Josefino C. Comiso NASA Goddard Space Flight Center Our Common Future Under Climate Change 7-11 July 2015, UNESCO, Paris France

Welcome message from author
This document is posted to help you gain knowledge. Please leave a comment to let me know what you think about it! Share it to your friends and learn new things together.
Transcript

Josefino C. Comiso NASA Goddard Space Flight Center
Our Common Future Under Climate Change
7-11 July 2015, UNESCO, Paris France

Ice Concentration estimates error due to – algorithm, ocean and land mask, ice types, melt and meltponding
Record length – the longer the better
Consistency of Satellite Sensor measurements – accounting for different calibration and characteristics
Lack of overlapping data for different seasons

Short record length of time series for continuous global coverage
Submarine data have long history but data are sparse spatially and temporally
Satellite ICESat Data collected only 2 months every year from 2003 to 2010
Satellite CryoSat data available only since 2011. Origin of the location of backscatter signal is not apparent.
Thickness measurement from space is problematic because of many unknowns and different ice types (i.e. snow thickness, effective density, etc…)

Historical Ice Extent
and Ice Area from
passive microwave
data (SMMR,
SSM/I, AMSR-E and
AMSR2)
Approximately
consistent
measurements for
more than 35 years


Top right numbers are trends for SMMR + SSMI only
Trends in plots: SMMR+SSMI+AMSR with 15% ice edge varied as follows: Red – a whole pixel (1%) Green – half a pixel (.5%) Blue – quarter of a pixel (.2%)
A bias of 12.5 (half a pixel) for ice extent is apparent if AMSR data is used. With ice area, the bias is minimal.
Reference: Comiso, J. and F. Nishio, 2008. Trends in the sea ice cover using enhanced and compatible AMSR-E, SSM/I, and SMMR data, J. Geophys. Res., 113, C02S07, doi:10.1029/2007JC004257.


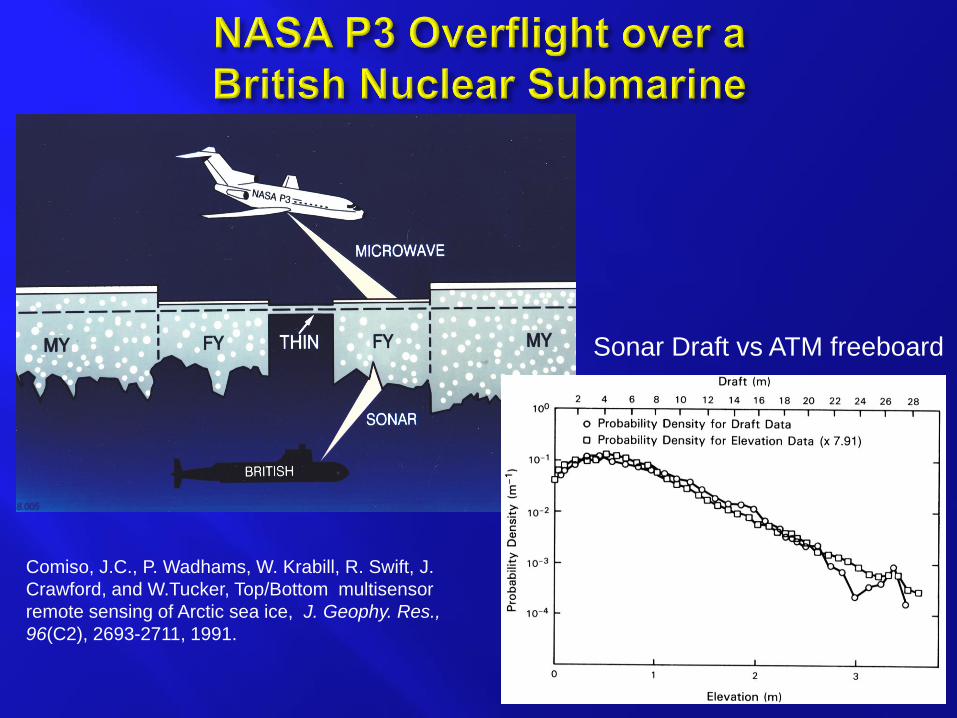
Sonar Draft vs ATM freeboard
Comiso, J.C., P. Wadhams, W. Krabill, R. Swift, J.
Crawford, and W.Tucker, Top/Bottom multisensor
remote sensing of Arctic sea ice, J. Geophy. Res.,
96(C2), 2693-2711, 1991.

80% MY ice contour
40% MY ice contour

Kwok, R. and G. F. Cunningham, 2015. Variability of Arctic sea ice thickness and Volume from CryoSat-2, Phil. Trans. R. Soc. A 373:20140157.


High confidence about our knowledge of the sea ice area and its variability and trend during the last 35 years.
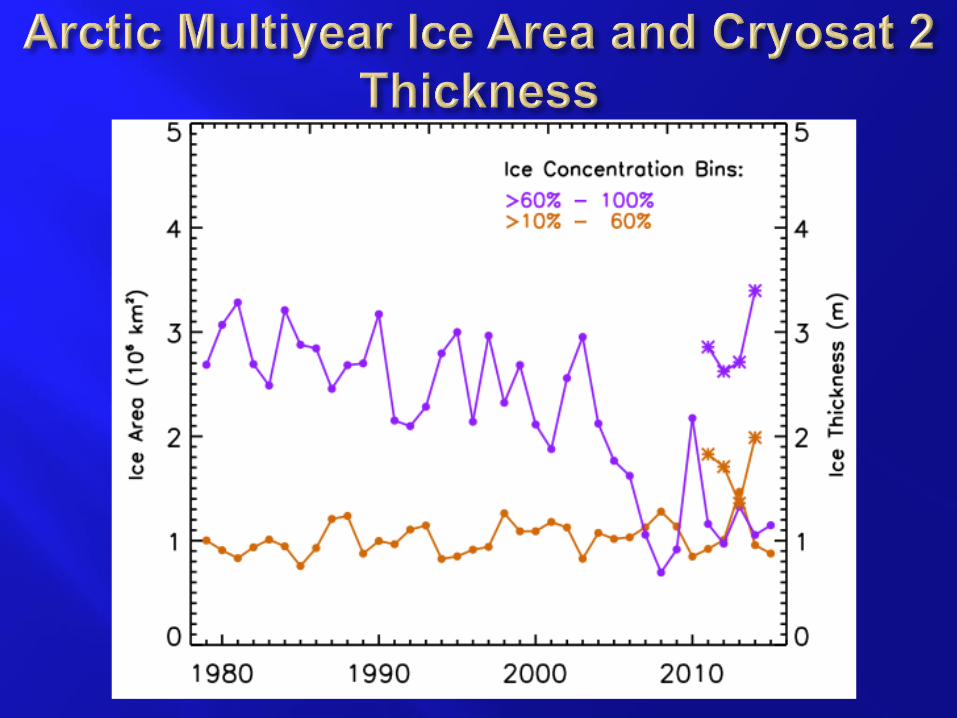
High confidence that the thick components of the sea ice cover, perennial and MY ice, are shrinking at a rapid rate.
Modest confidence that actual thickness is declining but biases in the time series are unknown.
Uncertainties in the volume is large because of the lack of adequate thickness measurements.
Dramatic declines in perennial ice occurred in 2007 and 2012 when global warming hiatus was supposed to be going on.

Related Documents