World Financial Symposium 2017World Financial Symposium 2014
World Financial Symposium 27 – 28 September 2017
Convention Center Dublin (CCD) – Ireland
World Financial Symposium 2017World Financial Symposium 2014
Aircraft Financing -The Future Looks Bright, or Does it?

World Financial Symposium 2017World Financial Symposium 2014
The Continued Evolution of Commercial Operating Leasing
Edward (Ted) O’Byrne, CIO, Aercap
September 27, 2017
The Continued Evolution of Commercial Operating LeasingEdward O'Byrne, Chief Investment Officer, AerCap

Evolution of Operating Leasing
3
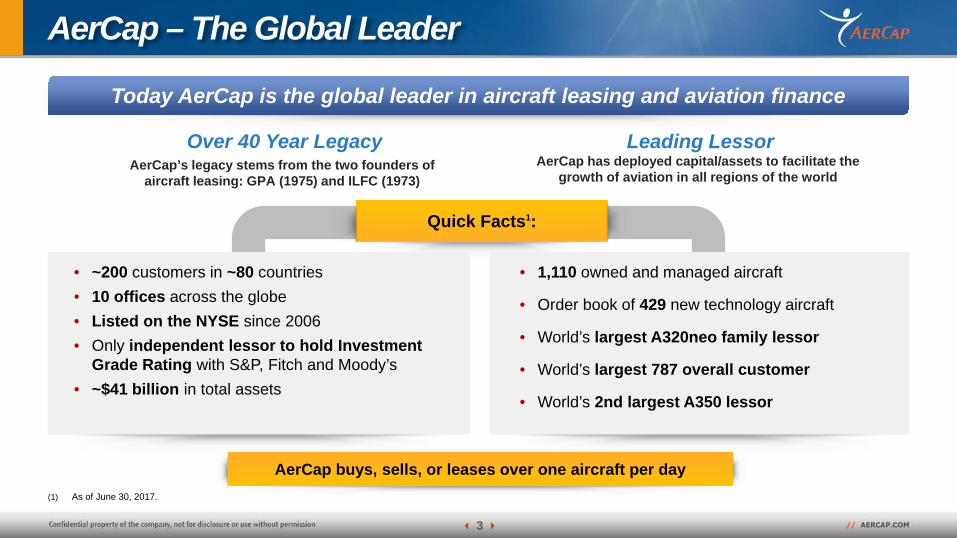
AerCap – The Global Leader
(1) As of June 30, 2017.
Quick Facts1:
Leading Lessor AerCap has deployed capital/assets to facilitate the
growth of aviation in all regions of the world
Over 40 Year Legacy AerCap’s legacy stems from the two founders of
aircraft leasing: GPA (1975) and ILFC (1973)
Today AerCap is the global leader in aircraft leasing and aviation finance
• ~200 customers in ~80 countries• 10 offices across the globe• Listed on the NYSE since 2006• Only independent lessor to hold Investment
Grade Rating with S&P, Fitch and Moody’s• ~$41 billion in total assets
• 1,110 owned and managed aircraft
• Order book of 429 new technology aircraft
• World’s largest A320neo family lessor
• World’s largest 787 overall customer
• World’s 2nd largest A350 lessor
AerCap buys, sells, or leases over one aircraft per day
4
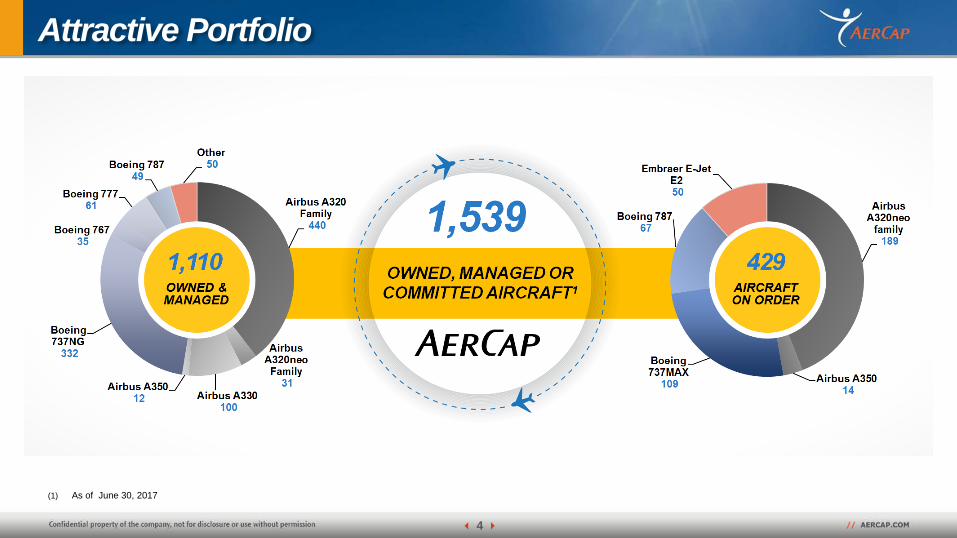
1,539 owned, managed or committed aircraft fleet1
(1) As of June 30, 2017
Attractive Portfolio
5
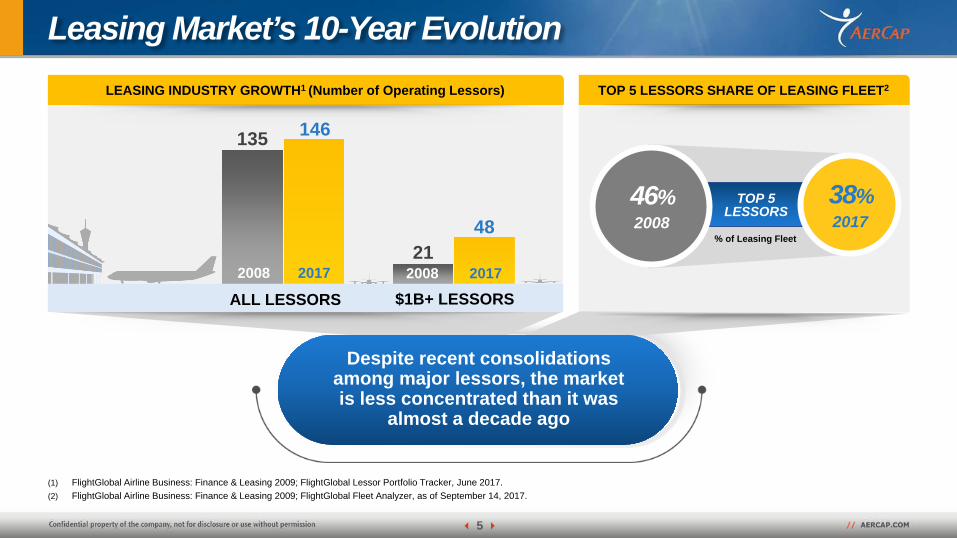
Leasing Market’s 10-Year Evolution
(1) FlightGlobal Airline Business: Finance & Leasing 2009; FlightGlobal Lessor Portfolio Tracker, June 2017. (2) FlightGlobal Airline Business: Finance & Leasing 2009; FlightGlobal Fleet Analyzer, as of September 14, 2017.
LEASING INDUSTRY GROWTH1 (Number of Operating Lessors) TOP 5 LESSORS SHARE OF LEASING FLEET2
Despite recent consolidations among major lessors, the market is less concentrated than it was
almost a decade ago
38%2017
46%2008
% of Leasing Fleet
TOP 5LESSORS
135
21
146
48
2008 2008 20172017
ALL LESSORS $1B+ LESSORS
6
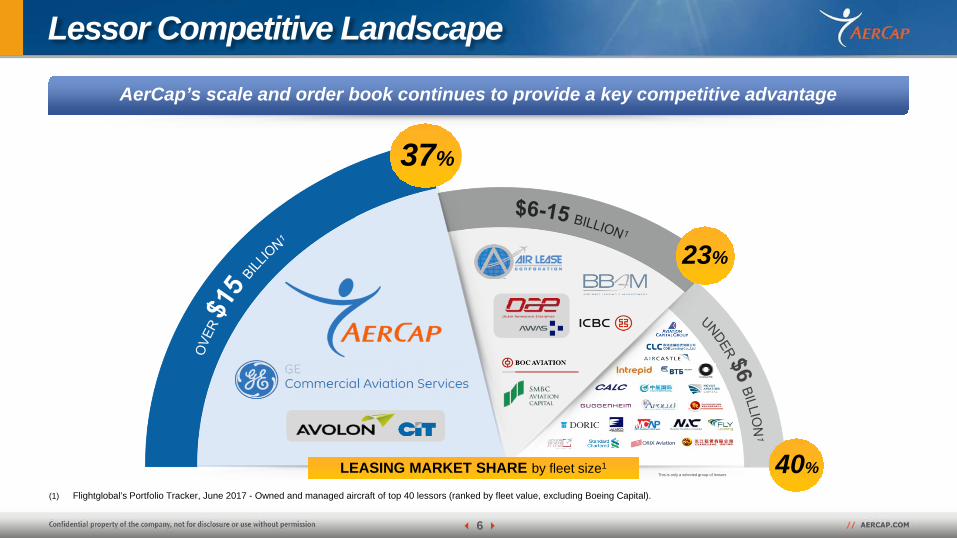
Lessor Competitive Landscape
(1) Flightglobal’s Portfolio Tracker, June 2017 - Owned and managed aircraft of top 40 lessors (ranked by fleet value, excluding Boeing Capital).
This is only a selected group of lessors
37%
23%
40%LEASING MARKET SHARE by fleet size1
AerCap’s scale and order book continues to provide a key competitive advantage
7
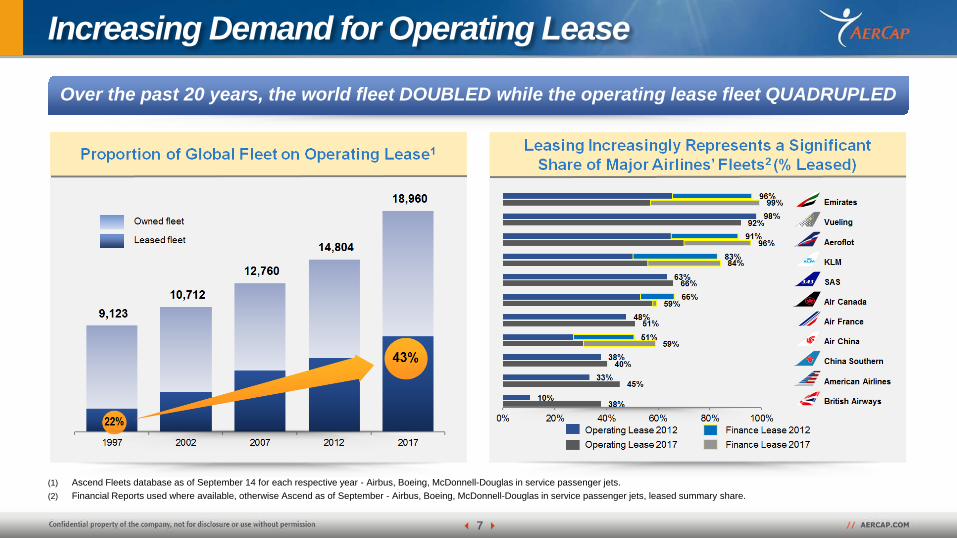
Increasing Demand for Operating Lease
Over the past 20 years, the world fleet DOUBLED while the operating lease fleet QUADRUPLED
(1) Ascend Fleets database as of September 14 for each respective year - Airbus, Boeing, McDonnell-Douglas in service passenger jets.(2) Financial Reports used where available, otherwise Ascend as of September - Airbus, Boeing, McDonnell-Douglas in service passenger jets, leased summary share.
Why Leasing?

9
Key Drivers of Continued Growth
RESIDUAL VALUE
MANAGEMENT
CAPEX & CASH FLOW
MANAGEMENT
OPERATIONAL OPTIONALITY
FRONT END: Delivery slots availability shorter than OEMs
BACK END: Ability to right-size fleet to match capacity to actual
passenger demand
Continued Growth of the Aircraft
Leasing Market
10
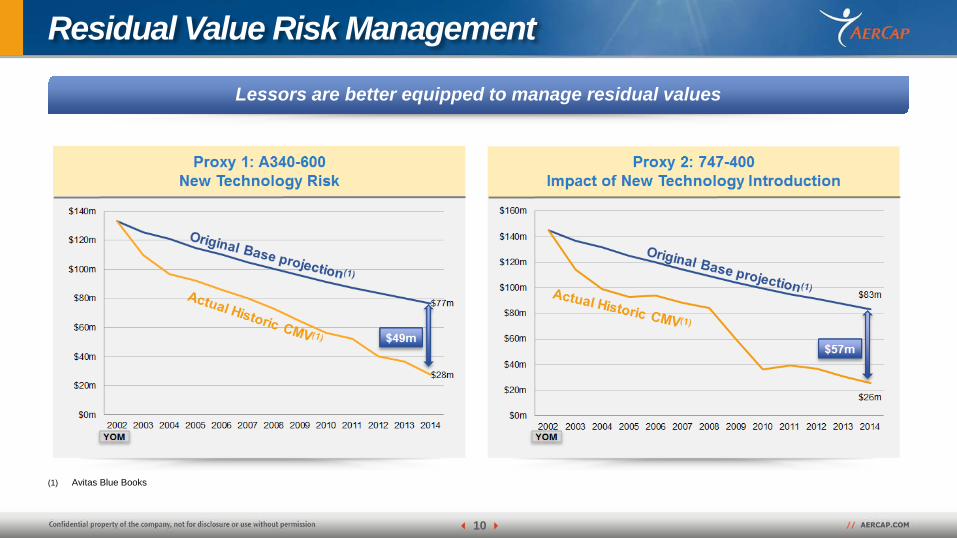
Residual Value Risk Management
Lessors are better equipped to manage residual values
(1) Avitas Blue Books.
11
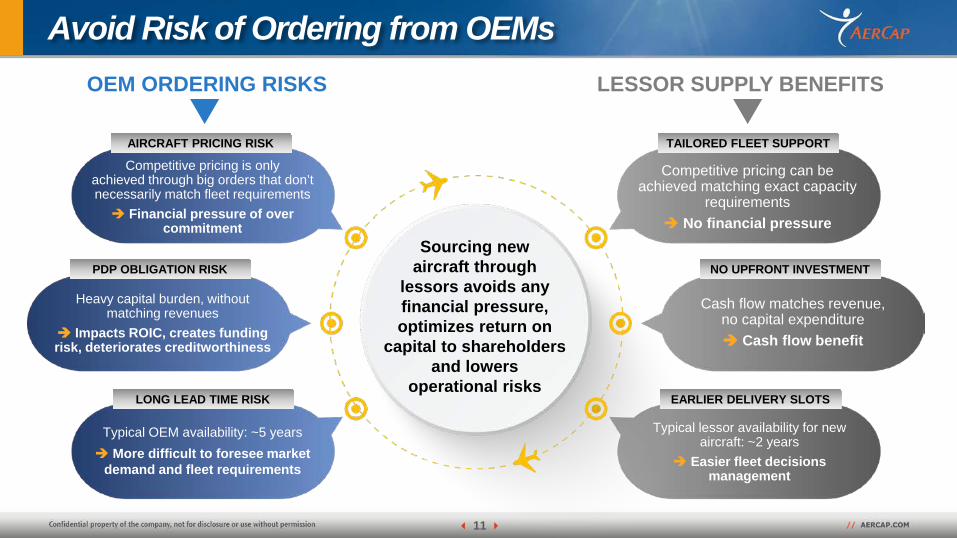
Avoid Risk of Ordering from OEMsOEM ORDERING RISKS LESSOR SUPPLY BENEFITS
Sourcing new aircraft through
lessors avoids any financial pressure, optimizes return on
capital to shareholders and lowers
operational risks
Heavy capital burden, without matching revenues
Impacts ROIC, creates funding risk, deteriorates creditworthiness
Competitive pricing is only achieved through big orders that don’t necessarily match fleet requirements Financial pressure of over
commitment
Competitive pricing can be achieved matching exact capacity
requirements No financial pressure
Typical lessor availability for new aircraft: ~2 years
Easier fleet decisions management
Cash flow matches revenue, no capital expenditure Cash flow benefit
Typical OEM availability: ~5 years More difficult to foresee market
demand and fleet requirements
AIRCRAFT PRICING RISK
PDP OBLIGATION RISK
LONG LEAD TIME RISK
TAILORED FLEET SUPPORT
NO UPFRONT INVESTMENT
EARLIER DELIVERY SLOTS

12
Value of Optionality
Operating lease gives the flexibility to right-size the fleet according to traffic growth and competitive environment, improving load factors and gaining access to new technology aircraft
LEASE
A320-200
145 seats
A320-200
145 seats
NO FLEXIBILITY
No ability to increase capacity Over capacity High operating costs
Ability to up-gauge & match demand
Down-gauge & maintain market share
Avail of new technology
A321-200 161 seats
A319-100 138 seats
Context:Traffic 3%
Context:Traffic 3%
Context:New Technology
BUY

13
Lessor Scale Enables Fleet-Wide Solutions
AerCap offers unparalleled access to the most-in-demand new and used aircraft to meet airlines’ fleet needs
Access to Modern, Fuel-Efficient Aircraft Access to a Diverse Portfolio of Used Aircraft
China Southern United Airlines
PLACEMENT OF 25 USED AIRBUS A319s
PLACEMENT OF 24 NEW AIRBUS A320neo FAMILY
AIRCRAFT
• Access to the industry’s leading order bookwith 441 modern, fuel-efficient aircraft1
• Attractive delivery positions to match capacity with forecasted demand
• Faster implementation of new technologies• World’s largest lessor customer of Airbus
A320neo family, Boeing 787, Embraer E-Jet E2 and 3rd largest lessor customer of 737 MAX1
• Operating flexibility to incrementally match capacity to actual passenger demand
• Opportunistically add used aircraft on existing routes when the economics are attractive
• Access to a diverse group of mid-life aircraft at attractive lease rates
• Greater flexibility in long-term capital management
(1) As of June 30, 2017.

Conclusions

15
Key Drivers of Continued Growth
Operating & financial
rationale for leasing
New capital driving
pricing down
Y-on-Y deliveries
show 50%+ going to lessors

16
This presentation contains certain statements, estimates and forecasts withrespect to future performance and events. These statements, estimates andforecasts are “forward-looking statements”. In some cases, forward-lookingstatements can be identified by the use of forward-looking terminology such as“may,” “might,” “should,” “expect,” “plan,” “intend,” “estimate,” “anticipate,”“believe,” “predict,” “potential” or “continue” or the negatives thereof orvariations thereon or similar terminology. All statements other than statementsof historical fact included in this presentation are forward-looking statementsand are based on various underlying assumptions and expectations and aresubject to known and unknown risks, uncertainties and assumptions, mayinclude projections of our future financial performance based on our growthstrategies and anticipated trends in our business. These statements are onlypredictions based on our current expectations and projections about futureevents. There are important factors that could cause our actual results, level ofactivity performance or achievements to differ materially from the results, levelof activity, performance or achievements expressed or implied in the forward-looking statements. As a result, there can be no assurance that the forward-looking statements included in this presentation will prove to be accurate or
correct. In light of these risks, uncertainties and assumptions, the futureperformance or events described in the forward-looking statements in thispresentation might not occur. Accordingly, you should not rely upon forward-looking statements as a prediction of actual results and we do not assume anyresponsibility for the accuracy or completeness of any of these forward-lookingstatements. We do not undertake any obligation to, and will not, update anyforward-looking statements, whether as a result of new information, futureevents or otherwise.
The information in this document is the property of AerCap Holdings N.V. andits subsidiaries and may not be copied or communicated to a fourth party, orused for any purpose other than that for which it is supplied without theexpress written consent of AerCap Holdings N.V. and its subsidiaries.
No warranty or representation is given concerning such information, whichmust not be taken as establishing any contractual or other commitmentbinding upon AerCap Holdings N.V. or any of its subsidiaries or associatedcompanies.
Disclaimer Incl. Forward Looking Statements & Safe Harbor
2
AerCap Holdings N.V.AerCap House65 St. Stephen’s GreenDublin 2, Ireland+353 1 819 [email protected]
Follow us on
World Financial Symposium 2017World Financial Symposium 2014
The Impact of Today’s Multifaceted Financing and Uncertainties
Munawar Noorani, Head of Aviation EMEA & APAC, Citi
Financing for GrowthMunawar Noorani, Managing Director, Head of Aviation Banking EMEA & APAC
IATA 4th World Financial Symposium: 27 September 2017
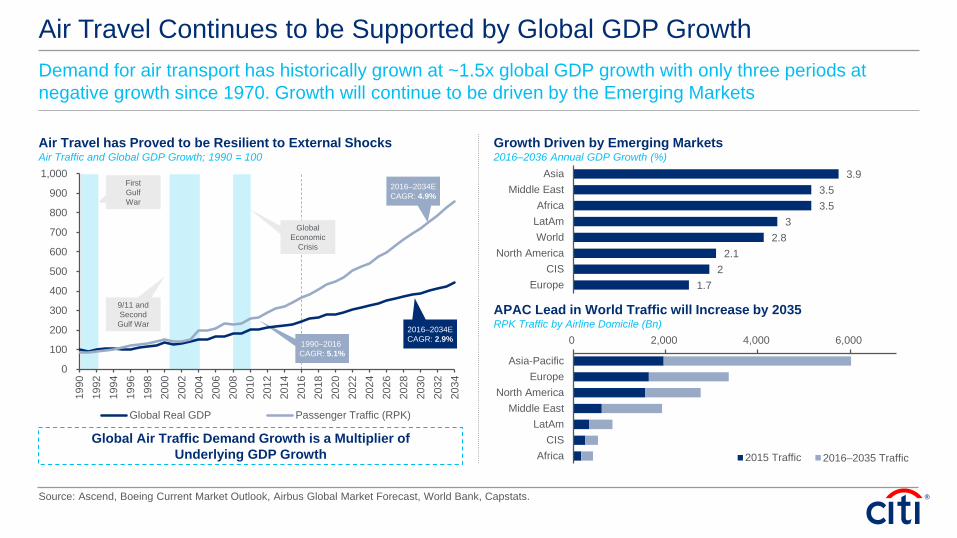
Air Travel Continues to be Supported by Global GDP Growth
Air Travel has Proved to be Resilient to External ShocksAir Traffic and Global GDP Growth; 1990 = 100
Growth Driven by Emerging Markets2016–2036 Annual GDP Growth (%)
Source: Ascend, Boeing Current Market Outlook, Airbus Global Market Forecast, World Bank, Capstats.
Demand for air transport has historically grown at ~1.5x global GDP growth with only three periods at negative growth since 1970. Growth will continue to be driven by the Emerging Markets
APAC Lead in World Traffic will Increase by 2035RPK Traffic by Airline Domicile (Bn)
Global Air Traffic Demand Growth is a Multiplier of Underlying GDP Growth
0 2,000 4,000 6,000
AfricaCIS
LatAmMiddle East
North AmericaEurope
Asia-Pacific
2015 Traffic 2016–2035 Traffic
9/11 andSecondGulf War
First Gulf War
2016–2034E CAGR: 2.9%
2016–2034E CAGR: 4.9%
GlobalEconomic
Crisis
1990–2016 CAGR: 5.1%
1.72
2.12.8
33.53.5
3.9
EuropeCIS
North AmericaWorld
LatAmAfrica
Middle EastAsia
0
100
200
300
400
500
600
700
800
900
1,000
1990
1992
1994
1996
1998
2000
2002
2004
2006
2008
2010
2012
2014
2016
2018
2020
2022
2024
2026
2028
2030
2032
2034
Global Real GDP Passenger Traffic (RPK)
0.00
0.01
0.10
1.00
10.00
100.00
0 10 20 30 40 50 60 70 80 90 100
Trip
s pe
r Cap
ita
Real GDP per Capita (2010 US$ in 000s at Purchasing Power Parity)
43%38%
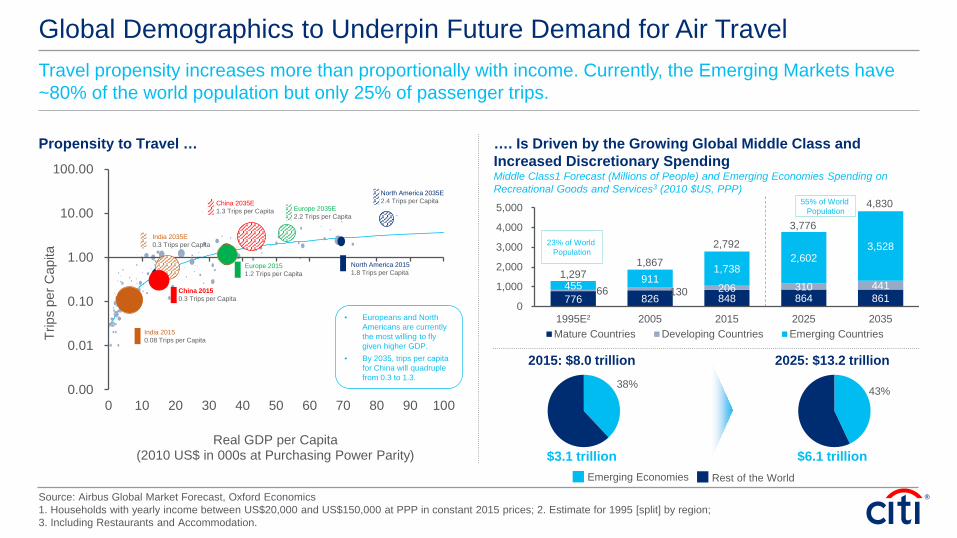
Global Demographics to Underpin Future Demand for Air Travel
Propensity to Travel …
Source: Airbus Global Market Forecast, Oxford Economics1. Households with yearly income between US$20,000 and US$150,000 at PPP in constant 2015 prices; 2. Estimate for 1995 [split] by region; 3. Including Restaurants and Accommodation.
Travel propensity increases more than proportionally with income. Currently, the Emerging Markets have ~80% of the world population but only 25% of passenger trips.
• Europeans and North Americans are currently the most willing to fly given higher GDP.
• By 2035, trips per capita for China will quadruple from 0.3 to 1.3.
India 20150.08 Trips per Capita
China 2015 0.3 Trips per Capita
Europe 20151.2 Trips per Capita
North America 20151.8 Trips per Capita
North America 2035E2.4 Trips per Capita
Europe 2035E2.2 Trips per Capita
China 2035E 1.3 Trips per Capita
India 2035E0.3 Trips per Capita
…. Is Driven by the Growing Global Middle Class and Increased Discretionary Spending Middle Class1 Forecast (Millions of People) and Emerging Economies Spending on Recreational Goods and Services3 (2010 $US, PPP)
776 826 848 864 861 66 130 206 310 441 455 911
1,738 2,602
3,528
0
1,000
2,000
3,000
4,000
5,000
1995E² 2005 2015 2025 2035Mature Countries Developing Countries Emerging Countries
23% of World Population
55% of World Population
4,830
3,776
2,792
1,8671,297
2015: $8.0 trillion 2025: $13.2 trillion
$3.1 trillion $6.1 trillionRest of the WorldEmerging Economies
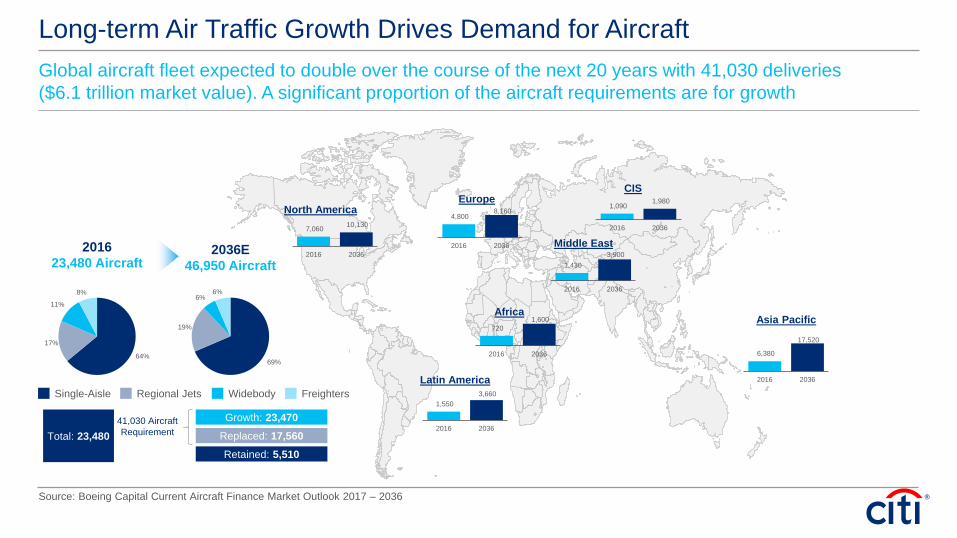
Long-term Air Traffic Growth Drives Demand for Aircraft
Source: Boeing Capital Current Aircraft Finance Market Outlook 2017 – 2036
Global aircraft fleet expected to double over the course of the next 20 years with 41,030 deliveries ($6.1 trillion market value). A significant proportion of the aircraft requirements are for growth
North AmericaEurope
CIS
Asia PacificAfrica
Middle East
Latin America
201623,480 Aircraft
2036E46,950 Aircraft
Retained: 5,510Replaced: 17,560Growth: 23,470
Total: 23,48041,030 Aircraft Requirement
Single-Aisle Regional Jets Widebody Freighters
64%
17%
11%
8%
69%
19%
6%6%
7,060 10,130
2016 2036
4,800 8,160
2016 2036
1,090 1,980
2016 2036
1,430 3,900
2016 2036
720 1,600
2016 2036
1,550 3,660
2016 2036
6,380
17,520
2016 2036
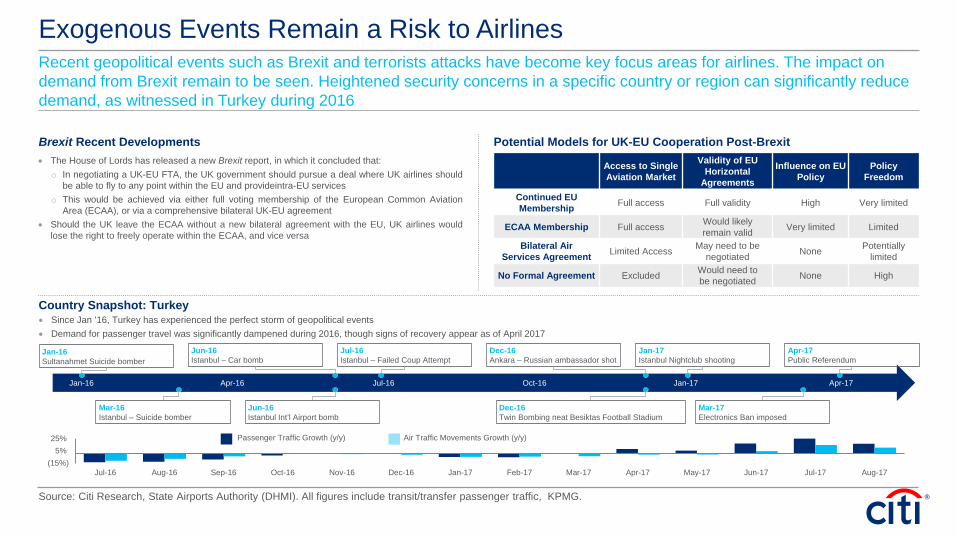
Exogenous Events Remain a Risk to Airlines
Brexit Recent Developments Potential Models for UK-EU Cooperation Post-Brexit
Source: Citi Research, State Airports Authority (DHMI). All figures include transit/transfer passenger traffic, KPMG.
Recent geopolitical events such as Brexit and terrorists attacks have become key focus areas for airlines. The impact on demand from Brexit remain to be seen. Heightened security concerns in a specific country or region can significantly reduce demand, as witnessed in Turkey during 2016
• The House of Lords has released a new Brexit report, in which it concluded that:o In negotiating a UK-EU FTA, the UK government should pursue a deal where UK airlines should
be able to fly to any point within the EU and provideintra-EU serviceso This would be achieved via either full voting membership of the European Common Aviation
Area (ECAA), or via a comprehensive bilateral UK-EU agreement• Should the UK leave the ECAA without a new bilateral agreement with the EU, UK airlines would
lose the right to freely operate within the ECAA, and vice versa
Access to SingleAviation Market
Validity of EU Horizontal
Agreements
Influence on EU Policy
Policy Freedom
Continued EU Membership Full access Full validity High Very limited
ECAA Membership Full access Would likely remain valid Very limited Limited
Bilateral Air Services Agreement Limited Access May need to be
negotiated None Potentially limited
No Formal Agreement Excluded Would need to be negotiated None High
Country Snapshot: Turkey • Since Jan ’16, Turkey has experienced the perfect storm of geopolitical events• Demand for passenger travel was significantly dampened during 2016, though signs of recovery appear as of April 2017
Jan-16 Apr-17Apr-16 Jul-16 Oct-16 Jan-17
Mar-16Istanbul – Suicide bomber
Jun-16Istanbul – Car bomb
Jun-16Istanbul Int’l Airport bomb
Jul-16Istanbul – Failed Coup Attempt
Dec-16Twin Bombing neat Besiktas Football Stadium
Dec-16Ankara – Russian ambassador shot
Jan-17Istanbul Nightclub shooting
Mar-17Electronics Ban imposed
Apr-17Public Referendum
Jan-16Sultanahmet Suicide bomber
(15%)5%
25%
Jul-16 Aug-16 Sep-16 Oct-16 Nov-16 Dec-16 Jan-17 Feb-17 Mar-17 Apr-17 May-17 Jun-17 Jul-17 Aug-17
Passenger Traffic Growth (y/y) Air Traffic Movements Growth (y/y)
Sources of Aircraft Finance

The Cornerstones of Aircraft Financing
Leasing Companies
Export Credit
Bank Debt
Capital Markets
• Each financing source is susceptible to both credit market and regulatory shocks which can reduce the supply and increase the cost of financing
• It is therefore prudent to pursue a diverse funding strategy
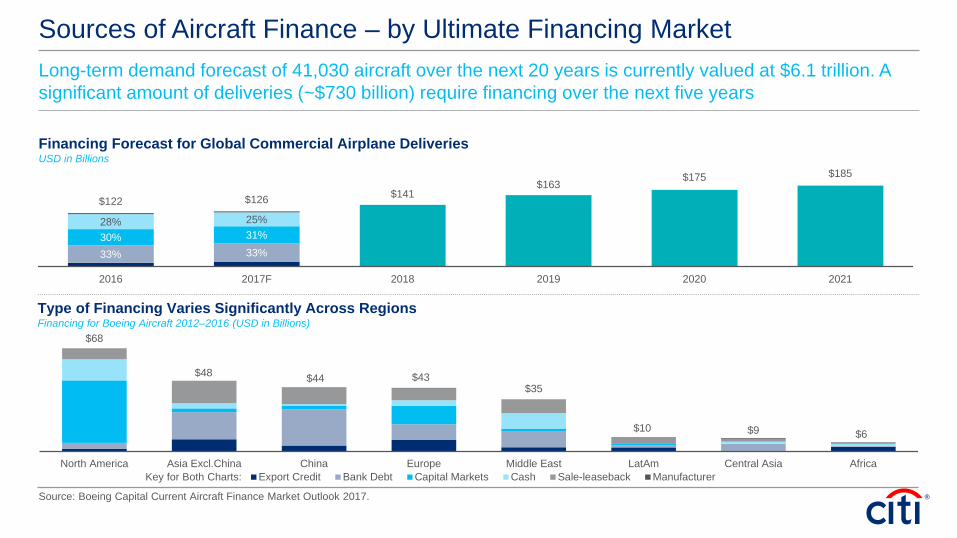
$68
$48 $44 $43$35
$10 $9 $6
North America Asia Excl.China China Europe Middle East LatAm Central Asia AfricaExport Credit Bank Debt Capital Markets Cash Sale-leaseback Manufacturer
Sources of Aircraft Finance – by Ultimate Financing Market
Financing Forecast for Global Commercial Airplane DeliveriesUSD in Billions
Source: Boeing Capital Current Aircraft Finance Market Outlook 2017.
Long-term demand forecast of 41,030 aircraft over the next 20 years is currently valued at $6.1 trillion. A significant amount of deliveries (~$730 billion) require financing over the next five years
Type of Financing Varies Significantly Across RegionsFinancing for Boeing Aircraft 2012–2016 (USD in Billions)
Key for Both Charts:
33% 33%30% 31%28% 25%
$122 $126 $141$163
$175 $185
2016 2017F 2018 2019 2020 2021
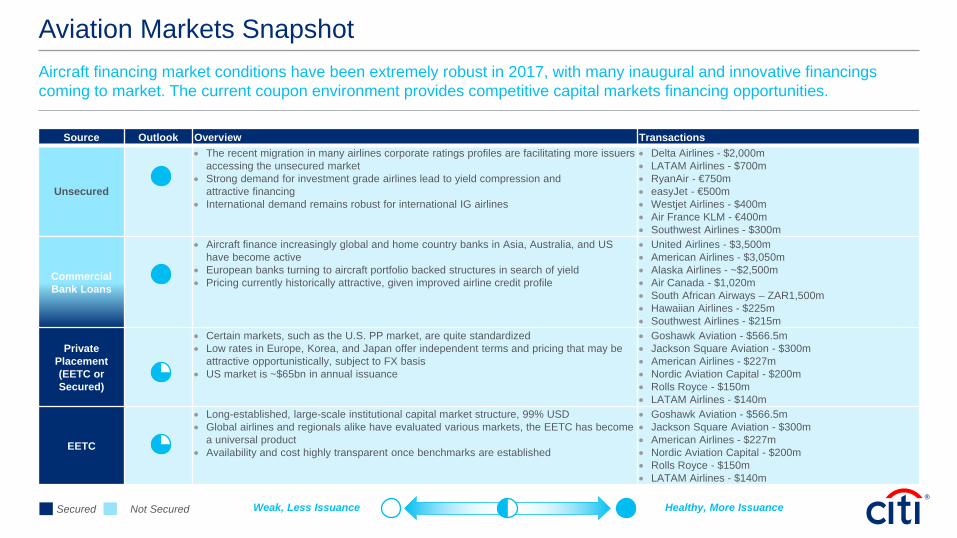
Aviation Markets SnapshotAircraft financing market conditions have been extremely robust in 2017, with many inaugural and innovative financings coming to market. The current coupon environment provides competitive capital markets financing opportunities.
Source Outlook Overview Transactions
Unsecured
• The recent migration in many airlines corporate ratings profiles are facilitating more issuers accessing the unsecured market
• Strong demand for investment grade airlines lead to yield compression and attractive financing
• International demand remains robust for international IG airlines
• Delta Airlines - $2,000m• LATAM Airlines - $700m• RyanAir - €750m• easyJet - €500m• Westjet Airlines - $400m• Air France KLM - €400m• Southwest Airlines - $300m
Commercial Bank Loans
• Aircraft finance increasingly global and home country banks in Asia, Australia, and US have become active
• European banks turning to aircraft portfolio backed structures in search of yield• Pricing currently historically attractive, given improved airline credit profile
• United Airlines - $3,500m• American Airlines - $3,050m• Alaska Airlines - ~$2,500m• Air Canada - $1,020m• South African Airways – ZAR1,500m• Hawaiian Airlines - $225m• Southwest Airlines - $215m
Private Placement (EETC or Secured)
• Certain markets, such as the U.S. PP market, are quite standardized• Low rates in Europe, Korea, and Japan offer independent terms and pricing that may be
attractive opportunistically, subject to FX basis• US market is ~$65bn in annual issuance
• Goshawk Aviation - $566.5m• Jackson Square Aviation - $300m• American Airlines - $227m• Nordic Aviation Capital - $200m• Rolls Royce - $150m• LATAM Airlines - $140m
EETC
• Long-established, large-scale institutional capital market structure, 99% USD• Global airlines and regionals alike have evaluated various markets, the EETC has become
a universal product• Availability and cost highly transparent once benchmarks are established
• Goshawk Aviation - $566.5m• Jackson Square Aviation - $300m• American Airlines - $227m• Nordic Aviation Capital - $200m• Rolls Royce - $150m• LATAM Airlines - $140m
Secured Not Secured Healthy, More IssuanceWeak, Less Issuance

Debt Capital Markets Considerations
25%
45%
30%
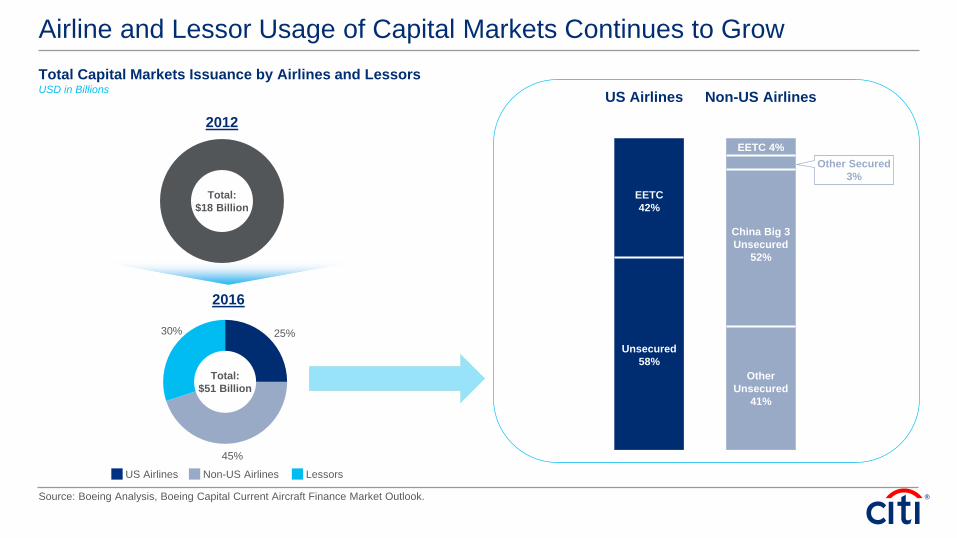
Airline and Lessor Usage of Capital Markets Continues to Grow
Source: Boeing Analysis, Boeing Capital Current Aircraft Finance Market Outlook.
Total Capital Markets Issuance by Airlines and LessorsUSD in Billions
2012
2016
EETC42%
Unsecured58%
China Big 3Unsecured
52%
Other Unsecured
41%
EETC 4%Other Secured
3%
US Airlines Non-US Airlines
Total:$18 Billion
Total:$51 Billion
US Airlines Non-US Airlines Lessors

Airline Market Cap & Corporate Ratings (2014)
Source: Market data from Capital IQ as of 1/1/2014, accessed on 8/20/2017. Ratings from Standard & Poor’s / Moody’s / Fitch as of 1/1/2014, accessed on 8/20/2017. (1) American Airlines Revenues are Pro Forma for the acquisition of US Airways
Top 20 World Airlines Ranked by Market Cap as of January 1, 2014.
Credit RatingsAirline Market Cap ($mm) LTM Revenues ($mm) S&P Moody's Fitch
$23,149 $37,773 BB- B1 B+13,690 38,279 B B2 B13,490 25,664 BB- B1 –13,126 17,699 BBB- Baa3 BBB11,983 6,925 – – –
9,986 7,137 – – –9,821 41,380 BBB- Ba1 –9,699 12,107 – – –8,938 12,237 – – –8,320 12,959 – – –7,596 12,925 BB – BB7,100 2,608 – – –6,954 14,869 – – –6,565 41,319(1) B B1 B+5,095 4,964 BB+ – –4,278 16,209 – – –4,137 8,747 – – –3,400 3,447 – – –3,299 1,654 – – –3,092 35,158 – – –
Total 173,718 $354,061 Total Investment Grade Airlines: 2
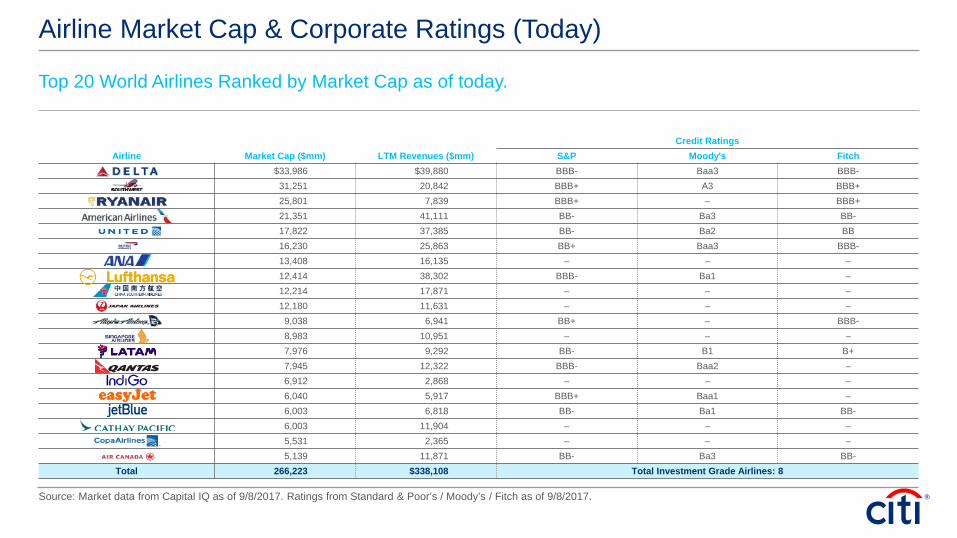
Airline Market Cap & Corporate Ratings (Today)
Source: Market data from Capital IQ as of 9/8/2017. Ratings from Standard & Poor’s / Moody’s / Fitch as of 9/8/2017.
Top 20 World Airlines Ranked by Market Cap as of today.
Credit RatingsAirline Market Cap ($mm) LTM Revenues ($mm) S&P Moody's Fitch
$33,986 $39,880 BBB- Baa3 BBB-31,251 20,842 BBB+ A3 BBB+25,801 7,839 BBB+ – BBB+21,351 41,111 BB- Ba3 BB-17,822 37,385 BB- Ba2 BB16,230 25,863 BB+ Baa3 BBB-13,408 16,135 – – –12,414 38,302 BBB- Ba1 –12,214 17,871 – – –12,180 11,631 – – –
9,038 6,941 BB+ – BBB-8,983 10,951 – – –7,976 9,292 BB- B1 B+7,945 12,322 BBB- Baa2 –6,912 2,868 – – –6,040 5,917 BBB+ Baa1 –6,003 6,818 BB- Ba1 BB-6,003 11,904 – – –5,531 2,365 – – –5,139 11,871 BB- Ba3 BB-
Total 266,223 $338,108 Total Investment Grade Airlines: 8

Export Credit Agency Considerations
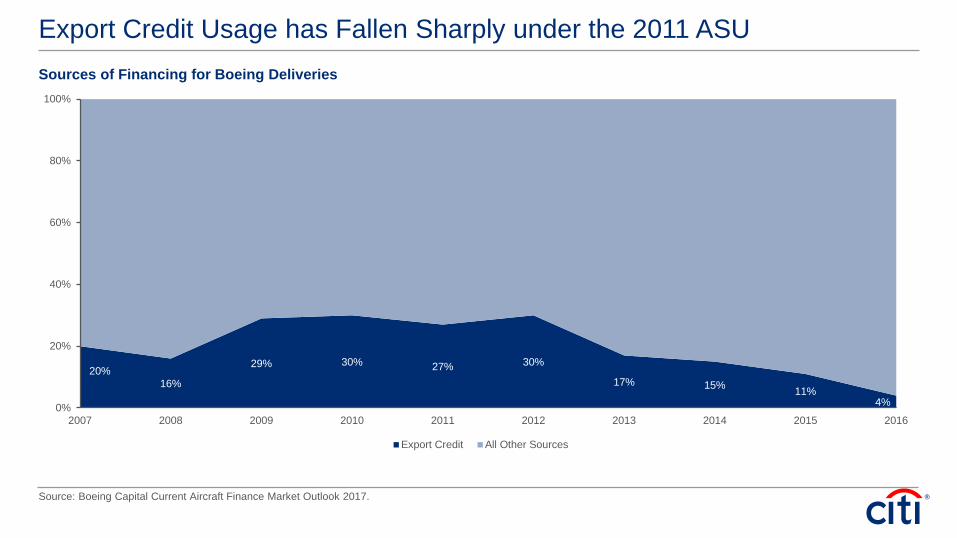
20%16%
29% 30% 27% 30%
17% 15% 11%4%0%
20%
40%
60%
80%
100%
2007 2008 2009 2010 2011 2012 2013 2014 2015 2016
Export Credit All Other Sources
Export Credit Usage has Fallen Sharply under the 2011 ASU
Source: Boeing Capital Current Aircraft Finance Market Outlook 2017.
Sources of Financing for Boeing Deliveries

• US EXIM Bank Update: While US EXIM Bank has been and remains “open for business” since its most recent reauthorization on December 4, 2015 and is currently accepting applications, approvals for financings greater than US$10 million will require a Board of Directors (“BoD”) of three members quorum (“Quorum”), a requirement which remains currently unfulfilled.
• European ECAs Update: The ECAs (UKEF, BPI France (formerly Coface), and Euler Hermes) have temporarily halted export credit support for Airbus aircraft since April 2016 due to an ongoing investigation surrounding previous applications for export credit support by Airbus.
US EXIM Bank / European ECAs Aircraft Sector Update
US EXIM Bank Status Update European ECAs Status Update• US EXIM Bank was reauthorized on December 4, 2015
through September 30, 2019 under its new charter• Due to current vacancies on the Board, the Board does not
have a Quorum and cannot approve financial commitments above $10 million
• Three board members are required to constitute a Quorum (There are currently only two board members in place following the appointment of Charles J Hall as acting Chairman and Scott Schloegel as acting Vice Chairman for the purposes of continuity of business)
• In April 2017, President Trump nominated Scott Garrett to serve as President and Chairman of US EXIM Bank and former congressman Spencer T. Bachus III as member of US EXIM Bank’s Board. These nominations were formally sent to the Senate on June 20, 2017 for confirmation. The certainty and timing of these nominations are unclear as Congress enters its summer recess
• On September 15, President Trump announced three more nominations to serve as U.S. Export-Import Bank board members. Whilst these nominations would bring the bank to a full complement of five board members, it should be noted that hearing dates and votes are still pending
• According to a press release by Airbus on April 1, 2016, UK Export Finance (UKEF) temporarily ceased support for new Airbus commercial aircraft purchase financings due to concerns raised by UKEF with regard to previous export credit applications. Shortly thereafter, BPI Finance (France) and Euler Hermes (Germany) joined the actions of UKEF (United Kingdom) in temporarily ceasing support
• We understand that the European ECAs intend to resume support for Airbus commercial financings in the future upon resolution of the referenced matters; however, the time table for resolution is uncertain at this point with a resumption unlikely in 2017; however, Airbus indicated earlier this year that it would expect some European ECA support to be considered on case-by-case basis by the end of 2017
UKEF Support for Boeing 787s powered by Rolls-Royce Engines
• UKEF has recently announced that it can provide guarantees on Boeing 787s powered by Rolls-Royce engines:– UKEF is able to provide a guarantee on the eligible financing amount, which would equal the sum of up to
85% of aircraft purchase price plus the applicable ECA premium – The new program has been well-received and Citi understands UKEF has received numerous applications
thus far
Italian ECA (SACE) – Supporting Boeing Aircraft Purchases on a Case-by-Case Basis
• SACE is able to offer support based on presence of Italian content, such as the case of Italian supplier Leonardo Aerostructure which provides 14% of content for the B787 Dreamliner aircraft program according to SACE
• Format of Support: 100% guarantee is the likely format of support. SACE is considering up to $1.25Bn in annual support under the program
• Recent Transactions: In June 2017, SACE supported Tukey’s SunExpress’ 10-year financing for its purchase of three Boeing aircraft
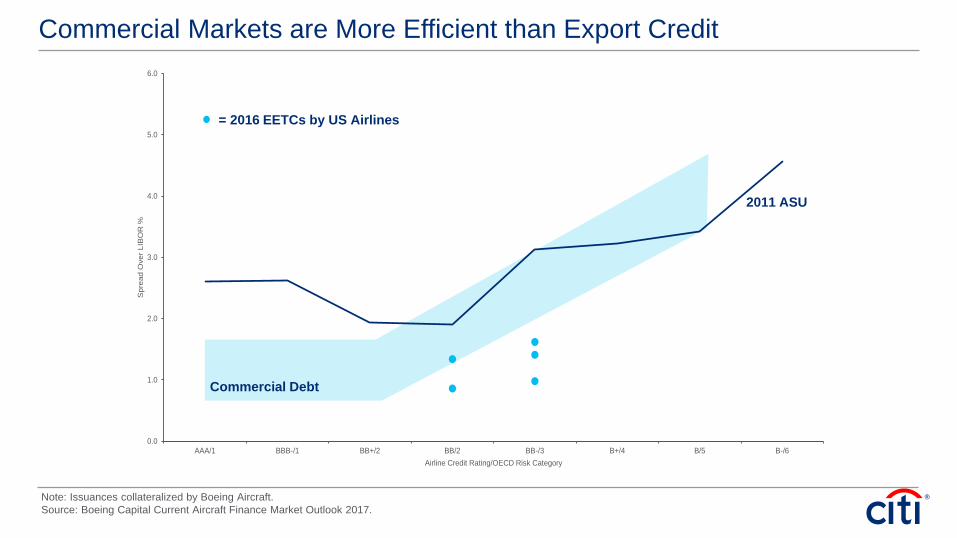
Commercial Markets are More Efficient than Export Credit
Note: Issuances collateralized by Boeing Aircraft.Source: Boeing Capital Current Aircraft Finance Market Outlook 2017.
0.0
1.0
2.0
3.0
4.0
5.0
6.0
AAA/1 BBB-/1 BB+/2 BB/2 BB-/3 B+/4 B/5 B-/6
Spr
ead
Ove
r LIB
OR
%
Airline Credit Rating/OECD Risk Category
= 2016 EETCs by US Airlines
2011 ASU
Commercial Debt

Bank Debt Considerations
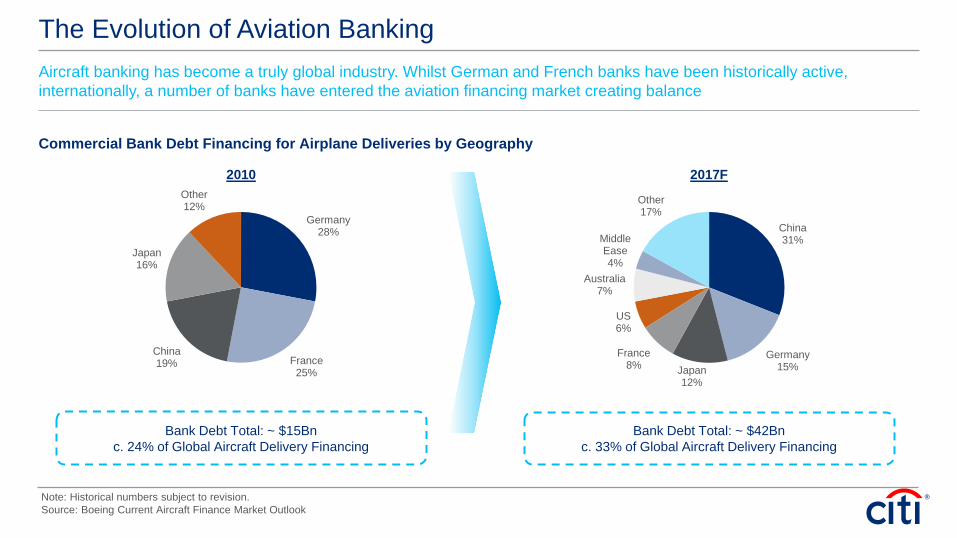
The Evolution of Aviation Banking
Commercial Bank Debt Financing for Airplane Deliveries by Geography
Note: Historical numbers subject to revision.Source: Boeing Current Aircraft Finance Market Outlook
Aircraft banking has become a truly global industry. Whilst German and French banks have been historically active, internationally, a number of banks have entered the aviation financing market creating balance
Bank Debt Total: ~ $15Bnc. 24% of Global Aircraft Delivery Financing
Bank Debt Total: ~ $42Bnc. 33% of Global Aircraft Delivery Financing
2010 2017F
Germany28%
France25%
China19%
Japan16%
Other12%
China 31%
Germany15%Japan
12%
France8%
US6%
Australia7%
Middle Ease4%
Other17%
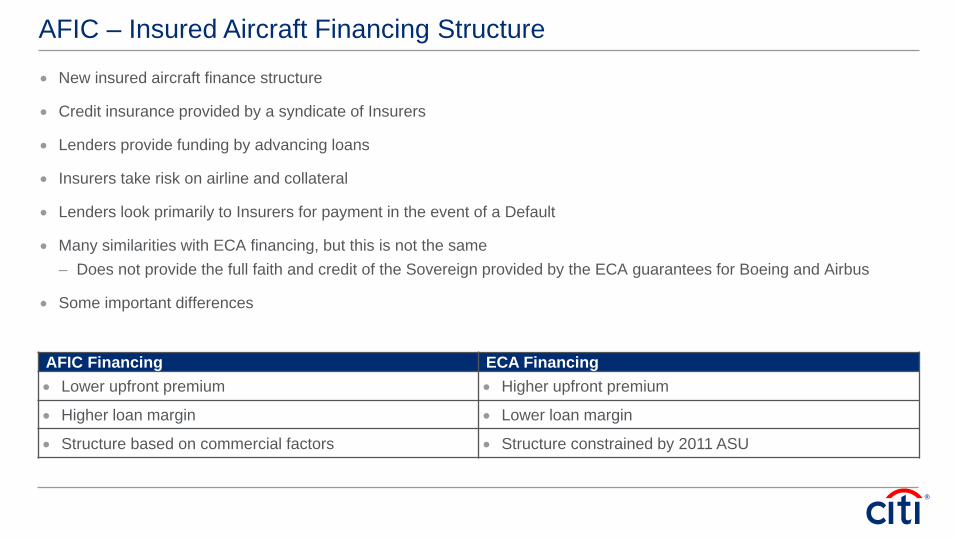
AFIC – Insured Aircraft Financing Structure
• New insured aircraft finance structure
• Credit insurance provided by a syndicate of Insurers
• Lenders provide funding by advancing loans
• Insurers take risk on airline and collateral
• Lenders look primarily to Insurers for payment in the event of a Default
• Many similarities with ECA financing, but this is not the same– Does not provide the full faith and credit of the Sovereign provided by the ECA guarantees for Boeing and Airbus
• Some important differences
AFIC Financing ECA Financing• Lower upfront premium • Higher upfront premium
• Higher loan margin • Lower loan margin
• Structure based on commercial factors • Structure constrained by 2011 ASU
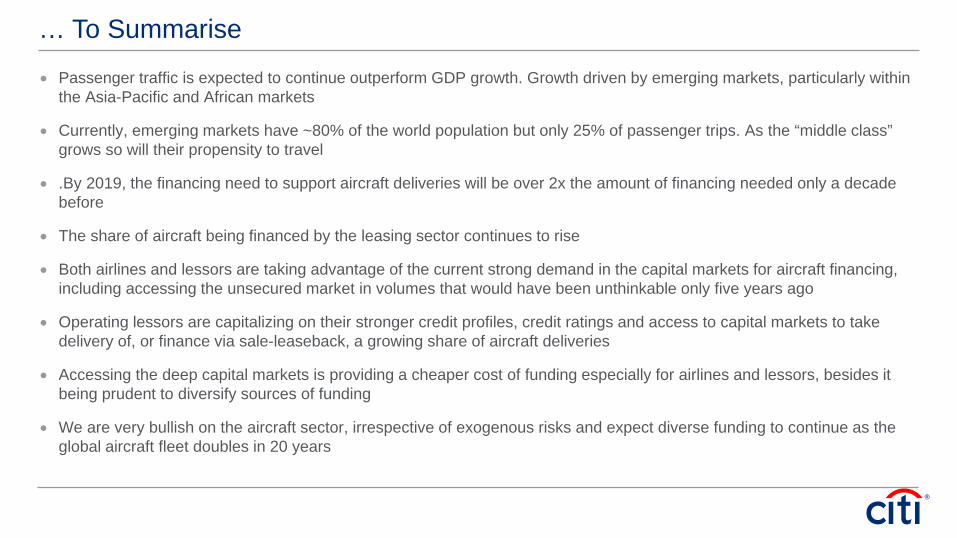
… To Summarise
• Passenger traffic is expected to continue outperform GDP growth. Growth driven by emerging markets, particularly within the Asia-Pacific and African markets
• Currently, emerging markets have ~80% of the world population but only 25% of passenger trips. As the “middle class” grows so will their propensity to travel
• .By 2019, the financing need to support aircraft deliveries will be over 2x the amount of financing needed only a decade before
• The share of aircraft being financed by the leasing sector continues to rise
• Both airlines and lessors are taking advantage of the current strong demand in the capital markets for aircraft financing, including accessing the unsecured market in volumes that would have been unthinkable only five years ago
• Operating lessors are capitalizing on their stronger credit profiles, credit ratings and access to capital markets to take delivery of, or finance via sale-leaseback, a growing share of aircraft deliveries
• Accessing the deep capital markets is providing a cheaper cost of funding especially for airlines and lessors, besides it being prudent to diversify sources of funding
• We are very bullish on the aircraft sector, irrespective of exogenous risks and expect diverse funding to continue as the global aircraft fleet doubles in 20 years
IRS Circular 230 Disclosure: Citigroup Inc. and its affiliates do not provide tax or legal advice. Any discussion of tax matters in these materials (i) is not intended or written to be used, and cannot be used orrelied upon, by you for the purpose of avoiding any tax penalties and (ii) may have been written in connection with the "promotion or marketing" of any transaction contemplated hereby ("Transaction").Accordingly, you should seek advice based on your particular circumstances from an independent tax advisor.
In any instance where distribution of this communication is subject to the rules of the US Commodity Futures Trading Commission ("CFTC"), this communication constitutes an invitation to consider enteringinto a derivatives transaction under U.S. CFTC Regulations §§ 1.71 and 23.605, where applicable, but is not a binding offer to buy/sell any financial instrument.
Any terms set forth herein are intended for discussion purposes only and are subject to the final terms as set forth in separate definitive written agreements. This presentation is not a commitment to lend, syndicate afinancing, underwrite or purchase securities, or commit capital nor does it obligate us to enter into such a commitment, nor are we acting as a fiduciary to you. By accepting this presentation, subject to applicable law orregulation, you agree to keep confidential the information contained herein and the existence of and proposed terms for any Transaction.
Prior to entering into any Transaction, you should determine, without reliance upon us or our affiliates, the economic risks and merits (and independently determine that you are able to assume these risks) as well as the legal,tax and accounting characterizations and consequences of any such Transaction. In this regard, by accepting this presentation, you acknowledge that (a) we are not in the business of providing (and you are not relying on usfor) legal, tax or accounting advice, (b) there may be legal, tax or accounting risks associated with any Transaction, (c) you should receive (and rely on) separate and qualified legal, tax and accounting advice and (d) youshould apprise senior management in your organization as to such legal, tax and accounting advice (and any risks associated with any Transaction) and our disclaimer as to these matters. By acceptance of these materials,you and we hereby agree that from the commencement of discussions with respect to any Transaction, and notwithstanding any other provision in this presentation, we hereby confirm that no participant in any Transactionshall be limited from disclosing the U.S. tax treatment or U.S. tax structure of such Transaction.
We are required to obtain, verify and record certain information that identifies each entity that enters into a formal business relationship with us. We will ask for your complete name, street address, and taxpayer ID number.We may also request corporate formation documents, or other forms of identification, to verify information provided.
Any prices or levels contained herein are preliminary and indicative only and do not represent bids or offers. These indications are provided solely for your information and consideration, are subject to change at any timewithout notice and are not intended as a solicitation with respect to the purchase or sale of any instrument. The information contained in this presentation may include results of analyses from a quantitative model whichrepresent potential future events that may or may not be realized, and is not a complete analysis of every material fact representing any product. Any estimates included herein constitute our judgment as of the date hereofand are subject to change without any notice. We and/or our affiliates may make a market in these instruments for our customers and for our own account. Accordingly, we may have a position in any such instrument at anytime.
Although this material may contain publicly available information about Citi corporate bond research, fixed income strategy or economic and market analysis, Citi policy (i) prohibits employees from offering, directly orindirectly, a favorable or negative research opinion or offering to change an opinion as consideration or inducement for the receipt of business or for compensation; and (ii) prohibits analysts from being compensated forspecific recommendations or views contained in research reports. So as to reduce the potential for conflicts of interest, as well as to reduce any appearance of conflicts of interest, Citi has enacted policies and proceduresdesigned to limit communications between its investment banking and research personnel to specifically prescribed circumstances.
© 2016 Citibank, N.A. London. Authorised and regulated by the Office of the Comptroller of the Currency (USA) and authorised by the Prudential Regulation Authority. Subject to regulation by the FinancialConduct Authority and limited regulation by the Prudential Regulation Authority. Details about the extent of our regulation by the Prudential Regulation Authority are available from us on request. All rightsreserved. Citi and Citi and Arc Design are trademarks and service marks of Citigroup Inc. or its affiliates and are used and registered throughout the world.
Citi believes that sustainability is good business practice. We work closely with our clients, peer financial institutions, NGOs and other partners to finance solutions to climate change, develop industry standards,reduce our own environmental footprint, and engage with stakeholders to advance shared learning and solutions. Citi’s Sustainable Progress strategy focuses on sustainability performance across three pillars:Environmental Finance; Environmental and Social Risk Management; and Operations and Supply Chain. Our cornerstone initiative is our $100 Billion Environmental Finance Goal – to lend, invest and facilitate$100 billion over 10 years to activities focused on environmental and climate solutions.

World Financial Symposium 2017World Financial Symposium 2014
Airlines and Lessors M&A, Transformative?
Dómhnal Slattery, Chief Executive Officer, Avolon

Airlines and Lessors M&A, transformative?Domhnal Slattery - Chief Executive Officer, AvolonSeptember 27th 2017

Slide 2
Avolon At A Glance1
1. Metrics as of 30 June 20172. Owned fleet includes aircraft on operating lease, aircraft on finance lease and aircraft classified as held for sale. Excludes spare engine assets. Committed fleet includes 75 B737 Max aircraft for which Avolon has entered into an MoU3. Not including the effect of upfront fees, undrawn fees, issuance cost amortization or fair value gains/losses on derivative financial instruments4. Includes $1.6bn undrawn secured debt commitments
Portfolio of Scale
Sustainable, Efficient Capital
Available Liquidity
High Quality Fleet
Strong Ratings
4.0%Cost of Funds
$46bnOwned and Committed Fleet
9212
Owned, Managed and Committed Fleet
2.0x Net Debt : Equity
$4.1bn4
Total Available Liquidity
$2.5bn Unrestricted Cash & Unsecured RCF
4.9 YearsWeighted Average Age
6.8 YearsRemaining Average Lease Term
3
CF Rating (S/M/F/K)
BB+ / Ba2 / BB / BBB+Term Loan B (S/M/F)
BBB- / Ba1 / BB+
Slide 3
2000 2005 2010 2015
1 Source IATA; net post-tax profits
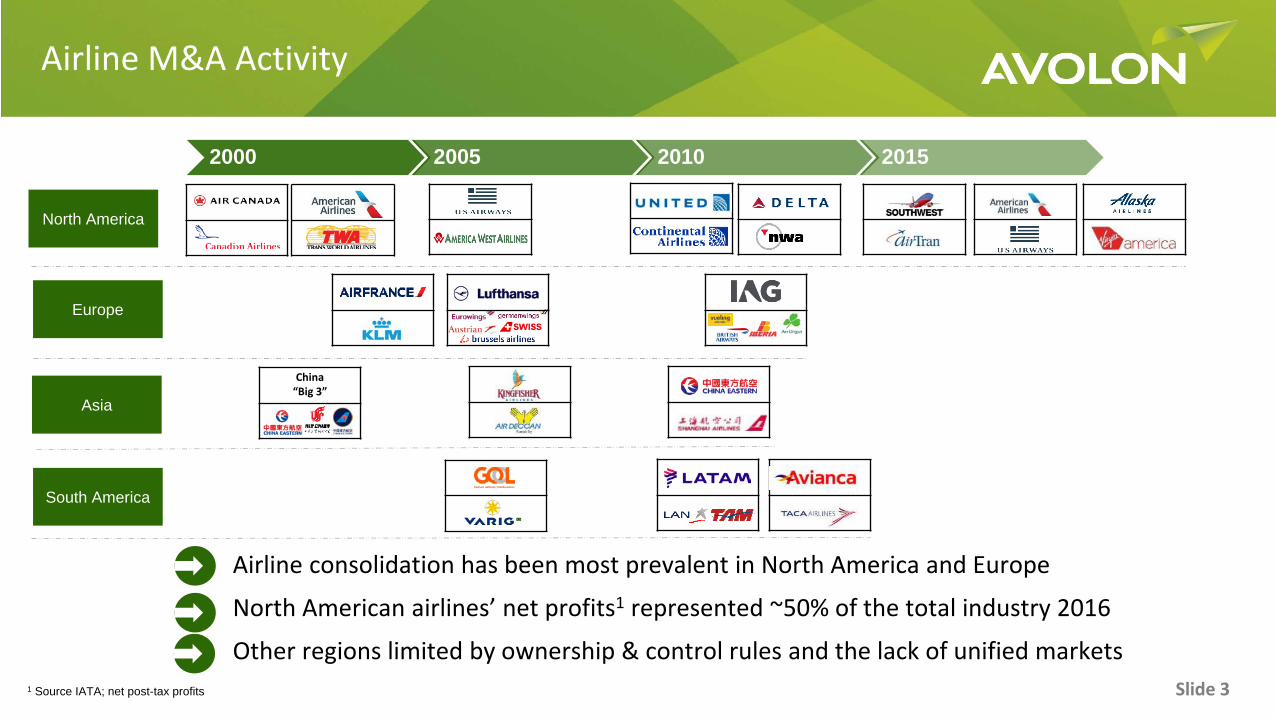
Airline M&A Activity
North America
Airline consolidation has been most prevalent in North America and Europe
North American airlines’ net profits1 represented ~50% of the total industry 2016
Other regions limited by ownership & control rules and the lack of unified markets
China “Big 3”
Europe
Asia
South America

Slide 4
C
B-
C
BB-
BBB-
BB
Caa2 Ba3 CCC+ BB-
B2 Baa3
Caa1 Ba2
B BBB-
CCC BB-
2009 2017
US Majors’ Credit Rating Significant Improvements
Source: Rating Agencies. *All ratings are senior unsecured ratings except for 1) Delta’s 2009 ratings which are as follows: Fitch – “Issuer Default” ; Moody’s – “Corporate Family” ; S&P – “Credit Rating” and 2) United 2009 Moody's Rating which is "Corporate Family"
2009 2017 2009 2017

Slide 5
Pre-2000 2000 2010 2015
Principal benefit is scale: purchasing power, market access, credit rating, airline incumbency, portfolio and platform efficiencies.
New Asian entrants, backed by large institutions, enjoy low financing cost despite small scale
Lessor M&A occurring on a global scale

Slide 6
Lessor growth demographics
Source: Ascend, Managed Aircraft, In Service
Consolidation in the aircraft leasing industry has been neutralised by new entrants
Avolon is the only lessor added to >500 aircraft list in 15 years
Achieving real scale is challenging 100-249 Aircraft
250-500 Aircraft
500+
Por
tfolio
Siz
e
X = Number of lessors
3
7
12100-249 Aircraft
250-500 Aircraft
500+
Slide 7
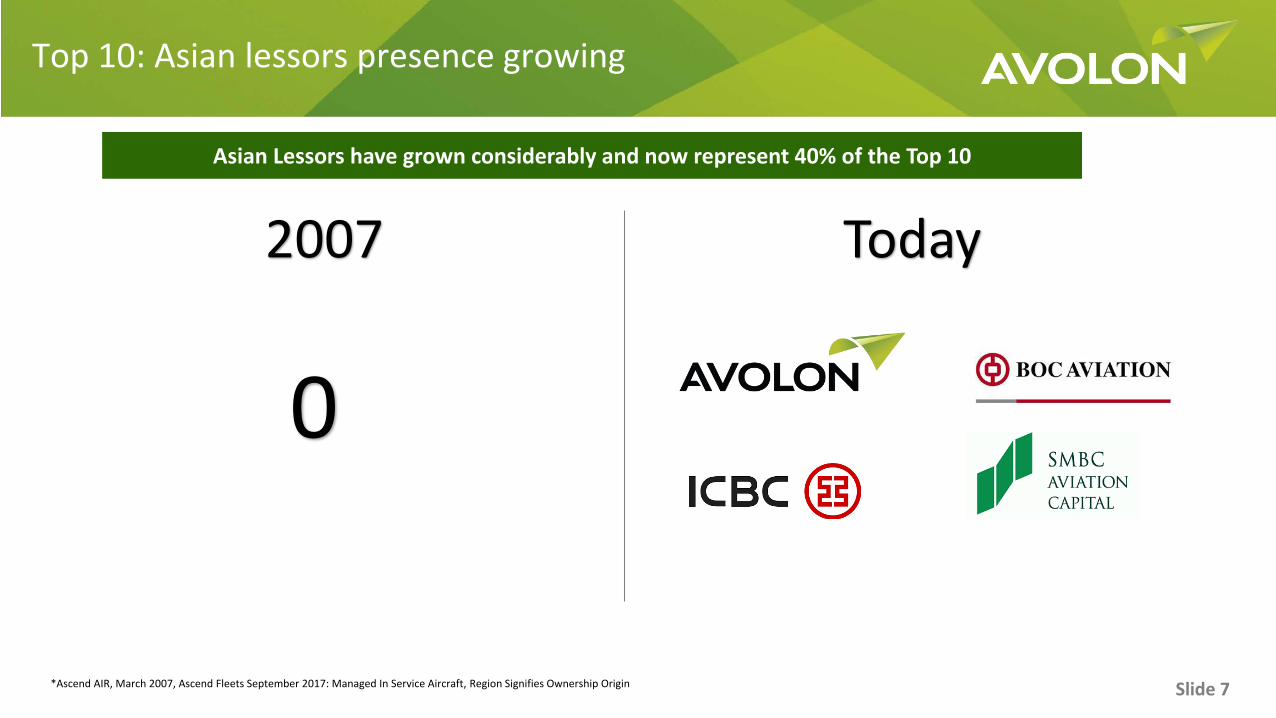
Top 10: Asian lessors presence growing
*Ascend AIR, March 2007, Ascend Fleets September 2017: Managed In Service Aircraft, Region Signifies Ownership Origin
Asian Lessors have grown considerably and now represent 40% of the Top 10
2007 Today
0
Slide 8
Significant aircraft financing requirement
2018 = $141Bn
Source: Boeing Capital
Slide 9
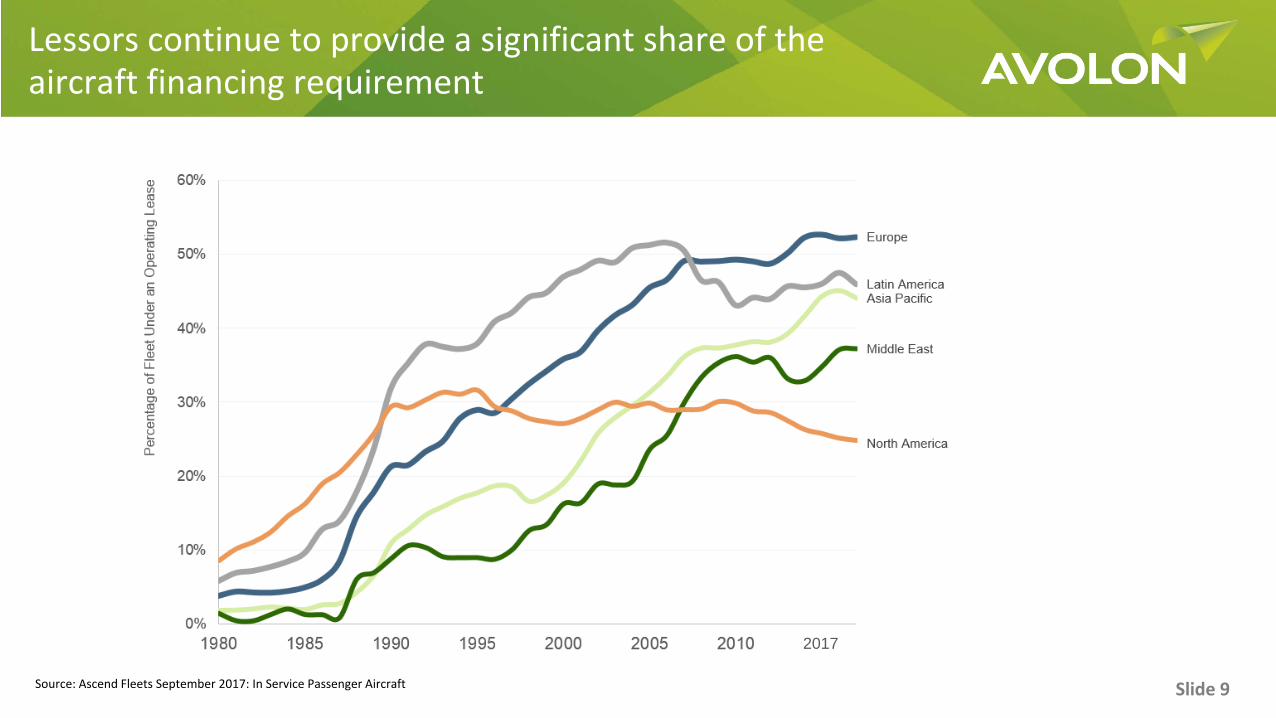
Lessors continue to provide a significant share of the aircraft financing requirement
Source: Ascend Fleets September 2017: In Service Passenger Aircraft
2017
Slide 10
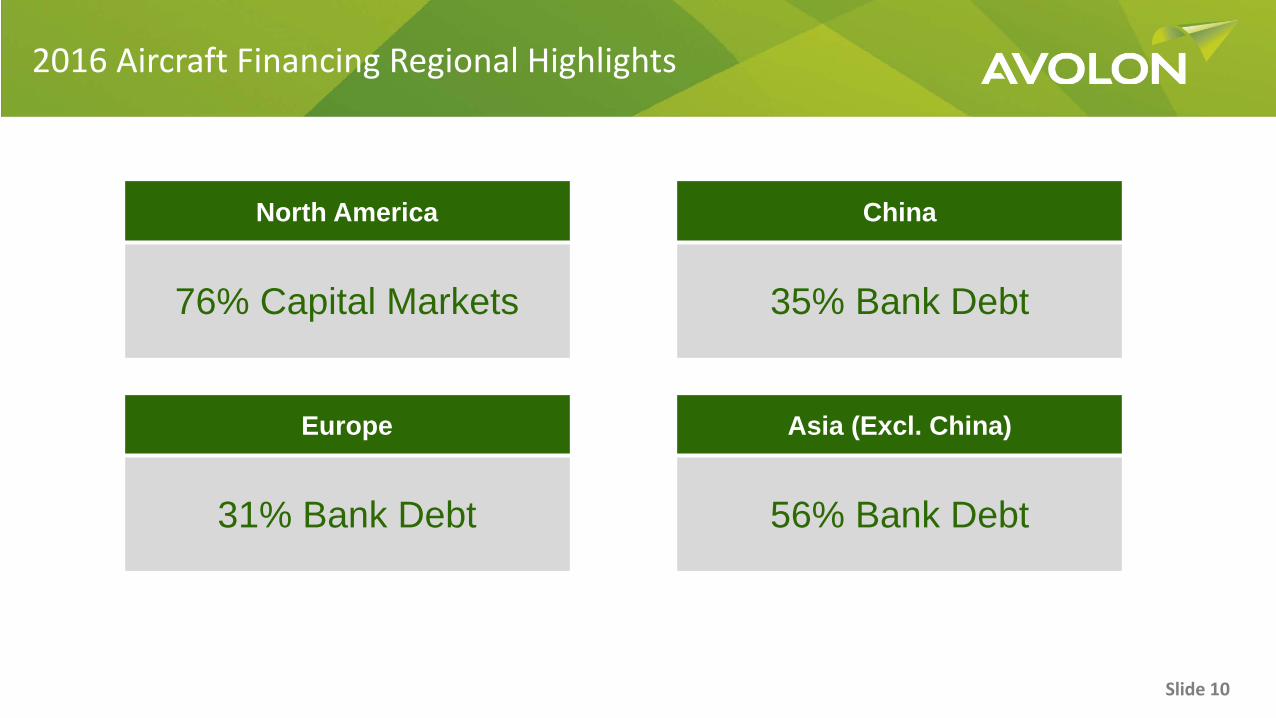
2016 Aircraft Financing Regional Highlights
North America
76% Capital Markets
China
35% Bank Debt
Europe
31% Bank Debt
Asia (Excl. China)
56% Bank Debt
Slide 11
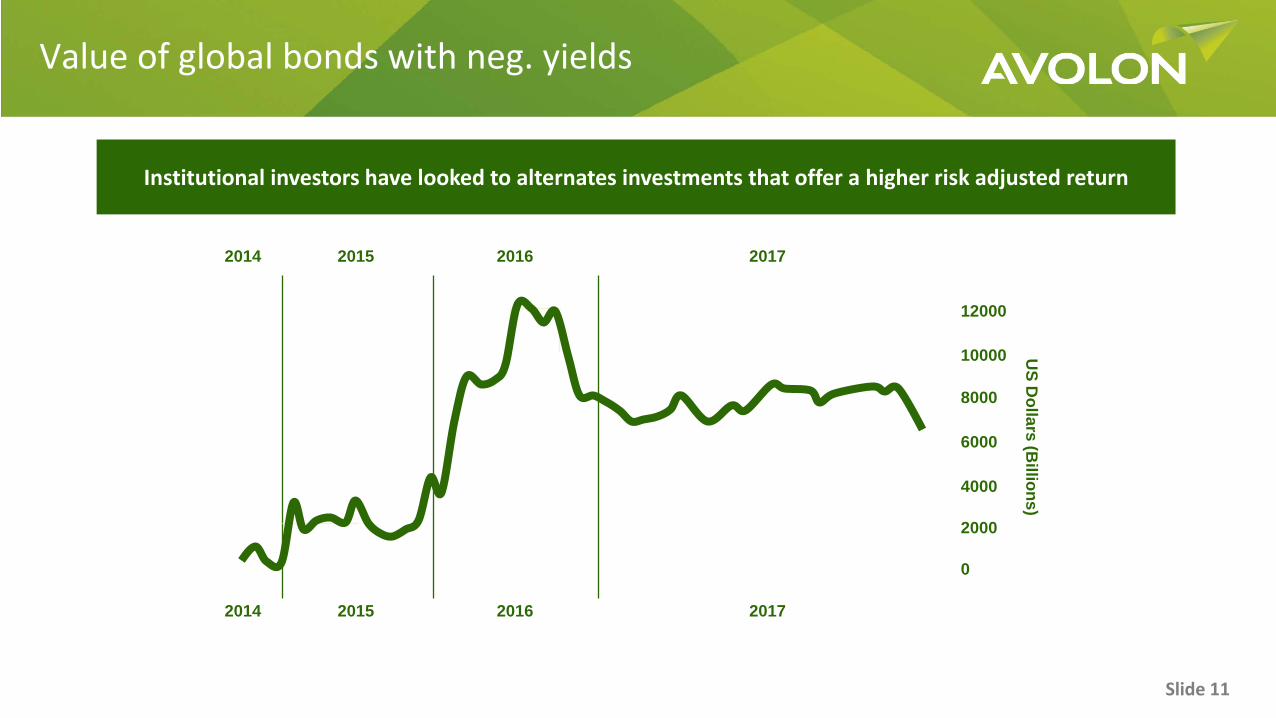
Value of global bonds with neg. yields
2014 2015 2016 2017
12000
10000
8000
6000
4000
2000
0
US D
ollars (Billions)
Institutional investors have looked to alternates investments that offer a higher risk adjusted return
2014 2015 2016 2017

Slide 12
Outlook
Headwinds Tailwinds
Interest rates
Excess Capacity / Yields
New Entrants
Macro Events (e.g. Brexit)
Fuel Price
Traffic Demand
Profitability
Balance Sheets

Slide 13
Avolon | Slide 22
THANK YOU