1
1
Transcriptional profiling of cross pathway control in Neurospora crassa and comparative
analysis of the Gcn4 and CPC1 regulons
Chaoguang Tian1, Takao Kasuga
1, Matthew S. Sachs
2 and N. Louise Glass
1
1Department of Plant and Microbial Biology
University of California, Berkeley 94720-3102 and 2Oregon Health & Science University,
Beaverton, OR 97006-8921
Corresponding author
N. Louise Glass
Tel (510) 643-2399
FAX (510) 642-4995
ACCEPTED
Copyright © 2007, American Society for Microbiology and/or the Listed Authors/Institutions. All Rights Reserved.Eukaryotic Cell doi:10.1128/EC.00078-07 EC Accepts, published online ahead of print on 20 April 2007

2
2
ABSTRACT
Identifying and characterizing transcriptional regulatory networks is important for
guiding experimental tests on gene function. The characterization of regulatory networks allows
comparisons among both closely and distantly related species, providing insight into network
evolution, which is predicted to correlate with the adaptation of different species to particular
environmental niches. One of the most intensely studied regulatory factors in the yeast
Saccharomyces cerevisiae is the bZIP transcription factor, Gcn4p. Gcn4p is essential for a
global transcriptional response when S. cerevisiae experiences amino acid starvation. In the
filamentous ascomycete Neurospora crassa, the ortholog of GCN4 is called cross pathway
control-1 (cpc-1); it is required for the ability of N. crassa to induce a number of amino acid
biosynthetic genes in response to amino acid starvation. Here, we decipher the CPC1 regulon by
profiling transcription in wild-type and cpc-1 mutant strains with full genome N. crassa 70-mer
oligonucleotide microarrays. We observed that at least 443 genes were direct or indirect CPC1
targets; these included 67 amino acid biosynthetic genes, 16 tRNA synthetase genes and 13
vitamin-related genes. Comparison between the N. crassa CPC1 and Gcn4/CaGcn4
transcriptional profiling datasets from S. cerevisiae and Candida albicans, respectively, revealed
a conserved regulon of 32 genes, 10 of which are predicted to be directly regulated by
Gcn4p/CaGcn4p/CPC1. The 32 gene conserved regulon encoded mostly amino acid biosynthetic
genes. The comparison of regulatory networks in species with clear orthology of genes sheds
light on how gene interaction networks evolve.
ACCEPTED

3
3
Key words: cpc-1, Neurospora crassa, GCN4, transcriptional profiling, regulatory network
evolution, Saccharomyces cerevisiae, Candida albicans
ACCEPTED
4
4
A major means of responding to stress and environmental perturbations is to alter
patterns of gene expression. The advent of full genome microarrays enables the measurement of
mRNA levels in response to these alterations. In the yeast Saccharomyces cerevisiae, the bZIP
transcription factor, Gcn4p, is the major regulator of genes whose expression changes in
response to amino acid starvation (26, 28). Gcn4p activates the transcription of more than 30
amino acid biosynthetic genes in 12 different biosynthetic pathways; mutations in GCN4 abolish
transcriptional responses associated with amino acid starvation (27, 49). Starvation for single
amino acids leads to increased synthesis of enzymes associated with amino acid biosynthesis
(25). Microarray analysis has further determined that Gcn4p affects the transcription of a large
number of genes (~1000) in response to amino acid starvation (34, 45).
Production of Gcn4p itself is induced during amino acid starvation via translational
regulation; four short upstream ORFs (uORFs) of 2 to 4 amino acids in length affect ribosome
scanning of GCN4 mRNA under conditions of stress (24, 44, 61). Translational regulation of
GCN4 is associated with kinase activity of Gcn2p, which is stimulated by the binding of
deacylated tRNAs that accumulate under conditions of amino acid starvation. The
phosphorylation target of Gcn2p is the α-subunit of translation initiation factor 2 (eIF2). In
addition to amino acid starvation, the Gcn4p pathway is also induced by starvation for purines
(50), glucose limitation (71), exposure to DNA damage agents, such as methyl methanesulfonate
(45) and rapamycin (67); it is not clear whether translational regulation of Gcn4p is identical
under all these stress conditions.
Gcn4p binds to 5’TGACTCA3’ sequences in the promoters of target genes, such as HIS4,
HIS3 ILV1 and ILV2 (1). By chromatin immunoprecipitation (ChIP) experiments, the promoters
of 207 genes were bound by Gcn4p (p<0.001) (22, 36); 95 genes overlap between the
ACCEPTED
5
5
transcriptional profiling and ChIP datasets. Gcn4p was also shown to physically interact with
numerous other proteins that are predicted to affect Gcn4p DNA binding and function in vivo (22,
33, 60).
The filamentous fungus Neurospora crassa diverged from S. cerevisiae approximately
350 million years ago (16). Previously, it was shown by genetic analyses that the cross-pathway
or general amino acid control is an evolutionarily conserved process between S. cerevisiae and N.
crassa (reviewed in (53)). A mutation in N. crassa was identified that conferred a phenotype
very similar to gcn4 mutants of S. cerevisiae; the cross pathway control (cpc-1) mutant failed to
induce the expression of a number of amino acid biosynthetic genes upon amino acid starvation,
(3, 4, 18, 37, 56). CPC1 is required for the global regulatory response observed during starvation
for amino acids (9-11, 46). The cpc-1 locus encodes a bZIP transcription factor with sequence
similarity to Gcn4 (46). The mRNA for cpc-1 encodes a long leader segment with two upstream
ORFs (uORFs) of 2 and 41 codons (53). As with GCN4, translation of cpc-1 mRNA is regulated
by amino acid starvation; the uORFs play a regulatory role (53). An ortholog of the GCN2 eIF2α
kinase, cpc-3, is important for the regulation of cpc-1 function in response to amino acid
starvation (55).
The amino acid identity between CPC1 and GCN4 is only 25% (42% similarity). The
carboxyl-terminus of CPC1 contains the DNA binding and dimerization domain (57 aa residues)
(46); however, regions associated with DNA binding and transcriptional activation are more
similar between Gcn4p and CPC1 in primary sequence (30 aa residues involved in DNA binding
are 70% identical) than are other regions. The introduction of GCN4 into a cpc-1 mutant of N.
crassa did not restore cross-pathway control (48), only constructs where the DNA binding
domain of cpc-1 was replaced by that of GCN4 complemented the cpc-1 mutant phenotype.
ACCEPTED

6
6
In N. crassa, cpc-1 is regulated throughout the asexual life cycle (14, 31, 54). The relative
levels of DNA binding activity from cell extracts correlates with CPC1 binding activity (14).
Binding studies of the trp-3 and arg-2 promoter regions show that CPC1 binds to a DNA
sequence identical to that bound by Gcn4p (5’TGACTC3’). However, the size of the bound
complex is larger than the predicted CPC1 homodimer, indicating that additional unknown
proteins also bind to these regions. As many as 20% of the total detectable mRNA species in N.
crassa are influenced directly or indirectly by the presence of a functional cpc-1 gene during
amino acid starvation (17), including cpc-1 itself; CPC1 regulates it own expression (14). The
synthesis of many polypeptides also increases in response to arginine limitation, which is
dependent on functional CPC1 (17, 58). These data indicate that CPC1 controls a large number
of N. crassa genes, similar in magnitude to the number reported for Gcn4p in S. cerevisiae (45).
In this study, we determined the regulon of CPC1 by profiling transcription of a wild-
type and a cpc-1 mutant under normal growth conditions and under amino acid starvation. As
with the GCN4 regulon, the transcription of a large number of genes was affected by conditions
of amino acid starvation and was also dependent upon functional CPC1. At least 443 genes were
predicted to be either direct or indirect CPC1 targets, including 67 amino acid biosynthesis genes,
16 tRNA synthetase genes and 13 vitamin metabolism related genes. In addition, a large number
of genes showed CPC1-dependent repression. We compared our results to those obtained by a
similar study on both wild-type and gcn4 mutants in S. cerevisiae and Candida albicans (62).
We identified conserved and divergent elements in the response to amino acid starvation in these
three fungi. A comparison of these regulons showed that regulation of only 32 orthologous
genes was conserved among all three fungi. Of these 32 genes, only 10 retained the conserved
cis-element bound by Gcn4p/CPC1.
ACCEPTED

7
7
MATERIALS AND METHODS
N. crassa genome 70-mer oligonucleotide microarray design and synthesis. We developed
oligonucleotide microarrays for the Neurospora research community as part of NIH Program
Project Grant GM068087. In a previous transcriptional profiling study assessing gene
expression patterns associated with asexual spore germination (31), we used an oligonucleotide
array comprised of 3366 predicted N. crassa genes. From the results of that study, we revised
our design to construct a 70-mer oligonucleotide set corresponding to the predicted 10,526 open
reading frames (ORFs) of N. crassa (Broad Institute,
http://www.broad.mit.edu/annotation/fungi/neurospora_crassa_7/index.html and MIPS,
http://pedant.gsf.de/cgi-bin/wwwfly.pl?Set=Ncrassa_annotations&Page=index) using the
bioinformatic tool ArrayOligoSelector (6, 31). ArrayOligoSelector identifies a unique 70 bp
segment to represent each ORF, avoiding self-annealing structures and repetitive sequences. In
addition, 384 70-mer oligonucleotides to intergenic or telomeric regions were included, along
with Ambion oligonucleotides for normalization procedures (31). A total of 10,910 70-mer
oligonucleotides were synthesized (Illumina, Inc., San Diego). We printed the 10,910 70-mers
onto gamma amino propyl silane slides at the University of California-San Francisco Core
Facility for Genomics and Proteomics (http://derisilab.ucsf.edu/core/). N. crassa microarray
slides are available to the research community from the Fungal Genetics Stock Center (FGSC)
http://www.fgsc.net/. Information on the oligonucleotide gene set is available at the Neurospora
Functional Genomics Database
(http://www.yale.edu/townsend/Links/ffdatabase/introduction.htm).
ACCEPTED

8
8
Strains and culture conditions. The cpc-1 mutant (FGSC 4264) and the wild-type (WT)
sequenced strain (FGSC 2489) were obtained from the FGSC. The cpc-1 CD15 allele is a single
base pair deletion in codon 93, resulting in a non-functional truncated polypeptide (47). Strains
were inoculated to slants containing Vogel’s (69) minimal medium and grown at 30ºC for two
days, followed by incubation at 25°C in constant light for 7 days. Conidia were harvested with
water and inoculated into 50 ml of Bird’s medium (43) in 250 ml Erlenmeyer flasks at a final
concentration of 106 conidia/ml. The cells were grown under constant light at 30ºC for 12 h at
300 rpm in a gyratory shaker. The inhibitor of imidazole glycerol phosphate (IGP) dehydratase,
3-aminotriazole (3-AT) was then added to a final concentration of 6 mM or 30 mM to the wild-
type (WT) and cpc-1 strains (FGSC 2489 and FGSC 4264, respectively). Addition of 3-AT to N.
crassa inhibits histidine biosynthesis and causes IGP to accumulate. Control cultures received no
3-AT. All cultures were incubated under identical conditions for a further 2 h. Each sample was
represented by duplicate cultures. The mycelium was harvested by filtration, immediately
immersed in liquid nitrogen and stored at -70ºC.
In N. crassa, amino acid starvation has been experimentally induced by the addition of 6
mM 3-AT to hyphal cultures (14, 54). To determine the appropriate concentration for
transcriptional profiling amino acid starvation in N. crassa, we performed profiling experiments
on 12 h old hyphal culture grown in liquid medium and exposed or not to 6 mM or 30 mM 3AT
for 30 min or for 2 h. Approximately 300 genes showed differential regulation after a 2 h
exposure to 3-AT under both concentrations (6 mM and 30 mM); expression levels were most
affected by 3-AT treatment time rather than by 3-AT concentration. To minimize possible side
effects of using too high a concentration of 3-AT, for subsequent analyses we exposed 12-h old
hyphae to 6 mM 3-AT for a 2 h.
ACCEPTED

9
9
RNA isolation and cDNA labeling. RNA isolation was accomplished using Trizol (Invitrogen
Life Technologies) and subsequently purified using the RNAeasy kit (Qiagen) according to the
manufacturers’ protocols. For cDNA synthesis and labeling, the Pronto kit (#40076, Corning)
was used according to manufacturer’s specifications. Briefly, cDNA was synthesized from 10ug
total RNA and oligo dT primer, ChipShot Reverse Transcriptase and aminoallyl-dNTP mix and
incubated at 42°C for 2 h. The cDNA was purified by a ChipShot membrane column. The dyes,
Cy3 and Cy5 (Amersham (#RPN5661)) were incorporated into cDNA by adding Cy3 or Cy5
mono NHS ester dye to the cDNA solution for 1 h at 22°C. The cDNA was subsequently
cleaned by a ChipShot membrane column, dried by vacuum and subsequently used for
hybridization.
Hybridization and image acquisition. Slides were pre-hybridized and hybridized at 42°C
according to manufacturer’s instructions (Corning Pronto kit (cat# 40076)). Briefly, the presoak
solution was pre-warmed (42°C) for 30 min and then a 1% volume of sodium borohydride was
added to the presoak solution and mixed well. The microarray slide was then added to solution
and incubated at 42°C for 20 min. Slides were washed, transferred to pre-warmed pre-
hybridization (42°C) for 15 min and then re-washed. The pre-soak and pre-hybridization steps
reduced slide background. Following slide pre-hybridization, labeled cDNA was re-suspended in
30µl hybridization solution (Pronto kit), heated at 95°C for 5 min and subsequently pipetted into
the space between a microarray slide and a LifterSlip cover glass (Erie Scientific, Portsmouth,
NH). Hybridization was carried out for 16 h at 42°C and unbound DNA was washed off
according to manufacturer’s instructions. An Axon GenePix 4000B scanner (Axon Instruments,
CA) was used to acquire images and GenePix Pro6 software was used to quantify hybridization
ACCEPTED
10
10
signals. Low-quality spots were flagged automatically by GenePix software and subsequently
each slide was inspected manually.
Experimental design and data analysis. For transcriptional profiling of WT and the cpc-1
mutant under conditions of amino acid starvation, we chose to use a closed circuit design for
microarray comparisons (Supplemental Fig. 1). Each arrow represents one hybridization and the
arrowhead points to Cy5-labelled cDNA. Circuit designs for microarrays are statistically robust
and improve resolution in identifying differentially regulated genes when compared to designs
for microarrays that use a universal reference (32, 63, 64, 68, 72).
Hybridized spots with at least one of the mean fluorescence intensities for Cy3 or Cy5
that was greater than mean background intensity plus three standard deviations of background
intensity were scored for further analysis if less than 0.02% of pixels were saturated.
Normalized ratio data were analyzed using Bayesian Analysis of Gene Expression Levels
(BAGEL) software, with which we inferred a relative gene expression level and credible interval
for each gene in each sample (65). These inferred levels of gene expression were then clustered
(15) using Hierarchical Clustering Explorer 2.0 (57) in which similarity in expression patterns
between genes is measured as Pearson’s correlation coefficient and the closest two genes or
clusters are successively joined. The Functional Catalogue (FunCat) created by MIPS (19, 52)
was mined to associate functional annotation for Neurospora genes
(http://mips.gsf.de/genre/proj/ncrassa/Search/Catalogs/catalog.jsp). Statistically significant over-
representation of gene groups in functional categories as compared to the whole genome was
obtained from the MIPS online FunCat system using hypergeometric distribution for p-value
calculation (http://mips.gsf.de/proj/funcatDB/help_p-value.html).
ACCEPTED
11
11
Cis-element discovery and enrichment analysis. Enrichment of motifs (p<0.001) was assessed
using Fisher’s exact test, performed by the Fisher test function implemented in the R 1.9
program (http://bioconductor.org). A motif logo illustrating the consensus sequence was
obtained using WebLogo program (http://weblogo.berkeley.edu). For identification of the CPC1
DNA-binding motif, the total number of putative targets was evaluated by MIPS Functional
Category analysis. Motif searches were conducted using three programs, BioProspector (42),
MDscan (38) and MEME (2) on segments 500 bases upstream of predicted translational start
sites, which were downloaded from the Broad Institute N. crassa database release version 7
(http://www.broad.mit.edu/annotation/fungi/neurospora_crassa_7/). The different predictions
were compared and inspected manually. The CPC1 DNA-binding cis-element matrix was built
based on MDscan prediction using the default parameter. From the initial MDscan, the
conserved 7 bp region in the middle of the element was used to make the initial matrix from
motif 1 (10 bp width). Using the initial matrix, the promoter regions of the 67 amino acid genes
were evaluated by the PATSER program (23). Fifty-seven genes were retained by using known
CPC1 targets to determine the cut-off value. The predicted cis-element in the promoter region of
these 57 genes was used to build the CPC1 DNA-binding matrix and logo. To identify additional
CPC1 target genes in the N. crassa and S. cerevisiae genome, predicted promoter regions were
scanned using the CPC1/Gcn4p matrix (23). Enrichment analysis was binned into a perfect
match to the CPC1/Gcn4p consensus, while the second bin reflected a 70% full score.
Identification of orthologs and regulogs in Neurospora crassa and other fungi. The
sequences of predicted open reading frames (ORFs) in the N. crassa genome were downloaded
from Broad Institute version7
(http://www.broad.mit.edu/annotation/genome/neurospora/Downloads.html). S. cerevisiae ORFs
ACCEPTED

12
12
and upstream 500 bp promoter regions were downloaded from SGD database. (ftp: //genome-
ftp.stanford.edu/pub/yeast/data_download/sequence/genomic_sequence/
orf_dna/archive/) and C. albicans ORFs and upstream region were downloaded from
http://www.candidagenome.org/download/sequence/genomic_sequence/. Orthologous genes
were identified as best bi-directional hits using BLASTp, with a cut off value of 1e-10. If
orthologs were CPC1, Gcn4p or CaGcn4p targets, they were defined as being a regulog in a
common regulon, a term that extends the concept of protein-DNA interlog (regulog) as defined
by Gerstein (73). Targets can be direct (Gcn4p/CPC1-DNA interaction) or indirect
(transcriptional response affected by mutations in cpc-1/gcn4/Cagcn4, but not a direct DNA
target). The Gcn4p target gene dataset includes chromatin immunoprecipitation data
(http://jura.wi.mit.edu/young_public/regulatory_code/GWLD.html; (22, 36) and transcriptional
profiling data (34, 45), that were obtained from haploid and diploid cells, respectively.
Transcriptional profiling data for WT and gcn4 mutants of S. cerevisiae and C. albicans were
kindly provided by Dr. Alan G. Hinnebusch (NIH/NICHD) and Dr. Alistair Brown (University
of Aberdeen), respectively. We re-analyzed the CaGcn4 profiling data using BAGEL (65) based
on normalized expression data. Genes were defined as CaGcn4p targets if they induced by 3-AT
treatment in WT, were statistically significant and were repressed in the Cagcn4 mutant, but not
in WT. Promoter regions and predicted ORFs from the Candida tropicalis, Aspergillus nidulans
and Magnaporthe grisea genomes were downloaded from The Broad Institute
(http://www.broad.mit.edu/annotation/fgi/).
Supplementary data and the Neurospora Functional Genomics Microarray database. The
complete dataset generated in this study is available as supplementary data and at the Neurospora
ACCEPTED

13
13
Functional Genomics Microarray database
(http://www.yale.edu/townsend/Links/ffdatabase/introduction.htm).
RESULTS
The transcriptional profile of wild-type N. crassa exposed to 3-aminotriazole. To investigate
the similarities between N. crassa cross-pathway control and S. cerevisiae general amino acid
control, we performed transcriptional profiling of N. crassa wild-type and cpc-1 mutants under
conditions of amino acid starvation. In N. crassa, amino acid starvation has been experimentally
induced by the addition of 3-amino triazole (3-AT) to hyphal cultures (14, 54). Preliminary
experiments indicated that exposure of a 12 h culture to 6 mM 3-AT for 2 h was sufficient to
induce expression levels of known targets of CPC1 (see Materials and Methods). For microarray
analyses, we used a 70-mer oligonucleotide set to the 10,526 predicted N. crassa genes with an
additional 384 70-mer oligonucleotides to intergenic or telomeric regions and Ambion
oligonucleotides for normalization procedures (see Materials and Methods). During the course
of this experiment, and for all of the datasets discussed here, a total of 5865 spots on the
Neurospora array had expression data.
A large number of genes showed differential expression levels in cultures of wild-type N.
crassa exposed to 6mM 3-AT for 2 h relative to unexposed control cultures; expression levels of
334 genes showed a statistically significant abundance in the 3-AT exposed culture, while
expression levels of 280 genes were less in the 3-AT exposed culture relative to unexposed WT
(Table 1). The genes identified in the increased and decreased expression level datasets were
subjected to functional category representation (FunCat;
ACCEPTED
14
14
http://mips.gsf.de/genre/proj/ncrassa/Search/Catalogs/catalog.jsp) (Supplementary Table 1). Of
the 334 genes whose expression levels significantly increased by 3-AT treatment in WT, 120
genes were classified in the Metabolism functional category. Of these, 54 genes were involved in
amino acid metabolism (p value=1.44e-34) and included known targets of CPC1, including trp-1
(anthranilate synthase component II; NCU00200.2), arg-12 (ornithine carbamoyltransferase;
NCU01667.2), his-3 (histidine biosynthesis trifunctional protein; NCU03139.2), trp-3
(tryptophan synthase; NCU08409.2), leu-6 (leucine-tRNA synthetase; NCU09463.2) as well as
cpc-1 itself (NCU04050.2). Another known target of CPC1, arg-2 (arginine-specific carbamoyl-
phosphate synthetase small subunit; NCU07732.2) was slightly induced, consistent with
published data (54), but did not pass the statistical significance test. The relative level of
transcript of the for gene (cytosolic serine hydroxymethyltransferase; NCU02274.2) was not
elevated after 2 h exposure to 3-AT, although previous northern data indicated for gene
expression increased after a 1 h exposure to 3-AT (41). We assessed for gene expression levels
from both the 30 min and 2 h microarray datasets (see Materials and Methods); for expression
levels were transient (detectable in the 30 min, but not the 2 h dataset).
A significant number of genes (280) also showed reduction in expression levels when
WT was exposed to 3-AT (Table 1). Functional category analysis of these genes (S-Table 1, WT
repressed genes) showed a different distribution of affected classes compared to the genes
induced by 3-AT. The most enriched group in the set of genes repressed by 3-AT were genes
associated with ribosome biosynthesis (p value=2e-97). Within the down-regulated gene set, 89
genes were associated with ribosome biosynthesis with 67 of these genes encoding predicted
ribosomal proteins. In S. cerevisiae, the expression level of over 90 transcripts for ribosome-
related proteins is reduced upon amino acid starvation (45). In addition to genes associated with
ACCEPTED
15
15
ribosome biogenesis, 45 N. crassa nuclear-encoded mRNAs specifying products with
mitochondrial functions also showed reduced expression levels after 3-AT exposure, also
consistent with observations in S. cerevisiae (8). Only 47 genes (17%) whose expression level
was statistically significantly reduced by 3-AT treatment belonged to the Metabolism functional
category, a category not significantly enriched as a responding class.
Transcriptional profile of the N. crassa cpc-1 mutant. The cpc-1 mutant grows like WT in
minimal medium (3) and basal transcript levels for amino acid biosynthesis genes, such as his-3,
trp-3, cpc-1 and arg-2 are similar between WT strains and the cpc-1 mutant (FGSC 4264) (53).
However, enzyme assay data showed that mutations in cpc-1 affect basal levels of activity of
some amino acid biosynthetic enzymes (3). When grown in minimal medium, the cpc-1 mutant
showed a higher gene expression level in 290 genes as compared to WT under identical
conditions, while 317 genes showed a lower expression level (Table 1). Functional category
analysis of the up-regulated gene set revealed a statistically significant over-representation of
genes annotated to be involved in protein synthesis (S-Table 1). Fifty genes (p value=1.24e-37)
were predicted to be involved in ribosome biosynthesis; 37 out of 50 genes encoded ribosomal
proteins (p value=1.53e-30) and seven were predicted rRNA genes (p value=7.00e-06). Energy-
related genes were also enriched, including 45 genes with mitochondrial functions (p
value=1.41e-19), eight genes predicted to be involved in aerobic respiration (p value=1e-06) and
12 electron transport genes (p value= 6e-8). Genes predicted to be involved in amino acid
biosynthesis were not enriched, although five genes involved in amino acid transport were over-
represented (p value= 0.0004) (S-Table 1).
In contrast to the gene set showing increased expression in the cpc-1 mutant, a similar
analysis of functions of genes in the down-regulated gene set revealed no significant enrichment
ACCEPTED
16
16
for genes in any specific functional category (S-Table 1). Only 12 genes identified in the down-
regulated gene set were related to amino acid metabolism, and among these, only three of these
were predicted to be involved in amino acid biosynthesis: 2-methylcitrate dehydratase
(NCU00680.2; lysine biosynthesis), homoaconitase precursor (NCU08898.2; lysine biosynthesis)
and methionine synthase (NCU06512.2).
Comparison of transcriptional profiles between WT and the cpc-1 exposed to 3-AT. When
the cpc-1 mutant was exposed to 3-AT for 2 h, it showed significant differences in expression
level for a large number of genes in comparison to cpc-1 grown in MM; 669 showed statistically
significant increased expression levels, while 510 genes showed decreased expression levels
(Table 1). Changes in expression level of a large number of genes in the cpc-1 mutant may
reflect increased stress associated with amino acid limitation. A similar transcriptional response
occurs in the S. cerevisiae gcn4 mutant when it is exposed to 3-AT (45). To identify genes
whose response to amino acid starvation were dependent upon CPC1, we compared expression
profiles obtained for WT versus the cpc-1 mutant in response to 3-AT; 255 genes showed
statistically significant increase in expression level, while 346 genes showed a decrease in
expression level (Table 1). A Venn diagram showing overlap of datasets of up-regulated genes
from WT and the cpc-1 mutant grown in MM and MM plus 3-AT is shown in Figure 1A. A total
of 443 genes were identified as potential CPC1 targets. This dataset included 121 genes in set B
whose expression levels increased by treatment with 3-AT in WT, but not in the cpc-1 mutant,
the 25 genes in set A, whose expression levels increased in both WT and the cpc-1 mutant by
treatment with 3-AT, but increased to a higher expression level in WT, the 109 genes in set F,
which required functional cpc-1 for appropriate expression levels in WT and the 101 genes in set
D, whose expression levels increased only in WT upon exposure to 3-AT (S-Figure 2A). In
ACCEPTED

17
17
addition, the 87 genes within set C were included in the CPC1 target gene set because expression
levels of 37 of these genes increased to a higher level in WT when exposed to 3-AT as compared
to the cpc-1 mutant. Genes within set E (557) were induced only in the cpc-1 mutant upon
exposure to 3-AT and were therefore considered not to be CPC1 targets.
CPC1 regulatory cis-element analysis. By biochemical analysis, CPC1 has been shown to bind
the cis-element TGACTC as a core sequence (14). We assessed whether the cis-element
identified by biochemical analysis was enriched within the 443 CPC1 target gene set. An initial
subgroup of putative CPC1 targets composed of 500 bp upstream regions from 67 amino acid
metabolism genes were analyzed by MEME, MDscan, BioProspector (see Materials and
Methods). All three analyses recovered the same cis-element, TGACTCA (Figure 2).
Interestingly in this regard, biochemical studies also showed that an “A” in position 7 was
necessary for high affinity binding (14). Of the 443 CPC1 target genes, 87 genes contained a
perfect match to this CPC1 consensus motif in their predicted promoter regions (p value=2.70e-
45). An enrichment within this 87 gene set was detected for genes involved in amino acid
metabolism (24 genes; p value=1.9e-21) and aminoacyl tRNA-synthetase genes (15 genes; p
value=1.3e-22). We next expanded the search to identify genes within the 443 gene set that
matched the CPC1 consensus less stringently (70% of the full score); 214 promoter regions (48%)
contained a CPC1 consensus match of at least 70% (p value=1.82e-13) (Table 2). This value is
very similar to that obtained for the Gcn4 3-AT responsive target gene set in S. cerevisiae (235
out of 539, 44%) (45).
Analysis of predicted promoter regions of all 10,526 N. crassa genes showed that 351
predicted genes have a perfect match to the CPC1 consensus. When the 87 putative direct CPC1
targets were removed from this 351-gene dataset (leaving 264 genes), an enrichment for genes in
ACCEPTED

18
18
any specific functional category was not detected. When the computational search was expanded
to any N. crassa genes that contained a 70% match to the CPC1 consensus in the upstream
region, 3468 genes were identified. It is unlikely that this number of genes are directly regulated
by CPC1.
Description of genes within functional categories that are enriched in the 443-gene set of
putative CPC1 targets. Our profiling data indicated that, similar to Gcn4p, CPC1 is a major
transcriptional regulator in N. crassa. The 443 CPC1 target genes were evaluated as to functional
category using the MIPS FunCat system (52) (Figure 3 and S-Table 1). Sixty-seven of the
predicted 195 amino acid metabolism genes in FunCat were present in the 443 CPC1 target gene
set and represented the largest FunCat category (p value=3.71e-41); 50 genes encoding amino
acid biosynthetic enzymes were identified (Supplementary Table 2). Increased or wild-type
expression levels of genes within nineteen of the 20 predicted amino acid biosynthetic pathways
were dependent upon functional cpc-1 in response to amino acid starvation; only genes in the
alanine biosynthetic pathway were absent (S-Table 2). Other functional categories were also
enriched within the CPC1 target gene set, in particular, cytosolic aminoacyl-tRNA synthetase
genes (p value=7e-13), nitrogen and sulfur metabolism genes (p value=7e-8), nucleotide
metabolism genes (p value=7e-6), metabolism of vitamins, cofactors, and prosthetic groups (p
value=4e-5), alcohol fermentation related genes (p value=2e-5), protein degradation genes (p
value=8e-6), and oxygen-response and free radical detoxification genes (p value=5.80e-06)
(Figure 3 and S-Table 2; ). Slightly over 50% of genes listed in S-Table 2 have gene designations
in N. crassa (65 out of 122); the remaining genes have not been characterized.
Within the 443 CPC1 target gene set, three genes known to be involved or likely to be
involved in the translational regulation of cpc-1 were identified, including cpc-3, a GCN2
ACCEPTED
19
19
ortholog (NCU01187.2; protein kinase), eukaryotic initiation factor, eIF2B-delta subunit
(NCU01468.2) and eIF2B-epsilon subunit (NCU02414.2). The promoters of the two latter genes
contain a perfect match to the CPC1 cis-element consensus. In S. cerevisiae, GCN2 (YDR283C)
and the eIF2B delta and epsilon subunits (YGR083c and YDR211w) are not induced by
treatment with 3-AT (45), nor do they contain a Gcn4p consensus cis-element in the promoter
region.
In cross-pathway control, deacylated tRNA is the signal for amino acid starvation (26, 28,
53). Analogously to the S. cerevisiae regulatory system, N. crassa CPC3, a protein kinase (S.
cerevisiae GCN2 ortholog) is believed to be activated directly by deacylated tRNA to
phosphorylate the alpha subunit of initiation factor 2 (eIF2), reducing translation at uORFs in the
cpc-1 mRNA and thus increasing translation of CPC1 (55). Sixteen out of 21 predicted
aminoacyl-tRNA synthetase (aa-tRNA synthetase) genes (corresponding to 20 aa-tRNA
synthetases; phenylalanyl-tRNA synthetase is composed of two subunits) were identified in the
CPC1 target gene set (S-Figure 2B). Among the 21 predicted aa-tRNA synthetase genes, 19 have
a perfect cis-element match to the CPC1 consensus, including the phenylalanyl-tRNA synthetase
β-subunit (Table 3). The one aa-tRNA synthetase gene in this set that lacked a perfect element,
NCU07755.2 (tyrosyl-tRNA synthetase) had a related element, TGACTCT; this variant element
can bind weakly to CPC1 in vitro (14). In contrast to the cytosolic tRNA-synthetase genes, none
of the 9 genes annotated as mitochondrial tRNA synthetases were identified as CPC1 targets. In
addition, five genes annotated as tRNA-synthetase related, NCU00466.2 (related to NCU08894.2,
glutamyl-tRNA synthetase), NCU00920.2 (related to NCU03575.2, isoleucyl-tRNA synthetase),
NCU00931.2 (related to NCU04020.2, lysine-tRNA ligase), NCU07082.2 (related to
NCU00915.2, aspartyl-tRNA synthetase), NCU09892.2 (hypothetical, related to NCU04449.2 ,
ACCEPTED
20
20
prolyl-tRNA synthetase) were not identified as CPC1 targets and all lacked a CPC1 consensus
cis-element.
The cpc-1 mutant is more sensitive to purine and pyrimidine analogues (12, 53),
suggesting a connection between the control of nucleotide and amino acid biosynthesis in N.
crassa. In S. cerevisiae, the Gcn4p regulog includes some purine and pyrimidine metabolism
genes (45). Consistent with these data, nucleotide metabolism genes were over-represented in
CPC1 regulog (p value=7.77e-06) (S-Table 2). An over-representation of genes related to
oxygen/radical detoxification were also identified in the CPC1 target set (7 genes, p
value=5.80e-6) (S-Table 2), which included two of the four predicted catalases, cat-3
(NCU00355.2) and cat-2 (NCU05770.2). In S. cerevisiae, genes known to be induced by
treatment with hydrogen peroxide, including CTA1 (catalase A) and CTT1 (catalase T) are also
induced by 3-AT treatment, but were Gcn4p independent (45). However, unlike S. cerevisiae,
where 26 transcription factors and 11 protein kinases are part of the Gcn4 regulon (34, 45), only
three genes encoding predicted DNA-binding proteins were identified as CPC1 targets (S-Table
2). None of these predicted transcription factors have an ortholog in S. cerevisiae. Only one other
gene in addition to cpc-3 was predicted to specify a protein kinase, NCU06230.2 (out of a total
~70 in the genome) was identified in the CPC1 dataset.
Within the 443-gene CPC1 dataset, 169 (~40%) genes encode hypothetical or conserved
hypothetical proteins (S-Table 1). Of these 169 genes, 27 (16%) have a perfect CPC1 cis-element
(TGACTCA) match in their 5'-region, a value similar to that of genes in the 443-gene target set
whose functions have been annotated (20%). Of these 169 genes of unknown function, 27 have
orthologs in S. cerevisiae. However, only four among these 27 were identified as part of the
Gcn4 regulon (45)(YIL164C, a predicted nitrilase, orthologous to NCU05387.2; YCR023C,
ACCEPTED
21
21
orthologous to NCU03107.2; YIR035C, orthologous to NCU02018.2 and YBR147W,
orthologous to NCU09195.2).
Functional categorization of genes dependent upon functional CPC1 for reduced
expression levels. Consistent with our findings that CPC1 is a major regulator in N. crassa, a
large number of genes also showed reduced expression levels upon exposure to 3-AT in WT
(Table 1), many of which (119) required functional CPC1 (Figure 1B; S-Table 1, CPC1-
dependent repressed genes). However, only two of the 119 genes contained a CPC1 consensus
cis-element in their predicted promoter regions. Among these 119 genes, 53 specified proteins
involved in ribosomal biosynthesis, with 37 of these specifying ribosomal proteins
(Supplemental Figure 2C). Analysis of the 5'-regions of the 37 ribosomal protein genes led to the
identification of a conserved a cis-element, AGCCCTAA, which is identical to that previously
identified as a potential regulatory site (21, 31).
Characterization of CPC1-independent genes. Expression levels of a large number of genes
(557) increased only in the cpc-1 mutant when it was exposed to 3-AT; changes in expression
levels of these genes were therefore CPC1-independent (Figure 1A; set E). In contrast to the
CPC1 target gene set, within the CPC1-independent genes, no functional category was
significantly enriched. The slight enrichment included a group of genes encoding nucleic acid
binding proteins (p value=5e-6), including predicted transcription factors (TF) and chromosomal
remodeling proteins, plus eight predicted protein kinases (S-Table 1).
Comparative analysis of N. crassa CPC1, S. cerevisiae Gcn4 and C. albicans CaGcn4
pathways. Gcn4p influences the transcriptional response of many genes (635) in response to
amino acid starvation in S. cerevisiae (34, 45). Based on chromatin-immunoprecipitation (ChIP)
data, 207 genes are directly bound by Gcn4p (binding p-value <0.001) (22, 36). Ninety-five
ACCEPTED

22
22
genes overlap between the Gcn4p transcriptional profiling and ChIP datasets. We combined the S.
cerevisiae transcriptional profiling and ChIP data to define a set of 747 S. cerevisiae genes as the
Gcn4 regulon. Functional categorization of these 747 genes (Figure 3 and S-Table 3) showed
enrichment for the same functional categories as the CPC1 regulon, including genes involved in
amino acid biosynthesis, nitrogen and sulfur metabolism and metabolism of vitamins. However,
the Gcn4 and CPC1 regulons also show differences, most notably in aminoacyl-tRNA-synthetase
genes, which were enriched in the CPC1 dataset only and genes involved in complex cofactor
(NAD/NADP) binding, which were enriched in Gcn4 dataset only. Since CPC1 and Gcn4p show
similarity in their DNA-binding domain and the cis-element sequence bound by CPC1 and
Gcn4p is identical (TGACTCA), these data suggest that cis-elements in the promoter regions of
some genes within the CPC1/Gcn4 regulons have diverged.
To further evaluate evolution of the Gcn4/CPC1 regulons, we analyzed an expression
profile dataset available from C. albicans WT and gcn4 mutants exposed or not to 40 mM 3-AT
(62). We identified genes whose expression levels increased or decreased at statistically
significant levels in the C. albicans dataset to enable comparison to our analyses of the N. crassa
and S. cerevisiae datasets (see Materials and Methods). A total of 483 genes were defined as
CaGcn4 regulon, including 399 genes whose increased expression levels and 84 genes whose
reduced expression levels upon exposure to 3-AT were dependent upon functional CaCGN4.
Functional category analyses showed that the N. crassa, S. cerevisiae and C. albicans datasets
showed enrichment of genes within identical functional categories, including amino acid, sulfur,
and vitamin metabolism (Figure 3 and S-Table 3), although some categories were specifically
enriched within a single or two species. For example, the complex cofactor (NAD/NADP)
functional category was significantly enriched in S. cerevisiae and C. albicans datasets, but not
ACCEPTED

23
23
in N. crassa. Genes within the protein degradation and oxygen detoxification functional category
were enriched in the C. albicans and N. crassa datasets, but not in S. cerevisiae dataset and genes
within the fermentation functional category were enriched in the N. crassa and S. cerevisiae
datasets, but not in the C. albicans dataset.
In N. crassa, many cytosolic aa-tRNA synthetase genes were members of the CPC1
regulon and contained a perfect CPC1 consensus site. In S. cerevisiae, only three aa-tRNA
synthetase genes have a perfect match to the Gcn4p consensus TGAC/GTCA (Table 3). Gcn4p
ChIP data supports the cis-element function in these three aa-tRNA synthetase genes
(YHR020W (proRS related), YHR019C (AspRS) and YDR341C (ArgRS)) (22, 36)). Of the
predicted 20 cytosolic aa-tRNA-synthetase genes in C. albicans, 10 have at least a 70% match to
the Gcn4p cis-element in the 500 bp region upstream of the coding sequence, including eight
with a full match. Although aa-tRNA-synthetase genes were not significantly enriched in
CaGcn4 dataset, six out of eight of the genes with a full cis-element match were induced from
1.2-2.4-fold upon exposure to 3-AT (62); their increase in expression level was dependent upon
functional CaGCN4 (Table 3). These data suggest a loss of regulation of aa-tRNA synthetase
genes by Gcn4 orthologs in the evolution of the hemi-ascomycete clade.
Computational comparison of ortholog and regulog identity between the CPC1, Gcn4 and
CaGcn4 datasets. Regulogs consist of orthologous genes that have maintained their regulatory
network through evolution (73). Some regulogs reflect direct interaction via an orthologous
regulator (direct targets). We wished to compare the identification of Gcn4p/CaGcn4p/CPC1
targets using purely computational methods as compared to the identification of predicted
Gcn4p/CaGcn4p/CPC1 targets by transcriptional profiling methods. For the computational
approach, we used the 351 genes in the N. crassa genome recovered using the CPC1 cis-element
ACCEPTED
24
24
matrix. Of these 351 genes, 103 orthologs were identified in S. cerevisiae, although only 21 of
these contained a Gcn4p cis-element (Figure 4A). Similarly, of the 351 N. crassa genes, 116
orthologous genes were identified in C. albicans, but only 30 had a CaGcn4p cis-element. To
compare S. cerevisiae and C. albicans, we used the CPC1 cis-element matrix to scan the
promoters of S. cerevisiae genes to identify 278 that contained a perfect match to the Gcn4p cis-
element; 123 of these were detected as Gcn4p targets in combined ChIP and profiling data (22,
36). Out of these 278 genes, 155 have an ortholog in C. albicans, but only 34 of the C. albicans
orthologs have a TGACTCA cis-element in the promoter region (Figure 4A). When all three of
these datasets were compared (Sc to Nc, Sc to Ca and Nc to Ca), the promoters of only 17
orthologous genes contained the Gcn4p/CaGcn4p/CPC1 cis-element (Figure 4A; Table 4).
Twelve of these genes are involved in amino acid biosynthesis, three encode aa-tRNA
synthetases, one gene is required for adenine biosynthesis and the last gene SNZ, is involved in
vitamin B6 biosynthesis.
Transcriptional profile comparisons of orthologs and regulogs of the CPC1 and Gcn4p
pathways. We then used the transcriptional profiling datasets from S. cerevisiae, C. albicans and
N. crassa WT and gcn4/Cagcn4/cpc-1 mutants in response to amino acid starvation to compare
to our computational analyses of Gcn4/CPC1 regulons based only on predicted cis-elements. We
expect to identify both conserved direct targets of Gcn4p/CaGcn4p/CPC1 (direct regulogs) and
conserved indirect target genes (indirect regulogs).
Of the 443 genes in the N. crassa CPC1 regulon, 201 have orthologs in S. cerevisiae, a
higher percentage than total genome comparisons (26%). However, only 73 of these 201 genes
are included in the Gcn4 regulon (Figure 4B); 34 of these contained the Gcn4p consensus cis-
element. Binding of Gcn4p to promoter regions of 25 of these 34 genes is observed (22, 36).
ACCEPTED
25
25
However, only 18 of the 73 orthologous gene pairs between S. cerevisiae and N. crassa have a
full match to the Gcn4p/CPC1 cis-element consensus sequence. In C. albicans, although 211 out
of the 443 CPC1 gene set were orthologous, only 64 of these were within the CaGcn4 regulon.
Only 14 of the 64 orthologous gene pairs between C. albicans and N. crassa have a predicted
CaGcn4p/CPC1 cis-element.
We also compared the S. cerevisiae Gcn4 dataset to the C. albicans CaGcn4 dataset. Of
the 747 genes in the Gcn4 regulon, 403 orthologs were identified in C. albicans. However, only
94 of the 403 genes in C. albicans were identified as part of the CaGcn4 regulon and of these,
only 20 contained the CaGcn4p cis-element. A comparison between all three datasets showed
that 32 regulogs were conserved among all three fungi (Figure 4B), which included both direct
and indirect targets. Of these 32 orthologous genes, 22 encoded amino acid biosynthetic
enzymes, one encoded a tRNA-synthetase, two encoded enzymes involved in adenine
biosynthesis, two encoded enzymes involved in oxygen radical detoxification, one is predicted to
be involved in vitamin B6 biosynthesis, three are involved in carbon metabolism and one is of
unknown enzymatic function, but which localizes to purified mitochondria (Table 5). Of these 32
genes, 10 contained a Gcn4p/CPC1/CaGcn4p consensus sequence and 18 have been confirmed
by ChIP in S. cerevisiae (22, 36).
DISCUSSION
CPC1 is a major transcriptional regulator in Neurospora. In this study, we identified
443 genes that required functional cpc-1 for correct expression patterns when N. crassa is
exposed to amino acid starvation. This gene set was enriched for the CPC1 cis-element as
compared to the entire genome. Functional categorization of this 443 gene set showed the
highest enrichment for genes associated with amino acid metabolism. Genes within a number of
ACCEPTED
26
26
other functional categories were also enriched, including nitrogen, sulfur and nucleotide
metabolism, fermentation, protein degradation and oxygen/radical detoxification. The vast
majority of genes identified in these functional categories have not been experimentally validated
in N. crassa; our transcriptional profiling data and comparative analysis provides support for the
hypothesis that the predicted biochemical function of these genes is correct. In addition, of the
443 genes, ~40% encode hypothetical or conserved hypothetical proteins. Genes that encode
proteins involved in a common cellular pathway are often co-regulated and expression of clusters
of genes that perform related cellular functions are often correlated (15, 29). Our profiling data
provides a guide for future phenotypic screening of knockout mutants of these genes (13).
Conservation and divergence of the Gcn4/CaGcn4/CPC1 regulons: identification of a core
regulon. Comparative microarray studies have usually been performed between evolutionarily
distant species where data were obtained under diverse experimental conditions (5). Our
examination of expression patterns in these three diverse fungal species under a common set of
experimental conditions (exposure to 3-AT in liquid medium) and in mutants of an orthologous
transcriptional regulator (GCN4/CaGCN4/cpc-1) revealed a conserved regulon of direct and
indirect targets. Thirty-two orthologous gene pairs have maintained their regulation in these
three fungi under these conditions and 10 of these genes are predicted to be directly regulated by
Gcn4p/CaGcn4p/CPC1 based on computational analyses. These 32 orthologous genes form the
core of the amino acid starvation response; 22 encode amino acid biosynthetic enzymes and one
encodes an aminoacyl tRNA synthetase.
Although over 15% of the Gcn4/CaGcn4/CPC1 targets were within the amino acid
functional category, direct regulation of most of these genes by Gcn4p/CaGcn4p/CPC1, as
evaluated by the presence of cis-elements, was not conserved. These data indicate that, in some
ACCEPTED
27
27
cases, orthologous genes in S. cerevisiae, C. albicans and N. crassa maintain their regulation by
either Gcn4, CaGcn4 or CPC1, but that regulation may change from direct to indirect or vice-
versa. For example, LYS2 was identified as a Gcn4p target in S. cerevisiae both by transcriptional
profiling and ChIP (22, 36, 45). However, its ortholog in N. crassa, NCU03010.2, was identified
as a target by transcriptional profiling, but lacks the CPC1 cis-element and the site match to
consensus score is less than 50%. Similarly, NCU07982.2 has a full match to the CPC1
consensus and was identified as a target by transcriptional profiling, but its ortholog in S.
cerevisiae, ILV2, is an indirect target of Gcn4p (detected by transcriptional profiling, but not by
ChIP).
Regulatory network evolution by cis-element gain/loss. Evolution of gene expression patterns
can affect phenotypic plasticity and is thought to play an important role in adaptation of species
to a particular environmental niche (5, 59). In C. albicans, responses to amino acid availability
are linked with pseudohyphal development, biofilm formation and phagocytosis by human
neutrophils (20, 51, 66). Similarly, the GCN4 ortholog in Aspergillus fumigatus, cpcA is required
for the virulence in human pulmonary infections (7, 35). These observations suggest that the
CaGcn4/CpcA regulons in these two species have evolved additional functions. It is not clear
how multiple promoters of coordinately expressed genes coordinately evolve their cis-elements
to become members of a regulon (39, 70). For example, the promoters of ribosomal protein
genes in N. crassa contain a cis-element that is an exact match to a cis-element identified in C.
albicans (21); a similar cis-element is not found in ribosomal protein genes in S. cerevisiae.
However, as shown in this study, coordinate repression of ribosomal protein gene expression
upon amino acid starvation is a conserved process in N. crassa, S. cerevisiae and C. albicans and
is dependent upon functional GCN4/CaGCN4/cpc-1.
ACCEPTED
28
28
In the hemiascomycete clade, which includes S. cerevisiae and C. albicans, the loss of
coordinate regulation of cytoplasmic ribosomal protein genes/rRNA processing genes with
mitochondrial ribosomal protein genes is correlated with a whole genome duplication event and
massive loss of a conserved cis-regulatory element (30). Promoter evolution can also be more
gradual, as observed in the tRNA synthetase genes described in this study. In N. crassa, 19 of the
20 cytosolic tRNA–synthetase genes have an exact CPC1 cis-element located in their promoter
regions; 16 were identified in the CPC1 regulon. In the filamentous ascomycete species
Magnaporthe grisea and Aspergillus nidulans, the predicted aa-tRNA synthetase genes also
contain the predicted CPC1 cis-element (21). In Candida tropicalis, similar to C. albicans, eight
out of 16 aa-tRNA synthetase orthologs have the TGACTCA consensus. In S. cerevisiae,
profiling data and ChIP data show that most of the aa-tRNA-synthetase genes are not regulated
by Gcn4p, nor are they part of the Gcn4 regulon. This loss of regulation of aa-tRNA-synthetase
genes in the hemiascomycete clade is not associated with any known genome rearrangements,
but may be associated with adaptation and speciation.
Regulatory network evolution. Species’ genomes evolve over time, especially via gene/genome
duplication and gene/segment loss, thus making it difficult to maintain regulation of individual
components of an entire regulon. However, networks show a buffering capacity, whereby the
identity of networks can be conserved through evolution, although mechanistic aspects of
individual gene regulation can diverge. For example, although the temporal regulation of eve
stripe expression is almost identical among species of Drosophila, this similarity in overall
regulation is not reflected by patterns of sequence conservation in regulatory regions (39, 40).
Similarly, a comparison of expression data from six species (S. cerevisiae, Escherichia coli, C.
elegans, A. thaliana, humans and D. melanogaster) showed that while functionally related genes
ACCEPTED
29
29
are often co-expressed and co-regulated, modular components of each transcriptional program
vary significantly between organisms (5). Although our analysis showed that the number of
conserved Gcn4/CaGcn4/CPC1 regulogs was only a fraction of the total identified target genes
identified by transcriptional profiling, the functional categorization of Gcn4/CaGcn4/CPC1
targets was remarkably similar, with conservation of overall response pathways to amino acid
starvation.
ACKNOWLEDGEMENTS
We thank The Broad Institute and MIPS for making N. crassa gene and intergenic
genomic data available for oligonucleotide prediction. We thank Drs. Audrey Gasch, Mike
Eisen, Jing Zhu and Joe DeRisi for valuable discussions on the development of oligonucleotide
microarrays for N. crassa. We thank Betty Gilbert, Sarah Brown and Anna Simonin for help
printing the Neurospora microarrays. We thank Dr. Jeff Townsend (Yale U) for reviewing our
manuscript, providing very helpful suggestions and developing the Neurospora microarray
database. This work was funded by a National Institutes of Health multi-institutional program
project grant (GM068087) to N.L.G (Core III: Transcriptional Profiling) and M.S.S. (Core II:
Functional Annotation).
ACCEPTED

30
30
REFERENCES
1. Arndt, K., and G. R. Fink. 1986. GCN4 protein, a positive transcription factor in yeast,
binds general control promoters at all 5' TGACTC 3' sequences. Proc. Natl. Acad. Sci. U.
S. A. 83:8516-8520.
2. Bailey, T. L., and C. Elkan. 1994. Presented at the Proceedings of the Second
International Conference on Intelligent Systems for Molecular Biology, Menlo Park,
California.
3. Barthelmess, I. B. 1982. Mutants affecting amino acid cross-pathway control in
Neurospora crassa. Genet. Res. 39:169-85.
4. Barthelmess, I. B. 1986. Regulation of amino acid synthetic enzymes in Neurospora
crassa in the presence of high concentrations of amino acids. Mol Gen. Genet. 203:533-
537.
5. Bergmann, S., J. Ihmels, and N. Barkai. 2004. Similarities and differences in genome-
wide expression data of six organisms. PLoS Biol. 2:E9.
6. Bozdech, Z., J. Zhu, M. P. Joachimiak, F. E. Cohen, B. Pulliam, and J. L. DeRisi.
2003. Expression profiling of the schizont and trophozoite stages of Plasmodium
falciparum with a long-oligonucleotide microarray. Genome Biol. 4:R9.
7. Braus, G. H., C. Sasse, and S. Krappmann. 2006. Amino acid acquisition, cross-
pathway control, and virulence in Aspergillus. Med. Mycol. 44:91-94.
8. Cantwell, R., C. M. McEntee, and A. P. Hudson. 1992. Regulation of mitochondrial
transcription during the stringent response in yeast. Curr. Genet. 21:241-247.
ACCEPTED
31
31
9. Carsiotis, M., and R. F. Jones. 1974. Cross-pathway regulation: tryptophan-mediated
control of histidine and arginine biosynthetic enzymes in Neurospora crassa. J. Bacteriol.
119:889-92.
10. Carsiotis, M., R. F. Jones, and A. C. Wesseling. 1974. Cross-pathway regulation:
histidine-mediated control of histidine, tryptophan, and arginine biosynthetic enzymes in
Neurospora crassa. J. Bacteriol. 119:893-898.
11. Carsiotis, M., and A. M. Lacy. 1965. Increased activity of tryptophan biosynthetic
enzymes in histidine mutants of Neurospora crassa. J. Bacteriol. 89:1472-1477.
12. Catcheside, D. E. A. 1978. A pleiotropic mutation Neurospora conferring sensitivity to
analogues of amino acids, purines and pyrimidines. Neurospora Newsl. 25:17-18.
13. Colot, H. V., G. Park, G. E. Turner, C. Ringelberg, C. M. Crew, L. Litvinkova, R. L.
Weiss, K. A. Borkovich, and J. C. Dunlap. 2006. A high-throughput gene knockout
procedure for Neurospora reveals functions for multiple transcription factors. Proc. Natl.
Acad. Sci. U.S.A. 103:10352-10357.
14. Ebbole, D. J., J. L. Paluh, M. Plamann, M. S. Sachs, and C. Yanofsky. 1991. cpc-1,
the general regulatory gene for genes of amino acid biosynthesis in Neurospora crassa, is
differentially expressed during the asexual life cycle. Mol. Cell. Biol. 11:928-34.
15. Eisen, M. B., P. T. Spellman, P. O. Brown, and D. Botstein. 1998. Cluster analysis and
display of genome-wide expression patterns. Proc. Natl. Acad. Sci. U. S. A. 95:14863-
14868.
16. Fitzpatrick, D. A., M. E. Logue, J. E. Stajich, and G. Butler. 2006. A fungal
phylogeny based on 42 complete genomes derived from supertree and combined gene
analysis. BMC Evol. Biol. 22;6:99.
ACCEPTED

32
32
17. Flint, H. J. 1985. Changes in gene expression elicited by amino acid limitation in
Neurospora crassa strains having normal or mutant cross-pathway amino acid control.
Mol. Gen. Genet. 200:283-290.
18. Flint, H. J., and J. Wilkening. 1986. Cloning of the arg-12 gene of Neurospora crassa
and regulation of its transcript via cross-pathway amino acid control. Mol. Gen. Genet.
203:110-116.
19. Frishman, D., K. Albermann, J. Hani, K. Heumann, A. Metanomski, A. Zollner, and
H.-W. Mewes. 2001. Functional and structural genomics using PEDANT. Bioinformatics
17:44-57.
20. Garcia-Sanchez, S., S. Aubert, I. Iraqui, G. Janbon, J.-M. Ghigo, and C. d'Enfert.
2004. Candida albicans biofilms: a developmental state associated with specific and
stable gene pxpression patterns. Eukaryot. Cell 3:536-545.
21. Gasch, A. P., A. M. Moses, D. Y. Chiang, H. B. Fraser, M. Berardini, and M. B.
Eisen. 2004. Conservation and evolution of cis-regulatory systems in ascomycete fungi.
PLoS Biol. 2:e398.
22. Harbison, C. T., D. B. Gordon, T. I. Lee, N. J. Rinaldi, K. D. Macisaac, T. W.
Danford, N. M. Hannett, J. B. Tagne, D. B. Reynolds, J. Yoo, E. G. Jennings, J.
Zeitlinger, D. K. Pokholok, M. Kellis, P. A. Rolfe, K. T. Takusagawa, E. S. Lander,
D. K. Gifford, E. Fraenkel, and R. A. Young. 2004. Transcriptional regulatory code of
a eukaryotic genome. Nature 431:99-104.
23. Hertz, G. Z., and G. D. Stormo. 1999. Identifying DNA and protein patterns with
statistically significant alignments of multiple sequences. Bioinformatics 15:563-577.
ACCEPTED
33
33
24. Hinnebusch, A. G. 1984. Evidence for translational regulation of the activator of general
amino acid control in yeast. Proc. Natl. Acad. Sci. U. S. A. 81:6442-6446.
25. Hinnebusch, A. G. 1988. Mechanisms of gene regulation in the general control of amino
acid biosynthesis in Saccharomyces cerevisiae. Microbiol. Rev. 52:248-73.
26. Hinnebusch, A. G. 2005. Translational regulation of GCN4 and the general amino acid
control of yeast. Annu. Rev. Microbiol. 59:407-450.
27. Hinnebusch, A. G., and G. R. Fink. 1983. Positive regulation in the general amino acid
control of Saccharomyces cerevisiae. Proc. Natl. Acad. Sci. U.S.A. 80:5374-5378.
28. Hinnebusch, A. G., and K. Natarajan. 2002. Gcn4p, a master regulator of gene
expression, is controlled at multiple levels by diverse signals of starvation and stress.
Eukaryot. Cell 1:22-32.
29. Ihmels, J., S. Bergmann, and N. Barkai. 2004. Defining transcription modules using
large-scale gene expression data. Bioinformatics 20:1993-2003.
30. Ihmels, J., S. Bergmann, M. Gerami-Nejad, I. Yanai, M. McClellan, J. Berman, and
N. Barkai. 2005. Rewiring of the yeast transcriptional network through the evolution of
motif usage. Science 309:938-940.
31. Kasuga, T., J. P. Townsend, C. Tian, L. B. Gilbert, G. Mannhaupt, J. W. Taylor,
and N. L. Glass. 2005. Long-oligomer microarray profiling in Neurospora crassa
reveals the transcriptional program underlying biochemical and physiological events of
conidial germination. Nucleic Acids Res. 33:6469-6485.
32. Kerr, M. K., and G. A. Churchill. 2001. Statistical design and the analysis of gene
expression microarray data. Genetical Res. 77:123-128.
ACCEPTED

34
34
33. Kim, S.-j., M. J. Swanson, H. Qiu, C. K. Govind, and A. G. Hinnebusch. 2005.
Activator Gcn4p and Cyc8p/Tup1p are interdependent for promoter occupancy at ARG1
in vivo. Mol. Cell. Biol. 25:11171-11183.
34. Kleinschmidt, M., O. Grundmann, N. Bluthgen, H. U. Mosch, and G. H. Braus. 2005.
Transcriptional profiling of Saccharomyces cerevisiae cells under adhesion-inducing
conditions. Mol. Genet. Genomics 273:382-93.
35. Krappmann, S., E. M. Bignell, U. Reichard, T. Rogers, K. Haynes, and G. H. Braus.
2004. The Aspergillus fumigatus transcriptional activator CpcA contributes significantly
to the virulence of this fungal pathogen. Mol. Microbiol. 52:785-799.
36. Lee, T. I., N. J. Rinaldi, F. Robert, D. T. Odom, Z. Bar-Joseph, G. K. Gerber, N. M.
Hannett, C. T. Harbison, C. M. Thompson, I. Simon, J. Zeitlinger, E. G. Jennings, H.
L. Murray, D. B. Gordon, B. Ren, J. J. Wyrick, J. B. Tagne, T. L. Volkert, E.
Fraenkel, D. K. Gifford, and R. A. Young. 2002. Transcriptional regulatory networks
in Saccharomyces cerevisiae. Science 298:799-804.
37. Legerton, T. L., and C. Yanofsky. 1985. Cloning and characterization of the
multifunctional his-3 gene of Neurospora crassa. Gene 39:129-40.
38. Liu, X. S., D. L. Brutlag, and J. S. Liu. 2002. An algorithm for finding protein-DNA
binding sites with applications to chromatin-immunoprecipitation microarray
experiments. Nat. Biotechnol. 20:835-839.
39. Ludwig, M. Z., A. Palsson, E. Alekseeva, C. M. Bergman, J. Nathan, and M.
Kreitman. 2005. Functional evolution of a cis-regulatory module. PLoS Biol. 3:e93.
ACCEPTED
35
35
40. Ludwig, M. Z., N. H. Patel, and M. Kreitman. 1998. Functional analysis of eve stripe 2
enhancer evolution in Drosophila: rules governing conservation and change. Develop.
125:949-958.
41. McClung, C. R., C. R. Davis, K. M. Page, and S. A. Denome. 1992. Characterization
of the formate (for) locus, which encodes the cytosolic serine hydroxymethyltransferase
of Neurospora crassa. Mol. Cell. Biol. 12:1412-1421.
42. McGuire, A. M., J. D. Hughes, and G. M. Church. 2000. Conservation of DNA
regulatory motifs and discovery of new motifs in microbial genomes. Genome Res.
10:744-757.
43. Metzenberg, R. L. Fungal Genet Newsl 51:19-20.
44. Mueller, P. P., and A. G. Hinnebusch. 1986. Multiple upstream AUG codons mediate
translational control of GCN4. Cell 45:201-207.
45. Natarajan, K., M. R. Meyer, B. M. Jackson, D. Slade, C. Roberts, A. G. Hinnebusch,
and M. J. Marton. 2001. Transcriptional profiling shows that Gcn4p is a master
regulator of gene expression during amino acid starvation in yeast. Mol. Cell. Biol.
21:4347-4368.
46. Paluh, J. L., M. J. Orbach, T. L. Legerton, and C. Yanofsky. 1988. The cross-
pathway control gene of Neurospora crassa, cpc-1, encodes a protein similar to GCN4 of
yeast and the DNA-binding domain of the oncogene v-jun-encoded protein. Proc. Natl.
Acad. Sci .U. S. A. 85:3728-3732.
47. Paluh, J. L., M. Plamann, D. Kruger, I. B. Barthelmess, C. Yanofsky, and D. D.
Perkins. 1990. Determination of the inactivating alterations in two mutant alleles of the
Neurospora crassa cross-pathway control gene cpc-1. Genetics 124:599-606.
ACCEPTED
36
36
48. Paluh, J. L., and C. Yanofsky. 1991. Characterization of Neurospora CPC1, a bZIP
DNA-binding protein that does not require aligned heptad leucines for dimerization. Mol.
Cell. Biol. 11:935-944.
49. Penn, M. D., B. Galgoci, and H. Greer. 1983. Identification of AAS genes and their
regulatory role in general control of amino acid biosynthesis in yeast. Proc. Natl. Acad.
Sci. U. S. A. 80:2704-2708.
50. Rolfes, R. J., and A. G. Hinnebusch. 1993. Translation of the yeast transcriptional
activator GCN4 is stimulated by purine limitation: implications for activation of the
protein kinase GCN2. Mol. Cell. Biol. 13:5099-5111.
51. Rubin-Bejerano, I., I. Fraser, P. Grisafi, and G. R. Fink. 2003. Phagocytosis by
neutrophils induces an amino acid deprivation response in Saccharomyces cerevisiae and
Candida albicans. Proc. Natl. Acad. Sci. U. S. A. 100:11007-11012.
52. Ruepp, A., A. Zollner, D. Maier, K. Albermann, J. Hani, M. Mokrejs, I. Tetko, U.
Guldener, G. Mannhaupt, M. Munsterkotter, and H. W. Mewes. 2004. The FunCat, a
functional annotation scheme for systematic classification of proteins from whole
genomes. Nucleic Acids Res. 32:5539-5545.
53. Sachs, M. S. 1996. General and cross-pathway controls of amino acid biosynthesis, p.
315-345. In R. Brambl and G. A. Marzluf (ed.), The Mycota, vol. 3. Springer-Verlag,
Berlin.
54. Sachs, M. S., and C. Yanofsky. 1991. Developmental expression of genes involved in
conidiation and amino acid biosynthesis in Neurospora crassa. Dev. Biol. 148:117-128.
55. Sattlegger, E., A. G. Hinnebusch, and I. B. Barthelmess. 1998. cpc-3, the Neurospora
crassa homologue of yeast GCN2, encodes a polypeptide with juxtaposed eIF2alpha
ACCEPTED
37
37
kinase and histidyl-tRNA synthetase-related domains required for general amino acid
control. J. Biol. Chem. 273:20404-20416.
56. Schechtman, M. G., and C. Yanofsky. 1983. Structure of the trifunctional trp-1 gene
from Neurospora crassa and its aberrant expression in Escherichia coli. J. Mol. Appl.
Genet. 2:83-99.
57. Seo, J., M. Bakay, Y. W. Chen, S. Hilmer, B. Shneiderman, and E. P. Hoffman. 2004.
Interactively optimizing signal-to-noise ratios in expression profiling: project-specific
algorithm selection and detection p-value weighting in Affymetrix microarrays.
Bioinformatics 20:2534-2544.
58. Spurgeon, S. L., and W. H. Matchett. 1977. Inhibition of aminoacyl-transfer
ribonucleic acid synthetases and the regulation of amino acid biosynthetic enzymes in
Neurospora crassa. J. Bacteriol. 129:1303-1312.
59. Stuart, J. M., E. Segal, D. Koller, and S. K. Kim. 2003. A gene-coexpression network
for global discovery of conserved genetic modules. Science 302:249-255.
60. Swanson, M. J., H. Qiu, L. Sumibcay, A. Krueger, S. J. Kim, K. Natarajan, S. Yoon,
and A. G. Hinnebusch. 2003. A multiplicity of coactivators is required by Gcn4p at
individual promoters in vivo. Mol. Cell. Biol. 23:2800-20.
61. Thireos, G., M. D. Penn, and H. Greer. 1984. 5' untranslated sequences are required for
the translational control of a yeast regulatory gene. Proc. Natl. Acad. Sci. U. S. A.
81:5096-5100.
62. Tournu, H., G. Tripathi, G. Bertram, S. Macaskill, A. Mavor, L. Walker, F. C. Odds,
N. A. Gow, and A. J. Brown. 2005. Global role of the protein kinase Gcn2 in the human
pathogen Candida albicans. Eukaryot. Cell 4:1687-96.
ACCEPTED
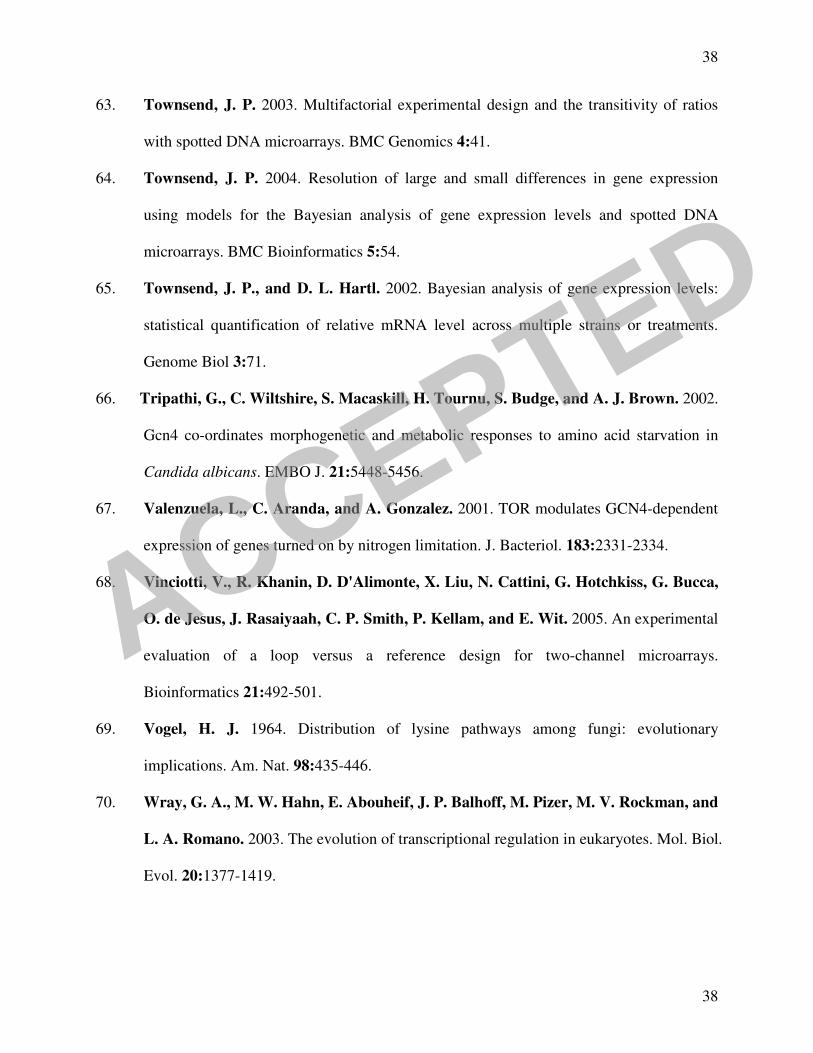
38
38
63. Townsend, J. P. 2003. Multifactorial experimental design and the transitivity of ratios
with spotted DNA microarrays. BMC Genomics 4:41.
64. Townsend, J. P. 2004. Resolution of large and small differences in gene expression
using models for the Bayesian analysis of gene expression levels and spotted DNA
microarrays. BMC Bioinformatics 5:54.
65. Townsend, J. P., and D. L. Hartl. 2002. Bayesian analysis of gene expression levels:
statistical quantification of relative mRNA level across multiple strains or treatments.
Genome Biol 3:71.
66. Tripathi, G., C. Wiltshire, S. Macaskill, H. Tournu, S. Budge, and A. J. Brown. 2002.
Gcn4 co-ordinates morphogenetic and metabolic responses to amino acid starvation in
Candida albicans. EMBO J. 21:5448-5456.
67. Valenzuela, L., C. Aranda, and A. Gonzalez. 2001. TOR modulates GCN4-dependent
expression of genes turned on by nitrogen limitation. J. Bacteriol. 183:2331-2334.
68. Vinciotti, V., R. Khanin, D. D'Alimonte, X. Liu, N. Cattini, G. Hotchkiss, G. Bucca,
O. de Jesus, J. Rasaiyaah, C. P. Smith, P. Kellam, and E. Wit. 2005. An experimental
evaluation of a loop versus a reference design for two-channel microarrays.
Bioinformatics 21:492-501.
69. Vogel, H. J. 1964. Distribution of lysine pathways among fungi: evolutionary
implications. Am. Nat. 98:435-446.
70. Wray, G. A., M. W. Hahn, E. Abouheif, J. P. Balhoff, M. Pizer, M. V. Rockman, and
L. A. Romano. 2003. The evolution of transcriptional regulation in eukaryotes. Mol. Biol.
Evol. 20:1377-1419.
ACCEPTED
39
39
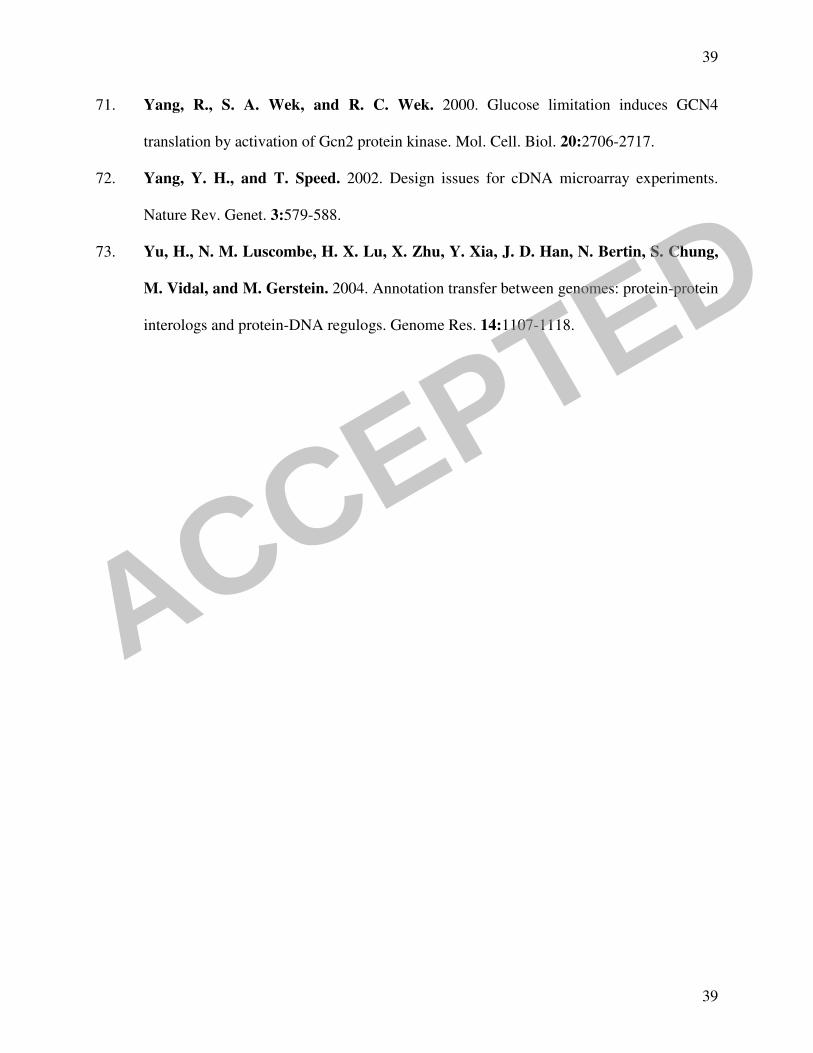
71. Yang, R., S. A. Wek, and R. C. Wek. 2000. Glucose limitation induces GCN4
translation by activation of Gcn2 protein kinase. Mol. Cell. Biol. 20:2706-2717.
72. Yang, Y. H., and T. Speed. 2002. Design issues for cDNA microarray experiments.
Nature Rev. Genet. 3:579-588.
73. Yu, H., N. M. Luscombe, H. X. Lu, X. Zhu, Y. Xia, J. D. Han, N. Bertin, S. Chung,
M. Vidal, and M. Gerstein. 2004. Annotation transfer between genomes: protein-protein
interologs and protein-DNA regulogs. Genome Res. 14:1107-1118.
ACCEPTED
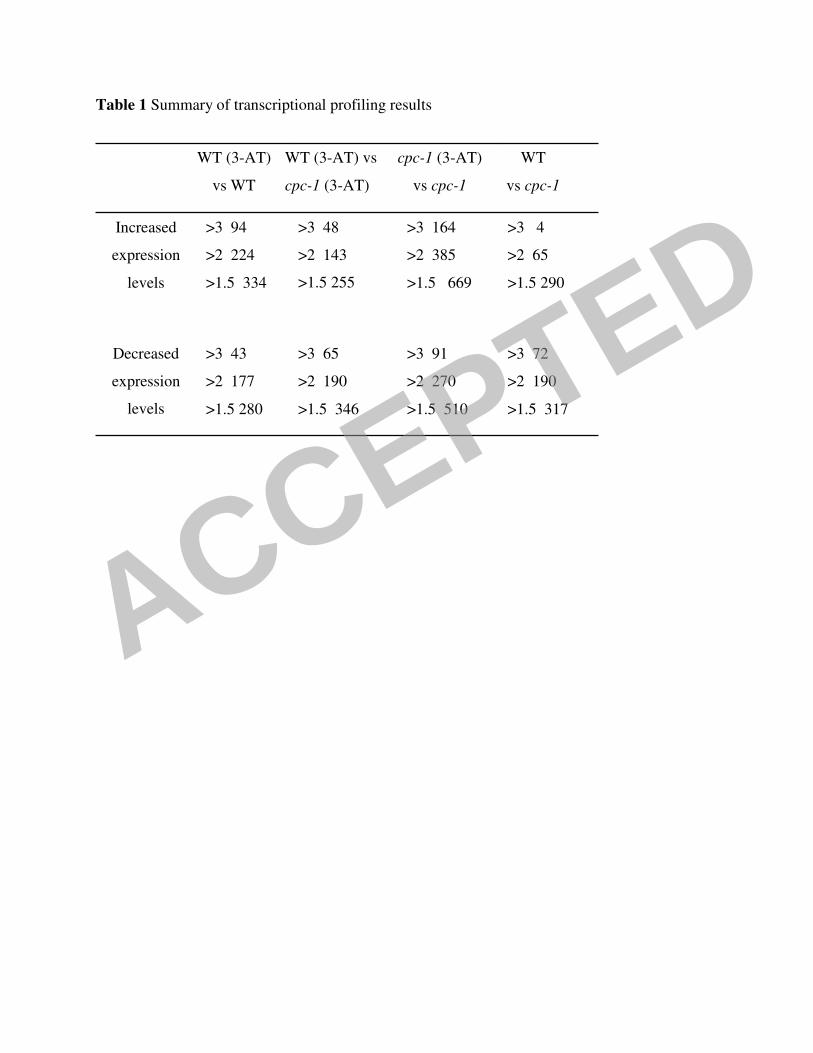
Table 1 Summary of transcriptional profiling results
>3 91
>2 270
>1.5 510
>3 164
>2 385
>1.5 669
cpc-1 (3-AT)
vs cpc-1
>3 65
>2 190
>1.5 346
>3 48
>2 143
>1.5 255
WT (3-AT) vs
cpc-1 (3-AT)
>3 72
>2 190
>1.5 317
>3 43
>2 177
>1.5 280
Decreased
expression
levels
>3 4
>2 65
>1.5 290
>3 94
>2 224
>1.5 334
Increased
expression
levels
WT
vs cpc-1
WT (3-AT)
vs WT
ACCEPTED
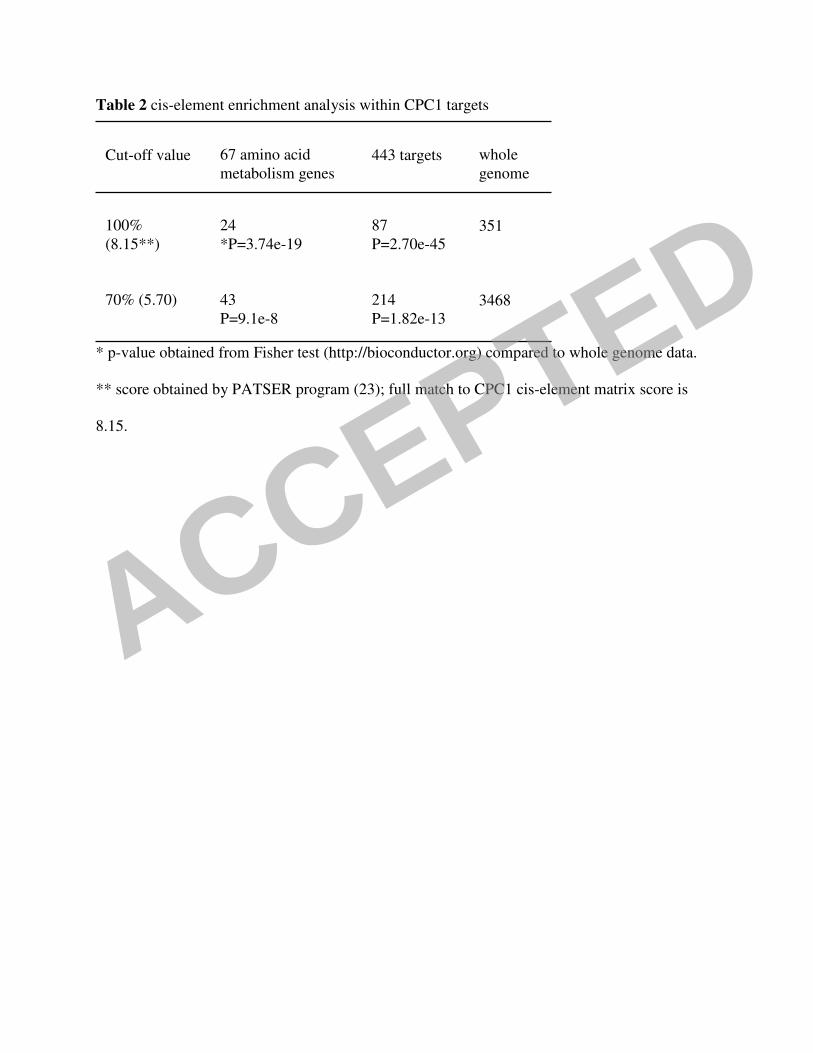
Table 2 cis-element enrichment analysis within CPC1 targets
* p-value obtained from Fisher test (http://bioconductor.org) compared to whole genome data.
** score obtained by PATSER program (23); full match to CPC1 cis-element matrix score is
8.15.
3468
214
P=1.82e-13
43
P=9.1e-8
70% (5.70)
351
87
P=2.70e-45
24
*P=3.74e-19
100%
(8.15**)
whole
genome
443 targets
67 amino acid
metabolism genes
Cut-off value
ACCEPTED
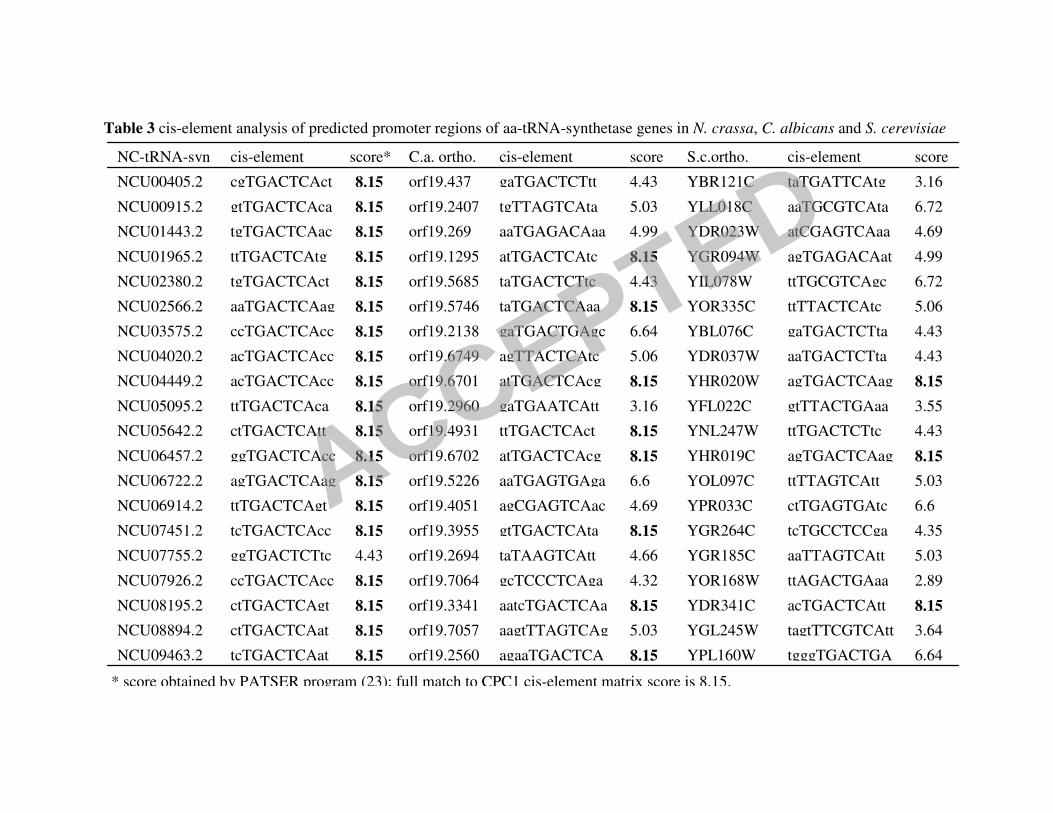
Table 3 cis-element analysis of predicted promoter regions of aa-tRNA-synthetase genes in N. crassa, C. albicans and S. cerevisiae
6.64 tgggTGACTGAYPL160W 8.15 agaaTGACTCAorf19.2560 8.15 tcTGACTCAat NCU09463.2
3.64 tagtTTCGTCAttYGL245W 5.03 aagtTTAGTCAgorf19.7057 8.15 ctTGACTCAat NCU08894.2
8.15 acTGACTCAtt YDR341C 8.15 aatcTGACTCAaorf19.3341 8.15 ctTGACTCAgt NCU08195.2
2.89 ttAGACTGAaa YOR168W 4.32 gcTCCCTCAga orf19.7064 8.15 ccTGACTCAcc NCU07926.2
5.03 aaTTAGTCAtt YGR185C 4.66 taTAAGTCAtt orf19.2694 4.43 ggTGACTCTtc NCU07755.2
4.35 tcTGCCTCCga YGR264C 8.15 gtTGACTCAta orf19.3955 8.15 tcTGACTCAcc NCU07451.2
6.6 ctTGAGTGAtc YPR033C 4.69 agCGAGTCAac orf19.4051 8.15 ttTGACTCAgt NCU06914.2
5.03 ttTTAGTCAtt YOL097C 6.6 aaTGAGTGAga orf19.5226 8.15 agTGACTCAag NCU06722.2
8.15 agTGACTCAag YHR019C 8.15 atTGACTCAcg orf19.6702 8.15 ggTGACTCAcc NCU06457.2
4.43 ttTGACTCTtc YNL247W 8.15 ttTGACTCAct orf19.4931 8.15 ctTGACTCAtt NCU05642.2
3.55 gtTTACTGAaa YFL022C 3.16 gaTGAATCAtt orf19.2960 8.15 ttTGACTCAca NCU05095.2
8.15 agTGACTCAag YHR020W 8.15 atTGACTCAcg orf19.6701 8.15 acTGACTCAcc NCU04449.2
4.43 aaTGACTCTta YDR037W 5.06 agTTACTCAtc orf19.6749 8.15 acTGACTCAcc NCU04020.2
4.43 gaTGACTCTta YBL076C 6.64 gaTGACTGAgc orf19.2138 8.15 ccTGACTCAcc NCU03575.2
5.06 ttTTACTCAtc YOR335C 8.15 taTGACTCAaa orf19.5746 8.15 aaTGACTCAag NCU02566.2
6.72 ttTGCGTCAgc YIL078W 4.43 taTGACTCTtc orf19.5685 8.15 tgTGACTCAct NCU02380.2
4.99 agTGAGACAat YGR094W 8.15 atTGACTCAtc orf19.1295 8.15 ttTGACTCAtg NCU01965.2
4.69 atCGAGTCAaa YDR023W 4.99 aaTGAGACAaa orf19.269 8.15 tgTGACTCAac NCU01443.2
6.72 aaTGCGTCAta YLL018C 5.03 tgTTAGTCAta orf19.2407 8.15 gtTGACTCAca NCU00915.2
3.16 taTGATTCAtg YBR121C 4.43 gaTGACTCTtt orf19.437 8.15 cgTGACTCAct NCU00405.2
score cis-element S.c.ortho. score cis-element C.a. ortho. score* cis-element NC-tRNA-syn
* score obtained by PATSER program (23); full match to CPC1 cis-element matrix score is 8.15.
ACCEPTED
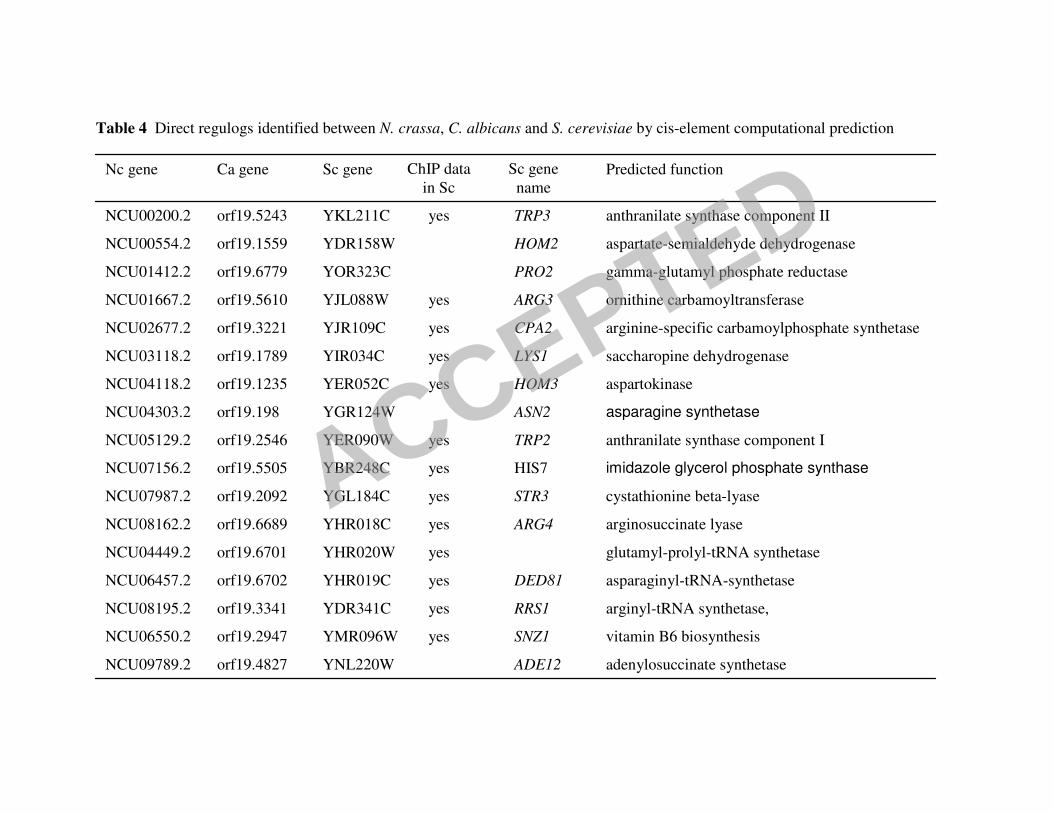
Table 4 Direct regulogs identified between N. crassa, C. albicans and S. cerevisiae by cis-element computational prediction
orf19.4827
orf19.2947
orf19.3341
orf19.6702
orf19.6701
orf19.6689
orf19.2092
orf19.5505
orf19.2546
orf19.198
orf19.1235
orf19.1789
orf19.3221
orf19.5610
orf19.6779
orf19.1559
orf19.5243
Ca gene
adenylosuccinate synthetase ADE12 YNL220W NCU09789.2
vitamin B6 biosynthesis SNZ1 yes YMR096W NCU06550.2
arginyl-tRNA synthetase, RRS1 yes YDR341C NCU08195.2
asparaginyl-tRNA-synthetase DED81 yes YHR019C NCU06457.2
glutamyl-prolyl-tRNA synthetase yes YHR020W NCU04449.2
arginosuccinate lyase ARG4 yes YHR018C NCU08162.2
cystathionine beta-lyase STR3 yes YGL184C NCU07987.2
imidazole glycerol phosphate synthase HIS7 yes YBR248C NCU07156.2
anthranilate synthase component I TRP2 yes YER090W NCU05129.2
asparagine synthetase ASN2 YGR124W NCU04303.2
aspartokinase HOM3 yes YER052C NCU04118.2
saccharopine dehydrogenase LYS1 yes YIR034C NCU03118.2
arginine-specific carbamoylphosphate synthetase CPA2 yes YJR109C NCU02677.2
ornithine carbamoyltransferase ARG3 yes YJL088W NCU01667.2
gamma-glutamyl phosphate reductase PRO2 YOR323C NCU01412.2
aspartate-semialdehyde dehydrogenase HOM2 YDR158W NCU00554.2
anthranilate synthase component II TRP3 yes YKL211C NCU00200.2
Predicted function Sc gene
name
ChIP data
in Sc
Sc gene Nc gene
ACCEPTED

Table 5 Common regulogs identified among N. crassa, C. albicans and S. cerevisiae by transcriptional profiling data
NCU00554.2 orf19.1559 YDR158W HOM2 aspartate-semialdehyde dehydrogenase
histidinol-phosphate aminotransferase HIS5 YIL116W orf19.4177 NCU06360.2
3-dehydro-deoxyphosphoheptonate aldolase ARO4 yes YBR249C orf19.4060 NCU05548.2
sulfite reductase beta subunit ECM17 YJR137C orf19.4099 NCU05238.2
isocitrate lyase ICL1 YER065C orf19.6844 NCU04230.2
aspartokinase HOM3 yes YER052C orf19.1235 NCU04118.2
phosphoribosyl-amidoimidazole-
succinocarboxamidesynthetase
ADE1 YAR015W orf19.7484 NCU03166.2
histidinol dehydrogenase HIS4 yes YCL030C orf19.5639 NCU03139.2
alpha aminoadipate reductase LYS2 yes YBR115C orf19.2970 NCU03010.2
arginine-specific carbamoylphosphate synthetase CPA2 yes YJR109C orf19.3221 NCU02677.2
argininosuccinate synthetase ARG1 yes YOL058W orf19.7469 NCU02639.2
cystathionine gamma-synthase STR2 YJR130C orf19.1033 NCU02430.2
ornithine carbamoyltransferase ARG3 yes YJL088W orf19.5610 NCU01667.2
gamma-glutamyl phosphate reductase PRO2 YOR323C orf19.6779 NCU01412.2
acetylglutamate kinase/acetylglutamyl-phosphate reductase ARG5,6 yes YER069W orf19.4788 NCU00567.2
anthranilate synthase/indole glycerol phosphate synthase TRP3 yes YKL211C orf19.5243 NCU00200.2
Predicted function Sc gene
name
ChIP
in Sc
Sc gene Ca gene Nc gene
ACCEPTED
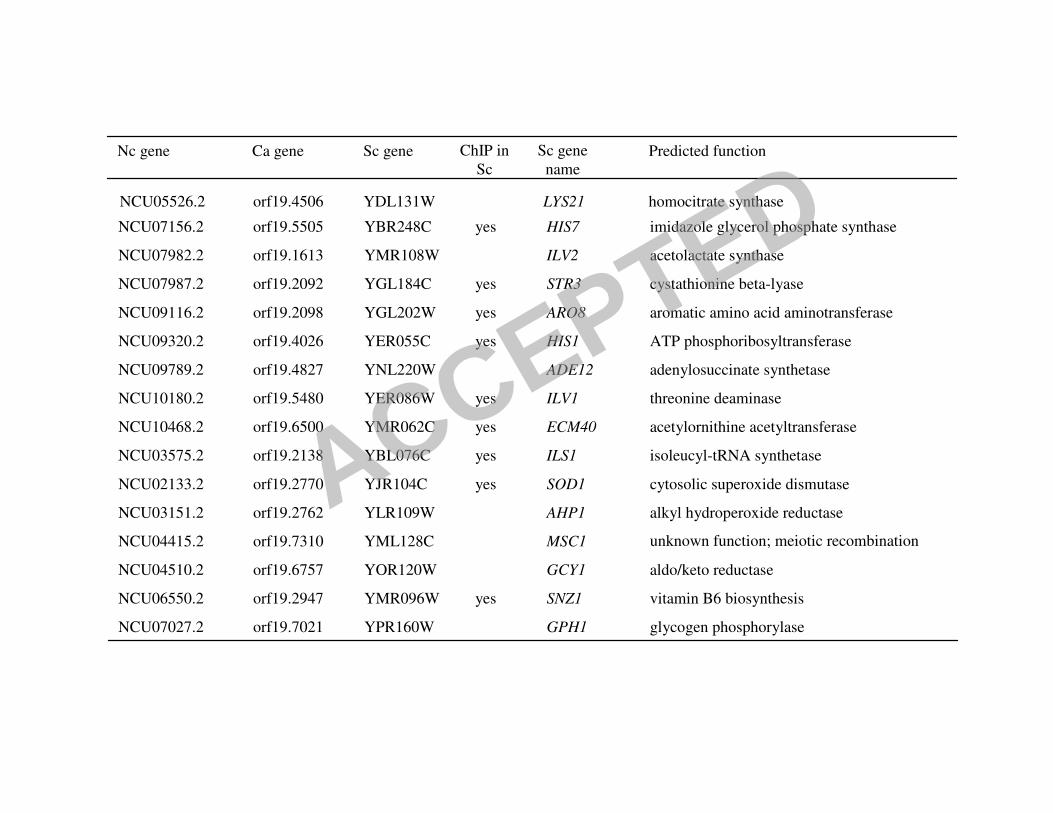
NCU05526.2 orf19.4506 YDL131W LYS21 homocitrate synthase
glycogen phosphorylase GPH1 YPR160W orf19.7021 NCU07027.2
vitamin B6 biosynthesis SNZ1 yes YMR096W orf19.2947 NCU06550.2
aldo/keto reductase GCY1 YOR120W orf19.6757 NCU04510.2
unknown function; meiotic recombination MSC1 YML128C orf19.7310 NCU04415.2
alkyl hydroperoxide reductase AHP1 YLR109W orf19.2762 NCU03151.2
cytosolic superoxide dismutase SOD1 yes YJR104C orf19.2770 NCU02133.2
isoleucyl-tRNA synthetase ILS1 yes YBL076C orf19.2138 NCU03575.2
acetylornithine acetyltransferase ECM40 yes YMR062C orf19.6500 NCU10468.2
threonine deaminase ILV1 yes YER086W orf19.5480 NCU10180.2
adenylosuccinate synthetase ADE12 YNL220W orf19.4827 NCU09789.2
ATP phosphoribosyltransferase HIS1 yes YER055C orf19.4026 NCU09320.2
aromatic amino acid aminotransferase ARO8 yes YGL202W orf19.2098 NCU09116.2
cystathionine beta-lyase STR3 yes YGL184C orf19.2092 NCU07987.2
acetolactate synthase ILV2 YMR108W orf19.1613 NCU07982.2
imidazole glycerol phosphate synthase HIS7 yes YBR248C orf19.5505 NCU07156.2
Predicted function Sc gene
name
ChIP in
Sc
Sc gene Ca gene Nc gene
ACCEPTED
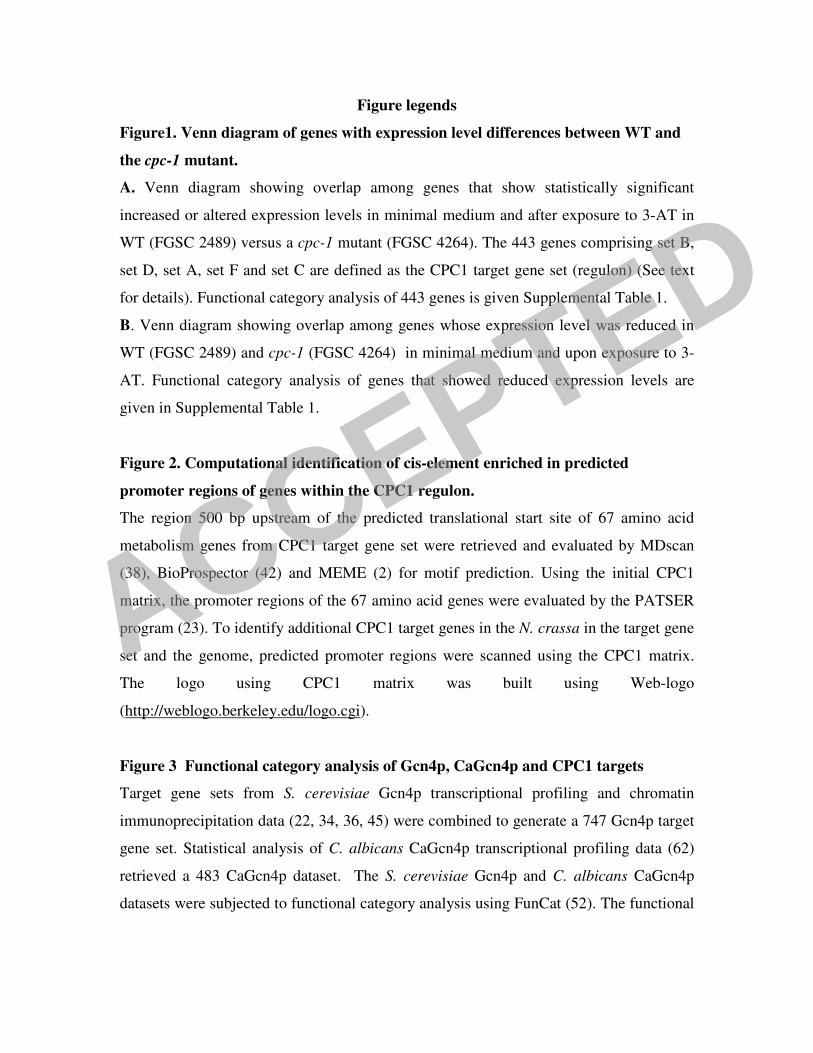
Figure legends
Figure1. Venn diagram of genes with expression level differences between WT and
the cpc-1 mutant.
A. Venn diagram showing overlap among genes that show statistically significant
increased or altered expression levels in minimal medium and after exposure to 3-AT in
WT (FGSC 2489) versus a cpc-1 mutant (FGSC 4264). The 443 genes comprising set B,
set D, set A, set F and set C are defined as the CPC1 target gene set (regulon) (See text
for details). Functional category analysis of 443 genes is given Supplemental Table 1.
B. Venn diagram showing overlap among genes whose expression level was reduced in
WT (FGSC 2489) and cpc-1 (FGSC 4264) in minimal medium and upon exposure to 3-
AT. Functional category analysis of genes that showed reduced expression levels are
given in Supplemental Table 1.
Figure 2. Computational identification of cis-element enriched in predicted
promoter regions of genes within the CPC1 regulon.
The region 500 bp upstream of the predicted translational start site of 67 amino acid
metabolism genes from CPC1 target gene set were retrieved and evaluated by MDscan
(38), BioProspector (42) and MEME (2) for motif prediction. Using the initial CPC1
matrix, the promoter regions of the 67 amino acid genes were evaluated by the PATSER
program (23). To identify additional CPC1 target genes in the N. crassa in the target gene
set and the genome, predicted promoter regions were scanned using the CPC1 matrix.
The logo using CPC1 matrix was built using Web-logo
(http://weblogo.berkeley.edu/logo.cgi).
Figure 3 Functional category analysis of Gcn4p, CaGcn4p and CPC1 targets
Target gene sets from S. cerevisiae Gcn4p transcriptional profiling and chromatin
immunoprecipitation data (22, 34, 36, 45) were combined to generate a 747 Gcn4p target
gene set. Statistical analysis of C. albicans CaGcn4p transcriptional profiling data (62)
retrieved a 483 CaGcn4p dataset. The S. cerevisiae Gcn4p and C. albicans CaGcn4p
datasets were subjected to functional category analysis using FunCat (52). The functional
ACCEPTED
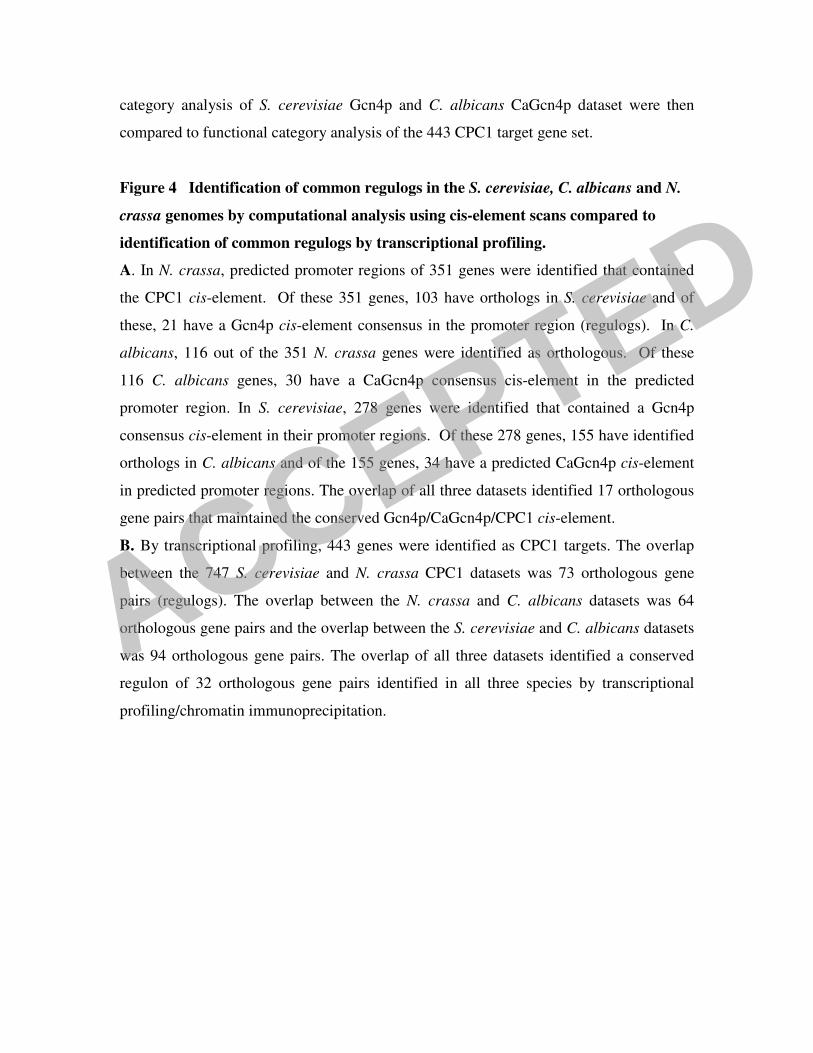
category analysis of S. cerevisiae Gcn4p and C. albicans CaGcn4p dataset were then
compared to functional category analysis of the 443 CPC1 target gene set.
Figure 4 Identification of common regulogs in the S. cerevisiae, C. albicans and N.
crassa genomes by computational analysis using cis-element scans compared to
identification of common regulogs by transcriptional profiling.
A. In N. crassa, predicted promoter regions of 351 genes were identified that contained
the CPC1 cis-element. Of these 351 genes, 103 have orthologs in S. cerevisiae and of
these, 21 have a Gcn4p cis-element consensus in the promoter region (regulogs). In C.
albicans, 116 out of the 351 N. crassa genes were identified as orthologous. Of these
116 C. albicans genes, 30 have a CaGcn4p consensus cis-element in the predicted
promoter region. In S. cerevisiae, 278 genes were identified that contained a Gcn4p
consensus cis-element in their promoter regions. Of these 278 genes, 155 have identified
orthologs in C. albicans and of the 155 genes, 34 have a predicted CaGcn4p cis-element
in predicted promoter regions. The overlap of all three datasets identified 17 orthologous
gene pairs that maintained the conserved Gcn4p/CaGcn4p/CPC1 cis-element.
B. By transcriptional profiling, 443 genes were identified as CPC1 targets. The overlap
between the 747 S. cerevisiae and N. crassa CPC1 datasets was 73 orthologous gene
pairs (regulogs). The overlap between the N. crassa and C. albicans datasets was 64
orthologous gene pairs and the overlap between the S. cerevisiae and C. albicans datasets
was 94 orthologous gene pairs. The overlap of all three datasets identified a conserved
regulon of 32 orthologous gene pairs identified in all three species by transcriptional
profiling/chromatin immunoprecipitation.
ACCEPTED

wt+3-AT/ wt
wt+3-AT/cpc-1+3-AT
87101
557
109
D
F
E
A25
B121
C
cpc-1+3-AT/cpc-1
wt+3-AT/ wt
wt+3-AT/cpc-1+3-AT
11350
338
229
D‘
F‘
E‘
A‘59
B‘60
C‘
cpc-1+3-AT/cpc-1
A
B
Induced
RepressedACCEPTED

ACCEPTED
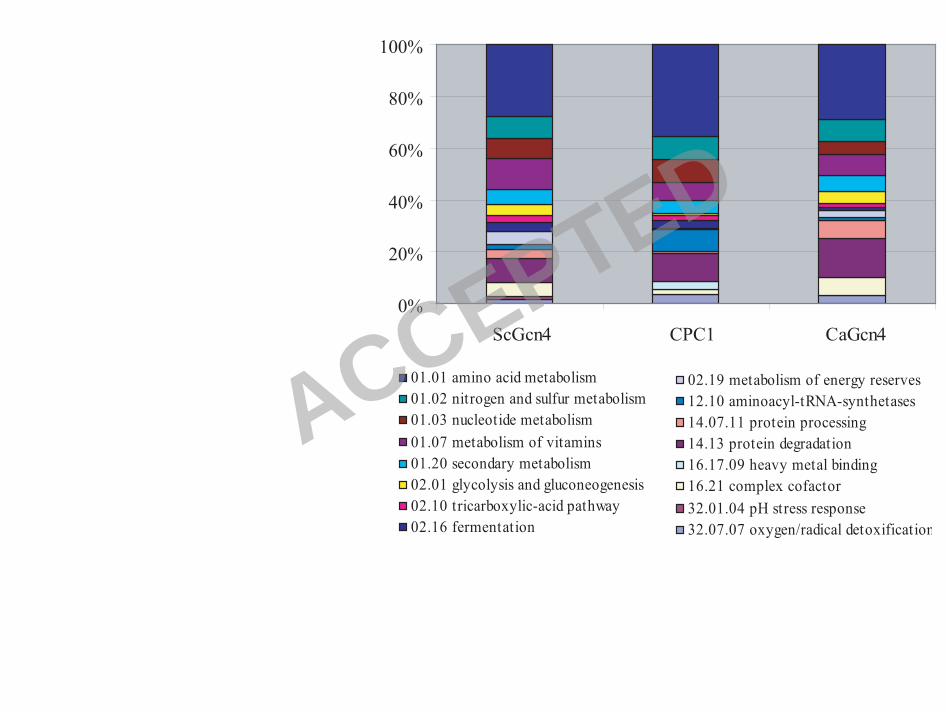
0%
20%
40%
60%
80%
100%
ScGcn4 CPC1 CaGcn4
01.01 amino acid metabolism
01.02 nitrogen and sulfur metabolism
01.03 nucleotide metabolism
01.07 metabolism of vitamins
01.20 secondary metabolism
02.01 glycolysis and gluconeogenesis
02.10 tricarboxylic-acid pathway
02.16 fermentation
02.19 metabolism of energy reserves
12.10 aminoacyl-tRNA-synthetases
14.07.11 protein processing
14.13 protein degradation
16.17.09 heavy metal binding
16.21 complex cofactor
32.01.04 pH stress response
32.07.07 oxygen/radical detoxification
ACCEPTED
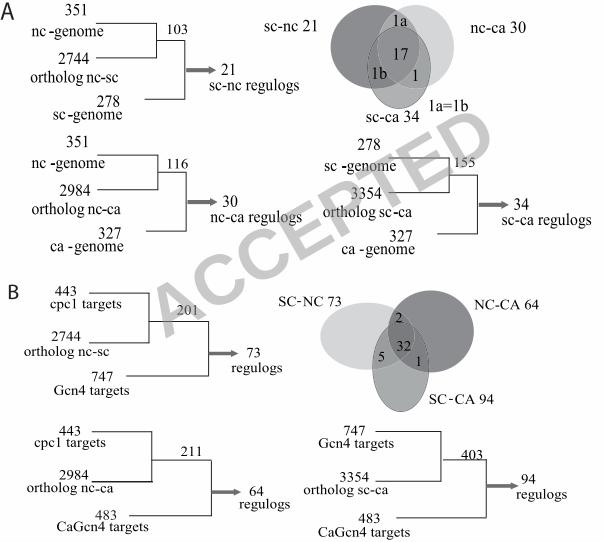
sc-nc 21
sc-ca 34
nc-ca 30
1a=1b
nc -genome
ortholog nc-sc
sc -genome
21sc-nc regulogs
351
-
-
-
-
2744
278-
11b
1a
17
nc -genome
ortholog nc-ca
ca -genome
30nc-ca regulogs
351
-
-
-
2984
327
sc -genome
ortholog sc-ca
ca -genome
34sc-ca regulogs
278
-
-
-
3354
327
A
443 cpc1 targets
2984 ortholog nc-ca
483CaGcn4 targets
64regulogs
443 cpc1 targets
2744ortholog nc-sc
747Gcn4 targets
73regulogs
747 Gcn4 targets
3354 ortholog sc-ca
483
94regulogs
325
SC-NC 73
SC-CA 94
NC-CA 64
1
2201
211 403
CaGcn4 targets
B
103
116 155
ACCEPTED