Genome-Wide Transcriptional Profiles during Temperature and Oxidative Stress Reveal Coordinated Expression Patterns and Overlapping Regulons in Rice Dheeraj Mittal 1 , Dinesh A. Madhyastha 2 , Anil Grover 1 * 1 Department of Plant Molecular Biology, University of Delhi South Campus, New Delhi, India, 2 BIOBASE Databases India Private Limited, Bangalore, India Abstract Genome wide transcriptional changes by cold stress, heat stress and oxidative stress in rice seedlings were analyzed. Heat stress resulted in predominant changes in transcripts of heat shock protein and heat shock transcription factor genes, as well as genes associated with synthesis of scavengers of reactive oxygen species and genes that control the level of sugars, metabolites and auxins. Cold stress treatment caused differential expression of transcripts of various transcription factors including desiccation response element binding proteins and different kinases. Transcripts of genes that are part of calcium signaling, reactive oxygen scavenging and diverse metabolic reactions were differentially expressed during cold stress. Oxidative stress induced by hydrogen peroxide treatment, resulted in significant up-regulation in transcript levels of genes related to redox homeostasis and down-regulation of transporter proteins. ROS homeostasis appeared to play central role in response to temperature extremes. The key transcription factors that may underlie the concerted transcriptional changes of specific components in various signal transduction networks involved are highlighted. Co-ordinated expression pattern and promoter architectures based analysis (promoter models and overrepresented transcription factor binding sites) suggested potential regulons involved in stress responses. A considerable overlap was noted at the level of transcription as well as in regulatory modules of differentially expressed genes. Citation: Mittal D, Madhyastha DA, Grover A (2012) Genome-Wide Transcriptional Profiles during Temperature and Oxidative Stress Reveal Coordinated Expression Patterns and Overlapping Regulons in Rice. PLoS ONE 7(7): e40899. doi:10.1371/journal.pone.0040899 Editor: Luis Herrera-Estrella, Centro de Investigacio ˜ n y de Estudios Avanzados del IPN, Mexico Received January 29, 2012; Accepted June 14, 2012; Published July 16, 2012 Copyright: ß 2012 Mittal et al. This is an open-access article distributed under the terms of the Creative Commons Attribution License, which permits unrestricted use, distribution, and reproduction in any medium, provided the original author and source are credited. Funding: The work is supported by the project grant to AG by Department of Biotechnology, Government of India (http://dbtindia.nic.in/index.asp). Council of Scientific and Industrial Research, Government of India (http://www.csir.res.in/home.asp), provided the fellowship grants to DM. The funders had no role in study design, data collection and analysis, decision to publish, or preparation of the manuscript. Competing Interests: DAM is an employee of BIOBASE Databases India Pvt. Ltd. This does not alter the authors’ adherence to all the PLoS ONE policies on sharing data and materials. * E-mail: [email protected] Introduction Rice is the most important world food crop as more than 3.5 billion people depend on rice for more than 20% of their daily calories (http://irri.org/about-rice/rice-facts/rice-basics). Rice cultivation is carried out in a wide range of ecological environments that have varying altitudes, climates and different soil types. Abiotic stresses (i.e. drought stress, salt stress, flooding stress, oxidative stress and temperature stress) profoundly affect rice cultivation. The severity of most abiotic stresses is on the rise due to intense cultivation practices and environmental deteriora- tion caused by the greenhouse effect. Temperature extremes drastically affect cultivation of rice crop. Rice is a chilling-sensitive plant [1]. Poor germination, delayed seedling emergence stunted growth and leaf discoloration are some of the notable effects of cold stress (CS) on vegetative growth of rice. During the reproductive stages, degeneration of panicle tip, incomplete panicle exertion, delayed flowering, failure of dehis- cence and fertilization, high spikelet sterility and irregular maturity are commonly observed in CS conditions [2]. CS treatment during the flowering stages of rice plant causes abnormal digestion of starch in mature pollen grains, which reduces pollen viability. Rice seed germination is drastically reduced in response to heat stress (HS). HS tends to reduce vigor of rice seedlings and cause abnormal branching patterns of roots [3]. The rate of plant development increases with HS and as a result the duration of developmental phases declines as temperature rises [4]. In rice, number and height of tillers and tillering duration is severely reduced in response to HS [3]. Rice is most susceptible to heat injury during flowering, as pollen viability is particularly sensitive to HS. Even 1–2 h of high temperature at anthesis results in high spikelet sterility [5]. The duration of grain filling in rice is highly sensitive to elevated temperatures. The grain yield of rice is reported to drop by 10% for every 1uC increase in growing season minimum temperature in the dry season [6]. This indicates that decreased rice yields are associated with increased night time temperature which is a result of global warming [6]. While efforts are underway for generation of transgenic rice with enhanced CS tolerance [7–10] as well as HS tolerance [11,12], production of cold and heat tolerant rice that can withstand field-level stress remains elusive. To intensively pursue this goal, there is an urgent need to characterize the physiological processes, biochemical enzymes, molecular mechanisms, and proteins and genes that impart temperature stress tolerance. In general, plants have evolved diverse mechanisms to react to the imposition to stresses. The strategies adopted by plants to combat stress depend on the ecology, timing, severity and the stage of crop growth [13]. Enhancement in reactive oxygen species (ROS) levels PLoS ONE | www.plosone.org 1 July 2012 | Volume 7 | Issue 7 | e40899

Welcome message from author
This document is posted to help you gain knowledge. Please leave a comment to let me know what you think about it! Share it to your friends and learn new things together.
Transcript

Genome-Wide Transcriptional Profiles duringTemperature and Oxidative Stress Reveal CoordinatedExpression Patterns and Overlapping Regulons in RiceDheeraj Mittal1, Dinesh A. Madhyastha2, Anil Grover1*
1 Department of Plant Molecular Biology, University of Delhi South Campus, New Delhi, India, 2 BIOBASE Databases India Private Limited, Bangalore, India
Abstract
Genome wide transcriptional changes by cold stress, heat stress and oxidative stress in rice seedlings were analyzed. Heatstress resulted in predominant changes in transcripts of heat shock protein and heat shock transcription factor genes, aswell as genes associated with synthesis of scavengers of reactive oxygen species and genes that control the level of sugars,metabolites and auxins. Cold stress treatment caused differential expression of transcripts of various transcription factorsincluding desiccation response element binding proteins and different kinases. Transcripts of genes that are part of calciumsignaling, reactive oxygen scavenging and diverse metabolic reactions were differentially expressed during cold stress.Oxidative stress induced by hydrogen peroxide treatment, resulted in significant up-regulation in transcript levels of genesrelated to redox homeostasis and down-regulation of transporter proteins. ROS homeostasis appeared to play central role inresponse to temperature extremes. The key transcription factors that may underlie the concerted transcriptional changes ofspecific components in various signal transduction networks involved are highlighted. Co-ordinated expression pattern andpromoter architectures based analysis (promoter models and overrepresented transcription factor binding sites) suggestedpotential regulons involved in stress responses. A considerable overlap was noted at the level of transcription as well as inregulatory modules of differentially expressed genes.
Citation: Mittal D, Madhyastha DA, Grover A (2012) Genome-Wide Transcriptional Profiles during Temperature and Oxidative Stress Reveal CoordinatedExpression Patterns and Overlapping Regulons in Rice. PLoS ONE 7(7): e40899. doi:10.1371/journal.pone.0040899
Editor: Luis Herrera-Estrella, Centro de Investigacion y de Estudios Avanzados del IPN, Mexico
Received January 29, 2012; Accepted June 14, 2012; Published July 16, 2012
Copyright: � 2012 Mittal et al. This is an open-access article distributed under the terms of the Creative Commons Attribution License, which permitsunrestricted use, distribution, and reproduction in any medium, provided the original author and source are credited.
Funding: The work is supported by the project grant to AG by Department of Biotechnology, Government of India (http://dbtindia.nic.in/index.asp). Council ofScientific and Industrial Research, Government of India (http://www.csir.res.in/home.asp), provided the fellowship grants to DM. The funders had no role in studydesign, data collection and analysis, decision to publish, or preparation of the manuscript.
Competing Interests: DAM is an employee of BIOBASE Databases India Pvt. Ltd. This does not alter the authors’ adherence to all the PLoS ONE policies onsharing data and materials.
* E-mail: [email protected]
Introduction
Rice is the most important world food crop as more than 3.5
billion people depend on rice for more than 20% of their daily
calories (http://irri.org/about-rice/rice-facts/rice-basics). Rice
cultivation is carried out in a wide range of ecological
environments that have varying altitudes, climates and different
soil types. Abiotic stresses (i.e. drought stress, salt stress, flooding
stress, oxidative stress and temperature stress) profoundly affect
rice cultivation. The severity of most abiotic stresses is on the rise
due to intense cultivation practices and environmental deteriora-
tion caused by the greenhouse effect.
Temperature extremes drastically affect cultivation of rice crop.
Rice is a chilling-sensitive plant [1]. Poor germination, delayed
seedling emergence stunted growth and leaf discoloration are some
of the notable effects of cold stress (CS) on vegetative growth of
rice. During the reproductive stages, degeneration of panicle tip,
incomplete panicle exertion, delayed flowering, failure of dehis-
cence and fertilization, high spikelet sterility and irregular maturity
are commonly observed in CS conditions [2]. CS treatment during
the flowering stages of rice plant causes abnormal digestion of
starch in mature pollen grains, which reduces pollen viability. Rice
seed germination is drastically reduced in response to heat stress
(HS). HS tends to reduce vigor of rice seedlings and cause
abnormal branching patterns of roots [3]. The rate of plant
development increases with HS and as a result the duration of
developmental phases declines as temperature rises [4]. In rice,
number and height of tillers and tillering duration is severely
reduced in response to HS [3]. Rice is most susceptible to heat
injury during flowering, as pollen viability is particularly sensitive
to HS. Even 1–2 h of high temperature at anthesis results in high
spikelet sterility [5]. The duration of grain filling in rice is highly
sensitive to elevated temperatures. The grain yield of rice is
reported to drop by 10% for every 1uC increase in growing season
minimum temperature in the dry season [6]. This indicates that
decreased rice yields are associated with increased night time
temperature which is a result of global warming [6].
While efforts are underway for generation of transgenic rice
with enhanced CS tolerance [7–10] as well as HS tolerance
[11,12], production of cold and heat tolerant rice that can
withstand field-level stress remains elusive. To intensively pursue
this goal, there is an urgent need to characterize the physiological
processes, biochemical enzymes, molecular mechanisms, and
proteins and genes that impart temperature stress tolerance. In
general, plants have evolved diverse mechanisms to react to the
imposition to stresses. The strategies adopted by plants to combat
stress depend on the ecology, timing, severity and the stage of crop
growth [13]. Enhancement in reactive oxygen species (ROS) levels
PLoS ONE | www.plosone.org 1 July 2012 | Volume 7 | Issue 7 | e40899

is noted under different stress conditions (UV exposure, wounding,
pathogen attack, flooding, drought, salt, heat stress and cold stress)
as well as by combination of these stresses with high light
irradiance [14–17]. The levels and kinds of ROS accumulated
during stress conditions and their subcellular source determines
the expression pattern of specific genes and the induction of stress
responsive pathways [16,18]. Extensive interactions have been
noted between HS and oxidative stress (OS) molecular pathways
[19–23]. During HS, plants activate mechanisms and pathways to
control the ROS and redox homeostasis [24]. In Arabidopsis, ROS
homeostasis has been shown to strongly influence regulation of
cold responsive genes. Cold stress binding factors (CBFs) have
been shown to be involved in ROS detoxification [25]. Cheng et al.
[26] has shown a ROS-mediated regulatory module that function
as an early component of the chilling stress response pathway in
rice plant. Thus, ROS may be referred as a point of convergence
between various stress responsive gene networks [27]. Further, an
overlapping induction or repression patterns of gene expression is
noted in response to different stress conditions, indicating that a
common set of signal transduction components may be involved.
The transcriptional regulatory networks are important in response
to abiotic stress in Arabidopsis and grasses [28,29]. Transcription
factors (TFs) are the master regulators owing to the capacity of
single TF controlling expression of many target down-stream
genes. Nakashima et al. [30] have suggested the role of DREB1/
CBF; AREB/ABF and NAC regulons in rice, regulating
dehydration, salinity, and temperature stress responsive gene
expression. Mittal et al. [31] have proposed rice HSFs as an
important node of cross-talk. The convergence of stress signaling
networks to a common set of TFs and regulons suggest the
existence of upstream regulatory genes that control plant responses
to multiple stresses [32]. Co-ordinated regulation of functionally
related genes involved in similar molecular, genetic, biochemical
or physiological processes are provided by TFs. The binding of the
TFs and cis-element combinations provide a structural basis for
the generation of unique patterns of gene expression.
Global transcription profiling using microarray is a powerful
approach to understand the molecular aspects under different
stress conditions. In rice, gene expression profiles during abiotic
stresses have been analyzed in response to different agents [26,33–
39]. However, the data from most of these studies can not simply
be compared because of the differences in the conditions under
which the respective experiments have been performed e.g. age of
the plants, light regime, growth conditions, stress treatments,
microarray platform and the analysis criteria used. This study
presents transcription profile of rice seedlings in response to CS,
HS and OS treatments in a single genotype, thus providing a
platform for comparison of the various genes and regulons up-
regulated following the three stress conditions. Two different time
points were used in our experiments to score ‘primary’ (at early
time points) and ‘secondary’ (at late time points) changes in the
gene expression. Composite module analyst (CMA) analysis was
employed to unravel the key transcription factors that may explain
concerted expression changes of specific components in various
signal transduction networks.
It is important to note that the levels of different stresses (i.e.
CS, HS and OS) employed in this study are largely sub lethal.
Exposure to sub lethal stress has been shown to bring about the
required changes in the plant metabolism necessary for
withstanding the subsequent severe stress levels (i.e. cross-
proection phenomenon) [40–43]. Based on this hypothesis, we
propose that the gene expression changes noted in this study
might be important in providing the adaptive advantage to
survive under lethal stress. This study highlights the common as
well as specific aspects of the transcriptional changes following
CS, HS and OS. Our data suggests that a variety of TFs
besides the well-known regulons govern the CS, HS and OS
responses. This study reveals that the ROS mediated common
regulatory modules are involved in the response of rice seedlings
to temperature extremes.
Materials and Methods
Growth of Rice Seedlings, Stress TreatmentsRice [Oryza sativa ssp. indica L; cultivar Pusa Basmati (PB1)]
seeds were germinated as described before [31]. Germinating
seeds were supplemented with rice growth medium [44]. After 7d,
seedlings were transferred to 100 ml glass beakers and allowed to
grow further, to ensure that seedlings recover from injury to the
roots taken place due to uprooting from the cotton bed. On d9,
beakers containing seedlings were transferred to growth chamber
(light intensity ,80 mmol m22 s21; humidity 40–50%; tempera-
ture 2862uC; light regime 14 h light/10 h dark cycle). The stress
conditions were standardized, with an emphasis on the uniformity
of the growth and stress regimes to minimize the occurrence of
secondary stresses during the treatment. The plants employed for
stress treatments were grown in uniform conditions to minimize
the physiological differences between individual plants, as far as
possible. Similar growth conditions (light intensity, humidity,
supplementation of the media, size of the beakers etc.) were
maintained for each stress treatment. For temperature stress,
uniform-sized seedlings (10 d old) were transferred to beakers,
which contained distilled water at 4261uC for heat stress (HS), at
561uC for cold stress (CS), and 10 mM H2O2 at 2862uC for
oxidative stress, and maintained at the requisite temperatures in
BOD (for different time intervals as shown). For oxidative stress
10 mM H2O2 was used (H2O2, a stable ROS, has long half-life;
[45]). Subsequent to completion of the stress intervals, tissues were
harvested (whole seedlings were pooled to have ,100 mg tissue
and taken as one biological replicate), frozen in liquid nitrogen and
kept at 280uC. Non-stressed plants for control were handled
exactly in similar manner. All rice seedlings harvested post stress
treatment was grown at the same time. RNA samples from three
independent biological replicates for stressed and control tissues
were then processed for microarray hybridization.
Microarray Analysis and Q-PCR60 mer rice 44 k oligo DNA array Kit (AMADID: No: 015241,
Agilent Technologies) which contains 45018 features/microarray
and ,40000 transcripts was used. Total RNA was isolated from
,100 mg tissue using Tri-reagent (Sigma, USA) as per the
manufacturer’s instructions, and further purified using RNA easy
mini elute kit (Qiagen, USA). The yield and RNA purity were
determined spectrophotometrically. Integrity of the RNA was
checked using Agilent Bioanalyzer (Agilent Technologies, USA).
200 ng total RNA was labeled with Cy3 using an Agilent low
RNA input fluorescent linear amplification kit (Agilent Technol-
ogies, USA). Hybridization and wash processes were performed
according to the manufacturer’s instructions and hybridized
microarrays were scanned using Agilent microarray scanner
(G2505B, Agilent Technologies, USA). Feature extraction soft-
ware (version 9.5.1 Agilent Technologies, USA) was employed for
the image analysis and data extraction process. The normalization
was done using GeneSpring GX version 7.3.1 (Agilent Technol-
ogies, USA) using the recommended per chip and per gene data
transformation: set measurements less than 0.01 to 0.01, per chip:
normalize to 50th percentile per gene: normalize to specific
samples (treated vs control). Data analysis was done using
Rice Transcript Profiles in Abiotic Stresses
PLoS ONE | www.plosone.org 2 July 2012 | Volume 7 | Issue 7 | e40899

GeneSpring GX version 7.3.1 (Agilent Technologies, USA) and
Microsoft Excel. Three biological replicates were used in the
microarray analysis. There was a good correlation among the
three biological replicates of a condition as evident by the fact that
more than 80% of the probes in the microarray showed variance
,0.25% among the biological replicates when calculated for the
complete data and showed good overall correlation coefficient
values. PCA plots among the biological replicates are provided in
the Fig. S1. The data discussed in this publication have been
deposited in NCBI’s Gene Expression Omnibus (Mittal et al. 2010)
and are accessible through GEO series accession number
GSE19983 (http://www.ncbi.nlm.nih.gov/geo/query/acc.
cgi?acc = GSE19983). We applied the criteria of at least 2.0 fold
change (Log2 values) in gene expression levels and p-value
revealed by t-test of less than 0.05. Multiple testing correction
(Benjamini and Hochberg False Discovery Rate multiple testing
correction) was applied on the t-test p-values and these corrected
p-values were used to identify the significantly changed genes. The
RAP-DB IDs given in the results corresponds to the IRGSP
genome build 4 (http://rapdb.dna.affrc.go.jp). Q-PCR was
carried out as described earlier [31]. Two biological replicates
and three technical replicates were used for the Q-PCR analysis.
cDNA for the real-time reactions were synthesized using the same
RNA samples that were used for microarrays.
CMA and F-Match AnalysisConstruction of composite promoter models (CPM) as combi-
nations of closely localized TF-binding sites in promoters were
identified with CMA software using the ExPlainTM Plant 3.0
(BIOBASE GmbH) in the promoters of differentially expressed
genes during the three stress conditions. Promoter analyses were
carried for up-regulated or down-regulated genes (Yes set) with
random set of 500/1000 genes (No sets were extracted from rice
promoters dataset present in ExPlainTM Plant software) based on
the number of Yes set genes. Computational identification of TF
binding sites in the promoter sequences under study was done with
MatchTM program which applies the full TRANSFAC library of
Positional Weight Matrices (PWM) from TRANSFACH database
with added PWM of heat shock proteins of vertebrates as heat
shock proteins are highly conserved across species. F-Match and
Match analysis were carried for up- or down- regulated genes with
a promoter window of 2500 to +100 bp around TSS (Transcrip-
tion Start Site). In F-Match analysis, p-value ,0.01 was chosen
and further in the results, the PWM with ratio .1.3 Yes/No
frequencies and Matched promoter p–value ,0.05 was selected.
CMA analysis were carried with results of Match analysis with
parameters; Genetic algorithm iterations run for 12 h, NC limit
‘‘None’’, Population size of 200, 3 to 5 TF pairs, in 1 module in 1
group, in 200 bp window size, with optimized distance between
the pairs options selected. More details and case studies on the
latter aspect can be seen elsewhere [46–50].
Functional and Clustering AnalysisExPlainTM Plant 3.0 software program (BIOBASE GmbH) was
employed to explore statistically over-represented groups in the
up- or down-regulated genes. Plant expression conditions, Plant
ontologies and gene ontology (GO) classification were carried with
p-value ,0.05. Cluster analysis were carried for up- or down-
regulated genes with rice protein interaction dataset from the
‘Reactome database’ (http://www.reactome.org), taken as sec-
ondary set with parameters cluster separation degree as ‘‘0’’ and
Distance threshold as ‘‘3’’ value.
Results
Gene Expression Profiling in Response to CS, HS and OSin Global Context
Transcript profiles as affected by CS, HS and OS were analyzed
by microarray analysis (Fig. 1A). The comparison of the number of
genes differentially regulated following the two time points of each
stress condition (early and late) as well as gene common to the two
time points are shown in the Venn diagram (Fig. 1A). It is evident
that HS and OS response is more pronounced in terms of
transcription induction in the early time points, than that of CS
response. When the two CS treatments (based on the time points)
were taken as a condition CS, 684 genes were up-regulated and
240 genes were down-regulated with respect to control. Similarly,
in case of HS, 1007 genes were up-regulated and 264 genes were
down-regulated and in OS, 380 were up-regulated and 291 were
down-regulated with respect to control (Fig.1 B). Fig. 1C shows
hierarchical cluster of differentially expressed genes (DEGs) shown
in Fig. 1B. The detailed gene lists are presented in Data S1.
ExPlainTM Plant 3.0 software program (BIOBASE GmbH) was
employed to explore statistically over-represented groups in data
sets according to Plant expression conditions, Plant ontologies and
gene ontology (GO) classification. Figures 2 and 3 show the
significant categories enriched for the DEGs, namely ‘Biological
process’, ‘Cellular-localization’, ‘Molecular-function’ and ‘Plant-
Expression-Condition’ according to BKL plant database (Fig. 2:
up-regulated genes; Fig. 3: down-regulated genes). In addition,
DEGs were also classified to other extended classes based on BKL
plant database. Various developmental stages were represented
when DEGs during CS were classified on the basis of plant
ontology (PO) growth stage and plant structure. The enrichment
of ‘inflorescence development, reproductive growth and flowering
stages, tapetum, pollen development and microspore specific
classes’ for the CS up-regulated genes was noteworthy. Grouping
of DEGs during HS for GO terms, plant growth stages and
structure revealed ‘D pollen mother cell meiosis stage and
microspore’ as the top most GO class for up-regulated genes.
GO categories associated with reproduction like ‘F mature embryo
stage, seed maturation stage, and stamen primordium visible’ were
noted. Two trait ontology terms i.e. ‘drought tolerance and
drought recovery’ were enriched for HS up-regulated genes. Trait
ontology based classification revealed ‘mineral and ion content
related trait as well as growth and development trait’ as enriched
terms for HS down-regulated genes. Enrichment of inflorescence
and its developmental stages, as well as spikelet in the GO term
plant ontology growth stage and structure was noted. Classification
based on the trait ontology revealed ‘grain yield and mineral ion
content related trait’ for the OS down-regulated genes. Detailed
functional classification for biological processes, cellular localiza-
tion, molecular function, plant expression conditions, PO growth
stages, PO plant structure and trait ontology are presented in Data
S2 for the DEGs during CS, HS and OS.
Rice protein interaction dataset from the ‘Reactome database’
(http://www.reactome.org) was taken as secondary set to carry out
cluster analysis. This analysis identifies common signaling
molecules in the vicinity of genes from the input list within the
signaling networks. The significant clusters enriched are shown in
Fig. 4. Clustering of DEGs from CS treatment yielded networks
with DNA transcription (cluster i), RNA metabolism (cluster ii),
kinase function (cluster iii), and Ca2+-mediated signaling molecules
(cluster iv). Similar clustering of DEGs from HS treatment yielded
networks with DNA transcription (cluster i), RNA metabolism
(cluster ii), chalcone synthase metabolism (cluster iii), and heat
shock proteins (HSPs) (cluster iv). In case of OS treatment,
Rice Transcript Profiles in Abiotic Stresses
PLoS ONE | www.plosone.org 3 July 2012 | Volume 7 | Issue 7 | e40899

networks with chalcone synthase metabolism (cluster i) and two
more clusters were noted. The physiological, molecular and
biochemical processes involving these clusters may be termed as
key mechanisms during the respective stress responses. The details
of genes shown to be the part of network/clusters are given in
Table S1.
Detailed analysis was undertaken by splitting genes into gene
lists having genes with specific expression profile under the given
stress, or the genes, which are common to two or three stresses. In
order to identify early or late responsive genes, the salient findings
are analyzed with reference to time points (i.e. early or late) for
each stress type (Fig. 5). Detailed gene lists (with fold changes, GO,
gene descriptions, Gramene pathways and other relevant infor-
mation) are provided in the Data S1. Significant classes of genes
i.e. kinases, transcription factors, signal transduction components,
genes involved in ubiquitin protein ligase reaction, auxin
responsive genes and metabolism related genes noted in the group
of DEGs are highlighted in Table 1. Selective gene expression
changes are highlighted in the following sections.
Figure 1. Global gene expression pattern in response to CS, HS and OS. A. Representation of the number of differentially regulated genesfollowing CS (CS1 h and CS5 h), HS (HS10 min and HS30 min) and OS (OS1 h and OS4 h). Numbers given in brackets represent the total number ofdifferentially expressed genes in CS1 h, CS5 h, HS10 min, HS30 min, OS1 h and OS4 h respectively. B. Differentially expressed genes for a stresscondition (i.e. the data from the two time points for one stress is considered as a condition). C. Hierarchical cluster image showing differentiallyexpressed genes for stress conditions depicted in 1B. Detailed gene lists are provided in Data S1.doi:10.1371/journal.pone.0040899.g001
Rice Transcript Profiles in Abiotic Stresses
PLoS ONE | www.plosone.org 4 July 2012 | Volume 7 | Issue 7 | e40899

Transcript Expression Profiling Specific to CSDuring cold, 326 genes were exclusively (i.e. noted only in CS
and not in HS and OS) up-regulated by more than two folds.
Genes involved in redox homeostasis like dehydrogenase and
copper chaperone for SOD were found up-regulated. A significant
number of genes that may be part of Ca2+ signaling were up-
regulated. A variety of transporters were also noted. On the other
hand, 47 genes were specifically down-regulated during CS. In
addition to the TFs and kinases (Table 1), transcripts of expansin
protein (causes loosening and extension of plant cell walls;
Os05g0277000) and dynamin protein (involved in cell membrane
severity; Os08g0425100) were found repressed. Further, peroxi-
dase 1 precursor gene (Os07g0639000) and genes that may be
involved in detoxification and redox homeostasis like oxidases,
endohydrolase and sulfo transferse were noted. The numbers of
DEGs described in the above section were derived using the
number of DEGs during CS as a condition (Fig. 1B).
Specific aspects related to gene expression changes induced by
CS are further taken herein as CS1 h and C55 h. The respective
lists represent the genes that are specific to CS i.e. not found
Figure 2. Functional classification of up-regulated genes. Significant GO/functional categories enriched for the up-regulated genes during CS,HS and OS are shown in the form of a pie chart. For details refer to the Data S2.doi:10.1371/journal.pone.0040899.g002
Rice Transcript Profiles in Abiotic Stresses
PLoS ONE | www.plosone.org 5 July 2012 | Volume 7 | Issue 7 | e40899
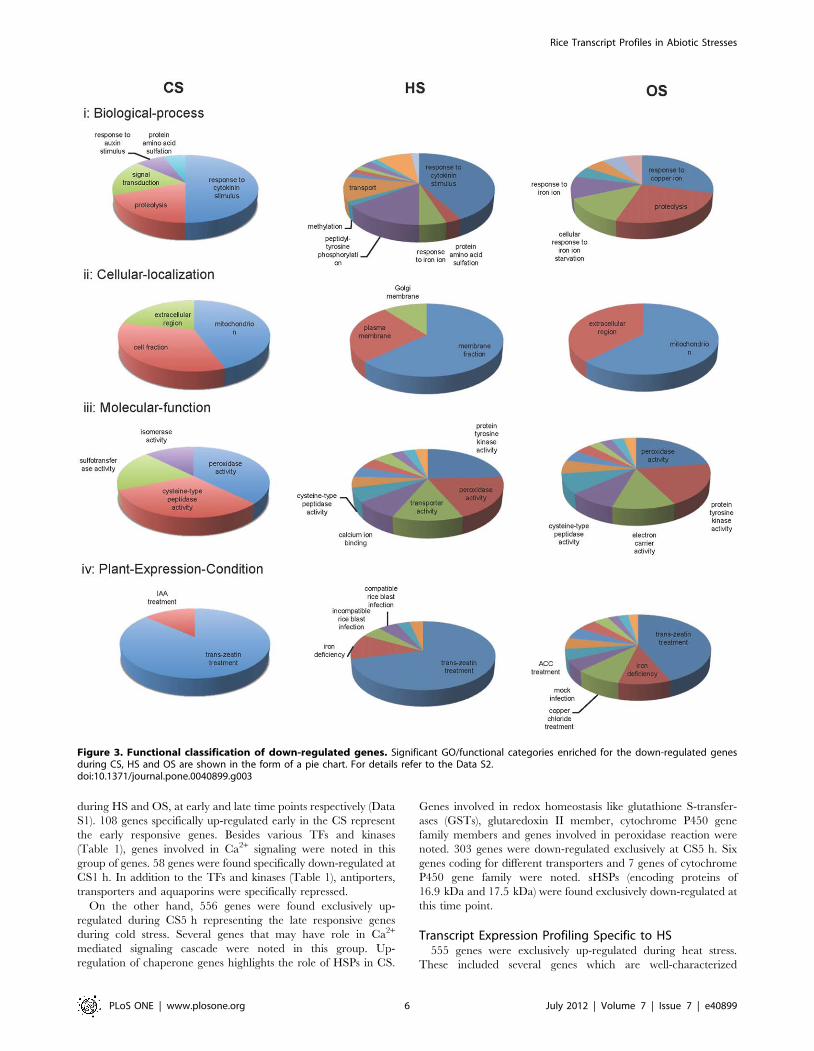
during HS and OS, at early and late time points respectively (Data
S1). 108 genes specifically up-regulated early in the CS represent
the early responsive genes. Besides various TFs and kinases
(Table 1), genes involved in Ca2+ signaling were noted in this
group of genes. 58 genes were found specifically down-regulated at
CS1 h. In addition to the TFs and kinases (Table 1), antiporters,
transporters and aquaporins were specifically repressed.
On the other hand, 556 genes were found exclusively up-
regulated during CS5 h representing the late responsive genes
during cold stress. Several genes that may have role in Ca2+
mediated signaling cascade were noted in this group. Up-
regulation of chaperone genes highlights the role of HSPs in CS.
Genes involved in redox homeostasis like glutathione S-transfer-
ases (GSTs), glutaredoxin II member, cytochrome P450 gene
family members and genes involved in peroxidase reaction were
noted. 303 genes were down-regulated exclusively at CS5 h. Six
genes coding for different transporters and 7 genes of cytochrome
P450 gene family were noted. sHSPs (encoding proteins of
16.9 kDa and 17.5 kDa) were found exclusively down-regulated at
this time point.
Transcript Expression Profiling Specific to HS555 genes were exclusively up-regulated during heat stress.
These included several genes which are well-characterized
Figure 3. Functional classification of down-regulated genes. Significant GO/functional categories enriched for the down-regulated genesduring CS, HS and OS are shown in the form of a pie chart. For details refer to the Data S2.doi:10.1371/journal.pone.0040899.g003
Rice Transcript Profiles in Abiotic Stresses
PLoS ONE | www.plosone.org 6 July 2012 | Volume 7 | Issue 7 | e40899

Figure 4. Network analysis. Clusters enriched for DEGs during CS, HS and OS. Hit molecules – red color, Inter connecting molecules - grey color.Red and Green Box – level of expressions during stress treatments respectively. Details of the genes shown in the clusters are provided in Table S1.doi:10.1371/journal.pone.0040899.g004
Rice Transcript Profiles in Abiotic Stresses
PLoS ONE | www.plosone.org 7 July 2012 | Volume 7 | Issue 7 | e40899

Figure 5. Specific gene expression pattern in response to CS, HS and OS. Representation of the number of DEGs based on the time pointsof stress treatments is depicted classifying the number of genes in early or late responsive genes. Early refers to time points: CS1 h, HS10 min andOS1 h of CS, HS and OS stress condition. Late refers to time points: CS5 h, HS30 min and OS4 h of CS, HS and OS stress condition. Detailed gene listsare provided in Data S1.doi:10.1371/journal.pone.0040899.g005
Table 1. Significant classes (shown underlined) of genes i.e. kinases, transcription factors, signal transduction components, genesinvolved in ubiquitin protein ligase reaction, auxin responsive genes and metabolism related genes noted in the group ofdifferentially regulated genes.
CS specific HS specific OS specific
Protein kinases- (19) [5]; TFs & STCs- WRKY(4), F-box (3), NAC (4), Myb (5) [3], Zn-finger(7) [2], HSFs (2), DREB (2), ERF (3);Ubiquitin protein ligase rxn- (7) [3];Metabolism related- (sucrose, stachyose,terpene, trehalose-6 phosphatase)synthase; Auxin responsive- OsSAURs (2)
Protein kinases- (5); TFs & STCs- HSFs (6), DREB (4), Zn-finger(5), bZIP (3), WRKY (2), MADS box (2), NAC (2) AP2 domaincontaining (2), MYB (1) [1], PP2C (3), Auxin response factor23 (1) EREBP [1], TSRF [1]; Ubiquitin protein ligase rxn- (9);Metabolism related- (galactinol, terpene, stachyose, chalcone,inositol-3-phosphate, strictosidine, digalactosyldiacyl glycerol)synthase; Auxin responsive- (0)
Protein kinases- (5) [1]; TFs and STCs- HSFs (2), F-box(2), Zn-finger (3), HLH DNA binding domaincontaining (1), EREBP (1), Ethylene responsive TF (1),MYB2 [1]; Metabolism related- trehalose-phosphaterxn (1); Auxin-responsive OsSAUR31
Early CS Early HS Early OS
Protein kinases- (3) [3]; TFs & STCs- F-box(2), NAC (2), MADS- box (1) DREB (1),sbCBF6 (1), Myb [2], HLH DNAbinding protein [1]; Ubiquitin protein ligaserxn- (7) [3]; Metabolism related- (terpene,sucrosephosphate, pseudourylate) synthase;Auxin responsive OsSAUR26, auxinresponse factor 23, OsSAUR28
Protein kinases- (17) [13]; TFs & STCs- HSFs (6), Zn fingerprotein (7), WRKY (12), F-box (4) [6], NAC (1) [2], Myb (2) [1],Zn-finger (7) [5], HSFs (6), DREB (1), G-box binding (1),MADS-box (13), PP2C (2) Ethylene receptor-1 (1), ERF1 (1) [1],Baby Boom2 (1), Argonaute (1) HLH domain containing [2],bZIP [1], EREBP [1], Ethylene receptor protein [1],Leucine Zipper [1], LRR [1]; Ubiquitin proteinligase rxn- (16) [5]; Metabolism related- (chalcone,stachyose) [spermidine, falavonol, terpene, strictosidine,sucrose] synthase; Auxin responsive-OsSAURs (3), auxin repressed protein gene (1),auxin metabolism related genes (2)
Protein kinases- (20) [12]; TFs & STCs- WRKY (11), F-box (2), NAC (2), Myb (4) [1], HSFs (4), HLH DNAbinding domain containing (2) [1], AP2 domaincontaining (5), DREB (1), ZIM (4), bZIP (2), DREbinding factors (2), NAM-like (1), leucine zipper (1;ATHB-6), EREBP (1), Zn-finger [3]; Ubiquitin proteinligase rxn- (11 includes Zn-finger C3HC4 (2), H2finger (2), Zn-finger (1)) [3]; Metabolism related-(trehalose 6-phosphate synthesis (3), (galactinol,phytoene, CTP, stachyose, cellulose, chalcone,flavonol, terpene, strictosidine, glutamate, granulebound starch) [chalcone, flavonol, glutamate,granule bound starch] synthase; Auxin responsive-(0)
Late CS Late HS Late OS
Protein kinases- (32) [10]; TFs & STCs-WRKY (8) [1], F-box (8) [2], NAC (6) [1],AP2 domain containing (2), HSFs (4) [1],DREB (2), bZIP (1), Myb (1) [1], ZIM (1),PP2C (5), PHD-finger (3), OCS-element bindingfactor (1), CONSTANS protein (1), Ethyleneresponsive TF (1), EREBP-4 likeprotein (1), Zn finger [2], MADS-box [1];Ubiquitin protein ligase rxn- (11) [5];Metabolic reactions- (stachyose, phytoene,cellulose, CTP, sucrose, terpene)synthase; Auxin responsive- OsIAA9, auxinresponse factor 16, auxin-inducibleprotein gene
Protein kinases- (5) [14]; TFs & STCs- WRKY (2), F-box (2) [1],NAC (3) [1], Myb (4) [3], Zn-finger (7) [2], HSFs (1),MADS-box (1), DREB (1), AGO protein (1), PP2C [1]; Ubiquitinprotein ligase rxn- (7) [3]; Metabolism related- (genesinvolved in trehalose 6 synthase rxn (2), myo-inositol-1-phosphate synthase rxn (1) terpene synthase (2)chalcone synthase 8; Auxin responsive- OsSAURs (1)
Protein kinases- (5) [1]; TFs & STCs- AP2 domaincontaining (1), WRKY [2], Myb [1]; Ubiquitin proteinligase rxn- (2); Metabolism related- (trehalose 6-phosphate synthesis (3), (galactinol, phytoene, CTP,stachyose, cellulose, chalcone, flavonol, terpene,strictosidine, glutamate, granule bound starch),[chalcone, flavonol, glutamate, granule bound starch]synthase; Auxin responsive- (0)
Numbers in () are for up-regulated genes, and in [] are for down-regulated genes. The italicized text is used for down-regulated genes. For details refer to Data S1. rxn;reaction.doi:10.1371/journal.pone.0040899.t001
Rice Transcript Profiles in Abiotic Stresses
PLoS ONE | www.plosone.org 8 July 2012 | Volume 7 | Issue 7 | e40899

components in HS responsive regulon. Genes involved in Ca2+
signaling like calnexin, calreticulin and EF hand family protein
were up-regulated. Up-regulation of different synthase genes and
various transporter genes was noted. 82 genes were exclusively
down-regulated during HS. Among these genes dehydrogenases,
genes involved in peroxidase reaction, various transporter genes
and an antiporter protein gene are noteworthy. The numbers of
DEGs described in the above section were derived using the
number of DEGs during HS as a condition (Fig. 1B).
Specific aspects relating to gene expression changes induced by
HS are further taken here as early and late changes during HS
(Data S1). At HS10 min, 557 genes were specifically up-regulated.
These included genes that are well-characterized components in
HS responsive regulon. Genes involved in Ca2+ signaling and
redox homeostasis were noted in this subgroup. Several genes
coding for different transporters, and hydrolases were found up-
regulated. 288 genes were specifically down-regulated at
HS10 min. Among these, down-regulation of a CBL-1 gene, 3
genes coding for phosphatases and 4 genes coding for different
transporters was noteworthy. Five genes involved in peroxidase
reaction and 6 cytochrome P450 gene family member genes were
also down-regulated.
At HS30 min, 222 genes were exclusively up-regulated. In this
gene list, one gene each of sHSP (HSP17.4), HSP30, HSP70,
HSP90 and a DnaJ domain containing protein were noted.
Transcripts of genes involved in Ca2+ signaling were up-regulated.
Up-regulation of cytochrome P450 gene family members and
genes involved in GSH trans-reaction highlights the role of redox
homeostasis at HS30 min. A total of 295 genes were exclusively
down-regulated during HS30. These included as many as fourteen
genes coding for various transporters and 3 genes for antiporters.
Three genes involved in Ca2+ signaling were also down-regulated.
Transcript Expression Profiling Specific to OSOf the 70 genes found exclusively up-regulated during OS, 9
genes codes for GSTs and one gene for glutathione reductase.
Several genes associated with the state of redox homeostasis were
up-regulated. 59 genes were down-regulated exclusively during
OS. Among these, transporter genes were significantly enriched.
The numbers of DEGs described in the above section were
derived using the number of DEGs during OS as a condition
(Fig. 1B).
Specific aspects relating to gene expression changes induced by
OS were further analysed as early and late changes during OS
(Data S1). A total of 441 genes were up-regulated specifically at
OS1 h. Six genes involved in Ca2+ signaling and 6 phosphatase
genes (including 5 class 2 C members) were noted. Transcript
levels of 3 chaperone genes, 7 transporter genes, 6 oxidoreductase
genes, and 3 VQ motif family genes were up-regulated. In
addition, 13 members of cytochrome P450 gene family were up-
regulated. A total of 183 genes were down-regulated exclusively at
the early time point OS. Among these, genes involved in redox
homeostasis were noted. Transcripts of different transporter genes
and genes involved in Ca2+ signaling were found repressed at
OS1 h.
A total of 134 genes were up-regulated exclusively at OS4 h.
Among these, 8 HSP (including sHSPs, HSP100, HSP80 and
HSP70) genes were up-regulated. Genes involved in peroxidase
reaction, GSH/GST trans-reactions and cytochrome P450 family
gene member were noted in this sub group. A total of 52 genes
were down-regulated exclusively at OS4 h. Among these, genes
involved in peroxidase reaction, cytochrome P450 gene family
members, metallothionein–like protein genes, reductases, dirigent
like protein pDIR17 gene and dopamine b-monooxygenese gene
were important to note.
Gene Expression Profiling-Common Elements in CS, HSand OS
19 genes were up-regulated by 2 or more folds in all three stress
conditions irrespective of the time points (Table S2). Sixty-four
genes were common among the up-regulated genes during CS and
HS, while 7 genes were down-regulated both in CS and HS. With
respect to CS and OS, 10 genes were commonly up-regulated and
14 were down-regulated. 36 genes were commonly up-regulated
and 3 genes were down-regulated during HS and OS.
Regulation of miRNA in CS, HS and OSRegulation of genes by miRNAs highlights the importance of
post-transcriptional gene regulation. In this study, probe sets for
several miRNA genes were found differentially regulated (Table
S3). Their putative and predicted targets (based on the data by
Archak and Nagaraju [51]) are also presented (Table S3). It is
noteworthy that some of these miRNAs have genes involved in
redox homeostasis (e.g. superoxide dismutase) as their targets. In
our data, redox homeostasis related genes were found differentially
regulated in all the three stress conditions tested. This supports the
view that ROS plays a central role in the abiotic stress response.
The functional validation of the stress responsive miRNAs remains
as an important endeavor.
Transcript Profiling of Transcription Factor Genes in CS,HS and OS
The expression profile of all the probes present on the array
representing transcription factors in rice (as per rice transcription
factor database, Rice TFDB (2.1), [52] was analyzed. The
expression of genes expressing differentially by more than or
equal to 1 fold (Log2 values, i.e. two times differential change in
the transcript abundance with respect to control) with a p-value of
,0.05 were considered significantly up- or down-regulated. The
above cut-off level was based on the assumption that induction of
TFs at low to moderate levels can have significant effects on
downstream gene expression. The differential profile of differen-
tially-expressed TF genes (in the form of hierarchical cluster)
present on the array is shown in Fig. 6 and the details are provided
in Data S3. Specific transcription factors up-regulated by more
than one fold in all the three stress conditions at both time points
of each stress type are shown in Table 2. Genes encoding for
WRKY (Os02g0462800), MYBS (Os02g0618400 and
Os05g0442400), CRT/DRE binding proteins (Os02g0677300)
and ZIM domain proteins (Os03g0180800, Os03g0180900,
Os10g0391400, Os10g0392400) were significantly up-regulated
in response to CS, HS and OS. Four gene members belonging to
rice ZIM family of TFs were significantly up-regulated in response
to the three stress conditions tested. A novel gene Os01g0780800
belonging to SAND domain proteins (SAND domain proteins;
Sp100, AIRE-1, NucP41/75 and DEAF-1 are known to be
chromatin associated; [53]) showed significant up-regulation. Rice
HUA1 (Os01g0914700; HUA1 is a RNA binding protein and is
involved in floral patterning) was up-regulated during these stress
conditions, with almost 4-folds change during initial cold stress.
Seven TF genes were down-regulated in all the stress conditions
(Table 2). These genes included 3 Myb/Myb related genes and
one gene each coding for a WRKY (Os01g0972800) and ZIM
domain containing protein (Os07g0153000). Q-PCR was carried
out to validate the microarray expression profile of the selected
Rice Transcript Profiles in Abiotic Stresses
PLoS ONE | www.plosone.org 9 July 2012 | Volume 7 | Issue 7 | e40899

TFs described above (Fig. S2). A good correlation in the pattern of
expression was noted between microarray and Q-PCR data.
Analysis of Promoters of DEGs in CS, HS and OSCPMs were constructed for DEGs during CS, HS and OS using
ExplainTM Plant 3.0 software program. This analysis aimed at
analyzing the over-represented TF binding sites (F-Match) to
unveil which all matrices/TF-binding sites occurs in the gene sets.
CMA analysis was carried out to find the best possible pair of TFs
(promoter models) to understand the underlying mechanism of
coordinated regulation of functionally related or co-expressed
genes. The over-represented TF binding site (F-Match) and the
promoter models are presented in Data S4. Based on the
constructed CPMs, it may be inferred that binding sites of specific
TFs (presented in Table 3) are enriched in the promoters of DEGs.
In addition, the pair combinations in the promoter models suggest
a possible combinatorial effect. Among the promoters of DEGs
during CS, members of AGAMOUS like family of proteins were
significantly noted besides the TFs listed in Table 3 (Data S2). The
promoters of the up-regulated genes during CS were enriched in
ABF1. The promoters of the DEGS during HS were enriched for
the HSF matrices along with ABRE-binding bZIP factor family
members like ABF2, ABF3 and ABF4 and TFs like BZ8 and GBF
family protein. Members of WRKY gene family of TFs were over-
represented among the promoters of the DEGs during OS. The
frequency of MYB family TF matrices was high among the
promoters of the down-regulated genes during HS. Similar pattern
was noted in case of the DEGs during OS. Overall, it was
noteworthy that promoters of down-regulated genes in all the
three stresses were enriched with the matrices of MYB/MYB-
related gene family of TFs. High frequency of Opaque-2 (a
transcriptional activator) matrices among the promoters of down-
regulated genes is noteworthy. Promoter matrices noted both in
CMA and F-Match analysis results for DEGs during CS, HS and
OS is presented in Table 4.
Discussion
To understand the molecular response in rice following sub
lethal stress levels that often result in adaptive response to
subsequent severe stresses, transcript profilings as affected by CS,
HS and OS were analyzed in rice seedlings. Our microarray based
transcript profiling data showed high correlation to Q-PCR based
transcript profiling data as evidenced for 23 OsHsf [31], 3 OsClpB
genes [54] and genes tested in this study (Fig. S2). A large number
of DEGs in response to above stresses were noted in this study.
Exhaustive GO enrichment and functional classification of DEGs
showed a considerable overlap for the enriched classes. DEGs
were classified as specific to a given stress type or common
amongst 2 or 3 stresses with respect to their expression profiles
during CS, HS and OS. The specificity in the expression pattern
of genes was noted also with reference to the time points of
analysis. Further, genes showing induction or repression in
response to all 3 stress conditions were noted. The latter class of
genes may function as integrators of multiple environmental
signals. Also such genes may function as co-regulators that respond
to a variety of abiotic stresses and/or represent the modules
(response networks) that might be involved in the cross-talk.
While transcript profilings have been analyzed to an extent in
response to CS and HS in rice [33,37,55,56], not much is known
about how OS modulates the transcriptional dynamics in this
species. This study provides a platform to compare and contrast
CS, HS and OS induced transcript changes. From this study,
metabolism associated with ROS appears as a central theme in the
3 stresses analyzed. This is evident from the fact that genes
involved in redox homeostasis in response to OS were also
differentially regulated during CS and HS. Several such genes
were co-regulated during CS and OS as well as during HS and
OS. HSFs and HSPs are important components of HS regulatory
networks [30,57], which were also prominently noted in DEGs
affected by OS. It can thus be inferred that HSFs-HSPs regulon is
a redox responsive regulatory system. Swindell et al. [58] noted
that HSFs and HSPs represent an interaction point amongst
multiple stress responsive pathways. In this study, matrices
corresponding to HSF bindings sites were noted in the promoters
of several DEGs in response to CS, HS and OS (Tables 3, 4)
suggesting that HSFs are major players in the stress response. It
has earlier been noted that HSPs are induced by a variety of stress
conditions [21,40,59–63]. Wang et al. [64] has proposed that a
cross-talk exists between HSP/chaperone and other stress
responsive mechanisms in plants. Banti et al. [65] noted that
cross-adaptation mechanisms between HS and anoxia involve
HSPs. In addition, Collinet et al. [66] drew parallels between HS
and CS responsive networks in Drosophila. In this report, HSFs and
HSPs were found differentially regulated during CS, suggesting
that both HS and CS lead to differential expression of the HS
genes. Furthermore, HSPs were also shown to protect against
ROS damage [67]. Importantly, absence of any gene involved in
redox homeostasis in early CS (CS1 h) suggests that ROS
mediated cross-talk or response occurs late in CS response. Taken
together, it appears that HSF/HSP regulon may be regarded as
Figure 6. Hierarchical clustering of the differentially expressedtranscription factors (TFs). Detailed gene lists (with fold changes,GO, gene descriptions, Gramene pathways and other relevantinformation) are provided in the Data S3.doi:10.1371/journal.pone.0040899.g006
Rice Transcript Profiles in Abiotic Stresses
PLoS ONE | www.plosone.org 10 July 2012 | Volume 7 | Issue 7 | e40899

Table 2. Transcription factor genes noted to be differentially expressed (both up- and down-regulated) during CS, HS and OSconditions by more than one fold.
Up-regulated TFs
Locus ID cDNA CS1H CS5H HS10 HS30 OS1H OS4H Description
Os01g0780800 AK108614 1.65 2.93 4.98 3.84 3.44 1.82 SAND domain containing protein.
Os01g0826400 AY676925 2.23 3.58 1.04 1.75 2.72 2.55 WRKY transcription factor 24.
Os01g0839100 AY077725 1.03 2.30 1.37 1.95 1.83 1.30 Zn-finger, C2H2 type domain-containing protein.
Os01g0917400 AK112102 3.99 1.88 1.72 1.88 2.19 1.22 Floral homeotic protein HUA1.
Os01g0952900 AK069958 4.51 5.39 4.81 4.62 4.97 3.08 Conserved hypothetical protein.
Os02g0181300 AK058773 2.23 3.05 1.73 2.05 2.39 1.20 WRKY transcription factor 71 (TF WRKY09).
Os02g0462800 AK110587 1.77 3.70 2.04 2.71 4.15 2.91 WRKY transcription factor 42 (TF WRKY02).
Os02g0527300 AK101934 2.94 3.71 2.83 3.69 1.01 1.76 Heat shock transcription factor 31 (Fragment).
Os02g0618400 AK099283 3.39 3.56 1.96 3.14 2.65 1.57 MYB8 protein.
Os02g0624300 AK112056 2.46 3.31 1.78 1.84 1.98 1.06 MYB1 protein.
Os02g0676800 CI545726 6.42 6.27 3.65 3.72 2.95 1.56 (No Hit)
Os02g0677300 AK060550 5.59 4.39 2.19 5.59 2.57 3.78 CRT/DRE binding factor 1.
Os02g0685200 AK111726 4.60 6.64 3.91 2.40 5.28 1.57 Myb, DNA-binding domain containing protein.
Os02g0764700 AK107146 5.38 5.61 3.91 4.17 3.81 1.10 Pathogenesis-related TF and ERF domain containingprotein.
Os03g0180800 AK070649 3.99 4.38 2.44 3.51 3.97 1.65 ZIM domain containing protein.
Os03g0180900 AK073589 1.76 2.84 2.46 2.26 3.05 1.80 ZIM domain containing protein.
Os03g0191900 CI428634 1.98 4.09 3.17 2.37 4.61 1.53 AP2 domain family TF homolog (ABI4:ABA-insensitive 4)
Os03g0212300 AK070861 2.78 1.26 2.76 2.08 1.11 2.25 Transcriptional factor B3 family protein.
Os03g0437200 AK059839 1.94 2.94 1.45 1.72 3.21 2.47 Zn-finger, C2H2 type domain-containing protein.
Os03g0741100 AK071734 2.75 3.88 3.50 3.67 3.25 1.74 bHLH domain containing protein.
Os03g0815100 AK067690 2.57 3.25 3.00 1.60 2.80 1.21 OsNAC6 protein.
Os03g0820300 AK068861 1.94 4.57 5.08 3.37 4.89 3.10 ZPT2-14.
Os03g0820400 AK119690 3.32 4.47 3.53 2.60 3.90 2.15 ZPT2-13.
Os04g0301500 AB040744 3.13 3.86 5.45 3.86 4.14 1.01 bHLH domain containing protein.
Os04g0399800 CI145320 1.65 2.86 1.29 1.00 4.17 1.53 Pathogenesis-related genes transcriptional activator PTI5.
Os05g0442400 AK107134 1.05 3.89 5.65 4.46 5.82 2.00 Transcription factor MYBS3.
Os06g0127100 AY327040 5.15 4.98 3.09 4.51 5.03 1.97 CBF-like protein.
Os07g0545800 AY062209 1.83 2.67 1.84 2.04 1.89 1.01 Chitin-inducible gibberellin-responsive protein.
Os07g0674800 AY297447 3.40 3.82 1.34 1.39 2.25 1.85 AP2 domain containing protein RAP2.2 (Fragment).
Os08g0545400 CI268958 2.14 4.61 5.24 5.52 5.21 5.52 DREB1C protein
Os09g0457900 AK067195 4.74 5.59 2.73 3.14 3.65 1.70 AP2 domain containing protein RAP2.6 (Fragment).
Os10g0391400 AK107854 3.69 4.18 3.81 3.44 3.83 1.47 ZIM domain containing protein.
Os10g0392400 AK061602 2.17 3.24 2.36 2.66 2.97 1.28 ZIM domain containing protein.
Os11g0684000 AY026332 1.02 2.48 1.73 1.42 3.04 1.80 Myb, DNA-binding domain containing protein.
Down-regulated TFs
Os01g0972800 AK110625 22.78 22.18 21.86 21.96 22.45 22.70 WRKY transcription factor 44.
Os01g0975300 AK061823 21.02 21.19 21.73 21.11 21.50 21.22 Myb-related protein Atmyb5 (Myb-related protein 5)
Os03g0410000 AK110683 22.20 21.83 21.15 21.37 21.07 21.05 R2R3 Myb transcription factor MYB-IF25.
Os06g0112700 NA 21.83 21.27 22.47 22.29 21.67 22.14 Myb, DNA-binding domain containing protein.
Os06g0187000 AB037135 22.80 23.05 23.16 23.24 23.10 23.91 Origin recognition complex 1.
Os07g0153000 AU082861 22.30 22.75 22.28 22.37 21.36 22.74 ZIM domain containing protein.
Os09g0489500 AK100210 21.77 21.10 21.60 21.68 21.83 22.34 Ocs-element binding factor 3.2.
Log2 values are shown for different stress regimes.doi:10.1371/journal.pone.0040899.t002
Rice Transcript Profiles in Abiotic Stresses
PLoS ONE | www.plosone.org 11 July 2012 | Volume 7 | Issue 7 | e40899

Table 3. CPMs enriched with the highest scores in the promoters of the differentially expressed genes during CS, HS and OS.
Gene Category Name of the Promoter Matrices Recognized TFs
For genes down-regulated during CS P$GAMYB_Q2/P$O2_Q2 GAMYB, MYB101, MYB33, Myb5/Opaque-2
P$C1_Q2/P$O2_01 ATMYB5, AtMYB82, Myb3, TT2/Opaque-2
For genes up-regulated during CS V$HSF2_01/P$ERF2_01 HSF2, HSF2A/AT2G33710, ATERF-1, ATERF13, ERF2
P$ARF_Q2/P$P_01 ARF1, ARF2, ARF23, ARF4, ARF6, ARF8, ARF9, ETT, MP, NPH4/MYB12
For genes down-regulated during HS P$O2_01/P$C1_Q2 Opaque-2/ATMYB5, AtMYB82, Myb3, TT2
P$GAMYB_Q2/P$MYBAS1_01 GAMYB, MYB101, MYB33, Myb5/AtMYB81, GAMYB, MYB101, MYB33,Myb5
For genes up-regulated during HS P$ABI4_01/V$HSF2_01 ABI4/HSF2, HSF2A
P$C1_Q2/V$HSF2_02 ATMYB5, AtMYB82, Myb3, TT2/HSF2, HSF2A, HSF2B
For genes down-regulated during OS P$ARR10_01/P$GAMYB_01 ARR10/GAMYB, MYB101, MYB33, Myb5
P$O2_01/V$HSF2_01 Opaque-2/HSF2, HSF2A
For genes up-regulated during OS P$EMBP1_Q2/V$HSF2_01 GBF1, GBF2A/HSF2, HSF2A
V$HSF_Q6/V$HSF1_Q6 HSF, HSF1/HSF1, HSF1-L, HSF1-S, HSF1long, HSF1short
P$: Plant matrices; V$: Vertebrate matrices.doi:10.1371/journal.pone.0040899.t003
Table 4. Promoter matrices noted both in CMA and F-Match analysis results for the differentially expressed genes during CS, HSand OS.
Gene CategoryName of the PromoterMatrices Recognized TFs
For genes down-regulated during CS P$O2_01 Opaque-2
V$HSF1_01 HSF1, HSF1-L, HSF1-S, HSF1long, HSF1short
P$O2_Q2 Opaque-2
P$GAMYB_Q2 GAMYB, MYB101, MYB33, Myb5
P$ZAP1_01 WRKY1
For genes up-regulated during CS P$ABF1_01 ABF1, ABF4
P$CPRF2_Q2 G/HBF-1
For genes down-regulated during HS P$O2_01 Opaque-2
P$O2_02 Opaque-2
P$MYBAS1_01 AtMYB81, GAMYB, MYB101, MYB33, Myb5
P$GAMYB_Q2 GAMYB, MYB101, MYB33, Myb5
P$GAMYB_01 GAMYB, MYB101, MYB33, Myb5
For genes up-regulated during HS V$HSF1_Q6 HSF1, HSF1-L, HSF1-S, HSF1long, HSF1short
V$HSF2_01 HSF2, HSF2A
V$HSF2_02 HSF2, HSF2A, HSF2B
For genes down-regulated during OS P$GAMYB_Q2 GAMYB, MYB101, MYB33, Myb5
P$GAMYB_01 GAMYB, MYB101, MYB33, Myb5
For genes up-regulated during OS V$HSF1_Q6 HSF1, HSF1-L, HSF1-S, HSF1long, HSF1short
V$HSF_Q6 HSF, HSF1
P$O2_02 Opaque-2
P$OCSBF1_01 OCSBF-1
V$HSF2_01 HSF2, HSF2A
P$CPRF2_01 G/HBF-1
P$EMBP1_Q2 GBF1, GBF2A
P$WRKY_Q2 WRKY1, WRKY11, WRKY15, WRKY21, WRKY25, WRKY26, WRKY3, WRKY4, WRKY7,WRKY74
P$: Plant matrices; V$: Vertebrate matrices.doi:10.1371/journal.pone.0040899.t004
Rice Transcript Profiles in Abiotic Stresses
PLoS ONE | www.plosone.org 12 July 2012 | Volume 7 | Issue 7 | e40899

the central regulator of plant stress responses involving ROS
accumulation.
Various major transcription factor classes like DREB1/CBF,
DREB2, NAC, MYB/MYC and HSFs were differentially
regulated in all the 3 stress types studied. Enrichment of MADS
box gene family members in HS response is a noteworthy
observation. Transcripts for ZIM proteins (known to have role in
plant abiotic stress response [68]) were prominently altered during
stresses in this study (Table 2; Data S1). It has been observed that
MAP kinases and CDPK pathways are involved in abiotic stress
induced defense response in plants. However, MAP kinases are not
neatly delineated into separate parallel cascades; instead they show
lot of overlap and are involved in cross-talk [25,69,70]. As kinases
were differentially expressed in all 3 stress conditions, we concur
with the postulation that kinases are involved in cross-talk. We also
infer that ROS and Ca2+ mediated gene networks may be shared
to a great extent during CS, HS and OS in rice. Xuan et al. [71]
showed that AtCaM3 is a key component of the NO pathway in
HS responsive signaling cascade. According to Zhang et al. [72],
increased cytosolic concentration of Ca2+ directly activates
AtCaM3 and results in adaptations to HS. HS resulted in
differential expression of genes involved in Ca2+ signaling. Overall,
we show that the expression of TFs and kinases was well supported
by genes for signaling components (such as proteins involved in
Ca2+ signaling and phosphatases).
The onset of metabolic reprogramming may enable the
adjustments of energy/osmotic homeostasis, as a key response to
stressful regimes. Genes involved in synthesis of raffinose family
oligosaccharides and others like trehalose were found enriched
following stress conditions applied. Galactinol and raffinose were
shown to have a role in scavenging hydroxyl radicals enabling
protection of plant cells from oxidative damage by abiotic stresses
[73]. Further, HS induced production of galactinol and raffinose
was also shown [74]. Importantly, galactinol synthase 1 is one of
the HSF target genes responsible for heat-induced synthesis of
raffinose family oligosaccharides in Arabidopsis [75]. Metabolic
reprogramming was apparent from several other transcript
changes in this study. This observation is in concurrence to the
report of Marsoni et al. [76]. Sakata et al. [77] found that
endogenous auxin levels specifically decreased in developing
anthers of barley and Arabidopsis under HS. HS mediated
induction of auxin responsive genes (IAA29) and role of bHLH
(TF PIF4) suggesting integration of auxin mediated signaling with
HS response was also shown [78]. Recently, it was shown that
Aux/IAA protein HaIAA27 represses transcriptional activation by
HaHSFA9, which controls a genetic program involved in seed
longevity and embryonic desiccation tolerance [79]. Our data
indicates that auxin mediated signaling is a constituent in CS, HS
and OS stress responses.
Several ab initio motif discovery methods have been developed
and applied to gene expression data in recent years (AlignACE,
[80]; REDUCE, [81,82]). These methods strive towards the goal
of finding a pattern in promoters that shows a statistically
significant dependency with the observed expression levels or
variables associated with these expression levels (e.g. clusters of co-
expressed genes). High-throughput efforts have been placed, for
instance, for the identification of transcription start sites and
conserved promoter motifs in several organisms [83,84]. Com-
paring the results of F-Match and CMA (Table 4), a clear pattern
of over-represented HSF binding sites in the promoters of up-
regulated genes during HS and OS treatment and not in CS up-
regulated genes was noted. A high similarity was found between
the promoter models of HS and OS responsive genes. It is evident
that gene regulation is accomplished by specific combination of
TFs rather than by single factor alone. For example, expression of
AtHSP90-1 gene is reportedly regulated by interaction between
HS and other transcription binding sites [activating protein-1 (Ap-
1), CCAAT/enhancer binding protein element (C/EBP), and
metal regulatory element (MRE)] [85]. It is possible that the
modules noted are responsible for a function specific regulation of
transcription. Overall, these TFs may form positive/negative
feedback loops in the signal transduction circuits. The pair
combinations in the promoter models and F-Match analysis may
be explored to identify unique type of combinatorial transcrip-
tional control.
The central role of ROS homeostasis during temperature
extremes is highlighted from this study. Pretreatment of plants
with stress conditions that induce ‘oxidative burst’ can trigger a
protective function or immunize the plants against environmental
stresses and thus could play a role in acclimatizing stress tolerance
[86,87]. In addition it was proposed that signal transduction events
following various stress conditions ultimately affects common set of
TFs associated with antioxidative defense enzymes [88–91]. Our
results are largely in accordance with the above propositions.
However the actual biological function(s) of large number of DEGs
noted in this study needs to be validated in future.
It is likely that DEGs noted in this study are relevant for
acclimation of stress tolerance. It is thus important to further
unravel the relation of stress tolerance with DEGs noted in this
study. We have recently noted that growth of rice seedlings
following CS is different when seedlings are pre-treated or co-
treated with OS along with CS and likewise, the growth of rice
seedlings following HS is different when pre-treated or co-treated
with OS along with HS (unpublished data). We are presently
analyzing how CS and OS together as well as HS and OS together
(pre-treatment as well as co-treatment) affect the gene expression
in rice seedlings (manuscript in preparation). The DEGs noted in
this study may have relevance in development of cross-protection
to different abiotic stresses. In summary, our data highlights the
global convergence and divergence of the transcriptome in
response to oxidative stress and temperature extremes. Co-
ordinated expression pattern and similar promoter architectures
(promoter models and overrepresented transcription factors)
suggest potential regulons (for instance; HSF: HSP and MYB
regulon). The differentially expressed genes noted in this study
might be the key players in the adaptive response of plants
following sub lethal stress conditions. The data sets generated in
this study may provide reference point for stress-regulated
transcriptome and data mining resource for abiotic stresses.
Supporting Information
Figure S1 PCA plots: PCA on conditions; samples withsimilar scores for one or more PCA components can beconsidered similar in their expression profile. Entities
with high scores for a particular PCA component follow the
expression pattern shown in PCA loading plots.
(TIFF)
Figure S2 Q-PCR analysis and comparison with themicroarray data for the selected TFs described in theTable 2. The blue bars represent the Q-PCR data (relative
transcript abundance).
(TIFF)
Table S1 Details of the genes noted in network clusters.The DEGs noted as part of the clusters are listed with BKL
description. The fold changes (Log2 values) are also shown.
(DOCX)
Rice Transcript Profiles in Abiotic Stresses
PLoS ONE | www.plosone.org 13 July 2012 | Volume 7 | Issue 7 | e40899

Table S2 Differentially expressed genes common to allthe three stress conditions tested by more than 2 fold(Log2 values).(DOCX)
Table S3 Specifically up/down-regulated miRNA genes.(DOC)
Data S1 Detailed gene lists (described and mentionedin this study) with fold changes and hierarchical clusters(Heat maps).(ZIP)
Data S2 Functional classification of DEGs. Data S2.1–
S2.6 provides the detailed functional classification of the genes for
DEGs during CS, HS and OS.
(ZIP)
Data S3 Transcript profiles of transcription factors.(ZIP)
Data S4 Promoter analysis of DEGs. Data S4.1; signifi-
cantly over represented transcription factor binding sites (TFBS) in
the promoters of DEGs based on F-Match analysis, Data S4.2;
Match out put/TF binding sites (Rice matrices) in the promoters
of DEGs based on CMA analysis. The TFs that correspond to
these matrices are also listed.
(ZIP)
Acknowledgments
We thank Dr. Amanjot Singh for his valuable inputs in the discussion,
Madavan Vasudevan and Mohammed Aiyaz (Genotypic Pvt. Ltd., India)
for their help in microarray data analysis.
Author Contributions
Conceived and designed the experiments: DM AG. Performed the
experiments: DM. Analyzed the data: DM DAM. Contributed reagents/
materials/analysis tools: DAM. Wrote the paper: DM AG.
References
1. Timperio AM, Egidi MG, Zolla L (2008) Proteomics applied on plant abiotic
stresses: role of heat shock proteins (HSP). J Proteomics 71: 391–411.
2. Sanghera GS, Wani SH, Hussain W, Singh NB (2011) Engineering cold stress
tolerance in crop plants. Curr Genomics 12(1): 30–43.
3. Yoshida S, Satake T, Mackill DS (1981) High temperature stress in rice. IRRI
research paper series. No 67, International Rice Research Institute, Los Banos,
Philippines: 1–15.
4. Slafer GA, Rawson HM (1994) Sensitivity of wheat phasic development to major
environmental factors: A re-examination of some assumptions by physiologists
and modelers. Australian Journal of Plant Physiology 21: 393–426.
5. Satake T, Yoshida S (1978) High temperature induced sterility in indica rices at
flowering. Japanese Journal of Crop Sceince 47: 6–17.
6. Peng S, Huang J, Sheehy JE, Laza RC, Visperas RM, et al. (2004) Rice yields
decline with higher night temperature from global warming. Proc Natl Acad
Sci U S A 101: 9971–9975.
7. Yokoi S, Hogashi S, Kishtiani S, Murata N, Toriyama K (1998) Identification of
the cDNA for Arabidopsis glycerol-3-phosphate acyltransferase (GPAT) confers
unsaturation of fatty acids and chilling tolerance of photosynthesis on rice.
Molecular Breeding 4: 269–275.
8. Sakamoto A, Alia, Murata N (1998) Metabolic engineering of rice leading to
biosynthesis of glycinebetaine and tolerance to salt and cold. Plant Mol Biol 38:
1011–1019.
9. Hoshida H, Tanaka Y, Hibino T, Hayashi Y, Tanaka A, et al. (2000) Enhanced
tolerance to salt stress in transgenic rice that overexpress chloroplast glutamine
synthetase. Plant Mol Biol 43: 103–111.
10. Saijo Y, Hata S, Kyozuka J, Shimamoto K, Izui K (2000) Over-expression of a
single Ca2+-dependent protein kinase confers both cold and salt/drought
tolerance on rice plants. Plant J 23: 319–327.
11. Katiyar-Agarwal S, Agarwal M, Grover A (2003) Heat-tolerant basmati rice
engineered by over-expression of hsp101. Plant Mol Biol 51: 677–686.
12. Singh A, Grover A (2008) Genetic engineering for heat tolerance in plants.
Physiol Mol Biol Plants 14: 155–166.
13. Mittler R (2006) Abiotic stress, the field environment and stress combination.
Trends Plant Sci 11: 15–19.
14. Moller IM (2001) Plant mitochondria and oxidative stress: Electron transport,
NADPH turnover, and metabolism of reactive oxygen species. Annu Rev Plant
Physiol Plant Mol Biol 52: 561–591.
15. Mittler R (2002) Oxidative stress, antioxidants and stress tolerance. Trends Plant
Sci 7: 405–410.
16. Miller G, Shulaev V, Mittler R (2008) Reactive oxygen signaling and abiotic
stress. Physiol Plant 133: 481–489.
17. Foyer CH, Noctor G (2009) Redox regulation in photosynthetic organisms:
signaling, acclimation, and practical implications. Antioxid Redox Signal 11:
861–905.
18. Mittler R, Vanderauwera S, Gollery M, Van Breusegem F (2004) Reactive
oxygen gene network of plants. Trends Plant Sci 9: 490–498.
19. Davletova S, Schlauch K, Coutu J, Mittler R (2005) The zinc-finger protein
Zat12 plays a central role in reactive oxygen and abiotic stress signaling in
Arabidopsis. Plant Physiol 139: 847–856.
20. Miller G, Mittler R (2006) Could heat shock transcription factors function as
hydrogen peroxide sensors in plants? Ann Bot 98: 279–288.
21. Volkov RA, Panchuk II, Mullineaux PM, Schoffl F (2006) Heat stress-induced
H(2)O(2) is required for effective expression of heat shock genes in Arabidopsis.
Plant Mol Biol 61: 733–746.
22. Wahid A, Gelani S, Ashraf M, Foolad MR (2007) Heat tolerance in plants: An
overview. Experimental and Experimental Botany 61: 199–223.
23. Suzuki N, Koussevitzky S, Mittler R, Miller G (2011) ROS and redox signalling
in the response of plants to abiotic stress. Plant Cell Environ DOI: 10.1111/j.1365–3040.2011.02336.x.
24. Locato V, Gadaleta C, De Gara L De Pinto MC (2008) Production of reactivespecies and modulation of antioxidant network in response to heat shock: a
critical balance for cell fate. Plant Cell Environ 31: 1606–1619.
25. Chinnusamy V, Zhu J, Zhu JK (2007) Cold stress regulation of gene expression
in plants. Trends Plant Sci 12: 444–451.
26. Cheng C, Yun KY, Ressom HW, Mohanty B, Bajic VB, et al. (2007) An early
response regulatory cluster induced by low temperature and hydrogen peroxidein seedlings of chilling-tolerant japonica rice. BMC Genomics 8: 175.
27. Fujita M, Fujita Y, Noutoshi Y, Takahashi F, Narusaka Y, et al. (2006) Crosstalk
between abiotic and biotic stress responses: a current view from the points of
convergence in the stress signaling networks. Curr Opin Plant Biol 9: 436–442.
28. Chinnusamy V, Schumaker K, Zhu JK (2004) Molecular genetic perspectives oncross-talk and specificity in abiotic stress signalling in plants. J Exp Bot 55: 225–
236.
29. Sunkar R, Chinnusamy V, Zhu J, Zhu JK (2007) Small RNAs as big players in
plant abiotic stress responses and nutrient deprivation. Trends Plant Sci 12: 301–
309.
30. Nakashima K, Ito Y, Yamaguchi-Shinozaki K (2009) Transcriptional regulatorynetworks in response to abiotic stresses in Arabidopsis and grasses. Plant Physiol
149: 88–95.
31. Mittal D, Chakrabarti S, Sarkar A, Singh A, Grover A (2009) Heat shock factor
gene family in rice: genomic organization and transcript expression profiling inresponse to high temperature, low temperature and oxidative stresses. Plant
Physiol Biochem 47: 785–795.
32. Kant P, Gordon M, Kant S, Zolla G, Davydov O, et al. (2008) Functional-
genomics-based identification of genes that regulate Arabidopsis responses tomultiple abiotic stresses. Plant Cell Environ 31: 697–714.
33. Rabbani MA, Maruyama K, Abe H, Khan MA, Katsura K, et al. (2003)Monitoring expression profiles of rice genes under cold, drought, and high-
salinity stresses and abscisic acid application using cDNA microarray and RNAgel-blot analyses. Plant Physiol 133: 1755–1767.
34. Chao DY, Luo YH, Shi M, Luo D, Lin HX (2005) Salt-responsive genes in ricerevealed by cDNA microarray analysis. Cell Res 15: 796–810.
35. Walia H, Wilson C, Condamine P, Liu X, Ismail AM, et al. (2005) Comparativetranscriptional profiling of two contrasting rice genotypes under salinity stress
during the vegetative growth stage. Plant Physiol 139: 822–835.
36. Walia H, Wilson C, Zeng L, Ismail AM, Condamine P, et al. (2007) Genome-
wide transcriptional analysis of salinity stressed japonica and indica ricegenotypes during panicle initiation stage. Plant Mol Biol 63: 609–623.
37. Arora R, Agarwal P, Ray S, Singh AK, Singh VP, et al. (2007) MADS-box genefamily in rice: genome-wide identification, organization and expression profiling
during reproductive development and stress. BMC Genomics 8: 242.
38. Zhou J, Wang X, Jiao Y, Qin Y, Liu X, et al. (2007) Global genome expression
analysis of rice in response to drought and high-salinity stresses in shoot, flag leaf,and panicle. Plant Mol Biol 63: 591–608.
39. Wang D, Pan Y, Zhao X, Zhu L, Fu B, et al. (2011) Genome-wide temporal-
spatial gene expression profiling of drought responsiveness in rice. BMC
Genomics 12: 149.
40. Sabehat A, Lurie S, Weiss D (1998) Expression of small heat shock proteins atlow temperatures: a possible role in protecting against chilling injuries. Plant
Physiol 117: 651–658.
41. Djanaguiraman M, Annie Sheeba J, Shnaker AK, Durga Devi D, Bangarusamy
U (2006) Rice can acclimate to lethal level of salinity by pretreatment withsublethal level of salinity through osmotic adjustment. Plant Soil 284: 363–373.
Rice Transcript Profiles in Abiotic Stresses
PLoS ONE | www.plosone.org 14 July 2012 | Volume 7 | Issue 7 | e40899

42. Goswami A, Banerjee R, Raha S (2010) Mechanism of plant adaptation/
memory in rice seedling under arsenic and heat stress: expression of heats-shockprotein gene HSP70. AoB Plants DOI: 10.1093/aobpl/plq023.
43. Ella ES, Dionisio-Sese ML, Ismail AM (2011) Seed pretreatment in rice reducesdamage, enhances carbohydrate mobilization and improves emergence and
seedling establishment under flooded conditions. AoB Plants DOI: 10.1093/
aobpla/plr007.
44. Yoshida S, Forno DA, Cook JH Gomez KA (1976) Laboratory Manual for
Physiological Studies of Rice. 3rd ed. International Rice Research Institute, LosBanos, Philippines.
45. Quan LJ, Zhang B, Shi WW. Li HY (2008) Hydrogen peroxide in plants: aversatile molecule of the reactive oxygen species network. J Integr Plant Biol 50:
2–18.
46. Kel AE, Gossling E, Reuter I, Cheremushkin E, Kel-Margoulis OV, et al. (2003)
MATCHTM: a tool for searching transcription factor binding sites in DNAsequences. Nucleic Acids Res 31: 3576–3579.
47. Kel A, Konovalova T, Waleev T, Cheremushkin E, Kel-Margoulis O, et al.(2006a) Composite Module Analyst: a fitness-based tool for identification of
transcription factor binding site combinations. Bioinformatics 22: 1190–1197.
48. Kel A, Voss N, Jauregui R, Kel-Margoulis O, Wingender E (2006b) Beyond
microarrays: Find key transcription factors controlling signal transduction
pathways. BMC Bioinformatics (Suppl 2): S13.
49. Waleev T, Shtokalo D, Konovalova T, Voss N, Cheremushkin E, et al. (2006)
Composite Module Analyst: identification of transcription factor binding sitecombinations using genetic algorithm. Nucleic Acids Res 34: W541–545.
50. Paragh G, Schling P, Ugocsai P, Kel AE, Liebisch G, et al. (2008) Novelsphingolipid derivatives promote keratinocyte differentiation. Exp Dermatol 17:
1004–1016.
51. Archak S, Nagaraju J (2007) Computational prediction of rice (Oryza sativa)
miRNA targets. Genomics Proteomics Bioinformatics 5: 196–206.
52. Riano-Pachon DM, Ruzicic S, Dreyer I, Mueller-Roeber B (2007) PlnTFDB: an
integrative plant transcription factor database. BMC Bioinformatics 8: 42.
53. Wojciak JM, Clubb RT (2001) Finding the function buried in SAND. Nat Struct
Biol 8: 568–570.
54. Singh A, Singh U, Mittal D, Grover A (2010) Genome-wide analysis of rice
ClpB/HSP100, ClpC and ClpD genes. BMC Genomics 11: 95.
55. Yamakawa H, Hirose T, Kuroda M, Yamaguchi T (2007) Comprehensive
expression profiling of rice grain filling-related genes under high temperature
using DNA microarray. Plant Physiol 144: 258–277.
56. Hu WH, Hu GC, Han B (2009) Genome-wide survey and expression profiling of
heat shock proteins and heat shock factors revealed overlapped and stressspecific response under abiotic stresses in rice. Plant Sci 176: 583–590.
57. Singh A, Mittal D, Lavania D, Agarwal M, Mishra RC, Grover A (2011)OsHsfA2c and OsHsfB4b are involved in the transcriptional regulation of
cytoplasmic OsClpB (Hsp100) gene in rice (Oryza sativa L.). Cell Stress andChaperones DOI: 10.1007/s12192-011-0303-5.
58. Swindell WR, Huebner M, Weber AP (2007) Transcriptional profiling ofArabidopsis heat shock proteins and transcription factors reveals extensive
overlap between heat and non-heat stress response pathways. BMC Genomics 8:
125.
59. Lee BH, Won SH, Lee HS, Miyao M, Chung WI, et al. (2000) Expression of the
chloroplast-localized small heat shock protein by oxidative stress in rice. Gene245: 283–290.
60. Sun W, Bernard C, van de Cotte B, Van Montagu M, Verbruggen N (2001) At-HSP17.6A, encoding a small heat-shock protein in Arabidopsis, can enhance
osmotolerance upon overexpression. Plant J 27: 407–415.
61. Cheong YH, Chang HS, Gupta R, Wang X, Zhu T, et al. (2002)
Transcriptional profiling reveals novel interactions between wounding, patho-gen, abiotic stress, and hormonal responses in Arabidopsis. Plant Physiol 129:
661–677.
62. Liu D, Zhang X, Cheng Y, Takano T, Liu S (2006) rHsp90 gene expression in
response to several environmental stresses in rice (Oryza sativa L.). Plant Physiol
Biochem 44: 380–386.
63. Singh A, Grover A (2010) Plant Hsp100/ClpB-like proteins: poorly-analyzed
cousins of yeast ClpB machine. Plant Mol Biol 74: 395–404.
64. Wang W, Vinocur B, Shoseyov O, Altman A (2004) Role of plant heat-shock
proteins and molecular chaperones in the abiotic stress response. Trends PlantSci 9: 244–252.
65. Banti V, Loreti E, Novi G, Santaniello A, Alpi A, et al. (2008) Heat acclimationand cross-tolerance against anoxia in Arabidopsis. Plant Cell Environ 31: 1029–
1037.
66. Colinet H, Lee SF, Hoffmann A (2010) Temporal expression of heat shock genes
during cold stress and recovery from chill coma in adult Drosophilamelanogaster. FEBS J 277: 174–185.
67. Neta-Sharir I, Isaacson T, Lurie S, Weiss D (2005) Dual role for tomato heat
shock protein 21: protecting photosystem II from oxidative stress and promotingcolor changes during fruit maturation. Plant Cell 17: 1829–1838.
68. Ye H, Du H, Tang N, Li X, Xiong L (2009) Identification and expression
profiling analysis of TIFY family genes involved in stress and phytohormoneresponses in rice. Plant Mol Biol 71: 291–305.
69. Ludwig AA, Saitoh H, Felix G, Freymark G, Miersch O, et al. (2005) Ethylene-mediated cross-talk between calcium-dependent protein kinase and MAPK
signaling controls stress responses in plants. Proc Natl Acad Sci U S A 102:
10736–10741.70. Mishra NS, Tuteja R. Tuteja N (2006) Signaling through MAP kinase networks
in plants. Arch Biochem Biophys 452: 55–68.71. Xuan Y, Zhou S, Wang L, Cheng Y, Zhao L (2010) Nitric oxide functions as a
signal and acts upstream of AtCaM3 in thermotolerance in Arabidopsisseedlings. Plant Physiol 153: 1895–1906.
72. Zhang W, Zhou RG, Gao YJ, Zheng SZ, Xu P, et al. (2009) Molecular and
genetic evidence for the key role of AtCaM3 in heat-shock signal transduction inArabidopsis. Plant Physiol 149: 1773–1784.
73. Nishizawa A, Yabuta Y, Shigeoka S (2008) Galactinol and raffinose constitute anovel function to protect plants from oxidative damage. Plant Physiol 147:
1251–1263.
74. Busch W, Wunderlich M, Schoffl F (2005) Identification of novel heat shockfactor-dependent genes and biochemical pathways in Arabidopsis thaliana.
Plant J 41: 1–14.75. Panikulangara TJ, Eggers-Schumacher G, Wunderlich M, Stransky H, Schoffl F
(2004) Galactinol synthase1. A novel heat shock factor target gene responsiblefor heat-induced synthesis of raffinose family oligosaccharides in Arabidopsis.
Plant Physiol 136: 3148–3158.
76. Marsoni M, Cantara C, De Pinto MC, Gadaleta C, De Gara L, et al. (2010)Exploring the soluble proteome of Tobacco Bright Yellow-2 cells at the switch
towards different cell fates in response to heat shocks. Plant Cell Environ 33:1161–1175.
77. Sakata T, Oshino T, Miura S, Tomabechi M, Tsunaga Y, et al. (2010) Auxins
reverse plant male sterility caused by high temperatures. Proc Natl Acad Sci U S A107: 8569–8574.
78. Koini MA, Alvey L, Allen T, Tilley CA, Harberd NP, et al. (2009) Hightemperature-mediated adaptations in plant architecture require the bHLH
transcription factor PIF4. Curr Biol 19: 408–413.79. Carranco R, Espinosa JM, Prieto-Dapena P, Almoguera C, Jordano J (2010)
Repression by an auxin/indole acetic acid protein connects auxin signaling with
heat shock factor-mediated seed longevity. Proc Natl Acad Sci U S A 107:21908–21913.
80. Hughes JD, Estep PW, Tavazoie S Church GM (2000) Computationalidentification of cis-regulatory elements associated with groups of functionally
related genes in Saccharomyces cerevisiae. J Mol Biol 296: 1205–1214.
81. Bussemaker HJ, Li H, Siggia ED (2001) Regulatory element detection usingcorrelation with expression. Nat Genet 27: 167–171.
82. Foat BC, Houshmandi SS, Olivas WM, Bussemaker HJ (2005) Profilingcondition-specific, genome-wide regulation of mRNA stability in yeast. Proc
Natl Acad Sci U S A 102: 17675–17680.83. Elemento O, Slonim N, Tavazoie S (2007) A universal framework for regulatory
element discovery across all genomes and data types. Mol Cell 28: 337–350.
84. McGrath PT, Lee H, Zhang L, Iniesta AA, Hottes AK, et al. (2007) High-throughput identification of transcription start sites, conserved promoter motifs
and predicted regulons. Nat Biotechnol 25: 584–592.85. Haralampidis K, Milioni D, Rigas S, Hatzopoulos P (2002) Combinatorial
interaction of cis elements specifies the expression of the Arabidopsis AtHsp90-1
gene. Plant Physiol 129: 1138–1149.86. He L, Gao Z, Li R (2009) Pretreatment of seed with H2O2 enhances drought
tolerance of wheat (Triticum aestivum L.) seedlings. Af. J. Biotechnol 8(22):6151–6157.
87. Wahid A, Sehar S, Perveen M, Gelani S, Basra SMA, Farooq M (2008) Seed
pretreatment with hydrogen peroxide improves heat tolerance in maize atgermination and seedling growth stages. Seed Science and Technology 36(3):
633–645.88. Pucciariello C, Banti V, Perata P (2012) ROS signaling as common element in
low oxygen and heat stresses. Plant Physiol Biochem DOI: 10.1026/J.plaphy.2012.02.016.
89. Petrov VD, Breusegem FV (2012) Hydrogen peroxide – a central hub for
information in plant cells. AoB Plants DOI: 10.1093/aobpla/pl5014.90. Mahalingam R, Fedroff N (2003) Stress response, cell death and signaling: the
many facets of reactive oxygen species. Physiol Plant 119: 56–68.91. Agarwal S, Sairam RK, Srivastava GC, Tyagi A, Meena RC (2005) Role of
ABA, salicylic acid, calcium and hydrogen peroxide on antioxidant enzyme
induction in wheat seedlings. Plant Sci.169: 559–570.
Rice Transcript Profiles in Abiotic Stresses
PLoS ONE | www.plosone.org 15 July 2012 | Volume 7 | Issue 7 | e40899
Related Documents