Mapping Backbone Dynamics in Solution with Site-Directed Spin Labeling: GCN4-58 bZip Free and Bound to DNA ² Linda Columbus and Wayne L. Hubbell* Jules Stein Eye Institute and Department of Chemistry and Biochemistry, UniVersity of California, Los Angeles, California 90095-7008 ReceiVed January 29, 2004; ReVised Manuscript ReceiVed April 9, 2004 ABSTRACT: In site-directed spin labeling, a nitroxide-containing side chain is introduced at selected sites in a protein. The EPR spectrum of the labeled protein encodes information about the motion of the nitroxide on the nanosecond time scale, which has contributions from the rotary diffusion of the protein, from internal motions in the side chain, and from backbone fluctuations. In the simplest model for the motion of noninteracting (surface) side chains, the contribution from the internal motion is sequence independent, as is that from protein rotary diffusion. Hence, differences in backbone motions should be revealed by comparing the sequence-dependent motions of nitroxides at structurally homologous sites. To examine this model, nitroxide side chains were introduced, one at a time, along the GCN4-58 bZip sequence, for which NMR 15 N relaxation experiments have identified a striking gradient of backbone mobility along the DNA-binding region [Bracken et al. (1999) J. Mol. Biol. 285, 2133]. Spectral simulation techniques and a simple line width measure were used to extract dynamical parameters from the EPR spectra, and the results reveal a mobility gradient similar to that observed in NMR relaxation, indicating that side chain motions mirror backbone motions. In addition, the sequence-dependent side chain dynamics were analyzed in the DNA/protein complex, which has not been previously investigated by NMR relaxation methods. As anticipated, the backbone motions are damped in the DNA-bound state, although a gradient of motion persists with residues at the DNA-binding site being the most highly ordered, similar to those of helices on globular proteins. Proteins are inherently dynamic structures. On the fast pico- to nanosecond time scale, atoms of the backbone and side chains collectively fluctuate about their average posi- tions. On a microsecond or longer time scale, proteins may switch between discrete conformational substates. Both dynamic modes can be related to function. For example, amplitudes of backbone fluctuations often vary dramatically throughout the structure, and flexible sequences have been found to be involved in protein-protein (1-3) or protein- ligand interactions (4) and in conferring thermodynamic stability to a structure (5, 6). In addition, backbone fluctua- tions and side chain motions may be essential “lubricants” for the interconversions between conformational substates (7). Conformational switching is recognized as a fundamental mechanism of protein function (8, 9). Due to the essential link between protein dynamics and function, there is great interest in experimental strategies to explore both conformational switching and fluctuations. NMR 1 relaxation techniques that monitor the reorientation of a labeled heavy atom-H bond vector (e.g., 15 N-H) have succeeded in describing the pico- to nanosecond backbone motions for small proteins in solution (2). When interpreted in terms of the Lipari-Szabo formalism, the data provide the frequency of bond motion as an effective correlation time, τ e , and amplitude of motion, which is measured by the square of an order parameter (S 2 ). Obtaining similar dynamic information on large complexes and membrane proteins using NMR relaxation experiments remains challenging due to technical difficulties related to the size of the protein and sample limitations. SDSL has emerged as a useful approach for the investiga- tion of protein structure and conformational dynamics (10, 11) and has the potential to provide direct information on backbone dynamics (12, 13). SDSL utilizes site-directed mutagenesis to replace the residue of interest with a cysteine and all reactive native cysteine residues with a suitable substitute. The unique cysteine residue is then modified with a sulfhydryl-specific nitroxide reagent to introduce a para- magnetic side chain that is sensitive to the local environment. In most studies, the side chain designated R1(a) in Figure 1 has been employed. The EPR spectrum of a spin-label probe encodes informa- tion about the dynamic modes of the nitroxide. Such information is of interest because the nitroxide motion reflects a variety of structural and dynamic features of the protein itself. These include Brownian rotary diffusion of the protein, backbone dynamics, segmental rigid body ² This work was supported by NIH Grants EY05216 and T32 EY07026, the Jules Stein Professor Endowment, and a grant from the Bruce Ford and Anne Smith Bundy Foundation. * Corresponding author. Phone: (310) 206-8830. Fax: (310) 794- 2144. E-mail: [email protected]. 1 Abbreviations: NMR, nuclear magnetic resonance; EPR, electron paramagnetic resonance; SDSL, site-directed spin labeling; DNA, deoxyribonucleic acid; MOMD, microscopic order macroscopic dis- order; M s, scaled mobility; IPTG, isopropyl -D-thiogalactoside; EDTA, ethylenediaminetetraacetate; BME, -mercaptoethanol; PMSF, phenyl- methanesulfonyl fluoride; DTT, dithiothreitol; SDS, sodium dodecyl sulfate; T4L, T4 lysozyme; PDB, Protein Data Bank. 7273 Biochemistry 2004, 43, 7273-7287 10.1021/bi0497906 CCC: $27.50 © 2004 American Chemical Society Published on Web 05/18/2004

Welcome message from author
This document is posted to help you gain knowledge. Please leave a comment to let me know what you think about it! Share it to your friends and learn new things together.
Transcript
Mapping Backbone Dynamics in Solution with Site-Directed Spin Labeling:GCN4-58 bZip Free and Bound to DNA†
Linda Columbus and Wayne L. Hubbell*
Jules Stein Eye Institute and Department of Chemistry and Biochemistry, UniVersity of California,Los Angeles, California 90095-7008
ReceiVed January 29, 2004; ReVised Manuscript ReceiVed April 9, 2004
ABSTRACT: In site-directed spin labeling, a nitroxide-containing side chain is introduced at selected sitesin a protein. The EPR spectrum of the labeled protein encodes information about the motion of the nitroxideon the nanosecond time scale, which has contributions from the rotary diffusion of the protein, frominternal motions in the side chain, and from backbone fluctuations. In the simplest model for the motionof noninteracting (surface) side chains, the contribution from the internal motion is sequence independent,as is that from protein rotary diffusion. Hence, differences in backbone motions should be revealed bycomparing the sequence-dependent motions of nitroxides at structurally homologous sites. To examinethis model, nitroxide side chains were introduced, one at a time, along the GCN4-58 bZip sequence, forwhich NMR 15N relaxation experiments have identified a striking gradient of backbone mobility alongthe DNA-binding region [Bracken et al. (1999)J. Mol. Biol. 285, 2133]. Spectral simulation techniquesand a simple line width measure were used to extract dynamical parameters from the EPR spectra, andthe results reveal a mobility gradient similar to that observed in NMR relaxation, indicating that sidechain motions mirror backbone motions. In addition, the sequence-dependent side chain dynamics wereanalyzed in the DNA/protein complex, which has not been previously investigated by NMR relaxationmethods. As anticipated, the backbone motions are damped in the DNA-bound state, although a gradientof motion persists with residues at the DNA-binding site being the most highly ordered, similar to thoseof helices on globular proteins.
Proteins are inherently dynamic structures. On the fastpico- to nanosecond time scale, atoms of the backbone andside chains collectively fluctuate about their average posi-tions. On a microsecond or longer time scale, proteins mayswitch between discrete conformational substates. Bothdynamic modes can be related to function. For example,amplitudes of backbone fluctuations often vary dramaticallythroughout the structure, and flexible sequences have beenfound to be involved in protein-protein (1-3) or protein-ligand interactions (4) and in conferring thermodynamicstability to a structure (5, 6). In addition, backbone fluctua-tions and side chain motions may be essential “lubricants”for the interconversions between conformational substates(7). Conformational switching is recognized as a fundamentalmechanism of protein function (8, 9).
Due to the essential link between protein dynamics andfunction, there is great interest in experimental strategies toexplore both conformational switching and fluctuations.NMR1 relaxation techniques that monitor the reorientationof a labeled heavy atom-H bond vector (e.g.,15N-H) havesucceeded in describing the pico- to nanosecond backbonemotions for small proteins in solution (2). When interpretedin terms of the Lipari-Szabo formalism, the data providethe frequency of bond motion as an effective correlation time,
τe, and amplitude of motion, which is measured by the squareof an order parameter (S2). Obtaining similar dynamicinformation on large complexes and membrane proteins usingNMR relaxation experiments remains challenging due totechnical difficulties related to the size of the protein andsample limitations.
SDSL has emerged as a useful approach for the investiga-tion of protein structure and conformational dynamics (10,11) and has the potential to provide direct information onbackbone dynamics (12, 13). SDSL utilizes site-directedmutagenesis to replace the residue of interest with a cysteineand all reactive native cysteine residues with a suitablesubstitute. The unique cysteine residue is then modified witha sulfhydryl-specific nitroxide reagent to introduce a para-magnetic side chain that is sensitive to the local environment.In most studies, the side chain designated R1(a) in Figure 1has been employed.
The EPR spectrum of a spin-label probe encodes informa-tion about the dynamic modes of the nitroxide. Suchinformation is of interest because the nitroxide motionreflects a variety of structural and dynamic features of theprotein itself. These include Brownian rotary diffusion ofthe protein, backbone dynamics, segmental rigid body
† This work was supported by NIH Grants EY05216 and T32EY07026, the Jules Stein Professor Endowment, and a grant from theBruce Ford and Anne Smith Bundy Foundation.
* Corresponding author. Phone: (310) 206-8830. Fax: (310) 794-2144. E-mail: [email protected].
1 Abbreviations: NMR, nuclear magnetic resonance; EPR, electronparamagnetic resonance; SDSL, site-directed spin labeling; DNA,deoxyribonucleic acid; MOMD, microscopic order macroscopic dis-order;Ms, scaled mobility; IPTG, isopropylâ-D-thiogalactoside; EDTA,ethylenediaminetetraacetate; BME,â-mercaptoethanol; PMSF, phenyl-methanesulfonyl fluoride; DTT, dithiothreitol; SDS, sodium dodecylsulfate; T4L, T4 lysozyme; PDB, Protein Data Bank.
7273Biochemistry2004,43, 7273-7287
10.1021/bi0497906 CCC: $27.50 © 2004 American Chemical SocietyPublished on Web 05/18/2004
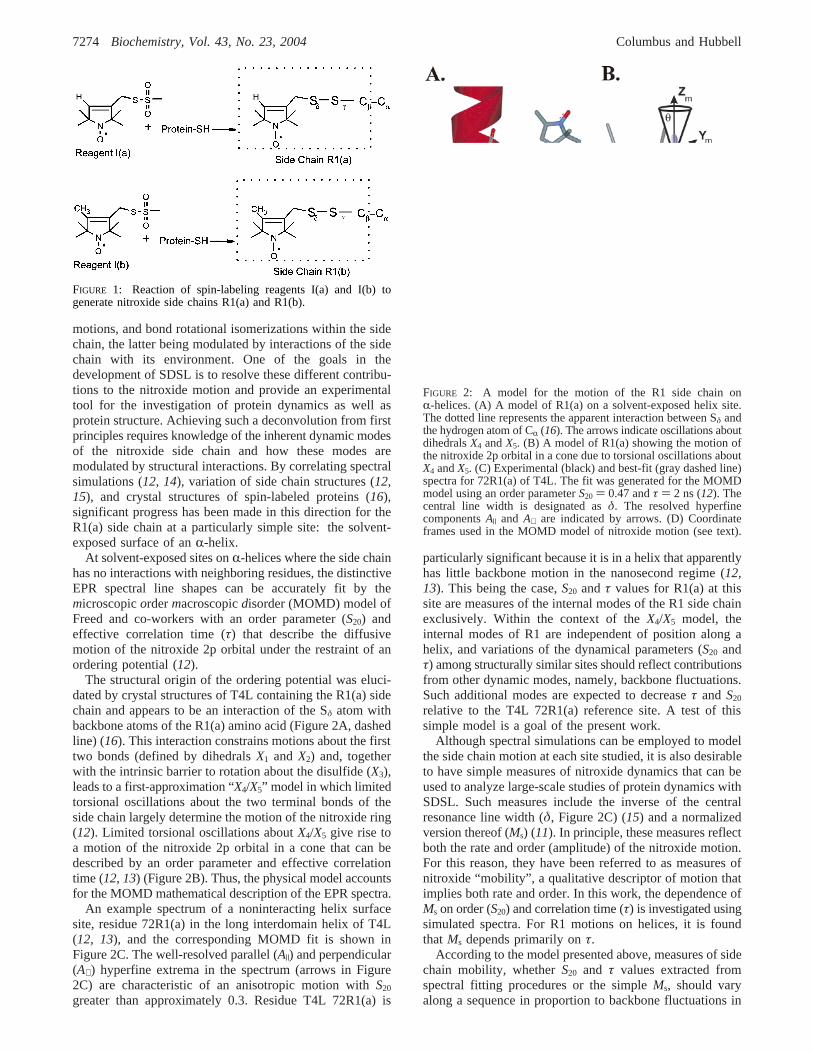
motions, and bond rotational isomerizations within the sidechain, the latter being modulated by interactions of the sidechain with its environment. One of the goals in thedevelopment of SDSL is to resolve these different contribu-tions to the nitroxide motion and provide an experimentaltool for the investigation of protein dynamics as well asprotein structure. Achieving such a deconvolution from firstprinciples requires knowledge of the inherent dynamic modesof the nitroxide side chain and how these modes aremodulated by structural interactions. By correlating spectralsimulations (12, 14), variation of side chain structures (12,15), and crystal structures of spin-labeled proteins (16),significant progress has been made in this direction for theR1(a) side chain at a particularly simple site: the solvent-exposed surface of anR-helix.
At solvent-exposed sites onR-helices where the side chainhas no interactions with neighboring residues, the distinctiveEPR spectral line shapes can be accurately fit by themicroscopicordermacroscopicdisorder (MOMD) model ofFreed and co-workers with an order parameter (S20) andeffective correlation time (τ) that describe the diffusivemotion of the nitroxide 2p orbital under the restraint of anordering potential (12).
The structural origin of the ordering potential was eluci-dated by crystal structures of T4L containing the R1(a) sidechain and appears to be an interaction of the Sδ atom withbackbone atoms of the R1(a) amino acid (Figure 2A, dashedline) (16). This interaction constrains motions about the firsttwo bonds (defined by dihedralsX1 and X2) and, togetherwith the intrinsic barrier to rotation about the disulfide (X3),leads to a first-approximation “X4/X5” model in which limitedtorsional oscillations about the two terminal bonds of theside chain largely determine the motion of the nitroxide ring(12). Limited torsional oscillations aboutX4/X5 give rise toa motion of the nitroxide 2p orbital in a cone that can bedescribed by an order parameter and effective correlationtime (12, 13) (Figure 2B). Thus, the physical model accountsfor the MOMD mathematical description of the EPR spectra.
An example spectrum of a noninteracting helix surfacesite, residue 72R1(a) in the long interdomain helix of T4L(12, 13), and the corresponding MOMD fit is shown inFigure 2C. The well-resolved parallel (A|) and perpendicular(A⊥) hyperfine extrema in the spectrum (arrows in Figure2C) are characteristic of an anisotropic motion withS20
greater than approximately 0.3. Residue T4L 72R1(a) is
particularly significant because it is in a helix that apparentlyhas little backbone motion in the nanosecond regime (12,13). This being the case,S20 andτ values for R1(a) at thissite are measures of the internal modes of the R1 side chainexclusively. Within the context of theX4/X5 model, theinternal modes of R1 are independent of position along ahelix, and variations of the dynamical parameters (S20 andτ) among structurally similar sites should reflect contributionsfrom other dynamic modes, namely, backbone fluctuations.Such additional modes are expected to decreaseτ and S20
relative to the T4L 72R1(a) reference site. A test of thissimple model is a goal of the present work.
Although spectral simulations can be employed to modelthe side chain motion at each site studied, it is also desirableto have simple measures of nitroxide dynamics that can beused to analyze large-scale studies of protein dynamics withSDSL. Such measures include the inverse of the centralresonance line width (δ, Figure 2C) (15) and a normalizedversion thereof (Ms) (11). In principle, these measures reflectboth the rate and order (amplitude) of the nitroxide motion.For this reason, they have been referred to as measures ofnitroxide “mobility”, a qualitative descriptor of motion thatimplies both rate and order. In this work, the dependence ofMs on order (S20) and correlation time (τ) is investigated usingsimulated spectra. For R1 motions on helices, it is foundthat Ms depends primarily onτ.
According to the model presented above, measures of sidechain mobility, whetherS20 and τ values extracted fromspectral fitting procedures or the simpleMs, should varyalong a sequence in proportion to backbone fluctuations in
FIGURE 1: Reaction of spin-labeling reagents I(a) and I(b) togenerate nitroxide side chains R1(a) and R1(b).
FIGURE 2: A model for the motion of the R1 side chain onR-helices. (A) A model of R1(a) on a solvent-exposed helix site.The dotted line represents the apparent interaction between Sδ andthe hydrogen atom of CR (16). The arrows indicate oscillations aboutdihedralsX4 andX5. (B) A model of R1(a) showing the motion ofthe nitroxide 2p orbital in a cone due to torsional oscillations aboutX4 andX5. (C) Experimental (black) and best-fit (gray dashed line)spectra for 72R1(a) of T4L. The fit was generated for the MOMDmodel using an order parameterS20 ) 0.47 andτ ) 2 ns (12). Thecentral line width is designated asδ. The resolved hyperfinecomponentsA| and A⊥ are indicated by arrows. (D) Coordinateframes used in the MOMD model of nitroxide motion (see text).
7274 Biochemistry, Vol. 43, No. 23, 2004 Columbus and Hubbell
the pico- to nanosecond time scale. To evaluate this idea,the site-dependent variation of the EPR spectra of nitroxideside chains R1(a) and R1(b) (shown in Figure 1) along thebasic leucine zipper (bZip) of GCN4 was investigated. GCN4bZip is a homodimeric motif in the DNA-binding transcrip-tion factor GCN4 (Figure 3). The GCN4 bZip motifinvestigated in the current study consists of the C-terminal58 residues of GCN4 and will be designated GCN4-58 (17).The C-terminus of GCN4-58 (29-58) forms a coiled coil(leucine zipper), and the highly basic N-terminus forms theDNA-binding region. In the free state, the basic region isthought to exist as an ensemble of structures with helicalpropensities. GCN4-58 was selected for study with SDSLbecause previous NMR studies identified a striking gradientof backbone motion along the sequence corresponding tothe DNA-binding region, while the motion throughout theleucine zipper was comparatively low and constant (17). Theresults presented below show that the distinctive pattern ofmotion is clearly revealed in the sequence dependence ofdynamical parameters derived from the EPR data, validatingthe utility of SDSL for monitoring backbone motions inproteins less accessible to NMR.
The crystal structures of GCN4-58 bound to two differentDNA recognition sites were previously determined (18, 19),and in both structures the helix binds to the major groove ofDNA. SDSL was further applied to characterize the dynamicsof GCN4-58 bound to DNA, providing the first insight intothe dynamic modes of the bound state. Although thebackbone motions of GCN4-58 are damped in the complex,a gradient of backbone dynamics persists. Previous calcula-tions of the conformational entropy change in the bindingreaction have assumed that the helices of GCN4-58 in thebound state have equal rigidity to helices found in globularproteins (20), but this is apparently not the case.
MATERIALS AND METHODS
Preparation of Spin-Labeled GCN4-58 Mutants
Cloning, Expression, and Purification of GCN4-58Mutants. GCN4-58 mutants containing single cysteinesubstitutions at consecutive sites 6-27 and 32, 35, 39, 43,and 46 (Figure 3) were generated using the QuikChangemethod (Stratagene, La Jolla, CA). The entire GCN4-58gene of each cysteine mutant was sequenced by DavisSequencing (Davis, CA). Mutant plasmids were transformedinto Escherichia coliBL21(DE3). Cell cultures were grownto an OD≈ 1.0, and protein expression was induced by
adding IPTG (1 mM final concentration). The cells wereharvested by centrifugation after 3 h of induction. The cellpellets were resuspended in a buffer (pH) 7.5) containing50 mM KH2PO4, 0.3 M NaCl, 1 mM EDTA, 0.1% v/v BME,and 0.1% w/v PMSF and sonicated for 4× 1 min in an icebath (output 4, duty cycle 50% using a Branson Sonifier 250and a standard disruption horn). The cell debris was pelletedby centrifugation at 27000g for 15 min. The supernatant wasfiltered (0.2µm) and loaded onto a SP-Sepharose Hi-Trapcolumn (Amersham Biosciences, Piscataway, NJ) equili-brated with a buffer (pH) 7.5) consisting of 50 mM Tris,1 mM EDTA, and 1 mM DTT. GCN4-58 was eluted witha linear NaCl gradient (from 0 to 2.0 M NaCl). Protein puritywas estimated at 95% using gel eletrophoresis with a 15%SDS Phast gel (Amersham Biosciences, Piscataway, NJ).
Spin Labeling of GCN4-58 Mutants.Immediately beforespin labeling, the protein was exchanged into a suitable buffer(50 mM sodium acetate and 50 mM KCl at pH 6.0) using aHi-Trap desalting column (Amersham Biosciences, Piscat-away, NJ). The GCN4-58 mutants (typically≈25µM) wereincubated with 1:1 molar ratio with the desired spin-labelingreagent. The reaction was allowed to proceed at roomtemperature for at least 1 h. The protein solutions werewashed several times (≈3 × 3 mL) through a Centricon filter(3 kDa cutoff) and concentrated to 200µM using a Microconfilter concentrator (3 kDa cutoff). The spin-labeled mutantsare designated by the residue number at which the nitroxideis introduced and the designation for the nitroxide side chaingiven in Figure 1. For example, 6R1(a) is a mutant with anR1(a) side chain at residue 6.
At some sites, spin-labeled side chains showed magneticdipolar interactions in the homodimer. To record thespectrum of the noninteracting species, the labeled ho-modimer was mixed with Cys-less wild-type GCN4-58 ata ratio of 1:5. Sufficient subunit exchange to eliminate theinteraction was observed within minutes of mixing thelabeled and unlabeled protein.
DNA Binding to Spin-Labeled GCN4-58 Mutants
DNA substrate, AP-1 or 2AP-1 (Integrated DNA Technol-ogy, Santa Clara, CA), was added to spin-labeled protein ata molar ratio equal to or greater than 2:1. The AP-1 sequencecontains a double-stranded pseudopalindromic sequence thatGCN4-58 recognizesin ViVo: 5′-GAGATGACTCATCTC-3′ and 3′-CTCTACTGAGTAGAG-5′. The 2AP-1 constructcontains two AP-1 binding sequences separated by six basepairs: 5′-GAGATGACTCATCGCGAGATGACTCATCTC-3′ and 3′-CTCTACTGAGTAGCGCTCTACTGAGTAGAG-5′. In some cases, the DNA/protein complexes were addedto 60% Ficoll 70 (w/v) at a ratio of 1:1 for a final Ficoll 70concentration of 30%. For tethering the protein/DNA com-plex to streptavidin-agarose beads (Novagen, Madison, WI),one of the strands of AP-1 was biotinylated at the 5′ terminus(Integrated DNA Technology, Santa Clara, CA) and annealedto an unlabeled complementary strand. The DNA was addedto the streptavidin-agarose beads with a molar ratio of 1.5:1(DNA:streptavidin). The mixture was incubated at roomtemperature and shaken for 30 min. The mixture wascentrifuged at 500g for 10 min and the supernatant carefullydecanted. The beads were washed twice by adding GCN4-58 labeling buffer, incubating, centrifuging, and decantingthe supernatant. The final sample was prepared by mixing
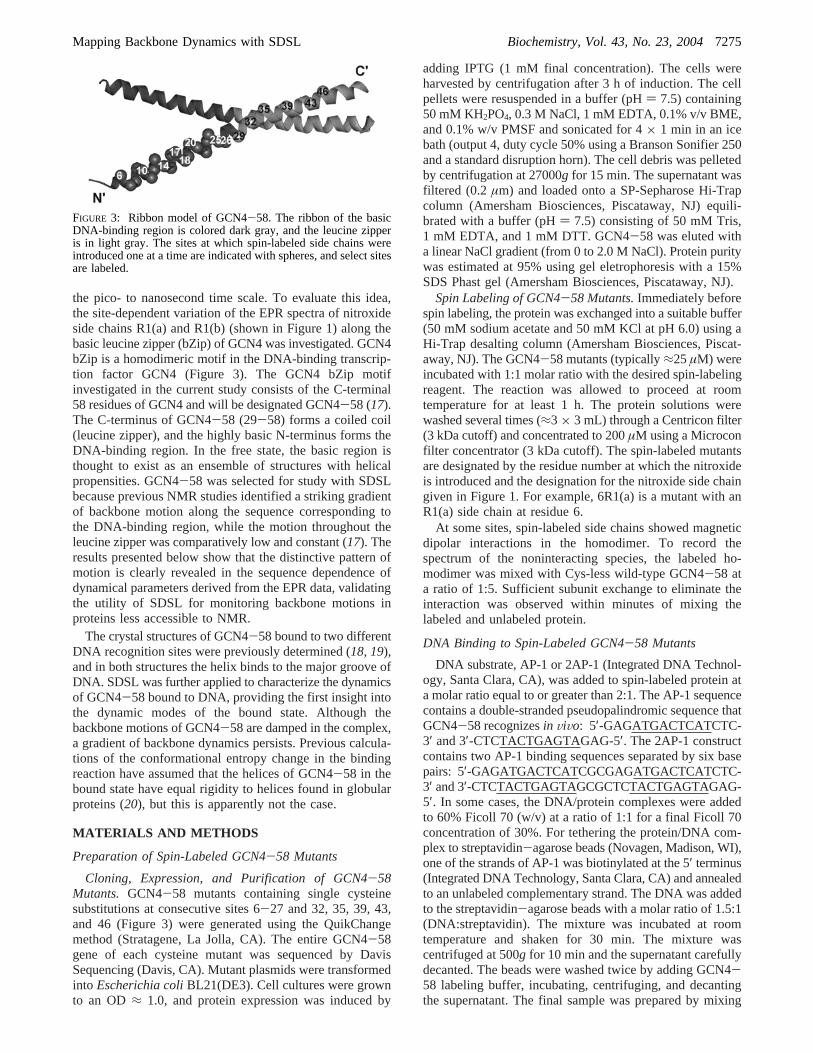
FIGURE 3: Ribbon model of GCN4-58. The ribbon of the basicDNA-binding region is colored dark gray, and the leucine zipperis in light gray. The sites at which spin-labeled side chains wereintroduced one at a time are indicated with spheres, and select sitesare labeled.
Mapping Backbone Dynamics with SDSL Biochemistry, Vol. 43, No. 23, 20047275
the DNA-bound beads with the spin-labeled protein with theDNA concentration 2-fold higher than that of the protein.
DNA binding of spin-labeled GCN4-58 was verifiedusing a native polyacrylamide gel shift. Two microliters ofthe EPR sample was loaded onto a 12-25% gradient gel(Amersham Biosciences, Piscataway, NJ). Native bufferstrips and reverse polarity electrodes were used to run thegel on a Phast system (Amersham Biosciences, Piscataway,NJ). The gel was stained and destained using standardmethods. Migration of the DNA-bound protein is signifi-cantly different from the unbound state, allowing a qualitativeassessment of DNA binding of the spin-labeled mutants ofGCN4-58.
DNA binding by the spin-labeled protein was also verifiedby EPR spectral changes. In essentially all cases, DNAbinding significantly altered the motion of the spin label,and the stoichiometry was determined to be 1:1 by titrationof the effect with increasing concentrations of DNA. Bindingconstants cannot be quantitatively determined using thismethod because the minimum detectable concentration oflabeled protein is approximately 1µM, whereas the DNA-binding constants are in the nanomolar range (21, 22).
EPR of Spin-Labeled GCN4-58 Mutants
EPR Measurements.EPR spectra were recorded on aVarian E-109 spectrometer fitted with a two-loop one-gapresonator (23). Protein samples of 5µL (≈200 µM) wereloaded in Pyrex capillaries (0.84 mm o.d. x 0.6 mm i.d.)sealed on one end. All spectra were acquired using a 2 mWincident microwave power. The modulation amplitude at 100kHz was optimized for each spectrum to avoid spectraldistortion. All spectra were normalized to the same area.
The inverse of the central resonance line width (δ; Figure2C) is a semiquantitative measurement of the mobility ofthe nitroxide side chain. For convenience, a normalizedcentral line width measure,Ms, is employed:
whereδexp is the central line width of R1 at the site of interestand δi and δm are the corresponding values at the mostimmobilized and mobile site observed in a protein underconditions where rotational diffusion of the protein as awhole does not contribute to the line width. This measurehas the advantage of simplicity in that it ranges from 0 to 1.The parametersδi andδm are somewhat arbitrary and subjectto revision, andδi depends to some extent on local polarityin the protein. However, relative values are of primaryinterest in analyzing a database, and these are not seriousdisadvantages. In the present study, the value ofδm is set at2.1 G, corresponding to R1 near the end of the disordered18-residue C-terminal sequence of rhodopsin (24). The valueof δi is set at 8.4 G, corresponding to the average value ofan immobilized, buried residue in a protein undergoing slowrotational diffusion (τR g 30 ns).
Simulation and Fitting of EPR Spectra.EPR spectra weresimulated or fit with the MOMD model of Freed and co-workers using the program NLSL (14). A brief descriptionspecific to the implementation used in the present work isgiven below.
In the MOMD model, three coordinate frames are em-ployed to represent the motion of the nitroxide in the protein,as illustrated in Figure 2D. The first is the molecule-fixedmagnetic tensor frame (xM, yM, zM). As is customary,zM liesalong the nitroxide p orbital,xM lies along the NO bond axis,and yM completes a right-handed coordinate system. Themagnetic frame is the principal frame for both the nitroxidehyperfine (A) andg tensors. The second coordinate frameis the principal frame of the rotational diffusion tensor (xR,yR, zR). In general, the rotational diffusion and magneticframes are not coincident. The relationship between theseframes is specified by the diffusion tilt angles (RD, âD, γD),defined as the Euler angles required for rotation of themagnetic frame into the diffusion frame. Simulations of theexperimental spectra to be discussed below are dependenton âD (Figure 2D), the tilt angle betweenzR andzM, but onlyweakly dependent onRD and γD. Anisotropic motions aresimulated in the MOMD model by introducing a restoring(ordering) potential (U) that constrains the spatial extent ofthe motion ofzR. Most spectra of R1(a) and R1(b) on solvent-exposed helical sites of proteins are adequately simulatedusing the restoring potentialU(θ) ) -1/2kBTC20(3 cos2 θ -1) to describe the motion of the nitroxide, whereC20 is ascaling coefficient andθ is the (instantaneous) angle betweenzR and the symmetry axis of the potential (15). The symmetryaxis of the potential defines thez-axis of the third and finalcoordinate frame, the director frame. For describing thenitroxide side chains on a protein subject to the aboveordering potential, the director frame is uniaxial (zD) andfixed to the protein backbone at the residue of interest. Theexistence of the restoring potential results in an anisotropicmotion and can be characterized by the order parameterS20
) 1/2⟨(3 cos2 θ - 1)⟩, where the brackets indicate averagingover spatial coordinates. The origin of the potential in theX4/X5 model is the barrier to rotation about the correspondingbonds of the side chain. For an individual protein molecule,zD forms an angleψ with respect to the external magneticfield. To obtain the final spectrum corresponding to anisotropic distribution of protein orientations, the spectra aresummed overψ.
For generating theoretical spectra with the MOMD model,the values for the elements of theA andg tensors were fixedatAxx ) 6.2,Ayy ) 5.9,Azz, ) 37,gxx ) 2.0076,gyy ) 2.0050,gzz ) 2.0023, and the diffusion tilt angles were fixed atRD
) 0°, âD ) 36°, γD ) 0°. These parameters were previouslyfound to be optimal for R1(a) on solvent-exposed surfacesof helices (12). An isotropic diffusion tensor was used, theprincipal values of the Lorentzian line width tensor (W) wereset to zero, and the Gaussian inhomogeneous broadening(gib0) was 1.0 G.
For fitting of experimental spectra, theA and g tensorelements were fixed at the values given above, and an axiallysymmetric diffusion tensor was employed, with principalvaluesR| andR⊥. In this report, spectra are characterized bythe geometric mean of the diffusion tensor elements,Rh )(R|R⊥
2)1/3, and an asymmetry parameterN ) R|/R⊥. Theeffective mean correlation time,τ, is defined asτ ) 1/6Rh.Starting with the Lorentzian line width parameters set to 0and the Gaussian inhomogeneous broadening at 1 G,Rh wasvaried to fit the central line width. For the highly mobileessentially isotropic spectra in the basic region of GCN4-58 free in solution (6-20),N andC20 were fixed at 1 and 0,
Ms )δexp
-1 - δi-1
δm-1 - δi
-1
7276 Biochemistry, Vol. 43, No. 23, 2004 Columbus and Hubbell
respectively, andRh and the Gaussian inhomogeneous linewidth (gib0) were the only parameters varied to obtain aleast-squares fit. In the best fit,Rh was close to the initialestimate. The NLSL program does not allow for independentvariation of the relative populations of spins in a multicom-ponent fit, so these fits are highly constrained. At a few sitesin the basic region, best fits were obtained by including aHeisenberg exchange rate for the more immobile component.For the less mobile residues in the region of the leucinezipper (25-46), a survey showed that the best fits wereobtained withN values≈-0.5, andN was fixed at this valuein order to constrain the fits and eliminate problems withthe correlation betweenRh andN.
For R1 in GCN4-58 bound to DNA, the relativelyimmobilized spectra required finite values ofC20 for goodfits. Following the initial procedure described above,N wasagain fixed at-0.5 andC20 was searched for an approximatefit to the overall line shape. For the final fit,Rh, C20, and theGaussian inhomogeneous line width parameters were variedfor a least-squares best fit. A few cases required an additionalterm in the order potential for a best fit (C22). The parametersRh and C20 may be correlated in the fitting procedure. Toestimate the error due to such correlation,Rh was incremen-tally changed from the best-fit value andC20 varied for anew fit. This procedure was continued until the reduced chi-squared for the new fit exceeded that for the best fit by 5%.In this way a range of values forRh andC20 were obtainedthat provided an estimate for the error in those quantities.This strategy was used for representative cases covering therange of correlation times and ordering potentials encoun-tered, and similar errors were assumed to hold for the othercases. Error estimates obtained by this procedure are largerthan those estimated from the chi-squared statistics.
RESULTS
Line Width as a Measure of Mobility.As mentioned above,Ms is a simple spectral parameter based on line width that isused as a measure of side chain mobility. To examine thedependence ofMs on rate and order in single componentspectra, a library of simulated spectra was generated usingthe MOMD model as described in Materials and Methods.To constrain the magnitude of this task, the motional modelfor the R1 side chain at a noninteracting solvent-exposedsite on anR-helix was selected (Figure 2) (12, 15). In general,such helix surface sites do not perturb the protein structureand provide the optimal location for a nitroxide “sensor” ofbackbone motion.
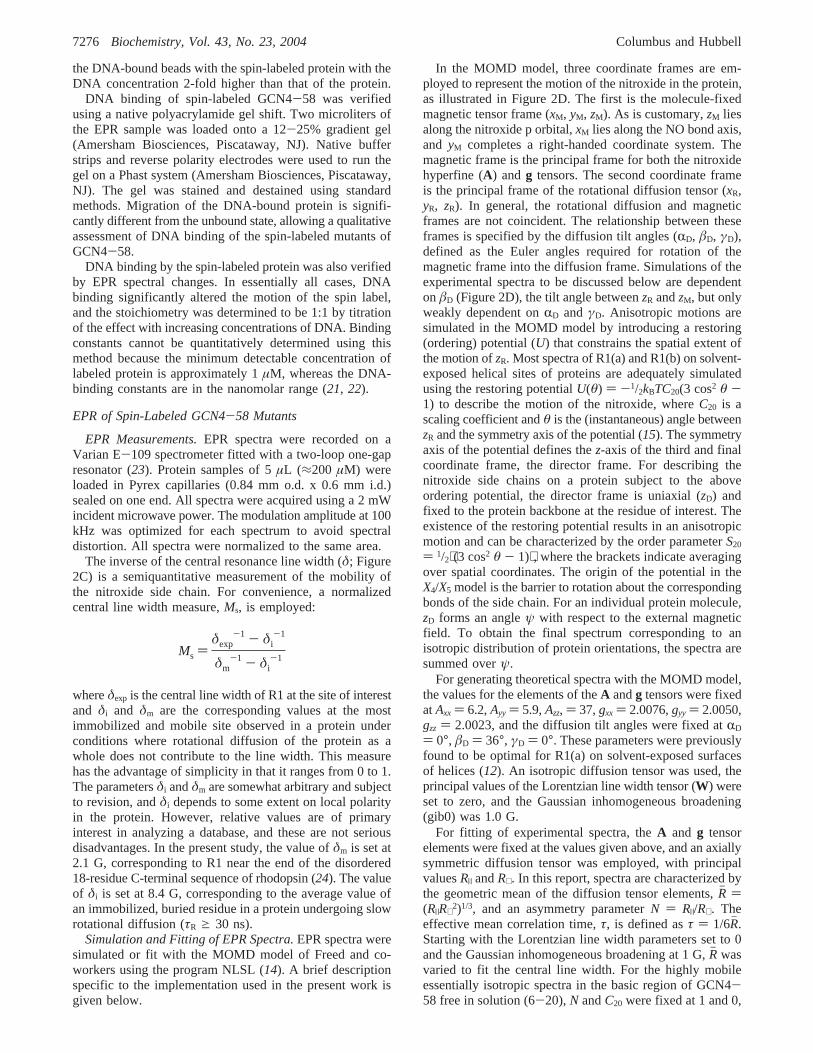
Figure 4 shows the dependence ofMs on order parameter(S20) and correlation time (τ) and as measured from a subsetof the simulated library. The gray regions of the plotshighlight the ranges ofS20 (0-0.5) andτ (1-4 ns) corre-sponding to values observed for R1 at noninteracting helixsurface sites.
The width of the central resonance line, upon whichMs isbased, is a function of inhomogeneous proton hyperfineinteraction, g-factor anisotropy, and motion. In the fastmotional regime (τ < 0.5 ns), theg-factor anisotropy isaveraged, and the inhomogeneous width of≈1 G isdetermined by the interaction of the unpaired electron withthe protons on the nitroxide ring (25, 26). In the fast motionallimit (0.5 < τ < 1 ns), rotational diffusion gives rise to
relaxation effects resulting from theg-factor anisotropy, anda Lorentzian contribution to the line width can be computedfrom Redfield theory (27). In the rigid limit (τ > 50 ns), theinhomogeneous line width is determined by the staticg-factoranisotropy, which corresponds to about 8.8 G at X-bandmicrowave frequencies. In the intermediate motional range(1 < τ < 50 ns), the line widths can be computed from asuitable line shape theory (28).
Figure 4A shows thatMs is relatively insensitive to changesin order parameter for values ofτ from 1 to 2 ns, a rangerelevant to R1 on helix surface sites. This is a consequenceof the intrinsic internal motion of the nitroxide side chain(i.e.,S20 ) 0.47,τ ) 2 ns, andâD ) 36°) that already resultsin an extensive averaging of theg-factor anisotropy at therates considered. Thus, a reduction in the apparent orderparameter due to additional modes of motion will have littlefurther effect. For slower rates (τ ) 4 ns) and high order,there is a slightincreasein Ms with increasing order. In thismotional regime, the central line width is dominated byrelaxation effects, and the increase inMs with increasingorder parameter could arise from a reduction in relaxationefficiency with increasing anisotropy of motion, causing thespectra for largerS20 to have a narrower center line.Ms isextremely sensitive toτ for all values ofS20 investigated inthe range of 1-4 ns (Figure 4B). The conclusion from these
FIGURE 4: Dependence ofMs on S20 and τ determined fromsimulated spectra. (A) Dependence ofMs on the order parameterfor the indicated correlation times. (B) Dependence ofMs on thecorrelation time for the indicated order parameters. The gray boxeshighlight the range of values expected for R1(a) on solvent-exposedhelical sites.
Mapping Backbone Dynamics with SDSL Biochemistry, Vol. 43, No. 23, 20047277
results is that the commonly used measures for relativemobility (δ-1 and the derivedMs) are primarily measures ofrelative rateswhen applied to R1(a) at helix surface sites.The results of Figure 4 apply to single-component spectra.For spectra with two components corresponding to similarnumbers of spins with significantly different mobilities,Ms
is dominated by the most mobile component.Motion of R1(a) and R1(b) in GCN4-58. In previous
work, it was shown that the internal motion of the R1(b)side chain on anR-helix is reduced relative to that in R1(a)due to interactions of the 4-methyl group, presumably a stericclash with theSγ of the disulfide bond (12). That being thecase, dynamic contributions from the backbone wouldcontribute in larger proportion to the overall motion of thenitroxide in R1(b) relative to R1(a). In the present experi-ments, both R1(a) and R1(b) were used to probe backbonemotions in GCN4-58 to evaluate this possibility.
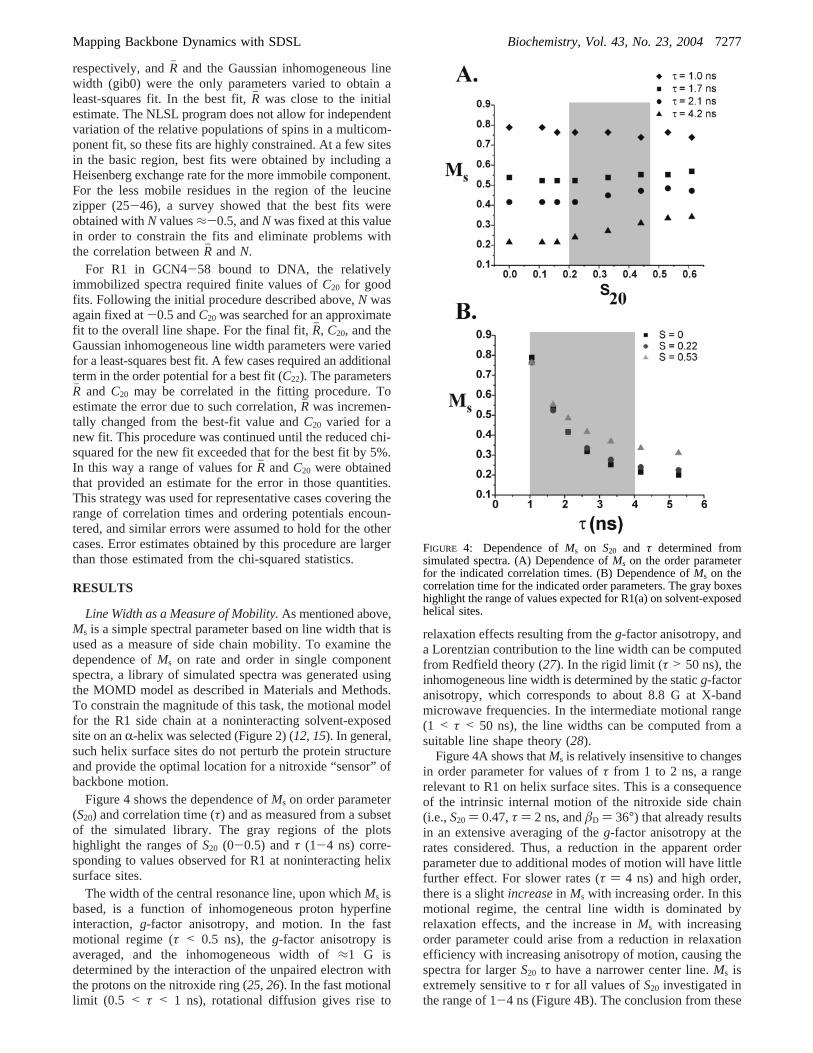
Figure 5 shows the EPR spectra of R1(a) (black) and R1(b)(red) for a continuous scan through the basic (DNA-binding)region of GCN4-58 (residues 6 through 26) and for selectedsolvent-exposed sites in the leucine zipper region (29, 32,35, 39, 43, and 46). The locations of the sites in the moleculeare shown in Figure 3. The spectra for R1(a) and R1(b) ateach site are normalized to the same number of spins, andthe relative amplitude is a sensitive indication of differencesin rates of motion. The EPR spectra have very narrow linewidths, particularly in the basic region, indicating very highmobility of the R1 side chain. As will be shown below, thismotion is dominated by internal motions within the protein,
with smaller contributions from the overall tumbling of the13 kDa GCN4-58 dimer.
EPR spectra of GCN4-58 27R1(a) and 27R1(b) were alsorecorded but not included in Figure 5 because the spectrareflected unusually high mobility, suggesting lack ofdimer formation, and the mutants did not bind DNAsubstrate. This is not surprising, because methionine 27 isat the dimer interface at the beginning of the leucine zipperregion, and the presence of the larger spin label coulddestabilize the protein. In addition, this residue is thoughtto play a specific role in the DNA-binding reaction (29).Within the leucine zipper region, only sites on the outersurface of the helices were selected, to avoid disruption ofthe coiled coil by introducing a bulky side chain at thepacking surface. Under any circumstance, the surface sitesare the important ones for sensing backbone motion, thesubject of the present study.
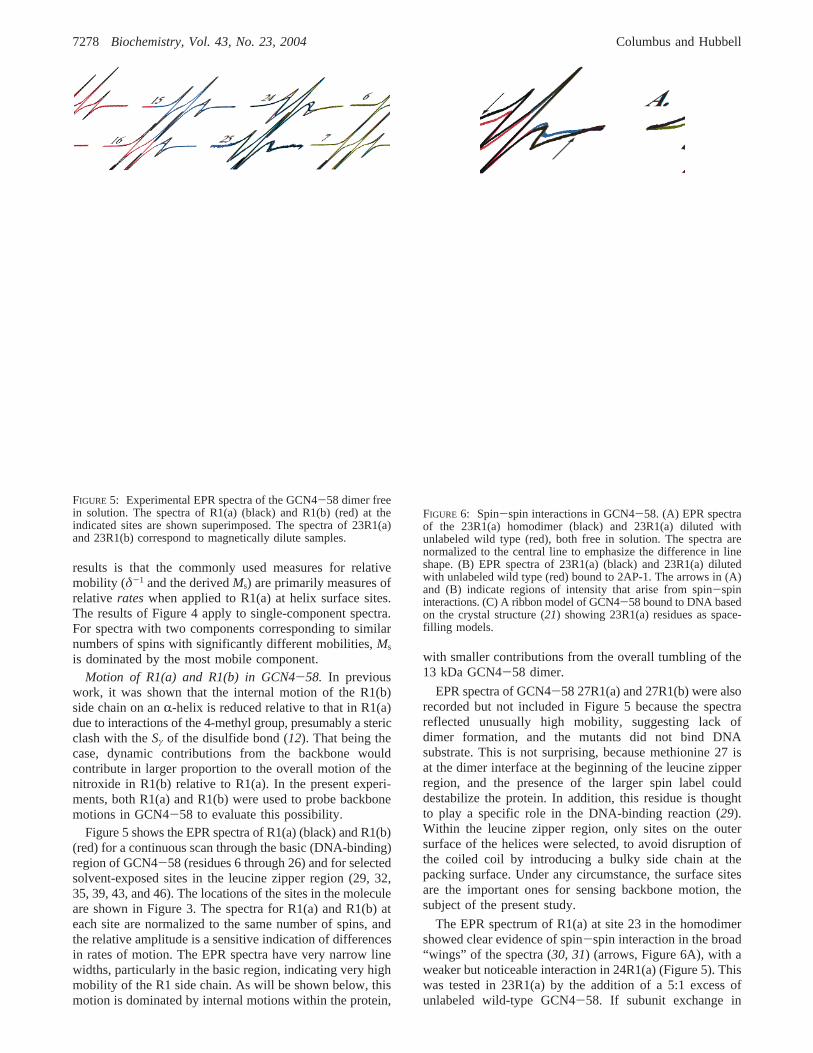
The EPR spectrum of R1(a) at site 23 in the homodimershowed clear evidence of spin-spin interaction in the broad“wings” of the spectra (30, 31) (arrows, Figure 6A), with aweaker but noticeable interaction in 24R1(a) (Figure 5). Thiswas tested in 23R1(a) by the addition of a 5:1 excess ofunlabeled wild-type GCN4-58. If subunit exchange in
FIGURE 5: Experimental EPR spectra of the GCN4-58 dimer freein solution. The spectra of R1(a) (black) and R1(b) (red) at theindicated sites are shown superimposed. The spectra of 23R1(a)and 23R1(b) correspond to magnetically dilute samples.
FIGURE 6: Spin-spin interactions in GCN4-58. (A) EPR spectraof the 23R1(a) homodimer (black) and 23R1(a) diluted withunlabeled wild type (red), both free in solution. The spectra arenormalized to the central line to emphasize the difference in lineshape. (B) EPR spectra of 23R1(a) (black) and 23R1(a) dilutedwith unlabeled wild type (red) bound to 2AP-1. The arrows in (A)and (B) indicate regions of intensity that arise from spin-spininteractions. (C) A ribbon model of GCN4-58 bound to DNA basedon the crystal structure (21) showing 23R1(a) residues as space-filling models.
7278 Biochemistry, Vol. 43, No. 23, 2004 Columbus and Hubbell
GCN4-58 takes place, the equilibrium mixture would haveonly 2.8% of dimers with two spins, and the interactionshould greatly decrease. This in fact is the result, as seen bythe decrease in the spectral amplitude in the wings (Figure6A, red trace), simultaneously confirming the presence ofstrong spin-spin interaction in the homodimer as well assubunit exchange.
An estimate of the interspin distance obtained from thespectral broadening in the 23R1(a) homodimer (≈6-7 G)gives a range of 10-15 Å (30). Modeling of the R1(a) sidechain in a preferred conformation (X1, X2 ) g+, g+) (16) inthe structural model of GCN4-58 derived from the crystalstructure of GCN4-58 bound to DNA (shown in Figure 6C)indicates that the nitroxide side chains point away from eachother on opposite sides of the dimer, with an inter-nitroxidedistance of≈15 Å, consistent with the distance estimatedfrom spin-spin interaction. Other residues of the basic regionforming topologically homologous pairs to 23, for whichspin-spin interaction might occur, are 20 and 27. For20R1(a), there is a slight reduction in the spectral breadthwhen the sample is diluted with unlabeled wild-type protein(data not shown), and spectral fits of 20R1(a) required theinclusion of weak Heisenberg exchange, indicative of weakinteraction between the nitroxide spins (see below). A weakerinteraction compared to 23R1(a) is indeed expected on thebasis of the crystal structure, because the putative helicalsegments diverge spatially from residue 23 to residue 20 (seeFigure 3). As mentioned above, 27R1(a) did not form dimersand could not be tested for spin-spin interaction.
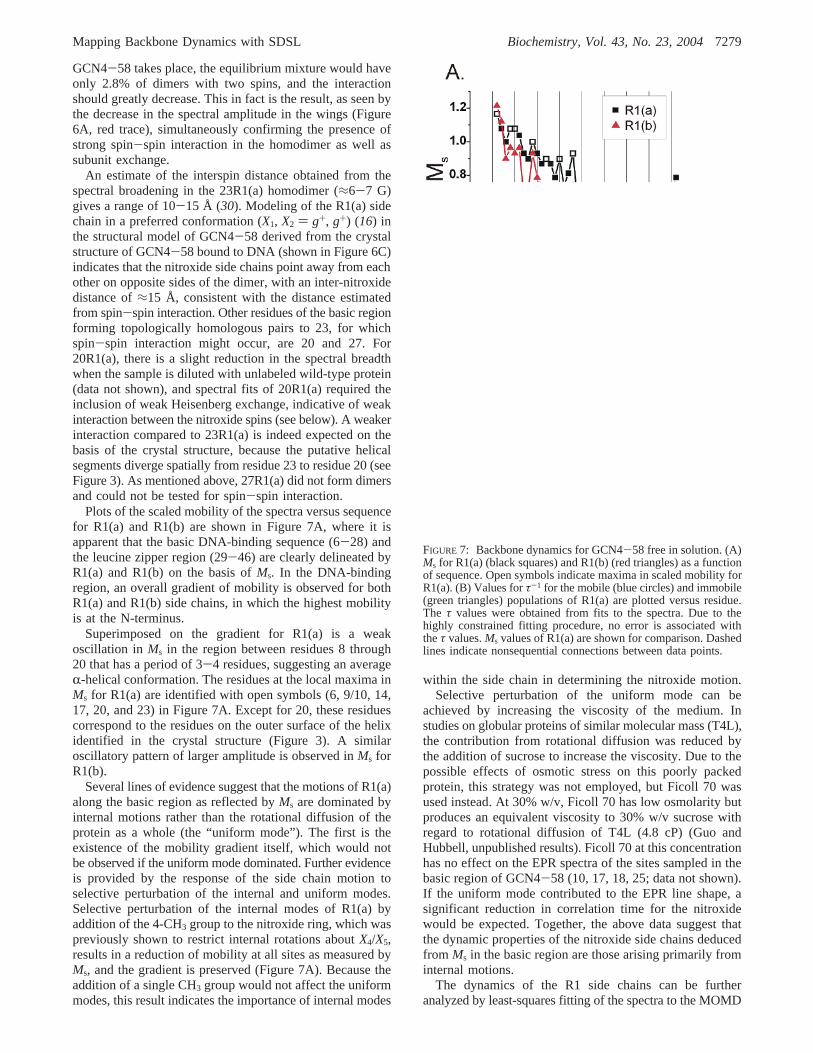
Plots of the scaled mobility of the spectra versus sequencefor R1(a) and R1(b) are shown in Figure 7A, where it isapparent that the basic DNA-binding sequence (6-28) andthe leucine zipper region (29-46) are clearly delineated byR1(a) and R1(b) on the basis ofMs. In the DNA-bindingregion, an overall gradient of mobility is observed for bothR1(a) and R1(b) side chains, in which the highest mobilityis at the N-terminus.
Superimposed on the gradient for R1(a) is a weakoscillation inMs in the region between residues 8 through20 that has a period of 3-4 residues, suggesting an averageR-helical conformation. The residues at the local maxima inMs for R1(a) are identified with open symbols (6, 9/10, 14,17, 20, and 23) in Figure 7A. Except for 20, these residuescorrespond to the residues on the outer surface of the helixidentified in the crystal structure (Figure 3). A similaroscillatory pattern of larger amplitude is observed inMs forR1(b).
Several lines of evidence suggest that the motions of R1(a)along the basic region as reflected byMs are dominated byinternal motions rather than the rotational diffusion of theprotein as a whole (the “uniform mode”). The first is theexistence of the mobility gradient itself, which would notbe observed if the uniform mode dominated. Further evidenceis provided by the response of the side chain motion toselective perturbation of the internal and uniform modes.Selective perturbation of the internal modes of R1(a) byaddition of the 4-CH3 group to the nitroxide ring, which waspreviously shown to restrict internal rotations aboutX4/X5,results in a reduction of mobility at all sites as measured byMs, and the gradient is preserved (Figure 7A). Because theaddition of a single CH3 group would not affect the uniformmodes, this result indicates the importance of internal modes
within the side chain in determining the nitroxide motion.Selective perturbation of the uniform mode can be
achieved by increasing the viscosity of the medium. Instudies on globular proteins of similar molecular mass (T4L),the contribution from rotational diffusion was reduced bythe addition of sucrose to increase the viscosity. Due to thepossible effects of osmotic stress on this poorly packedprotein, this strategy was not employed, but Ficoll 70 wasused instead. At 30% w/v, Ficoll 70 has low osmolarity butproduces an equivalent viscosity to 30% w/v sucrose withregard to rotational diffusion of T4L (4.8 cP) (Guo andHubbell, unpublished results). Ficoll 70 at this concentrationhas no effect on the EPR spectra of the sites sampled in thebasic region of GCN4-58 (10, 17, 18, 25; data not shown).If the uniform mode contributed to the EPR line shape, asignificant reduction in correlation time for the nitroxidewould be expected. Together, the above data suggest thatthe dynamic properties of the nitroxide side chains deducedfrom Ms in the basic region are those arising primarily frominternal motions.
The dynamics of the R1 side chains can be furtheranalyzed by least-squares fitting of the spectra to the MOMD
FIGURE 7: Backbone dynamics for GCN4-58 free in solution. (A)Ms for R1(a) (black squares) and R1(b) (red triangles) as a functionof sequence. Open symbols indicate maxima in scaled mobility forR1(a). (B) Values forτ-1 for the mobile (blue circles) and immobile(green triangles) populations of R1(a) are plotted versus residue.The τ values were obtained from fits to the spectra. Due to thehighly constrained fitting procedure, no error is associated withtheτ values.Ms values of R1(a) are shown for comparison. Dashedlines indicate nonsequential connections between data points.
Mapping Backbone Dynamics with SDSL Biochemistry, Vol. 43, No. 23, 20047279
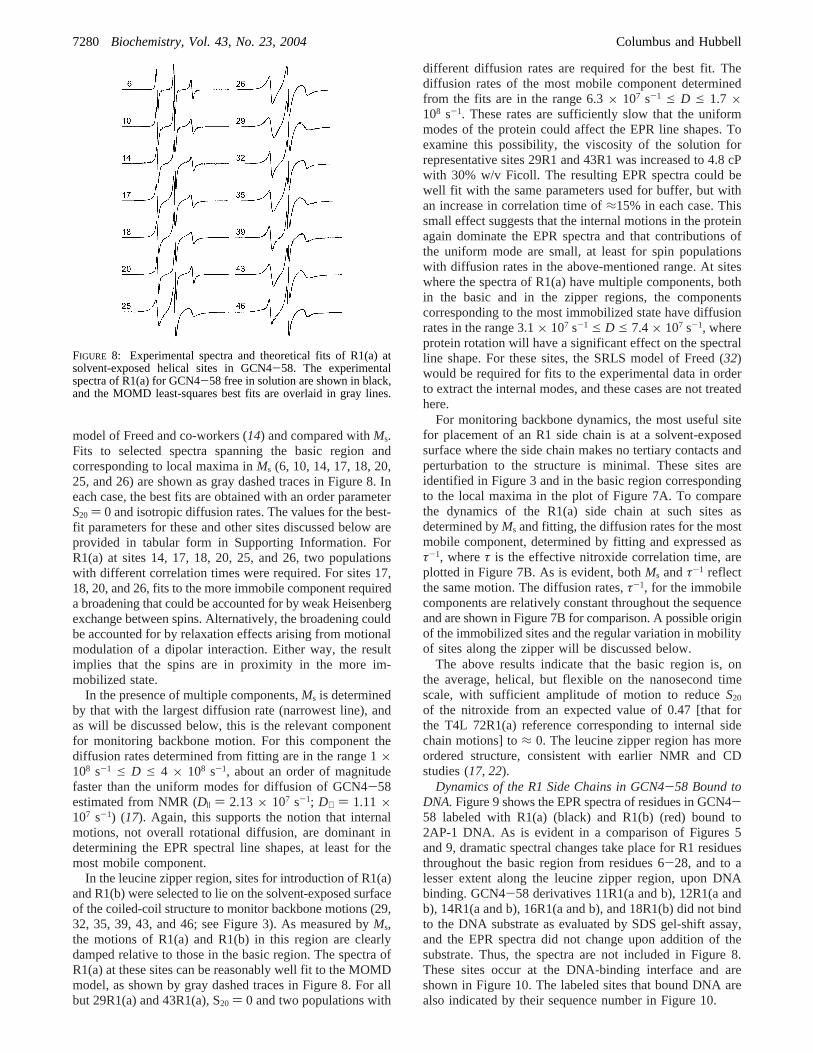
model of Freed and co-workers (14) and compared withMs.Fits to selected spectra spanning the basic region andcorresponding to local maxima inMs (6, 10, 14, 17, 18, 20,25, and 26) are shown as gray dashed traces in Figure 8. Ineach case, the best fits are obtained with an order parameterS20 ) 0 and isotropic diffusion rates. The values for the best-fit parameters for these and other sites discussed below areprovided in tabular form in Supporting Information. ForR1(a) at sites 14, 17, 18, 20, 25, and 26, two populationswith different correlation times were required. For sites 17,18, 20, and 26, fits to the more immobile component requireda broadening that could be accounted for by weak Heisenbergexchange between spins. Alternatively, the broadening couldbe accounted for by relaxation effects arising from motionalmodulation of a dipolar interaction. Either way, the resultimplies that the spins are in proximity in the more im-mobilized state.
In the presence of multiple components,Ms is determinedby that with the largest diffusion rate (narrowest line), andas will be discussed below, this is the relevant componentfor monitoring backbone motion. For this component thediffusion rates determined from fitting are in the range 1×10⁸ s-1 e D e 4 × 10⁸ s-1, about an order of magnitudefaster than the uniform modes for diffusion of GCN4-58estimated from NMR (D| ) 2.13× 10⁷ s-1; D⊥ ) 1.11×10⁷ s-1) (17). Again, this supports the notion that internalmotions, not overall rotational diffusion, are dominant indetermining the EPR spectral line shapes, at least for themost mobile component.
In the leucine zipper region, sites for introduction of R1(a)and R1(b) were selected to lie on the solvent-exposed surfaceof the coiled-coil structure to monitor backbone motions (29,32, 35, 39, 43, and 46; see Figure 3). As measured byMs,the motions of R1(a) and R1(b) in this region are clearlydamped relative to those in the basic region. The spectra ofR1(a) at these sites can be reasonably well fit to the MOMDmodel, as shown by gray dashed traces in Figure 8. For allbut 29R1(a) and 43R1(a), S20 ) 0 and two populations with
different diffusion rates are required for the best fit. Thediffusion rates of the most mobile component determinedfrom the fits are in the range 6.3× 10⁷ s-1 e D e 1.7 ×10⁸ s-1. These rates are sufficiently slow that the uniformmodes of the protein could affect the EPR line shapes. Toexamine this possibility, the viscosity of the solution forrepresentative sites 29R1 and 43R1 was increased to 4.8 cPwith 30% w/v Ficoll. The resulting EPR spectra could bewell fit with the same parameters used for buffer, but withan increase in correlation time of≈15% in each case. Thissmall effect suggests that the internal motions in the proteinagain dominate the EPR spectra and that contributions ofthe uniform mode are small, at least for spin populationswith diffusion rates in the above-mentioned range. At siteswhere the spectra of R1(a) have multiple components, bothin the basic and in the zipper regions, the componentscorresponding to the most immobilized state have diffusionrates in the range 3.1× 10⁷ s-1 e D e 7.4× 10⁷ s-1, whereprotein rotation will have a significant effect on the spectralline shape. For these sites, the SRLS model of Freed (32)would be required for fits to the experimental data in orderto extract the internal modes, and these cases are not treatedhere.
For monitoring backbone dynamics, the most useful sitefor placement of an R1 side chain is at a solvent-exposedsurface where the side chain makes no tertiary contacts andperturbation to the structure is minimal. These sites areidentified in Figure 3 and in the basic region correspondingto the local maxima in the plot of Figure 7A. To comparethe dynamics of the R1(a) side chain at such sites asdetermined byMs and fitting, the diffusion rates for the mostmobile component, determined by fitting and expressed asτ-1, whereτ is the effective nitroxide correlation time, areplotted in Figure 7B. As is evident, bothMs andτ-1 reflectthe same motion. The diffusion rates,τ-1, for the immobilecomponents are relatively constant throughout the sequenceand are shown in Figure 7B for comparison. A possible originof the immobilized sites and the regular variation in mobilityof sites along the zipper will be discussed below.
The above results indicate that the basic region is, onthe average, helical, but flexible on the nanosecond timescale, with sufficient amplitude of motion to reduceS20
of the nitroxide from an expected value of 0.47 [that forthe T4L 72R1(a) reference corresponding to internal sidechain motions] to≈ 0. The leucine zipper region has moreordered structure, consistent with earlier NMR and CDstudies (17, 22).
Dynamics of the R1 Side Chains in GCN4-58 Bound toDNA.Figure 9 shows the EPR spectra of residues in GCN4-58 labeled with R1(a) (black) and R1(b) (red) bound to2AP-1 DNA. As is evident in a comparison of Figures 5and 9, dramatic spectral changes take place for R1 residuesthroughout the basic region from residues 6-28, and to alesser extent along the leucine zipper region, upon DNAbinding. GCN4-58 derivatives 11R1(a and b), 12R1(a andb), 14R1(a and b), 16R1(a and b), and 18R1(b) did not bindto the DNA substrate as evaluated by SDS gel-shift assay,and the EPR spectra did not change upon addition of thesubstrate. Thus, the spectra are not included in Figure 8.These sites occur at the DNA-binding interface and areshown in Figure 10. The labeled sites that bound DNA arealso indicated by their sequence number in Figure 10.
FIGURE 8: Experimental spectra and theoretical fits of R1(a) atsolvent-exposed helical sites in GCN4-58. The experimentalspectra of R1(a) for GCN4-58 free in solution are shown in black,and the MOMD least-squares best fits are overlaid in gray lines.
7280 Biochemistry, Vol. 43, No. 23, 2004 Columbus and Hubbell
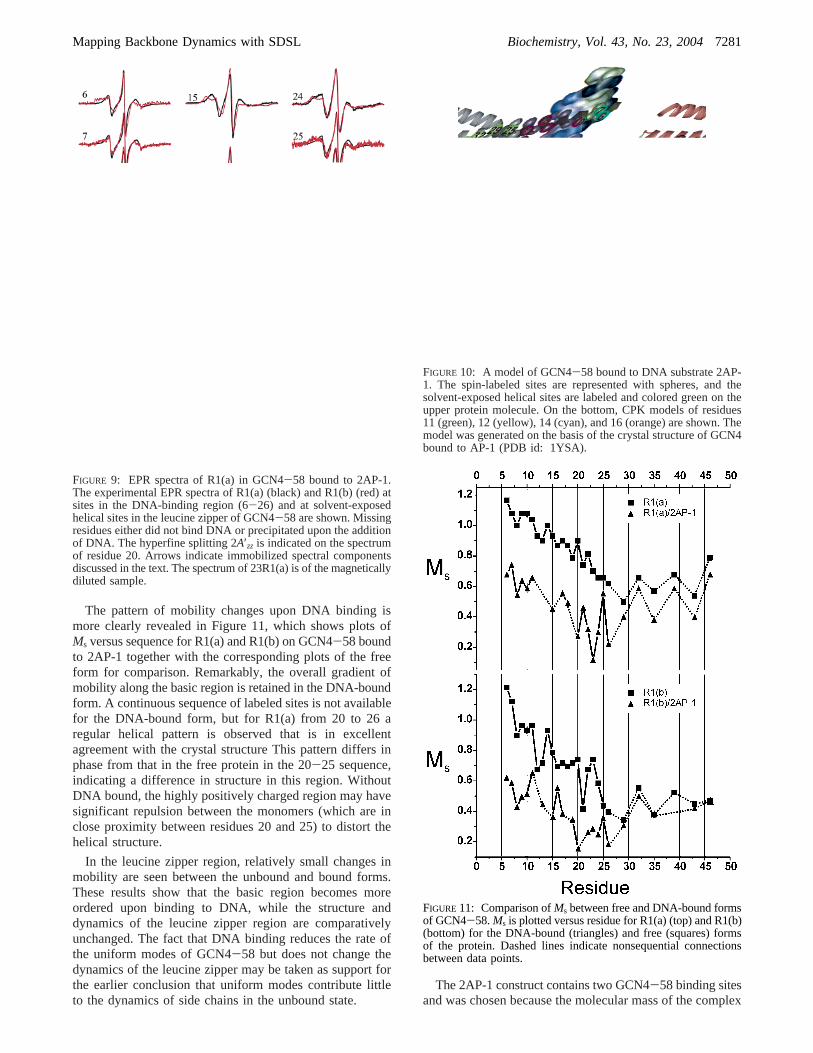
The pattern of mobility changes upon DNA binding ismore clearly revealed in Figure 11, which shows plots ofMs versus sequence for R1(a) and R1(b) on GCN4-58 boundto 2AP-1 together with the corresponding plots of the freeform for comparison. Remarkably, the overall gradient ofmobility along the basic region is retained in the DNA-boundform. A continuous sequence of labeled sites is not availablefor the DNA-bound form, but for R1(a) from 20 to 26 aregular helical pattern is observed that is in excellentagreement with the crystal structure This pattern differs inphase from that in the free protein in the 20-25 sequence,indicating a difference in structure in this region. WithoutDNA bound, the highly positively charged region may havesignificant repulsion between the monomers (which are inclose proximity between residues 20 and 25) to distort thehelical structure.
In the leucine zipper region, relatively small changes inmobility are seen between the unbound and bound forms.These results show that the basic region becomes moreordered upon binding to DNA, while the structure anddynamics of the leucine zipper region are comparativelyunchanged. The fact that DNA binding reduces the rate ofthe uniform modes of GCN4-58 but does not change thedynamics of the leucine zipper may be taken as support forthe earlier conclusion that uniform modes contribute littleto the dynamics of side chains in the unbound state.
The 2AP-1 construct contains two GCN4-58 binding sitesand was chosen because the molecular mass of the complex
FIGURE 9: EPR spectra of R1(a) in GCN4-58 bound to 2AP-1.The experimental EPR spectra of R1(a) (black) and R1(b) (red) atsites in the DNA-binding region (6-26) and at solvent-exposedhelical sites in the leucine zipper of GCN4-58 are shown. Missingresidues either did not bind DNA or precipitated upon the additionof DNA. The hyperfine splitting 2A′zz is indicated on the spectrumof residue 20. Arrows indicate immobilized spectral componentsdiscussed in the text. The spectrum of 23R1(a) is of the magneticallydiluted sample.
FIGURE 10: A model of GCN4-58 bound to DNA substrate 2AP-1. The spin-labeled sites are represented with spheres, and thesolvent-exposed helical sites are labeled and colored green on theupper protein molecule. On the bottom, CPK models of residues11 (green), 12 (yellow), 14 (cyan), and 16 (orange) are shown. Themodel was generated on the basis of the crystal structure of GCN4bound to AP-1 (PDB id: 1YSA).
FIGURE 11: Comparison ofMs between free and DNA-bound formsof GCN4-58.Ms is plotted versus residue for R1(a) (top) and R1(b)(bottom) for the DNA-bound (triangles) and free (squares) formsof the protein. Dashed lines indicate nonsequential connectionsbetween data points.
Mapping Backbone Dynamics with SDSL Biochemistry, Vol. 43, No. 23, 20047281
is high (≈50 kDa); hence, the correlation time of the complexis expected to be slow on the EPR time scale, and onlyinternal motions of the side chain and backbone fluctuationsshould contribute to the EPR spectra. A lower limit to thecorrelation time of the complex can be determined using theEPR spectrum of 20R1(b). This side chain is buried in theinterior of the complex (in agreement with the crystalstructure) and, therefore, immobilized relative to the protein.Using a Brownian diffusion model and the measured 2A′zz
(labeled in Figure 9), the correlation time of the nitroxideof 20R1(b) is estimated to be 16.8 ns (28). This value issimilar to that calculated from the Stokes-Einstein equationfor a sphere of equivalent mass (16.5 ns).
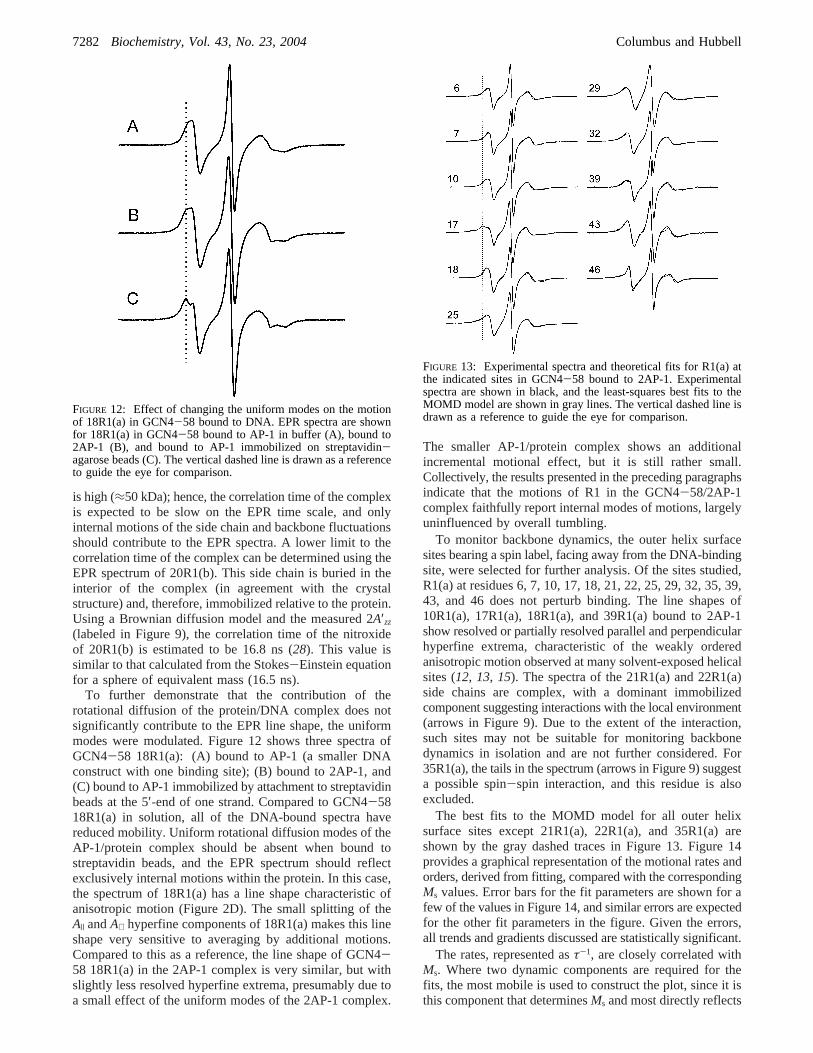
To further demonstrate that the contribution of therotational diffusion of the protein/DNA complex does notsignificantly contribute to the EPR line shape, the uniformmodes were modulated. Figure 12 shows three spectra ofGCN4-58 18R1(a): (A) bound to AP-1 (a smaller DNAconstruct with one binding site); (B) bound to 2AP-1, and(C) bound to AP-1 immobilized by attachment to streptavidinbeads at the 5′-end of one strand. Compared to GCN4-5818R1(a) in solution, all of the DNA-bound spectra havereduced mobility. Uniform rotational diffusion modes of theAP-1/protein complex should be absent when bound tostreptavidin beads, and the EPR spectrum should reflectexclusively internal motions within the protein. In this case,the spectrum of 18R1(a) has a line shape characteristic ofanisotropic motion (Figure 2D). The small splitting of theA| andA⊥ hyperfine components of 18R1(a) makes this lineshape very sensitive to averaging by additional motions.Compared to this as a reference, the line shape of GCN4-58 18R1(a) in the 2AP-1 complex is very similar, but withslightly less resolved hyperfine extrema, presumably due toa small effect of the uniform modes of the 2AP-1 complex.
The smaller AP-1/protein complex shows an additionalincremental motional effect, but it is still rather small.Collectively, the results presented in the preceding paragraphsindicate that the motions of R1 in the GCN4-58/2AP-1complex faithfully report internal modes of motions, largelyuninfluenced by overall tumbling.
To monitor backbone dynamics, the outer helix surfacesites bearing a spin label, facing away from the DNA-bindingsite, were selected for further analysis. Of the sites studied,R1(a) at residues 6, 7, 10, 17, 18, 21, 22, 25, 29, 32, 35, 39,43, and 46 does not perturb binding. The line shapes of10R1(a), 17R1(a), 18R1(a), and 39R1(a) bound to 2AP-1show resolved or partially resolved parallel and perpendicularhyperfine extrema, characteristic of the weakly orderedanisotropic motion observed at many solvent-exposed helicalsites (12, 13, 15). The spectra of the 21R1(a) and 22R1(a)side chains are complex, with a dominant immobilizedcomponent suggesting interactions with the local environment(arrows in Figure 9). Due to the extent of the interaction,such sites may not be suitable for monitoring backbonedynamics in isolation and are not further considered. For35R1(a), the tails in the spectrum (arrows in Figure 9) suggesta possible spin-spin interaction, and this residue is alsoexcluded.
The best fits to the MOMD model for all outer helixsurface sites except 21R1(a), 22R1(a), and 35R1(a) areshown by the gray dashed traces in Figure 13. Figure 14provides a graphical representation of the motional rates andorders, derived from fitting, compared with the correspondingMs values. Error bars for the fit parameters are shown for afew of the values in Figure 14, and similar errors are expectedfor the other fit parameters in the figure. Given the errors,all trends and gradients discussed are statistically significant.
The rates, represented asτ-1, are closely correlated withMs. Where two dynamic components are required for thefits, the most mobile is used to construct the plot, since it isthis component that determinesMs and most directly reflects
FIGURE 12: Effect of changing the uniform modes on the motionof 18R1(a) in GCN4-58 bound to DNA. EPR spectra are shownfor 18R1(a) in GCN4-58 bound to AP-1 in buffer (A), bound to2AP-1 (B), and bound to AP-1 immobilized on streptavidin-agarose beads (C). The vertical dashed line is drawn as a referenceto guide the eye for comparison.
FIGURE 13: Experimental spectra and theoretical fits for R1(a) atthe indicated sites in GCN4-58 bound to 2AP-1. Experimentalspectra are shown in black, and the least-squares best fits to theMOMD model are shown in gray lines. The vertical dashed line isdrawn as a reference to guide the eye for comparison.
7282 Biochemistry, Vol. 43, No. 23, 2004 Columbus and Hubbell
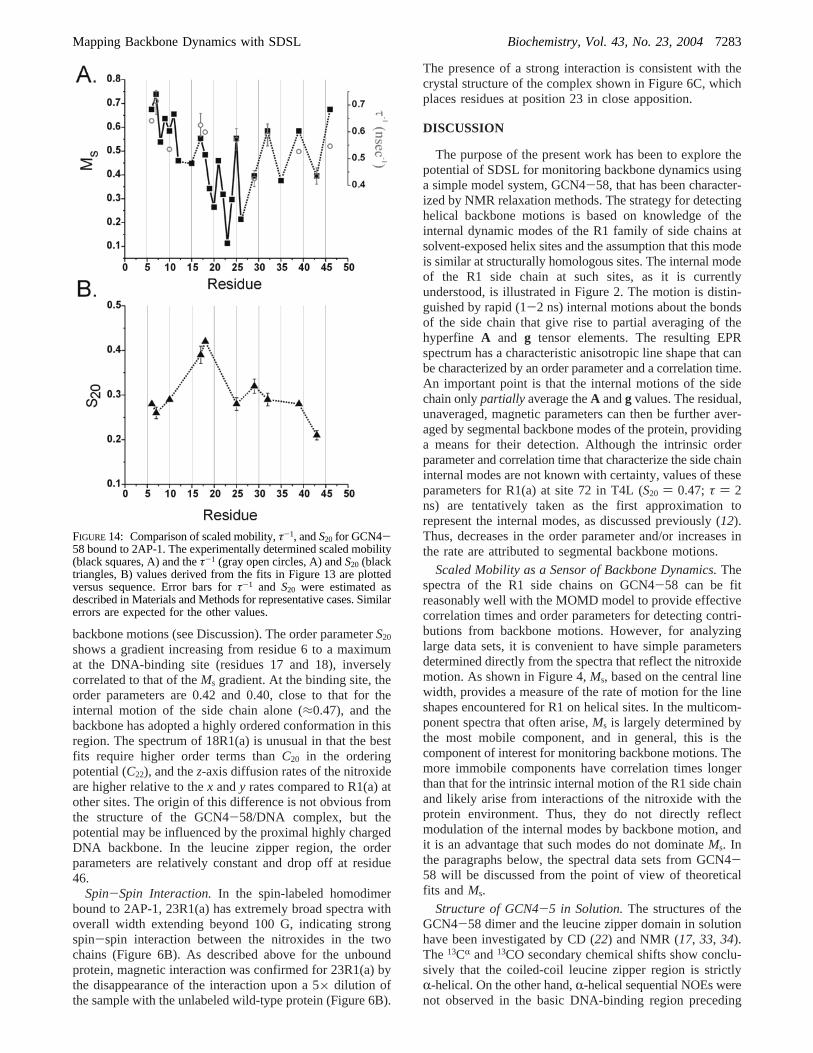
backbone motions (see Discussion). The order parameterS20
shows a gradient increasing from residue 6 to a maximumat the DNA-binding site (residues 17 and 18), inverselycorrelated to that of theMs gradient. At the binding site, theorder parameters are 0.42 and 0.40, close to that for theinternal motion of the side chain alone (≈0.47), and thebackbone has adopted a highly ordered conformation in thisregion. The spectrum of 18R1(a) is unusual in that the bestfits require higher order terms thanC20 in the orderingpotential (C22), and thez-axis diffusion rates of the nitroxideare higher relative to thex andy rates compared to R1(a) atother sites. The origin of this difference is not obvious fromthe structure of the GCN4-58/DNA complex, but thepotential may be influenced by the proximal highly chargedDNA backbone. In the leucine zipper region, the orderparameters are relatively constant and drop off at residue46.
Spin-Spin Interaction.In the spin-labeled homodimerbound to 2AP-1, 23R1(a) has extremely broad spectra withoverall width extending beyond 100 G, indicating strongspin-spin interaction between the nitroxides in the twochains (Figure 6B). As described above for the unboundprotein, magnetic interaction was confirmed for 23R1(a) bythe disappearance of the interaction upon a 5× dilution ofthe sample with the unlabeled wild-type protein (Figure 6B).
The presence of a strong interaction is consistent with thecrystal structure of the complex shown in Figure 6C, whichplaces residues at position 23 in close apposition.
DISCUSSION
The purpose of the present work has been to explore thepotential of SDSL for monitoring backbone dynamics usinga simple model system, GCN4-58, that has been character-ized by NMR relaxation methods. The strategy for detectinghelical backbone motions is based on knowledge of theinternal dynamic modes of the R1 family of side chains atsolvent-exposed helix sites and the assumption that this modeis similar at structurally homologous sites. The internal modeof the R1 side chain at such sites, as it is currentlyunderstood, is illustrated in Figure 2. The motion is distin-guished by rapid (1-2 ns) internal motions about the bondsof the side chain that give rise to partial averaging of thehyperfine A and g tensor elements. The resulting EPRspectrum has a characteristic anisotropic line shape that canbe characterized by an order parameter and a correlation time.An important point is that the internal motions of the sidechain onlypartially average theA andg values. The residual,unaveraged, magnetic parameters can then be further aver-aged by segmental backbone modes of the protein, providinga means for their detection. Although the intrinsic orderparameter and correlation time that characterize the side chaininternal modes are not known with certainty, values of theseparameters for R1(a) at site 72 in T4L (S20 ) 0.47; τ ) 2ns) are tentatively taken as the first approximation torepresent the internal modes, as discussed previously (12).Thus, decreases in the order parameter and/or increases inthe rate are attributed to segmental backbone motions.
Scaled Mobility as a Sensor of Backbone Dynamics.Thespectra of the R1 side chains on GCN4-58 can be fitreasonably well with the MOMD model to provide effectivecorrelation times and order parameters for detecting contri-butions from backbone motions. However, for analyzinglarge data sets, it is convenient to have simple parametersdetermined directly from the spectra that reflect the nitroxidemotion. As shown in Figure 4,Ms, based on the central linewidth, provides a measure of the rate of motion for the lineshapes encountered for R1 on helical sites. In the multicom-ponent spectra that often arise,Ms is largely determined bythe most mobile component, and in general, this is thecomponent of interest for monitoring backbone motions. Themore immobile components have correlation times longerthan that for the intrinsic internal motion of the R1 side chainand likely arise from interactions of the nitroxide with theprotein environment. Thus, they do not directly reflectmodulation of the internal modes by backbone motion, andit is an advantage that such modes do not dominateMs. Inthe paragraphs below, the spectral data sets from GCN4-58 will be discussed from the point of view of theoreticalfits andMs.
Structure of GCN4-5 in Solution.The structures of theGCN4-58 dimer and the leucine zipper domain in solutionhave been investigated by CD (22) and NMR (17, 33, 34).The 13CR and13CO secondary chemical shifts show conclu-sively that the coiled-coil leucine zipper region is strictlyR-helical. On the other hand,R-helical sequential NOEs werenot observed in the basic DNA-binding region preceding
FIGURE 14: Comparison of scaled mobility,τ-1, andS20 for GCN4-58 bound to 2AP-1. The experimentally determined scaled mobility(black squares, A) and theτ-1 (gray open circles, A) andS20 (blacktriangles, B) values derived from the fits in Figure 13 are plottedversus sequence. Error bars forτ-1 and S20 were estimated asdescribed in Materials and Methods for representative cases. Similarerrors are expected for the other values.
Mapping Backbone Dynamics with SDSL Biochemistry, Vol. 43, No. 23, 20047283
residue 25, eliminating the possibility that stable helices exist.Nevertheless, intermediate positive13CR and13CO secondarychemical shifts in the DNA-binding region suggest thatR-helical conformations are preferentially populated, leadingto the conclusion that the basic region is an ensemble ofnascent helices and interconversion between the helical statesoccurs on time scales faster than microseconds.
In the spin-labeled protein, the weak periodic modulationof Ms with a period of 3-4 residues along the continuousseries of sites in the basic region likely reflects the presenceof a helical structure (Figure 7), although the depth ofmodulation is far less than observed for helices in well-packed proteins (10). In addition, the strong spin-spininteraction between residues at position 23, and the weakerinteraction between those at position 24, also supports thehelical configuration in this region. These results are not atodds with the view that GCN4-58 in solution is a collectionof rapidly exchanging conformations with a helical prefer-ence. If conformations in an equilibrium mixture havelifetimes of ≈10-7 s or longer, EPR spectra characteristicof each state will be observed in proportion to the abundanceof that state. The existence of two dynamic populations ofthe R1(a) side chain at many sites in the basic region mayin fact arise from GCN4-58 conformers that are exchangingon this time scale. If so, one conformer is characterized byrelatively low and constant R1(a) mobility along the basicregion (Figure 7B, green trace) and weak Heisenbergexchange between some of the R1(a) residues in thehomodimer. These features suggest a relatively condensedstructure with intramolecular interactions between the mono-mers along the basic region. The other conformer ischaracterized by the most mobile state of the side chain witha mobility gradient along the basic region. Alternatively, thetwo dynamic populations of R1(a) could correspond todifferent rotamers of the R1(a) side chain, one of which haslocal intramolecular interactions that give rise to the moreimmobilized population. Irrespective of the origin of theimmobilized population, it is the most mobile populationmeasured byMs that is analyzed in the current study anddiscussed below.
Backbone Dynamics of GCN4-58: Comparison betweenNMR and SDSL Data.Backbone dynamics of GCN4-58have been investigated by reduced spectral density mappingof 15N relaxation data on GCN4-58 in solution (17). Thedata revealed a nearly linear decrease in mobility, measuredby J(0.87ωH), from the N-terminus to about residue 29, thefirst residue of the leucine zipper. Throughout the leucinezipper region (29-52) J(0.87ωH) was high and essentiallyconstant. The spectral densityJ(0.87ωH) depends stronglyon 1- S2
NH, whereSNH is the order parameter for motion ofthe backbone NH bond vector. Thus, the ordering of thebackbone motion increases regularly from the N-terminusthrough the basic region. In the leucine zipper region,S2
NH
was found to be≈0.91, typical of ordered helices in otherproteins. At a temperature of 290 K, near the temperaturewhere the EPR spectra were recorded in the present experi-ments, the spectral densityJ(ωN) varied strongly withsequence position along the basic region but was againconstant in the leucine zipper. This result suggests asequence-dependent variation of the rates as well as the orderof motion through the basic region, but not in the leucinezipper (17).
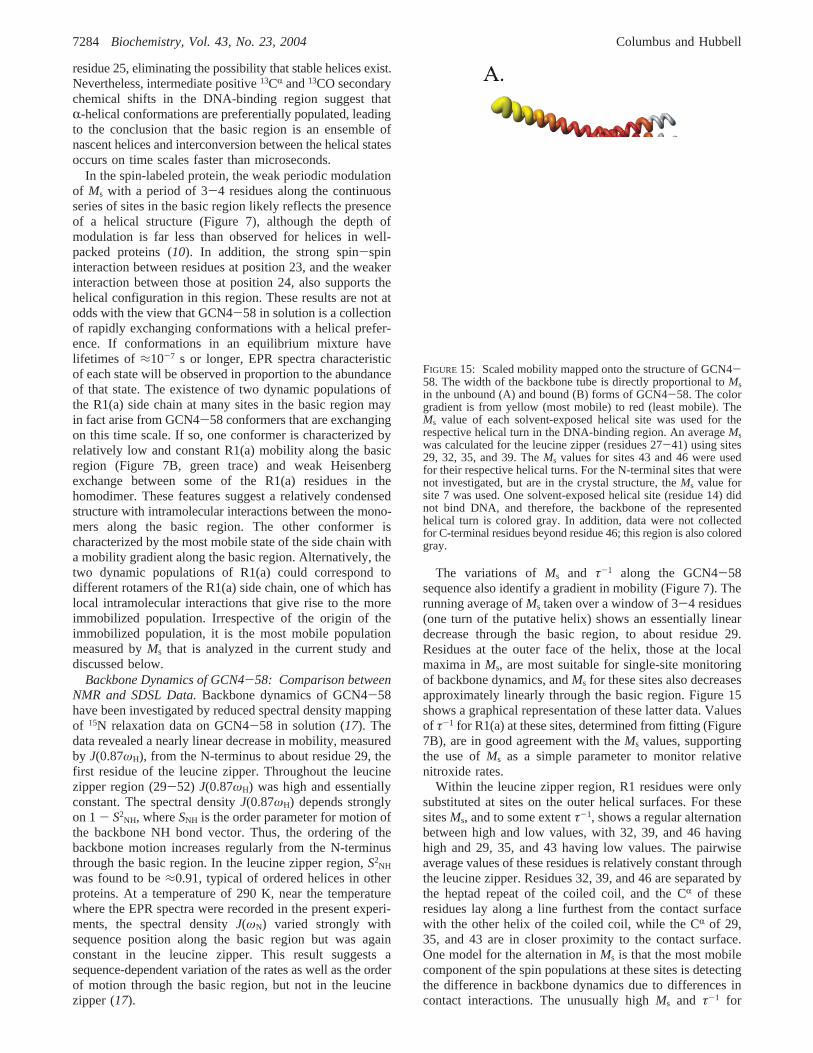
The variations ofMs and τ-1 along the GCN4-58sequence also identify a gradient in mobility (Figure 7). Therunning average ofMs taken over a window of 3-4 residues(one turn of the putative helix) shows an essentially lineardecrease through the basic region, to about residue 29.Residues at the outer face of the helix, those at the localmaxima inMs, are most suitable for single-site monitoringof backbone dynamics, andMs for these sites also decreasesapproximately linearly through the basic region. Figure 15shows a graphical representation of these latter data. Valuesof τ-1 for R1(a) at these sites, determined from fitting (Figure7B), are in good agreement with theMs values, supportingthe use ofMs as a simple parameter to monitor relativenitroxide rates.
Within the leucine zipper region, R1 residues were onlysubstituted at sites on the outer helical surfaces. For thesesitesMs, and to some extentτ-1, shows a regular alternationbetween high and low values, with 32, 39, and 46 havinghigh and 29, 35, and 43 having low values. The pairwiseaverage values of these residues is relatively constant throughthe leucine zipper. Residues 32, 39, and 46 are separated bythe heptad repeat of the coiled coil, and the CR of theseresidues lay along a line furthest from the contact surfacewith the other helix of the coiled coil, while the CR of 29,35, and 43 are in closer proximity to the contact surface.One model for the alternation inMs is that the most mobilecomponent of the spin populations at these sites is detectingthe difference in backbone dynamics due to differences incontact interactions. The unusually highMs and τ-1 for
FIGURE 15: Scaled mobility mapped onto the structure of GCN4-58. The width of the backbone tube is directly proportional toMsin the unbound (A) and bound (B) forms of GCN4-58. The colorgradient is from yellow (most mobile) to red (least mobile). TheMs value of each solvent-exposed helical site was used for therespective helical turn in the DNA-binding region. An averageMswas calculated for the leucine zipper (residues 27-41) using sites29, 32, 35, and 39. TheMs values for sites 43 and 46 were usedfor their respective helical turns. For the N-terminal sites that werenot investigated, but are in the crystal structure, theMs value forsite 7 was used. One solvent-exposed helical site (residue 14) didnot bind DNA, and therefore, the backbone of the representedhelical turn is colored gray. In addition, data were not collectedfor C-terminal residues beyond residue 46; this region is also coloredgray.
7284 Biochemistry, Vol. 43, No. 23, 2004 Columbus and Hubbell
46R1(a) reflects the presence of a highly mobile population(≈32%) that could arise from a local unfolding due to theproximity of the C-terminus, which is known to be unfolded(residues 54-58) (17).
At all residues in the basic and leucine zipper regions,the spectra of R1(a) can be reasonably well fit without anordering potential, i.e., with isotropic motion. Thus, it is notpossible to examine the sequence dependence of the orderparameter using R1(a). This situation is due to the fact thatrapid internal motions within the side chain lead to extensiveaveraging of theA and g tensors, and relatively littleadditional mobility from backbone motions is needed toeffectively average the residual anisotropy. One solution tothis problem is to reduce the amplitude of the intrinsicinternal side chain motions by addition of a substituent onthe 4-position of the nitroxide ring (12), thus extending thedynamic range for detection. For this reason, R1(b) was alsoinvestigated in the present study. The 4-CH3 group of R1(b)increases the intrinsic order parameter for the internal motionfrom S20 ) 0.47 for R1(a) toS20 ) 0.81. However, forresidues 6-20 in the basic region of free GCN4-58, theresidual anisotropy is still effectively averaged, and the lineshapes remain essentially isotropic. Approximate simulationsbased on the effective Hamiltonian model for R1 motion (35)suggest that nanosecond backbone motions with an orderparameter ofS20 e 0.2 are required to reduce the internalorder parameter from 0.81 to effectively 0. The NMR-basedorder parameters for the NH bond motion in this same regionareS20 e 0.6, but it must be recalled that motions involvingrotations about the NH bond axis (axial helix rocking) arenot detected in the NMR experiment, while such motionsare effective in producing spectral averaging of R1 (13).Thus, estimated order parameters for backbone motionsderived from motions of R1(a) will in general be less thanthose determined from15N-H relaxation experiments.
Within the leucine zipper region, addition of the 4-CH3
group has the desired effect, and spectral line shapescharacteristic of anisotropic motion are observed. As always,analysis of such spectra in terms of backbone dynamicsrequires that the nitroxide not make interactions with theenvironment. This limits the use of the 4-substituted deriva-tives, because the substituent itself provides additionalopportunities for such interaction, as is evident in many ofthe spectra in Figures 5 and 9. Future development of spinlabels with highly hindered internal modes without additionalinteractions should greatly improve measurement of dynamicdisorder due to backbone motions. However, the line shapesof 29R1(b) and 35R1(b) suggest simple noninteracting states.Fitting of the 29R1(b) and 35R1(b) spectra provides effectiveorder parameters of 0.28 and 0.47, respectively (Figure 16).The additional motion that reduces the order parameter forthe intrinsic internal motion from 0.81 to the above valuesis a quantitative measure of the amplitude of backbonemotions, along with a minor contribution from the uniformrotational modes of the protein.
Structure and Dynamics of GCN4-58 Bound to DNA.Notsurprisingly, substitution of the native residue by the spinlabel at several sites within the binding domain perturbs theinteraction, and it was not possible to obtain continuoussequences for secondary structure determination. However,for the permissive sites in the continuous sequence 20-26,two turns of a regular helix are clearly identified with R1(a)
by a much greater depth of modulation ofMs than forunbound GCN4-58 (Figure 11). The data are in excellentagreement with the orientation of this segment predicted bythe crystal structure of the complex (18, 19). In addition,strong spin-spin interaction is observed between residuesat site 23 in the pure spin-labeled homodimer, as would bepredicted by their proximity in the crystal structure.
Upon binding to the 2AP-1 DNA substrate,Ms dropssharply at sites throughout the basic region, but not in theleucine zipper, indicating that backbone dynamic modes aredamped in the binding domain (Figures 11 and 15). Remark-ably, a gradient of mobility is retained through the DNA-binding region, indicating significant internal flexibility ofparts of the helical “fingers” even when bound to substrate.
In the DNA-bound state, motions are sufficiently dampedthat the nitroxide residual anisotropies are not completelyaveraged, and fits to the spectra requireS20 > 0. As shownin Figure 14A, the rates of motion determined from the fits(τ-1) agree rather well withMs. The order parameters, shownin Figure 14B, rise steadily from the N-terminus to the DNA-binding sites, where the order is a maximum (sites 17 and18). The order parameter is relatively constant through theleucine zipper but drops significantly from sites 39 to 46,suggesting some “fraying” near the end of the coiled coil.In the crystal structure, a gradient in CR B-factors consistentwith the Ms gradient is observed from the N-terminus toresidue 17 and from residue 49 to the C-terminus.
The EPR line shapes obtained from MOMD fits for thesolvent-exposed helical sites in the bound state also directlyreveal the gradient in mobility in the DNA-binding region(Figure 13). Within the basic region, the regular increase incentral line width (peak to peak) from 7R1(a) to 17R1(a)reflects a decrease in rate. The apparent increase in widthof the low-field resonance line from 7R1(a) to 10R1(a)reflects an increased separation of unresolvedA| and A⊥
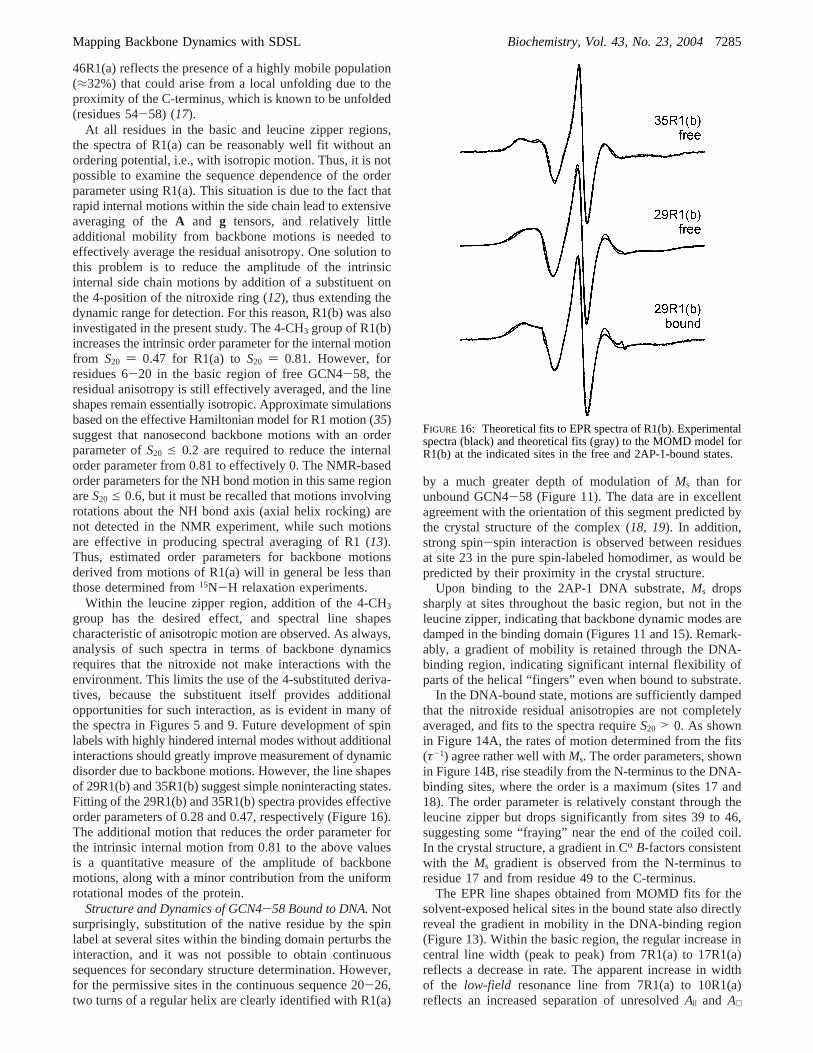
FIGURE 16: Theoretical fits to EPR spectra of R1(b). Experimentalspectra (black) and theoretical fits (gray) to the MOMD model forR1(b) at the indicated sites in the free and 2AP-1-bound states.
Mapping Backbone Dynamics with SDSL Biochemistry, Vol. 43, No. 23, 20047285
hyperfine extrema due to an increase inS20. Only at 17R1(a)is the order sufficiently high to resolve the two components.The spectrum of 18R1(a) cannot be directly comparedbecause of the unusual anisotropic motion at this site. Withinthe leucine zipper region, the spectra of 25-43 are relativelysimilar, reflecting the similar degrees of order. However, thealternation of central line widths in the region 29-46 thatreflects the mobility alternation of Figure 14 is evident, asis the high mobility of 46R1(a).
Residue 29R1(b) affords an opportunity to compare theorder parameters in the leucine zipper region in the free andbound states. The spectra for the bound and unbound statesof 29R1(b) and the corresponding fits are shown in Figure16. In solution, 29R1(b) hasτ ) 3.4 ns andS20 ) 0.28. Thefit to the same residue, when bound to DNA, givesτ ) 3.4ns andS20 ) 0.33. Thus, there is only a slight increase inorder at the beginning of the zipper domain due to DNAbinding.
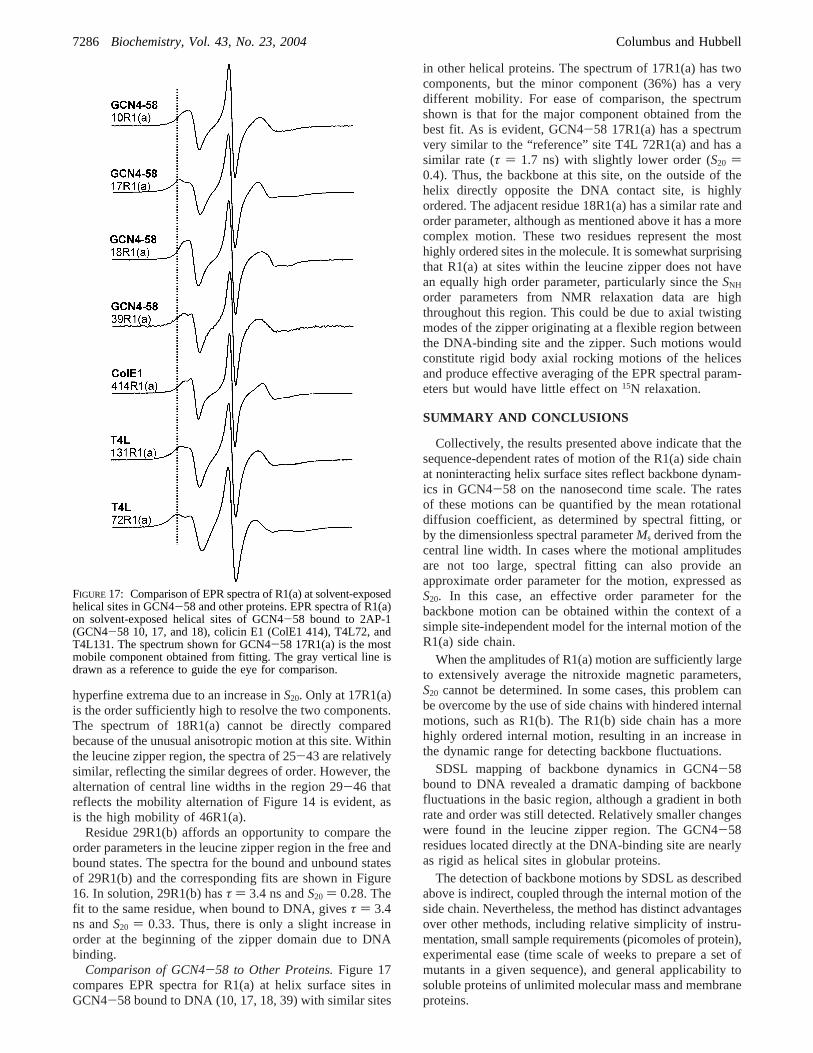
Comparison of GCN4-58 to Other Proteins.Figure 17compares EPR spectra for R1(a) at helix surface sites inGCN4-58 bound to DNA (10, 17, 18, 39) with similar sites
in other helical proteins. The spectrum of 17R1(a) has twocomponents, but the minor component (36%) has a verydifferent mobility. For ease of comparison, the spectrumshown is that for the major component obtained from thebest fit. As is evident, GCN4-58 17R1(a) has a spectrumvery similar to the “reference” site T4L 72R1(a) and has asimilar rate (τ ) 1.7 ns) with slightly lower order (S20 )0.4). Thus, the backbone at this site, on the outside of thehelix directly opposite the DNA contact site, is highlyordered. The adjacent residue 18R1(a) has a similar rate andorder parameter, although as mentioned above it has a morecomplex motion. These two residues represent the mosthighly ordered sites in the molecule. It is somewhat surprisingthat R1(a) at sites within the leucine zipper does not havean equally high order parameter, particularly since theSNH
order parameters from NMR relaxation data are highthroughout this region. This could be due to axial twistingmodes of the zipper originating at a flexible region betweenthe DNA-binding site and the zipper. Such motions wouldconstitute rigid body axial rocking motions of the helicesand produce effective averaging of the EPR spectral param-eters but would have little effect on15N relaxation.
SUMMARY AND CONCLUSIONS
Collectively, the results presented above indicate that thesequence-dependent rates of motion of the R1(a) side chainat noninteracting helix surface sites reflect backbone dynam-ics in GCN4-58 on the nanosecond time scale. The ratesof these motions can be quantified by the mean rotationaldiffusion coefficient, as determined by spectral fitting, orby the dimensionless spectral parameterMs derived from thecentral line width. In cases where the motional amplitudesare not too large, spectral fitting can also provide anapproximate order parameter for the motion, expressed asS20. In this case, an effective order parameter for thebackbone motion can be obtained within the context of asimple site-independent model for the internal motion of theR1(a) side chain.
When the amplitudes of R1(a) motion are sufficiently largeto extensively average the nitroxide magnetic parameters,S20 cannot be determined. In some cases, this problem canbe overcome by the use of side chains with hindered internalmotions, such as R1(b). The R1(b) side chain has a morehighly ordered internal motion, resulting in an increase inthe dynamic range for detecting backbone fluctuations.
SDSL mapping of backbone dynamics in GCN4-58bound to DNA revealed a dramatic damping of backbonefluctuations in the basic region, although a gradient in bothrate and order was still detected. Relatively smaller changeswere found in the leucine zipper region. The GCN4-58residues located directly at the DNA-binding site are nearlyas rigid as helical sites in globular proteins.
The detection of backbone motions by SDSL as describedabove is indirect, coupled through the internal motion of theside chain. Nevertheless, the method has distinct advantagesover other methods, including relative simplicity of instru-mentation, small sample requirements (picomoles of protein),experimental ease (time scale of weeks to prepare a set ofmutants in a given sequence), and general applicability tosoluble proteins of unlimited molecular mass and membraneproteins.
FIGURE 17: Comparison of EPR spectra of R1(a) at solvent-exposedhelical sites in GCN4-58 and other proteins. EPR spectra of R1(a)on solvent-exposed helical sites of GCN4-58 bound to 2AP-1(GCN4-58 10, 17, and 18), colicin E1 (ColE1 414), T4L72, andT4L131. The spectrum shown for GCN4-58 17R1(a) is the mostmobile component obtained from fitting. The gray vertical line isdrawn as a reference to guide the eye for comparison.
7286 Biochemistry, Vol. 43, No. 23, 2004 Columbus and Hubbell
ACKNOWLEDGMENT
We thank Dr. Arthur G. Palmer, III, for the wild-typeGCN4-58 plasmid; Dr. Christian Altenbach for EPR analysissoftware, scientific discussion, and careful review of themanuscript; Shirley Oga and Mark Fleissner for technicalassistance; and Dr. Cameron Mura for helpful comments onthe manuscript.
SUPPORTING INFORMATION AVAILABLE
Three tables containing fit parameters for GCN4-58,GCN4-58 bound to 2AP-1, and R1(b). This material isavailable free of charge via the Internet at http://pubs.acs.org.
REFERENCES
1. Carr, P. A., Erickson, H. P., and Palmer, A. G. (1997) Backbonedynamics of homologous fibronectin type III cell adhesiondomains from fibronectin and tenascin,Structure 5, 949-959.
2. Ishima, R., and Torchia, D. A. (2000) Protein dynamics fromNMR, Nat. Struct. Biol. 7, 740-743.
3. Zuiderweg, E. R. (2002) Mapping protein-protein interactionsin solution by NMR spectroscopy,Biochemistry 41, 1-7.
4. Wang, C., Pawley, N. H., and Nicholson, L. K. (2001) The roleof backbone motions in ligand binding to the c-Src SH3 domain,J. Mol. Biol. 313, 873-887.
5. Stone, M. J., Gupta, S., Snyder, N., and Regan, L. (2001)Comparison of protein backbone entropy andâ-sheet stability:NMR-derived dynamics of protein G B1 domain mutants,J. Am.Chem. Soc. 123, 185-186.
6. Yang, D., and Kay, L. E. (1996) Contributions to conformationalentropy arising from bond vector fluctuations measured fromNMR-derived order parameters: application to protein folding,J. Mol. Biol. 263, 369-382.
7. Parak, F. G. (2003) Proteins in action: the physics of structuralfluctuations and conformational changes,Curr. Opin. Struct. Biol.13, 552-557.
8. Hammes, G. G. (2002) Multiple conformational changes in enzymecatalyasis,Biochemistry 41, 8221-8228.
9. Gerstein, M., Lesk, A. M., and Chothia, C. (1994) Structuralmechanisms for domain movements in proteins,Biochemistry 33,6739-6749.
10. Hubbell, W. L., Gross, A., Langen, R., and Lietzow, M. A. (1998)Recent advances in site-directed spin labeling of proteins,Curr.Opin. Struct. Biol. 8, 649-656.
11. Hubbell, W. L., Cafiso, D. S., and Altenbach, C. (2000) Identifyingconformational changes with site-directed spin labeling,Nat.Struct. Biol. 7, 735-739.
12. Columbus, L., Kalai, T., Jeko, J., Hideg, K., and Hubbell, W. L.(2001) Molecular motion of spin labeled side chains inR-helices:analysis by variation of side chain structure,Biochemistry 40,3828-3846.
13. Columbus, L., and Hubbell, W. L. (2002) A new spin on proteindynamics,Trends Biochem. Sci. 27, 288-295.
14. Budil, D. E., Lee, S., Saxena, S., and Freed, J. H. (1996) Nonlinear-least-squares analysis of slow-motion EPR spectra in one and twodimensions using a modified Levenberg-Marquardt algorithm,J. Magn. Reson., Ser. A 120, 155-189.
15. Mchaourab, H. S., Lietzow, M. A., Hideg, K., and Hubbell, W.L. (1996) Motion of spin-labeled side chains in T4 lysozyme.correlation with protein structure and dynamics,Biochemistry 35,7692-7704.
16. Langen, R., Oh, K. J., Cascio, D., and Hubbell, W. L. (2000)Crystal structures of spin labeled T4 lysozyme mutants: implica-tions for the interpretation of EPR spectra in terms of structure,Biochemistry 39, 8396-8405.
17. Bracken, C., Carr, P. A., Cavanagh, J., and Palmer, A. G. (1999)Temperature dependence of intramolecular dynamics of the basic
leucine zipper of GCN4: implications for the entropy of associa-tion with DNA, J. Mol. Biol. 285, 2133-2146.
18. Ellenberger, T. E., Brandl, C. J., Struhl, K., and Harrison, S. C.(1992) The GCN4 basic region leucine zipper binds DNA as adimer of uninterrupted alpha helices: crystal structure of theprotein-DNA complex,Cell 71, 1223-1237.
19. Keller, W., Konig, P., and Richmond, T. J. (1995) Crystal structureof a bZIP/DNA complex at 2.2 A: determinants of DNA specificrecognition,J. Mol. Biol. 254, 657-667.
20. Barbato, G., Ikura, M., Kay, L. E., Pastor, R. W., and Bax, A.(1992) Backbone dynamics of calmodulin studied by15Nrelaxation using inverse detected two-dimensional NMR spec-troscopy: the central helix is flexible,Biochemistry 31, 5269-5278.
21. Hill, D. E., Hope, I. A., Macke, J. P., and Struhl, K. (1986)Saturation mutagenesis of the yeast his3 regulatory site: require-ments for transcriptional induction and for binding by GCN4activator protein,Science 234, 451-457.
22. Weiss, M. A., Ellenberger, T., Wobbe, C. R., Lee, J. P., Harrison,S. C., and Struhl, K. (1990) Folding transition in the DNA-bindingdomain of GCN4 on specific binding to DNA,Nature 347, 575-578.
23. Hubbell, W. H., Froncisz, W., and Hyde, J. S. (1987) Continuousand stopped flow EPR Spectrometer based on a loop gap resonator,ReV. Sci. Instrum. 58, 1879-1886.
24. Langen, R., Cai, K., Altenbach, C., Khorana, H. G., and Hubbell,W. L. (1999) Structural features of the C-terminal domain ofbovine rhodopsin: a site-directed spin-labeling study,Biochemistry38, 7918-7924.
25. Bales, B. L. (1989) Inhomogenously broadened spin-label spectra,in Biological Magnetic Resonance: Spin Labeling Theory andApplications(Berliner, L. J., and Reuben, J., Eds.) pp 77-126,Plenum Press, New York.
26. Robinson, B. H., Mailer, C., and Reese, A. W. (1999) Linewidthanalysis of spin labels in liquids I. theory and data analysis,J.Magn. Reson. 138, 199-209.
27. Stone, T. J., Buckman, T., Nordio, P. L., and McConnell, H. M.(1965) Spin-labeled biomolecules,Proc. Natl. Acad. Sci. U.S.A.54, 1010-1017.
28. Freed, J. H. (1976) Theory of slow tumbling ESR spectra fornitroxides, inSpin Labeling Theory and Applications(Berliner,L. J., Ed.) pp 53-132, Academic Press, New York.
29. Alber, T. (1993) How GCN4 binds DNA,Curr. Opin. Struct. Biol.3, 182-184.
30. Altenbach, C., Oh, K. J., Trabanino, R. J., Hideg, K., andHubbell, W. H. (2001) Estimation of interresidue distances in spinlabeled proteins at physiological temperatures: experimentalstrategies and practical limitations,Biochemistry 40, 15471-15482.
31. Mchaourab, H. S., Oh, K. J., Fang, C. J., and Hubbell, W. L. (1997)Conformation of T4 lysozyme in solution. hinge-bending motionand the substrate-induced conformational transition studied by site-directed spin labeling,Biochemistry 36, 307-316.
32. Barnes, J. P., Liang, Z., McHaourab, H. S., Freed, J. H.,and Hubbell, W. L. (1999) A multifrequency electron spinresonance study of T4 lysozyme dynamics,Biophys. J. 76, 3298-3306.
33. Saudek, V., Pasley, H. S., Gibson, T., Gausepohl, H., Frank, R.,and Pastore, A. (1991) Solution structure of the basic regionfrom the transcriptional activator GCN4,Biochemistry 30, 1310-1317.
34. Saudek, V., Pastore, A., Morelli, M. A., Frank, R., Gausepohl,H., and Gibson, T. (1991) The solution structure of a leucine-zipper motif peptide,Protein Eng. 4, 519-529.
35. Griffith, O. H., and Jost, P. C. (1976) Lipid spin labels in biologicalmembranes, inSpin Labeling Theory and Applications(Berliner,L. J., Ed.) pp 454-523, Academic Press, New York.
BI0497906
Mapping Backbone Dynamics with SDSL Biochemistry, Vol. 43, No. 23, 20047287
Related Documents