Oikos 00: 1–14, 2009 doi: 10.1111/j.1600-0706.2009.18284.x
© 2009 The Authors. Journal compilation © 2009 Oikos Subject Editor: José Alexandre Felizola Diniz-Filho. Accepted 16 November 2009
1
The virtual ecologist approach: simulating data and observers
Damaris Zurell, Uta Berger, Juliano S. Cabral, Florian Jeltsch, Christine N. Meynard, Tamara Münkemüller, Nana Nehrbass, Jörn Pagel, Björn Reineking, Boris Schröder and Volker Grimm
D. Zurell ([email protected]) and B. Schröder, Inst. of Geoecology, Univ. of Potsdam, Karl-Liebknecht-Str. 24/25, DE–14476 Potsdam, Germany. BS also at: ZALF e.V., Leibniz-Centre for Agricultural Landscape Research, Soil Landscape Modelling, Eberswalder Straße 84, DE–15374 Müncheberg, Germany. – U. Berger, Inst. of Forest Growth and Computer Sciences, Dresden Univ. of Technology, Pienner Straße 8, DE–01737 Tharandt, Germany. – J. S. Cabral, F. Jeltsch and J. Pagel, Inst. for Biochemistry and Biology, Univ. of Potsdam, Maulbeerallee 2, DE–14469 Potsdam, Germany. – C. N. Meynard, Inst. des Sciences de l’Evolution, Univ. de Montpellier II, UMR CNRS 5554, Place Eugène Bataillon, CC 065, FR–34095 Montpellier Cedex 5, France. – T. Münkemüller, Laboratoire d’Ecologie Alpine, Univ. J. Fourier, UMR CNRS 5553, BP 53, FR–38041 Grenoble Cedex 9, France. – N. Nehrbass and V. Grimm, UFZ, Helmholtz Centre of Environmental Research – UFZ, Dept of Ecological Modelling, Permoserstr. 15, DE–04318 Leipzig, Germany. Present address for NN: Stünz-Mölkauer Weg 18, DE–04318 Leipzig, Germany. – B. Reineking, Biogeographical Modelling, BayCEER, Univ. of Bayreuth, Universitätsstraße 30, DE–95440 Bayreuth, Germany.
Ecologists carry a well-stocked toolbox with a great variety of sampling methods, statistical analyses and modelling tools, and new methods are constantly appearing. Evaluation and optimisation of these methods is crucial to guide method-ological choices. Simulating error-free data or taking high-quality data to qualify methods is common practice. Here, we emphasise the methodology of the ‘virtual ecologist’ (VE) approach where simulated data and observer models are used to mimic real species and how they are ‘virtually’ observed. This virtual data is then subjected to statistical analyses and modelling, and the results are evaluated against the ‘true’ simulated data. The VE approach is an intuitive and powerful evaluation framework that allows a quality assessment of sampling protocols, analyses and modelling tools. It works under controlled conditions as well as under consideration of confounding factors such as animal movement and biased observer behaviour. In this review, we promote the approach as a rigorous research tool, and demonstrate its capabilities and practi-cal relevance. We explore past uses of VE in different ecological research fields, where it mainly has been used to test and improve sampling regimes as well as for testing and comparing models, for example species distribution models. We discuss its benefits as well as potential limitations, and provide some practical considerations for designing VE studies. Finally, research fields are identified for which the approach could be useful in the future. We conclude that VE could foster the integration of theoretical and empirical work and stimulate work that goes far beyond sampling methods, leading to new questions, theories, and better mechanistic understanding of ecological systems.
Models permeate every field in ecology. They have become an indispensable tool for a wide range of tasks, including the understanding of mechanisms, capturing the processes behind the emergence of ecological phenomena, quantify-ing relationships between species presence or abundance and environmental conditions, and forecasting effects of changing environments on broad spatial and temporal scales (DeAngelis and Mooij 2005, Araújo and Rahbek 2006, Thuiller et al. 2008).
There is, however, a further important field of applica-tion of ecological models that so far has not been thoroughly acknowledged in ecological research: evaluating methods for data sampling, analysis and modelling methods by means of virtual data. Here, the idea is to generate virtual data by simulating not only ecological processes, but also the sam-pling processes that are used to collect these data in real-ity and the methodological tools used to analyse them. We propose to call this the ‘virtual ecologist’ (VE) approach (see
Glossary). Th e virtue of this approach is its ability to rigor-The virtue of this approach is its ability to rigor-ously test method performance against a known truth. Th e VE approach is concerned with practical questions regard-ing ecological methods: Is a method able to identify patterns that we know exist (Grimm et al. 1999)? Can we infer the mechanisms underlying these patterns given a certain set of data (Tyre et al. 2001)? Can we correctly and reliably predict future events (Zurell et al. 2009)?
To evaluate methods of data collection, statistical analy-sis, and modelling we would ideally compare their outcome to reality. This would allow us to assess whether existing patterns were detected correctly, whether correct estimates of process rates were obtained, or whether the distribu-tion of a species was predicted correctly. However, we have no privileged access to reality independent of and beyond field observations and analytical methods. The ability of field data to represent reality depends not only on the time interval and the spatial extent of observation but also on the disturbances
2
the observation procedure might induce. We can never know the complete ‘truth’ because any knowledge about the real world is based on (limited) data, because the methods to derive and analyse real world data sets are subject to constraints and biases (Grimm et al. 1999, Halle and Halle 1999, Hirzel et al. 2001, Austin et al. 2006), and because amount of data is limited by time and costs. Many factors cannot be controlled: underlying environmental factors; historical factors such as disturbances, catastrophes, past land uses; and ecological processes such as competition, dispersal and diseases.
With the VE approach all relevant information can be obtained at all times in the virtual world which is taken as a surrogate of reality. We know, for example, the full move-ment path of model animals, or the exact location of all individuals or subpopulations at a given time. In the virtual reality, we can generate certain patterns a priori as well as biases introduced by the (virtual) observer.
The idea of generating virtual data to evaluate different methods is quite natural and not new. An early example for evaluating sampling methods is given by Stickel (1954). Stickel analysed the quality of mark–recapture data describ-ing the dispersal of small mammals. For this, the author used as a virtual habitat a sheet of paper divided into grid cells. Some of the grid cells marked traps. Animal movement was simulated by random movements of a pencil. Based on the virtual capture data, movement indices were calculated and compared to those derived from the full trajectories of the pencil. By this the accuracy of diff erent observational algo-By this the accuracy of different observational algo-rithms was evaluated.
In statistics it is quite common praxis to use high-quality data or artificially created, error-free data to qualify differ-ent sampling or modelling methods (Hirzel et al. 2001). For example, Fortin et al. (1989) subsampled a large, real vegetation data set of sugar-maple Acer saccharum in south-western Québec, simulating three different types of sam-pling designs (random, systematic and systematic-cluster). This allowed them to evaluate the effects of these sampling designs and of different sampling efforts on the estimation of spatial structures as well as the sensitivity of different spatial analysis methods. Statistical ecologists also build replicate or simulated data sets with known properties to demonstrate the unbiasedness of new modelling methods they have devel-oped or to show their superior efficiency in comparison to previous methods (Bolker 2008). Many introductory text-books on statistics deal with such topics. Bolker (2008) rec-ommends using simulated data as a ‘best-case scenario’ to test whether correct estimates of the parameters of an eco-logical system can be inferred from the data before proceed-ing to real data.
In this review, we identify two main fields of applica-tion for VE: (1) testing and improving sampling schemes and methods; (2) testing and comparing models. The first includes the evaluation of spatial and temporal sampling designs, and the assessment of sampling bias as well as the sensitivity of sampling methods to extrinsic conditions, trappability or observability (Halle and Halle 1999). For the latter, VE may help to assess whether a particular model fitted to the virtual data is principally capable of describing and predicting underlying patterns and pro-cesses. Also, contests can be arranged between competing models (Hanski 1999), and their application domain can be circumscribed theoretically (Hirzel et al. 2001). In this way, VE helps to select the most appropriate model for a given situation.
The primary aim of this review is to give the VE approach, which emerged and keeps emerging indepen-dently under different names in the literature, a common name and summarise its potential and current limitations. We want to introduce VE as a generic, rigorous and unify-ing approach that can be used as a common basis for test-ing methods of data collection and for testing modelling methods. First we will characterise the virtual ecologist approach and its elements in more detail. Secondly, we will review past uses of VE and list specific examples within the two above-mentioned main fields of application. We will thereby show that VE can be applied in a broad and diverse range of problems in ecology. Then we will discuss potential uses for empirical ecologists and ecological mod-ellers, and give some practical guidelines which might help to design VE studies for given purposes. Finally, we will outline future directions and list specific research fields that we feel would benefit from VE.
The virtual ecologist approach
The virtual ecologist approach requires four elements (Fig. 1): (a) the virtual ecological model, (b) the virtual sampling model, (c) (statistical) modelling and (d) evalua-tion. The virtual ecological model (a) represents the virtual
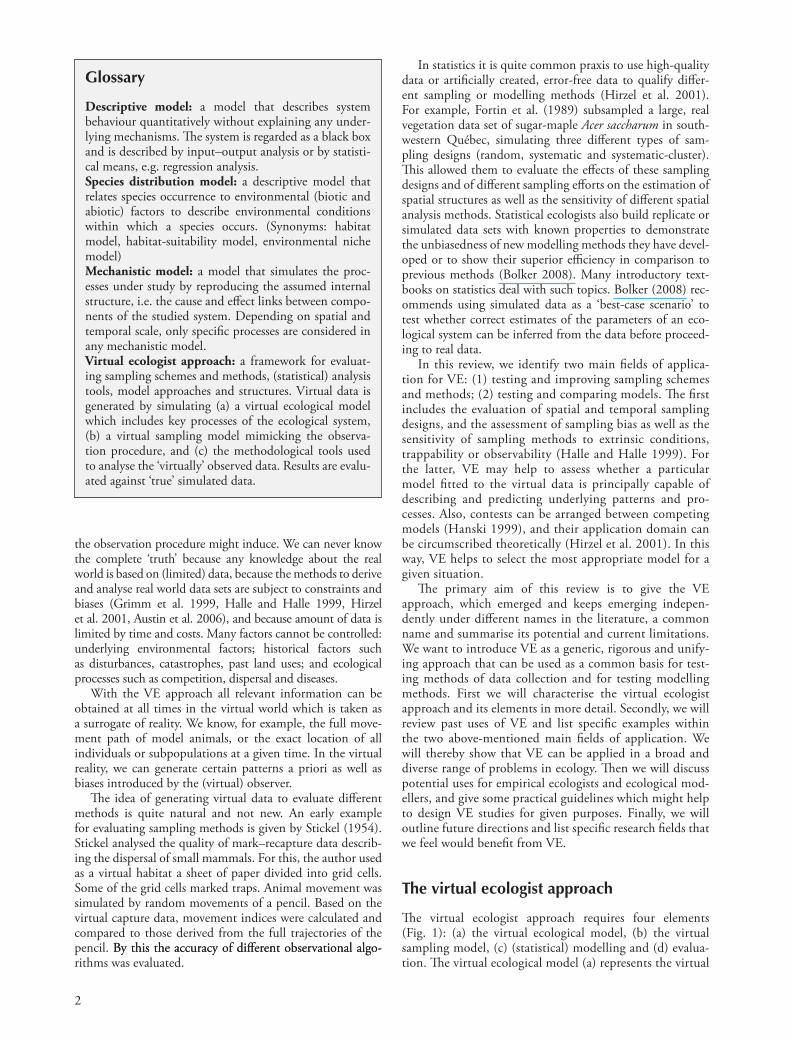
Glossary
Descriptive model: a model that describes system behaviour quantitatively without explaining any under-lying mechanisms. The system is regarded as a black box and is described by input–output analysis or by statisti-cal means, e.g. regression analysis. Species distribution model: a descriptive model that relates species occurrence to environmental (biotic and abiotic) factors to describe environmental conditions within which a species occurs. (Synonyms: habitat model, habitat-suitability model, environmental niche model)Mechanistic model: a model that simulates the proc-esses under study by reproducing the assumed internal structure, i.e. the cause and effect links between compo-nents of the studied system. Depending on spatial and temporal scale, only specific processes are considered in any mechanistic model.Virtual ecologist approach: a framework for evaluat-ing sampling schemes and methods, (statistical) analysis tools, model approaches and structures. Virtual data is generated by simulating (a) a virtual ecological model which includes key processes of the ecological system, (b) a virtual sampling model mimicking the observa-tion procedure, and (c) the methodological tools used to analyse the ‘virtually’ observed data. Results are evalu-ated against ‘true’ simulated data.

3
species and/or ecosystem, and includes key processes of the ecological system relevant to the question under study. Thus, the virtual ecological model may comprise a single or multiple species, single individuals or entire populations; it may be temporally and spatially implicit or explicit, fine-scaled or coarse-scaled; it may be governed by abiotic factors etc. The virtual sampling model (b) simulates the observa-tion process. Data is collected from the virtual ecosystem (by a ‘virtual ecologist’) according to a sampling scheme mimicking the way the data would be collected by real ecologists in real ecosystems. (Statistical) Modelling (c) is used to draw inferences from the collected data. Examples include estimation of population size, identification of fac-tors influencing species distribution or abundance, and estimation of process parameters. (Statistical) Modelling can also be used to predict the effects of ecological pro-cesses. Finally, the results are evaluated against ‘true’ simu-lated data (d). Essentially, the ‘virtual ecologist’ operates in the same way as an empirical ecologist (Fig. 1). However, in a VE study we have full access to all information created by the virtual ecological model which allows us to draw strong conclusions about our sampling and (statistical) modelling methods.
Different names have emerged throughout the literature for the very same approach: “artificial data” or “artificial species” (Austin et al. 2006, Meynard and Quinn 2007, Cabral and Schurr 2009), “virtual species” (Hirzel et al. 2001), “virtual ecologist” (Grimm et al. 1999, Tyre et al. 2001, Zurell et al. 2009), “simulated data” (Hanski 1999, Dormann et al. 2007), “virtual ecology” (Grimm et al. 1999, Nehrbass et al. 2006), to name but a few. Of these, virtual ecologist approach seems to best capture the central idea that not only a virtual reality is created but that the sampling itself or the observer’s behaviour is also being simulated in a second model in a hierarchical way. The term virtual ecolo-gist is thus not ambiguous in contrast to terms such as ‘vir-tual experiment’ or ‘virtual ecology’ which are also used for studies simply employing conceptual models for hypothesis testing where the effect of different scenarios on some system response is explored (Parysow and Gertner 1997, 1999). The current inconsistent terminology emphasises the importance
to give the approach a common name which, we believe, will make it more visible and coherent.
In addition to various studies that we simply knew from regular scanning of the ecological literature, our overview of applications of the virtual ecologist approach is based on extensive literature searches carried out between autumn 2008 and spring 2009 using both the search engines ,www.scirus.com. and ,www.sciencedirect.com.. We used mul-tiple keywords such as ‘virtual ecologist’, ‘virtual biologist’, ‘virtual experiment’, ‘virtual species’, ‘artificial species’, ‘arti-ficial data’ and ‘simulated data’. Due to the lack of a gen-eral terminology, it is possible that we have not detected all studies that would have been relevant to our review of the VE approach. However, we are confident that we included a representative set of worked examples and of ecological research fields.
Both the virtual ecological model and the virtual sam-pling model can be of different complexities. Depending on how much process detail is put into these models the VE approach covers quite a broad range of scientific ques-tions and applications. Generally, we can distinguish descriptive and mechanistic models representing the virtual species/ecosystem (see Glossary). In the same way, the virtual sampling model, i.e. the virtual ecologist, may be descriptive or mechanistic.
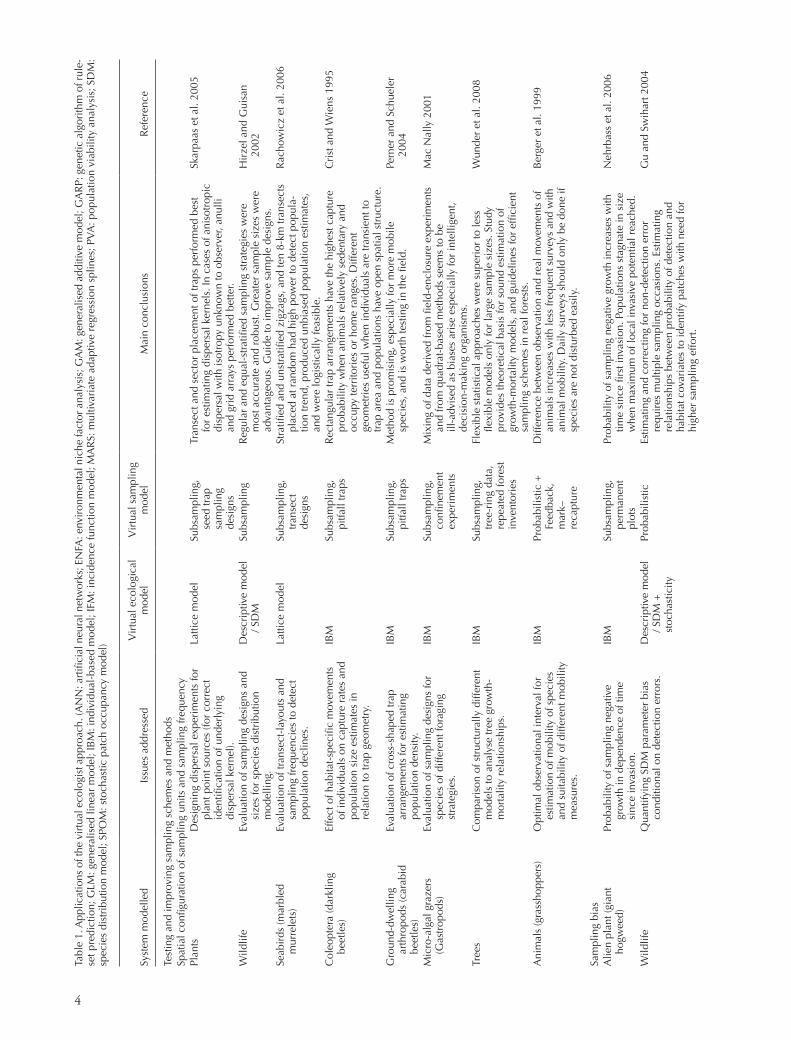
Throughout our literature survey, we found an approxi-mately equal ratio between descriptive and mechanistic representations of the virtual ecological model (Table 1; 21 descriptive models vs 25 mechanistic models). In most studies that aimed at testing and improving sampling regimes (n 5 14) the virtual ecosystem was simulated by means of mechanistic modelling (12). Within the sec-ond field of application, testing and comparing models, 19 out of 32 reviewed studies used descriptive models of the virtual ecosystem. The field of mechanistic modelling is vast and, thus, mechanistic modelling types employed in VE studies are manifold (Table 1). They range from grid-based models and patch network models (Hanski 1998) to individual-based models (Grimm 1999, Grimm and Railsback 2005).
Likewise, the virtual sampling model (Fig. 1, b) covers a wide range of complexities and model types. In most stud-ies we reviewed within the two main fields of application, virtual sampling was modelled as simple subsampling from the full simulated data, and in rare cases virtual sampling was modelled probabilistically (Table 1; 37 out of 46 VE studies employed subsampling, eight of which carried out a full census; seven VE studies employed probabilistic sam-pling). Simple subsampling means that the virtual ecologist acts flawlessly according to a certain sampling design, makes no observational or measurement errors and does not inter-act with the virtual species in any way (Tyre et al. 2001). Probabilistic sampling includes e.g. probability of detection and regards observation as a stochastic process (Reese et al. 2005). For instance, even if the species is present, it may not be detected. Still the virtual sampling includes no interaction between virtual species and virtual ecologist. If the virtual ecosystem is based on a mechanistic model, direct feedbacks may be included between the models of virtual species and virtual sampling, such as observer induced individual escapes (Nott 1998, Berger et al. 1999).
Figure 1. The elements of the virtual ecologist approach.
4
Tabl
e 1.
App
licat
ions
of t
he v
irtu
al e
colo
gist
app
roac
h. (A
NN
: art
ifici
al n
eura
l net
wor
ks; E
NFA
: env
iron
men
tal n
iche
fact
or a
naly
sis;
GA
M: g
ener
alis
ed a
dditi
ve m
odel
; GA
RP:
gen
etic
alg
orith
m o
f rul
e-se
t pre
dict
ion;
GLM
: gen
eral
ised
line
ar m
odel
; IB
M: i
ndiv
idua
l-ba
sed
mod
el; I
FM: i
ncid
ence
func
tion
mod
el; M
AR
S: m
ultiv
aria
te a
dapt
ive
regr
essi
on s
plin
es; P
VA
: pop
ulat
ion
viab
ility
ana
lysi
s; S
DM
: sp
ecie
s di
stri
butio
n m
odel
; SPO
M: s
toch
astic
pat
ch o
ccup
ancy
mod
el)
Syst
em m
odel
led
Issu
es a
ddre
ssed
Vir
tual
eco
logi
cal
mod
elV
irtu
al s
ampl
ing
mod
elM
ain
conc
lusi
ons
Ref
eren
ce
Test
ing
and
impr
ovin
g sa
mpl
ing
sche
mes
and
met
hods
Spat
ial c
onfig
urat
ion
of s
ampl
ing
units
and
sam
plin
g fr
eque
ncy
Plan
tsD
esig
ning
dis
pers
al e
xper
imen
ts fo
r pl
ant p
oint
sou
rces
(for
cor
rect
id
entifi
catio
n of
und
erly
ing
disp
ersa
l ker
nel).
Latti
ce m
odel
Subs
ampl
ing,
se
ed tr
ap
sam
plin
g de
sign
s
Tran
sect
and
sec
tor
plac
emen
t of t
raps
per
form
ed b
est
for
estim
atin
g di
sper
sal k
erne
ls. I
n ca
ses
of a
niso
trop
ic
disp
ersa
l with
isot
ropy
unk
now
n to
obs
erve
r, an
ulli
and
grid
arr
ays
perf
orm
ed b
ette
r.
Skar
paas
et a
l. 20
05
Wild
life
Eval
uatio
n of
sam
plin
g de
sign
s an
d si
zes
for
spec
ies
dist
ribu
tion
mod
ellin
g.
Des
crip
tive
mod
el
/ SD
MSu
bsam
plin
gR
egul
ar a
nd e
qual
-str
atifi
ed s
ampl
ing
stra
tegi
es w
ere
mos
t acc
urat
e an
d ro
bust
. Gre
ater
sam
ple
size
s w
ere
adva
ntag
eous
. Gui
de to
impr
ove
sam
ple
desi
gns.
Hir
zel a
nd G
uisa
n 20
02
Seab
irds
(mar
bled
m
urre
lets
)Ev
alua
tion
of tr
anse
ct-l
ayou
ts a
nd
sam
plin
g fr
eque
ncie
s to
det
ect
popu
latio
n de
clin
es.
Latti
ce m
odel
Subs
ampl
ing,
tr
anse
ct
desi
gns
Stra
tified
and
uns
trat
ified
zig
zags
, and
ten
8-km
tran
sect
s pl
aced
at r
ando
m h
ad h
igh
pow
er to
det
ect p
opul
a-tio
n tr
end,
pro
duce
d un
bias
ed p
opul
atio
n es
timat
es,
and
wer
e lo
gist
ical
ly fe
asib
le.
Rac
how
icz
et a
l. 20
06
Col
eopt
era
(dar
klin
g be
etle
s)
Effe
ct o
f hab
itat-
spec
ific
mov
emen
ts
of in
divi
dual
s on
cap
ture
rat
es a
nd
popu
latio
n si
ze e
stim
ates
in
rela
tion
to tr
ap g
eom
etry
.
IBM
Subs
ampl
ing,
pi
tfall
trap
sR
ecta
ngul
ar tr
ap a
rran
gem
ents
hav
e th
e hi
ghes
t cap
ture
pr
obab
ility
whe
n an
imal
s re
lativ
ely
sede
ntar
y an
d oc
cupy
terr
itori
es o
r ho
me
rang
es. D
iffer
ent
geom
etri
es u
sefu
l whe
n in
divi
dual
s ar
e tr
ansi
ent t
o tr
ap a
rea
and
popu
latio
ns h
ave
open
spa
tial s
truc
ture
.
Cri
st a
nd W
iens
199
5
Gro
und-
dwel
ling
arth
ropo
ds (c
arab
id
beet
les)
Eval
uatio
n of
cro
ss-s
hape
d tr
ap
arra
ngem
ents
for
estim
atin
g po
pula
tion
dens
ity.
IBM
Subs
ampl
ing,
pi
tfall
trap
sM
etho
d is
pro
mis
ing,
esp
ecia
lly fo
r m
ore
mob
ile
spec
ies,
and
is w
orth
test
ing
in th
e fie
ld.
Pern
er a
nd S
chue
ler
2004
Mic
ro-a
lgal
gra
zers
(G
astr
opod
s)
Eval
uatio
n of
sam
plin
g de
sign
s fo
r sp
ecie
s of
diff
eren
t for
agin
g st
rate
gies
.
IBM
Subs
ampl
ing,
co
nfine
men
t ex
peri
men
ts
Mix
ing
of d
ata
deriv
ed fr
om fi
eld-
encl
osur
e ex
peri
men
ts
and
from
qua
drat
-bas
ed m
etho
ds s
eem
s to
be
ill-a
dvis
ed a
s bi
ases
ari
se e
spec
ially
for
inte
llige
nt,
deci
sion
-mak
ing
orga
nism
s.
Mac
Nal
ly 2
001
Tree
sC
ompa
riso
n of
str
uctu
rally
diff
eren
t m
odel
s to
ana
lyse
tree
gro
wth
-m
orta
lity
rela
tions
hips
.
IBM
Subs
ampl
ing,
tr
ee-r
ing
data
, re
peat
ed fo
rest
in
vent
orie
s
Flex
ible
sta
tistic
al a
ppro
ache
s w
ere
supe
rior
to le
ss
flexi
ble
mod
els
only
for
larg
e sa
mpl
e si
zes.
Stu
dy
prov
ides
theo
retic
al b
asis
for
soun
d es
timat
ion
of
grow
th-m
orta
lity
mod
els,
and
gui
delin
es fo
r ef
ficie
nt
sam
plin
g sc
hem
es in
rea
l for
ests
.
Wun
der
et a
l. 20
08
Ani
mal
s (g
rass
hopp
ers)
Opt
imal
obs
erva
tiona
l int
erva
l for
es
timat
ion
of m
obili
ty o
f spe
cies
an
d su
itabi
lity
of d
iffer
ent m
obili
ty
mea
sure
s.
IBM
Prob
abili
stic
+
Feed
back
, m
ark–
re
capt
ure
Diff
eren
ce b
etw
een
obse
rvat
ion
and
real
mov
emen
ts o
f an
imal
s in
crea
ses
with
less
freq
uent
sur
veys
and
with
an
imal
mob
ility
. Dai
ly s
urve
ys s
houl
d on
ly b
e do
ne if
sp
ecie
s ar
e no
t dis
turb
ed e
asily
.
Ber
ger
et a
l. 19
99
Sam
plin
g bi
asA
lien
plan
t (gi
ant
hogw
eed)
Prob
abili
ty o
f sam
plin
g ne
gativ
e gr
owth
in d
epen
denc
e of
tim
e si
nce
inva
sion
.
IBM
Subs
ampl
ing,
pe
rman
ent
plot
s
Prob
abili
ty o
f sam
plin
g ne
gativ
e gr
owth
incr
ease
s w
ith
time
sinc
e fir
st in
vasi
on. P
opul
atio
ns s
tagn
ate
in s
ize
whe
n m
axim
um o
f loc
al in
vasi
ve p
oten
tial r
each
ed.
Neh
rbas
s et
al.
2006
Wild
life
Qua
ntify
ing
SDM
par
amet
er b
ias
cond
ition
al o
n de
tect
ion
erro
rs.
Des
crip
tive
mod
el
/ SD
M +
st
ocha
stic
ity
Prob
abili
stic
Estim
atin
g an
d co
rrec
ting
for
non-
dete
ctio
n er
ror
requ
ires
mul
tiple
sam
plin
g oc
casi
ons.
Est
imat
ing
rela
tions
hips
bet
wee
n pr
obab
ility
of d
etec
tion
and
habi
tat c
ovar
iate
s to
iden
tify
patc
hes
with
nee
d fo
r hi
gher
sam
plin
g ef
fort
.
Gu
and
Swih
art 2
004
5
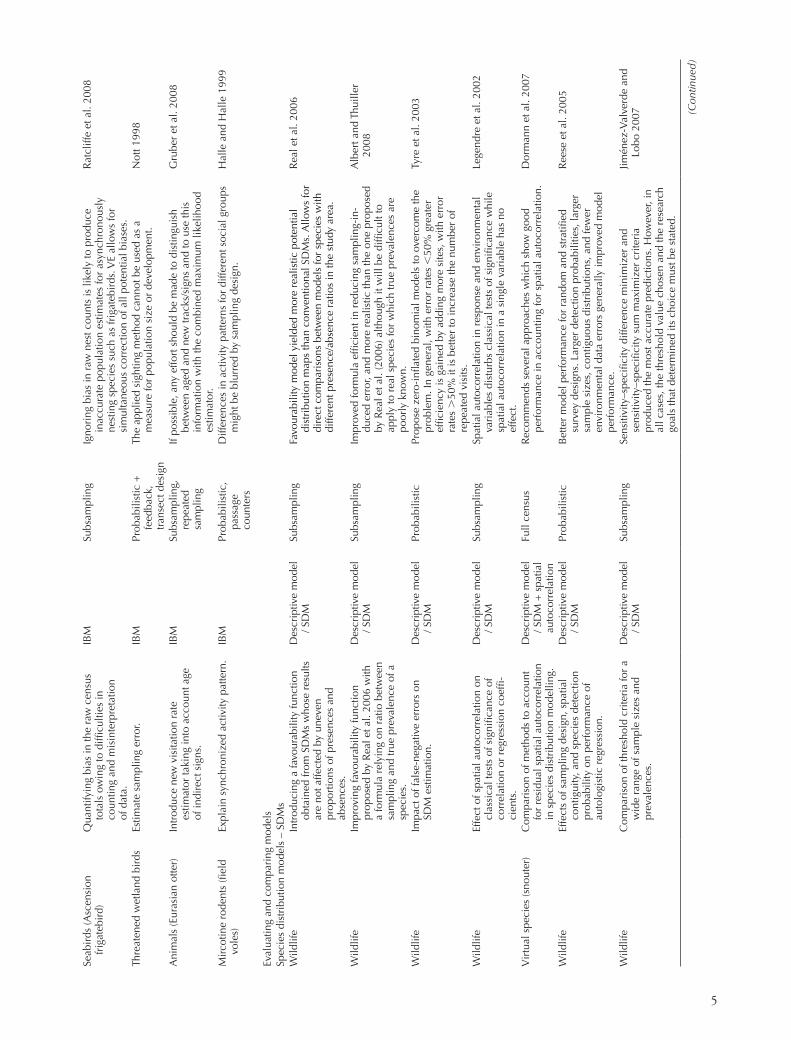
Seab
irds
(Asc
ensi
on
frig
ateb
ird)
Qua
ntify
ing
bias
in th
e ra
w c
ensu
s to
tals
ow
ing
to d
ifficu
lties
in
coun
ting
and
mis
inte
rpre
tatio
n
of d
ata.
IBM
Subs
ampl
ing
Igno
ring
bia
s in
raw
nes
t cou
nts
is li
kely
to p
rodu
ce
inac
cura
te p
opul
atio
n es
timat
es fo
r as
ynch
rono
usly
ne
stin
g sp
ecie
s su
ch a
s fr
igat
ebir
ds. V
E al
low
s fo
r si
mul
tane
ous
corr
ectio
n of
all
pote
ntia
l bia
ses.
Rat
cliff
e et
al.
2008
Thre
aten
ed w
etla
nd b
irds
Estim
ate
sam
plin
g er
ror.
IBM
Prob
abili
stic
+
feed
back
, tr
anse
ct d
esig
n
The
appl
ied
sigh
ting
met
hod
cann
ot b
e us
ed a
s a
mea
sure
for
popu
latio
n si
ze o
r de
velo
pmen
t.N
ott 1
998
Ani
mal
s (E
uras
ian
otte
r)In
trod
uce
new
vis
itatio
n ra
te
estim
ator
taki
ng in
to a
ccou
nt a
ge
of in
dire
ct s
igns
.
IBM
Subs
ampl
ing,
re
peat
ed
sam
plin
g
If po
ssib
le, a
ny e
ffort
sho
uld
be m
ade
to d
istin
guis
h be
twee
n ag
ed a
nd n
ew tr
acks
/sig
ns a
nd to
use
this
in
form
atio
n w
ith th
e co
mbi
ned
max
imum
like
lihoo
d es
timat
or.
Gru
ber
et a
l. 20
08
Mir
cotin
e ro
dent
s (fi
eld
vole
s)Ex
plai
n sy
nchr
oniz
ed a
ctiv
ity p
atte
rn.
IBM
Prob
abili
stic
, pa
ssag
e co
unte
rs
Diff
eren
ces
in a
ctiv
ity p
atte
rns
for
diffe
rent
soc
ial g
roup
s m
ight
be
blur
red
by s
ampl
ing
desi
gn.
Hal
le a
nd H
alle
199
9
Eval
uatin
g an
d co
mpa
ring
mod
els
Spec
ies
dist
ribu
tion
mod
els
– SD
Ms
Wild
life
Intr
oduc
ing
a fa
vour
abili
ty fu
nctio
n ob
tain
ed fr
om S
DM
s w
hose
res
ults
ar
e no
t affe
cted
by
unev
en
prop
ortio
ns o
f pre
senc
es a
nd
abse
nces
.
Des
crip
tive
mod
el
/ SD
MSu
bsam
plin
gFa
vour
abili
ty m
odel
yie
lded
mor
e re
alis
tic p
oten
tial
dist
ribu
tion
map
s th
an c
onve
ntio
nal S
DM
s. A
llow
s fo
r di
rect
com
pari
sons
bet
wee
n m
odel
s fo
r sp
ecie
s w
ith
diffe
rent
pre
senc
e/ab
senc
e ra
tios
in th
e st
udy
area
.
Rea
l et a
l. 20
06
Wild
life
Impr
ovin
g fa
vour
abili
ty fu
nctio
n pr
opos
ed b
y R
eal e
t al.
2006
with
a
form
ula
rely
ing
on r
atio
bet
wee
n sa
mpl
ing
and
true
pre
vale
nce
of a
sp
ecie
s.
Des
crip
tive
mod
el
/ SD
MSu
bsam
plin
gIm
prov
ed fo
rmul
a ef
ficie
nt in
red
ucin
g sa
mpl
ing-
in-
duce
d er
ror,
and
mor
e re
alis
tic th
an th
e on
e pr
opos
ed
by R
eal e
t al.
(200
6) a
lthou
gh it
will
be
diffi
cult
to
appl
y to
rea
l spe
cies
for
whi
ch tr
ue p
reva
lenc
es a
re
poor
ly k
now
n.
Alb
ert a
nd T
huill
er
2008
Wild
life
Impa
ct o
f fal
se-n
egat
ive
erro
rs o
n SD
M e
stim
atio
n.D
escr
iptiv
e m
odel
/ S
DM
Prob
abili
stic
Prop
ose
zero
-infl
ated
bin
omia
l mod
els
to o
verc
ome
the
prob
lem
. In
gene
ral,
with
err
or r
ates
,50
% g
reat
er
effic
ienc
y is
gai
ned
by a
ddin
g m
ore
site
s, w
ith e
rror
ra
tes
.50
% it
is b
ette
r to
incr
ease
the
num
ber
of
repe
ated
vis
its.
Tyre
et a
l. 20
03
Wild
life
Effe
ct o
f spa
tial a
utoc
orre
latio
n on
cl
assi
cal t
ests
of s
igni
fican
ce o
f co
rrel
atio
n or
reg
ress
ion
coef
fi-ci
ents
.
Des
crip
tive
mod
el
/ SD
MSu
bsam
plin
gSp
atia
l aut
ocor
rela
tion
in r
espo
nse
and
envi
ronm
enta
l va
riab
les
dist
urbs
cla
ssic
al te
sts
of s
igni
fican
ce w
hile
sp
atia
l aut
ocor
rela
tion
in a
sin
gle
vari
able
has
no
effe
ct.
Lege
ndre
et a
l. 20
02
Vir
tual
spe
cies
(sno
uter
) C
ompa
riso
n of
met
hods
to a
ccou
nt
for
resi
dual
spa
tial a
utoc
orre
latio
n in
spe
cies
dis
trib
utio
n m
odel
ling.
Des
crip
tive
mod
el
/ SD
M +
spa
tial
auto
corr
elat
ion
Full
cens
usR
ecom
men
ds s
ever
al a
ppro
ache
s w
hich
sho
w g
ood
perf
orm
ance
in a
ccou
ntin
g fo
r sp
atia
l aut
ocor
rela
tion.
D
orm
ann
et a
l. 20
07
Wild
life
Effe
cts
of s
ampl
ing
desi
gn, s
patia
l co
ntig
uity
, and
spe
cies
det
ectio
n pr
obab
ility
on
perf
orm
ance
of
auto
logi
stic
reg
ress
ion.
Des
crip
tive
mod
el
/ SD
MPr
obab
ilist
icB
ette
r m
odel
per
form
ance
for
rand
om a
nd s
trat
ified
su
rvey
des
igns
. Lar
ger
dete
ctio
n pr
obab
ilitie
s, la
rger
sa
mpl
e si
zes,
con
tiguo
us d
istr
ibut
ions
, and
few
er
envi
ronm
enta
l dat
a er
rors
gen
eral
ly im
prov
ed m
odel
pe
rfor
man
ce.
Ree
se e
t al.
2005
Wild
life
Com
pari
son
of th
resh
old
crite
ria
for
a w
ide
rang
e of
sam
ple
size
s an
d pr
eval
ence
s.
Des
crip
tive
mod
el
/ SD
MSu
bsam
plin
gSe
nsiti
vity
–spe
cific
ity d
iffer
ence
min
imiz
er a
nd
sens
itivi
ty–s
peci
ficity
sum
max
imiz
er c
rite
ria
prod
uced
the
mos
t acc
urat
e pr
edic
tions
. How
ever
, in
all c
ases
, the
thre
shol
d va
lue
chos
en a
nd th
e re
sear
ch
goal
s th
at d
eter
min
ed it
s ch
oice
mus
t be
stat
ed.
Jimén
ez-V
alve
rde
and
Lobo
200
7 (Con
tinue
d)

6
Syst
em m
odel
led
Issu
es a
ddre
ssed
Vir
tual
eco
logi
cal
mod
elV
irtu
al s
ampl
ing
mod
elM
ain
conc
lusi
ons
Ref
eren
ce
Wild
life
Com
pari
son
of r
egul
aris
atio
n m
etho
ds fo
r SD
Ms.
Des
crip
tive
mod
el
/ SD
MSu
bsam
plin
gN
o re
gula
riza
tion
met
hod
perf
orm
ed b
est u
nder
all
circ
umst
ance
s. V
aria
ble
sele
ctio
n sh
ould
be
used
with
ca
utio
n. R
idge
and
lass
o ar
e ri
sk-a
vers
e m
odel
st
rate
gies
, pre
fera
bly
esp.
for
smal
l sam
ple
size
s.
Rei
neki
ng a
nd S
chrö
der
2006
Fore
sts
Com
pari
son
of m
odel
ling
tech
niqu
es
for
the
brao
d-sc
ale
map
ping
of
fore
st c
hara
cter
istic
s.
Des
crip
tive
mod
el
/ SD
MSu
bsam
plin
gM
AR
S an
d A
NN
per
form
ed b
est w
ithin
VE,
but
muc
h sm
alle
r di
ffere
nces
wer
e se
en w
ith r
eal d
ata
beca
use
of n
oise
or
poss
ible
lack
of n
onlin
ear
rela
tions
hips
be
twee
n re
spon
se a
nd p
redi
ctor
var
iabl
es.
Moi
sen
and
Fres
cino
20
02
Gra
ssla
nds
Com
pari
son
of m
odel
ling
tech
niqu
es
for
pred
ictin
g ec
osys
tem
attr
ibut
es.
Des
crip
tive
mod
el
/ SD
MSu
bsam
plin
gFo
r th
e si
x tr
aits
ana
lyse
d, A
NN
s w
ere
able
to m
ake
bette
r pr
edic
tions
than
reg
ress
ion
mod
els.
Paru
elo
and
Tom
asel
19
97
Wild
life
Com
pare
per
form
ance
of S
DM
al
gori
thm
s re
gard
ing
unde
rlyi
ng
resp
onse
sha
pes,
dir
ect a
nd
indi
rect
pre
dict
ors.
Des
crip
tive
mod
el
/ SD
MSu
bsam
plin
gEc
olog
ical
kno
wle
dge
and
stat
istic
al s
kills
of t
he a
naly
sts
wer
e m
ore
impo
rtan
t tha
n th
e m
etho
d us
ed.
Aus
tin e
t al.
2006
Wild
life
Com
pare
per
form
ance
of S
DM
al
gori
thm
s co
nditi
onal
on
prev
alen
ce, s
ampl
e si
ze, s
elec
tion
proc
edur
e.
Des
crip
tive
mod
el
/ SD
M +
st
ocha
stic
ity
Subs
ampl
ing
Rec
omm
end
the
use
of G
AM
or
GLM
ove
r cl
assi
ficat
ion
tree
s or
GA
RP.
SD
Ms
for
spec
ies
with
low
pre
vale
nce
can
be im
prov
ed th
roug
h ta
rget
ed s
ampl
ing.
Mey
nard
and
Qui
nn
2007
Wild
life
Com
pare
per
form
ance
of S
DM
al
gori
thm
s co
nditi
onal
on
colo
nisa
tion
hist
ory.
Des
crip
tive
mod
el
/ SD
M +
st
ocha
stic
ity
Subs
ampl
ing
GLM
was
bad
ly a
ffect
ed in
the
case
of t
he s
prea
ding
sp
ecie
s bu
t pro
duce
d sl
ight
ly b
ette
r re
sults
than
EN
FA
whe
n th
e sp
ecie
s w
as o
vera
bund
ant;
at e
quili
briu
m,
both
met
hods
pro
duce
d eq
uiva
lent
res
ults
.
Hir
zel e
t al.
2001
Arb
orea
l mar
supi
als
(gre
ater
glid
er)
Suita
bilit
y of
SD
Ms
for
iden
tifyi
ng
sour
ce h
abita
ts.
IBM
Subs
ampl
ing
SDM
s ba
sed
on lo
gist
ic r
egre
ssio
ns m
easu
re th
e ab
ility
of
spe
cies
to r
each
/ col
oniz
e ha
bita
t, no
t the
ir d
eath
/ bi
rth
rate
s.
Tyre
et a
l. 20
01
Cer
rado
veg
etat
ion
(sav
anna
)Pe
rfor
man
ce o
f SD
Ms
coup
led
with
sp
atia
l eig
enve
ctor
map
ping
und
er
rang
e ex
pans
ion.
Cel
lula
r au
tom
ata
Subs
ampl
ing
Mec
hani
sms
that
gen
erat
e ra
nge
cohe
sion
and
det
erm
ine
spec
ies’
dis
trib
utio
n un
der
clim
ate
chan
ges
can
be
capt
ured
by
spat
ial m
odel
ling.
de M
arco
et a
l. 20
08
Fish
(str
eam
trou
t)U
sefu
lnes
s of
SD
Ms
for
asse
ssin
g th
e fit
ness
pot
entia
l pro
vide
d by
ha
bita
t and
for
pred
ictin
g po
pula
tion
resp
onse
s to
hab
itat
alte
ratio
n.
IBM
Subs
ampl
ing
Littl
e ca
n be
infe
rred
abo
ut th
e fit
ness
val
ue o
f hab
itat
from
obs
erve
d ha
bita
t sel
ectio
n. R
ecom
men
d th
at
SDM
s be
sup
plem
ente
d w
ith m
echa
nist
ic a
ppro
ache
s.
Rai
lsba
ck e
t al.
2003
Wild
life
(art
hrop
ods)
Ef
fect
s of
tran
sien
t dyn
amic
s an
d ec
olog
ical
pro
pert
ies
and
proc
esse
s on
the
pred
ictio
n ac
cura
cy o
f SD
Ms
unde
r cl
imat
e ch
ange
.
Latti
ce m
odel
Subs
ampl
ing
Diff
eren
t ran
ge d
ynam
ics
lead
to d
iffer
ent p
redi
ctio
n ac
cura
cies
of S
DM
s un
der
clim
ate
chan
ge. S
tudy
pi
npoi
nts
rele
vant
pro
cess
es w
hich
sho
uld
be
inco
rpor
ated
into
SD
Ms.
Zur
ell e
t al.
2009
Des
crip
tive
com
mun
ity a
ssem
bly
mod
els
Bar
ro C
olor
ado
Isla
nd
Fore
stEv
alua
te p
hylo
gene
tic c
omm
unity
m
etri
cs a
nd th
eir
stat
istic
al p
ower
to
det
ect p
hylo
gene
tic p
atte
rns
form
ed b
y ec
olog
ical
(com
petit
ion,
ha
bita
t filte
ring
, or
neut
ral
proc
esse
s) a
nd tr
ait e
volu
tion
proc
esse
s (c
onse
rved
and
co
nver
gent
trai
ts).
IBM
Fu
ll ce
nsus
Ver
y fe
w te
sts
gave
con
sist
ent t
ype
I err
or r
ates
ove
r a
rang
e of
diff
eren
t con
ditio
ns. M
ost t
ests
rej
ect t
he n
ull
hypo
thes
is (t
hat o
nly
neut
ral p
roce
sses
str
uctu
red
spat
ially
the
loca
l com
mun
ity) t
oo o
ften
whe
n th
e ra
ndom
izat
ion
algo
rith
m b
roke
dow
n a
stru
ctur
e in
th
e or
igin
al d
ata
set.
Test
s of
ten
show
ed b
ette
r co
nfor
man
ce w
hen
appl
ied
to a
sin
gle
stud
y si
te
rath
er th
an to
mul
ti-st
udy
site
s.
Har
dy 2
008
Tabl
e 1.
(Con
tinue
d)

7
Nat
ural
com
mun
ities
Des
crip
tive
mod
elFu
ll ce
nsus
Patte
rns
due
to c
ompe
titio
n ar
e be
tter
dete
cted
by
near
est-
rela
tive
test
s, p
atte
rns
due
to h
abita
t filte
ring
ar
e be
tter
dete
cted
with
tota
l com
mun
ity r
elat
edne
ss
test
s. S
tatis
tical
pow
er s
tron
gly
depe
nds
on th
e si
ze o
f th
e lo
cal c
omm
unity
rel
ativ
e to
the
regi
onal
poo
l with
la
rger
poo
l siz
es in
crea
sing
pow
er fo
r ha
bita
t filte
ring
pa
ttern
s bu
t dec
reas
ing
pow
er fo
r co
mpe
titio
n pa
ttern
s.
Kra
ft et
al.
2007
Nat
ural
com
mun
ities
Com
pare
per
form
ance
of m
etri
cs
mea
suri
ng n
este
dnes
s an
d co
-occ
urre
nce
in o
ccur
renc
e by
si
de m
atri
ces.
Des
crip
tive
mod
el
Full
cens
usA
nul
l mod
el th
at p
rese
rves
mat
rix
row
and
col
umn
tota
ls h
as lo
wer
type
I an
d ty
pe II
err
or p
roba
bilit
ies
than
a n
ull m
odel
that
rel
axes
row
and
col
umn
tota
ls
(whi
ch is
use
d in
the
popu
lar
nest
edne
ss te
mpe
ratu
re
calc
ulat
or).
Fisc
her a
nd L
inde
nmay
er
2002
, Hig
gins
et a
l. 20
06, G
rew
e an
d C
how
n 20
06, U
lrich
an
d G
otel
li 20
07a,
20
07b
Dyn
amic
(met
a-)p
opul
atio
n m
odel
sA
nim
als
(but
terfl
ies)
Intr
oduc
e m
odel
of i
ndiv
idua
l ca
ptur
e hi
stor
ies
that
allo
ws
to
mea
sure
rat
es o
f mig
ratio
n an
d su
rviv
al in
met
apop
ulat
ions
.
Patc
h ne
twor
kPr
obab
ilist
ic,
mar
k–re
capt
ure
The
mod
el c
an b
e ap
plie
d in
stu
dies
of 1
0 or
mor
e po
pula
tions
with
diff
erin
g pa
tch
area
s an
d is
olat
ion,
an
d fo
r se
vera
l hun
dred
cou
nted
indi
vidu
als.
Han
ski e
t al.
2000
Ani
mal
s (b
utte
rflie
s)Ev
alua
tion
of a
n im
prov
ed m
etho
d fo
r pa
ram
eter
est
imat
ion
of IF
Ms
for
a ra
nge
of v
aryi
ng d
ata
scen
ario
s.
Patc
h ne
twor
kSu
bsam
plin
gN
ew m
etho
d pr
oduc
ed p
aram
eter
est
imat
es fo
r IF
M th
at
wer
e m
ore
accu
rate
than
thos
e ob
tain
ed b
y or
igin
al
met
hod
for
all s
cena
rios
.
Moi
lane
n 19
99
Wild
life
Stud
ying
the
effe
ct o
f diff
eren
t typ
es
of e
rror
in d
ata
used
to p
aram
eter
-is
e IF
Ms.
Patc
h ne
twor
kPr
obab
ilist
icFa
lse
zero
s ha
ve th
e gr
eate
st im
pact
and
sho
uld
be
avoi
ded.
Giv
en li
mite
d re
sour
ces,
it m
ay b
e pr
efer
able
to
sur
vey
only
par
t of a
larg
e pa
tch
netw
ork
thor
-ou
ghly
rat
her
than
to h
astil
y su
rvey
the
com
plet
e se
t of
pat
ches
.
Moi
lane
n 20
02
Wild
life
Com
pari
ng th
e su
scep
tibili
ty o
f di
ffere
nt S
POM
s to
pre
dict
ing
spur
ious
tren
ds in
met
apop
ulat
ion
size
.
Patc
h ne
twor
kSu
bsam
plin
gLo
gist
ic r
egre
ssio
n m
odel
s (e
stim
ated
from
turn
over
dat
a)
are
mor
e se
nsiti
ve to
the
impl
icit
estim
atio
n of
a tr
end
than
the
IFM
, esp
. whe
n on
ly tw
o sn
apsh
ots
of
occu
panc
y da
ta a
re u
sed.
The
latte
r al
so a
llow
s in
corp
orat
ing
a qu
asi-
equi
libri
um a
ssum
ptio
n.
Moi
lane
n 20
00
Ani
mal
s (g
rass
hopp
ers)
Inve
stig
ate
data
req
uire
men
ts o
f IFM
, an
d co
mpa
re tw
o di
ffere
nt S
POM
s.
IBM
Subs
ampl
ing,
re
peat
ed
sam
plin
g
Res
ults
sug
gest
put
ting
emph
asis
on
dete
rmin
ing
the
mig
ratio
n pa
ram
eter
s fr
om a
dditi
onal
, ind
epen
dent
da
ta r
athe
r th
an c
olle
ctin
g m
ore
snap
shot
yea
rs.
Hilk
er e
t al.
2006
Wild
life
Exam
ine
how
rob
ust fi
ve P
VA
mod
els
are
to n
egle
cted
effe
cts
of s
peci
es
inte
ract
ions
.
stoc
hast
ic,
stag
e-st
ruct
ured
pr
edat
or–p
rey
mod
el
Subs
ampl
ing
Sim
plify
ing
the
com
plex
ity o
f spe
cies
inte
ract
ions
by
popu
latio
n m
odel
s, in
clud
ing
PVA
, can
be
mis
lead
-in
g, b
ut o
nly
whe
n th
e si
ngle
-spe
cies
mod
el is
itse
lf ov
erly
com
plex
.
Sabo
and
Ger
ber
2007
Wild
life
Ass
essm
ent o
f the
rel
iabi
lity
of
pred
ictio
ns fo
r ex
tinct
ion
risk
s fr
om P
VA
con
ditio
nal o
n av
aila
ble
data
.
Ric
ker
mod
elSu
bsam
plin
gD
espi
te c
onsi
dera
ble
unce
rtai
nty
in th
e pr
edic
ted
risk
of
decl
ine,
use
ful p
redi
ctio
ns fo
r th
e ra
nkin
g of
spe
cies
in
term
s of
rel
ativ
e th
reat
and
for
eval
uatio
n of
di
ffere
nt m
anag
emen
t opt
ions
are
pos
sibl
e us
ing
only
10
yea
rs o
f dat
a.
McC
arth
y et
al.
2003
Plan
ts (P
rote
acea
e)In
trod
uce
likel
ihoo
d fr
amew
ork
for
estim
atin
g de
mog
raph
ic m
odel
s fo
r ra
nge
dyna
mic
s of
woo
dy
plan
ts.
Latti
ce m
odel
Prob
abili
stic
Pr
oces
s-ba
sed
mod
els
can
quan
titat
ivel
y de
scri
be h
ow
larg
e-sc
ale
abun
danc
e di
stri
butio
ns a
rise
from
the
loca
l dyn
amic
s an
d di
sper
sal b
etw
een
popu
latio
ns.
The
pres
ente
d fr
amew
ork
prov
ides
link
bet
wee
n SD
Ms,
em
piri
cal d
emog
raph
y an
d th
eore
tical
eco
logy
.
Cab
ral a
nd S
chur
r 20
09

8
disturbance effects on grasshopper are included in the model. The comparison of the ‘real’ mobility variables (obtained in the virtual world) with the sampled vari-ables provides a quality assessment of the various variables depending on the particular survey method and allows to rank their suitability.
The VE approach can also be used for assessing the compatibility of different sampling methods across spatial scales (Mac Nally 2001). Mac Nally asks whether compar-ing experimental units of different size may cause scaling artefacts. He tests the ability of the two most common methods to estimate the strength of interaction between competing species, enclosures and quadrate- or transect-based techniques, and whether information from the two sources can be mixed, which often is done for parameteris-ing so-called community matrix models (Wootton 1995). In his simulation model, Wootton (1995) describes three types of foragers (mimicking micro-algal grazers on rocky shores) which are distinguished by their foraging strategy (‘random walkers’, ‘homing’, ‘searcher’). Mac Nally (2001) found that for foragers that apply a more ‘intelligent’ for-aging strategy, including dynamic decision-making capabi-lities, the mixing of data from field-enclosure experiments and quadrate-based methods is ill-advised because the error of these two methods scales differently with the size of the sampling plot.
A third example is related to tree-mortality relationships. Tree mortality is a key process in forest dynamics. In many cases, tree death is preceded by periods of slow growth, and many forest succession models incorporate growth-mortality relationships. Few studies, however, quantify the growth-mortality relationship from empirical data. One question concerns the accuracy of growth-mortality models that are based on tree-ring data, forest inventory data or a combi-nation of both. Wunder et al. (2008) address this question with a VE approach. An individual-based virtual forest model included growth, mortality, snag standing time and regeneration of trees. The forest was subjected to alternative sampling regimes (tree-coring, forest inventories). Growth-mortality relationships were estimated with statistical mod-els of varying flexibility, and were compared to the a priori specified relationships. Highest accuracies were found for tree-ring based models, which require only a small sample size (60 dead trees). High model accuracies were also found for forest inventory-based models, starting at sample sizes of 500 trees. Overall, the study provided guidelines for efficient sampling schemes in real forests.
Testing and comparing models
Within this field of application we can compare the effi-ciency of different modelling approaches including algorith-mic choices, or the effects of different model structures and complexities. We distinguish different classes of problems that can be unified conceptually or technically: first, we list examples of VE studies testing and comparing species distri-bution models (see Glossary), followed by studies that tested descriptive models in the context of community assembly theory. Finally, we present studies that used VE to test statis-tical modelling frameworks to parameterise dynamic popu-lation models of differing complexity.
Past use of VE
Testing and improving sampling schemes and methods
In many field studies, ecologists obtain data that are known to be biased. Nevertheless, such data may provide valuable information particularly in cases where the ratio of mea-sured variables between ecological systems is of interest. Knowledge about the error range of each variable is essen-tial, as it might differ depending on the particular obser-vation scenario. An increasing number of studies already optimise the error ranges of their chosen observation sce-nario by a virtual or theoretical comparison of optional scenarios beforehand (Table 1). In the following we chose three of these studies to illustrate the range of potential fields of application.
Entomologists frequently use mark-recapture methods to monitor the position of grasshoppers or ground beetles in order to understand their behaviour and mobility depending on habitat quality, intra-daily variable climatic conditions, or interactions with con-specific and other animals. Based on the resulting data on positions at different times, various mobility variables are calculated, for example the mean daily movement, maximal distance between two locations an indi-vidual was captured, or mean activity radius. These indices may be biased and their quality may differ depending on the particular observation scheme, sample size, edge effects, spa-tial discretisation among others (Berger et al. 1999).
It seems reasonable to assume that the quality of mobility variables increases with the frequency of observations. How-ever, too frequent or dense observations will disturb the indi-viduals and might artificially increase their activity (Fig. 2). It is thus necessary to optimise the observation scenario related to the minimisation of the observation error and, simulta-neously, to minimise the disturbance effect by the observer. The VE approach was used for this optimisation (Berger et al. 1999). The ‘virtual ecologist’ samples the data accord-ing to the observation schemes applied in the field and
Figure 2. Movement of one exemplary individual over a 100 day period; (a) undisturbed and (b) influenced by an observer’s motion during daily surveys (after Berger et al. 1999).

9
as competition and predation, environmental stochasticity, and climate change. Virtually sampled data were used to calibrate species distribution models; then, future potential species distribution was projected and evaluated against the simulated ‘true’ distribution of the virtual species. With the VE approach, Zurell et al. (2009) were able to show that the performance of species distribution models for climate change projections strongly depends on the dispersal ability of the species and the extinction rate at the trailing edge of range shifts. Furthermore, their results indicated that spe-cies distribution models were useful tools in most of their tested situations. Zurell et al. (2009) were the first to rigor-ously assess the potential impacts of such factors like dis-persal, demographic processes and biotic interactions on global change projections. Nevertheless, they also point out, that their study only scratched the surface of what could be done by using VE with mechanistic models of the virtual ecosystems to test species distribution models. In the future, the complicating effects of several other factors could be explored with this approach such as changing biotic interac-tions under environmental change, the effects of changing disturbance regimes, local ecological adaptation or the evo-lution of species niches.
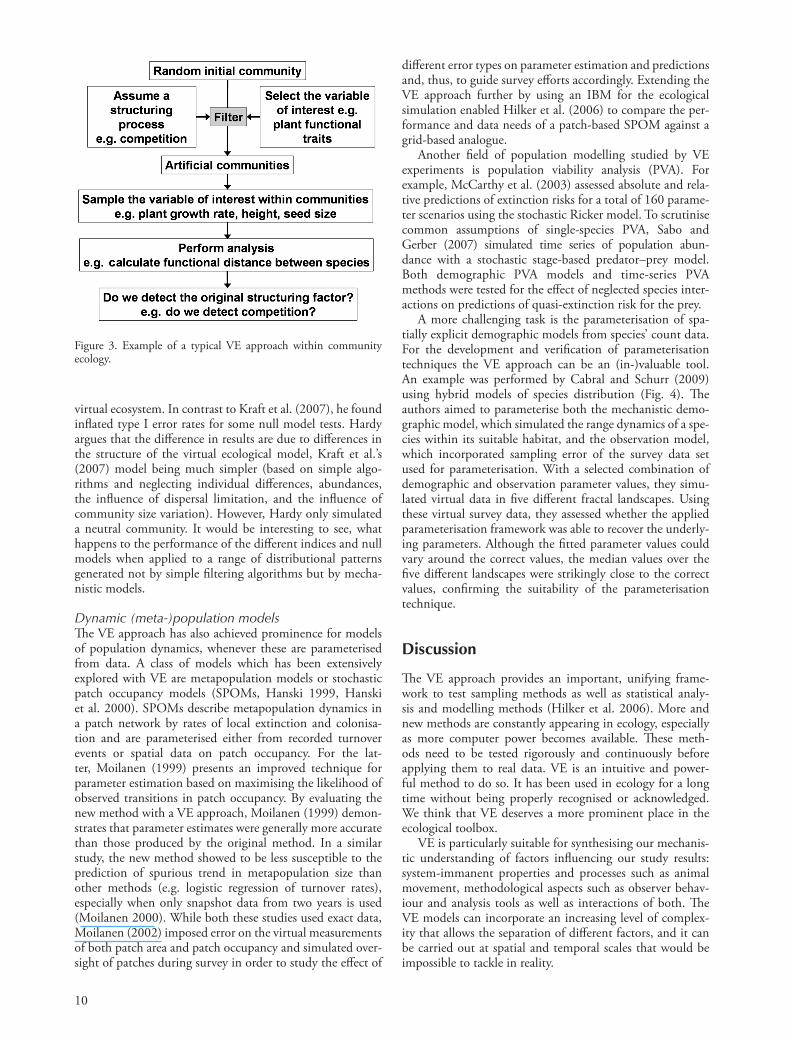
Descriptive community assembly modelsSeveral studies on community structure and assembly rules utilised the virtual ecologist approach. Local communities can be considered as a subset of the larger regional pool of potential community members. Numerous processes (includ-ing niche differentiation, environmental filtering, limited dispersal, niche conservatism and convergence) contribute to the formation of the local community from the regional species pool by fostering some species and excluding oth-ers. From certain patterns in distributional data, underlying community processes can be inferred by employing different metrics that characterise the community structure and by testing these for significant deviations from the null hypoth-esis (e.g. the community is locally neutral). Therefore, the question is twofold. First, do different processes result in dif-ferent patterns of phenotypic, genotypic and trait diversity? Second, do the metrics and null models successfully distin-guish between different patterns? The VE approach has been mainly used to address the second question, i.e. to test the performance of different metrics and null models in identify-ing non-random patterns in biodiversity distribution data.
Here, artificial communities that result from any of the proposed processes are created, for example by using simple filtering algorithms (Fig. 3). For instance, limiting similarity has been modeled by the stepwise exclusion of species with the lowest trait based Euclidean distances to other species while neutrality was modelled by random exclusion (Kraft et al. 2007). Then different metrics and null models are applied and their performance at distinguishing patterns cre-ated by different community processes is assessed. Patterns tested have considered nestedness (Fischer and Lindenmayer 2002, Greve and Chown 2006, Higgins et al. 2006, Ulrich and Gotelli 2007a, 2007b) and trait, phylogenetic and species diversity (Kraft et al. 2007).
Hardy (2008) studied how phylogenetic community metrics and null models perform in identifying neutral proc-esses by using an individual-based model to represent the
Species distribution modelsSpecies distribution models are commonly used to character-ise suitable environmental conditions for a species by relat-ing incidence data to environmental variables (Guisan and Zimmermann 2000). The resulting species–habitat relation-ship can be extrapolated in space and time to identify the spatial distribution of potentially suitable habitats. Steps in species distribution modelling involve data acquisi-tion, selection of modelling algorithm, model calibration including selection of important predictor variables and parameters, creation of habitat suitability maps, and model evaluation. VE studies usually focussed on specific steps of this model building procedure.
Several VE studies tested and compared the performance of alternative modelling algorithms (Hirzel et al. 2001, Legendre et al. 2002, Moisen and Frescino 2002, Tyre et al. 2003, Reese et al. 2005, Austin et al. 2006, Dormann et al. 2007, Meynard and Quinn 2007) conditional on e.g. response shapes, direct and indirect predictor variables, prevalence, sample size, spatial autocorrelation, or coloni-sation history. Reineking and Schröder (2006) compared regularisation and variable selection methods for model calibration. Other studies tested different threshold criteria (Jiménez-Valverde and Lobo 2007) or the use of favourabil-ity functions (Real et al. 2006, Albert and Thuiller 2008) to convert the species distribution model output to maps of presence or absence.
All these studies focussed on the methods’ ability to correctly reproduce the current distribution pattern of the virtual species. Simple descriptive models were used to create these patterns. Only few studies were concerned with the processes behind those distribution patterns, and simu-lated the virtual ecosystem and driving processes by means of mechanistic modelling (Tyre et al. 2001, Railsback et al. 2003, de Marco et al. 2008, Zurell et al. 2009).
Tyre et al. (2001) examined whether species distribution models are capable of identifying source habitats with high birth rates and low death rates and, thus, whether demo-graphic processes can be inferred from simple distribution patterns. De Marco et al. (2008) evaluated the performance of SDMs coupled with spatial eigenvector mapping under range expansion. Railsback et al. (2003) and Zurell et al. (2009) assessed whether species distribution models are able to project species distribution into the future when species undergo transient dynamics due to environmental change. Species distribution models are increasingly used to project shifts in species distributions for different scenarios of cli-mate change (Thomas et al. 2004, Thuiller 2004) and land use change (Pompe et al. 2008). Since the future is unknown, these expected distributional changes are difficult to evaluate, and the use of species distribution models for global change projections remains hotly debated (Dormann 2007).
Zurell et al. (2009) utilised VE to explore the perfor-mance of species distribution models under climate change scenarios, and tested the effects of transient dynamics and ecological processes on projection accuracies. To accomplish this, they created a virtual ecosystem by means of mechanis-mechanis-tic modelling that included three species, a butterfly, a host plant and a predator, and incorporated species-specific prop-erties and processes such as ecological niche width, disper-sal and reproduction, interspecific ecological processes such
10
different error types on parameter estimation and predictions and, thus, to guide survey efforts accordingly. Extending the VE approach further by using an IBM for the ecological simulation enabled Hilker et al. (2006) to compare the per-formance and data needs of a patch-based SPOM against a grid-based analogue.
Another field of population modelling studied by VE experiments is population viability analysis (PVA). For example, McCarthy et al. (2003) assessed absolute and rela-tive predictions of extinction risks for a total of 160 parame-ter scenarios using the stochastic Ricker model. To scrutinise common assumptions of single-species PVA, Sabo and Gerber (2007) simulated time series of population abun-dance with a stochastic stage-based predator–prey model. Both demographic PVA models and time-series PVA methods were tested for the effect of neglected species inter-actions on predictions of quasi-extinction risk for the prey.
A more challenging task is the parameterisation of spa-tially explicit demographic models from species’ count data. For the development and verification of parameterisation techniques the VE approach can be an (in-)valuable tool. An example was performed by Cabral and Schurr (2009) using hybrid models of species distribution (Fig. 4). The authors aimed to parameterise both the mechanistic demo-graphic model, which simulated the range dynamics of a spe-cies within its suitable habitat, and the observation model, which incorporated sampling error of the survey data set used for parameterisation. With a selected combination of demographic and observation parameter values, they simu-lated virtual data in five different fractal landscapes. Using these virtual survey data, they assessed whether the applied parameterisation framework was able to recover the underly-ing parameters. Although the fitted parameter values could vary around the correct values, the median values over the five different landscapes were strikingly close to the correct values, confirming the suitability of the parameterisation technique.
Discussion
The VE approach provides an important, unifying frame-work to test sampling methods as well as statistical analy-sis and modelling methods (Hilker et al. 2006). More and new methods are constantly appearing in ecology, especially as more computer power becomes available. These meth-ods need to be tested rigorously and continuously before applying them to real data. VE is an intuitive and power-ful method to do so. It has been used in ecology for a long time without being properly recognised or acknowledged. We think that VE deserves a more prominent place in the ecological toolbox.
VE is particularly suitable for synthesising our mechanis-tic understanding of factors influencing our study results: system-immanent properties and processes such as animal movement, methodological aspects such as observer behav-iour and analysis tools as well as interactions of both. The VE models can incorporate an increasing level of complex-ity that allows the separation of different factors, and it can be carried out at spatial and temporal scales that would be impossible to tackle in reality.
virtual ecosystem. In contrast to Kraft et al. (2007), he found inflated type I error rates for some null model tests. Hardy argues that the difference in results are due to differences in the structure of the virtual ecological model, Kraft et al.’s (2007) model being much simpler (based on simple algo-rithms and neglecting individual differences, abundances, the influence of dispersal limitation, and the influence of community size variation). However, Hardy only simulated a neutral community. It would be interesting to see, what happens to the performance of the different indices and null models when applied to a range of distributional patterns generated not by simple filtering algorithms but by mecha-nistic models.
Dynamic (meta-)population modelsThe VE approach has also achieved prominence for models of population dynamics, whenever these are parameterised from data. A class of models which has been extensively explored with VE are metapopulation models or stochastic patch occupancy models (SPOMs, Hanski 1999, Hanski et al. 2000). SPOMs describe metapopulation dynamics in a patch network by rates of local extinction and colonisa-tion and are parameterised either from recorded turnover events or spatial data on patch occupancy. For the lat-ter, Moilanen (1999) presents an improved technique for parameter estimation based on maximising the likelihood of observed transitions in patch occupancy. By evaluating the new method with a VE approach, Moilanen (1999) demon-strates that parameter estimates were generally more accurate than those produced by the original method. In a similar study, the new method showed to be less susceptible to the prediction of spurious trend in metapopulation size than other methods (e.g. logistic regression of turnover rates), especially when only snapshot data from two years is used (Moilanen 2000). While both these studies used exact data, Moilanen (2002) imposed error on the virtual measurements of both patch area and patch occupancy and simulated over-sight of patches during survey in order to study the effect of
Figure 3. Example of a typical VE approach within community ecology.

11
this sounds very similar to VE. However, in model selection the goodness of fit of alternative models can only be evalu-ated on the given data which might be limited and biased. In contrast, VE allows the models to be evaluated against known (virtual) truth. Thus, in a VE study the question is not about how well the model fits the data but how well the model represents (virtual) reality and under which circum-stances it does this.
Limitations
Beside the merits of the virtual ecologist approach, mod-ellers must be aware of possible limitations of VE, which are actually more related to the models used or to the simula-tion design than with VE itself. Foremost, the benefit of VE depends on the quality of the ecological model, and ignores whatever complexity is not covered by the model. Models by definition simplify; the real world is much more complicated, and conclusions drawn from the virtual data sets might be limited. Wunder et al. (2008) point out that when using VE to identify necessary sample sizes to achieve a desired level of accuracy, these values constitute only lower bounds as they were estimated under the controlled conditions of the virtual reality. In the model of Berger et al. (1999), grasshoppers moved according to a random walk. Deviations from this movement behaviour might lead to a different ranking of the observation errors. However, different movement modes can be implemented and tested in the model, as in the example of Mac Nally (2001). Generally, VE is better at discrediting
The behaviour of individual ecologists can be simulated in particular situations and, thus, potential problems aris-ing during data sampling can be extensively explored: lim-ited access to certain areas (e.g. lack of roads, steep slopes); spatial autocorrelation in the samples and in the way ecolo-gists move; interactions with the observation target; vary-ing detection probabilities among other factors. Specific problems can be isolated and thereby better understood. A simulation can help to optimise resources and get an idea of the necessary sampling effort for a desired level of accu-racy, given site access, budget constraints, sampling bias, and current knowledge of the system. This becomes particularly important when we are about to spend a large budget in surveying a large area, for example.
VE allows to compare alternative methods and thereby to theoretically circumscribe their application domain. The most appropriate model for any situation can be selected, i.e. the best modelling approach for a given data set, and crucial data needs for the application of more complex descriptive or even mechanistic models may be identified (Hirzel et al. 2001). This has to be seen different from and is more sophis-ticated than model selection techniques. In model selec-tion the fit of potential models to the data is assessed and models are then ranked according to their predictive power (Burnham and Anderson 2002). For instance, Gotelli et al. (2009) recently proposed a modelling strategy that employs parametric bootstrapping to assess the fit of simulation models and to rank competing models according to their ability to explain large-scale diversity patterns. At first sight,
Figure 4. Schematic representation of the likelihood framework introduced by Cabral and Schurr (2009). The process-based model of range dynamics consists of a demographic and an observation component and is fitted to spatial abundance data. Virtual data is simulated by running the process-based model with predefined, ‘true’ parameter values against which the estimated parameters are evaluated.
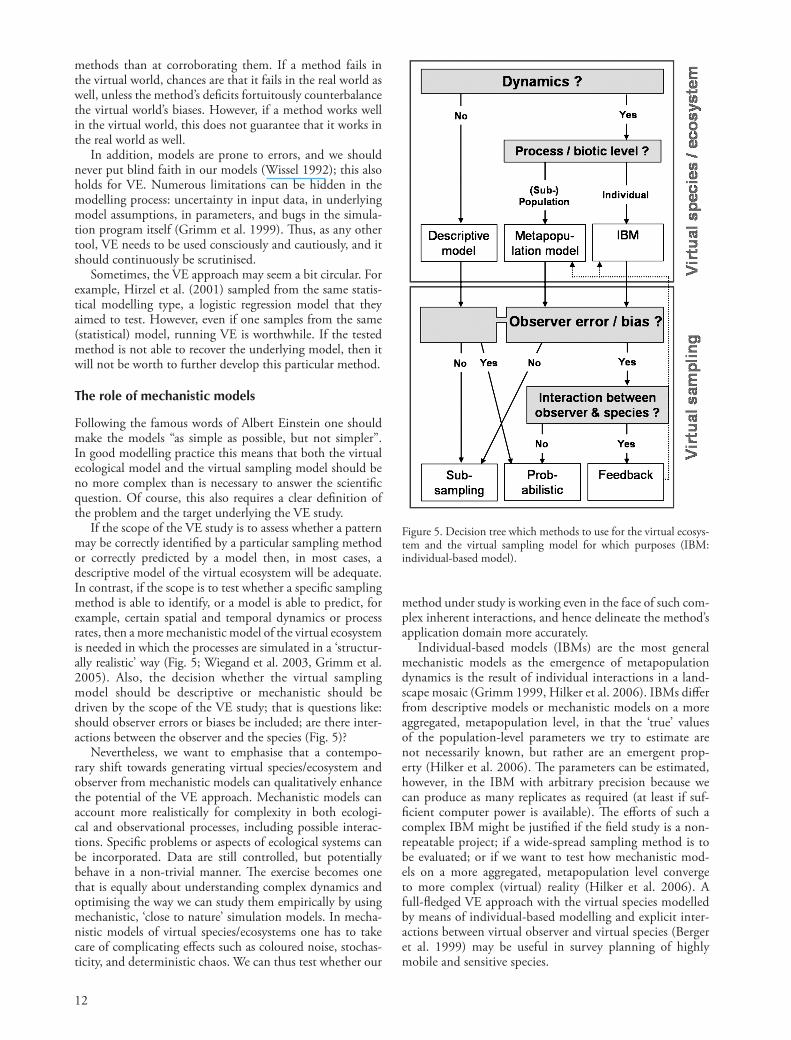
12
method under study is working even in the face of such com-plex inherent interactions, and hence delineate the method’s application domain more accurately.
Individual-based models (IBMs) are the most general mechanistic models as the emergence of metapopulation dynamics is the result of individual interactions in a land-scape mosaic (Grimm 1999, Hilker et al. 2006). IBMs differ from descriptive models or mechanistic models on a more aggregated, metapopulation level, in that the ‘true’ values of the population-level parameters we try to estimate are not necessarily known, but rather are an emergent prop-erty (Hilker et al. 2006). The parameters can be estimated, however, in the IBM with arbitrary precision because we can produce as many replicates as required (at least if suf-ficient computer power is available). The efforts of such a complex IBM might be justified if the field study is a non-repeatable project; if a wide-spread sampling method is to be evaluated; or if we want to test how mechanistic mod-els on a more aggregated, metapopulation level converge to more complex (virtual) reality (Hilker et al. 2006). A full-fledged VE approach with the virtual species modelled by means of individual-based modelling and explicit inter-actions between virtual observer and virtual species (Berger et al. 1999) may be useful in survey planning of highly mobile and sensitive species.
methods than at corroborating them. If a method fails in the virtual world, chances are that it fails in the real world as well, unless the method’s deficits fortuitously counterbalance the virtual world’s biases. However, if a method works well in the virtual world, this does not guarantee that it works in the real world as well.
In addition, models are prone to errors, and we should never put blind faith in our models (Wissel 1992); this also holds for VE. Numerous limitations can be hidden in the modelling process: uncertainty in input data, in underlying model assumptions, in parameters, and bugs in the simula-tion program itself (Grimm et al. 1999). Thus, as any other tool, VE needs to be used consciously and cautiously, and it should continuously be scrutinised.
Sometimes, the VE approach may seem a bit circular. For example, Hirzel et al. (2001) sampled from the same statis-tical modelling type, a logistic regression model that they aimed to test. However, even if one samples from the same (statistical) model, running VE is worthwhile. If the tested method is not able to recover the underlying model, then it will not be worth to further develop this particular method.
The role of mechanistic models
Following the famous words of Albert Einstein one should make the models “as simple as possible, but not simpler”. In good modelling practice this means that both the virtual ecological model and the virtual sampling model should be no more complex than is necessary to answer the scientific question. Of course, this also requires a clear definition of the problem and the target underlying the VE study.
If the scope of the VE study is to assess whether a pattern may be correctly identified by a particular sampling method or correctly predicted by a model then, in most cases, a descriptive model of the virtual ecosystem will be adequate. In contrast, if the scope is to test whether a specific sampling method is able to identify, or a model is able to predict, for example, certain spatial and temporal dynamics or process rates, then a more mechanistic model of the virtual ecosystem is needed in which the processes are simulated in a ‘structur-ally realistic’ way (Fig. 5; Wiegand et al. 2003, Grimm et al. 2005). Also, the decision whether the virtual sampling model should be descriptive or mechanistic should be driven by the scope of the VE study; that is questions like: should observer errors or biases be included; are there inter-actions between the observer and the species (Fig. 5)?
Nevertheless, we want to emphasise that a contempo-rary shift towards generating virtual species/ecosystem and observer from mechanistic models can qualitatively enhance the potential of the VE approach. Mechanistic models can account more realistically for complexity in both ecologi-cal and observational processes, including possible interac-tions. Specific problems or aspects of ecological systems can be incorporated. Data are still controlled, but potentially behave in a non-trivial manner. The exercise becomes one that is equally about understanding complex dynamics and optimising the way we can study them empirically by using mechanistic, ‘close to nature’ simulation models. In mecha-nistic models of virtual species/ecosystems one has to take care of complicating effects such as coloured noise, stochas-ticity, and deterministic chaos. We can thus test whether our
Figure 5. Decision tree which methods to use for the virtual ecosys-tem and the virtual sampling model for which purposes (IBM: individual-based model).
13
new questions for empirical research. Also, field work could be oriented more directly towards data needs modellers have for specific modelling tasks. Looking at their models from the perspective of optimising empirical work might make work of theoreticians more valuable, and also it might help to better understand the system.
Acknowledgements – We would like to thank J.A.F. Diniz-Filho and T.F.L.V.B. Rangel for valuable comments.
References
Albert, C. H. and Thuiller, W. 2008. Favourability functions versus probability of presence: advantages and misuses. – Ecography 31: 417–422.
Araújo, M. B. and Rahbek, C. 2006. How does climate change affect biodiversity? – Science 313: 1396–1397.
Austin, M. P. et al. 2006. Evaluation of statistical models used for predicting plant species distributions: role of artificial data and theory. – Ecol. Modell. 199: 197–216.
Berger, U. et al. 1999. Virtual biologists observe virtual grasshop-pers: an assessment of different mobility parameters for the analysis of movement patterns. – Ecol. Modell. 115: 119–127.
Bolker, B. M. 2008. Ecological models and data in R. – Princeton Univ. Press.
Burnham, K. P. and Anderson, D. R. 2002. Model selection and multimodel inference: a practical–theoretic approach. – Springer.
Cabral, J. S. and Schurr, F. M. 2009. Estimating demographic models for the range dynamics of plant species. – Global. Ecol. Biogeogr. doi: 10.1111/j.1466-8238.2009.00492.x.
Crist, T. O. and Wiens, J. A. 1995. Individual movements and estimation of population size in darkling beetles (Coleoptera: Tenebrionidae). – J. Anim. Ecol. 64: 733–746.
DeAngelis, D. L. and Mooij, W. M. 2005. Individual-based mod-elling of ecological and evolutionary processes. – Annu. Rev. Ecol. Evol. Syst. 36: 147–168.
Dormann, C. F. 2007. Promising the future? Global change projec-tions of species distributions. – Basic Appl. Ecol. 8: 387–397.
Dormann, C. F. et al. 2007. Methods to account for spatial autocor-relation in the analysis of species distributional data: a review. – Ecography 30: 609–628.
Fischer, J. and Lindenmayer, D. B. 2002. Treating the nestedness temperature calculator as a black box can lead to false conclu-sions. – Oikos 99: 193–199.
Fortin, M.-J. et al. 1989. Spatial autocorrelation and sampling design in plant ecology. – Vegetatio 83: 209–222.
Gotelli, N. J. et al. 2009. Patterns and causes of species richness: a general simulation model for macroecology. – Ecol. Lett. 12: 873–886.
Greve, M. and Chown, S. L. 2006. Endemicity biases nestedness metrics: a demonstration, explanation and solution. – Ecogra-phy 29: 347–356.
Grimm, V. 1999. Ten years of individual-based modelling in ecol-ogy: what have we learned and what could we learn in the future? – Ecol. Modell. 115: 129–148.
Grimm, V. and Railsback, S. F. 2005. Individual-based modeling and ecology. – Princeton Univ. Press.
Grimm, V. et al. 1999. Individual-based modelling and ecological theory: synthesis of a workshop. – Ecol. Modell. 115: 275–282.
Grimm, V. et al. 2005. Pattern-oriented modeling of agent-based complex systems: lessons from ecology. – Science 310: 987–991.
Gruber, B. et al. 2008. A new method for estimating visitation rates of cryptic animals via repeated surveys of indirect signs. – J. Appl. Ecol. 45: 728–735.
Future directions
We have shown various applications and research fields where the virtual ecologist approach has been successfully employed, and has proven itself as a practical and worthwhile tool. As pointed out throughout this review, the approach is not yet fully explored and many more aspects of ecological surveys and modelling tasks can be addressed with VE.
The ecological community holds enormous stocks of data collected, for example, in herbaria; by voluntary or hobby ornithologists, entomologists; nature conservationists; PhD students etc. Sometimes trust in this data is rather limited because of suspected bias in survey design or observer behav-iour. For instance, volunteers monitoring butterflies will often preferentially visit places where they expect to find the most enigmatic and interesting species. Conversely, places where observers do not expect to find many species are likely to not be monitored properly or only very short visits will be paid to such places. Through such unequal observer effort fallacious absences (and also presences) might be induced with unknown effects for subsequent data analyses. Here, VE could help to assess potential effects rigorously and to assess sampling bias if information on the observer effort is available; the data could then be corrected by these estimated values. However, we want to stress that VE is no panacea for flawed survey designs. It can merely be a way to salvage at least some of the information in the data.
Another important research field for which VE holds great potential for the future is global change research. Railsback et al. (2003), Cabral and Schurr (2009) and Zurell et al. (2009) show that VE can help to evaluate models which are intended to project species distributions into the future for different scenarios of environmental change. The effects of many other factors potentially complicating global change projections could be explored with VE: changing biotic inter-actions or spatially dependent biotic interactions that only take place at the edges of species distributions, behavioural adaptation, evolutionary effects, invasions, climatic extremes or catastrophic events. The VE approach would also allow to assess projections that address the effects of climate change or land use change for individual species with particular spe-cies-environment relationships, or to integrate species with different functional characteristics into assessing the effects of global change in whole communities or ecosystems.
In addition to these potential future directions, the virtual ecologist approach could, if it were used more routinely in the future, have more general and perhaps even more impor-tant benefits: it could foster the integration of theoretical and empirical work. Empiricists are often unaware of the potentials and limitations of ecological models, and the same holds for theoreticians regarding field work and sampling methods. Working together on the development of sampling methods, designs and efforts by using the VE approach could help overcome this mutual ignorance. It could help practi-tioners to better plan their work. It could help modellers to increase the practical value of their work. It could also stimu-late work that goes far beyond sampling methods. While try-ing to test sampling methods, new and interesting ecological models and even theories might emerge; and while trying to use existing models for testing sampling methods, ecological models might become more realistic in structure and lead to
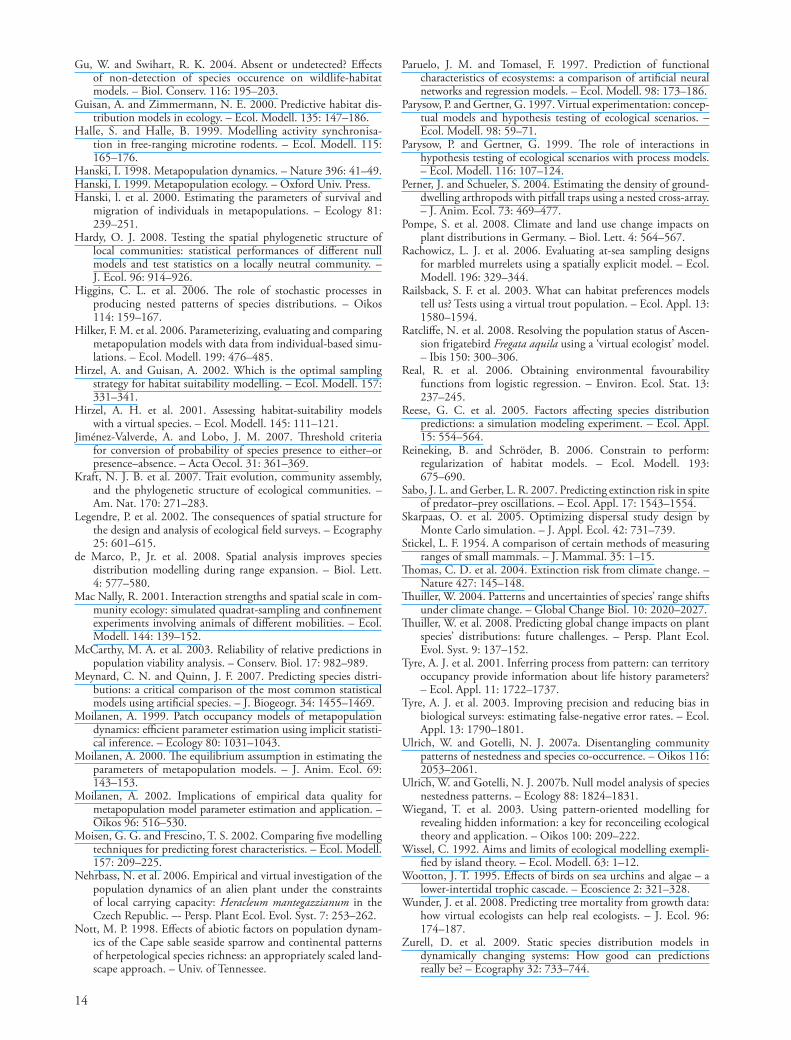
14
Paruelo, J. M. and Tomasel, F. 1997. Prediction of functional characteristics of ecosystems: a comparison of artificial neural networks and regression models. – Ecol. Modell. 98: 173–186.
Parysow, P. and Gertner, G. 1997. Virtual experimentation: concep-tual models and hypothesis testing of ecological scenarios. – Ecol. Modell. 98: 59–71.
Parysow, P. and Gertner, G. 1999. The role of interactions in hypothesis testing of ecological scenarios with process models. – Ecol. Modell. 116: 107–124.
Perner, J. and Schueler, S. 2004. Estimating the density of ground-dwelling arthropods with pitfall traps using a nested cross-array. – J. Anim. Ecol. 73: 469–477.
Pompe, S. et al. 2008. Climate and land use change impacts on plant distributions in Germany. – Biol. Lett. 4: 564–567.
Rachowicz, L. J. et al. 2006. Evaluating at-sea sampling designs for marbled murrelets using a spatially explicit model. – Ecol. Modell. 196: 329–344.
Railsback, S. F. et al. 2003. What can habitat preferences models tell us? Tests using a virtual trout population. – Ecol. Appl. 13: 1580–1594.
Ratcliffe, N. et al. 2008. Resolving the population status of Ascen-sion frigatebird Fregata aquila using a ‘virtual ecologist’ model. – Ibis 150: 300–306.
Real, R. et al. 2006. Obtaining environmental favourability functions from logistic regression. – Environ. Ecol. Stat. 13: 237–245.
Reese, G. C. et al. 2005. Factors affecting species distribution predictions: a simulation modeling experiment. – Ecol. Appl. 15: 554–564.
Reineking, B. and Schröder, B. 2006. Constrain to perform: regularization of habitat models. – Ecol. Modell. 193: 675–690.
Sabo, J. L. and Gerber, L. R. 2007. Predicting extinction risk in spite of predator–prey oscillations. – Ecol. Appl. 17: 1543–1554.
Skarpaas, O. et al. 2005. Optimizing dispersal study design by Monte Carlo simulation. – J. Appl. Ecol. 42: 731–739.
Stickel, L. F. 1954. A comparison of certain methods of measuring ranges of small mammals. – J. Mammal. 35: 1–15.
Thomas, C. D. et al. 2004. Extinction risk from climate change. – Nature 427: 145–148.
Thuiller, W. 2004. Patterns and uncertainties of species’ range shifts under climate change. – Global Change Biol. 10: 2020–2027.
Thuiller, W. et al. 2008. Predicting global change impacts on plant species’ distributions: future challenges. – Persp. Plant Ecol. Evol. Syst. 9: 137–152.
Tyre, A. J. et al. 2001. Inferring process from pattern: can territory occupancy provide information about life history parameters? – Ecol. Appl. 11: 1722–1737.
Tyre, A. J. et al. 2003. Improving precision and reducing bias in biological surveys: estimating false-negative error rates. – Ecol. Appl. 13: 1790–1801.
Ulrich, W. and Gotelli, N. J. 2007a. Disentangling community patterns of nestedness and species co-occurrence. – Oikos 116: 2053–2061.
Ulrich, W. and Gotelli, N. J. 2007b. Null model analysis of species nestedness patterns. – Ecology 88: 1824–1831.
Wiegand, T. et al. 2003. Using pattern-oriented modelling for revealing hidden information: a key for reconceiling ecological theory and application. – Oikos 100: 209–222.
Wissel, C. 1992. Aims and limits of ecological modelling exempli-fied by island theory. – Ecol. Modell. 63: 1–12.
Wootton, J. T. 1995. Effects of birds on sea urchins and algae – a lower-intertidal trophic cascade. – Ecoscience 2: 321–328.
Wunder, J. et al. 2008. Predicting tree mortality from growth data: how virtual ecologists can help real ecologists. – J. Ecol. 96: 174–187.
Zurell, D. et al. 2009. Static species distribution models in dynamically changing systems: How good can predictions really be? – Ecography 32: 733–744.
Gu, W. and Swihart, R. K. 2004. Absent or undetected? Effects of non-detection of species occurence on wildlife-habitat models. – Biol. Conserv. 116: 195–203.
Guisan, A. and Zimmermann, N. E. 2000. Predictive habitat dis-tribution models in ecology. – Ecol. Modell. 135: 147–186.
Halle, S. and Halle, B. 1999. Modelling activity synchronisa-tion in free-ranging microtine rodents. – Ecol. Modell. 115: 165–176.
Hanski, I. 1998. Metapopulation dynamics. – Nature 396: 41–49.Hanski, I. 1999. Metapopulation ecology. – Oxford Univ. Press.Hanski, l. et al. 2000. Estimating the parameters of survival and
migration of individuals in metapopulations. – Ecology 81: 239–251.
Hardy, O. J. 2008. Testing the spatial phylogenetic structure of local communities: statistical performances of different null models and test statistics on a locally neutral community. – J. Ecol. 96: 914–926.
Higgins, C. L. et al. 2006. The role of stochastic processes in producing nested patterns of species distributions. – Oikos 114: 159–167.
Hilker, F. M. et al. 2006. Parameterizing, evaluating and comparing metapopulation models with data from individual-based simu-lations. – Ecol. Modell. 199: 476–485.
Hirzel, A. and Guisan, A. 2002. Which is the optimal sampling strategy for habitat suitability modelling. – Ecol. Modell. 157: 331–341.
Hirzel, A. H. et al. 2001. Assessing habitat-suitability models with a virtual species. – Ecol. Modell. 145: 111–121.
Jiménez-Valverde, A. and Lobo, J. M. 2007. Threshold criteria for conversion of probability of species presence to either–or presence–absence. – Acta Oecol. 31: 361–369.
Kraft, N. J. B. et al. 2007. Trait evolution, community assembly, and the phylogenetic structure of ecological communities. – Am. Nat. 170: 271–283.
Legendre, P. et al. 2002. The consequences of spatial structure for the design and analysis of ecological field surveys. – Ecography 25: 601–615.
de Marco, P., Jr. et al. 2008. Spatial analysis improves species distribution modelling during range expansion. – Biol. Lett. 4: 577–580.
Mac Nally, R. 2001. Interaction strengths and spatial scale in com-munity ecology: simulated quadrat-sampling and confinement experiments involving animals of different mobilities. – Ecol. Modell. 144: 139–152.
McCarthy, M. A. et al. 2003. Reliability of relative predictions in population viability analysis. – Conserv. Biol. 17: 982–989.
Meynard, C. N. and Quinn, J. F. 2007. Predicting species distri-butions: a critical comparison of the most common statistical models using artificial species. – J. Biogeogr. 34: 1455–1469.
Moilanen, A. 1999. Patch occupancy models of metapopulation dynamics: efficient parameter estimation using implicit statisti-cal inference. – Ecology 80: 1031–1043.
Moilanen, A. 2000. The equilibrium assumption in estimating the parameters of metapopulation models. – J. Anim. Ecol. 69: 143–153.
Moilanen, A. 2002. Implications of empirical data quality for metapopulation model parameter estimation and application. – Oikos 96: 516–530.
Moisen, G. G. and Frescino, T. S. 2002. Comparing five modelling techniques for predicting forest characteristics. – Ecol. Modell. 157: 209–225.
Nehrbass, N. et al. 2006. Empirical and virtual investigation of the population dynamics of an alien plant under the constraints of local carrying capacity: Heracleum mantegazzianum in the Czech Republic. –- Persp. Plant Ecol. Evol. Syst. 7: 253–262.
Nott, M. P. 1998. Effects of abiotic factors on population dynam-ics of the Cape sable seaside sparrow and continental patterns of herpetological species richness: an appropriately scaled land-scape approach. – Univ. of Tennessee.