Informing Observers: Quality-driven Filtering and Composition of Web 2.0 Sources Donato Barbagallo, Cinzia Cappiello, Chiara Francalanci, Maristella Matera, Matteo Picozzi Politecnico di Milano, DEI Piazza Leonardo da Vinci, 32 20133 – Milano - Italy +39 02 2399 3400 [name.surname]@polimi.it ABSTRACT Current Web technologies enable an active role of users, who can create and share their contents very easily. This mass of information includes opinions about a variety of key interest topics and represents a new and invaluable source of marketing information. Public and private organizations that aim at understanding and analyzing this unsolicited feedback need adequate platforms that can support the detection and monitoring of key topics. Hence, there is an emerging trend towards automated market intelligence and the crafting of tools that allow monitoring in a mechanized fashion. We therefore present an approach that is based on quality of Web 2.0 sources as the key factor for information filtering and also allows the users to flexibly and easily compose their analysis environments thanks to the adoption of a mashup platform. Categories and Subject Descriptors D.2.8. [Measures]: Product Measures. D.2.10 [Design]: Methodologies. H.3.3 [Information Search and Retrieval]: Search Process. H.4 [Information Systems Applications]: Decision Support. H.5.4 [Hypertext/Hypermedia]: Architectures, Navigaton. General Terms Measurement, Design, Experimentation, Human Factors. Keywords Quality in Web 2.0, Reputation of Web sources, Sentiment Analysis, Mashups. 1. INTRODUCTION Current Web sources, particularly based on the users’ participation, are able to daily provide high volumes of heterogeneous data containing opinions about a variety of key interest topics (e.g., products, brands, services, or any subject of interest for users). Currently, these unsolicited feedbacks represent a new and invaluable source of information for the organizations that aim at understanding customers’ behavior and market trends. However, the size of this information base and its pace of change make manual market monitoring almost impossible and increase the difficulties in the identification of relevant and useful content. In fact, Web browsing is mainly supported by search engines that are general-purpose tools and, although efficient and commonly effective, sometimes are not able to satisfy the users’ expectations [12]. Due to the plethora of contents currently available on the Web and their heterogeneous nature, people and organizations not only need effective mechanisms to discover information, but also solutions to identify dependable and trustable services, fulfilling quality requirements, and to filter the provided contents based on specific information needs. This paper discusses models, methods and technologies for supporting the access, filtering and analysis of data sources based on their quality. Covering these requirements raises a number of issues. First, relevant and authoritative Web sources must be selected. We will show that grounding the analysis of sources on data quality dimensions improves this task. Second, the end users should be able to compose on-demand the information access functionalities they need. We therefore propose a mashup paradigm for the creation of personalized Web access environments from a set of services for information access and filtering, which is in line with some emerging requirements for end-user programming [1]. The remainder of this paper is organized as follows. Section 2 reviews the main contributions related to the definition of quality models for Web 2.0 sources. In Section 3, we propose a quality model for the evaluation of authoritative Web sources. Section 4 illustrates some experiments that we have conducted to validate the basic assumptions on which the quality model is based. Section 5 describes the main methodological and technological ingredients to achieve the quality-based filtering and composition of dependable information sources, while Section 6 describes a concrete application of the proposed quality-driven framework for sentiment analysis. Section 7 finally draws our conclusions. 2. RELATED WORKS The literature lacks quality models for the selection of relevant and authoritative Web 2.0 sources. Some works focus on the notion of reputation, defined as the general opinion about a person, a company, or an object [16]. Reputation is particularly significant to support decisions based on Internet-based service provisioning: in this context, it can be defined as a collective measure of trustworthiness based on the referrals or ratings from Permission to make digital or hard copies of all or part of this work for personal or classroom use is granted without fee provided that copies are not made or distributed for profit or commercial advantage and that copies bear this notice and the full citation on the first page. To copy otherwise, or republish, to post on servers or to redistribute to lists, requires prior specific permission and/or a fee. Conference’10, Month 1–2, 2010, City, State, Country. Copyright 2010 ACM 1-58113-000-0/00/0010…$10.00.

Welcome message from author
This document is posted to help you gain knowledge. Please leave a comment to let me know what you think about it! Share it to your friends and learn new things together.
Transcript
Informing Observers: Quality-driven Filtering and Composition of Web 2.0 Sources
Donato Barbagallo, Cinzia Cappiello, Chiara Francalanci, Maristella Matera, Matteo Picozzi
Politecnico di Milano, DEI
Piazza Leonardo da Vinci, 32 20133 – Milano - Italy
+39 02 2399 3400
[name.surname]@polimi.it
ABSTRACT Current Web technologies enable an active role of users, who can create and share their contents very easily. This mass of information includes opinions about a variety of key interest topics and represents a new and invaluable source of marketing information. Public and private organizations that aim at understanding and analyzing this unsolicited feedback need adequate platforms that can support the detection and monitoring of key topics. Hence, there is an emerging trend towards automated market intelligence and the crafting of tools that allow monitoring in a mechanized fashion. We therefore present an approach that is based on quality of Web 2.0 sources as the key factor for information filtering and also allows the users to flexibly and easily compose their analysis environments thanks to the adoption of a mashup platform.
Categories and Subject Descriptors D.2.8. [Measures]: Product Measures. D.2.10 [Design]: Methodologies. H.3.3 [Information Search and Retrieval]: Search Process. H.4 [Information Systems Applications]: Decision Support. H.5.4 [Hypertext/Hypermedia]: Architectures, Navigaton.
General Terms Measurement, Design, Experimentation, Human Factors.
Keywords Quality in Web 2.0, Reputation of Web sources, Sentiment Analysis, Mashups.
1. INTRODUCTION Current Web sources, particularly based on the users’ participation, are able to daily provide high volumes of heterogeneous data containing opinions about a variety of key interest topics (e.g., products, brands, services, or any subject of interest for users). Currently, these unsolicited feedbacks represent a new and invaluable source of information for the organizations that aim at understanding customers’ behavior and
market trends. However, the size of this information base and its pace of change make manual market monitoring almost impossible and increase the difficulties in the identification of relevant and useful content. In fact, Web browsing is mainly supported by search engines that are general-purpose tools and, although efficient and commonly effective, sometimes are not able to satisfy the users’ expectations [12]. Due to the plethora of contents currently available on the Web and their heterogeneous nature, people and organizations not only need effective mechanisms to discover information, but also solutions to identify dependable and trustable services, fulfilling quality requirements, and to filter the provided contents based on specific information needs.
This paper discusses models, methods and technologies for supporting the access, filtering and analysis of data sources based on their quality. Covering these requirements raises a number of issues. First, relevant and authoritative Web sources must be selected. We will show that grounding the analysis of sources on data quality dimensions improves this task. Second, the end users should be able to compose on-demand the information access functionalities they need. We therefore propose a mashup paradigm for the creation of personalized Web access environments from a set of services for information access and filtering, which is in line with some emerging requirements for end-user programming [1].
The remainder of this paper is organized as follows. Section 2 reviews the main contributions related to the definition of quality models for Web 2.0 sources. In Section 3, we propose a quality model for the evaluation of authoritative Web sources. Section 4 illustrates some experiments that we have conducted to validate the basic assumptions on which the quality model is based. Section 5 describes the main methodological and technological ingredients to achieve the quality-based filtering and composition of dependable information sources, while Section 6 describes a concrete application of the proposed quality-driven framework for sentiment analysis. Section 7 finally draws our conclusions.
2. RELATED WORKS The literature lacks quality models for the selection of relevant and authoritative Web 2.0 sources. Some works focus on the notion of reputation, defined as the general opinion about a person, a company, or an object [16]. Reputation is particularly significant to support decisions based on Internet-based service provisioning: in this context, it can be defined as a collective measure of trustworthiness based on the referrals or ratings from
Permission to make digital or hard copies of all or part of this work for personal or classroom use is granted without fee provided that copies are not made or distributed for profit or commercial advantage and that copies bear this notice and the full citation on the first page. To copy otherwise, or republish, to post on servers or to redistribute to lists, requires prior specific permission and/or a fee. Conference’10, Month 1–2, 2010, City, State, Country. Copyright 2010 ACM 1-58113-000-0/00/0010…$10.00.
members in a community. Few contributions address the concept of reputation of a generic Web object in terms of its credibility. For example, Rieh and Danielson [19] show that credibility is usually related to authority, quality, trust, and persuasion and is influenced by both superficial factors (e.g., design look, advertisement, information structure, company motive) and deeper aspects (e.g., usefulness and accuracy of information). Since Web credibility is seen as a user experience, Bilenko and White [8] evaluate the credibility of Web sites in terms of the user experience, monitoring features emerging from usage logs, such as dwell time and visit counts. Pun and Lochovsky [18] define the reputation of a Web source by considering quality dimensions such as cohesiveness, popularity, visual appearance, appropriateness, minimality, and navigation design. Akamine et al. [1] propose the WISDOM tool for the automatic classification of Web information sources based on credibility of information contents, credibility of information sender, and credibility of documents (from style and superficial evaluation). Special evaluation criteria for the reputation of Web 2.0 sources have been proposed by Conrad et al. [13]. They take into account several features, ranging from users’ participation to content grammatical accuracy. However, their measures only apply to Web blogs. Spelling errors are also considered as a rough but effective measure of source reputation by Gelman and Barletta [4]. Even in this case, the proposed indicator is applied only to Wikipedia pages.
Special focus needs to be put on the user-centered, participatory nature of the emergent Web 2.0 applications. This dimension indeed introduces new quality concerns, mainly related to the quality of user-created contents and the level of user participation. Especially when contents have to be analyzed to understand customers’ behavior and opinions, the quality of a Web 2.0 source depends on the accuracy of the user-provided contents and is influenced by the relevance of contents with respect to an analysis domain. The quality of the user participation also plays a fundamental role: the higher the participation of users in a Web 2.0 application, the higher the availability of contents. The user participation is in turn related to the user-perceived quality of the Web resource. However, the notion of user-perceived quality in Web 2.0 not always corresponds to the traditional notion of Web quality. For example, the diffusion of Facebook is undeniable, but the reasons behind the consensus of the user community remain unclear if explained in the light of Web quality dimensions [14]. One reason is that the usefulness of the retrieved information from the users’ point of view, in other words the relevance of contents with respect to some interesting entities, is still underestimated [14]. Some recent proposals highlight the importance of users’ participation and accuracy of user-provided contents. However, as already mentioned before, the limit of such works is that their models only apply to specific classes of Web 2.0 sources (e.g., Web blogs [13] or Wikipedia pages [4]).
3. QUALITY MODEL Given the lack of adequate and generally valid approaches, we propose a quality model in which some dimensions capture not only the intrinsic quality of contents, but also their relevance with respect to an analysis domain, and the quality of user participation, for any Web 2.0 resource enabling user-based content creation. In line with other recent proposals on the quality of Web 2.0 sources [1], our model gives a central role to the quality of user-provided contents. We therefore capitalize on a
previous classification of data quality dimensions [5], where accuracy, completeness, and time are proposed as fundamental data quality dimensions in any contexts, and interpretability, authority, and dependability are considered for semi-structured and non-structured sources of information, and thus are adequate to assess the quality of user-created contents. We have however revisited such “traditional” data quality dimensions to better express the relevance of the user-provided contents and the quality of the user participation. For example, the accuracy dimension, which traditionally corresponds to the notion of values correctness, in Web 2.0 should measure not only the capability of the source to provide correct content, but also the coherence of the user created content with the topics on which the source is focused. Thus, out of scope discussions are considered as errors. In order to emphasize the relevance of the source contents with respect to some “interesting” entities, our model assumes the identification of a specific Domain of Interest (DI), which can be expressed as a set of variables delimiting the context of the analysis. DI can be for example expressed as
DI ={<c1, c2, …,cn>, t, <l1, l2,…,lm>} to specify different categories of contents (<ci, c2,…,cn>) describing the main topics that are relevant for the analysis of the user-provided contents, a given time interval (t), and a set of geographical locations (<li, l2,…,lm>) that can further help to assess the relevance of the source content with respect to the analysis goal. Any other domain variable could be included in the domain representation to capture any specific analysis goal.
Based on the assumption that DI provides the context of the analysis, we have identified some attributes that refine the data quality dimensions to focus on:
• Relevance: degree of specialization of the source in a given domain (e.g., tourism).
• Breadth of contributions: overall range of issues on which the source can provide information.
• Traffic: overall volume of information produced and exchanged in a given time frame.
• Liveliness: responsiveness to new issues or events. The first two attributes concentrate on the adherence of contents to the selected DI; the last two attributes instead focus more on the users’ participation.
Assessing the quality of a Web 2.0 source according to the dimensions and the attributes previously introduced could not be enough when dealing with services such as Facebook or Twitter, where the focus on the person as an individual is pivotal. Indeed, in these sources, the trustworthiness of the content mostly depends on the quality of the contribution of the single users, and by the ability of the participating users to trigger relevant discussions, influence and spread ideas, also leveraging innovation [20][10].
With respect to this specific context, the literature has recently focused on opinion leaders, the so-called influencers [20] [11]. Therefore, we propose two different models to assess quality at the source level and at the contributors’ level.
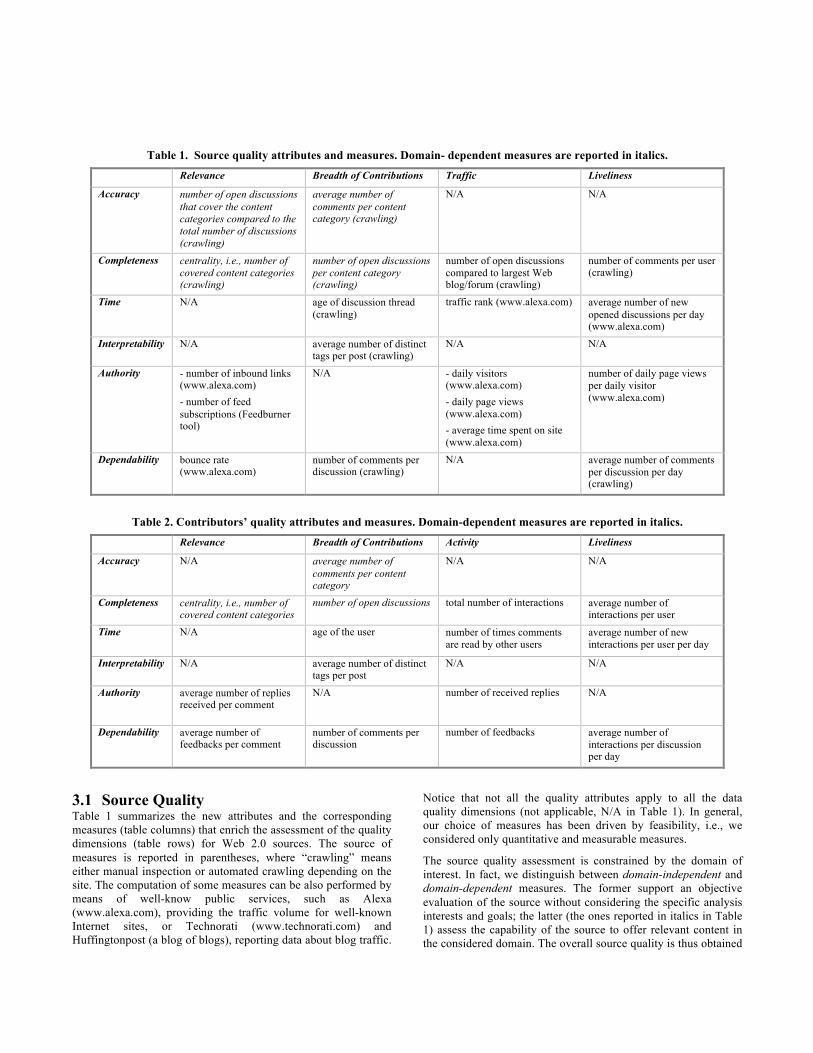
Table 1. Source quality attributes and measures. Domain- dependent measures are reported in italics.
Relevance Breadth of Contributions Traffic Liveliness
Accuracy number of open discussions that cover the content categories compared to the total number of discussions (crawling)
average number of comments per content category (crawling)
N/A N/A
Completeness centrality, i.e., number of covered content categories (crawling)
number of open discussions per content category (crawling)
number of open discussions compared to largest Web blog/forum (crawling)
number of comments per user (crawling)
Time N/A age of discussion thread (crawling)
traffic rank (www.alexa.com) average number of new opened discussions per day (www.alexa.com)
Interpretability N/A average number of distinct tags per post (crawling)
N/A N/A
Authority - number of inbound links (www.alexa.com) - number of feed subscriptions (Feedburner tool)
N/A - daily visitors (www.alexa.com) - daily page views (www.alexa.com) - average time spent on site (www.alexa.com)
number of daily page views per daily visitor (www.alexa.com)
Dependability bounce rate (www.alexa.com)
number of comments per discussion (crawling)
N/A average number of comments per discussion per day (crawling)
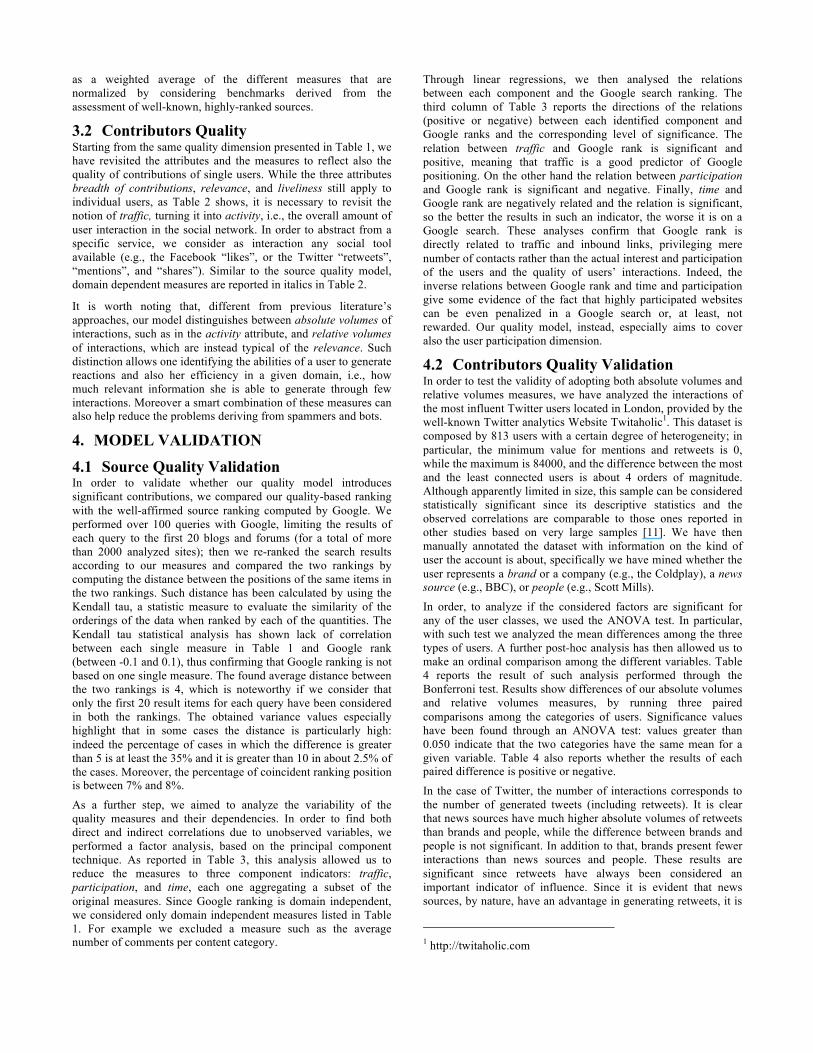
Table 2. Contributors’ quality attributes and measures. Domain-dependent measures are reported in italics.
Relevance Breadth of Contributions Activity Liveliness
Accuracy N/A average number of comments per content category
N/A N/A
Completeness centrality, i.e., number of covered content categories
number of open discussions total number of interactions average number of interactions per user
Time N/A age of the user number of times comments are read by other users
average number of new interactions per user per day
Interpretability N/A average number of distinct tags per post
N/A N/A
Authority average number of replies received per comment
N/A number of received replies N/A
Dependability average number of feedbacks per comment
number of comments per discussion
number of feedbacks average number of interactions per discussion per day
3.1 Source Quality Table 1 summarizes the new attributes and the corresponding measures (table columns) that enrich the assessment of the quality dimensions (table rows) for Web 2.0 sources. The source of measures is reported in parentheses, where “crawling” means either manual inspection or automated crawling depending on the site. The computation of some measures can be also performed by means of well-know public services, such as Alexa (www.alexa.com), providing the traffic volume for well-known Internet sites, or Technorati (www.technorati.com) and Huffingtonpost (a blog of blogs), reporting data about blog traffic.
Notice that not all the quality attributes apply to all the data quality dimensions (not applicable, N/A in Table 1). In general, our choice of measures has been driven by feasibility, i.e., we considered only quantitative and measurable measures.
The source quality assessment is constrained by the domain of interest. In fact, we distinguish between domain-independent and domain-dependent measures. The former support an objective evaluation of the source without considering the specific analysis interests and goals; the latter (the ones reported in italics in Table 1) assess the capability of the source to offer relevant content in the considered domain. The overall source quality is thus obtained
as a weighted average of the different measures that are normalized by considering benchmarks derived from the assessment of well-known, highly-ranked sources.
3.2 Contributors Quality Starting from the same quality dimension presented in Table 1, we have revisited the attributes and the measures to reflect also the quality of contributions of single users. While the three attributes breadth of contributions, relevance, and liveliness still apply to individual users, as Table 2 shows, it is necessary to revisit the notion of traffic, turning it into activity, i.e., the overall amount of user interaction in the social network. In order to abstract from a specific service, we consider as interaction any social tool available (e.g., the Facebook “likes”, or the Twitter “retweets”, “mentions”, and “shares”). Similar to the source quality model, domain dependent measures are reported in italics in Table 2.
It is worth noting that, different from previous literature’s approaches, our model distinguishes between absolute volumes of interactions, such as in the activity attribute, and relative volumes of interactions, which are instead typical of the relevance. Such distinction allows one identifying the abilities of a user to generate reactions and also her efficiency in a given domain, i.e., how much relevant information she is able to generate through few interactions. Moreover a smart combination of these measures can also help reduce the problems deriving from spammers and bots.
4. MODEL VALIDATION
4.1 Source Quality Validation In order to validate whether our quality model introduces significant contributions, we compared our quality-based ranking with the well-affirmed source ranking computed by Google. We performed over 100 queries with Google, limiting the results of each query to the first 20 blogs and forums (for a total of more than 2000 analyzed sites); then we re-ranked the search results according to our measures and compared the two rankings by computing the distance between the positions of the same items in the two rankings. Such distance has been calculated by using the Kendall tau, a statistic measure to evaluate the similarity of the orderings of the data when ranked by each of the quantities. The Kendall tau statistical analysis has shown lack of correlation between each single measure in Table 1 and Google rank (between -0.1 and 0.1), thus confirming that Google ranking is not based on one single measure. The found average distance between the two rankings is 4, which is noteworthy if we consider that only the first 20 result items for each query have been considered in both the rankings. The obtained variance values especially highlight that in some cases the distance is particularly high: indeed the percentage of cases in which the difference is greater than 5 is at least the 35% and it is greater than 10 in about 2.5% of the cases. Moreover, the percentage of coincident ranking position is between 7% and 8%.
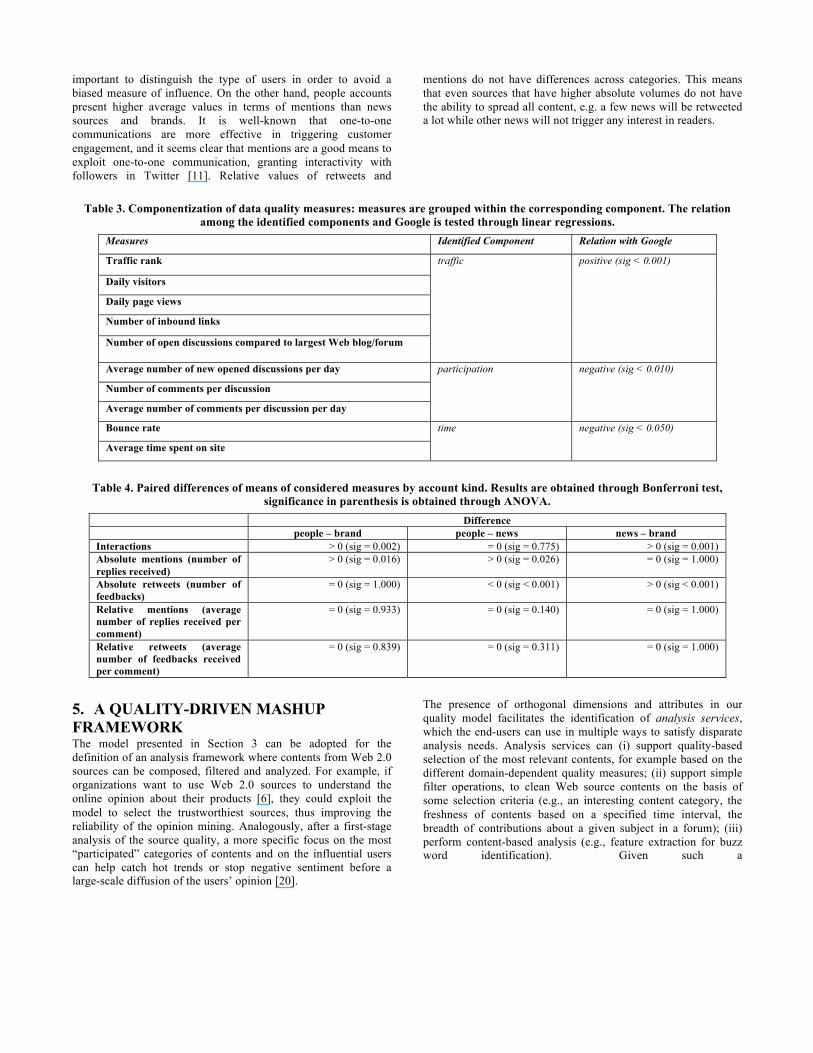
As a further step, we aimed to analyze the variability of the quality measures and their dependencies. In order to find both direct and indirect correlations due to unobserved variables, we performed a factor analysis, based on the principal component technique. As reported in Table 3, this analysis allowed us to reduce the measures to three component indicators: traffic, participation, and time, each one aggregating a subset of the original measures. Since Google ranking is domain independent, we considered only domain independent measures listed in Table 1. For example we excluded a measure such as the average number of comments per content category.
Through linear regressions, we then analysed the relations between each component and the Google search ranking. The third column of Table 3 reports the directions of the relations (positive or negative) between each identified component and Google ranks and the corresponding level of significance. The relation between traffic and Google rank is significant and positive, meaning that traffic is a good predictor of Google positioning. On the other hand the relation between participation and Google rank is significant and negative. Finally, time and Google rank are negatively related and the relation is significant, so the better the results in such an indicator, the worse it is on a Google search. These analyses confirm that Google rank is directly related to traffic and inbound links, privileging mere number of contacts rather than the actual interest and participation of the users and the quality of users’ interactions. Indeed, the inverse relations between Google rank and time and participation give some evidence of the fact that highly participated websites can be even penalized in a Google search or, at least, not rewarded. Our quality model, instead, especially aims to cover also the user participation dimension.
4.2 Contributors Quality Validation In order to test the validity of adopting both absolute volumes and relative volumes measures, we have analyzed the interactions of the most influent Twitter users located in London, provided by the well-known Twitter analytics Website Twitaholic1. This dataset is composed by 813 users with a certain degree of heterogeneity; in particular, the minimum value for mentions and retweets is 0, while the maximum is 84000, and the difference between the most and the least connected users is about 4 orders of magnitude. Although apparently limited in size, this sample can be considered statistically significant since its descriptive statistics and the observed correlations are comparable to those ones reported in other studies based on very large samples [11]. We have then manually annotated the dataset with information on the kind of user the account is about, specifically we have mined whether the user represents a brand or a company (e.g., the Coldplay), a news source (e.g., BBC), or people (e.g., Scott Mills).
In order, to analyze if the considered factors are significant for any of the user classes, we used the ANOVA test. In particular, with such test we analyzed the mean differences among the three types of users. A further post-hoc analysis has then allowed us to make an ordinal comparison among the different variables. Table 4 reports the result of such analysis performed through the Bonferroni test. Results show differences of our absolute volumes and relative volumes measures, by running three paired comparisons among the categories of users. Significance values have been found through an ANOVA test: values greater than 0.050 indicate that the two categories have the same mean for a given variable. Table 4 also reports whether the results of each paired difference is positive or negative.
In the case of Twitter, the number of interactions corresponds to the number of generated tweets (including retweets). It is clear that news sources have much higher absolute volumes of retweets than brands and people, while the difference between brands and people is not significant. In addition to that, brands present fewer interactions than news sources and people. These results are significant since retweets have always been considered an important indicator of influence. Since it is evident that news sources, by nature, have an advantage in generating retweets, it is
1 http://twitaholic.com
important to distinguish the type of users in order to avoid a biased measure of influence. On the other hand, people accounts present higher average values in terms of mentions than news sources and brands. It is well-known that one-to-one communications are more effective in triggering customer engagement, and it seems clear that mentions are a good means to exploit one-to-one communication, granting interactivity with followers in Twitter [11]. Relative values of retweets and
mentions do not have differences across categories. This means that even sources that have higher absolute volumes do not have the ability to spread all content, e.g. a few news will be retweeted a lot while other news will not trigger any interest in readers.
Table 3. Componentization of data quality measures: measures are grouped within the corresponding component. The relation
among the identified components and Google is tested through linear regressions. Measures Identified Component Relation with Google
Traffic rank traffic positive (sig < 0.001)
Daily visitors
Daily page views
Number of inbound links
Number of open discussions compared to largest Web blog/forum
Average number of new opened discussions per day participation
negative (sig < 0.010)
Number of comments per discussion
Average number of comments per discussion per day
Bounce rate time negative (sig < 0.050)
Average time spent on site
Table 4. Paired differences of means of considered measures by account kind. Results are obtained through Bonferroni test, significance in parenthesis is obtained through ANOVA.
Difference people – brand people – news news – brand Interactions > 0 (sig = 0.002) = 0 (sig = 0.775) > 0 (sig = 0.001) Absolute mentions (number of replies received)
> 0 (sig = 0.016) > 0 (sig = 0.026) = 0 (sig = 1.000)
Absolute retweets (number of feedbacks)
= 0 (sig = 1.000) < 0 (sig < 0.001) > 0 (sig < 0.001)
Relative mentions (average number of replies received per comment)
= 0 (sig = 0.933) = 0 (sig = 0.140) = 0 (sig = 1.000)
Relative retweets (average number of feedbacks received per comment)
= 0 (sig = 0.839) = 0 (sig = 0.311) = 0 (sig = 1.000)
5. A QUALITY-DRIVEN MASHUP FRAMEWORK The model presented in Section 3 can be adopted for the definition of an analysis framework where contents from Web 2.0 sources can be composed, filtered and analyzed. For example, if organizations want to use Web 2.0 sources to understand the online opinion about their products [6], they could exploit the model to select the trustworthiest sources, thus improving the reliability of the opinion mining. Analogously, after a first-stage analysis of the source quality, a more specific focus on the most “participated” categories of contents and on the influential users can help catch hot trends or stop negative sentiment before a large-scale diffusion of the users’ opinion [20].
The presence of orthogonal dimensions and attributes in our quality model facilitates the identification of analysis services, which the end-users can use in multiple ways to satisfy disparate analysis needs. Analysis services can (i) support quality-based selection of the most relevant contents, for example based on the different domain-dependent quality measures; (ii) support simple filter operations, to clean Web source contents on the basis of some selection criteria (e.g., an interesting content category, the freshness of contents based on a specified time interval, the breadth of contributions about a given subject in a forum); (iii) perform content-based analysis (e.g., feature extraction for buzz word identification). Given such a
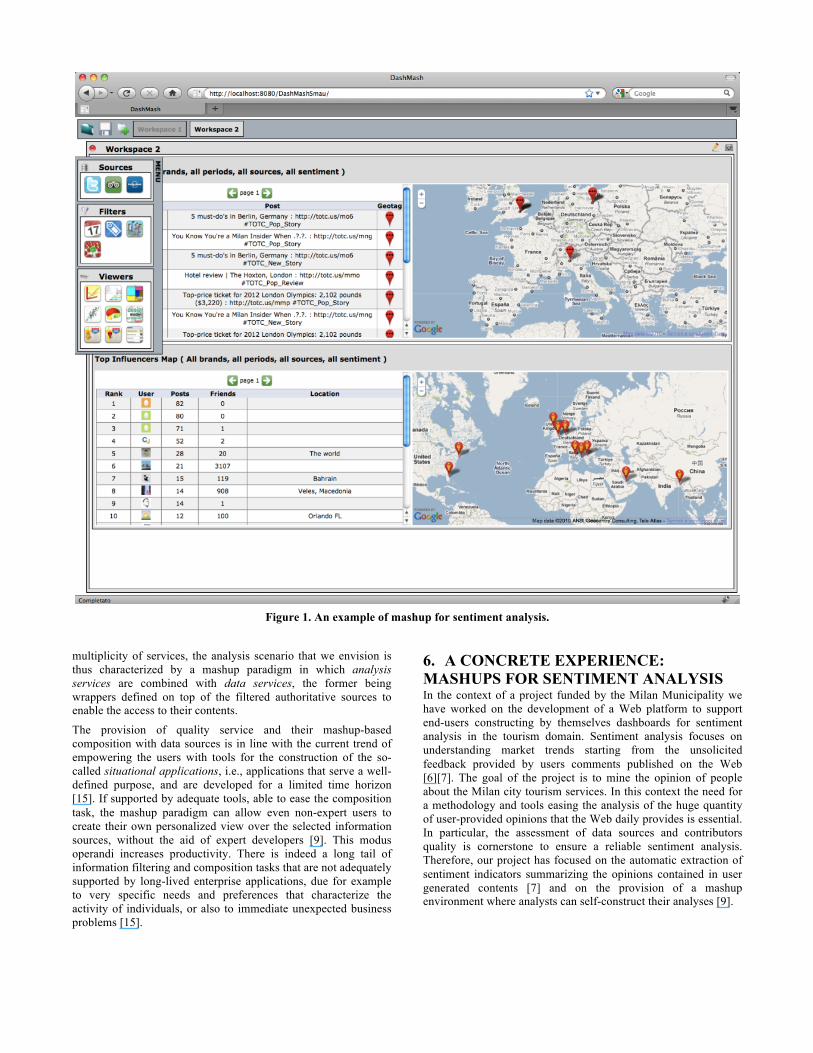
Figure 1. An example of mashup for sentiment analysis.
multiplicity of services, the analysis scenario that we envision is thus characterized by a mashup paradigm in which analysis services are combined with data services, the former being wrappers defined on top of the filtered authoritative sources to enable the access to their contents.
The provision of quality service and their mashup-based composition with data sources is in line with the current trend of empowering the users with tools for the construction of the so-called situational applications, i.e., applications that serve a well-defined purpose, and are developed for a limited time horizon [15]. If supported by adequate tools, able to ease the composition task, the mashup paradigm can allow even non-expert users to create their own personalized view over the selected information sources, without the aid of expert developers [9]. This modus operandi increases productivity. There is indeed a long tail of information filtering and composition tasks that are not adequately supported by long-lived enterprise applications, due for example to very specific needs and preferences that characterize the activity of individuals, or also to immediate unexpected business problems [15].
6. A CONCRETE EXPERIENCE: MASHUPS FOR SENTIMENT ANALYSIS In the context of a project funded by the Milan Municipality we have worked on the development of a Web platform to support end-users constructing by themselves dashboards for sentiment analysis in the tourism domain. Sentiment analysis focuses on understanding market trends starting from the unsolicited feedback provided by users comments published on the Web [6][7]. The goal of the project is to mine the opinion of people about the Milan city tourism services. In this context the need for a methodology and tools easing the analysis of the huge quantity of user-provided opinions that the Web daily provides is essential. In particular, the assessment of data sources and contributors quality is cornerstone to ensure a reliable sentiment analysis. Therefore, our project has focused on the automatic extraction of sentiment indicators summarizing the opinions contained in user generated contents [7] and on the provision of a mashup environment where analysts can self-construct their analyses [9].
Within this analysis framework the overall sentiment assessment is weighed with respect to the quality of the Web sources. We have developed data services for the access to contents crawled from Twitter, TripAdvisor, and LonelyPlanet that, according to our model and domain of interest2, resulted as the top ranked sources. We have also developed a number of analysis services to measure data sources and user quality according to the model introduced in Section 33. Figure 1 reports an example of mashup where the user has selected two data sources storing users comments extracted from Twitter and TripAdvisor. A filter is applied to select the only comments from users that are considered influencers. Influencers’ data are visualized through a list-based viewer, which is integrated with Google Maps to show the influencers locations. A further synchronization with another map and another list-based viewer allows one to see the original posts of each influencer, as well as the geo-localization of their posts, if available.
The implementation of the sentiment analysis framework has confirmed us the applicability of the main choices at the basis of our approach, namely the centrality of quality for content filtering and the opportunity for the end-users to self-create their quality-based filtering and analysis process. We are confident that the overall approach can be generalized to any other framework where the analysis of Web 2.0, user-provided contents is needed. The intrinsic modularity of the proposed approach is indeed open to the extension towards new kinds of domains, quality dimensions and analyses.
7. CONCLUSION This paper has discussed the need for methodology and tools easing the analysis of the huge quantity of data that the Web daily provides, and has proposed reputation as a key factor to drive content filtering. Our reputation model is articulated across different orthogonal dimensions; this feature has facilitated the identification of orthogonal analysis services, with the advantage for the end users to mash-up these services in multiple ways, to satisfy disparate situational needs and, in some cases, create innovative added value.
The modularity of the proposed approach is open to the extension towards new kinds of analysis. Our current work focuses on the design and development of new analysis components. To accommodate the always-increasing need of filtering out the noise, understanding users’ conversations, identifying and analyzing the relevant content, we are now developing services for sentiment analysis [6][7].
8. ACKNOWLEDGMENTS This work is supported by the Milan Municipality and by the Search Computing project funded by the European Research Council (ERC), IDEAS Advanced Grant.
2 The domain of interest defined for the sentiment analysis, and in particular the categories of relevant contents to be analyzed, derive from the well-‐known Anholt model that addresses the tourism domain [3].
3 A demo is available at http://home.dei.polimi.it/cappiell/demo/DemoDashMash.mov
9. REFERENCES
[1] S. Akamine, D. Kawahara, Y. Kato, T. Nakagawa, K. Inui, S. Kurohashi and Y. Kidawara, “WISDOM: a Web information credibility analysis system”, Proc. of ACL-IJCNLP 2009 (Software Demonstrations), 2009:1-4.
[2] J. M. Almeida, M. A. Goncalves, F. Figueiredo, H. Pinto, F. Belem. “On the Quality of Information for Web 2.0 Services”. IEEE Internet Computing, Vol. 14(6), Nov-Dic 2010, pp 47-55.
[3] S. Anholt, 2009. “Competitive Identity: The New Brand Management for Nations, Cities and Regions”. Palgrave Macmillan, Eds.
[4] I. Askira Gelman and A. L. Barletta, “A "quick and dirty" website data quality indicator”. Proc. of WICOW 2008:43-46.
[5] C. Batini, C. Cappiello, C. Francalanci, and A. Maurino, “Methodologies for data quality assessment and improvement”. ACM Computing Surveys, 41(3), 2009:1-52.
[6] D. Barbagallo, C. Cappiello, C. Francalanci, M. Matera, “Semantic sentiment analyses based on the reputation of Web information sources”. Proc. of ICEIS ‘10, pp. 30-37, 2010.
[7] D. Barbagallo, C. Cappiello, C. Francalanci, and M. Matera. “Applied Semantic Technologies: Using Semantics in Intelligent Information Processing”, In: “Semantic sentiment analyses based on the reputation of Web information sources”, Taylor and Francis, 2011.
[8] M. Bilenk and R. W. White, “Mining the search trails of surfing crowds: identifying relevant websites from user activity”. Proc. of WWW 2008:51-60.
[9] C. Cappiello, M. Matera, M. Picozzi, G. Sprega, D. Barbagallo, C. Francalanci. “DashMash: a Mashup Environment for End User Development”. Proc. of ICWE 2011. LNCS 6757, Springer, pp. 152-166, 2011.
[10] C. Castillo, M. Mendoza, B. Poblete. “Information credibility on Twitter”. Proc. of WWW '11. ACM, New York, NY, USA, pp. 675-684. 2011.
[11] M. Cha, H. Haddadi, F. Benevenuto, and K. P. Gummadi. “Measuring User Influence in Twitter: The Million Follower Fallacy”, Proc. International AAAI Conference on Weblogs and Social Media (ICWSM), 2010.
[12] X. Chen and C. Ding, “QoS Based Ranking for Web Search”, Web Intelligence 2008:747-750.
[13] J.G. Conrad, J. L. Leidner, and F. Schilder, “Professional credibility: authority on the Web”. Proc. WICOW 2008:85-88.
[14] J. Hart, C. Ridley, F. Taher, C. Sas, A. J. Dix. “Exploring the Facebook Experience: A New Approach to Usability”. Proc. of NordiCHI, pp. 471-474, ACM, 2008.
[15] A. Jhingran. “Enterprise information mashups: Integrating information, simply”. In Proc. VLDB, pp. 3–4, 2006.
[16] A. Jøsang, R. Ismail, and C. Boyd, “A survey of trust and reputation systems for online service provision”. Decision Support Systems, 43 (2), 2007:618-644.
[17] J. McCarthy and W. Wright. Technology as Experience. MIT Press, (2004).
[18] J. C. C. Pun and F. H. Lochovsky, “Ranking Search Results by Web Quality Dimensions”. Journal of Web Engineering (3-4), 2004:216-235.
[19] S.Y. Rieh and D.R. Danielson, “Credibility: A multidisciplinary framework”. B. Cronin (Ed.), Annual Review of Information Science and Technology, Vol. 41, 2007:307-364.
[20] T.W. Valente, R. Davis, “Accelerating the Diffusion of Innovations Using Opinion Leaders” in The Annals of the
American Academy of Political and Social Science November 1999 vol. 566 no. 1 55-67.
[21] J. Yu, B. Benatallah, R. Saint-Paul, F. Casati, F. Daniel, and M. Matera, “A framework for rapid integration of presentation components,” Proc. of WWW 2007:923-932.
Related Documents