The Ghana LEAP program: results from the impact evaluation
Benjamin Davis
FAO, PtoP and Transfer Project
Robert Osei
ISSER
Scoping Conference
The Links between Social Inclusion and Sustainable Growth in Africa
30 -31 October 2013
The Hague
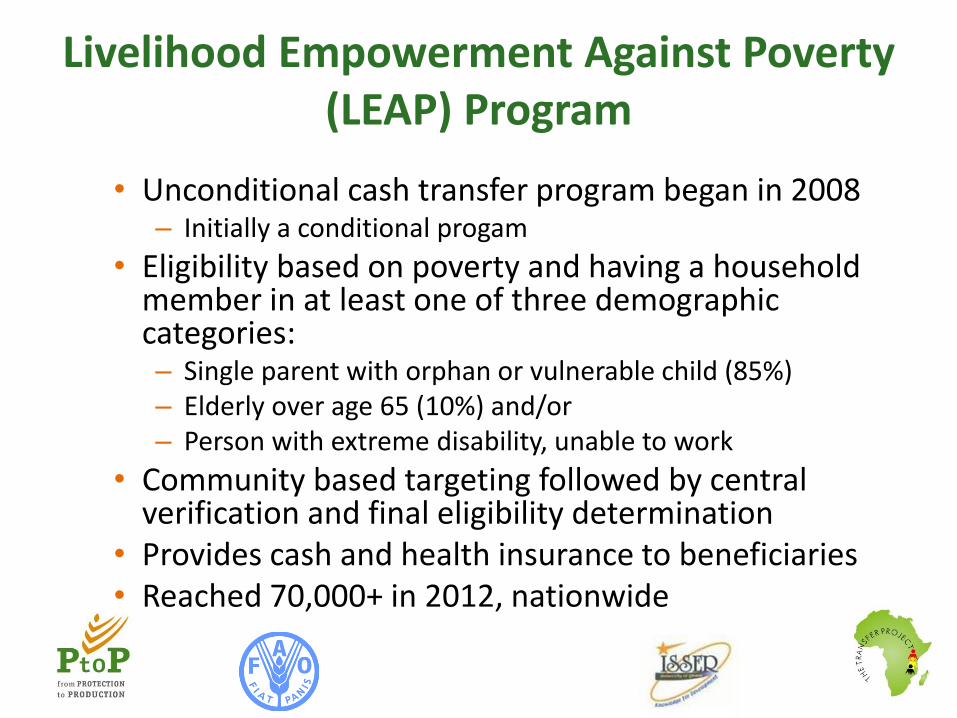
Livelihood Empowerment Against Poverty (LEAP) Program
• Unconditional cash transfer program began in 2008 – Initially a conditional progam
• Eligibility based on poverty and having a household member in at least one of three demographic categories: – Single parent with orphan or vulnerable child (85%) – Elderly over age 65 (10%) and/or – Person with extreme disability, unable to work
• Community based targeting followed by central verification and final eligibility determination
• Provides cash and health insurance to beneficiaries • Reached 70,000+ in 2012, nationwide
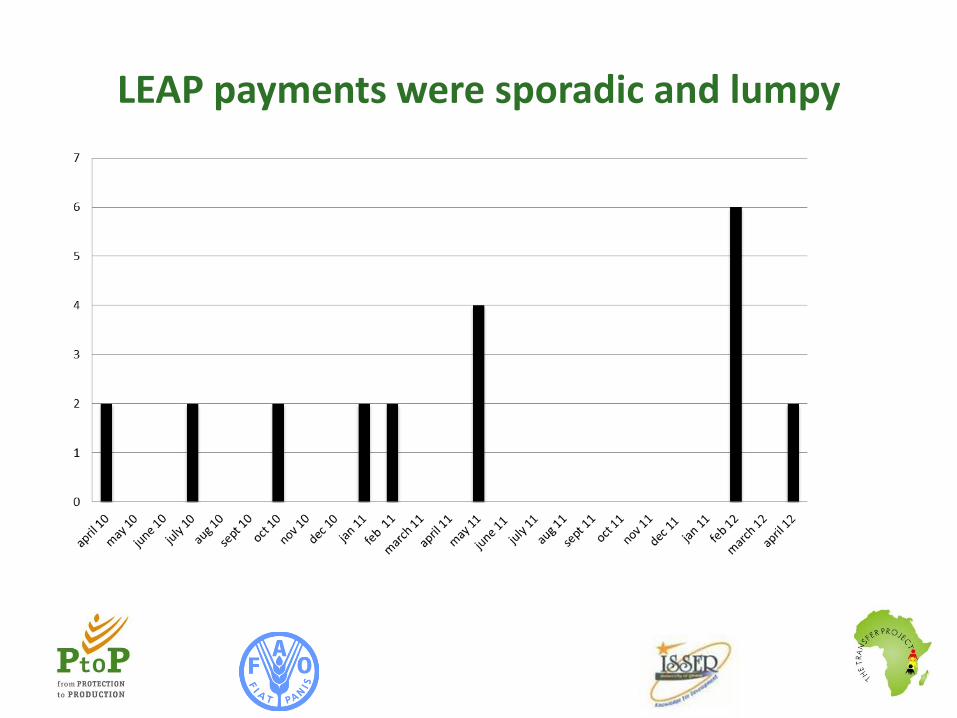
LEAP payments were sporadic and lumpy
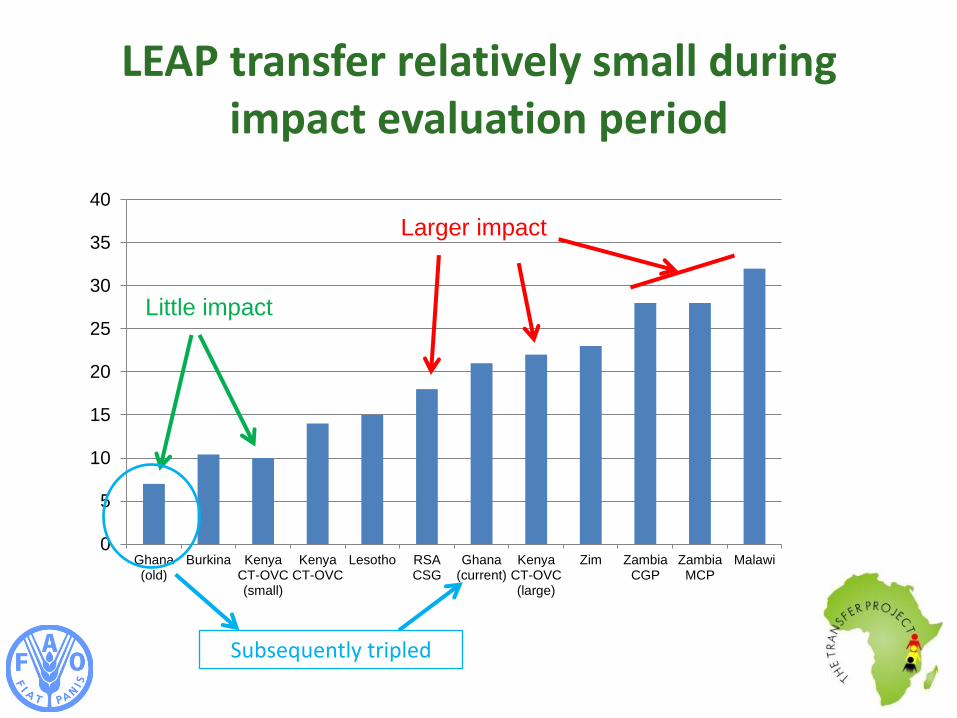
LEAP transfer relatively small during impact evaluation period
0
5
10
15
20
25
30
35
40
Ghana(old)
Burkina KenyaCT-OVC(small)
KenyaCT-OVC
Lesotho RSACSG
Ghana(current)
KenyaCT-OVC(large)
Zim ZambiaCGP
ZambiaMCP
Malawi
Larger impact
Little impact
Subsequently tripled
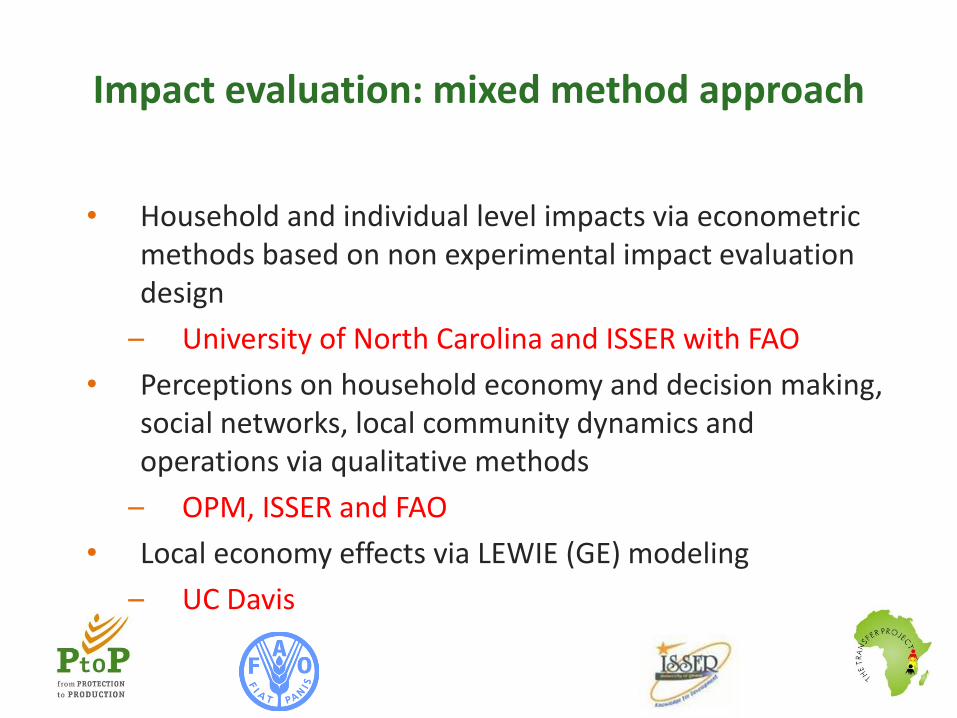
Impact evaluation: mixed method approach
• Household and individual level impacts via econometric methods based on non experimental impact evaluation design
– University of North Carolina and ISSER with FAO
• Perceptions on household economy and decision making, social networks, local community dynamics and operations via qualitative methods
– OPM, ISSER and FAO
• Local economy effects via LEWIE (GE) modeling
– UC Davis
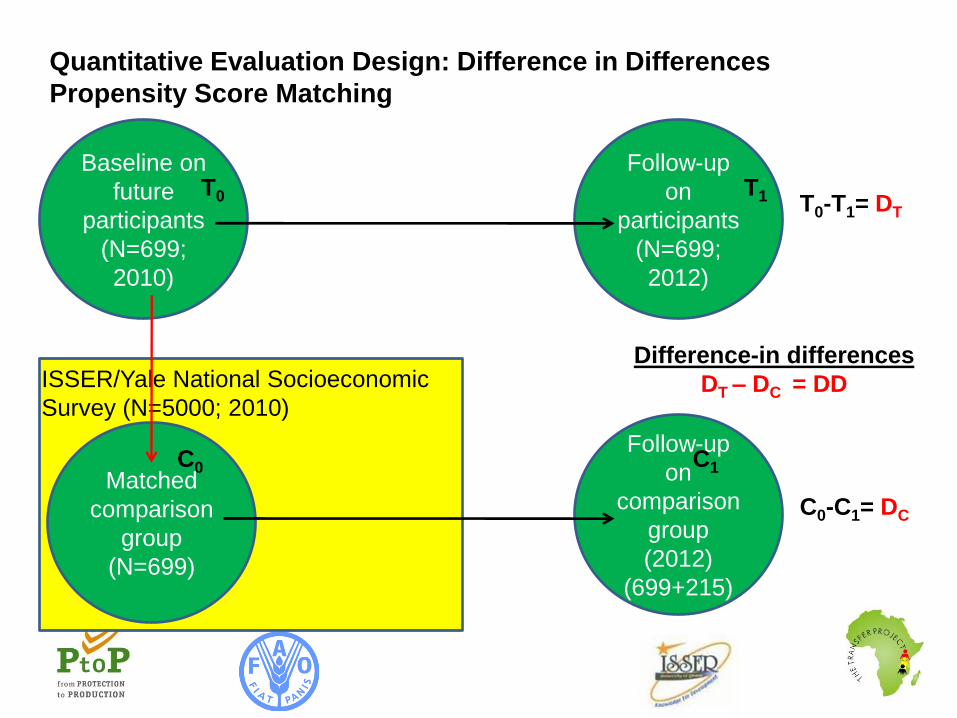
Quantitative Evaluation Design: Difference in Differences
Propensity Score Matching
Baseline on
future
participants
(N=699;
2010)
Matched
comparison
group
(N=699)
ISSER/Yale National Socioeconomic
Survey (N=5000; 2010)
Follow-up
on
participants
(N=699;
2012)
Follow-up
on
comparison
group
(2012)
(699+215)
T0 T1
C0 C1
T0-T1= DT
C0-C1= DC
Difference-in differences
DT – DC = DD
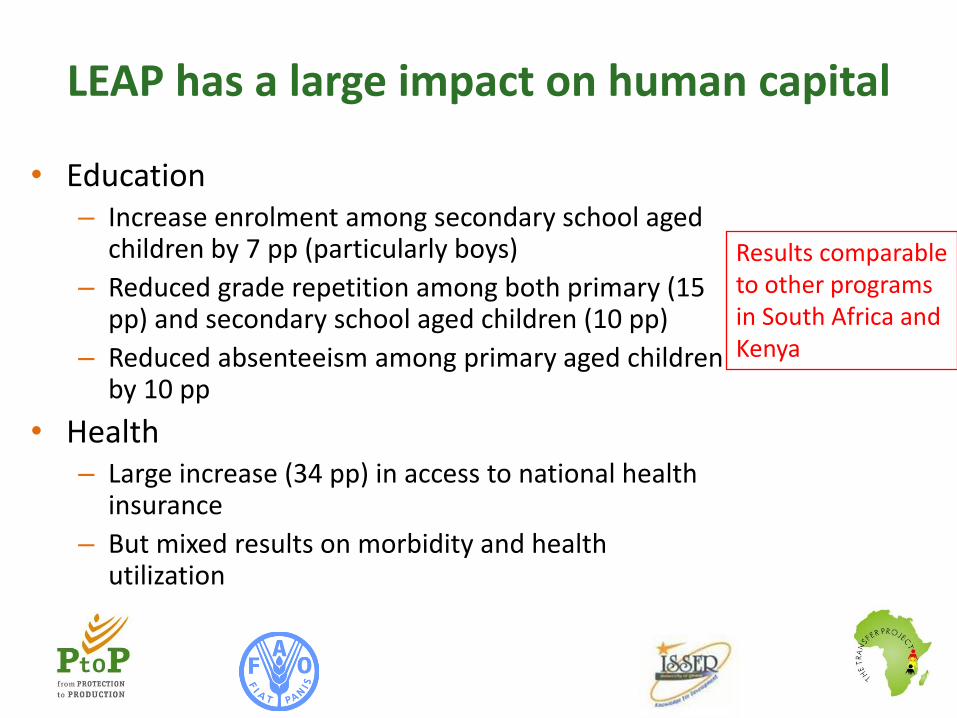
LEAP has a large impact on human capital
• Education – Increase enrolment among secondary school aged
children by 7 pp (particularly boys)
– Reduced grade repetition among both primary (15 pp) and secondary school aged children (10 pp)
– Reduced absenteeism among primary aged children by 10 pp
• Health – Large increase (34 pp) in access to national health
insurance
– But mixed results on morbidity and health utilization
Results comparable to other programs in South Africa and Kenya
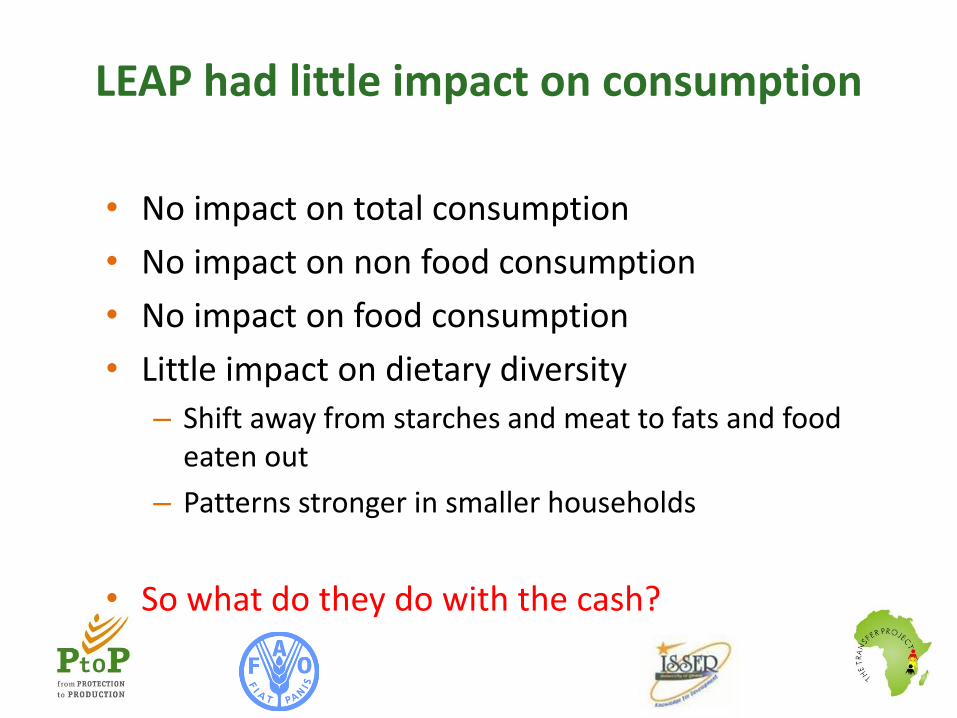
LEAP had little impact on consumption
• No impact on total consumption
• No impact on non food consumption
• No impact on food consumption
• Little impact on dietary diversity
– Shift away from starches and meat to fats and food eaten out
– Patterns stronger in smaller households
• So what do they do with the cash?

Struggling livelihoods
• Most have low levels of assets – Few acres of agricultural land, few small animals, basic agricultural tools and low
levels of education
• Less than half of households had some farming activity – Cassava (50 %) maize and yam (~ 40%)
• Large differences between LEAP and ISSER samples – Almost 80% sold some portion of production – Traditional production systems – 13 percent raised livestock
• Poultry predominate
• Less than 10 percent in wage employment • One-third ran a non-farm enterprise • Over half received some form of private transfers • One-fifth had savings; one quarter a loan
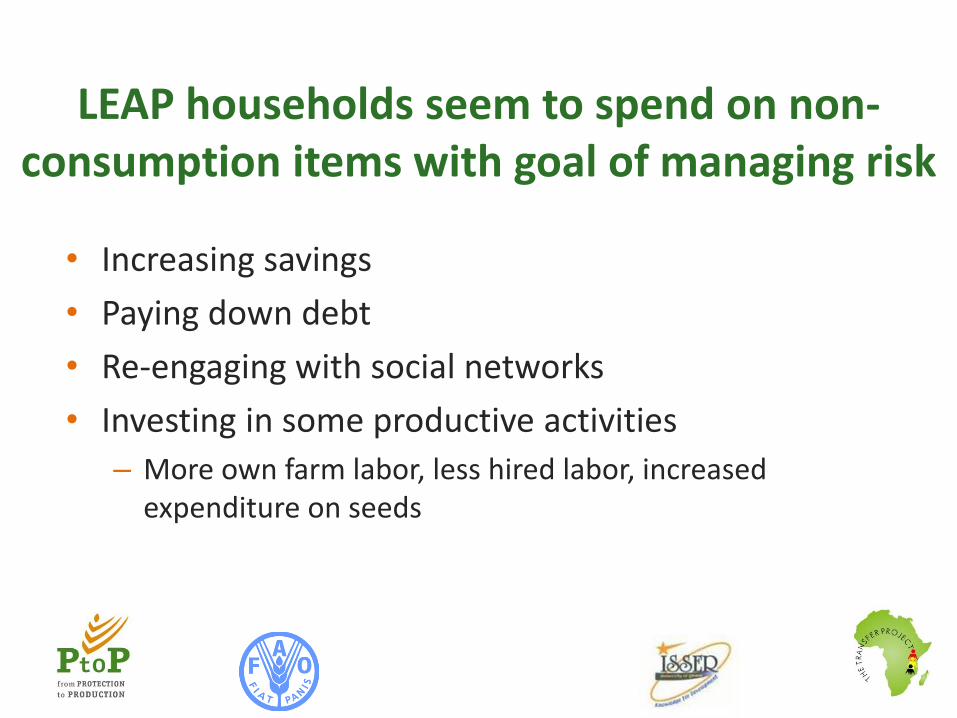
LEAP households seem to spend on non-consumption items with goal of managing risk
• Increasing savings
• Paying down debt
• Re-engaging with social networks
• Investing in some productive activities
– More own farm labor, less hired labor, increased expenditure on seeds
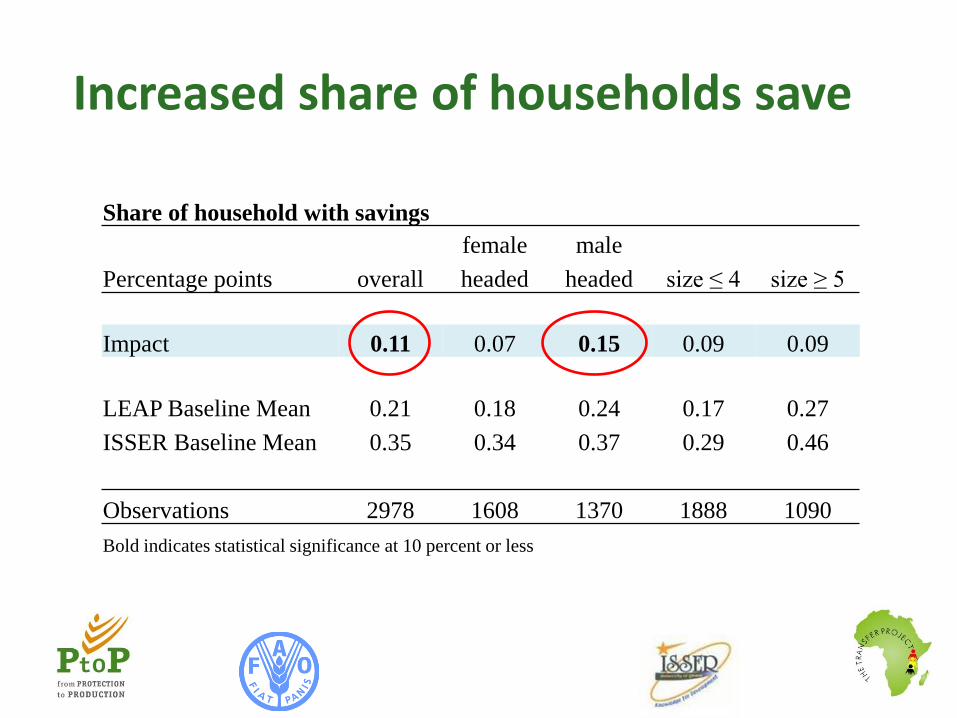
Increased share of households save
Share of household with savings
female male
Percentage points overall headed headed size ≤ 4 size ≥ 5
Impact 0.11 0.07 0.15 0.09 0.09
LEAP Baseline Mean 0.21 0.18 0.24 0.17 0.27
ISSER Baseline Mean 0.35 0.34 0.37 0.29 0.46
Observations 2978 1608 1370 1888 1090
Bold indicates statistical significance at 10 percent or less
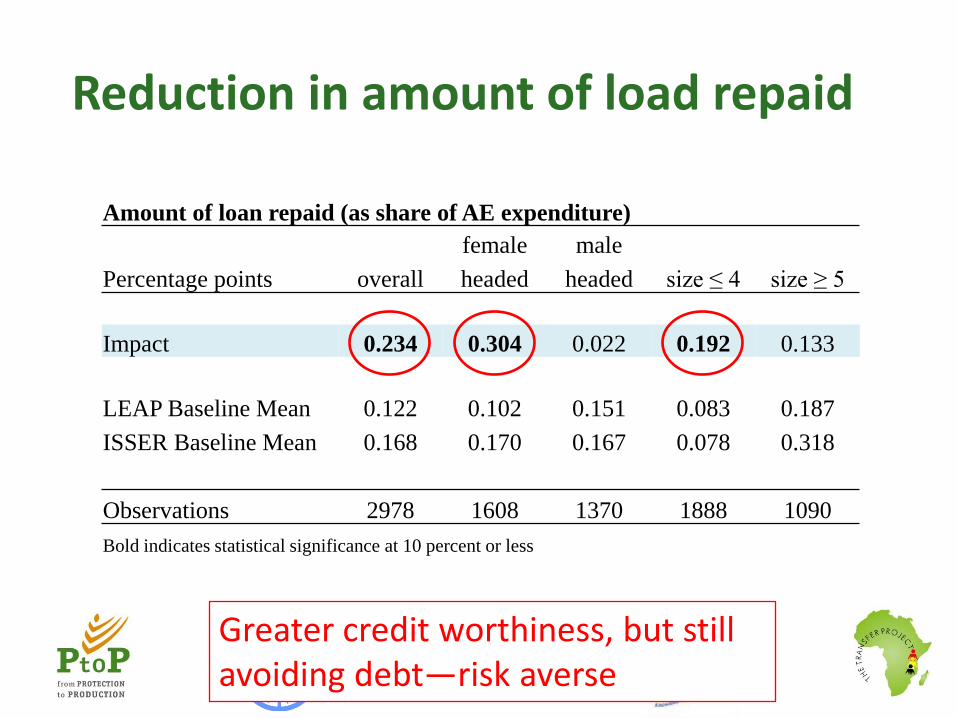
Reduction in amount of load repaid
Amount of loan repaid (as share of AE expenditure)
female male
Percentage points overall headed headed size ≤ 4 size ≥ 5
Impact 0.234 0.304 0.022 0.192 0.133
LEAP Baseline Mean 0.122 0.102 0.151 0.083 0.187
ISSER Baseline Mean 0.168 0.170 0.167 0.078 0.318
Observations 2978 1608 1370 1888 1090
Bold indicates statistical significance at 10 percent or less
Greater credit worthiness, but still avoiding debt—risk averse
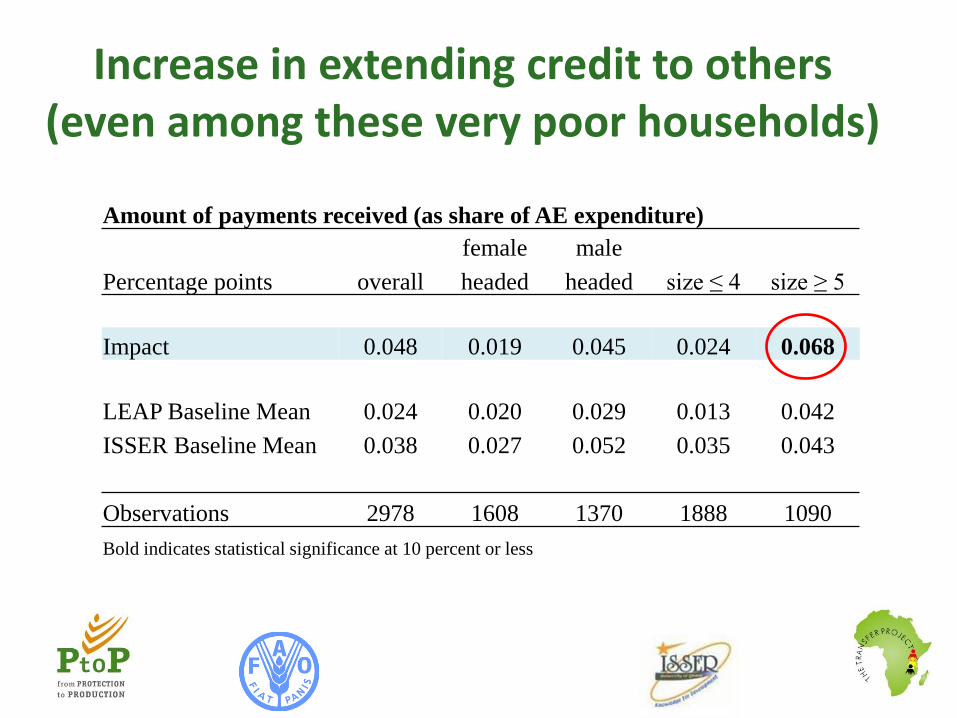
Increase in extending credit to others (even among these very poor households)
Amount of payments received (as share of AE expenditure)
female male
Percentage points overall headed headed size ≤ 4 size ≥ 5
Impact 0.048 0.019 0.045 0.024 0.068
LEAP Baseline Mean 0.024 0.020 0.029 0.013 0.042
ISSER Baseline Mean 0.038 0.027 0.052 0.035 0.043
Observations 2978 1608 1370 1888 1090
Bold indicates statistical significance at 10 percent or less

Social networks: similar story from qualitative field work
• Beneficiaries “re-entering” social networks, re-investing in alliances and social security –
• Increasing social standing via family contributions, savings groups (susu), church groups, social events, etc – “now when someone dies, they say come”
• Beneficiaries viewed as less of a “drain”. – Re-building and broadening social capital base, trust - builds self-esteem,
confidence, hope
– “now we are able to mingle.”
• Some beginning to “help” others in need, including small gifts
No clear story on livelihood activities
• Some change in input use – Increase in expenditures on seeds – Increase in family labor on own farm – Reduction in hiring in labor – Alluded to in qualitative field work
• No clear pattern on crop production • No impact on off farm business enterprise • No impact on wage employment
– Though qualitative field work suggests shift from casual agricultural wage labor
• No impact on child labor – Though qualitative field work suggests reduction in child labor
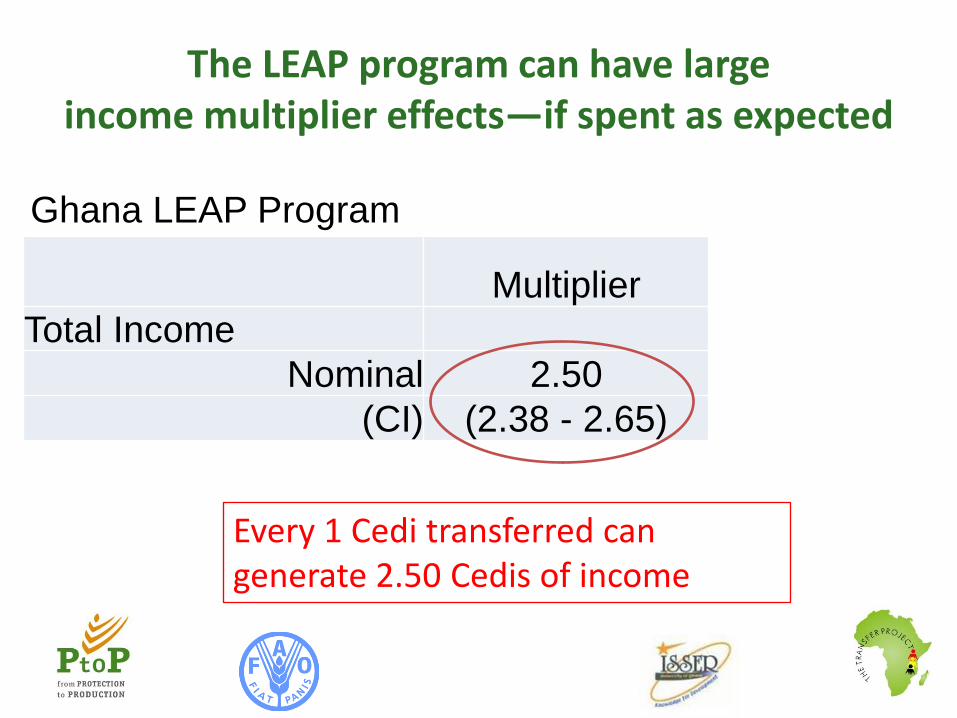
The LEAP program can have large income multiplier effects—if spent as expected
Multiplier Total Income
Nominal 2.50 (CI) (2.38 - 2.65)
Ghana LEAP Program
Every 1 Cedi transferred can generate 2.50 Cedis of income
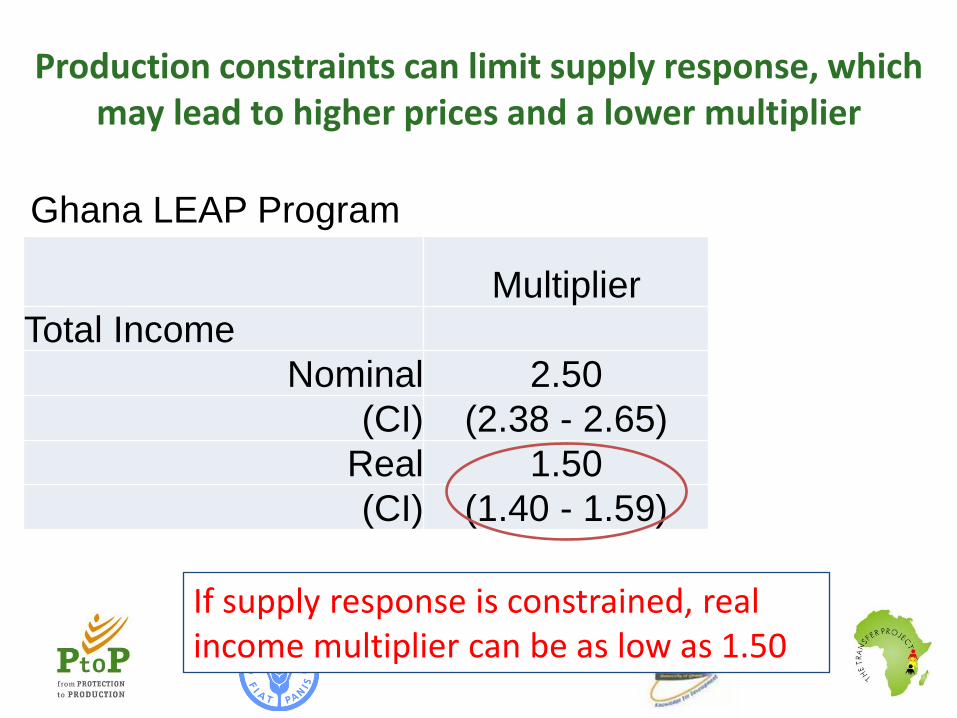
Production constraints can limit supply response, which may lead to higher prices and a lower multiplier
Multiplier Total Income
Nominal 2.50 (CI) (2.38 - 2.65)
Real 1.50 (CI) (1.40 - 1.59)
Ghana LEAP Program
If supply response is constrained, real income multiplier can be as low as 1.50
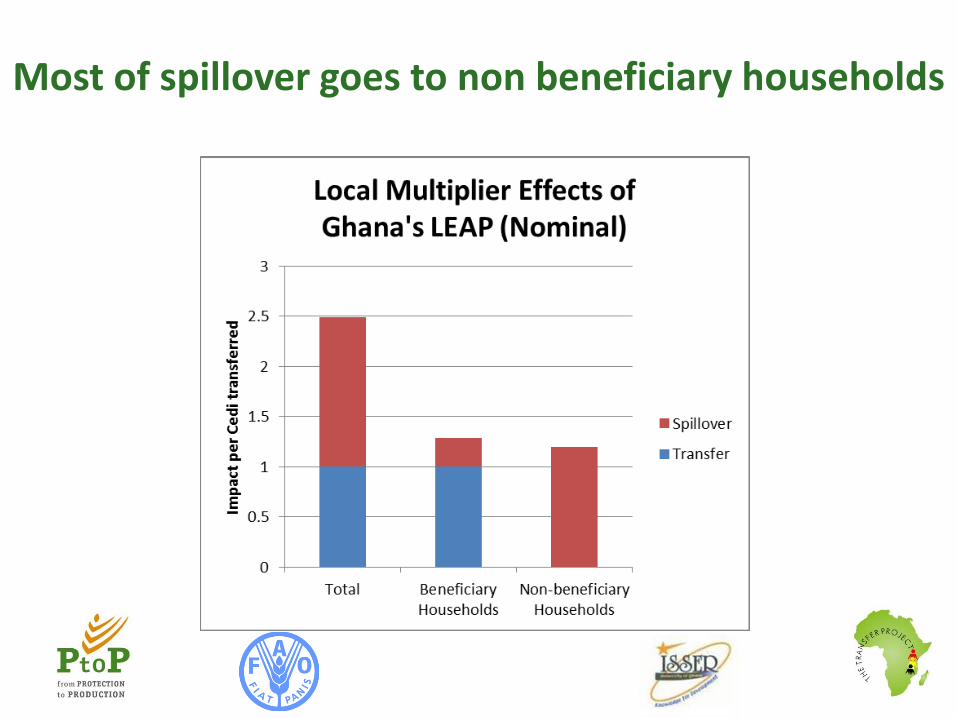
Most of spillover goes to non beneficiary households
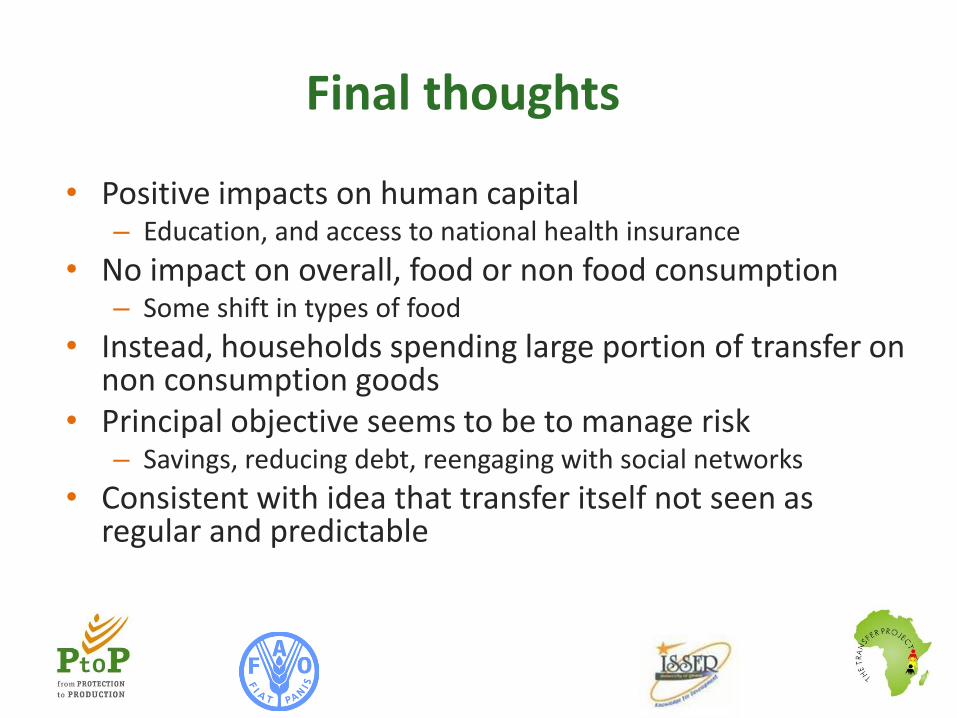
Final thoughts
• Positive impacts on human capital – Education, and access to national health insurance
• No impact on overall, food or non food consumption – Some shift in types of food
• Instead, households spending large portion of transfer on non consumption goods
• Principal objective seems to be to manage risk – Savings, reducing debt, reengaging with social networks
• Consistent with idea that transfer itself not seen as regular and predictable
Sources
Handa, S., Park, M., Darko, R., Osei-Akoto, I., Davis, B. and Daidone, S. (2013). Livelihood Empowerment against Poverty Impact Evaluation, Carolina Population Center, University of North Carolina.
Thome, K., Taylor, E., Kagin, J., Davis, B., Darko Osei, R., Osei-
Akoto, I. and Handa, S. (2013). Local Economy-wide Impact Evaluation (LEWIE) of Ghana’s Livelihood Empowerment Against Poverty (LEAP) Program, PtoP project report, FAO and The World Bank.
OPM (2013). Qualitative Research and Analyses of the
Economic Impact of Cash Transfer Programmes in Sub Saharan Africa. Ghana Country Case Study Report, PtoP project report, FAO.

Our websites
From Protection to Production Project
http://www.fao.org/economic/PtoP/en/
The Transfer Project
http://www.cpc.unc.edu/projects/transfer