Sunspot Studies in Oslo
Nils Brynildsen, Per Maltby, Terje Fredvik and Olav Kjeldseth-Moe
Institute of Theoretical Astrophysics
University of Oslo

Program History• Sunspot studies with SOHO instruments from
05/1996• Purpose: To study the transition region and corona
above spots, particularly the fast down flows into sunspot umbrae observed with HRTS
• Extended to sunspot plumes, and 3 min oscillations in the sunspot chromosphere and transition region
• O_SPOT – studies run between May 1996 and present• A total of 115 spots observed on 190 days• All O_SPOT data are processed into intensity and
velocity maps• Results presented in papers, talks, posters and
proceedings
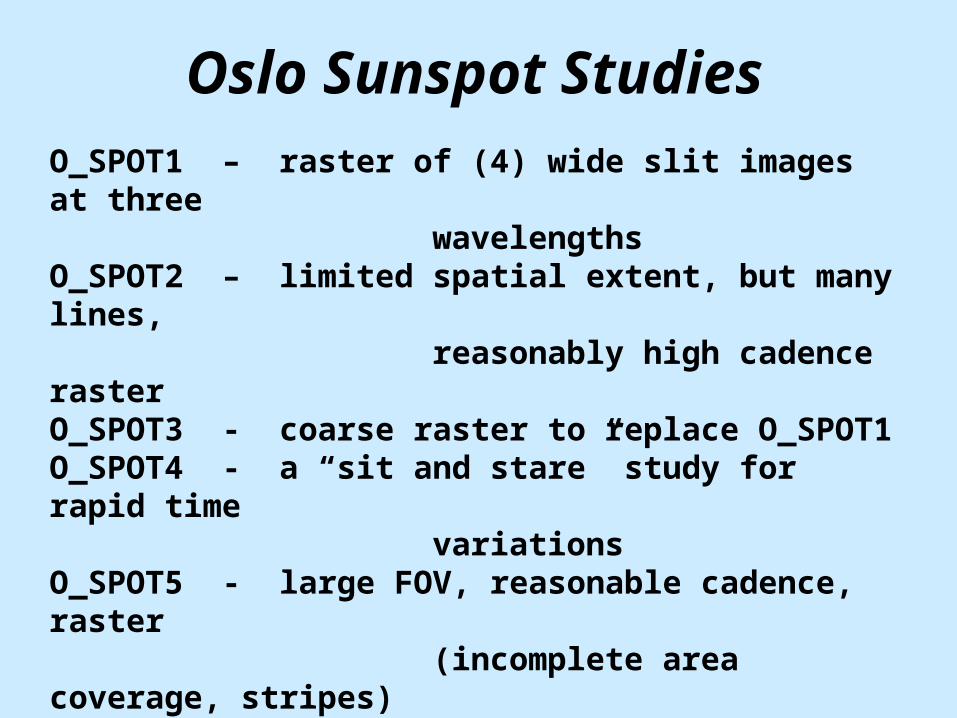
Oslo Sunspot StudiesO_SPOT1 – raster of (4) wide slit images at three wavelengths O_SPOT2 – limited spatial extent, but many lines, reasonably high cadence raster O_SPOT3 - coarse raster to replace O_SPOT1O_SPOT4 - a “sit and stare” study for rapid time variationsO_SPOT5 - large FOV, reasonable cadence, raster (incomplete area coverage, stripes)---------------------------------------------O_SPOT10 – GIS study for sunspot oscillationsO_SPOT11 – NIS study for sunspot oscillations

Oslo Sunspot Studies (2)
Study Spectro- Slit Step Number of FOV of Exp. Cadence Name meter # size Locations/ one rst. time (duration) (as) Rasters (as^2) (s) (m:s)==============================================O_SPOT1 NIS 6 50 4/4 240x240 10 2:04 O_SPOT2 NIS 4 2 60/1 120x120 20 22:36 O_SPOT3 NIS 5 8 30/1 240x240 8 6:20 O_SPOT4 NIS 3 drift 150/1 4x51 5 20:30 O_SPOT5 NIS 4 4 60/1 240x240 10 26:30 ----------------------------------------------------------------O_SPOT10 GIS 2 drift 145/6 11x4 17 45:50 O_SPOT11 NIS 4 drift 250/1 13x120 10 60:00 ==============================================Studies marked drift have step size 0 arc-sec. and no rotational comp.Number of locations marks number of exposures defined as a single rasterSolar drift rate x raster duration defines extent of raster in x-direction

Wavelength list
Ion (Å) T(K) #1 #2 #3 #4 #5 #10 #11=====================================He I 522 10 000 x He I 584 10 000 x x x x F xO III 599 95 000 x x x uO VI 554 175 000 x x x x l xO V 629 240 000 x x x x x l xNe VI 562 430 000 x x x xMg VIII 315 810 000 x GMg IX 368 960 000 x x x x x I xFe XIV 334 1 900 000 x SFe XVI 360 2 700 000 x x x x
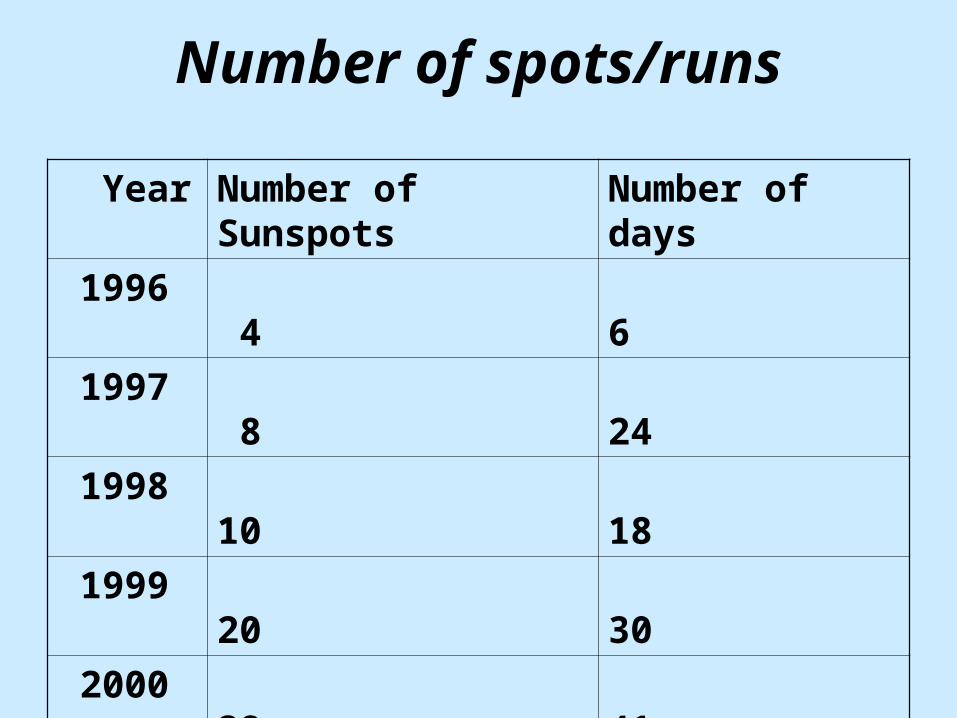
Number of spots/runs
Year Number of Sunspots
Number of days
1996 4 6
1997 8 24
1998 10 18
1999 20 30
2000 28 41
2001 23 36
2002 17 30
2003 5 5


- A 50 arc sec overlapping area, with ~30 s and ~2 min cadence
- Clear and significant changes over 5 min time periods. Also perceptible changes over time spans of ~2 min.
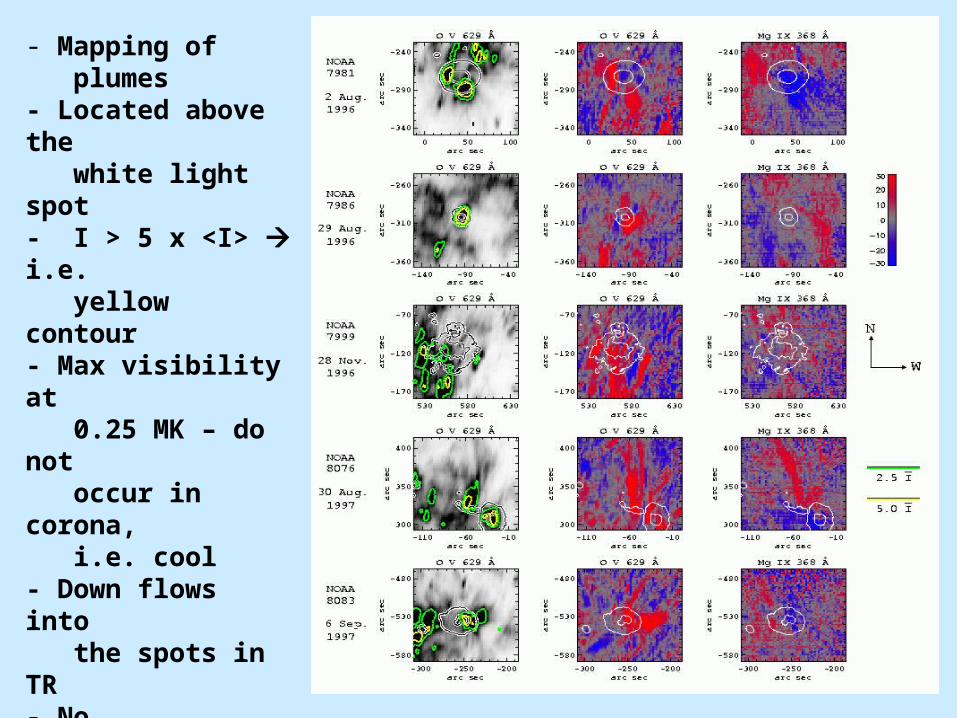
- Mapping of plumes- Located above the white light spot- I > 5 x <I> i.e. yellow contour- Max visibility at 0.25 MK – do not occur in corona, i.e. cool- Down flows into the spots in TR- No corresponding up-flows- No systematic flows in corona- Up-flows in extended area? (large raster)
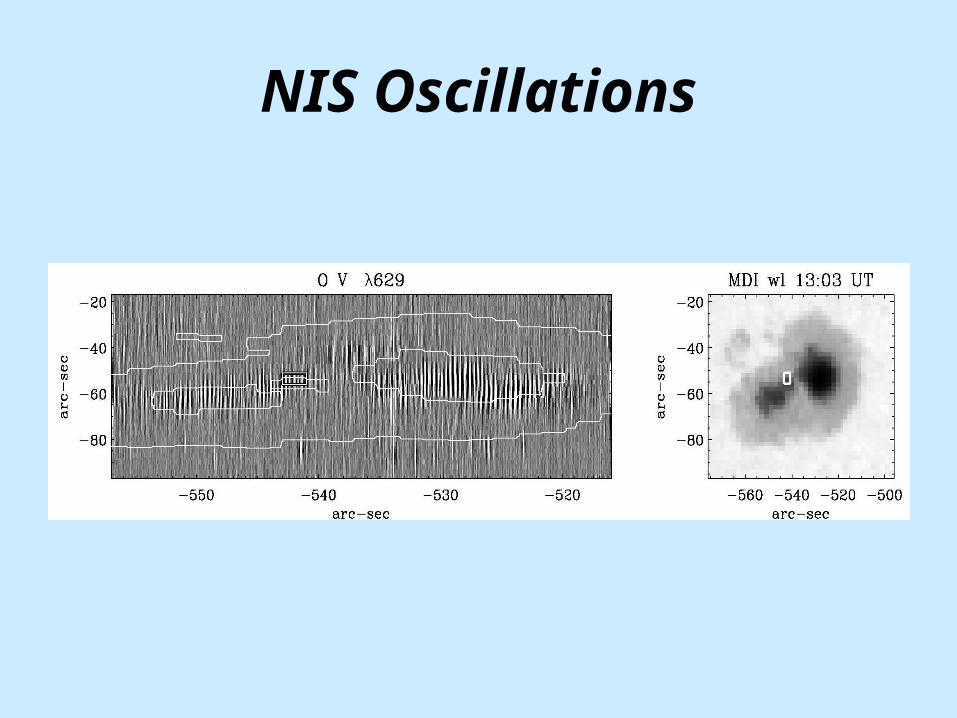
NIS Oscillations

GIS/NIS Oscillations
Data reduction of O_SPOT data
All CDS data are corrected using standard CDS software, transformed to absolute intensity, and processed may encompass the following:
-- Intensity and velocity maps from line profiles fitted to Gaussians. Blends removed before fitting.
-- Routines for conditional probability analysis used on selected emission lines.
-- Power spectra of relative integrated line intensities calculated for spectral lines to study the 3 minute oscillations.
-- CDS data are often co-aligned and compared with data from SUMER, MDI or TRACE.