Sunspot Studies in Oslo Nils Brynildsen, Per Maltby, Terje Fredvik and Olav Kjeldseth- Moe Institute of Theoretical Astrophysics University of Oslo

Sunspot Studies in Oslo
Jan 14, 2016
Sunspot Studies in Oslo. Nils Brynildsen, Per Maltby, Terje Fredvik and Olav Kjeldseth-Moe Institute of Theoretical Astrophysics University of Oslo. Program History. Sunspot studies with SOHO instruments from 05/1996 - PowerPoint PPT Presentation
Welcome message from author
This document is posted to help you gain knowledge. Please leave a comment to let me know what you think about it! Share it to your friends and learn new things together.
Transcript
Sunspot Studies in Oslo
Nils Brynildsen, Per Maltby, Terje Fredvik and Olav Kjeldseth-Moe
Institute of Theoretical Astrophysics
University of Oslo

Program History• Sunspot studies with SOHO instruments from
05/1996• Purpose: To study the transition region and corona
above spots, particularly the fast down flows into sunspot umbrae observed with HRTS
• Extended to sunspot plumes, and 3 min oscillations in the sunspot chromosphere and transition region
• O_SPOT – studies run between May 1996 and present• A total of 115 spots observed on 190 days• All O_SPOT data are processed into intensity and
velocity maps• Results presented in papers, talks, posters and
proceedings
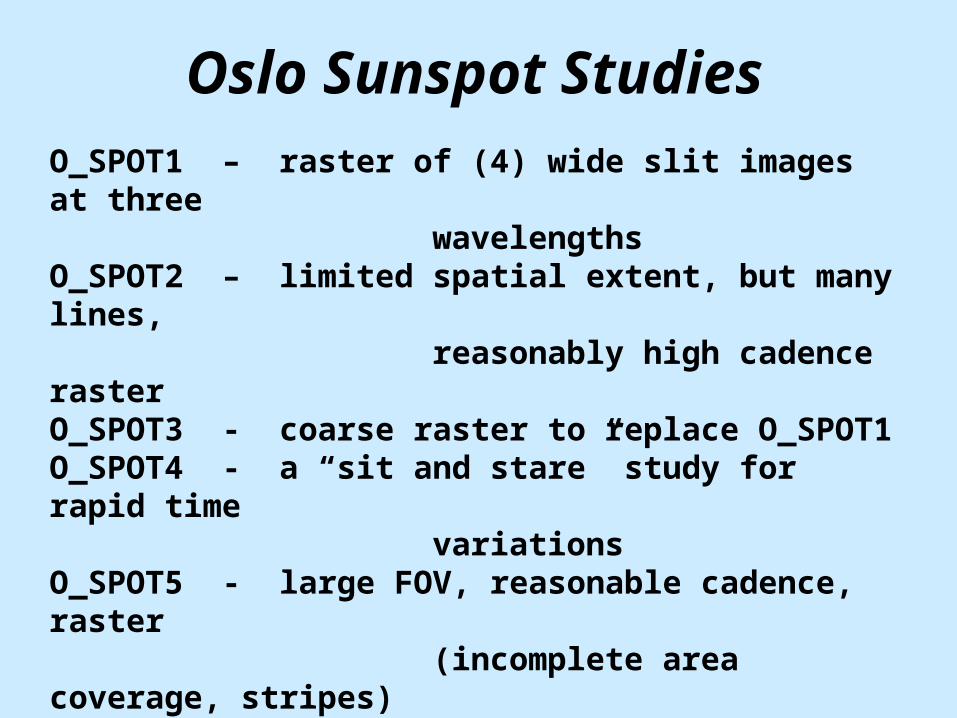
Oslo Sunspot StudiesO_SPOT1 – raster of (4) wide slit images at three wavelengths O_SPOT2 – limited spatial extent, but many lines, reasonably high cadence raster O_SPOT3 - coarse raster to replace O_SPOT1O_SPOT4 - a “sit and stare” study for rapid time variationsO_SPOT5 - large FOV, reasonable cadence, raster (incomplete area coverage, stripes)---------------------------------------------O_SPOT10 – GIS study for sunspot oscillationsO_SPOT11 – NIS study for sunspot oscillations

Oslo Sunspot Studies (2)
Study Spectro- Slit Step Number of FOV of Exp. Cadence Name meter # size Locations/ one rst. time (duration) (as) Rasters (as^2) (s) (m:s)==============================================O_SPOT1 NIS 6 50 4/4 240x240 10 2:04 O_SPOT2 NIS 4 2 60/1 120x120 20 22:36 O_SPOT3 NIS 5 8 30/1 240x240 8 6:20 O_SPOT4 NIS 3 drift 150/1 4x51 5 20:30 O_SPOT5 NIS 4 4 60/1 240x240 10 26:30 ----------------------------------------------------------------O_SPOT10 GIS 2 drift 145/6 11x4 17 45:50 O_SPOT11 NIS 4 drift 250/1 13x120 10 60:00 ==============================================Studies marked drift have step size 0 arc-sec. and no rotational comp.Number of locations marks number of exposures defined as a single rasterSolar drift rate x raster duration defines extent of raster in x-direction

Wavelength list
Ion (Å) T(K) #1 #2 #3 #4 #5 #10 #11=====================================He I 522 10 000 x He I 584 10 000 x x x x F xO III 599 95 000 x x x uO VI 554 175 000 x x x x l xO V 629 240 000 x x x x x l xNe VI 562 430 000 x x x xMg VIII 315 810 000 x GMg IX 368 960 000 x x x x x I xFe XIV 334 1 900 000 x SFe XVI 360 2 700 000 x x x x
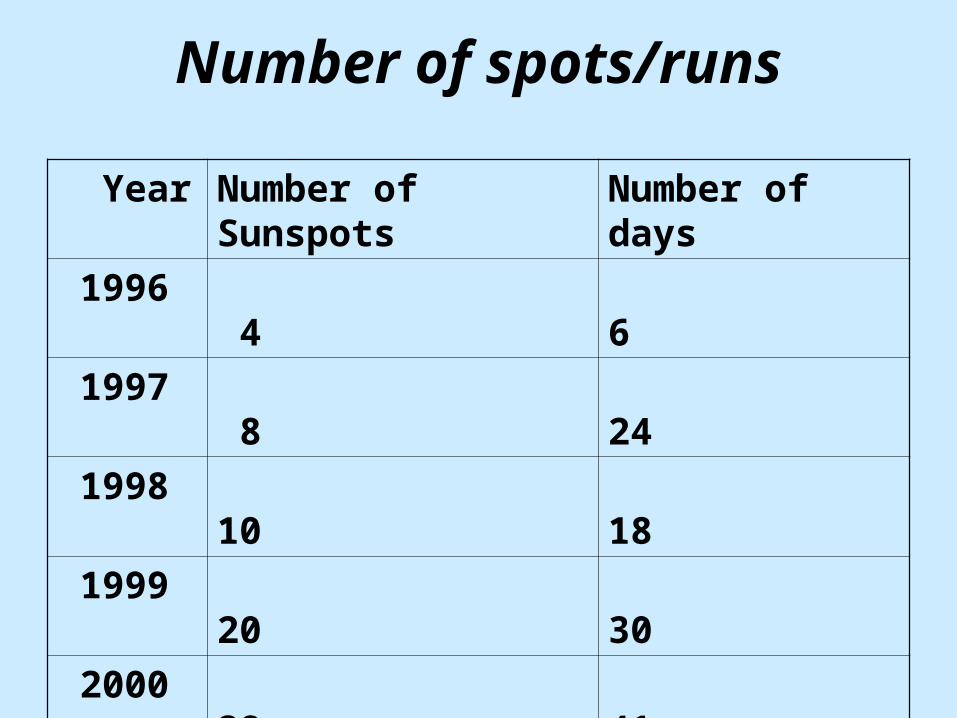
Number of spots/runs
Year Number of Sunspots
Number of days
1996 4 6
1997 8 24
1998 10 18
1999 20 30
2000 28 41
2001 23 36
2002 17 30
2003 5 5


- A 50 arc sec overlapping area, with ~30 s and ~2 min cadence
- Clear and significant changes over 5 min time periods. Also perceptible changes over time spans of ~2 min.
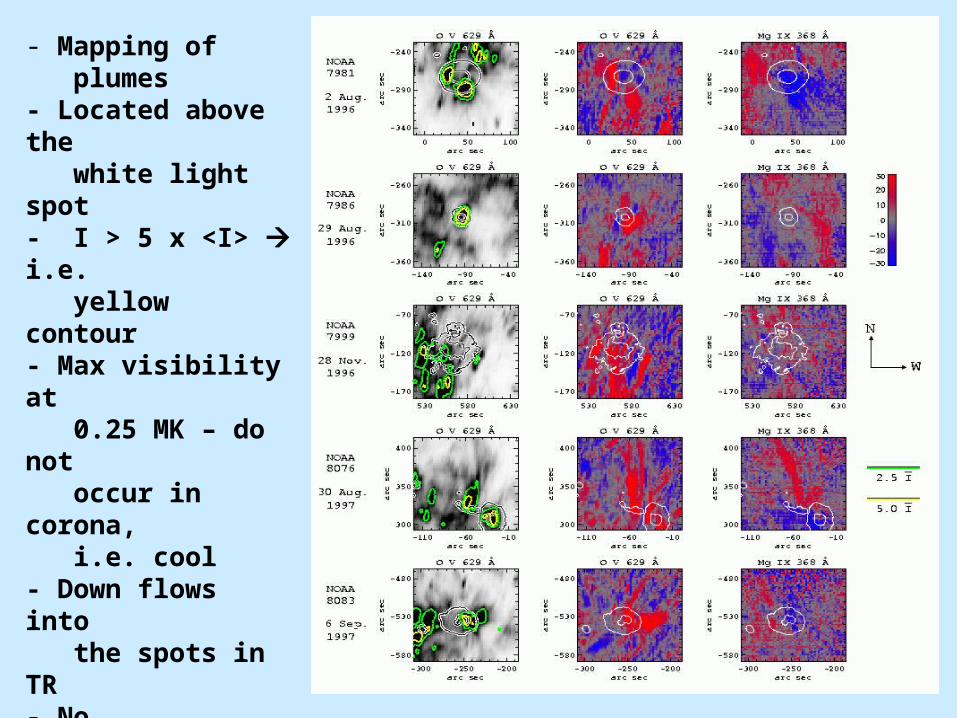
- Mapping of plumes- Located above the white light spot- I > 5 x <I> i.e. yellow contour- Max visibility at 0.25 MK – do not occur in corona, i.e. cool- Down flows into the spots in TR- No corresponding up-flows- No systematic flows in corona- Up-flows in extended area? (large raster)
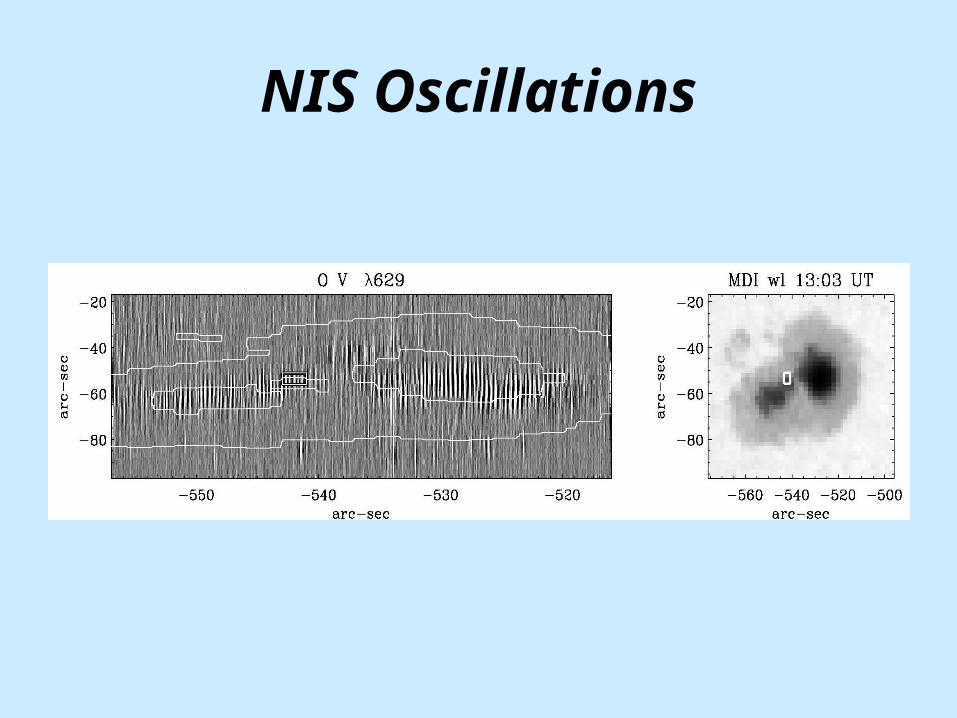
NIS Oscillations

GIS/NIS Oscillations
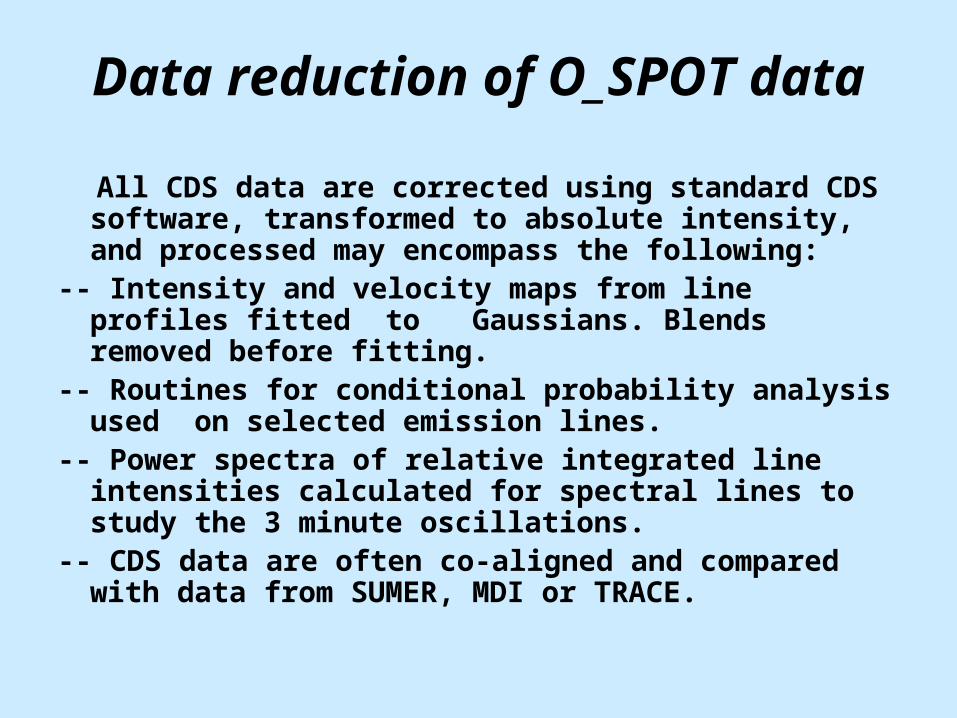
Data reduction of O_SPOT data
All CDS data are corrected using standard CDS software, transformed to absolute intensity, and processed may encompass the following:
-- Intensity and velocity maps from line profiles fitted to Gaussians. Blends removed before fitting.
-- Routines for conditional probability analysis used on selected emission lines.
-- Power spectra of relative integrated line intensities calculated for spectral lines to study the 3 minute oscillations.
-- CDS data are often co-aligned and compared with data from SUMER, MDI or TRACE.
Related Documents