CHAPTER-I
INTRODUCTION:
Health care industry is one of the most prominent industries is service sector. In this fast world
the number of hospital and techniques of service rendered by them are growing and changing rapidly.
Irrespective of the pricing factors the customers pay more attention on “Quality” and “Service”
rendered by the heath care organizations.
Quality is an elusive and indistinct construct. Often mistaken for imprecise adjectives like
“Goodness, or luxury, or weight”, quality and its requirements are not easily articulated by consumers.
Overview of the concept
Service Quality
“Service quality is a measure of how well the service level delivered matches customer's
expectations. Delivering quality service means confirming to customer's expectation on a consistent
basis”. (Lewis and Booms 1983)
According to Asubonteng et al., (1996), due to intense competition and the hostility of
environmental factors, service quality has become a cornerstone marketing strategy for companies.
This highlights how improving service quality is to organization for their survival and growth since it
could help them tackle these challenges they face in the competitive markets. This means that service-
based companies are compelled to provide excellent services to their customers in order to have a
sustainable competitive advantage. There is however, a need for these organizations to understand what
service quality is in order to attain their objectives.
In service marketing literature , service quality is generally defined as the overall assessment of
a service by the customers (Eshghi et al., 2008, p.121) or the extent to which a service meets customer's
needs or expectations , Asubonteng et al., (1996).
According to Douglas & Connor (2003, p.166), Parasuraman et al., (1985, p.42), and Ladhari,
(2008, p.172 ) the intangible elements of a service ( inseparability , heterogeneity and perishability ) are
the critical determinants influencing service quality perceived by a consumer. This means that a service
must be well defined by the provider in terms of its characteristics in order to understand how service
quality is perceived by consumers. According to Johns, (1999, p.954), a service could mean an
industry, a performance, an output, an offering or a process and it is defined differently in various
service industries. The differences in service industries are based on the characteristics of service
1

which include; intangibility, heterogeneity, perishability and inseparability means there is no physical
product, nothing to be touched, tasted, smelled or heard before being purchased and this therefore
means that it is difficult for consumer to understand the nature of what they receive. An example would
be a telecommunication company offering mobile service to customers; here the consumer makes just
calls and does not receive and physical product.
Inseparability means service are consumed as they purchased. An example is seen when a
consumer is making a telephone call, he /she consumes the service while paying the chargers. This
implies that the consumer is involved in the production and delivery of the service meaning he/she
special note of what is actually produced by the service provider (Beamish & Ashford, 2007.p.240).
These above mentioned aspects of service make it very difficult measure service unlike product
quality which is measured objectively using factors such as durability and number defects because
tangible nature quality ( Parasuraman et al.,, 1988, p.13). Gronoroos, (1982,p.36-43), developed the
first model to measure service quality. He identified three components of service quality; the technical
quality is concerned with what delivered (outcome), the functional quality deals with the process of
service delivery ( how it is delivered) and the image quality which is identified as corporate image of
company resulting from both technical and functional qualities of service components. The technical
quality component of products unlike services is easy to assess because they are concerned with
tangibility (service scape) such as physical features that are visible to the consumer. Service scape is
defined as the physical facilities of a service company and this concept is related to the SERVQUAL
model in that the tangible aspects of the physical environment are covered in the SERQUAL model.
Service scape therefore plays a great role int that it influences customers' evaluation of other factors
determining perceived service setting quality like empathy, reliability, responsiveness, and assurances
(Reimer & Kuehn, 2004, p.785). Willam & Dargel, (2004, p.310) further suggest that, service scape is
more in service setting because of the unique characteristics of services (intangibility, perishability
inseparability and heterogeneity). Summarily, servicescape is very important inn the delivery of
services and affects perceived service quality which further leads either customer statisfaction or not.
Service quality is an important area to academicians because of its relevancy to service
companies and therefore many researchers have tried to develop various models to measure it, even
though some claim it is hard to measure because of its intangibility which is hard to quantify ( Eshghi
et al., 2008, p.121); (Douglas & Connor, 2003,p.171). This is why as services are intangible in nature,
evaluating the customer's perception of quality can be done through the interaction with the personnel
offering service, (Magi & Julander, 1996, p.35). From their suggestion, interaction between consumer
2

and service provider cloud easily understand the consumer better and identify what he/she exactly
wants.
Various models have been developed to measure service quality following these approaches
either attitude-based measures service quality because it allows for comparisons before and after
changes, identifies quality related problems, and helps in developing clear standard for service delivery.
Teas, (1993), developed the Evaluated Performance model which measures the gap between
perceived performance and the ideal amount of a dimension of service quality, rather than the
customer's expectation. This was to solve some of the criticism of some previous models Gronroos,
(1985): Parasuraman et al.,(1985,1988).
The SERVQUAL model was made of ten dimensions of service quality when created; tangibles,
reliability, responsiveness, communication, credibility, security, competence, courtesy, understanding
the customer, and access, Parasuraman et al., (1985, p.47-48) but later on these dimensions were
reduced to five because some dimensions were overlapping (communication, credibility, security,
competence, courtesy, understanding customers and access) and they included,
Tangibles - physical facilities, equipments, and staff appearance.
Reliability- ability to perform the promised service dependably and accurately;
Responsiveness -willingness to help customers and provide prompt service;
Assurance – knowledge and courtesy of employees and their ability to inspire trust and confidence;
Empathy – caring, individual attention the firm provides its customers (Parasuraman et al., 1988,
p.23). These dimensions mainly focus on the human aspects of service delivery (responsiveness,
reliability, assurance, and empathy) and the tangibles of service.
3
1.1 INDUSTRY PROFILE
Healthcare Industry:
Health care providers are institutions or individuals providing health care services. Individuals
including health professionals and allied health professions can be self-employed or working as an
employee in a hospital, clinic, or other health care institution, whether government operated, private
for-profit, or private not for profit (e.g non-government organization). They such as in a government
health department or other agency, medical laboratory, or health training institution. Examples of health
workers are doctors, nurses, midwives, paramedics, dentists, medical laboratory technologists,
psychologists, community health worker, traditional medicine practitioners, and others.
The goals for health systems, according to the world health organization, are good health,
responsiveness to the expectations of the population, and fair financial contribution. Progress towards
them depends on how systems carry out four vital factions. Provisions of health care services, resources
generation, financing, and other dimensions for the evaluation of health care system include quality,
efficiency, acceptability, and equity.
Today most governments recognize the importance of public health programs in reducing the
incidence of disease, disability, the effect of ageing and health inequities, although public health
generally receives, although public health generally receives significantly less government funding
compared with medicine. For example, most countries have a vaccinations are voluntary to promote
health, vaccinations are voluntary in some countries and mandatory in some countries, some
governments pay all or parts or the costs for vaccines in a national vaccination schedule.
The rapid emergence of many chronic diseases, which require costly long-term care and
treatment, is making many health managers and policy makers re-examine their health care delivery
practices. An important health issue facing the world currently is HIV/AIDS. Another major public
concern is diabetes.In 2006, according to the world health organization, at least 17, million people
worldwide suffered from diabetes. Its incidence is increasing rapidly, and it is estimated that by the
year 2030, this number will doubted. A controversial aspect of public health is the control of tobacco
smoking linked to cancer and other chronic illnesses.
4

Antibiotic resistance is another is another major concern, leading to the reemergence of diseases
such as tuberculosis, the world health organization, for its world health day 2011 campaign, is calling
for intensified global commitment to safeguard antibiotics and other antimicrobial medicines for future
generations.
Health Care Industry in India
Healthcare industry to double in value by 2012: KPMG
ECONOMICTIMES.COM Jul 21, 2009,
NEW DELHI: Propelled by rising income levels as well as changing demographics and illness profiles,
particularly with a shift from chronic to life style diseases, the Indian health care industry is estimated
to double in value by 2012 at $14.2 billion and more than quadruple by 2017, says the latest Indian
health care edition of KPMG’s Global Infrastructure – Trend monitor.
Consultants KPMG in their just published report on the outlook for Indian healthcare
infrastructure in the next five year reveal that against a world average of around four hospital bead per
1000 population, India lags behind at just over 0, 72 clearly indicating an insufficiency.
Rising income levels, charging demographics and illness profiles with a shift from chronic to
lifestyle diseases would propel the Indian healthcare industry to double in value by 2012 and quadruple
by 2017.
The rate of growth of the health care industry in India is moving ahead neck with
pharmaceutical industry and the country much has been said and done in the health care sector for
bringing about improvement. Till date, approximately 12 % of the scope offered by the health care
industry in india has been tapped. The health care industry in india is reckoned to be the engine of the
economy in the year to come. Health care industry in india is worth $ 17 billion and is anticipated to
grow by 13% every year. The health care sector encompasses health care instruments, health care in the
retail market, hospitals enrolled to the hospital networks etc.,
5

Expenses incurred by the indian government on health are the highest amongst developing
countries. An Indian expense on health care sector comprises 5.25% of the GDP. Chances are that the
health care market could experience a like and attain a figure ranging between $ 53 to $ 73 billion five
year from now. This in turn will reflect an increase in the gross domestic product to 6.2% GDP. The
health care industry in india earns revenues accounting for 5.2% of gross domestic product.
Employment opportunities are provided to as many as 4 million people in the health care
segment or other related sector catering to the health care industry in india in some way or the other.
Owing to the vast differences in medical expenses in western countries and that or india, India has
become one of the favorites for health care treatments due to the progressive nature of the health care
sector in india, several foreign companies are intending to invest in the country.
6

1.2 COMPANY PROFILE
This chapter gives a brief profile of the Meenakshi Mission Hospital and Research Center (MMHRC)
Location of the organization:
This study was conducted at MMHRC, Madurai. It is located at Lake Area, Melur road, Madurai.
Organization of Meenakshi Mission Hospital and Research Center:
Meenakshi Mission Hospital and Research Center (MMHRC), which extends is services from the
temple city of Madurai is managed by the S.R. Trust. MMHRC, which started of with barely 50 beads
in 1990, has after 21 years turned into a 700-bed multi-specialty premiere hospital where patients visit
us with the hope and confidence of getting cured. Dr.N.sethuraman is the chairman, while
Dr.Mrs.RajamSethuraman is the Executive Director of MMHRC. Dr.S.Gurushankar currently
administering the daily activities of MMHRC. Prof. V.N.Rajasearan is the medical director.
The S.R Trust is a public charitable non-profit organization founded by Dr.N.Sethuraman. The
Founder President, Dr.N.Sethuraman, is also the recipient of the prestigious Dr.B.C. Roy National
award for medical social services. He was instrumental in making a medical paradigm shift in health
care, in India.Dr.Sethuraman was inspired by his high School Headmaster, ThiruManikavasagam, who
always urged him not only to provide medical services, but to also work for social upliftment. These
words left an indelible imprint in the heart and mind of young N.Sethuraman. Today,
Thiru.Manikavasagam would have been proud of his student who followed his ideals, and not only
established the S.R. Trust, but made it a full-fledged modern facility with contemporary team-based
care and cutting edge technology.
The S.R. Trust is now managed by its Managing Trustee, Dr. S. Gurushankar, who is a doctor
himself, and a graduate from the Indian Institute of Management (IIM). Since its inception in 1985, the
S.R.Trust continues to grow and develop while adhering to its purpose of existence, to provide
affordable healthcare to all.
7
FOUNDER Dr. N. SETHURAMAN
The S.R.Trust (Reg. No. 291/85 dated May 9,1985), is a public charitable non-profit organization
founded by Dr.N. Sethuraman. The Founder, Dr. N.Sethuraman, is also the recipient of the prestigeous
Dr. B. C. Roy National award for medical social services. He was instrumental in making a medical
paradigm shift in health care, in India.Dr. Sethuraman was inspired by his High School Headmaster,
ThiruManikavasagam, who always urged him not only to provide medical services, but to also work for
social upliftment. These words left an indelible imprint in the heart and mind of young N. Sethuraman.
Today, Thiru.Manikavasagam would have been proud of his student who followed his ideals, and not
only established the S.R. Trust, but made it a full-fledged modern facility with contemporary team-
based care and cutting edge technology.The SR Trust is now managed by its Managing Trustee, Dr. S.
Gurushankar, who is a doctor himself, and a graduate from the Indian Institute of Management
(IIM).Since its inception in 1985, the S.R.Trust continues to grow and develop while adhering to its
purpose of existence, to provide affordable healthcare to all.
Trustees
Dr. N. Sethuraman - Founder
Dr. Mrs. RajamSethuraman - Secretary
Dr. S. Gurushankar - Managing Trustee
Mr. S. Manavalan
Mr. S. Regunathan
Mrs. C. KaminiGurushankar
Mr. G. SakthiSaravanan
8

Meenakshi Mission Hospital & Research Centre (MMHRC)
Meenakshi Mission Hospital & Research Centre (MMHRC), which extends its services from the
temple city of Madurai, is managed by the S.R. Trust. MMHRC, which started of with barely 50 beds
in 1990, has after 21 years, turned into a 700-bed Multi-specialty premiere hospital where patients visit
us with the hope and confidence of getting cured.Dr. Mrs. RajamSethuraman is the Executive Director
of MMHRC. Dr. S. Gurushankar, who dons the role of Vice Chairman, is currently administering the
daily activities of MMHRC. Prof. V.N.Rajasekaran is the Medical Director.
Vision
No man is too poor to afford first-grade medical treatment
Mission
World-class care within everybody's reach
Values
Care, Compassion, Commitment, Charity, Empathy, Quality Service.
Quality Policy
Meenakshi Mission Hospital & Research Centre, in pursuit of excellence, is committed to comply
with applicable requirements for developing and providing world class health care at an affordable cost.
We shall foster an environment in which every person is motivated to continually improve the
efficiency and effectiveness in the management of health care services.
Goals and Objectives:
Patient Registration should complete with in 5 minutes.
To guide new patient.
To provide promote information’s to the patient.
To maintain below 5 years record.
Nature of service rendered.
To receive the patient, attainders and visitors.
9

Our Publications:
Maruthuvamalar – widely circulated allopathic magazine published MMHRC.
MMJ – medical journal published by meenakshi IMA branch for the allopathic doctors
MMHRC news letter carries information to public about services achievement activates of
hospital
Red Ribbon news letter a publication of the STD/HIV/AIDS information technology center
for red ribbon club member.
COMSORT news letter bulletin (Consortiums of service Organization of Tamil Nadu) sup-
ported by MMHRC.
Hemophilia news letter-news letter of the hemophilia club.
“Kasakkumlnippu” Diabetic society MMHRC
Clinical Specialities
Andrology& Urology
Andrology pertains to male health and deals with the male reproductive system and urological
problems peculiar to men. Urology is the medical and surgical specialty focussing on the urinary tract,
kidneys, bladder, urethra, adrenal glands etc. MMHRC offers innovative treatments and management of
these conditions and minimally invasive procedures if necessary. We offer the most comprehensive and
sophisticated services in the hospital. This was the first department to be commissioned at the hospital
under the able leadership of Dr. T.R.Murali, the first full-time consultant, on 22nd. January 1990. The
first patients were seen on 12th. April 1990 and the first urological surgery was performed on 25th
April 1990.The Department caters to ten districts around Madurai and often attracts patients from
Kerala and Chennai for the specialized services like Andrology, TVT "O", ESWL and flexible upper
tract scopy offered at MMHRC
Cardiology
The Department of Cardiology offers innovative and scientifically based treatments for cardiac ail-
ments and quality patient care, backed by a team of qualified, skilled and experienced doctors.
MMHRC provides access to world class cardiac health care, especially to the rural population in the ar-
eas surrounding Madurai. We strongly believe in investing in the latest medical and diagnostic equip-
ment, as well as constantly upgrading the skills of our personnel to offer the very best in care and treat -
ment.MMHRC offers 24 hour emergency services. It is equipped to manage cases of acute myocardial
10

infarction for primary PCI and subsequent management, attend to cases of congestive cardiac failure,
manage and stabilize complicated cases, as well as offer round-the-clock management for various other
acute cardiac cases. The Department of Cardiology is well-equipped, offering dedicated critical care
units with monitors, ventilators and all other necessary equipment.
Diabetology
India is known as the diabetes capital of the world and over 40 million people in India are
affected by diabetes. "Diabetes Mellitus" has assumed pandemic proportions and refers to too
much sugar in the blood, which in turn can be the cause of serious health problems. Chronic
diabetes includes Type-1 or Type 2 diabetes, pre-diabetes and gestational diabetes. In India
one out of every five people is a diabetic. Diabetes itself can be the cause of hypertension,
high levels of cholesterol and lingering infections.Uncontrolled diabetes is linked with many
other illnesses and their morbidity, including retinopathy, kidney failure, heart disease,
stroke, gangrene and neuropathy. MMHRC offers a well-equipped Department of Diabetol-
ogy, manned by experienced doctors, providing world class diabetic care at affordable costs.
We offer state-of-the-art diabetic services and the department focuses on creating awareness,
early detection, monitoring, treatment, management of diabetes and the nutritional needs of
diabetics.
Patient Care
At MMHRC we offer, both outpatient and inpatient care for diabetics, at all three levels.
Primary Care
MMHRC offers screening for diabetes. This includes not only those who are affected by Diabetes, but
also those who are at high risk, with family history, obesity, sedentary lifestyle etc.
Secondary Care
All diabetics are treated and monitored at MMHRC to prevent the onset of long-standing or
uncontrolled diabetic complications like retinopathy, neuropathy and nephropathy. This includes
screening for diabetic complications like fundus photographs, heart check-ups, peripheral vascular
screening, tests for micro albumin, urine PCR, nerve conduction study and autonomic nerve system
study.
Tertiary Care
MMHRC offers treatment and management services for all diabetic complications like chronic renal
failure, proliferative retinopathy, erectile dysfunction and diabetic foot ulcers. This is done in
11

conjunction with the experienced specialists of the respective departments.
Charity
Diabetes is an expensive condition and treatment / management is often life long. At MMHRC we offer
charitable schemes to assist diabetics who find it difficult to afford the treatment required.
Free Insulin scheme
Type -1 Diabetic patients who are identified and treated in our hospital are provided free insulin in
association with Novo aid program.
At present 10 Type-1 DM patients have benefited from this programme.
Diabetic Club
A diabetic club was initiated at MMHRC in 2009 for diabetic patients and regular awareness
programmes / classes are conducted for them, from time to time. The aim of the club is for diabetics to
network with other diabetics and to empower them to live with diabetes throughout their life. The club
has 540 diabetics enrolled as members, and they are regularly educated about diabetes and the
complications associated with it.
E.N.T.
The branch of medicine dealing with the disorders of the ear, nose, throat, neck and head is better
known as E.N.T or Otorhinolaryngology. Reinforced by cutting edge technology and backed by quali-
fied doctors, the ENT Department at MMHRC is equipped to handle ENT cases and emergencies. The
department handles cases pertaining to voice disorders, hearing loss, tonsil infections, vertigo, cancer,
sinus etc. The advent of laser allows complicated surgeries to be performed with ease and minimal
morbidity. Our physicians provide compassionate care for a broad range of E.N.T / Otorhinolaryngeal
disorders and diseases
General Medicine
General Medicine is a branch of medicine which deals with the diagnosis and treatment of the dis-
eases of the internal organs, especially amongst adults. The treatment is non-surgical and the span of
this specialty includes asthma, respiratory diseases, tuberculosis, haematology and geriatric care. The
Department of General Medicine at MMHRC, has admitted and treated the maximum number of pa-
tients. Several executives have undergone the Health Check-up Programmes and many private insur-
ance companies & T.P.A.s’ have included our department doctors in their Panel of Doctors. The Inten-
sive Medical Care Unit (IMCU) and Intensive Coronary Care Unit (ICCU) are equipped with state-of-
12

the-art equipments and manned round the clock by experienced medical personnel.PG Training in Gen-
eral Medicine at MMHRC is recognized by Diplomate National Board of Examinations, New Delhi,
General Medicine and Family Medicine. The PG training programme is quite popular for its depth of
practical training. We attract brilliant and quality aspirants for the PG post every year.
Nephrology
Nephrology is a challenging and complex super specialty requiring knowledge and skill which are
applied with a human touch The Department of Nephrology at MMHRC is spread across 10000 sq. ft.
and has grown to become one of the largest Nephrology centres in India. Since 1992 this department
has become a tertiary referral centre for the management of high risk nephrology cases. This growth
has been under the able leadership of Dr. K. Sampath Kumar, who started his career with two Drake-
Willock old refurbished machines in a humble way and who has been associated with MMHRC for 18
years now. The department has made great strides in diagnosis, treatment and management, offering
patients immense compassion and personalized care. The department has been treating the largest num-
ber of out patients in MMHRC for the last four years, with an average of 80 per day. Every year, a 20%
increase in patient load and growth in all fields of nephrology is seen.
Neurology
The department of Neurology at MMHRC has reached the pinnacle of achievement in its growth
and development between 2010-2011. It offers comprehensive evaluation and treatment for patients
with neurological disorders. The department has two consultant neurologists and four medical officers
available round the clock. We have a state of the art neuro-electro-physiology laboratory for nerve con-
duction study, EEG, Electromyography and evoked potentials. We also offer a separate sleep labora-
tory, where sleep related problems are effectively managed. The number of patients this department has
catered to this year has doubled, as against last year. We have 1351 new cases and 2261 old cases, all
related to neurological disorders. which include diseases related to the brain, spinal cord, nerve roots,
myoneural junctions, muscles, plexus etc
Ophthalmology
The Ophthalmology department at MMHRC, has its own community-oriented programmes to serve
the needy and poor, afflicted with eye problems. The team does excellent work in primary, secondary
and tertiary level eye care in Madurai and covers the southern districts of Tamilnadu. In tune with the
hospitals commitment to serving the impoverished, the department conducts regular eye camps in
seven districts totally free of cost. The department has assumed the role of a comprehensive therapeutic 13
facility in the region, with the fruition of our plans to acquire a perimeter to provide effective screening
and to strengthen the glaucoma clinic.
Orthopaedics& Traumatology
The Department of Orthopaedics and Traumatology at MMHRC, has become one of the tertiary re-
ferral Centre for management of musculoskeletal disorders, joint replacements, trauma, arthroscopic
surgeries and spine surgeries. The department is also recognized by the National Board of Examina-
tions, New Delhi for Post-Graduate training for the award of "Diplomate of National Board" Degree in
Orthopaedics.The department is backed by state-of-the-art facilities at par with international standards
in management of Trauma and is experienced to manage mass casualty cases and disaster management.
Management of polytraumatised victims is a regular feature and multidisciplinary interaction under one
roof has been a boon for successful management of these patients. Round the clock Accident and
Emergency services and readily available specialists provide the best possible treatment and care for
the patients.
Free Meals Scheme
Feed Patients:
The hospital is providing more than 150 patients "Free Meals" 365
days thrice. Become a Contributor today and feed help the poor Pa-
tients. Your gift of Rs. 2000/- a day meal can be a memorable day to 30
poor In-patients in the hospital.
Choose A Day:
The hospital feeds patients on the day the donors choose to provide. You can see the thankful-
ness in the eyes of patients when you provide meals by your hand on your auspicious day like
Birthday
Wedding day
Beloved's birthday
Any memorable day
Donate
14

You can donate as
Sponsoring 'one day meals scheme'
Sponsoring 'one day meals for 5 consequent years'
Sponsoring 'one day meals for every year'
Camila Children's cancer Fund
Childhood Cancer Facts
There are more than 200 different kinds of cancer, each with its own name and treatment. But
the causes of childhood cancers are mainly unknown, although there are many theories. Cancers
are not infectious, so they can’t be passed on to anyone who comes into contact with your child.
Most cancers are not caused by an inherited faulty gene and so it is extremely rare for a second
child in a family to develop cancer. Parents often worry that something they did or did not do may
have caused their child’s cancer. This is not the case, and parents should not feel guilty or that they
are to blame for their child developing
Volunteering
About Volunteer Service
Volunteer Service at Meenakshi Mission Hospital and Research Centre offers a wide range of
service activities. The Volunteer programs provide a unique opportunity for national and interna-
tional volunteers to gain Hospital experience. Many are preparing themselves for health-related ca-
reers in medicine, nursing, or other areas, while others do service in non-medical areas such as
branding, marketing, fundraising to develop new skills, meet new friends, and to have fun while
doing things for others!Whatever the assignment, the objectives are the same - the care and welfare
of the patient.
Our Projects
15
S.R.Trust is so keen in providing multi-facet services to the society by tieing up with the projects of In-
dian state and central government, national and international foundations:
Direct Relief International(DRI), USA regularly supports us through medical supplies and
equipments to serve the needy persons. DRI extended its support towards successful implementa-
tion of telemedicine project.
Magen David Adom (MDA), UK one of the donor organizations helps us in receiving medical
supplies.
Americares India, Mumbai a disaster relief and humanitarian organization supports us since 3
years.
Hospice care provides human and compassionate care inclusive of medical, psychological and
spiritual support for people in the last phases of incurable diseases. So that they may live as com-
fortable as possible. This care not only assists terminally ill patients to die peacefully but also to
make them live peacefully until the patients die.
Hospice care focuses on bringing comfort, self respect, and tranquility to the dying patient. Pa-
tient’s symptoms and pain are controlled to help reach these goals. However the focus is providing
care not curing because Hospice care is used when one can no longer be helped by curative treat-
ment.Our hospital in collaboration with Lions club international – USA, Lions Club Madurai Dis-
trict and Lions Club Madurai Vaigai is establishing a hospice centre for poor patients who need
end of life care. The hospice centre would be 25 bedded with comprehensive facility of modern
hospice care.
Gnanambal Palliative care centre started with the aim of providing the best quality of life for in-
dividuals, many of whom will be approaching death, and to offer comfort and support to their fam-
ilies and careers as well.
Corrective cleft lip /palate surgeries for the poor…Our hospital established an exclusive Smile
Train Centre for cleft lip/palate centre by the grant assistance of Smile Train, USA.
Blindness Control Program for children in collaboration with the Vitamin Angels Alliance, USA
16

to wipe out Vitamin A deficiency among children.
Ekam Project Recently to treat the rural poor children who are in need of acute medical need, we
have initiated a project in collaboration with the EkamTrust, Chennai.
Tamil Nadu Foundation In collaboration with Tamil Nadu Foundation, our hospital conducts free
eye camps at various districts.
Services:
Telemedicine
In India, despite several advancements made in the medical field, the benefits are still available
to the priviledged few residing mainly in the Urban areas. It is a known that 75% of the qualified
doctors practice in Urban Centres, whereas the vast majority of the India’s population live in the
rural areas. Telemedicine is the use of telecommunication and information Technologies in order to
provide clinical health care at a distance. It helps eliminate distance barriers and can improve
access to medical services, that would often not be available in distant rural communities. These
technologies permit communications between patient and medical staff with both convenience and
fidelity as well as the transmission of medical, imaging and health information data from one site
to another. Telemedicine can be extremely beneficial for people living in isolated communities and
remote regions. Patients who live in such areas can be seen by a doctor or specialist, who can
provide an accurate and complete examination, while the patient may not have to travel.
Telemedicine technology critically bridge the distance by all health care professionals using
information and communication technologies for the exchange of valid health information for
diagnosis, treatment and prevention of disease and injuries, research and evaluation, and for the
continuing education of health care providers, all in the interests of advancing the health of
individuals and their communities. Meenakshi Mission Hospital & Research centre in Madurai,
extends its helping hands by establishing Meenakshi Tele Care Centre in rural remote areas. So far
Meenakshi Mission Hospital has established 6 centres in and around southern Tamil Nadu and also
Tele consultation services for Davanekare District - Karnataka. Meenakshi Mission Hospital has
plans to start 500 more Telemedicine centres.
Habitat for Humanity: With the help of Habitat for Humanity India, 100 new houses are built
17

under the name “Millard Linda Habitat” at Kathapatti. 1000 more houses will be launched with the
mission of building new houses to the poor with hope & happiness.
Creche and Play school by The District Social Welfare Board, which caters to the needs of
children from diverse social and cultural backgrounds, aged from 4 months to 3 years. The Creche
aims to provide an environment for children which is safe, happy, loving and stimulating. More
than 40 children are enrolled.
Working Women’s Hostel aims to provide young women not only with reasonably priced housing
but also opportunities for growth, making them self confident at the same time sensitive and
responsible to other women.
Integrated Counselling and Testing Centre (ICTC): With the support of Tamil Nadu State AIDS
Control Society (TANSACS), our hospital provides Prevention of Parent to Child Transmission of
HIV/AIDS (PPTCT) services are remodelled as a hub - 'Integrated Counselling and Testing Centre'
(ICTC) to provide services to all clients under one roof. An ICTC is a place where a person is
counselled and tested for HIV of his own free will or as advised by a medical provider. The main
functions of an ICTC are:
Conducting HIV diagnostic tests Providing basic information on the modes of HIV transmission
and promoting behavioural change to reduce vulnerability.Link people with other HIV prevention,
care and treatment services.
RNTCP III Phase Our hospital has been enrolled as an NGO/Private Provider in our district for
the performance of designated microscope centre scheme in accordance with the Revised National
Tuberculosis Control Program policy. MOU has been signed recently with the Deputy Director of
Medical Services (TB unit), Madurai District.
Family Counselling Centre: Marital problems have become the most distressing in the
lives of many married couples. Our family Counselling Centre counsel many such couples and
help them to live in harmony. This year, we have served more than 400 families.
Apart from Family Counselling, we also counsel cancer patients, HIV patients and others to live in
peace at our hospital which is supported by Tamil Nadu Social Welfare Board, Chennai.
2.1 Need of the Study:-
18

This study helps to identify the service quality of the Meenakshi Mission Hospital and
Research Centre by which the hospital can further improve its performance to enjoy
high reputation among the patients
This study also helps to making necessary changes in the attributes of the services
offered by the Meenakshi Mission Hospital and Research Centre.
This study also helps to identify and offer additional services according to the
expectations of the patients.
19

2.2 Objectives of the study:-
To identify the demographic profile of the patients.
To access the gap between the perceived and expected service quality among the Patients.
To identify the determinants of patients satisfaction in Meenakshi Mission Hospital
To know the overall patient satisfaction in Meenakshi Mission Hospital.
To suggest the ways to improve the quality of services in MMHRC
20

2.3 Scope of the study
The project entitled “Assessing the service quality of Meenakshi Mission Hospital and
Research Center, Madurai.” will enable from the patient point of view to refer the performance of the
service provider and their growth, thereby decide on to continue the same.
The outcome of the study, which is based on the above aspects can be utilized by the Hospitals
in India.
2.4 REVIEW OF LITERATURE
The health care service can be broken down into two quality dimensions: technical quality and
21

functional quality (Gronroos, 1984). While technical quality in the health care sector is defined
primarily on the basis of the technical accuracy of the medical diagnoses and procedures or the
conformance to professional specification, function quality refers to the manner in which the health
care service is delivered to the patient (Lam, 1997). In other words, technical quality is about what the
customer get, functional quality is about how they get it. Research has shown that technical quality falls
short of being a truly useful measure for describing how patient evaluate the quality of a medical
ervices encounter (Boers et al., 1994). Ware and Snyder (1975) state that although technical quality has
high priority with patients, most patients do not have the knowledge to evaluate effectively the quality
of the diagnostic and therapeutic intervention process or information necessary for such evaluation is
not shared with the patient. Thus, patient base their evaluation of quality on interpersonal and
environmental factors, which medical professionals have always regarded as less important. Moreover,
most patients cannot distinguish between the caring performance and the curing performance of
medical care providers (Lam, 1997). O’Callaghan (1998) in their studies, Cronin and Taylor (1994) and
Mc Alexander et al.(1994) found that there is a link between the patient’s perception of quality of
service and patient satisfaction. Research has shown that customers tend to evaluate the quality of the
health care service by focusing on more functional issues like physical facilities, interactions with
receptionists or brochures rather than hard-to evaluate technical aspects of the service delivery (Brown
and Swartz, 1989; Barnes and Mowatt, 1986; Crane and Lynch, 1988; Davies and Ware, 1981).
Research finds that patient satisfaction is positively related to purchase intentions (Cronin and Taylor,
1992), loyalty toward health care providers (John, 1992; Woodside et al., 1989) and adherence to
medical treatment recommendation (Hall and Dornan, 1990). According to Oswald et al., (1998),
consumer must rely on attitudes toward caregivers and the facility itself in other to evaluate their
experiences. They point out that there is a strong connection between health service quality perceptions
and customer satisfaction. Healthcare providers’ focus is providing the appropriate treatment to their
patients. They believe that this actually is the focus of the patient as well (Bopp, 1990). However, as
Swartz and Brown (1989) observed, patients’ perception often differ from those of the physician and
physicians may misperceive their patients’ evaluations. This causes dissatisfaction on the patients’ side
and leads the patient to look for an alternative provider and spread negative word of mouth which
would affect potential clients (Brown and Swartz, 1989; Swartz and Brown, 1989).
Parasuraman et al. (1988) described the development of a 22-item instrument of the
SERVQUAL model having 5dimensions to assess perceptions of customers regarding service quality in
22

service and retailing organizations. The researchers had selected four major well known service
providing businesses: a bank, a credit care company, a firm offering appliance repairs and maintenance
services and a long-distance telephone company. They ended up with a 22-item instrument having five
dimensions. All four different firms, from which the data was collected to perform factor analysis,
yielded five extracted factors with the same items loaded on each factor and having factor loadings
greater than 0.5 cut-off value. The reliability coefficients (Cronbach’s Alpha) were all greater than the
cutoff value of 0.6. This signifies the internal validity of the factors. Scale’s validity was also assessed
with the use of analysis of variance. Several tools have been developed to measure patients’
perceptions, but SERVQUAL instrument developed by parasuraman et al. (1988) is the most widely
used tool (Sohail, 2003). While the finding of some studies confirm the five generic quality dimension
of SERVQUAL (Babakus and Mangold, 1992; Youssef 1996), others either identification less number
of dimensions (Lam, 1997) or used a modified version of the instrument and identified additional
dimensions (Reidenback and Sondifer-Smallwood, 1990). Haywood-farmer and Status (1988)
concluded that SERVQUAL was inappropriate for measuring professional service quality since it
exclude the dimensions for “car service”, “service customization” and “knowledge of the professional”.
Coddington, D., and Moore, K. (1990) employed a modified SERVQUAL approach to
understand the relationship among patients’ perception of inpatient, outpatient and emergency room
service their overall perception of service quality satisfaction with their care and willingness to
recommend the hospital’s service to other. Seven dimensions were identified and differential impacts of
these dimensions were found in the three hospital setting. “patient confidence” was found to affect
patient satisfaction in all three setting in addition to influencing perception of service quality in both the
inpatient and the outpatient setting.
Babakus, E and Boller, G (1992) found that SERVQUAL is reliable and valid in the hospital
environment. Silvestro and Johnston (1992) identified care as a quality factor. Johnston (1995) further
developed the research of Silvestro and Johnston (1992) and found eighteen quality dimensions,
namely, cleanliness, aesthetics, comfort, functionality, reliability, reliability, responsiveness, flexibility
communication, integrity, commitment, security, competence, courtesy, friendliness, attentiveness, care
access and availability. Vandamme and Leunis (1993) suggest that SERVQUAL may not be generalized
to hospital services or health care services due to the uniqueness of the services offered.
Bowers et al., (1994) identified two additional quality dimensions, namely, “caring” and
“patient outcomes” to the five generic quality dimensions of SERVQUAL. The findings of the study
23

pointed out that empathy, responsiveness, reliability, communication, and caring were strongly
correlated with overall patient satisfaction.
Similar to Bowers et al. (1994), Gabbott an Hogg (1995) identified “caring” as a dimension, but
they decided not o accept it as a separate dimension since it was already covered by the five
SERVQUAL dimensions. Anderson (1995) used the SERVQUAL instrument to assess the quality of
service offered by a public university health clinic. The finding revealed that the clinic investigated was
poor on the assurance dimension. Youssef (1996) investigated patients’ satisfaction with National
Health Service (NSH) hospital in the UK using SERVQUAL.
Oliver Richard L.(1980) investigated service quality provided in public and private hospital in
Greece. They found that patient in public hospital were satisfied about the competence of physicians
and nurses. Their finding on private hospital show that patient are more satisfied with physical
facilities, waiting times and admission procedures compared to the public hospitals’ patients.
Carmen, J and Taylor, S. examined public and private hospital in Malta in terms of their care
service quality and concluded that both type of hospitals’ service exceeded the corresponding
customer’s expectations. Dean (1999) conducted research in two different health services setting in
Australia to test the transferability of SERVQUAL. It was concluded that quality factor differ not by
industry, but also by the type of health service. Lim and Tag (200) conducted a modified SERVQUAL
with six dimensions, namely, tangibles, reliability, assurance, responsiveness, empathy, accessibility
and affordability on 252 patients in Singapore hospitals. They concluded that hospital needed
improvements across all six dimensions.
Coddington D, and Moore K. (2000) examined patients’ expectations and perceptions about
hospital service quality in Singapore. In the beginning, the survey instrument was designed with five
dimensions of the SERVQUAL model. The instrument consisted of 25 questions having 5 point Likert
scale. In this study another dimension “accessibility and affordability” was added to the questionnaire
in the form of three additional questions that were different from original SERVQUAL model. This
additional dimension would also be included as the part of the present study.
Sohail’s (2003) objective was to assess the dimensions of the SERVQUAL model that influence
the perception of patients regarding the service quality in private hospitals in Malaysia. Patients’
satisfaction was taken as dependent variable and it was measured on the basis of five dimensions
defined in the SERVQUAL model. The research instrument was a questionnaire based upon a modified
version of SERVQUAL having five dimensions Tangibility, Reliability, Responsiveness, Assurance and
Empathy and it consisted of 15 pairs of matching expectation/perception items. A total of 186 responses
24

were obtained and this represented a response rate of 18.6%. To address construct validity of the study,
factor analysis was conducted. None of the reliability alphas were below the cutoff point of 0.60. The
mean scores of the patients’ expectations of service quality were generally low.
Kang and James (2004) applied the SERVQUAL model in the health care industry based on
European perspective1. A total of 464 users of two specific cell phone companies in South Korea were
interviewed. Interviewees were asked to rate questions in the questionnaire constructed for 3 constructs
i.e. functional quality, technical quality, image and their impact on overall service quality and customer
satisfaction. Confirmatory Factor Analysis (CFA) was conducted to check the unit-dimensionality of
the construct. Initial results did confirm the five-factor structure of the SERVQUAL model. The results
of the study indicated that functional and technical quality influence the perceptions that are related to
the overall service quality.
Evans J and Lindsay W. (2005) tested perceptions of service quality in Egypt from the
perspective of public and private hospital patients and attempted to seek an answer to the question; how
do patients evaluate service quality by using relevant dimension. A survey of a total of 500 patients,
from 12 hospitals of Egypt was conducted, and resulted in 332 successfully filled questionnaires. This
questionnaire was designed on the basis of the five dimensional SERVQUAL model having 5-point
Likert rating scale. The results of the survey highlighted a three factor solution of the SERVQUAL
model. A statistically significant difference in terms of service quality was observed between public and
private hospitals.
Karassavidou (2009) aimed to identify the service quality dimension used by patients for
service quality evaluation in Greek NHS (National Services Hospitals). A SERVQUAL questionnaire,
including an expectation and perception section, each consisting of 26 statements having seven point
Likert scale was used for the survey. A survey of 137 patients was conducted in six hospitals method
was used to extract factors. Factor analysis resulted in three extracted factors. Alpha coefficient ranged
from 0.785 to 0.996 and confirmed the reliability of all three dimensions. Gap analysis was also
performed to determine the degree to which the difference between expectations and perceptions exist
among patients surveyed.
Oliveria and Ferreira’s (2008) measured service quality at a higher education institute in Brazil.
This was a survey based research. The survey instrument was five dimensional SERVQUAL model.
The instrument consisted of 19 items having 7 point Likert scale. The gaps between expectations and
25

perceptions for all 19 items had been measured. The questionnaire was applied to 38 beginning
students in the Production Engineering course. The results show that the gaps for all 19 items were
negative and this implies that the expectations of the students were higher as compared to the
perceptions.
Manaf and Nooi (2009) based their study upon the difference in perceptions and expectations of
in-patients and out-patients on the basis of SERVQUAL model adapted for the health care industry in
Malaysia. Surveys of outpatients and inpatients were conducted and 646 inpatients and 570 outpatients’
usable questionnaires were analyzed. Factor analysis was carried out for both inpatient and outpatient
data. This yielded with two factors, namely clinical dimensions of service 2 and physical dimension of
service.
Miranda et.al. (2010) based their study on the SERVQUAL model and measured the gap
between the perceptions of health managers and that of patients’. Patients’ satisfaction was taken
as the dependent variable and the variables, Health staff (doctors and nurses), Efficiency (waiting times
and the time it takes to resolve complaints), No Health Staff (administrative staff), and Facilities
(cleanliness, equipment and the location of the health center) were taken as independent variables. The
gap between the perceptions of health managers and patients were measured and most of them were
found to have statistically significant negative values.
Yesilada and Direktor (2010) extracted the dimensions of the SERVQUAL model in both public
and private hospitals. In the survey, 990 people living in Northern Cyprus, above 18 years of age were
selected for the survey. 806 people contributed their responses. A 22 items-SERVQUAL model with 5-
point “agree-disagree” Likert scale was used. Three factors were extracted through factor analysis, with
61.5% explained variance. Reliability –confidence, empathy and tangibility appeared as the most
important dimensions of service quality. Private hospitals appeared with smaller gaps between
expectations and perceptions (not negligibly small), as compared to the public hospitals and were
perceived as better service providers.
3. RESEARCH METHODOLOGY
Research
Research refers to the systematic method consisting of enunciating the problem, formulating a
26

hypothesis, collection the fact or data, analyzing the factors and reaching certain conclusions either in
the form of solutions to words the concerned problem or in certain generalization for some theoretical
formulation, red man and more define research as a “ systematized effort to gain new knowledge”.
Methodology
Research Methodology is purely and simple the frame work or plan for a study that guide the
collection and analysis of the data. It is a way to systematically solve the research problem. It may be
understood as a science of studying how research is done statistically.
3.1 Research Design
Research Design is the arrangement of conditions for collection and analysis of data in a
manner that aims to combine relevance to the research purpose with economy in procedure. In this
study descriptive research is been used.
3.2 Descriptive Research
It includes surveys and facts finding enquires of different kinds. The major purpose of it is
description of the state of affairs as it exists at present. The main chart of it is the researcher has no
control over the variable; he or she only report. What has happened or what is happening.
3.3 Sampling Technique
Simple Random Sampling technique has been used to select the sample
A Simple Random Sampling is a group of subjects (a sample) chosen from a larger group ( a
population)
3.4 Sources of Data
Primary Data
Secondary Data
3.4.1 Primary Data
It is are those which are collected a fresh and for the first time and thus happen to original in
character. There are several methods of collecting primary data, particularly in surveys and descriptive
researches. Important ones are observation method interview method, through questionnaires, through
schedules, using mechanical devices, through projective technique, Depth interview and content
analysis.
Primary Data has been collected through face to face interview and filling the questionnaire
from the customers of Meenakshi Mission Hospital and Research Centre.
3.4.2 Secondary Data
27

Secondary data means data that are already available. i.e., they refer to the data which have
already been collected and analyzed by someone else. Secondary data may either by published data or
unpublished data.
Secondary Data has been collected through various publications related to hospitals, books,
journals, company publications
3.5 Sample Size
Sample size is the total number of samples selected for the study from the sampling population.
Sample size for the study was arrived at 150 respondents is taken for this study. The sample area
chosen for the study are patients of Meenakshi Mission Hospital and Research Centre.
3.6 Statistical tool used
Percentage Analysis
Reliability
Chisquare
Service Gap Score
Percentage Analysis
The following is the formula to calculate percentage analysis
Percentage of Respondent = No. of Respondent x 100
Total no. of Respondent
CHI - SQUARE Analysis
This test is used to test significance of association between two attributes. Chi- square,
symbolically written as χ 2 (pronounce as Ki- square), is a statistical measure used in the context of
sampling analysis for comparing a variance to a theoretical variance. Formula for finding chi square
is
χ 2 = ∑(O-E)2/ E
4.1. DESCRIPTIVE STATISTICS
4.1.1 Gender wise classification of the Patients
28

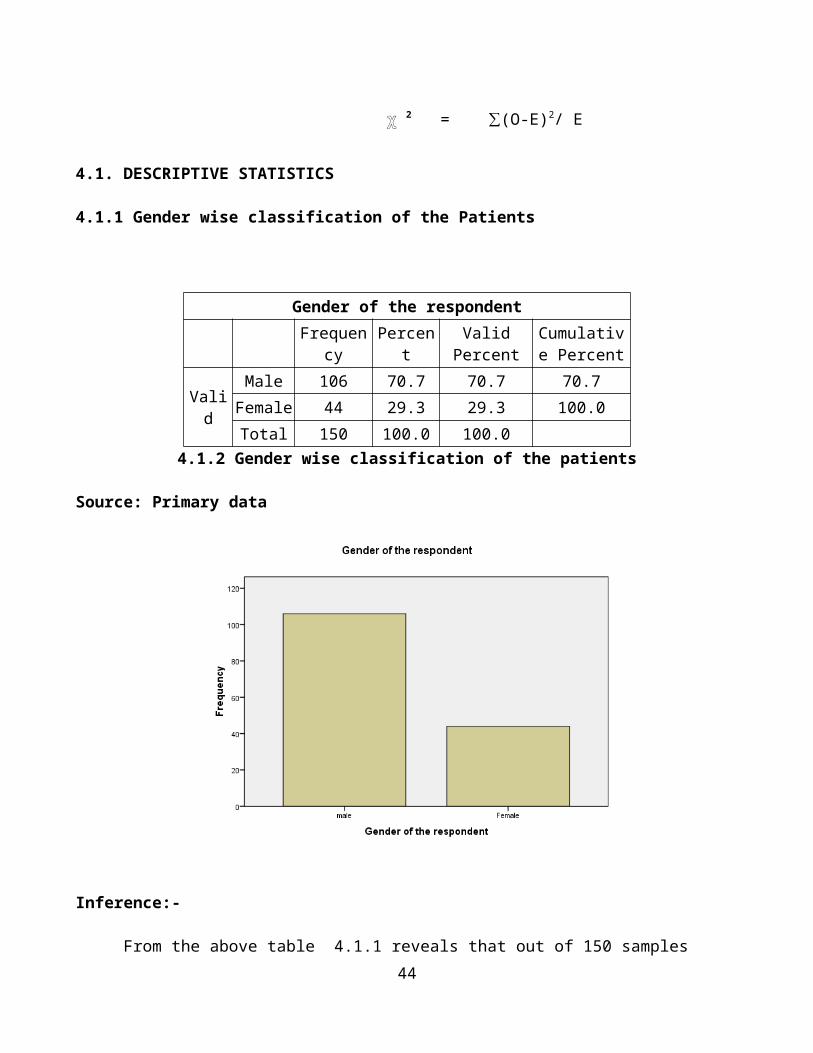
Gender of the respondent
Frequency Percent Valid PercentCumulative
Percent
Valid
Male 106 70.7 70.7 70.7
Female 44 29.3 29.3 100.0
Total 150 100.0 100.04.1.2 Gender wise classification of the patients
Source: Primary data
Inference:-
From the above table 4.1.1 reveals that out of 150 samples taken for the survey, 70.7% majority of
the respondents are male remaining 29.3% of the respondents are female.
4.1.2 Age wise classification of the patients
29

Age group of the respondent
Frequency Percent Valid PercentCumulative
Percent
Valid Less than 20 years 10 6.7 6.7 6.7
Between 21years to 30 years
42 28.0 28.0 34.7
Between 31years to 40 years
47 31.3 31.3 66.0
Between 41 years to 50 years
19 12.7 12.7 78.7
Greater than 50 years 32 21.3 21.3 100.0
Total 150 100.0 100.0
4.1.2 Age wise classification of the patientsSource: Primary data
Inference:-
From the above table 4.1.2 inferred that out of 150 samples, 31.3% majority of the respondents are
belongs to the age group of 31 to 40, 28% of the respondents belongs to the age group of 21 to 30 and
the remaining percentage of the respondents belongs to the age group of others.
4.1.3 Marital status of the Patients
30

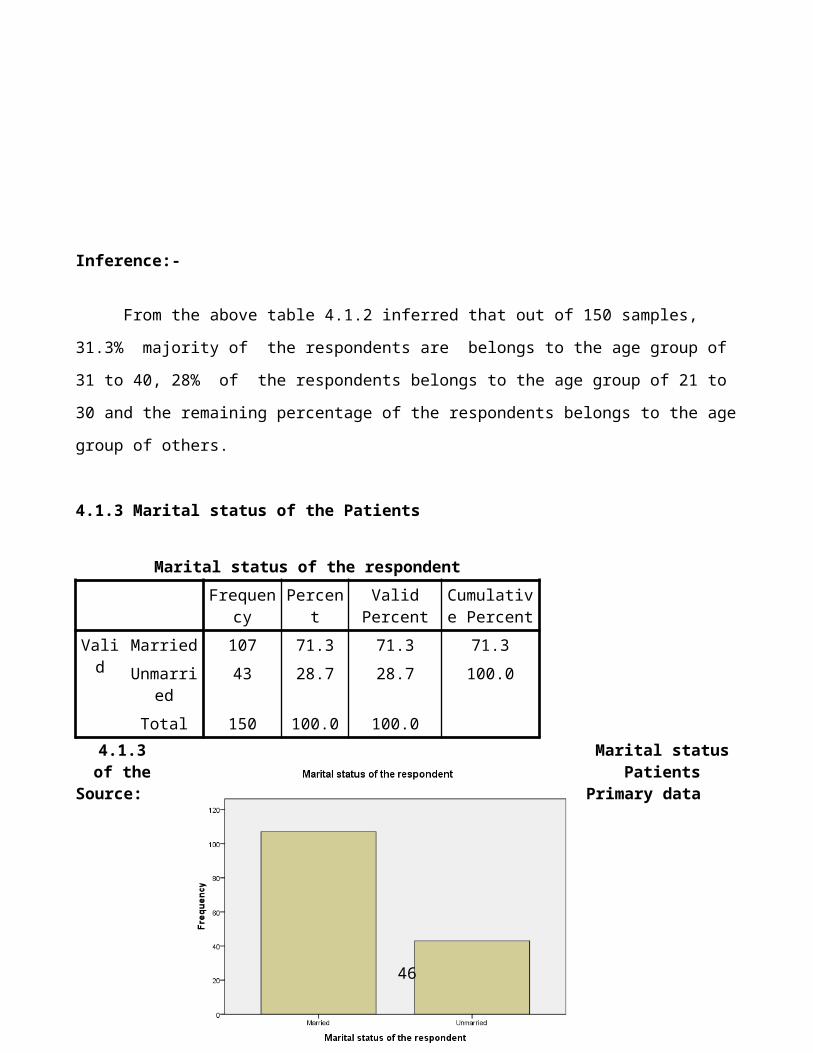
Marital status of the respondent
Frequency Percent Valid PercentCumulative
Percent
Valid Married 107 71.3 71.3 71.3
Unmarried 43 28.7 28.7 100.0
Total 150 100.0 100.0
4.1.3 Marital status of the PatientsSource: Primary data
Inference:-
From the above table 4.1.3 reveals that out of 150 samples, 71.3% majority of the respondents are
married and remaining 28.7% of the respondents are unmarried.
4.1.4 Level of Education of the Patients
31

Level of Education of the respondent
Frequency Percent Valid PercentCumulative
Percent
U.G 40 26.7 26.7 26.7
P.G 29 19.3 19.3 46.0
Diploma 14 9.3 9.3 55.3
Higher secondary 30 20.0 20.0 75.3
Below 10th 37 24.7 24.7 100.04.1.4 Level of Education of the Patients
Source: Primary data
Inference:-
From the above table 4.1.4 inferred that out of 150 samples, 26.7% majority of the respondents
belongs to Under Graduation(UG), 24.7% of the respondents belongs to below 10th and the
remaining percentage of the respondents belongs to others.
4.1.5 Occupation of the respondent
32
Occupation of the respondent
Frequency Percent Valid PercentCumulative
Percent
Valid Business 62 41.3 41.3 41.3
Professional 31 20.7 20.7 62.0
Student 31 20.7 20.7 82.7
Housewife 26 17.3 17.3 100.0
Total 150 100.0 100.0
4.1.5 Occupation of the respondentSource: Primary data
Inference:-
From the above table 4.1.5 inferred that out of 150 samples, 41.3% majority of the respondents
belongs to Business, 20.7% of the respondents are belongs to both professional and student and
remaining percentage of the respondents are belongs to others.
4.1.6 Monthly family income of the respondent
33

Monthly family income
Frequency Percent Valid PercentCumulative
Percent
Valid Less than 10,000 42 27.3 27.3 27.3
Rs. 10,001 to Rs. 25000
28 20.3 20.3 47.6
Rs. 25,001 to Rs.50,000
33 21.3 21.3 68.9
Rs. 50,001 to Rs. 75000
37 24.4 24.4 93.3
Greater than Rs. 75000 10 6.7 6.7 100.0
Total 150 100.0 100.0
4.1.6 Monthly Family IncomeSource: Primary data
Inference:-
From the above table 4.1.6 inferred that out of 150 samples, 27.3% majority of the respondents
belongs to the income group of Less than 10,000, 20.3% of the respondents belongs to the income
group of Rs 10,001 to 25,000 , 6.7% of the respondents are belongs to the income group of more than
75,000.
34

4.1.7 Referral of hospital by the patients
How do you know about this Hospital?
Frequency Percent Valid PercentCumulative
Percent
Valid Family doctor referral
40 26.7 26.7 26.7
Friends 50 33.3 33.3 60.0
Relatives 46 30.7 30.7 90.7
Advertisement 14 9.3 9.3 100.0
Total 150 100.0 100.0
4.1.7 Referral of hospital to the patientsSource: Primary data
Inference:-
From the above table 4.1.7 inferred that out of 150 samples, 33.3% majority of the respondents
belongs to the referral by friends, 30.7% of the respondents belongs to the referral by Relatives and
the remaining percentage of the respondents belongs to the others.
35

4.2 Reliability statistics for the Expectation and Perception
4.2.1 Reliability for Expectation
4.2.1Reliability for Expectation
4.2.2 Reliability for Perception
Reliability Statistics
Cronbach's Alpha N of Items
.933 24
4.2.2 Reliability for Perception
Inference:- From the above table 4.2.1 and 4.2.2 inferred that the reliablility statistics for expectation is 0.804
and the perception is 0.933.
4.3 Cross tabulation and Chi-Square Test
4.3.1 Cross tabulation between the Age wise classifications of the patients by treatment 36
Reliability Statistics
Cronbach's Alpha N of Items
.804 24

undergone in this hospitals
H0: There is no significant difference between Age and treatment undergone in this Hospital
H1:There is significant difference between Age and treatment undergone in the Hospital
General
Medicine
Andrology
and
Urology
Diabeto
logy E.N.T
Nephr
ology
Neuro
logy
Gynae
cology
Orthopae
dics
Opthal
molog
y
Age
group
of the
respon
dent
Less than
20 years3 0 0 2 0 0 1 0 4 10
Between
21years to
30 years
17 0 2 9 0 0 1 4 9 42
Between
31years to
40 years
14 2 7 9 1 6 1 4 3 47
Between 41
years to 50
years
9 0 4 1 0 3 0 1 1 19
Greater than
50 years8 1 8 2 0 2 1 7 3 32
Total 51 3 21 23 1 11 4 16 20 150
4.3.1 Cross tabulation between the patients undergone treatment in this hospital and age wise
classification
Chi-square
Value dfAsymp. Sig.
(2-sided)
Pearson Chi-Square 45.831a 32 .054
Likelihood Ratio 50.971 32 .018
Linear-by-Linear Association
.106 1 .744
N of Valid Cases 150
37

Inference:-
The above table 4.3.1 shows that the chi-square value is 0.054. Here the value is greater than 0.05. Therefore
the H0 is accepted. Hence there is no significant difference between age and treatment undergone in this
hospital.
4.3.2 Cross tabulation between the Gender wise classification by referral to the patients
H0: There is no significant difference between Gender and Referral by the patients
H1:There is significant difference between Gender and Referral by the patients
How do you know about this Hospital?
Total
Family doctor
referral Friends Relatives Advertisement
Age group of the
respondent
Less than 20 years 1 4 4 1 10
Between 21years to 30
years
3 23 11 5 42
Between 31years to 40
years
12 14 14 7 47
Between 41 years to 50
years
8 2 9 0 19
Greater than 50 years 16 7 8 1 32
Total 40 50 46 14 150
4.3.2 Cross tabulation between the Gender wise classification by referral to the patients
38

Chi-Square
Value dfAsymp. Sig.
(2-sided)
Pearson Chi-Square 5.783a 3 .123
Likelihood Ratio 6.258 3 .100
Linear-by-Linear Association
2.907 1 .088
N of Valid Cases 150
Inference:-
The above table 4.3.2 shows that the chi-square value is 0.123. Here the value is less than 0.05.
Therefore the H0 is rejected. Hence there is significant difference between Gender and Referral for the
patients.
4.3.3 Cross tabulation between the age wise and income wise classification
H0: There is no significant difference between age and income wise classification patients
H1:There is significant difference between age and income wise classification of the patients
Monthly family income
Total
Less than
10,000
Rs. 10,001 to
Rs. 25000
Rs. 25,001 to
Rs.50,000
Rs. 50,001 to
Rs. 75000
Greater than
Rs. 75000
Level of Education of
the respondent
U.G 15 9 10 5 1 40
P.G 3 9 6 5 6 29
Diploma 4 2 5 3 0 14
Higher
secondary
4 8 6 9 3 30
Below 10th 9 7 8 13 0 37
Total 35 35 35 35 10 150
4.3.3 Cross tabulation between the age wise and income wise classification
39

Chi-Square Tests
Value Df
Asymp. Sig. (2-
sided)
Pearson Chi-Square 28.709a 16 .026
Likelihood Ratio 29.536 16 .021
Linear-by-Linear
Association
2.173 1 .140
N of Valid Cases 150
Inference:-
The above table 4.3.3 shows that the chi-square value is 0.026. Here the value is less than 0.05.
Therefore the H0 is rejected. Hence there is significant difference between the age wise and income
wise classification
40
4.4 Service Gap Score:
Step1: Designing SERVQUAL Instrument
Perceptions Expectations Gap
Score
Tangibles P Tangibles E P-E
MMHRC have up to date Equipment 6.2 Ideal Hospitals have modern
Equipment
4.7 1.5
MMHRC physical installations are
visually attractive
5.1 The physical installations
should be visually attractive
4.9 0.2
MMHRC employees are well dressed
and clean
4.9 The employees should be
well dressed and clean
4.9 0
The appearance of MMHRC physical
installations is conserved according
to the service offered
5.0 The appearance of hospital
installations should be
conserved according to the
service offered
4.9 0.1
Total 21.2 19.4 1.8
Average Gap Score[Total of E-P/4] 0.45
Reliability P Reliability E P-E
When MMHRC promise to do
something in a certain time they really
does it
4.9 When these hospitals promise
to do something in a certain
time they must do it
4.9 0
When you have any problem with
MMHRC it is solidary and makes you
feel secure
4.8 When the patient have any
problems the latter must be
solidary and make them feel
secure
4.8 0
MMHRC can be trusted 4.8 These hospital should be of
confidence
4.4 0.4
MMHRC provides the service in the
time promised
5.3 They should provide the
service in time promised
4.4 0.9
MMHRC keeps it records correctly 5.1 They should keep their 4.4 0.7
41

records correctly
Total 24.9 22.9
Average Gap Score[Total of E-P/5] 0.4
Responsibility P Responsibility E P-E
MMHRC does not inform exactly
when services will be executed.
4.9 It should be expected that
they inform patients exactly
when the services are to be
executed.
4.2 0.7
You do not receive immediate sevices
form MHRC employees
4.5 It is not reasonable to expect
immediate availability of
hospital employees
4.6 -0.1
MMHRC employees are not always
available to help Patients
4.6 Hospital employees do not
need to be always available to
help clients.
4.7 -0.1
MMHRC employees are always too
busy to respond
4.8 It is normal for them to be too
busy to readily respond to
requests
4.3 0.5
Total 18.8 17.8
Average Gap Score[Total of E-P/4] 0.25
Assurance P Assurance E P-E
You can believe MMHRC employees 4.7 Patients should be able to
believe in the Hospital
employees
4.3 0.4
You feel secure negotiating with
MMHRC employees.
4.4 Patients should be able to feel
safe in negotiating with
Hospital employees.
4.4 0
MMHRC employees are polite 4.6 The employees should be
polite
4.6 0
MMHRC employees do not obtain
adequate support from the hospitals to
perform their tasks correctly.
The employees should obtain
adequate support from the
hospitals to perform their 42

4.7
tasks correctly.
4.3 0.4
Total 18.4 17.6
Average Gap Score[Total of E-P/4] 0.2
Empathy P Empathy E P-E
MMHRC does not pay individuals
attention to you.
4.8 It should not be expected for
hospitals to pay individuals
attention to patients.
4.4 0.4
MMHRC employees do not give
personal attention to you
4.7 It shoud be expected for the
employees to give
personalized attention to
patients.
4.7 0
MMHRC employees donot know their
needs
4.7 It is absurd to expect the
employees to know the
patient needs
4.1 0.6
MMHRC does not have your best
interest as its objective.
4.9 It is absurd to expect these
hospitals to have the patients
best interest as their
objective.
4.2 0.7
MMHRC does not have convenient
working hours for all patients.
4.7 It should not be expected for
the working hours to be
convenient for all patients.
4.6 0.1
MMHRC give enough treatment for
their patients
4.4 It give enough treatment for
patients
4.4 0
The treatment of MMHRC is in good
quality
4.8 The treatment of hospitals
have good quality
4.7 0.1
Total 33 31.1
Average Gap Score[Total of E-P/7] 0.27
43
Step2: Calculation of Service Gap score
Scores for five different categories as calculated in step1 is averaged to compute Service Gap
score is given below
S.no Categories Gap Scores
1 Average score for Tangibles 0.45
2 Average score for Reliability 0.40
3 Average score for Responsiveness 0.25
4 Average score for Assurance 0.20
5 Average score for Empathy 0.27
Total 1.57
Average (Total/5) un-weighted score 0.314
Inference:
From the above 4.4 table shows that the service gap score for the Meenakshi Mission Hospital
and Research Centre in Madurai city, it show that lowest service gap in “Assurance” and
“Responsiveness” dimension and little bigger service gap is occurred in the “Tangibles” and
“Reliability” dimension.
44

5.1 Findings:-
By applying descriptive statistics determined the demographic profile of 150 samples determined,
majority of the respondents are in male (106) and rest of them are female respondents(44) in this re-
search study.
By applying the descriptive statistics determined the demographic profile of 150 samples deter-
mined, majority of the respondents 31.3% belongs to the age group of 31 to 40, 28% respondents
are belongs to the age group of 21 to 30 and the remaining percentage of the respondents belongs to
the age group of others.
By applying the descriptive statistics determined the demographic profile of 150 samples deter-
mined, majority of the respondents 26.7% belongs to the Under Graduate, 24.7% belongs to the
Post Graduate and the remaining percentage of the respondents belongs to the educational qualifi-
cation of others.
The Majority of the respondents, 41.3% belongs to the Own Business category and 20.7% are be-
longs to the professionals and student and the remaining respondents are belongs to the other cate-
gories.
By applying the descriptive statistics, 27.3% majority of the respondents belongs to the income
group of Less than 10,000, 20.3% of the respondents belongs to the income group of Rs 10,001 to
25,000 , 6.7% of the respondents are belongs to the income group of more than 75,000.
The majority of respondents 33.3% belongs to the referral by friends, 30.7% respondents belongs to
the referral by Relatives and the remaining percentage of the respondents belongs to the others.
By applying the chi-square statistics there is no significant difference between age and treatment
undergone in this hospital.
By applying the chi-square statistics there is no significant difference between gender and Referral
to the hospital.
By applying the service gap score analysis for the Meenakshi Mission Hospital and Research Cen-
tre in Madurai city, it show that lowest service gap in “Assurance” and “Responsiveness” dimen-
sion and little bigger service gap is occurred in the “Tangibles” and “Reliability” dimension.
5.2 Suggestions
45
It is suggested to improve the patient’s satisfaction level through providing more amenities to the
patients then only more number of patients are preffered to Meenakshi Mission Hospital and
Research Centre.
It is suggested to reduce the waiting hours of the patients.
It is suggested to reduce the price of the food in the canteen because the price fixed for food in the
canteen is comparatively higher regarding to the quality of the food served.
It is suggested to provide separate room patient cardiology department. The ward secretary must to
give periodical advise to the patient and patient attainders regarding the procedure followed in
hospital.
It is suggested to the cash counter must have additional counters in order to pay faster.
5.3 Conclusion
46

This Research project explained the service quality of Meenakshi Mission Hospital and
Research Centre in Madurai city. The study has been able to accomplish its objectives, by thoroughly
analyzing and identifying the service gap of Meenakshi Mission Hospital and Research Centre
strengths and weaknesses of various service covers among the patients of various places. The company
may highly benefited by outcome of this study.
The outcome of the study has proved that the service quality of the Meenakshi Mission Hospital
and Research Centre strengths and Patients satisfaction towards the MMHRC. The Hospital has a
higher reputation among the patients.
It is concluded that the Hospital could initiate various steps based on the recommendations
given in this report. The hospital by adopting some of the recommendations , if not all can further
improve its service quality .
47

Bibiliography:-
1. Parasuraman A, Zeithaml VA, Berry LL. (1988), “SERVQUAL: “A multiple term scale for measur-
ing customer perceptions of service quality”, Journal of retailing, Vol.No. 61, pp.12-40.
2. Carmen J, and Taylor S. (1990), “Measuring service quality: “A Reexamination and Extension,”
Journal of retailing, Vol.No. 66, pp.33-35.
3. Lanning J.A. (1990), “The Health care Quality Quagmire: some Signposts.” Hospital and Health
sciences Administration, Vol.No.35, pp.39-54.
4. Babakus E, Boller G. (1992), “An empirical Assessment of the SERVQUAL Scale.” Journal of
Business Research”, Vol. No. 24, pp.253-68.
5. Stevenson W. (1999) “Production & operations management”, 6th edition Boston, MA: Irwin Mc-
Graw-Hill, pp. 421-422.
6. Gronroos. C.(1984), ”A service quality model and its marketing implications”, European journal of
marketing, Vol.No. 18, pp.36-44
7. Oliver Richard L.(1980) “A cognitive model of antecedents and consequence of satisfaction deci-
sions”, journal of marketing Research, Vol.No. 17, pp. 46-54.
8. Bowers M, Swan I, and Kohler W.(1994) “What attributes Determine quality and satisfaction With
Health care Delivery?” Health care Management Review Vol.No.19, pp. 49-55.
9. Coddington D, and Moore K. (1987) ”Quality of care as a Business Strategy: How customers De-
fine quality and how to Market it.” Healthcare forum Vol.30, issue no.2, pp. 29-32.
10. Evans J and Lindsay W. (1999). “The management and control of quality”, 4th edition St.Paul, MN:
West. pp.52
11. www.meenakshimission.org
12. www.smilemmhrc.org
13. www.google.com
QUESTIONNAIRE
Dear sir,
48

This is a MBA Academic questionnaire titled “Assessing the Service Quality of Meenakshi Mission Hospital
and Research Center, Madurai”. Your personal details and identity are not revealed in this research. You have
been randomly selected to participate in this survey; please do not mention your address in the questionnaire. I
also express my hearty thanks for spending your valuable time in answering this questionnaire.
Name of the Patient : ____________________________________________________
1. Gender: □ (1) Male □ (2) Female
2. Age Group:
□ (1) Less than 20yrs □ (2) Between 21 yrs to 30 yrs □ (3) Between 31 yrs to 40 yrs
□ (4) Between 41rs to 50 yrs □ (5) Greater than 50 yrs.
3. Marital Status: □ (1) Married □ (2) Unmarried
4. Educational Qualification:
□ (1) SSLC/HSC □ (2) Undergraduate □ (3) Postgraduate □ (4) Diploma □ (5) Others
If (5) Others, Please Specify ___________________________.
5. Occupation:
□ (1) Business □ (2) Professional □ (3) Student □ (4) Housewife □ (5) Others
If (5) Others, Please Specify ___________________________.
6. Monthly Family Income:
□(1)Less than Rs.10,000 □ (2) Between Rs.10,001 to Rs.25,000 □(3) Between Rs.25,001 to Rs.50,000
□ (4) Between Rs.50, 001 to Rs.75, 000 □ (5) Greater than Rs.75, 000
7. How did you come to know about the Meenakshi Mission Hospital and Research Centre?
□ (1) Through Family Doctor Referral □ (2) Through Advertisements
□ (3) Family Members Referral □ (4) Friends Referral
49

□ (5) Others (If Others, Please Specify_________________________________________)
8. Which Type of Treatment you had undergone in Meenakshi Mission Hospital and Research
Centre?
□ (1) Andrology & Urology □ (2) Cardiology □ (3) Venereology
□ (4) Diabetology □ (5) E.N.T. □ (6) Nephrology
□ (7) Neurology □ (8) Ophthalmology □ (9) Orthopaedics
□ (10) General Medicine □ (11) Gynecology □ (12) □ Paediatrics
□ (13) Others (If Others, Please Specify_________________________________________)
Expectations:-
This section deals with your opinion of hospital in Madurai. Please show the extent which you
think. Hospitals should possess the following features. We are interested in knowing your expectations
from ideal Hospitals in Madurai. You should rank each statement as follows;
50

Strongly Disagree ------------------------------------------------------------------Strongly Agree 1 2 3 4 5 6 7
s.no Features
Strongly strongly
disagree agree
1.
Tangibility:-
Ideal Hospitals have modern Equipment
1 2 3 4 5 6 7
2. The physical installations should be visually attractive 1 2 3 4 5 6 7
3. The employees should be well dressed and clean 1 2 3 4 5 6 7
4. The appearance of hospital installations should be
conserved according to the service offered
1 2 3 4 5 6 7
5.
Reliability:-
When these hospitals promise to do something in a certain
time they must do it
1 2 3 4 5 6 7
6. When the patient have any problems the latter must be
solidary and make them feel secure
1 2 3 4 5 6 7
7. These hospital should be of confidence 1 2 3 4 5 6 7
8. They should provide the service in time promised 1 2 3 4 5 6 7
9. They should keep their records correctly 1 2 3 4 5 6 7
10.
Responsibility:-
It should be expected that they inform patients exactly when
the services are to be executed. 1 2 3 4 5 6 7
11. It is not reasonable to expect immediate availability of
hospital employees
1 2 3 4 5 6 7
12. Hospital employees do not need to be always available to
help Patients.
1 2 3 4 5 6 7
13. It is normal for them to be too busy to readily respond
requests
1 2 3 4 5 6 7
14.
Assurance:-
Patients should be able to believe in the Hospital employees 1 2 3 4 5 6 7
51
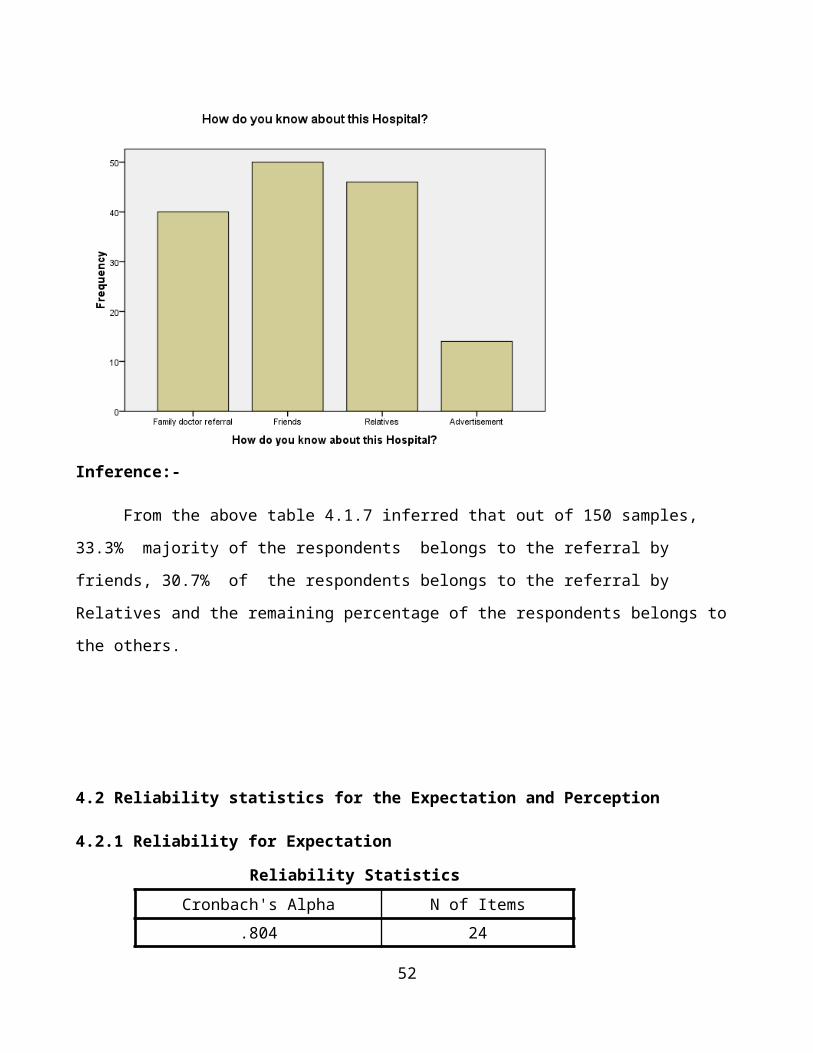
15. Patients should be able to feel safe in negotiating with
Hospital employees.
1 2 3 4 5 6 7
16. The employees should be polite 1 2 3 4 5 6 7
17. The employees should obtain adequate support from the
hospitals to perform their tasks correctly.
1 2 3 4 5 6 7
18.
Empathy:-
It should not be expected for hospitals to pay individuals
attention to patients.
1 2 3 4 5 6 7
19. It shoud be expected for the employees to give personalized
attention to patients.
1 2 3 4 5 6 7
20. It is absurd to expect the employees to know the patient
needs
1 2 3 4 5 6 7
21. It is absurd to expect these hospitals to have the patients
best interest as their objective.
1 2 3 4 5 6 7
22. It should not be expected for the working hours to be
convenient for all patients.
1 2 3 4 5 6 7
23. It give enough treatment for patients 1 2 3 4 5 6 7
24. The treatment of hospitals have good quality 1 2 3 4 5 6 7
Perceptions:
The following statement deal with the perceptions of service experienced in Meenakshi
Mission Hospital and Research Centre. Please show the extent to which these statements reflect your
perception of service in Meenakshi Mission Hospital and Research Centre in Madurai.
52

Strongly Disagree ------------------------------------------------------------------Strongly Agree 1 2 3 4 5 6 7
s.no Features
Strongly strongly
disagree agree
1.
Tangibility:-
MMHRC have up to date Equipment
1 2 3 4 5 6 7
2. MMHRC physical installations are visually attractive 1 2 3 4 5 6 7
3. MMHRC employees are well dressed and clean 1 2 3 4 5 6 7
4. The appearance of MMHRC physical installations is
conserved according to the service offered
1 2 3 4 5 6 7
5.
Reliability:-
When MMHRC promise to do something in a certain time
they really does it
1 2 3 4 5 6 7
6. When you have any problem with MMHRC it is solidary
and makes you feel secure
1 2 3 4 5 6 7
7. MMHRC can be trusted 1 2 3 4 5 6 7
8. MMHRC provides the service in the time promised 1 2 3 4 5 6 7
9. MMHRC keeps it records correctly 1 2 3 4 5 6 7
10.
Responsibility:-
MMHRC does not inform exactly when services will be
executed.
1 2 3 4 5 6 7
11. You do not receive immediate sevices form MHRC
employees
1 2 3 4 5 6 7
12. MMHRC employees are not always available to help
Patients
1 2 3 4 5 6 7
13. MMHRC employees are always too busy to respond 1 2 3 4 5 6 7
14.
Assurance:-
You can believe MMHRC employees 1 2 3 4 5 6 7
15. You feel secure negotiating with MMHRC employees. 1 2 3 4 5 6 7
16. MMHRC employees are polite 1 2 3 4 5 6 7
17. MMHRC employees do not obtain adequate support from 1 2 3 4 5 6 7
53

the hospitals to perform their tasks correctly.
18.
Empathy:-
MMHRC does not pay individuals attention to you. 1 2 3 4 5 6 7
19. MMHRC employees do not give personal attention to you 1 2 3 4 5 6 7
20. MMHRC employees donot know their needs 1 2 3 4 5 6 7
21. MMHRC does not have your best interest as its objective. 1 2 3 4 5 6 7
22. MMHRC does not have convenient working hours for all
patients.
1 2 3 4 5 6 7
23. MMHRC give enough treatment for their patients 1 2 3 4 5 6 7
24. The treatment of MMHRC is in good quality 1 2 3 4 5 6 7
25. Did you satisfy with the service rendered by the MMHRC?
1) □Highly satisfied 2) □Satisfied 3) □ Neither satisfied nor unsatisfied
4) □unsatisfied 5) □Highly unsatisfied
26. Your overall satisfaction in MMHRC?
1) □Highly satisfied 2) □Satisfied 3) □ Neither satisfied nor unsatisfied
4) □unsatisfied 5) □Highly unsatisfied
Thank you
Patient’s Signature
54