MS-Abrehet43/11/012
Spatial and seasonal variation in the Macro-invertebrate Community Structure and physico-chemical parameters of Enfranz River, Lake TanaSub-Basin (Ethiopia)
Abrehet Kahsay Mehari1, Ayalew Wondie2, Minwyelet Mingist1 and
Jacobus Vijverberg3*
1Fisheries, Wetlands and Wildlife Management Program, Bahir Dar
University, PO Box 79, Bahir Dar, Ethiopia2Biology Program, Bahir Dar University, PO Box 79, Bahir Dar,
Ethiopia3Department of Aquatic Ecology, Netherlands Institute of
Ecology (NIOO-KNAW), Droevendaalsesteeg 10, 6708 PB Wageningen,
The Netherlands*) Corresponding author: e-mail: [email protected]

AbstractThe macro-invertebrate community of the Enfranz River,
located northwest of Bahir Dar city in the southern part of
Lake Tana Watershed, was studied in wet and dry seasons from
August 2010 to May 2011. This river feeds Lake Tana and has a
catchment area of 198 km2. The river was sampled along its
whole length at four sites from headwaters until its outflow
in Lake Tana. The following physico-chemical parameters were
measured: temperature, dissolved oxygen, total dissolved
solids, conductivity and pH. Most physico-chemical parameters
varied significantly (P < 0.05) among sampling sites. Mean
values of dissolved oxygen concentrations at the head of the
river (6.08 mg l-1) were significantly higher (P < 0.05) than
the concentrations at the more downstream sites (3.3-5.2 mg
l-1). Macro-invertebrates were identified to the family
level; a total of 15286 individuals belonging to 30 families
were collected. The Shannon-Wiener Diversity Index and the
Hilsenhoff Family-level Biotic Index and several macro-
invertebrate community metrics for water quality assessment
were calculated. Macro-invertebrate diversity indices and
community metrics differed significantly among sampling sites
(ANOVA, P < 0.05), diversity being higher at the headwaters.
Diversity differed significantly among sampling seasons (P <
0.05); the highest values were observed in the wet season.
Pearson’s correlation coefficients showed that, dissolved
oxygen, total dissolved solids and conductivity were
II
significantly correlated with macro-invertebrate diversity
and community metrics, but pH and temperature did not show
any relationship. We conclude that the River downstream is
severely affected by land use of the local people. Mitigating
management measures are urgently needed to restore the
quality of this river.
Key words: Water quality, Water quality management, Effects
of land use, Biodiversity.
III
1. Introduction
Freshwater ecosystems have been altered by human disturbances
such as agriculture, urban development, impoundment,
channelization, mining, forest fire suppression, road
construction and species introductions (LaBonte et al., 2001). All
of which have lead to severe degradation and loss of biodiversity
(Vinson and Hawking, 1998) and as a result these ecosystems have
become the most endangered ecosystems on the planet (Dudgeon et
al., 2006). While many taxa contribute to biodiversity in
freshwater ecosystems, aquatic macro-invertebrates play a central
ecological role in many running water ecosystems (Boulton, 2003)
and are among the most ubiquitous (Voelz and McArthur, 2000) and
diverse organisms in fresh waters (Strayer, 2006). Aquatic macro-
invertebrates form an important component of the trophic
structure of freshwater ecosystems since they play an important
role in the food webs (Grubh and Mitsch, 2004; Xie et al., 2006)
and stimulate nutrient cycling by reducing the size of organic
particles (Callisto et al., 2001). They are important food items
for fish (Findlay et al., 1989) and aquatic birds (Kostecke et al.,
2005).
Macro-invertebrates are often used as biomonitoring tools
(Dallas and Mosepele, 2007). Biomonitoring is based on the
principle that organisms are the ultimate indicators of the
environment they are within (Mandaville, 2002 and U.S. EPA,
2002). Biomonitoring has the advantage above monitoring physico-
4
chemical parameters that it can detect cumulative physical,
chemical and biological impacts of adverse activities to an
aquatic system (Davis et al., 2003).
Aquatic macro-invertebrates are often preferred for
biomonitoring because of the following three reasons: Firstly,
they are not very mobile and therefore they are representative of
the area from which they are collected, secondly they have
relatively short life cycles and therefore can reflect
environmental changes quickly through changes in their community
composition and finally they respond to pollutants in both water
column and sediments (Reece and Richardson, 2000).
Despite the important roles of macro-invertebrates in
aquatic ecosystems, published information about macro-
invertebrates in Ethiopia is scarce and this is the first study
on macro-invertebrates in one of the ca. 47 rivers flowing into
Lake Tana, Ethiopia’s largest lake.
The purpose of this study on Enfranz River was three fold:
(1) To assess the spatial and seasonal variation of physico-
chemical parameters and macro-invertebrate diversity and other
community metrics over a river continuum from headwaters until
its outflow into Lake Tana, (2) to assess the spatial and
seasonal variation in water quality over this river continuum,
and (3) to conclude if water management measures are necessary to
mitigate the observed water quality.
5
2. Materials and methods
2.1. Description of study area
Enfranz River is situated northwest of Bahir Dar city and is a
source of drinking water for its people. The upper stream of the
river is rich with a number of springs. It drains to southwest of
Lake Tana and its catchment area is ca. 198 km2 (Woldegeriel G.
Kidan, 2010). The climate of the Enfranz river area is
characterized by a main-rainy season with heavy rains during
July–September, dry season during December–April, pre-rainy
season during May–June and post-rainy season during October–
November.
The riparian vegetation of the river area was studied by
Kidan (2010). He reported about 27 species of riparian vegetation
of which three species were endemic to Ethiopia (Erythrina brucei,
Mellitia ferruguina and Acanthus senni). The main water source of the
Enfranz River, besides surface water, is groundwater. From wells
drilled near the river, this water is directly, without storage,
pumped to the people in the city (Kassahun, 2008). The total
population of Bahir Dar was in 2007 ca. 220000 inhabitants and
has a population growth rate of 6.6 % per year (CSA, 2007), which
is more than twice as high as the average population growth rate
in Ethiopia.
6

2.2. Sampling
This study was conducted in wet and dry seasons of 2010-2011.
Samples for both physico-chemical and macro-invertebrates were
collected in August and October 2010 and January and May 2011
covering both the wet and the dry seasons. Four sampling sites
along the river gradient of the Enfranz River were selected and
the sites were designated as E1 to E4. Sampling sites ranged from
head waters (E1) to the mouth of the river (E4), where the water
flows into Lake Tana. The detailed description of the sampling
site is presented in (Fig. 1, Table 1).
Physico-chemical parameters
Samples for physico-chemical parameters were taken at the same
location and almost simultaneously with the samples for macro-
invertebrates. Water temperature, dissolved oxygen (DO), pH,
total dissolved solids (TDS) and conductivity were measured in situ
using electronic measure equipment.
Macro-invertebrates
Quantitative sampling was carried out based on the rapid bio-
assessment protocols that are used for rivers and wadable streams
(Barbour et al., 1999). Samples were taken using dip net with mesh
size of 500 µm. In the field, the collected material was sieved
through 500 µm and 250 µm mesh sieves and put into collection
bottles. The sampling effort at each site was 30 minutes. Then
macro-invertebrates collected from riffles and pools of each site
7
were pooled so as to obtain a single sample from each site. All
samples were preserved with 70% ethanol until laboratory analyses
and counting. All the organisms in the sample were enumerated and
identified to the lowest possible taxonomic level (family level)
using a dissecting microscope and standard keys (Edmondson,
1959; Jessup et al., 1999; Gooderham and Tysrlin, 2002 and
Bouchard, 2004).
2.4. Data Analysis
Descriptive statistics were used to analyze physico-chemical
data. For the macro-invertebrate communities two biotic indices
were calculated for each site and each sampling date. The
Shannon-Wiener Diversity Index (H′) is a diversity index that
incorporates richness and evenness. A high H′ indicates a good
water quality. H′ was calculated as follows:
:
H′ = - (P∑ i ln [Pi])
Eqn 1
Where: Pi is the relative abundance (ni/N) of species i, ni =
number of individuals in species i and N = total number of
individuals in all species. H′ is ranging from 0 for a community
with a single species, to over 7 for a very diverse community.
The Hilsenhoff Family-level Biotic Index (HFBI) is a biotic index
that is calculated by multiplying the number of individuals of
each family by an assigned tolerance value for that family.
8

Assigned tolerance values range from 0 to 10 for families and
increase as water quality decreases (Hilsenhoff, 1988; Bode et
al., 1996). This Index was calculated as follows:
HFBI = Σ [(TVi) (ni)] ⁄ N …………………………………..Eqn 2
Where: TVi is tolerance value for species i, ni is the number of
individuals in species i and N is the total number of individual
in the sample collection. High HFBI community values are an
indication of organic pollution, while low values indicate good
water quality.
Excel spreadsheets and statistical software (SPSS version 16)
were used for the statistical analysis. Two ways ANOVA was used
to evaluate differences in physico-chemical data and macro-
invertebrate metrics among the sampling sites and seasons. Macro-
invertebrate metrics were Arcsine transformed before analysis.
Data used in ANOVA analyses were first tested on homogeneity of variances. Differences among means were tested using Tukey HSD.
Pearson’s correlation coefficients were used to determine the
relationships between physico-chemical parameters and macro-
invertebrate metrics.
3. Results
3.1. Physico-chemical Parameters
9

Dissolved oxygen
The mean values of dissolved oxygen (DO) range from 3.27 mg/l at
the mouth of the river (E4) to 6.08mg/l in the head waters (E1)
(Table 2). The mean value of dissolved oxygen showed significantvariation among sampling sites (F=61.25, P=0.000), the value at
E1 being significantly higher than at the other sites. The mean
values of dissolved oxygen in wet and dry season were similar and
not significant different (F=0.044, P=0.84).
Temperature
Temperature did not differ significantly among sampling sites
(F=0.59, P= 0.62) and seasons (F=0.72, P=0.42).
Total dissolved solids
The mean value of total dissolved solids along the study sites
ranged from 82.78 ppm at E2 to 146.5 ppm at E4, while its value
in wet and dry season was 92.45 ppm and 117.9, respectively
(Table 2). The value of total dissolved solids along sampling
sites showed significant variation (F=4.55, P=0.04), the value at
E4 being significantly higher than at E1, E2 and E3. Contrary to
our expectations, differences among seasons were not significant
(F=3.70, P=0.09).
Conductivity
Mean values for conductivity ranged from 165.50 μS/cm at E2 to
246.75 μS/cm at E4 (Table 2). There was significant variation
10

among sampling sites (F=4.55, P=0.04); the value at E4 being
significantly higher than at E1, E2 and E3. Differences among
seasons were not significant (F=3.702, P=0.091).
pH
The mean value of pH was 7.1 (Table 2). Values did not differ
significantly among sampling sites (F=0.522, P=0.679) and seasons
(F=0.44, P=0.83).
3.2. Macro-invertebrates
A total of 15286 macro-invertebrate individuals belonging to 30
families were collected from 4 sites during the survey work
(Table 3). The total number of individuals present at each site
ranged from 2690 at E1 to 6473 at E4 and 6512 and 8774 during wet
and dry seasons, respectively. Libellulidae were the most
abundant family (2540 individuals), followed by Chironomidae
(1747 individuals), Belostomatidae (1135 individuals),
Coenagrionidae (1106 individuals), Culicidae (678 individuals),
then Corixidae (675 individuals).
Composition of taxa The mean proportions of ephemeropterans varied between 0.12 % and
23.59 %. The lowest value was observed at E4 and the highest
value at E1 (Table 4), differences among sampling sites were
11

significant (F = 433.09, P = 0.000). In contrast, the difference
between seasons was not significant (F = 0.72, P = 0.42).The mean poportions of trichopterans ranged from 0.00 % at
E4 and E3 to 12.59 % at E1 (Table 4), differences were
significant (F = 241.58, P = 0.000). The differences between
seasons was relatively large (Table 4) and significant (F =
17.79, P = 0.03).
The mean proportions of dipterans varied from 4.29 % at E1
to 29.77 % at E3 (Table 4), differences were significant (F =
71.44, P = 0.000). Value at E4 was significantly higher than at
E1, E2 and E3. The differences among seasons were not significant
(F = 3.22, P = 0.11).
Biotic indices
The mean values of H’ at sampling sites ranged from 2.39 at E4 to
3.02 at E2 (Table 4). The H′ value showed significant variation
among sampling sites (F = 143.08, P = 0.000); the value being
significantly higher in E2 than E1, E3 and E4. Differences amongseasons were not significant (F= 4.78, P = 0.60).,,,,
The mean values of HFBI ranged from 5.38 to 8.19.The lowest
value was at E1 and the highest value was at E4 (Table 4).
Differences among sampling sites were significant (F = 938.64, P
= 0.00). Mean values for wet and dry season were 6.86 and 7.17,
respectively (Table 4); differences were significant (F = 44.86,
P = 0.000).
12
3.3. Correlations between physico-chemical parameters and macro-
invertebrate metrics
Pearson correlation coefficients between physico-chemical
parameters and macro-invertebrate metrics are presented in Table
5. Macro-invertebrate metrics were significantly correlated to
some of the physico-chemical parameters.
Of all parameters, dissolved oxygen was the only one which
was significantly correlated with all macro-invertebrate metrics
(P < 0.05). In contrast, temperature and pH did not show any
significant correlations. Shannon-Wiener Diversity Index, percent
Ephemeroptera and percent Trichoptera were positively correlated
to dissolved oxygen, whereas HFBI and percent dipterans showed
negative correlations.
TDS (total dissolved solids) and conductivity were
negatively related to the Shannon-Wiener Diversity Index.
4. Discussion
4.1. Physico-chemical parameters
In this study, all measured physico-chemical parameters were not
significantly different between seasons. This may have been
partially caused by the sampling dates during the wet season.
August was in the main rainy season, but October was in the post-13

rainy season. During this season it was still rainy, but rain
fall and runoff with sediments was less and therefore water
quality parameters were less affected. In contrast with the non-
significant differences among seasons, differences among sampling
sites were often significant, but only for dissolved oxygen
content (DO) we observed a clear trend along the river from
headwaters until the outflow in Lake Tana. Only E1 (headwaters)
had DO levels between 6 and 9 mg l-1, which is typical for
unspoiled small tropical forest rivers (Neill et al., 2006). The
others sites showed significant reductions in DO, particularly
sites E3 and E4 had low DO values. The decline in the DO at these
sites is most probably caused by the increased organic matter
content from cattle grazing, agricultural activities and
fisheries. The pH showed very little variation among sites and
values were within the permissible range for natural waters
(USEPA, 2002).
4.2 Macro-invertebrates
The total number of taxa (30) we found in the Enfranz River was
similar to the number of taxa observed by Sitotaw (2006) for the
Ethiopian Baro River (29), but lower than the number of taxa (42-
49) in three other large Ethiopian Rivers (Blue Nile, Omo River,
Awash River). The total number of taxa observed in our study is
also low when compared with the over 50 total taxa reported for
most tropical African rivers (Victor and Ogbeiu,1985; Endokpayi14
et al., 2000; Ogbeibu, 2001; Adakole and Annue, 2003). The
relatively low number of taxa recorded in the present study could
be due to physico-chemical condition like low DO (Uwadiae, 2009)
and the relative small catchment size of the Enfranz River.
Libellulidae were the most dominant taxon. The high
densities of Libellulidae in the outflow of the river was
probably caused by the high deposition rate of fine sediment and
detritus in this area (Merrit and Cummins, 1988). Dipterans were
dominant too, most individuals belonged to the family
Chironomidae. This is a common phenomenon in both temperate and
tropical waters (Victor and Onomivbori, 1996; Ogbeibu, 2001).
Composition of macro-invertebrate taxa We observed that Ephemeroptera and Trichoptera were more abundant
in the headwater sites E1 and E2 than downstream, especially the
proportion of Baetidae (Ephemeroptera) was very high. One reason
may be that the downstream sites were dominated by agriculture
and grazing activities. It is well known that distribution of
macro-invertebrates in rivers is strongly influenced by
anthropogenic impacts (e.g., Matthaei et al., 2000). Another reason
for the reduced abundance of Ephemeroptera and Trichoptera
downstream may be the decreasing size of the particulate organic
matter (Vannote et al., 1980; Bradt et al., 1999). The relative high
abundance of Trichoptera during the wet season can probably be
explained by the increased particulate organic matter
concentrations from leaf litter inputs (Afonso et al., 2000).
15

Dipterans showed relatively high abundances in downstream
stations. Since most dipteran larvae contain hemoglobin they are
able to survive low oxygen conditions (Lake, 2003). High
abundance of dipterans indicate poor water quality (Hooper et al.,
2003). An increase in its densities in response to organic
enrichment by anthropogenic activities frequently eliminates all
other macro-invertebrates (Marques and Barbosa, 2001).
Biotic indices
Downstream stations had lower Shannon-Wiener diversity values
probably due to the presence of livestock and other anthropogenic
activities. Herbivory of aquatic vegetation and nutrient inputs
via urine and fecal deposition and trampling of sediments which
was a common phenomenon in these sites (Abrehet Kahsay Mehari
personal observations), have direct impacts on the macro-
invertebrate communities in streams (Griffith et al., 2005).
Hilsenhoff Family-level Biotic Index indicates organisms’
tolerance to low dissolved oxygen or high organic pollution. High
values are indicative of organic pollution while low values are
indicative of clean water. Average HFBI values at head water
station E1 indicated a fair water quality, but the more downward
stations all showed poorer water quality: fairly poor (E2), poor
(E3) and very poor (E4), respectively.
4.3. Correlations between physico-chemical parameters and macro-
invertebrate metrics
16

The correlation that exists between physico-chemical parameters
and the macro-invertebrates’ metrics indicate that physico-
chemical parameters regulate the distribution of the different
macro-invertebrate taxa, i.e. affect community structure. This
was also observed by Ogbogu (2001) for a stream-reservoir system
in Nigeria.
4.4 Conclusions
Land use strongly affected oxygen concentrations, macro-
invertebrate community structure and biodiversity based on the
relative abundance of the macro-invertebrate taxa. Biodiversity
indices indicated poor and very poor water quality at the down
stream stations. We conclude that the Enfranz River downstream is
severely affected by land use of the local people. Mitigating
management measures are urgently needed to restore the quality of
this river.
5. Acknowledgements
This research was carried out under the Agriculture and
Environmental Science College and Fisheries, Wetlands and
Wildlife program. We are thankful for the practical and mental
support of colleagues and friends during the course of the
research. The financial support from the Bahir Dar University and
17

Amhara regional Agricultural Research Institute (ARARI) is highly
acknowledged.
6. References
Adakole, J.A. and Annue, P.A. (2003).BenthicMacroinverteberates as indicators of Environmentalquality of an urban stream, Zaria, Northern Nigeria. J.Aquat. Sci. 18: 85-92.
Afonso, A.D.O., Henry, R., Rodella, R., and Maimoni, C. S.(2000). Allochthonous matter input in two differentstretches of a headstream. Braz. Arch. Biol. Tec. 43: 335–343.
Barbour, M. T., Gerritsen, J., Snyder, B. D., and Stribling,J. B. (1999). Rapid bio-assessment protocols for use instreams and wadeable rivers: periphyton, benthic macroinvertebrates and fish, 2nd ed. EPA 841-B-99-002. U.S.Environmental Protection Agency; Office of Water;Washington D.C.
Bode, R. W., Novak, M. A., and Abele, L. E. (1996). Qualityassurance Work plan for Biological Stream Monitoring inNew York State. NYS department of EnvironmentalConservation, Albany, NY.
Bouchard, R.W. (2004). Guide to aquatic macroinvertebrates ofthe Upper Midwest. Water C.E.M. Bicudo, T. Matsumura-Tundisi (Eds.), Limnology in Brazil. pp. 365-371.ABC/SBL. Rio de Janeiro: Graftex Comunicação Visual.
Boulton, A. J. (2003). Parallels and contrasts in the effectsof drought on stream macro-invertebrate assemblages.Freshwater Biology. 48: 1173-1185.
Bradt, P., Urban, M., Goodman, N., Bissell, S. and Spiegel, I.(1999). Stability and resilience in benthic macro-invertebrate assemblages. Hydrobiologia. 403: 123-133.
18

Callisto, M., Moreno, P., and Barbosa, F.A.R. (2001). Habitatdiversity and benthic functional trophic groups at SerraDo Cipo, Southeast Brazi. Rev. Brasil. Biol. 61: 259-266.
CSA. (2007). Statistical Abstract 2007. Central Statistical Agency,Addis Ababa.
Dallas, H. F., and Mosepele, B. (20007). A Preliminary Surveyand Analysis of the Spatial Distribution of AquaticInvertebrates in the Okavango Delta. African journal of aquaticscience. 32: 1-11.
Davis, S., Vellids, G., and Pringle, C. M. (2003). Macroinvertebrates Biomonitoring in Interminant Coastal PlainStreams Impacted by Animal Agriculture, Journal ofEnvironmental Quality. 32:1036-1043.
Dudgeon, D., Arthington, A. H., Gessner, M. O., Kawabata, Z.,Knowler, D. J., Leveque, C., Naiman, R. J., Prieur-Richard, A., Soto, D., Stiassny, M. L. J., andSullivan, C.A. (2006). Freshwater Biodiversity:importance threats, status and conservation challenges.Biological Reviews. 81:163-182.
Edmondson, W. T. (1959). Fresh water biology. 2nd ed. JohnWiley and Sons Inc. New York, USA.
Edokpayi C.A., Okenyi, J.C., Ogbeibu, A.E. and Osimen, E.C.(2000). The effect of Human activities on themacrobenthic Invertebrates of Ibiekuma stream, Ekpoma,Nigeria. Biosc. Res. Comm.. 12: 79-87.
Findlay, S., Schoeberl, K., and Wagner, B. (1989).Abundance,Composition, and Dynamics of the Invertebrate Fauna of aTidal Freshwater Wetland. Journal of the North AmericanBenthological Society, 8: 140-148.
Gooderham, J. and Tysrlin, E. (2002). The water bug book. Aguide to the freshwater macro-invertebrates of temperateAustralia. Csiro publishing.
19

Griffith, M. B., Hill, B., Mccormick, H., Kaufmann, R.,Herlihy, T., Selle, A. R. (2005). Comparative applicationof indices of biotic integrity based on periphyton,macro-invertebrates, and fish to southern Rocky Mountainstreams. Journal of ecology and natural environment, 5: 117- 136.
Grubh, A. R., and Mitsch, W. J. (2004). Distribution andabundance of macro-invertebrates in created wetlandecosystems. 2003 Annual report (Olentangy River WetlandResearch Park).
Hilsenoff, W. L. (1988). Rapid field assessment of organicpollution with a family-level biotic index. Journal of theNorth American Benthological Society, 7: 65-68.
Hooper, H. L., Sibly, R. M., Hutchinson, T. M., and Maund, S.J. (2003). The in uence of larval density, foodflavailability and habitat longevity on the life historyand population growth rate of the midge Chironomusriparius. Oikos, 102: 515–524.
Jessup, B. K., Markowitz, A., and Stribling, J. B. (1999).Family-level key to the stream invertebrates of Marylandand surrounding areas. Maryland department of naturalresources Chesapeake Bay and watershed program resourceassessment service monitoring and non-tidal assessmentdivision CBWP-MANTA-EA-99-2.
Kassahun, G. (2008). Physico-chemical and BacteriologicalDrinking Water Quality Assessment of Bahir Dar town watersupply from source to yard connection (NorthWesternEthiopia). M.Sc Thesis, Addis Ababa University, AddisAbaba.
Kidan, W.G. (2009).Biodiversity assessment/Majorvegetation/and land use impacts of Enfranz Riverinewetland in Lake Tana watershed, Northern BahirDar,Ethiopia. MSc thesis, School of Graduate Studies, BahirDar University.
20

Kostecke, M. R., Smith, M. L., and Hands, M. H. (2005). Macro-invertebrate Responses to Cattail Management at CheyenneBottoms. Wetlands journal, 23: 758-763.
LaBonte, J. R., Scott, D. W., McIver, J. D., and Hayes, J. L.(2001).Threatened, endangered and sensitive insects inEastern Oregon and Washington forests and adjacent lands.Northwest Science, 75:185-198.
Lake, P. S. (2003). Ecological effects of perturbation bydrought in owing waters. fl Freshwater Biology, 48: 1161-1172.
Mandaville, S. M. 2002. Benthic macro-invertebrates infreshwaters-taxa tolerance values, metrics, andprotocols. Project H-1. Soil and Water conservationsociety of metro Halifax.Environmental protection agency:Office of research and development, Washington D.C.
Marques, M. M., and Barbosa, F. (2001). Biological quality ofwaters from an impacted tropical watershed (middle RioDoce basin, southeast Brazil), using benthic macro-invertebrate communities as an indicator. Hydrobiologia,457: 69–76.
Matthaei, C. D., Arbuckle, C. J., Townsend, C .R. (2000).Stable surface as refugia for invertebrates duringdisturbance in a New Zealand stream. Journal of North AmericanBenthological societies, 19: 82-93.
Merritt, R. W., and Cummins, K. W. (1988). An introduction tothe aquatic insects of North America. Kendall, Hunt Pub.Co., Dubuque, Iowa, 722p.
Neill, C., Deegan, L. A., Thomas, S. M., Haupert, C. L.,Krusche, A. V., Ballester, V. M., and Victoria, R .L.(2006). Deforestation alters the hydraulic andbiogeochemical characteristics of small lowland Amazonianstreams: Hydrological Processes, 20: 2563-2580.
21

Ogbeibu, A. E. (2001). Distribution, density, and diversity ofdipterans in a temporary pond in Okomu forest reserve,southern Nigeria. Nigeria Journal of Aquatic Sciences, 16: 43-52.
Ogbogu, S. S. (2001) .Assessment of water quality and macroinvertebrates’ abundance in Opa-stream Reservoir system,Ile-Ife. Journal of Pure Applied Sciences, 17: 517-521.
Pielou, E. C. (1966). An introduction to mathematical ecology.Wiley, New York.
Reece, F.P., and Richardson, S.J. (2000).Biomonitoring withthe Reference Condition Approach for the Detection ofAquatic Ecosystems at Risk. Proceedings of a conferenceon the Biology and Management of species and habitats atrisk.
Sitotaw, B. (2006). Assessment of Benthic-Macro-invertebratestructures in relation to environmental degradation insome Ethiopian rivers. Biological Reviews, 81: 163-182.
Strayer, D. L. (2006). Challenges for freshwater invertebrateconservation. Journal of the North American Benthological Society,25:271–287.
USEPA (2002). Summary of biological assessment programs andbio-criteria development for states, tribes, territories,and interstate commissions: Streams and wadeable rivers.EPA 822-R-02-048. Washington, D.C.: U.S. Environmentalprotection agency, office of environmental informationand office of water.
Uwadiae, R. E. (2009). An ecological study on the macrobenthicinvertebrate community of Epe lagoon, Lagos. PhD. ThesisUniversity of Lagos, Akoka, Lagos. 253 p.
Vannote, R. L., Minshall, G. W., Cummins, K. W., Sedell, J.R., and Cushing, C. E. (1980). The River ContinuumConcept. Canadian Journal of Fisheries and Aquatic Sciences, 37: 130-137.
22

Victor, R., and Onomivbori, O. (1996). The effects of urbanperturbation on the benthic macro-invertebrates of asouthern Nigeria stream. In: SPB Academic PublishingAmsterdam, the Netherlands. 223-238pp.
Victor, R and Ogbeibu, A.E. (1985). Macrobenthic invertebratesof a stream flowing through farmland in Southern Nigeria.Environmental Pollution series A. 39:333-347.
Vinson, M. R., and Hawkins, C. P. (1998). Biodiversity ofstream insects: variation at local, basin and regionalscale s. Annual Review of Entomology 43:271-193.Northwest Science.Voelz, N.J., and Mcarthur, J.V. 2000.An exploration of factors influencing lotic insectspecies richness. Biodiversity and Conservation, 9,1543–1570.
Voelz, N.J., and Mcarthur, J.V (2000). An exploration offactors influencing lotic insect species richness.Biodiversity and Conservation, 9, 1543–1570.Wallace, J.B., Grubaugh, J. W., and Whiles, M. R. (1996). Bioticindices and stream ecosystem processes: Results from anexperimental study. Ecological Applications, 6: 140-151.
Xie, Z., Tang, T., Ma, k., Liu, R., Qu, X., Chen, J., and Ca,I. (2006). Effect of plant Architecture on the structureof Epiphytic macro-invertebrates in a Chinese Lake.Journal of fresh water ecology, 21:132-137.
23

Table 1. Description of sampling sites in the Enfranz River (see
also Figure 1).
Site
Name
Coordinates Altitude Descriptions
E1 11.600659N
37.279893E
1833 Head of the river, sides covered
with patchy grasses and few
shrubs. More than 10 springs join
here to create the river.
E2 11.622792N
37.289684E
1805 River sides surrounded by
riparian vegetation.
E3 11.639711N
37.299492E
1791 River sides surrounded by big
trees. Used by local people to
cultivate crops and for washing
and bathing site.
E4 11.647443N
37.310901E
1789 Mouth of the river. Agriculture,
cattle grazing and fisheries
dominate.
24

Table 2. Mean (± SE) values of physico-chemical parameters per site and season along the Enfranz River (2010-2011). SE = Standard error.
ParametersDO (mg
l-1)
Temp
(oC)
TDS (ppm) Cond
(μS/cm)
pH
Sampling sitesE1 6.08±0.14
a
20.33±0.6
2a
94.75±15.77ab 207.18±9.09
ab
7.12±0.
02aE2 5.16±0.07
b
21.12±0.9
7a82.78±10.51bc
165.50±21.0
4bc
7.16±0.
03aE3 4.19±0.12
c
19.17±0.5
0a96.70±3.05ac
192.03±7.46
ac
7.16±0.
01aE4 3.27±0.23
d
21.88±0.2
5a
146.50±
20.04a
246.75±17.8
1a
7.14±0.
01a
Sampling seasonWet 4.66±.45
a
19.98±.66
a92.45±11.41a
192.04±16.26
a
7.14±.
03aDry 4.69a±.3
9a
21.26±.36
a117.91±12.62a
213.69±11.89
a
7.15±.
01a
25

Table 3. Total number of collected macro-invertebrates per familyat each sampling site and per season in the Enfranz River (2010-2011).
FamilyTolerance value
Sampling sites and seasons E1 E2 E3 E4 Wet Dry Total
Ephemeroptera
Baetidae 5 329 243 66 0 305 327 632
Caenidae 6 205 106 63 7 171 210 381
Heptageniidae 4 76 0 0 0 28 48 76
Potomanthidae 3 25 0 0 0 7 18 25
TrichopteraHydropsychidae 4 166 101 0 0 152 115 267Hydroptilidae 4 55 0 0 0 33 22 55Philoptotamidae 3 34 0 0 0 29 5 34Phryganeidae 4 67 0 0 0 52 15 67Rhyacophilidae - 10 0 0 0 9 1 10OdonataAeshnidae 3 83 49 0 0 88 44 132Coenagrionidae 9 12 77 381 636 426 686 1106Libellulidae 9 17 60 503 1960 888 1652 2540Calopterygidae 5 26 0 0 0 6 20 26HemipteraBelostomatidae 9 150 288 124 573 451 684 1135Corixidae 8 57 122 211 285 271 404 675Gerridae 6 189 350 47 64 276 374 650Naucoridae 8 81 102 57 0 107 133 240Nepidae 7 74 133 55 0 104 158 262Notonectidae 9 43 65 143 319 229 341 570Pleidae 8 0 69 57 78 96 108 204Veliidae 7 63 113 66 61 127 176 303ColeopteraDytiscidae 5 121 85 0 0 77 129 206Elmidae 4 295 84 78 0 216 241 457Gyrinidae 4 227 87 80 123 285 232 517Haliplidae 5 67 65 65 58 123 132 255Hydrophilidae 5 70 71 53 66 124 136 260Dipterans Ceratopogonidae 6 25 116 175 345 289 372 661Chironomidae 8 66 255 595 831 743 1004 1747Culicidae 8 28 21 198 431 255 423 678MolluscsPhysidae 8 0 71 0 180 135 116 251Planorbidae 7 0 0 69 180 95
4154 249
Lymnaeidae 6 0 9 0 0 5 9Sphaeriidae 8 0 37 0 0 37 37 37Arachnida Pisauridae 8 0 63 71 146 114 166 280
26
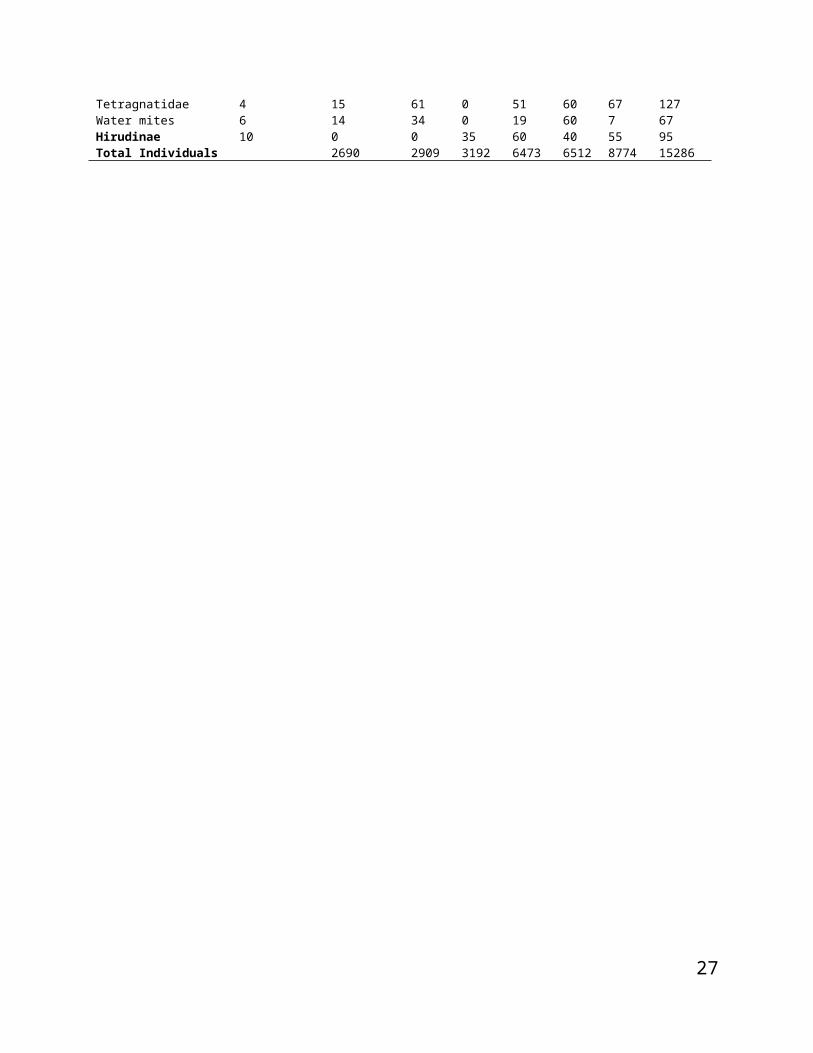
Tetragnatidae 4 15 61 0 51 60 67 127Water mites 6 14 34 0 19 60 7 67Hirudinae 10 0 0 35 60 40 55 95Total Individuals 2690 2909 3192 6473 6512 8774 15286
27

Table 4. Mean + 1 SE of macro-invertebrate metrics per site and season in the Enfranz River (2010-2011). H′ = Shannon-Wiener Diversity Index, HFBI = Hilsenhoff Family-level Biotic Index. Different letters within the same column show significant differences (P <0.05). SE = Standard error.
28
H′ HFBI % Ephem %
Trichop
%
Dipterans
E1 2.97±.03
3a
5.38±.14
a
23.59±.4
6a
12.59±2.
8a4.29±1.58a
E2 3.02±.03
1a
6.61±.11
b
11.92±.5
8b
3.60±0.5
b
13.24±1.44
b
E3 2.70±.02
6b
7.78±.03
c
3.84±.24
c
0.00±0.0
c
29.77±1.15
c
E4 2.39±.06
5c
8.19±.08
d
0.12±.12
d
0.00±0.0
c
25.57±2.16
c
Wet 2.80±.08
a
6.86±.44
a
9.84±3.3
9a
5.39±2.6
8a
17.59±4.40
a
Dry 2.74±.11
a
7.13±.39
b
9.89±3.4
3a
2.70±1.2
9b
18.85±3.44
a

Table 5. Pearson’s correlation coefficients between physico-chemical parameters and macro-invertebrate metrics. H′ = Shannon-Wiener Diversity Index, HFBI = Hilsenhoff Family-level Biotic Index.
Metrics Physico-chemical parameters
R P-value
Dissolved oxygen 0.824
0.00
H′
Temperature -0.203
0.452
TDS -0.672
0.004
Conductivity -0.636
0.008
pH -0.008
0.975
HFBI
Dissolved oxygen -0.944
0.000
Temperature 0.067
0.804
TDS 0.507
0.045
Conductivity 0.338
0.201
pH 0.294
0.269
Dissolved oxygen 0.94
0.000
29

8Temperature -
0.065
0.811
%Ephem
TDS -0.441
0.087
Conductivity -0.252
0.346
pH -0.295
0.267
Dissolved oxygen 0.814
0.000
Temperature -0.006
0.982
% Trichop
TDS -0.415
0.110
Conductivity -0.187
0.488
pH -0.384
0.143
Dissolved oxygen -0.868
0.000
Temperature -0.104
0.701
% Dipterans
TDS 0.378
0.149
Conductivity 0.27
0.309
30
1pH
0.284
0.287
31
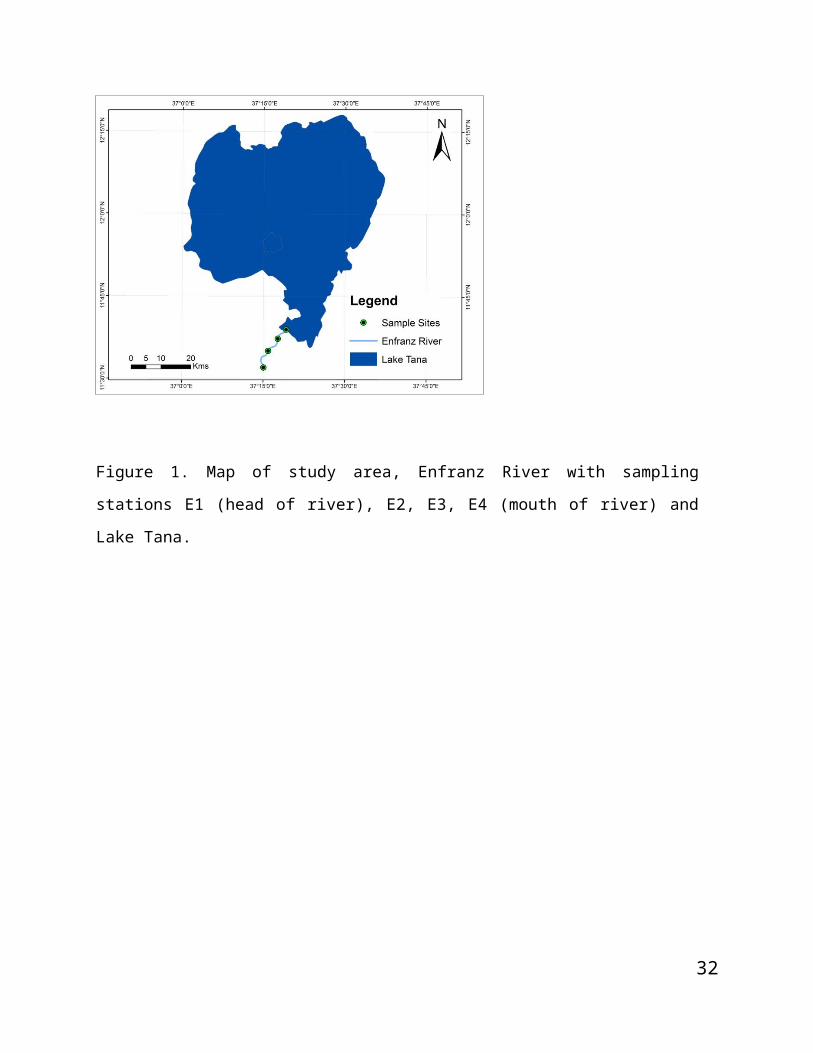
Figure 1. Map of study area, Enfranz River with sampling
stations E1 (head of river), E2, E3, E4 (mouth of river) and
Lake Tana.
32