Solar Resource Mapping Republic of Zambia
Supporting Strategic Planning and Commercial Development by Investing in Global Public Goods
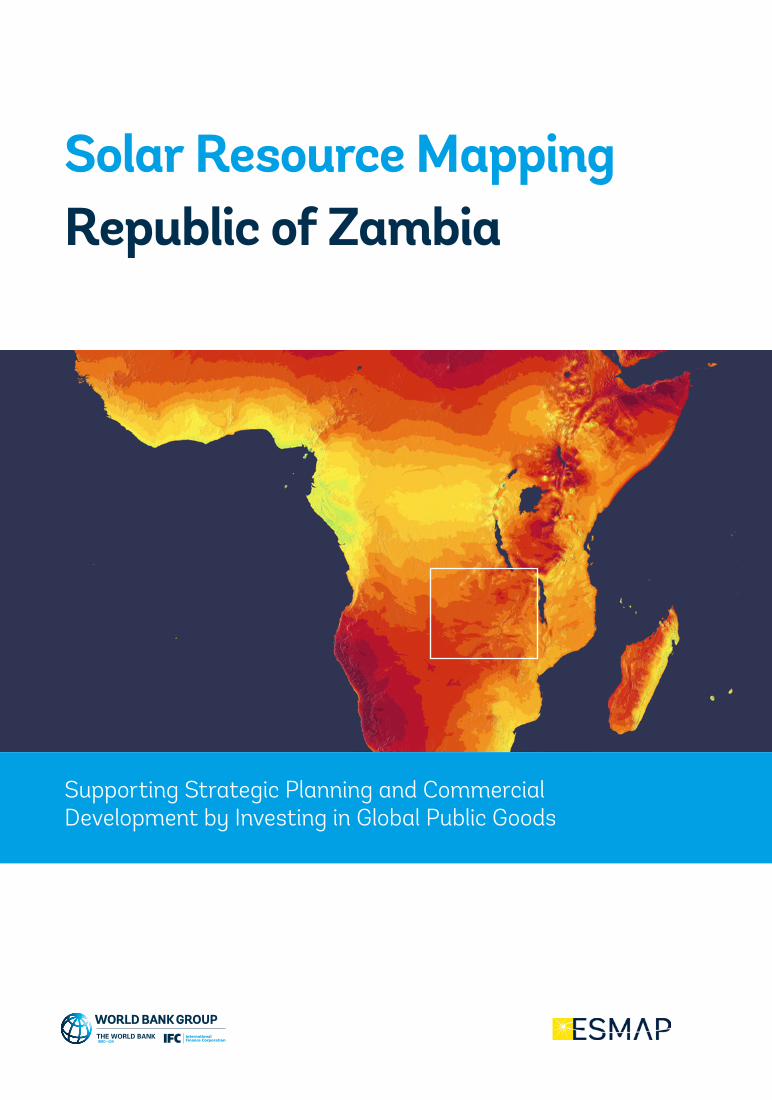
Preliminary modelling and planning of Phase 2: Project inception and stakeholder
engagement; preparation of initial solar resource and meteorological data
calculated by satellite-based and meteorological models; preliminary validation
using ground-based data available in a wider region; preparation of Phase 2.
Ground-based data collection for two years: Implementation of a ground-
based measurement campaign using high quality instruments, with regular
data transmission and reporting, for the purpose of validating and improving
the solar models that are used for generating reliable high-resolution solar and
meteorological data for any site in Zambia.
Production of validated solar resource atlas: Preparation of validated solar resource
data and maps. The report Solar Atlas of Zambia describes the methodology and the
findings of the project.
Phase 1 / 2014Interim resource assessment based on satellite-data analysis and global datasets
Phase 2 / 2015-2017Solar measurement campaign to validate and improve interim resource assessment
Phase 3 / 2018-2019Publication of validated resource atlas and accompanying datasets
Project Scope and Methods
Solargis data vs ground measurements
Project Timeline
Fully equipped station during the installation campaign
Cross-comparison of the modeled and ground-measured DNI data: 1-minute and 15-minute aggregations (Lusaka, 24 months)
Pyranometer Kipp & Zonen CMP 10
Example of the quality control of the measured data (Lusaka, GHI, CMP, Jan — Dec 2017)
Knowledge exchange
passed physical limit low visual check partial sun below horizon

Global Horizontal Irradiation
Daily totals:
Yearly totals:
5.0
1826
5.2
1899
5.4
1972
5.6
2045
5.8
2118
kWh/m²
Global horizontal irradiation (GHI) represents
a total amount of shortwave radiation received by
a horizontal surface. It is considered as a solar resource
reference and enables comparing individual sites or
regions. It is the most important parameter for energy
yield calculation and performance assessment of
flat-plate photovoltaic (PV) technologies.
Mis
amfu
Lusa
ka
Moc
hipa
pa
2
4
Overview of GH I at six solar meteorological stations
Interannual variability Long-term monthly averages
Comparison of long-term average of daily totals: original and regionally-adapted values
Map of GHI long-term average (period 1994-2017)
3
Mou
nt M
akul
u
5
Long
e
1
Mut
anda
6
50 km
Original Adapted Difference2
[kWh/m ]2
[kWh/m ] [%]
Mochipapa 5.834 5.528 -5.3
Mount Makulu 5.766 5.432 -5.8
Mutanda 5.845 5.451 -6.7
Solar meteorological stationOriginal Adapted Difference
2[kWh/m ] 2[kWh/m ] [%]
Longe 5.988 5.665 -5.4
Lusaka 5.785 5.489 -5.1
Misamfu 5.927 5.541 -6.5
Solar meteorological station

Direct Normal IrradiationDirect normal irradiation (DNI) is the amount of solar
radiation from the direction of the sun. It is the most
important parameter for energy yield calculation and
performance assessment of concentrating solar power
and concentrating solar photovoltaic technologies.
DNI is also important for the calculation of global
irradiation received by tilted or sun-tracking
photovoltaic modules.
Mis
amfu
Lusa
ka
Moc
hipa
pa
2
4
Overview of DNI at six solar meteorological stations
Interannual variability Long-term monthly averages
Comparison of long-term average of daily totals: original and regionally-adapted values
Map of DNI long-term average (period 1994-2017)
3
Daily totals:
Yearly totals:
4.2
1534
4.6
1680
5.0
1826
5.4
1972
5.8
2118
kWh/m²
Mou
nt M
akul
u
5
Long
e
1
Mut
anda
6
50 km
Original Adapted Difference2
[kWh/m ]2
[kWh/m ] [%]
Longe 5.739 5.415 -5.6
Lusaka 5.503 5.120 -7.0
Misamfu 5.243 4.747 -9.5
Solar meteorological stationOriginal Adapted Difference
2[kWh/m ]
2[kWh/m ] [%]
Mochipapa 5.771 5.350 -7.3
Mount Makulu 5.489 5.062 -7.8
Mutanda 5.191 4.780 -7.9
Solar meteorological station
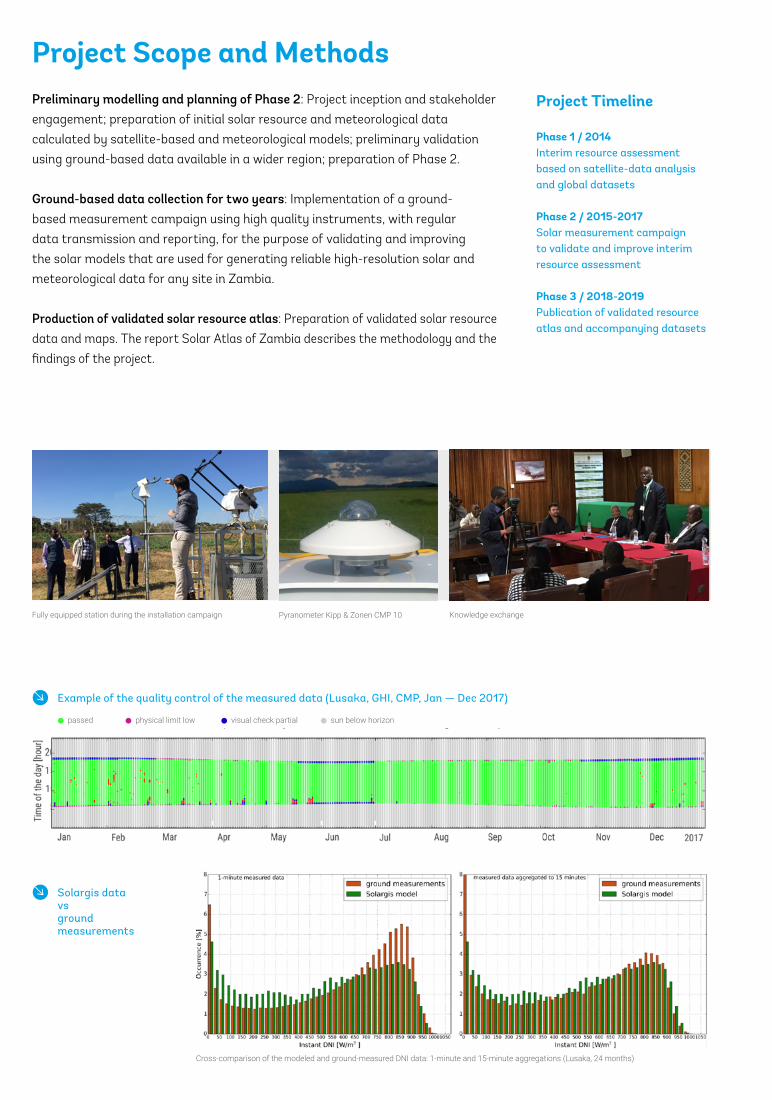
ResultsThe data measured at six solar meteorological stations contributed substantially to understanding of solar resource availability and variability in Zambia. The measurements also helped to improve accuracy of the solar model in the region. Now, the model can produce more accurate solar and meteorological data for any location.The overall uncertainty of yearly values for most of the territory of Zambia has been reduced to ±4% (up to ±6% in complex geographical conditions) for global horizontal irradiation (GHI), and to ±5% (up to ±10% in complex geographical conditions) for direct normal irradiation (DNI), respectively. Complete set of measurements is publicly available for download.
For each site, collocated with the solar meteorological station, a set of historical time series representing a period of 1994 to2017 is calculated by the accuracy-enhanced models. The model data outputs include also TMY for P50 and P90 probabilities of exceedance. The procedures and results are documented in the consultancy reports and have been supported by workshops.
Map data sources: Solar resource database © 2019 Solargis • Administrative boundaries © 2016 Cartography Unit, GSDPM, World Bank Group • Map data © 2016 OpenStreetMap.org contributors • GeoNames.org • Shuttle Radar Topography Mission, version 2 © 2000–2006 SRTM Mission Team • Cartography © 2018 Solargis • Solargis database version: 2.1 • Map issue date: 2019-04-03. Copyright © 2019 Solargis. Disclaimer: Considering the nature of climate fluctuations, interannual and long-term changes, as well as the uncertainty of measurements and applied methods, Solargis does not take any responsibility whatsoever, and does not give any warranty on the accuracy of the data that were used to produce this publication. Solargis has done its utmost to assess climate conditions based on the best available data, software, and knowledge. It is recommended that this publication be used as a guideline rather than an instrument for building the solar power systems. All rights reserved. No part of this publication may be reproduced, stored in a retrieval system or transmitted in any form or by any means without the prior written permission of the copyright owner.
Zambezi river at sunset, Mana Pools National Park, Zambia (acknowledgement to Craig-Chipperfield)
The overall national electrification rate in Zambia is currently about 31 percent with urban access rate at about 67 percent, and rural access rate at just 4 percent. At present, Zambia has ca 2,800 MW of installed electricity generation capacity, of which 85% is hydro based.
The Zambian energy sector is endowed with enormous renewable resources including solar energy. Solar resource is ideally suited for mini-grid and off-grid applications in rural areas and remote settlements where rolling grids would impose high costs and supply would be unreliable due to the high technical losses of long-distance transmission systems. The vast majority of power in Zambia is operated by ZESCO, the state-owned utility.
The World Bank’s Energy Sector Management Assistance Program (ESMAP) has been working with the Government of Zambia since 2013 to improve the assessment and mapping of solar and wind resource potential. The ESMAP-funded solar measurement campaign has provided critical data to help firm up solar resource estimates by private developers.
With the help of the World Bank Group’s (WBG) Scaling Solar initiative, the country has managed to expand its renewable energy efforts, with approximately 100 MW of solar competitively awarded to IPPs. The solar measurements were accessed and used by the winning developers on the two first round projects under Scaling Solar in Zambia.
Technical reports, online data access and more informationesmap.org/re_mapping_zambiaglobalsolaratlas.info/downloads/zambiaenergydata.info
About
This leaflet presents results from the World Bank’s
Solar Resource Mapping project in Zambia. The project
is funded by the Energy Sector Management Assistance
Program (ESMAP), under a global initiative in support of
renewable energy resource assessment and mapping,
administered by the World Bank and supported by
donors. The Solar Resource Mapping project in Zambia
has been developed in a close coordination with the
Ministry of Energy (MoE) of Zambia, the World Bank’s
primary country counterpart for this project.
Under the project, a solar and meteorological
measurement campaign was carried out on six
meteorological sites for a period of two years with the
aim of reducing the uncertainty and improving the
accuracy of solar resource models in Zambia.
The data and maps with improved accuracy can be used
for knowledge-based decision making for solar energy
investments in Zambia.
The results are uploaded into the Global Solar Atlas.
World Bank GroupThe World Bank Group is one of the world’s largest sources of funding and knowledge for developing countries. Its five institutions share a commitment to reducing poverty, increasing shared prosperity, and promoting sustainable development.
ESMAPESMAP is a partnership between the World Bank Group and its 18 partners to help low and middle income countries reduce poverty and boost growth, through environmentally sustainable energy solutions.
MAIN CONTRACTOR Solargis s.r.o.Mytna 48, 81107 [email protected]
SUBCONTRACTORGeoSUN AfricaUnit 1, CS Africa Building, 1 Meson Street, Techno ParkStellenbosch, 7600South Africa
Solar Resource Mapping
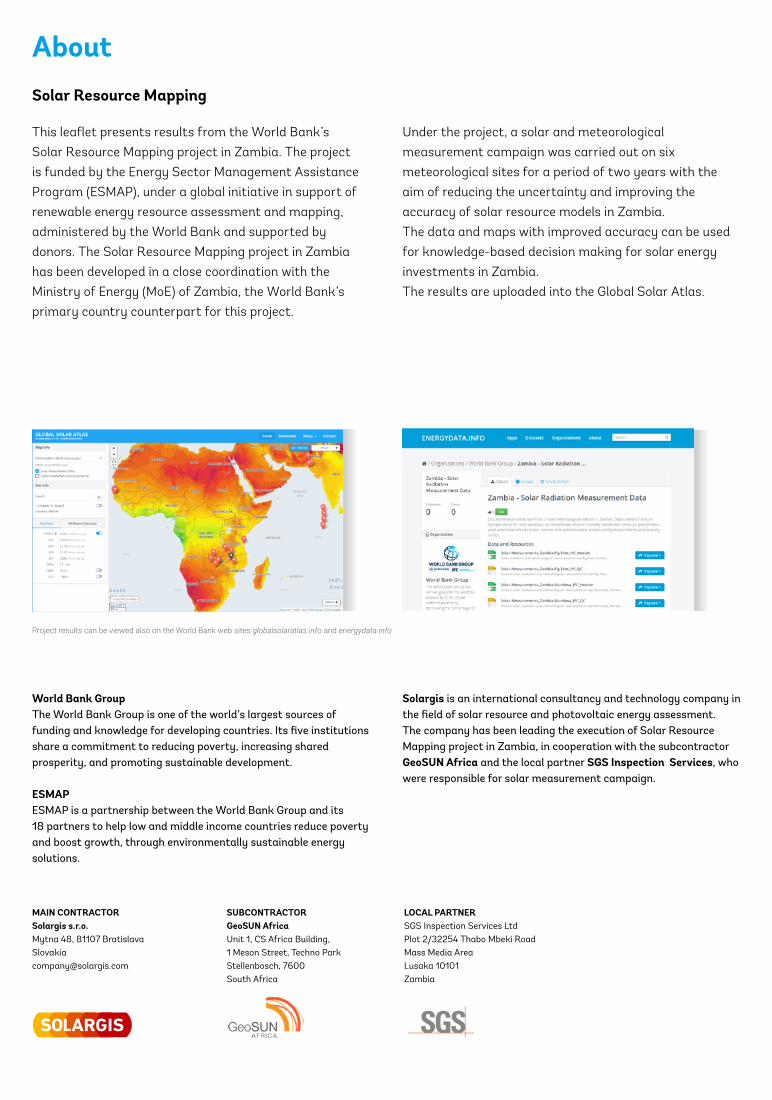
Project results can be viewed also on the World Bank web sites globalsolaratlas.info and energydata.info
LOCAL PARTNER SGS Inspection Services Ltd Plot 2/32254 Thabo Mbeki Road Mass Media AreaLusaka 10101Zambia
Solargis is an international consultancy and technology company in the field of solar resource and photovoltaic energy assessment. The company has been leading the execution of Solar Resource Mapping project in Zambia, in cooperation with the subcontractor GeoSUN Africa and the local partner SGS Inspection Services, who were responsible for solar measurement campaign.