SOLAR RESOURCE AND PV POTENTIAL OF ZAMBIA SOLAR RESOURCE ATLAS April 2019 Public Disclosure Authorized Public Disclosure Authorized Public Disclosure Authorized Public Disclosure Authorized

Welcome message from author
This document is posted to help you gain knowledge. Please leave a comment to let me know what you think about it! Share it to your friends and learn new things together.
Transcript
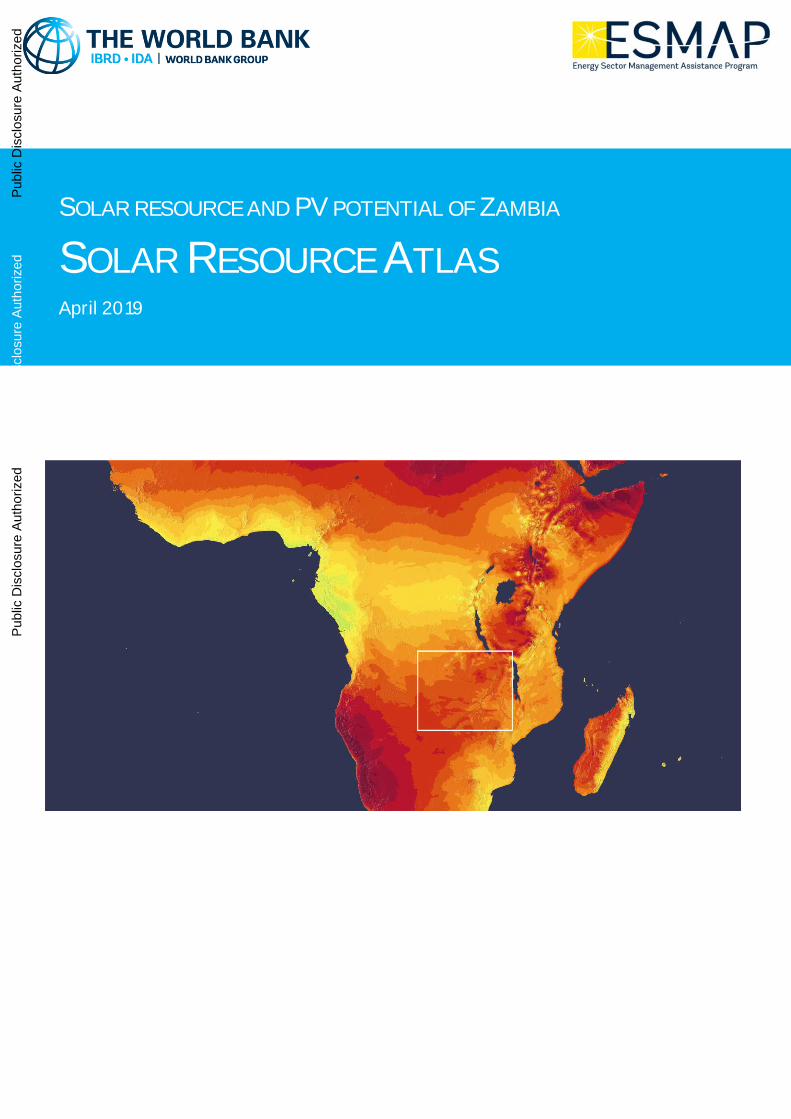
SOLAR RESOURCE AND PV POTENTIAL OF ZAMBIA
SOLAR RESOURCE ATLAS April 2019
Pub
lic D
iscl
osur
e A
utho
rized
Pub
lic D
iscl
osur
e A
utho
rized
Pub
lic D
iscl
osur
e A
utho
rized
Pub
lic D
iscl
osur
e A
utho
rized

This report was prepared by Solargis, under contract to the World Bank.
Capacity Building for Renewable Energy Resource Mapping and Grid Integration in Zambia [Project ID: P145271]. This activity is funded and supported by the Energy Sector Management Assistance Program (ESMAP), a multi-donor trust fund administered by the World Bank, under a global initiative on Renewable Energy Resource Mapping. Further details on the initiative can be obtained from the ESMAP website.
The content of this document is the sole responsibility of the consultant authors. Any improved or validated solar resource data will be incorporated into the Global Solar Atlas.
Copyright © 2019 THE WORLD BANK Washington DC 20433 Telephone: +1-202-473-1000 Internet: www.worldbank.org
The World Bank does not guarantee the accuracy of the data included in this work and accept no responsibility for any consequence of their use. The boundaries, colors, denominations, and other information shown on any map in this work do not imply any judgment on the part of the World Bank concerning the legal status of any territory or the endorsement or acceptance of such boundaries.
Rights and Permissions
The material in this work is subject to copyright. Because the World Bank encourages dissemination of its knowledge, this work may be reproduced, in whole or in part, for non-commercial purposes as long as full attribution to this work is given. Any queries on rights and licenses, including subsidiary rights, should be addressed to World Bank Publications, World Bank Group, 1818 H Street NW, Washington, DC 20433, USA; fax: +1-202-522-2625; e-mail: [email protected]. Furthermore, the ESMAP Program Manager would appreciate receiving a copy of the publication that uses this publication for its source sent in care of the address above, or to [email protected].
All images remain the sole property of their source and may not be used for any purpose without written permission from the source.
Attribution
Please cite the work as follows: World Bank. 2019. Solar resource and PV potential of Zambia: Solar Resource Atlas. Washington, DC: World Bank.
Solar Resource Atlas Based on regional adaptation of Solargis model
Republic of Zambia
Reference No. 128-09/2019
Customer Consultant
World Bank
Energy Sector Management Assistance Program
Contact: Mr. Tigran Parvanyan
1818 H St NW, Washington DC, 20433, USA
Phone: +1-202-473-3159
E-mail: mailto: [email protected]
http://www.esmap.org/RE_Mapping
Solargis s.r.o.
Contact: Mr. Marcel Suri
Mytna 48, 811 07 Bratislava, Slovakia
Phone +421 2 4319 1708
E-mail: [email protected]
https://solargis.com
Solar Resource Atlas
Based on regional adaptation of Solargis model
Solargis reference No. 128-09/2019
© 2019 Solargis page 4 of 76
Table of contents
Table of contents .............................................................................................................................................. 4
Acronyms ......................................................................................................................................................... 5
Glossary ........................................................................................................................................................... 7
Executive summary ........................................................................................................................................... 9
1 Introduction ............................................................................................................................................. 10
1.1 Past and on-going solar resource assessment initiatives ........................................................................ 10
1.2 Evaluation of the existing data and studies .............................................................................................. 12
1.3 Structure of this study ................................................................................................................................ 13
2 Methods and data ..................................................................................................................................... 14
2.1 Solar resource data .................................................................................................................................... 14
2.2 Meteorological data .................................................................................................................................... 23
2.3 Simulation of solar photovoltaic potential ................................................................................................ 25
2.4 Outline of solar concentrating technologies ............................................................................................. 29
3 Solar resource and PV potential of Zambia ............................................................................................... 31
3.1 Geography ................................................................................................................................................... 31
3.2 Air temperature ........................................................................................................................................... 39
3.3 Global Horizontal Irradiation ...................................................................................................................... 43
3.4 Direct Normal Irradiation ............................................................................................................................ 49
3.5 Global Tilted Irradiation .............................................................................................................................. 53
3.6 Photovoltaic power potential ..................................................................................................................... 58
3.7 Evaluation .................................................................................................................................................... 63
4 Data delivered for Zambia ......................................................................................................................... 64
4.1 Spatial data products ................................................................................................................................. 64
4.2 Project in QGIS format ................................................................................................................................ 68
4.3 Map images ................................................................................................................................................ 68
5 List of maps ............................................................................................................................................. 70
6 List of figures ........................................................................................................................................... 71
7 List of tables ............................................................................................................................................ 72
8 References ............................................................................................................................................... 73
Support information ........................................................................................................................................ 75
Solar Resource Atlas
Based on regional adaptation of Solargis model
Solargis reference No. 128-09/2019
© 2019 Solargis page 5 of 76
Acronyms
AC Alternating current
AERONET The AERONET (AErosol RObotic NETwork) is a ground-based remote sensing network
dedicated to measuring atmospheric aerosol properties. It provides a long-term database of
aerosol optical, microphysical and radiative parameters.
AOD Aerosol Optical Depth at 670 nm. This is one of atmospheric parameters derived from MACC
database and used in Solargis. It has a notable impact on the accuracy of solar calculations
in arid zones.
CFSR Climate Forecast System Reanalysis. The meteorological model operated by the US service
NOAA.
CFSv2 The Climate Forecast System Version 2. CFSv2 meteorological models operated by the US
service NOAA (Operational extension of Climate Forecast System Reanalysis, CFSR).
CPV Concentrated Photovoltaic systems, which uses optics such as lenses or curved mirrors to
concentrate a large amount of sunlight onto a small area of photovoltaic cells to generate
electricity.
CSP Concentrated solar power systems, which use mirrors or lenses to concentrate a large
amount of sunlight onto a small area, where it is converted to heat for a heat engine
connected to an electrical power generator.
DC Direct current
DIF Diffuse Horizontal Irradiation, if integrated solar energy is assumed. Diffuse Horizontal
Irradiance, if solar power values are discussed.
DNI Direct Normal Irradiation, if integrated solar energy is assumed. Direct Normal Irradiance, if
solar power values are discussed.
ECMWF European Centre for Medium-Range Weather Forecasts is independent intergovernmental
organisation supported by 34 states, which provide operational medium- and extended-range
forecasts and a computing facility for scientific research.
ESMAP Energy Sector Management Assistance Program, a multi-donor trust fund administered by
the World Bank
EUMETSAT European Organisation for the Exploitation of Meteorological Satellites, an intergovernmental
organisation for establishing, maintaining and exploiting European systems of operational
meteorological satellites
GFS Global Forecast System. The meteorological model operated by the US service NOAA.
GHI Global Horizontal Irradiation, if integrated solar energy is assumed. Global Horizontal
Irradiance, if solar power values are discussed.
GIS Geographical Information System
GTI Global Tilted (in-plane) Irradiation, if integrated solar energy is assumed. Global Tilted
Irradiance, if solar power values are discussed.
KSI Kolmogorov–Smirnov Index, a statistical index for comparing functions or samples
Solar Resource Atlas
Based on regional adaptation of Solargis model
Solargis reference No. 128-09/2019
© 2019 Solargis page 6 of 76
MACC Monitoring Atmospheric Composition and Climate – meteorological model operated by the
European service ECMWF (European Centre for Medium-Range Weather Forecasts)
Meteosat MFG
and MSG
Meteosat satellite operated by EUMETSAT organization. MSG: Meteosat Second Generation;
MFG: Meteosat First Generation
MERRA Modern-Era Retrospective Analysis for Research and Applications, a NASA reanalysis for the
satellite era using an Earth observing systems
MERRA-2 Modern-Era Retrospective analysis for Research and Applications, Version 2
NASA National Aeronautics and Space Administration organization
NOAA NCEP National Oceanic and Atmospheric Administration, National Centre for Environmental
Prediction
NOAA ISD NOAA Integrated Surface Database with meteorological data measured by ground-based
measurement stations
NOCT The Nominal Operating Cell Temperature, is defined as the temperature reached by open
circuited cells in a module under the defined conditions: Irradiance on cell surface
= 800 W/m2, Air Temperature = 20°C, Wind Velocity = 1 m/s and mounted with open back
side.
PV Photovoltaic
PVOUT Photovoltaic electricity output calculated from solar resource and air temperature time
series.
RSR Rotating Shadowband Radiometer
SOLIS Solar Irradiance Scheme, Solar clear-sky model for converting meteorological satellite
images into radiation data
SRTM Shuttle Radar Topography Mission, a service collecting topographic data of Earth's land
surfaces
STC Standard Test Conditions, used for module performance rating to ensure the same
measurement conditions: irradiance of 1,000 W/m², solar spectrum of AM 1.5 and module
temperature at 25°C.
TEMP Air Temperature at 2 metres
UV Ultraviolet radiation
Solar Resource Atlas
Based on regional adaptation of Solargis model
Solargis reference No. 128-09/2019
© 2019 Solargis page 7 of 76
Glossary
AC power output
of a PV power plant
Power output measured at the distribution grid at a connection point.
Aerosols Small solid or liquid particles suspended in air, for example desert sand or soil
particles, sea salts, burning biomass, pollen, industrial and traffic pollution.
All-sky irradiance The amount of solar radiation reaching the Earth's surface is mainly determined by
Earth-Sun geometry (the position of a point on the Earth's surface relative to the Sun
which is determined by latitude, the time of year and the time of day) and the
atmospheric conditions (the level of cloud cover and the optical transparency of
atmosphere). All-sky irradiance is computed with all factors taken into account
Bias Represents systematic deviation (over- or underestimation) and it is determined by
systematic or seasonal issues in cloud identification algorithms, coarse resolution
and regional imperfections of atmospheric data (aerosols, water vapour), terrain,
sun position, satellite viewing angle, microclimate effects, high mountains, etc.
Clear-sky irradiance The clear sky irradiance is calculated similarly to all-sky irradiance but without
considering the impact of cloud cover.
Fixed-mounted modules Photovoltaic modules assembled on fixed bearing structure in a defined tilt to the
horizontal plane and oriented in fixed azimuth.
Frequency of data
(30-minute, hourly, daily,
monthly, yearly)
Period of aggregation of solar data that can be obtained from the Solargis database.
Installed DC capacity Total sum of nominal power (label values) of all modules installed on photovoltaic
power plant.
Long-term average Average value of selected parameter (GHI, DNI, etc.) based on multiyear historical
time series. Long-term averages provide a basic overview of solar resource
availability and its seasonal variability.
P50 value Best estimate or median value represents 50% probability of exceedance. For annual
and monthly solar irradiation summaries it is close to average, since multiyear
distribution of solar radiation resembles normal distribution.
P90 value Conservative estimate, assuming 90% probability of exceedance (with a 90%
probability the value should be exceeded). When assuming normal distribution, the
P90 value is also a lower boundary of the 80% probability of occurrence. P90 value
can be calculated by subtracting uncertainty from the P50 value. In this report we
apply a simplified assumption of normal distribution of yearly values.
PV electricity production AC power output of a PV power plant expressed as percentage part of installed DC
capacity.
Root Mean Square
Deviation (RMSD)
Represents spread of deviations given by random discrepancies between measured
and modelled data and is calculated according to this formula:
𝑅𝑀𝑆𝐷 = √∑ (𝑋𝑘𝑚𝑒𝑎𝑠𝑢𝑟𝑒𝑑 − 𝑋𝑚𝑜𝑑𝑒𝑙𝑒𝑑𝑘 )
2𝑛𝑘=1
𝑛
On the modelling side, this could be low accuracy of cloud estimate (e.g.
intermediate clouds), under/over estimation of atmospheric input data, terrain,
Solar Resource Atlas
Based on regional adaptation of Solargis model
Solargis reference No. 128-09/2019
© 2019 Solargis page 8 of 76
microclimate and other effects, which are not captured by the model. Part of this
discrepancy is natural - a satellite monitors a large area (of approx. 3 x 4 km), while
a sensor sees only a micro area of approx. 1 sq. centimetre. On the measurement
side, the discrepancy may be determined by accuracy/quality and errors of the
instrument, pollution of the detector, misalignment, data loggers, insufficient quality
control, etc.
Solar irradiance Solar power (instantaneous energy) falling on a unit area per unit time [W/m2]. Solar
resource or solar radiation is used when considering both irradiance and irradiation.
Solar irradiation Amount of solar energy falling on a unit area over a stated time interval [Wh/m2 or
kWh/m2].
Spatial grid resolution In digital cartography the term applies to the minimum size of the grid cell or in
other words, minimum size of the pixels in the digital map.
Solar Resource Atlas
Based on regional adaptation of Solargis model
Solargis reference No. 128-09/2019
© 2019 Solargis page 9 of 76
Executive summary
This report presents results of the solar resource assessment and mapping activity undertaken by The World Bank
in Zambia, as a part of a broader technical assistance project covering biomass, solar and wind mapping funded by
the Energy Sector Management Assistance Program (ESMAP).
The data used in this report is based on the Solargis model. The uncertainty of the solar resource data has been
reduced by the regional model adaptation based on the ground measurements collected at six solar meteorological
stations across Zambia, commissioned by The World Bank during the years 2015 to 2017 under the same activity.
The ground-based solar resource measurements have been supplied by GeoSUN Africa, based in South Africa. The
measurement campaign has been technically supported by SGS Inspection Services, Zambia.
The report has two objectives:
• To explain the methodologies and outcomes of the solar resource and photovoltaic power potential
assessment, based on the combined use of models and measured data. The report documents the uncertainty
of solar and meteorological data, as key inputs in the technical and financial evaluation of solar energy systems.
• To improve the awareness and knowledge of resources for solar energy technologies by producing a
comprehensive countrywide dataset and maps based on the accuracy-enhanced models. The report evaluates
key solar climate features, and the geographic and time variability of solar power potential in the country.
The results of this report compare to interim solar resource validation at the beginning of the project, which were
based on the Solargis model, validated by the ground measurements available in a wider region (ESMAP Solar
Resource Mapping for Zambia, Interim Solar Modelling Report, 128-01/2014, November 2014). The uncertainty
estimates in this report have been found as too optimistic. The validation of the model based on 24 months of
measurements conducted at six solar meteorological stations revealed higher uncertainty of originally used Solargis
model.
The uncertainty of the Solargis model yearly estimates for yearly values of DNI, has been reduced from the original
assumptions, made in 2014, for the original model ±9.0% to the range of ±5% and ±7% for the regionally adapted
model. For yearly GHI, the uncertainty was reduced from ±6.5% for original model to the range of ±4% and ±5% for
the regionally adapted model. These figures represent a majority of the country’s territory with flat and monotonous
terrain. In specific conditions with complex terrain we expect a higher model uncertainty. The key achievement of
this project is supplying country-wide data and maps, based on the extensive validation of the solar model by high
accuracy solar measurements acquired in Zambia.
The data underlying this report are delivered in two formats:
• Raster GIS data for the whole territory of the Republic of Zambia, representing long-term monthly and yearly
average values. This data layers are accompanied by geographical data layers in raster and vector data formats.
• High-resolution digital maps prepared for poster printing, as well as Google Earth maps.
The maps show that, throughout most of Zambia, yearly sum of global horizontal irradiation is in the range of 1900
to 2100 kWh/m2. This translates to a specific yearly PV electricity output in the range of 1550 kWh/kWp to more
than 1700 kWh/kWp. The seasonal variability is smaller, compared to other countries further away from the equator.
This qualifies Zambia as a country with high potential for PV power generation.
The aggregated data for Zambia can be accessed online via an interactive map-based application, or as
downloadable files and maps at http://globalsolaratlas.info/. The ground-measured data is accessible through
https://energydata.info/.
Solar Resource Atlas
Based on regional adaptation of Solargis model
Solargis reference No. 128-09/2019
© 2019 Solargis page 10 of 76
1 Introduction
Solar electricity offers a unique opportunity to achieve long-term sustainability goals, such as the development of a
modern economy, healthy and educated society, clean environment, and improved geopolitical stability. Solar power
plants exploit local solar resources; they do not require heavy support infrastructure, they are scalable, and improve
electricity services. A key feature of solar electricity is that it is accessible in remote locations, thus providing
development opportunities anywhere.
While solar resources are fuel to solar power plants, the local geographical and climate conditions determine the
efficiency of their operation. Free fuel makes solar technology attractive; however, effective investment and technical
decisions require detailed, accurate and validated solar and meteorological data. Accurate data are also needed for
the cost-effective operation of solar power plant. High quality solar resource and meteorological data can be
obtained by satellite-based meteorological models and by measuring instruments installed at meteorological
stations.
1.1 Past and on-going solar resource assessment initiatives
Several solar resource assessment initiatives are documented below as publications and online data resources. The
works show steadily growing interest and different stages of development of solar resource assessment and energy
modelling in the region. Below we compare a selection of solar databases.
NASA Power, NASA
Monthly and yearly averages are available from the NASA Power project [1]. The data and documentation are
updated in 2018. Specific parameters are available at higher time resolution (e.g. daily). The data includes
numerous atmospheric and solar radiation parameters, the solar data represents a period from 1983 to 2005,
resolution of approx. 55 km. Data is not validated for the region and it can be accessed from
https://power.larc.nasa.gov/.
Photovoltaic Geographical Information System (PVGIS), European Commission JRC
Geographical Assessment of Solar Resource and Performance of Photovoltaic Technology. The online tools are
accessible from http://re.jrc.ec.europa.eu/pvgis.html. The database is based on Meteosat satellite data
calculation and offers solar resource long-term averages as well as hourly data.
PVGIS HelioClim-1 is an older version of PVGIS based on HelioClim-1 product by Ecole des Mines, Paris, that
makes use of interpolation of clear-sky index derived from low resolution Meteosat MFG satellite images and
terrain shading. The PVGIS Helioclim-1 database has been validated at only very limited number of ground stations
in Africa and the outputs are of lower accuracy [2].
PVGIS CM-SAF is more modern and more accurate version of satellite database which makes use of Meteosat
MSG satellite images. CM-SAF data is primarily offered at hourly resolution, the accuracy is better, compared to
HelioClim 1. Yet the data has also limited validation in Africa and no validation in this region. The most recent
update of the project has been made in 2017 [3].
HelioClim Project, Ecole des Mines Paris (Mines ParisTech), ARMINES, Transvalor
Solar Resource Atlas
Based on regional adaptation of Solargis model
Solargis reference No. 128-09/2019
© 2019 Solargis page 11 of 76
Online solar radiation satellite-derived database is available for free on http://www.soda-pro.com/web-
services/radiation/helioclim-1. This database is one of first attempts in Europe to provide satellite-based solar
radiation database covering Europe and Africa. HelioClim 1 uses reduced dataset of Meteosat Prime MFG satellite
images, with temporal resolution from 3 hours and the cloud index is calculated via Heliosat-2 method. With the
coverage period from 1985 to 2005, it represents daily values of solar radiations with a coarse resolution: 20 to 30km
[4]. The group developed and operates a commercial version of HelioClim-3 database, which also covers the territory
of Meteosat Prime satellite. More information at http://www.soda-is.com.
CAMS - JADE, European Union’s Earth observation programme
CAMS (Copernicus Atmosphere Monitoring Service) solar radiation services provide detailed assessment of optical
variables in the atmosphere. Developed and operated by ARMINES,/MINES ParisTech/TRANSVALOR and
implemented by ECMWF (European centre for Medium-range Weather Forecasts) as part of the Copernicus
programme, https://atmosphere.copernicus.eu/, it covers Europe, Africa and adjacent territories between ±66°
latitude and longitude and it processes Meteosat satellites (MFG and MSG) images with Heliosat-4 method to create
the dataset of solar radiation components with JADE being the specific CAMS radiation service dataset over Africa
[5]. CAMS solar radiations services are validated at BSRN network of ground stations, but without a reference station
in the wide region of South-eastern Africa. The service is still in the phase of accuracy improvements.
Meteonorm, Meteotest
Meteonorm, https://meteonorm.com/en/ is a global meteorological database of ground stations around the world,
with a support from satellite-based solar radiation for Europe and Africa available from CM-SAF data service. The
measurements are used to interpolate the specific conditions from nearby stations for the site of interest and to
calculate synthetic hourly data for one artificial year. This approach provides data with limited accuracy and use,
and there are little prospects for meeting the needs of development and operation of commercial PV power plants.
The accuracy of calculation database depends the density of good-quality solar meteo stations. In Africa however,
the availability of high-quality solar meteorological stations (based on the use of high-accuracy sensors and good
maintenance) is very limited, with only a handful sites available in the region of Central/Southeast Africa. Moreover,
the micro-climate conditions of a specific site would be completely overlooked by spatial interpolation, which may
result in large errors in the calculation output. Synthetic hourly data cannot be validated by high resolution ground
measurements [6].
Other projects
The list above is not exhaustive as there are some other projects, historical and on-going, in various stages of
development, also offering solar radiation data, for example:
• SOLEMI by DLR (Germany); https://wdc.dlr.de/data_products/SERVICES/SOLARENERGY/description.php
• Solar database by 3E (Belgium); https://solardata.3e.eu/
• Solar database by Reuniwatt (France); https://reuniwatt.com/
Global Solar Atlas, World Bank Group
The World Bank Group have provided the Global Solar Atlas to support the scale-up of solar power in their client
countries. This work is funded by the Energy Sector Management Assistance Program (ESMAP), a multi-donor trust
fund administered by The World Bank. The Atlas has been prepared by Solargis under a contract to The World Bank.
The primary aim is to provide quick and easy access to solar resource data and maps globally [7, 8]. The project is
ongoing, and a substantial update is planned for year 2019; https://globalsolaratlas.info.
Solar Resource Atlas
Based on regional adaptation of Solargis model
Solargis reference No. 128-09/2019
© 2019 Solargis page 12 of 76
Renewable Energy Resource Mapping for Zambia, World Bank (ESMAP)
This report refers to the outcomes achieved within this project, closed in 2019. A set of data and reports for Zambia
has been prepared by Solargis and its subcontractor GeoSUN Africa, working on this project until the present. Three
areas were addressed, in consecutive phases:
• Preliminary modelling that has been conducted by Solargis
• Installation, operation and data acquisition for six ground-based solar meteorological stations by GeoSUN
Africa, South Africa supported by SGS Inspection Services, Zambia. All the measured data is accessible via
the portal https://energydata.info/
• This report refers to final Phase 3 of the project, and it accompanies the delivery of the final outputs based
on the combination of the modelled and the measured data. Solargis provides the final mapping outputs
for Zambia. All outputs are accessible from https://globalsolaratlas.info.
1.2 Evaluation of the existing data and studies
Zambia has considerable though diverse potential for solar power generation. Many of the solar and meteorological
data sets, listed in Chapter 1.1, do not fulfil the requirements for accuracy, reliability and features needed for
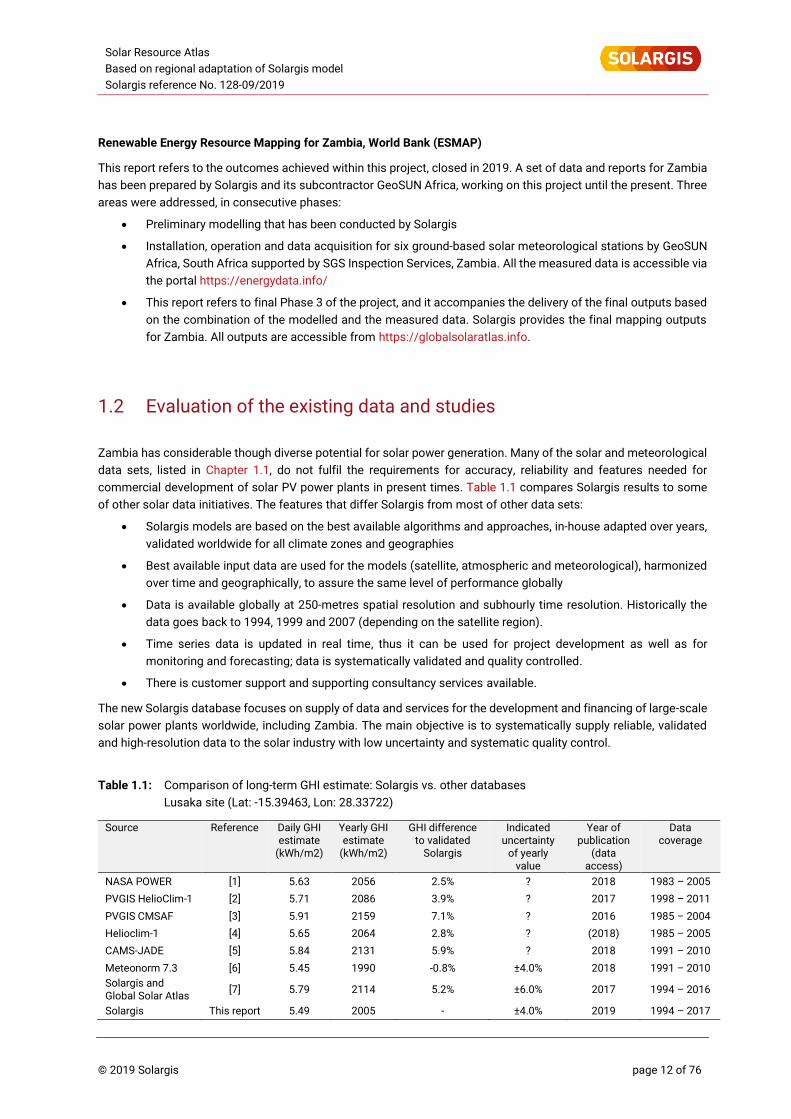
commercial development of solar PV power plants in present times. Table 1.1 compares Solargis results to some
of other solar data initiatives. The features that differ Solargis from most of other data sets:
• Solargis models are based on the best available algorithms and approaches, in-house adapted over years,
validated worldwide for all climate zones and geographies
• Best available input data are used for the models (satellite, atmospheric and meteorological), harmonized
over time and geographically, to assure the same level of performance globally
• Data is available globally at 250-metres spatial resolution and subhourly time resolution. Historically the
data goes back to 1994, 1999 and 2007 (depending on the satellite region).
• Time series data is updated in real time, thus it can be used for project development as well as for
monitoring and forecasting; data is systematically validated and quality controlled.
• There is customer support and supporting consultancy services available.
The new Solargis database focuses on supply of data and services for the development and financing of large-scale
solar power plants worldwide, including Zambia. The main objective is to systematically supply reliable, validated
and high-resolution data to the solar industry with low uncertainty and systematic quality control.
Table 1.1: Comparison of long-term GHI estimate: Solargis vs. other databases
Lusaka site (Lat: -15.39463, Lon: 28.33722)
Source Reference Daily GHI estimate
(kWh/m2)
Yearly GHI estimate
(kWh/m2)
GHI difference to validated
Solargis
Indicated uncertainty
of yearly value
Year of publication
(data access)
Data coverage
NASA POWER [1] 5.63 2056 2.5% ? 2018 1983 – 2005
PVGIS HelioClim-1 [2] 5.71 2086 3.9% ? 2017 1998 – 2011
PVGIS CMSAF [3] 5.91 2159 7.1% ? 2016 1985 – 2004
Helioclim-1 [4] 5.65 2064 2.8% ? (2018) 1985 – 2005
CAMS-JADE [5] 5.84 2131 5.9% ? 2018 1991 – 2010
Meteonorm 7.3 [6] 5.45 1990 -0.8% ±4.0% 2018 1991 – 2010
Solargis and Global Solar Atlas
[7] 5.79 2114 5.2% ±6.0% 2017 1994 – 2016
Solargis This report 5.49 2005 - ±4.0% 2019 1994 – 2017
Solar Resource Atlas
Based on regional adaptation of Solargis model
Solargis reference No. 128-09/2019
© 2019 Solargis page 13 of 76
(regionally adapted)
The solar industry requires models that offer map-based data covering extensive territories at a high level of a detail
using historical and real time data. Modern solar measuring stations are used for accuracy enhancement of such
models and to gain a better understanding of the local climate. Thus, a combination of the model data with modern
solar and meteorological measurements is used to support solar energy development in all stages of its lifecycle.
High accuracy solar resource and meteorological data is needed for the development and operation of commercial
solar power plants. Typically, detailed data describing the local climate is needed for a location of interest; however,
high accuracy meteorological measurements for sites of interest are rarely available. Therefore, data from solar and
meteorological models are initially used to evaluate the energy yield and assess the performance of the power
plants. When the location for commercial project development is selected, a solar meteorological station is installed
in the second step. The high accuracy meteorological equipment is used to collect local data for an initial period of
at least one year. Such measurements are then used for the site adaptation of solar models and for delivering high
accuracy solar resource and meteorological time series that covers a long historical period. At larger power plants,
solar measurements are collected continuously over the lifetime of the project.
The solar and meteorological data is used for the following tasks related to solar power generation:
1. Country-level evaluation and strategical assessment
2. Prospection; selection of candidate sites for future power plants, and prefeasibility analysis
3. Project evaluation; solar and energy yield assessment, technical design and financing
4. Monitoring and performance assessment of solar power plants and forecasting of solar power
5. Quality control of solar measurements.
This report addresses the first topic from the list above.
1.3 Structure of this study
Following an introduction to the activity (Chapter 1), Chapter 2 of this Solar Resource Atlas provides an outline of
solar radiation basics and principles of photovoltaic power potential calculation. Chapters 2.1 and 2.2 describe
measuring and modelling approaches for developing reliable solar and meteorological data, including information
about solar and meteorological data uncertainty. These chapters document the role of solar measurements in
reducing the uncertainty of solar, meteorological and PV power potential data for the country. Chapter 2.3 and 2.4
explain the relevance of solar resource and meteorological information for the deployment of solar power
technologies. An emphasis is given to photovoltaic (PV) technology, which has high potential for developing utility-
scale projects close to larger load centres, as well as deployment of rooftop PV systems, off-grid, hybrid systems
and mini-grids for community electrification.
Chapter 3 presents an analysis and evaluation of meteorological and solar resource data in Zambia. Six
representative sites are selected to show potential regional differences in Zambia through tables and graphs.
Chapter 3.1 introduces ancillary geographical data that influence the performance of solar power plants. Chapter
3.2 to 3.5 summarizes geographical differences and seasonal variability of the solar resource in Zambia, while
Chapter 3.6 presents the PV power generation potential of the country. The theoretical specific PV electricity output
is calculated from the most commonly used PV technology: a fixed system with crystalline-silicon (c-Si) PV modules,
optimally tilted and oriented towards the Equator. Chapter 3.7 summarizes the analytical information and presents
conclusions. Chapter 4 summarizes the technical features of the delivered data products. Chapters 5 to 8 provide
support information.
Solar Resource Atlas
Based on regional adaptation of Solargis model
Solargis reference No. 128-09/2019
© 2019 Solargis page 14 of 76
2 Methods and data
2.1 Solar resource data
2.1.1 Introduction
Solar resource (physical term solar radiation) is fuel to solar energy systems. The solar radiation available for solar
energy systems at the ground level depends on processes in the atmosphere. This leads to a high spatial and
temporal variability at the Earth’s surface. The interactions of extra-terrestrial solar radiation with the Earth’s
atmosphere, surface and objects are divided into three groups:
1. Solar geometry, trajectory around the sun and Earth's rotation (declination, latitude, solar angle)
2. Atmospheric attenuation (scattering and absorption) by:
2.1 Atmospheric gases (air molecules, ozone, NO2, CO2 and O2)
2.2 Solid and liquid particles (aerosols) and water vapour
2.3 Clouds (condensed water or ice crystals)
3. Topography (elevation, surface inclination and orientation, horizon)
4. Shadows, reflections from surface or local obstacles (trees, buildings, etc.) and re-diffusion by atmosphere.
The atmosphere attenuates solar radiation selectively: some wavelengths are associated with high attenuation (e.g.
UV) and others with a good transmission. Solar radiation called "short wavelength" (in practice, 300 to 4000 nm) is
of primary interest to solar power technology and is used as a reference. The component that is neither reflected
nor scattered, and which directly reaches the surface, is called direct radiation; this is the component that produces
shadows. The component scattered by the atmosphere that also reaches the ground is called diffuse radiation. A
small portion of the radiation reflected by the surface that reaches an inclined plane is called the reflected radiation.
These three components together create global radiation. A proportion of individual component at any time is given
by Sun position and by the actual state of atmosphere – mainly the occurrence of clouds, air pollution and humidity.
According to the generally adopted terminology, in solar radiation two terms are distinguished:
• Solar irradiance indicates power (instant energy) per second incident on a surface of 1 m2 (unit: W/ m2).
• Solar irradiation, expressed in MJ/ m2 or Wh/m2; it indicates the amount of incident solar energy per unit
area during a lapse of time (hour, day, month, etc.).
Often, the term irradiance is used by the authors of numerous publications in both cases, which can sometimes
cause confusion.
In solar energy applications, the following three solar resources are relevant:
• Direct Normal Irradiation/Irradiance (DNI): it is the direct solar radiation from the solar disk and the region
closest to the sun (circumsolar disk of 5° centred on the sun). DNI is the component that is important to
concentrating solar collectors used in Concentrating Solar Power (CSP) and high-performance cells in
Concentrating Photovoltaic (CPV) technologies.
• Global Horizontal Irradiation/Irradiance (GHI): sum of direct and diffuse radiation received on a horizontal
plane. GHI is a reference radiation for the comparison of climatic zones; it is also the essential parameter
for calculation of radiation on a flat plate collector.
• Global Tilted Irradiation/Irradiance (GTI) or total radiation received on a surface with defined tilt and
azimuth, fixed or sun-tracking. This is the sum of the scattered radiation, direct and reflected. A term Plane
of Array (POA) irradiation//irradiance is also used. In the case of photovoltaic (PV) applications, GTI can
Solar Resource Atlas
Based on regional adaptation of Solargis model
Solargis reference No. 128-09/2019
© 2019 Solargis page 15 of 76
occasionally be affected by shading from the surrounding terrain or objects, and GTI is then composed only
from diffuse and reflected components. This typically occurs for sun at low angles over the horizon.
Solar radiation data can be acquired by two complementary approaches:
1. Ground-mounted sensors are good in providing high frequency and accurate data (for well-maintained, high
accuracy measuring equipment) for a specific location.
2. Satellite-based models provide data with a lower frequency of measurement, but cover a long history over
lager areas. Satellite-models are not capable of producing instantaneous values at the same accuracy as
ground sensors, but can provide robust aggregated values.
Chapter 2 summarizes approaches applied for measuring and computing solar resource parameters, for Zambia,
and the main sources of uncertainty. It also discusses methods for combining data acquired by these two
complementary approaches with the aim of maximizing strengths of both approaches.
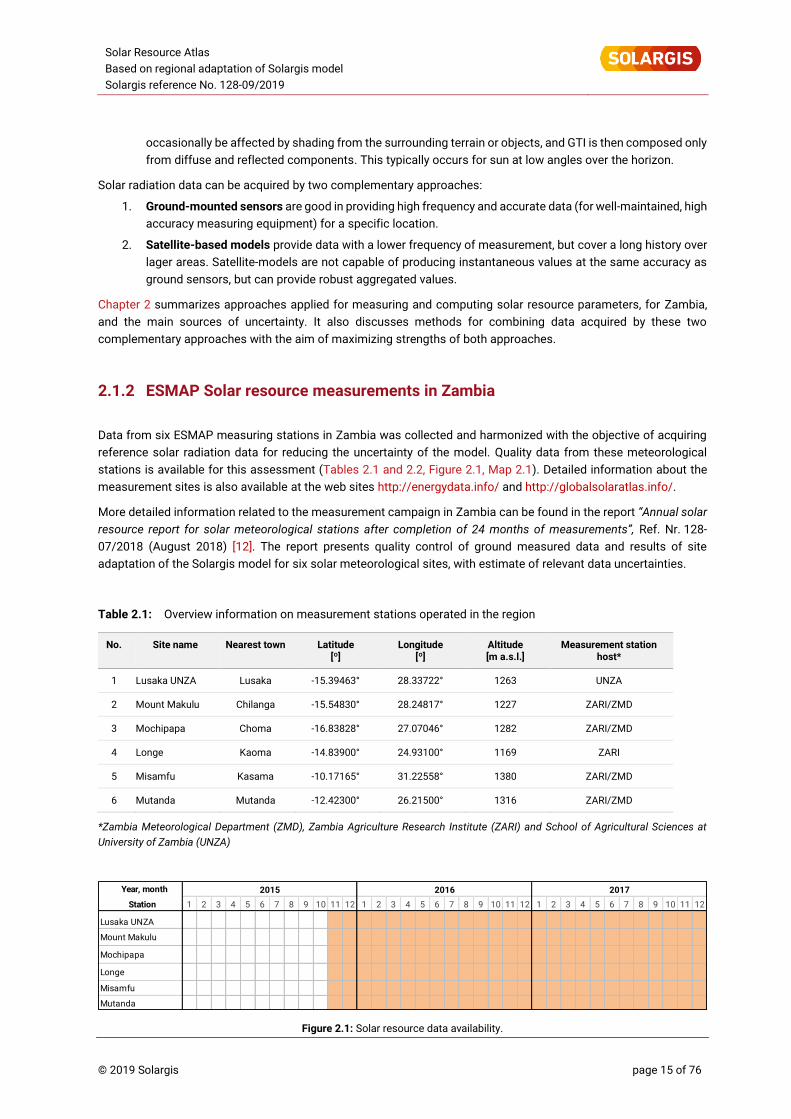
2.1.2 ESMAP Solar resource measurements in Zambia
Data from six ESMAP measuring stations in Zambia was collected and harmonized with the objective of acquiring
reference solar radiation data for reducing the uncertainty of the model. Quality data from these meteorological
stations is available for this assessment (Tables 2.1 and 2.2, Figure 2.1, Map 2.1). Detailed information about the
measurement sites is also available at the web sites http://energydata.info/ and http://globalsolaratlas.info/.
More detailed information related to the measurement campaign in Zambia can be found in the report “Annual solar
resource report for solar meteorological stations after completion of 24 months of measurements”, Ref. Nr. 128-
07/2018 (August 2018) [12]. The report presents quality control of ground measured data and results of site
adaptation of the Solargis model for six solar meteorological sites, with estimate of relevant data uncertainties.
Table 2.1: Overview information on measurement stations operated in the region
No. Site name Nearest town Latitude [º]
Longitude [º]
Altitude [m a.s.l.]
Measurement station host*
1 Lusaka UNZA Lusaka -15.39463° 28.33722° 1263 UNZA
2 Mount Makulu Chilanga -15.54830° 28.24817° 1227 ZARI/ZMD
3 Mochipapa Choma -16.83828° 27.07046° 1282 ZARI/ZMD
4 Longe Kaoma -14.83900° 24.93100° 1169 ZARI
5 Misamfu Kasama -10.17165° 31.22558° 1380 ZARI/ZMD
6 Mutanda Mutanda -12.42300° 26.21500° 1316 ZARI/ZMD
*Zambia Meteorological Department (ZMD), Zambia Agriculture Research Institute (ZARI) and School of Agricultural Sciences at
University of Zambia (UNZA)
Figure 2.1: Solar resource data availability.
Year, month
Station 1 2 3 4 5 6 7 8 9 10 11 12 1 2 3 4 5 6 7 8 9 10 11 12 1 2 3 4 5 6 7 8 9 10 11 12
Lusaka UNZA
Mount Makulu
Mochipapa
Longe
Misamfu
Mutanda
2015 2016 2017
Solar Resource Atlas
Based on regional adaptation of Solargis model
Solargis reference No. 128-09/2019
© 2019 Solargis page 16 of 76
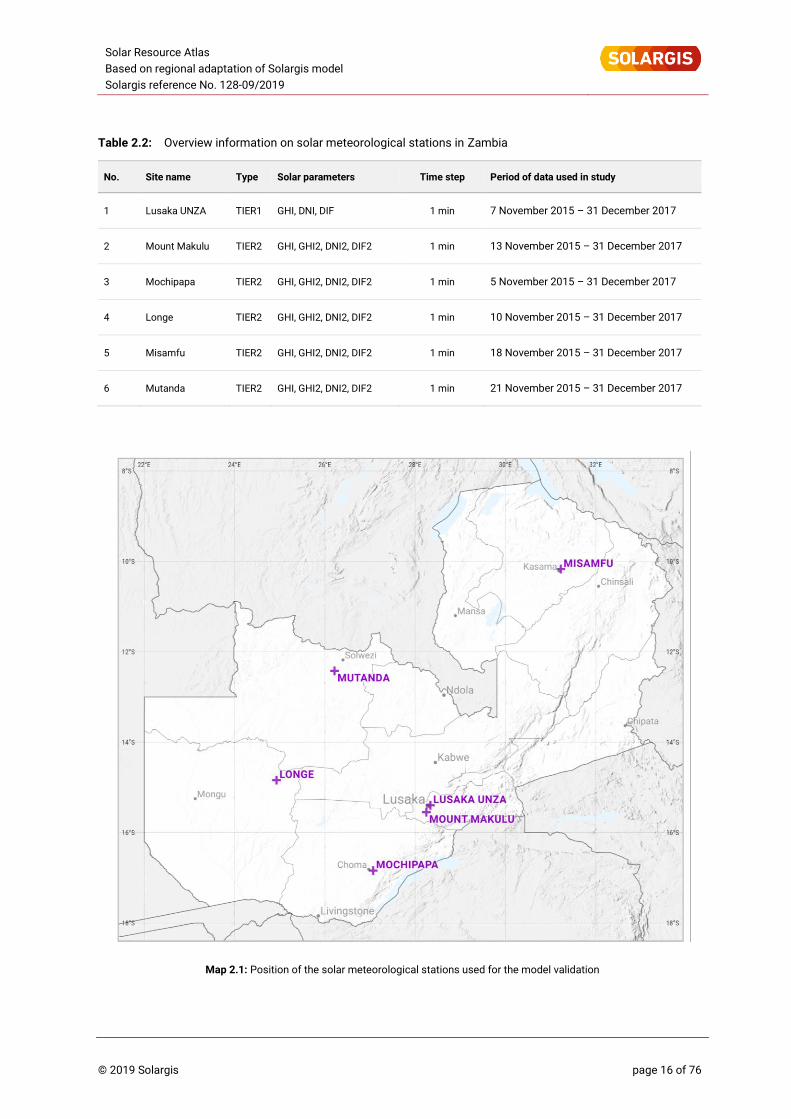
Table 2.2: Overview information on solar meteorological stations in Zambia
No. Site name Type Solar parameters Time step Period of data used in study
1 Lusaka UNZA TIER1 GHI, DNI, DIF 1 min 7 November 2015 – 31 December 2017
2 Mount Makulu TIER2 GHI, GHI2, DNI2, DIF2 1 min 13 November 2015 – 31 December 2017
3 Mochipapa TIER2 GHI, GHI2, DNI2, DIF2 1 min 5 November 2015 – 31 December 2017
4 Longe TIER2 GHI, GHI2, DNI2, DIF2 1 min 10 November 2015 – 31 December 2017
5 Misamfu TIER2 GHI, GHI2, DNI2, DIF2 1 min 18 November 2015 – 31 December 2017
6 Mutanda TIER2 GHI, GHI2, DNI2, DIF2 1 min 21 November 2015 – 31 December 2017
Map 2.1: Position of the solar meteorological stations used for the model validation
Solar Resource Atlas
Based on regional adaptation of Solargis model
Solargis reference No. 128-09/2019
© 2019 Solargis page 17 of 76
2.1.3 Solargis satellite-based model
Models using satellite and atmospheric data have become a standard for calculating solar resource time series and
maps. The same models are also used for real-time data delivery for system monitoring and solar resource
forecasting. Data from reliable operational solar models are routinely used by the solar industry.
In this study, we applied a model developed and operated by the company Solargis. This model operationally
calculates high-resolution solar resource data and other meteorological parameters. Its geographical extent covers
most of the land surface between 60º North and 45º South latitudes. A comprehensive overview of the Solargis
model was made available in several publications [9, 10, 11]. The related uncertainty and requirements for bankability
are discussed in [12, 13, 14].
In the Solargis approach, solar irradiance is calculated in 5 steps:
1. Calculation of clear-sky irradiance, assuming all atmospheric effects except clouds,
2. Calculation of cloud properties from satellite data,
3. Integration of clear-sky irradiance and cloud effects and calculation of global horizontal irradiance (GHI)
4. Calculation of direct normal irradiance (DNI) from GHI and clear-sky irradiance.
5. Calculation of global tilted irradiance (GTI) from GHI and DNI.
Models used in individual calculation steps are parameterized by a set of inputs characterizing the cloud properties,
state of the atmosphere and terrain conditions.
The clear-sky irradiance is calculated by the simplified SOLIS model [15]. This model allows the fast calculation of
clear-sky irradiance from the set of input parameters. Sun position is a deterministic parameter, and it is described
by the algorithms with satisfactory accuracy. Stochastic variability of clear-sky atmospheric conditions is
determined by changing concentrations of atmospheric constituents, namely aerosols, water vapour and ozone.
Global atmospheric data, representing these constituents, are routinely calculated by world atmospheric data
centres:
• In Solargis, the new generation aerosol data set representing Atmospheric Optical Depth (AOD) is used.
The core data set, representing a period from 2003 to the present, is from the MACC-II/CAMS project
(ECMWF) [16, 17]. An important feature of this data set is that it captures daily variability of aerosols and
allows simulating more precisely the events with extreme atmospheric load of aerosol particles. Thus, it
reduces uncertainty of instantaneous estimates of GHI and especially DNI, and it allows for improved
statistical distribution of irradiance values [18, 19]. For years 1994 to 2002, data from the MERRA-2 model
(NASA) [20] is used and it is homogenized with MACC-II/CAMS model are used. The Solargis calculation
accuracy of the clear-sky irradiance is especially sensitive to information on aerosols.
• Water vapour is also highly variable in space and time, but it has lower impact on the values of solar
radiation, compared to aerosols. The daily GFS and CFSR values (NOAA NCEP) are used in Solargis, thus
representing the daily variability from 1994 to the present [21, 22, 23].
• Ozone absorbs solar radiation at wavelengths shorter than 0.3 µm, thus having negligible influence on the
broadband solar radiation.
The clouds are the most influencing factor modulating clear-sky irradiance. The effect of clouds is calculated from
satellite data in the form of the cloud index (cloud transmittance). The cloud index is derived by relating irradiance
recorded by the satellite in several spectral channels and surface albedo to the cloud optical properties. In this study,
a data from the Meteosat MFG and MSG satellites is used. Data is available for a period from 1994 to the present
(24-hour delay) in a time step of 30 and 15 minutes. In Solargis, the modified calculation scheme by Cano has been
adopted to retrieve cloud optical properties from the satellite data [25]. A number of improvements have been
introduced to better cope with specific situations such as snow, ice, or high albedo areas (arid zones and deserts),
and complex terrain.
Solar Resource Atlas
Based on regional adaptation of Solargis model
Solargis reference No. 128-09/2019
© 2019 Solargis page 18 of 76
To calculate Global Horizontal Irradiance (GHI) for all atmospheric and cloud conditions, the clear-sky global
horizontal irradiance is coupled with the cloud index.
From GHI, other solar irradiance components (direct, diffuse and reflected) are calculated. Direct Normal Irradiance
(DNI) is calculated by the modified Dirindex model [26]. Diffuse horizontal irradiance is derived from GHI and DNI
according to the following equation:
DIF = GHI - DNI * Cos Z (1)
Where Z is the zenith angle between the solar position and the Earth’s surface.
Calculation of Global Tilted Irradiance (GTI) from GHI deals with direct and diffuse components separately. While
calculation of the direct component is straightforward, estimation of diffuse irradiance for a tilted surface is more
complex, and it is affected by limited information regarding shading effects and albedo of nearby objects. For
converting diffuse horizontal irradiance for a tilted surface, the Perez diffuse transposition model is used [27]. The
reflected component is also approximated considering that knowledge of local conditions is limited.
A model for the simulation of terrain effects (elevation and shading) based on high-resolution elevation and horizon
data is used in the standard Solargis methodology [28]. The model by Ruiz Arias is used to achieve enhanced spatial
representation – from the resolution of satellite (several km) to the resolution of the digital terrain model.
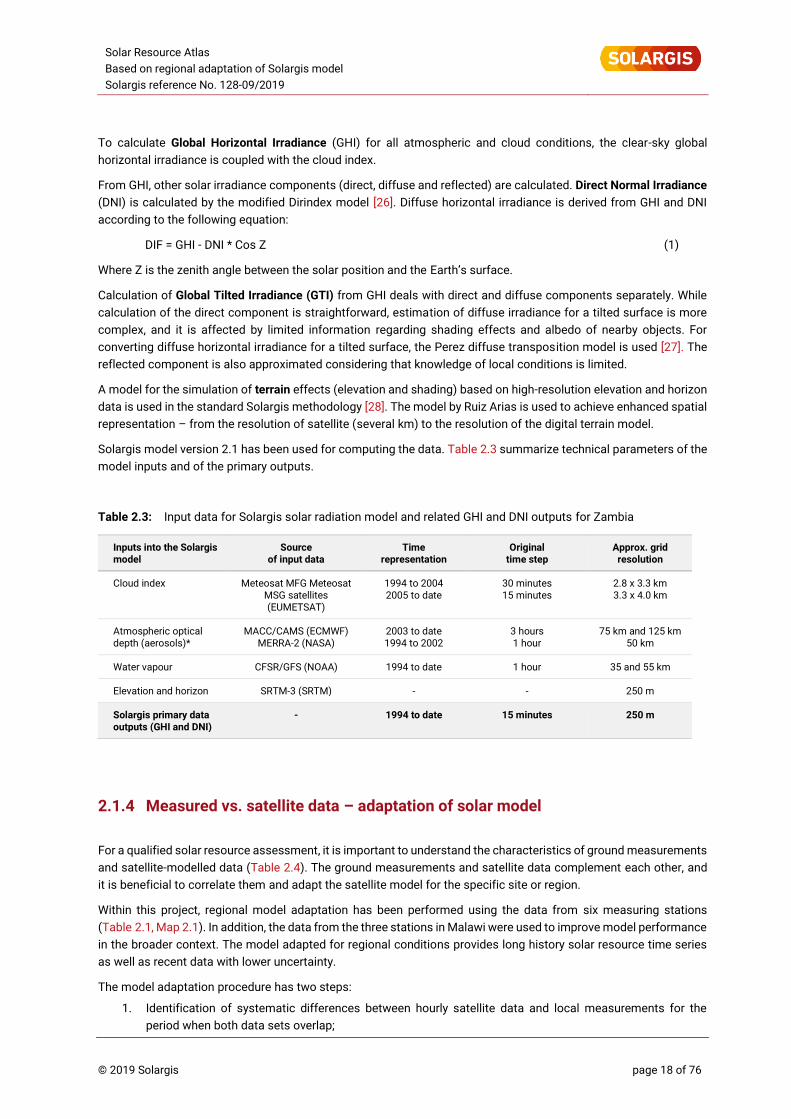
Solargis model version 2.1 has been used for computing the data. Table 2.3 summarize technical parameters of the
model inputs and of the primary outputs.
Table 2.3: Input data for Solargis solar radiation model and related GHI and DNI outputs for Zambia
Inputs into the Solargis model
Source of input data
Time representation
Original time step
Approx. grid resolution
Cloud index Meteosat MFG Meteosat MSG satellites (EUMETSAT)
1994 to 2004 2005 to date
30 minutes 15 minutes
2.8 x 3.3 km 3.3 x 4.0 km
Atmospheric optical depth (aerosols)*
MACC/CAMS (ECMWF) MERRA-2 (NASA)
2003 to date 1994 to 2002
3 hours 1 hour
75 km and 125 km 50 km
Water vapour CFSR/GFS (NOAA) 1994 to date 1 hour 35 and 55 km
Elevation and horizon SRTM-3 (SRTM) - - 250 m
Solargis primary data outputs (GHI and DNI)
- 1994 to date 15 minutes 250 m
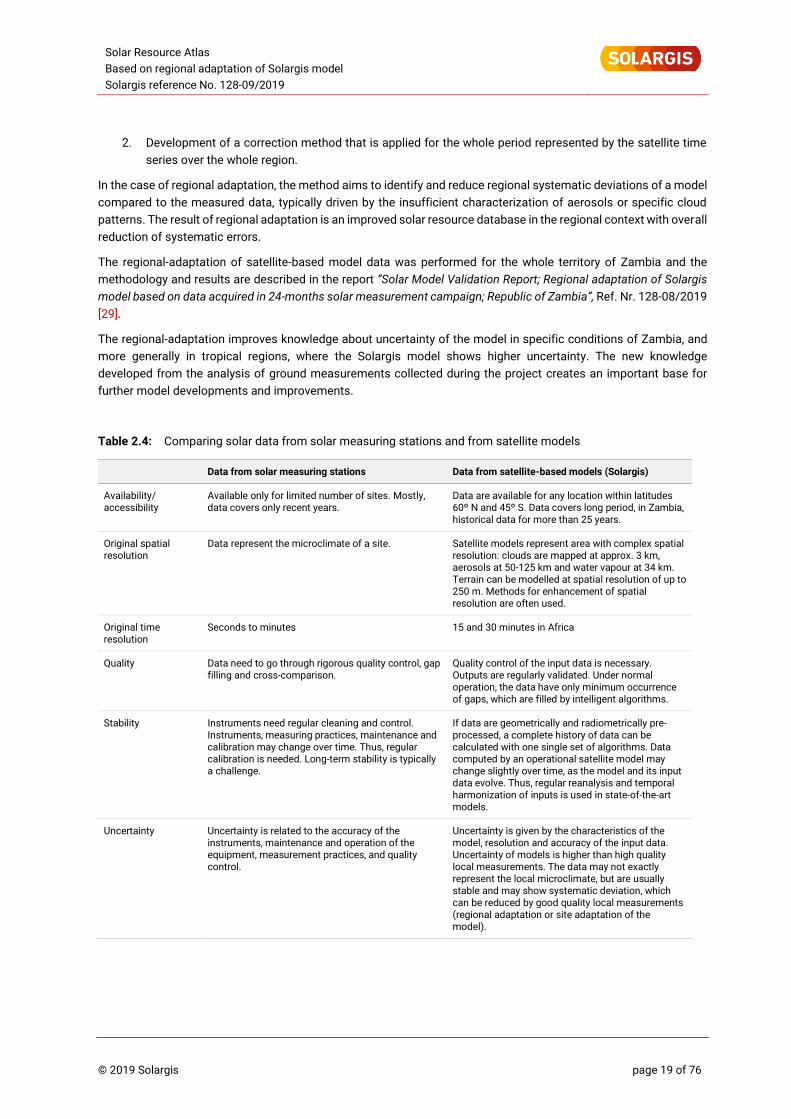
2.1.4 Measured vs. satellite data – adaptation of solar model
For a qualified solar resource assessment, it is important to understand the characteristics of ground measurements
and satellite-modelled data (Table 2.4). The ground measurements and satellite data complement each other, and
it is beneficial to correlate them and adapt the satellite model for the specific site or region.
Within this project, regional model adaptation has been performed using the data from six measuring stations
(Table 2.1, Map 2.1). In addition, the data from the three stations in Malawi were used to improve model performance
in the broader context. The model adapted for regional conditions provides long history solar resource time series
as well as recent data with lower uncertainty.
The model adaptation procedure has two steps:
1. Identification of systematic differences between hourly satellite data and local measurements for the
period when both data sets overlap;
Solar Resource Atlas
Based on regional adaptation of Solargis model
Solargis reference No. 128-09/2019
© 2019 Solargis page 19 of 76
2. Development of a correction method that is applied for the whole period represented by the satellite time
series over the whole region.
In the case of regional adaptation, the method aims to identify and reduce regional systematic deviations of a model
compared to the measured data, typically driven by the insufficient characterization of aerosols or specific cloud
patterns. The result of regional adaptation is an improved solar resource database in the regional context with overall
reduction of systematic errors.
The regional-adaptation of satellite-based model data was performed for the whole territory of Zambia and the
methodology and results are described in the report “Solar Model Validation Report; Regional adaptation of Solargis
model based on data acquired in 24-months solar measurement campaign; Republic of Zambia”, Ref. Nr. 128-08/2019
[29].
The regional-adaptation improves knowledge about uncertainty of the model in specific conditions of Zambia, and
more generally in tropical regions, where the Solargis model shows higher uncertainty. The new knowledge
developed from the analysis of ground measurements collected during the project creates an important base for
further model developments and improvements.
Table 2.4: Comparing solar data from solar measuring stations and from satellite models
Data from solar measuring stations Data from satellite-based models (Solargis)
Availability/ accessibility
Available only for limited number of sites. Mostly, data covers only recent years.
Data are available for any location within latitudes 60º N and 45º S. Data covers long period, in Zambia, historical data for more than 25 years.
Original spatial resolution
Data represent the microclimate of a site. Satellite models represent area with complex spatial resolution: clouds are mapped at approx. 3 km, aerosols at 50-125 km and water vapour at 34 km. Terrain can be modelled at spatial resolution of up to 250 m. Methods for enhancement of spatial resolution are often used.
Original time resolution
Seconds to minutes 15 and 30 minutes in Africa
Quality Data need to go through rigorous quality control, gap filling and cross-comparison.
Quality control of the input data is necessary. Outputs are regularly validated. Under normal operation, the data have only minimum occurrence of gaps, which are filled by intelligent algorithms.
Stability Instruments need regular cleaning and control. Instruments, measuring practices, maintenance and calibration may change over time. Thus, regular calibration is needed. Long-term stability is typically a challenge.
If data are geometrically and radiometrically pre-processed, a complete history of data can be calculated with one single set of algorithms. Data computed by an operational satellite model may change slightly over time, as the model and its input data evolve. Thus, regular reanalysis and temporal harmonization of inputs is used in state-of-the-art models.
Uncertainty Uncertainty is related to the accuracy of the instruments, maintenance and operation of the equipment, measurement practices, and quality control.
Uncertainty is given by the characteristics of the model, resolution and accuracy of the input data. Uncertainty of models is higher than high quality local measurements. The data may not exactly represent the local microclimate, but are usually stable and may show systematic deviation, which can be reduced by good quality local measurements (regional adaptation or site adaptation of the model).
Solar Resource Atlas
Based on regional adaptation of Solargis model
Solargis reference No. 128-09/2019
© 2019 Solargis page 20 of 76
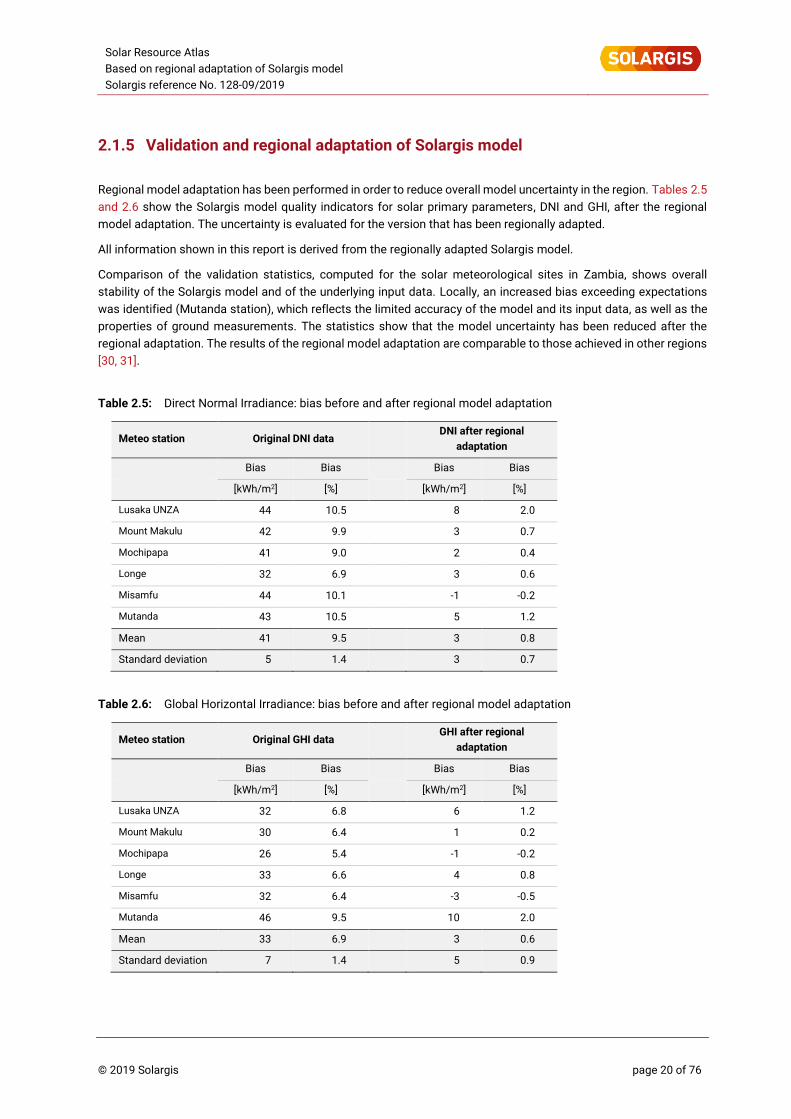
2.1.5 Validation and regional adaptation of Solargis model
Regional model adaptation has been performed in order to reduce overall model uncertainty in the region. Tables 2.5
and 2.6 show the Solargis model quality indicators for solar primary parameters, DNI and GHI, after the regional
model adaptation. The uncertainty is evaluated for the version that has been regionally adapted.
All information shown in this report is derived from the regionally adapted Solargis model.
Comparison of the validation statistics, computed for the solar meteorological sites in Zambia, shows overall
stability of the Solargis model and of the underlying input data. Locally, an increased bias exceeding expectations
was identified (Mutanda station), which reflects the limited accuracy of the model and its input data, as well as the
properties of ground measurements. The statistics show that the model uncertainty has been reduced after the
regional adaptation. The results of the regional model adaptation are comparable to those achieved in other regions
[30, 31].
Table 2.5: Direct Normal Irradiance: bias before and after regional model adaptation
Meteo station Original DNI data DNI after regional
adaptation
Bias Bias Bias Bias
[kWh/m2] [%] [kWh/m2] [%]
Lusaka UNZA 44 10.5 8 2.0
Mount Makulu 42 9.9 3 0.7
Mochipapa 41 9.0 2 0.4
Longe 32 6.9 3 0.6
Misamfu 44 10.1 -1 -0.2
Mutanda 43 10.5 5 1.2
Mean 41 9.5 3 0.8
Standard deviation 5 1.4 3 0.7
Table 2.6: Global Horizontal Irradiance: bias before and after regional model adaptation
Meteo station Original GHI data GHI after regional
adaptation
Bias Bias Bias Bias
[kWh/m2] [%] [kWh/m2] [%]
Lusaka UNZA 32 6.8 6 1.2
Mount Makulu 30 6.4 1 0.2
Mochipapa 26 5.4 -1 -0.2
Longe 33 6.6 4 0.8
Misamfu 32 6.4 -3 -0.5
Mutanda 46 9.5 10 2.0
Mean 33 6.9 3 0.6
Standard deviation 7 1.4 5 0.9
Solar Resource Atlas
Based on regional adaptation of Solargis model
Solargis reference No. 128-09/2019
© 2019 Solargis page 21 of 76
2.1.6 Uncertainty of solar resource estimates
The uncertainty of regionally adapted satellite-based DNI and GHI is determined by uncertainty of the model, ground
measurements, and the model adaptation method. More specifically it depends on [15]:
1. Parameterization and adaptation of numerical models integrated in Solargis for the given data inputs and
their ability to generate accurate results for various geographical and time-variable conditions:
• Data inputs into Solargis model: accuracy of Meteosat satellite data, MACC-II/CAMS and MERRA-2
aerosols and CFSR/GFS water vapour
• Solis clear-sky model and its capability to properly characterize various states of the atmosphere
• Simulation accuracy of the Solargis cloud transmittance algorithms, being able to properly distinguish
different states of various surface types, albedo, clouds and fog
• Diffuse and direct decomposition by Perez model
• Transposition from global horizontal to in-plane irradiance (for GTI) by Perez model
• Terrain shading and disaggregation by Ruiz-Arias model
2. Uncertainty of the ground-measurements, which is determined by:
• Accuracy of the instruments
• Maintenance practices, including sensor cleaning, service and calibration
• Data post-processing and quality control procedures.
3. Uncertainty of the model adaptation at regional scale and residual uncertainty after adaptation
The uncertainty from the interannual variability of solar resource is not considered in this study.
Accuracy statistics, such as bias (Chapter 2.1.5) characterize the accuracy of the Solargis model in the given
validation points, relative to the ground measurements. The validation statistics are affected by local geography and
by the quality and reliability of ground-measured data. Therefore, the validation statistics only indicate performance
of the model in this region.
The majority of Zambia territory has uncertainty of the regionally-adapted model yearly values in the range of ±4% to
±5% for GHI and ±5% to ±7% for DNI. We expect higher uncertainty in regions with more complex geography, which
is partly a result of uncertainty of ground measurements, limited number of solar meteorological stations and higher
model uncertainty in regions with specific micro-climatic conditions (e.g. occurrence of convective clouds close to
steep mountain slopes).
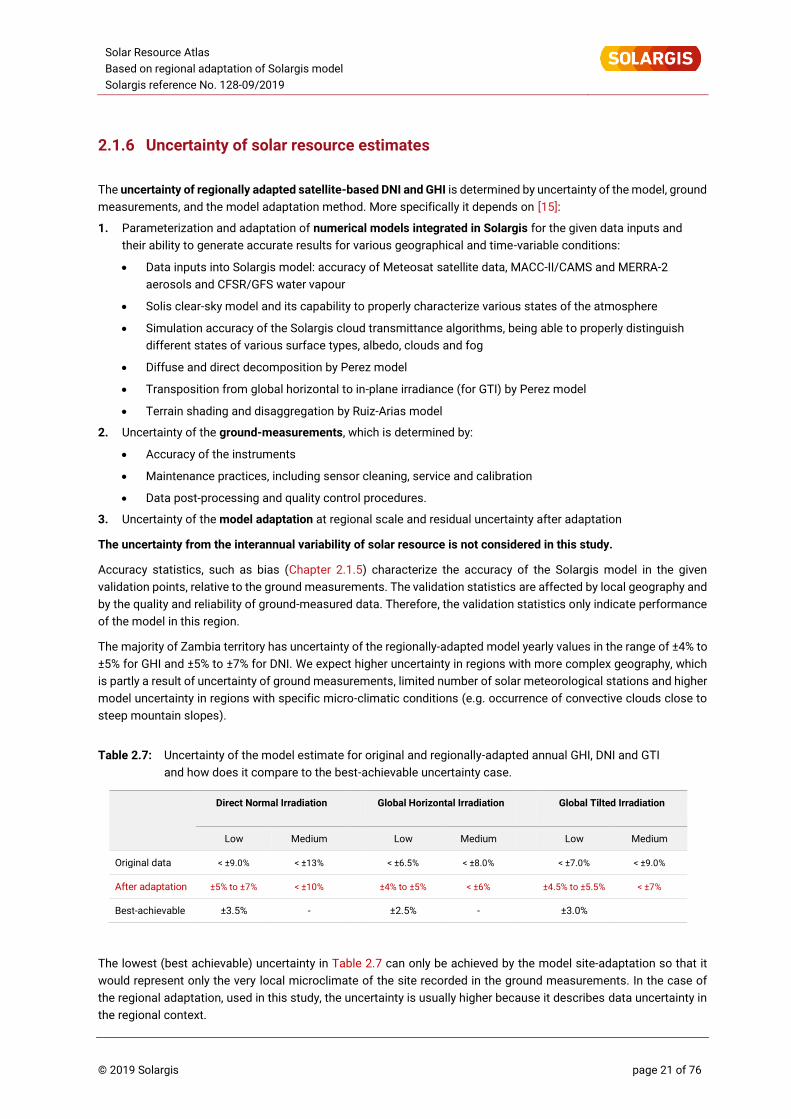
Table 2.7: Uncertainty of the model estimate for original and regionally-adapted annual GHI, DNI and GTI
and how does it compare to the best-achievable uncertainty case.
Direct Normal Irradiation
Global Horizontal Irradiation Global Tilted Irradiation
Low Medium
Low Medium Low Medium
Original data < ±9.0% < ±13%
< ±6.5% < ±8.0% < ±7.0% < ±9.0%
After adaptation ±5% to ±7% < ±10%
±4% to ±5% < ±6% ±4.5% to ±5.5% < ±7%
Best-achievable ±3.5% - ±2.5% - ±3.0%
The lowest (best achievable) uncertainty in Table 2.7 can only be achieved by the model site-adaptation so that it
would represent only the very local microclimate of the site recorded in the ground measurements. In the case of
the regional adaptation, used in this study, the uncertainty is usually higher because it describes data uncertainty in
the regional context.
Solar Resource Atlas
Based on regional adaptation of Solargis model
Solargis reference No. 128-09/2019
© 2019 Solargis page 22 of 76
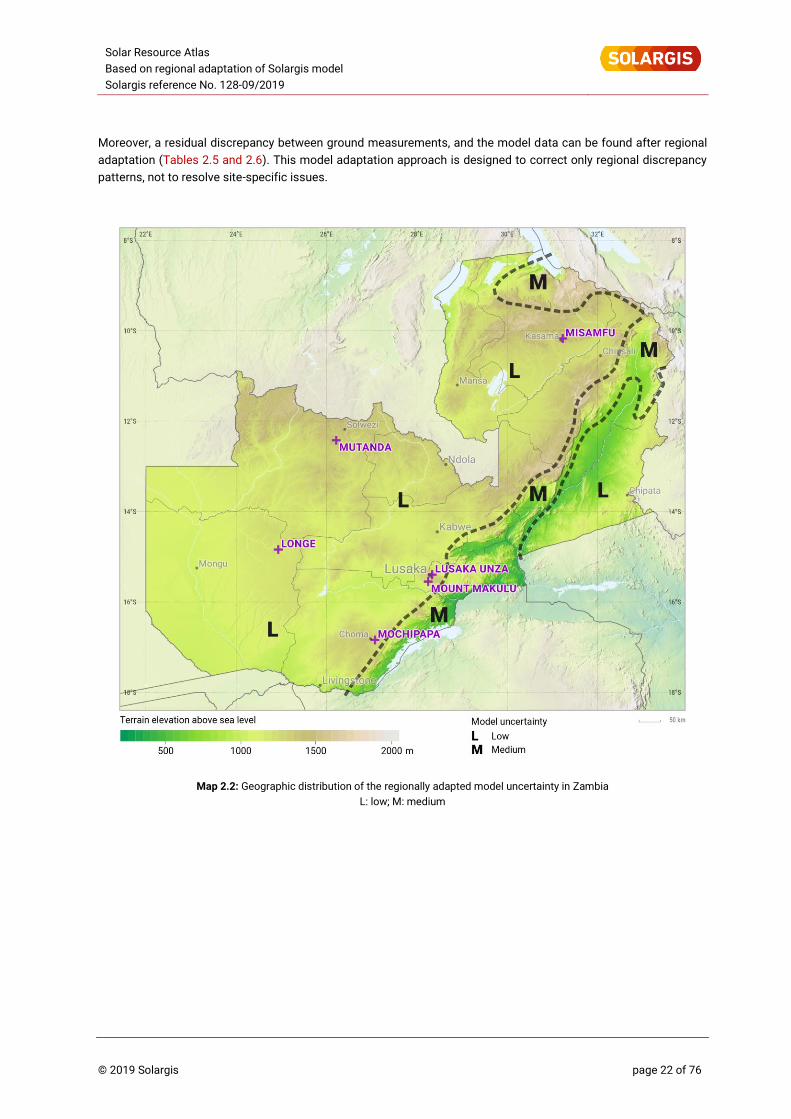
Moreover, a residual discrepancy between ground measurements, and the model data can be found after regional
adaptation (Tables 2.5 and 2.6). This model adaptation approach is designed to correct only regional discrepancy
patterns, not to resolve site-specific issues.
Map 2.2: Geographic distribution of the regionally adapted model uncertainty in Zambia
L: low; M: medium
Solar Resource Atlas
Based on regional adaptation of Solargis model
Solargis reference No. 128-09/2019
© 2019 Solargis page 23 of 76
2.2 Meteorological data
2.2.1 Measured vs. modelled data
Meteorological parameters are an important part of a solar energy project assessment as they determine the
operating conditions and the effectiveness of solar power plant operations. The most important meteorological
parameter for the operation of photovoltaic power plants is air temperature, which directly impacts power production
(energy yield is decreasing when temperature is increasing). Meteorological data can be collected by two
approaches: (1) by measuring at meteorological sites and (2) computing by meteorological models.
The requirements for the meteorological data for solar energy projects are:
• Long and continuous record of data, preferably covering the same time period as satellite-based solar
resource data,
• Data should reliably represent the local climate,
• Data should be accurate, quality-controlled and without gaps.
Table 2.8: Comparing data from meteorological stations and weather models
Meteorological station data Data from meteorological models
Availability/ accessibility
Available only for selected sites. Data may cover different periods of time
Data are available for any location. Data cover long continuous and equal period of time (decades)
Original spatial resolution
Local measurement representing microclimate with all local weather occurrences
Regional simulation, representing regional weather patterns with relatively coarse grid resolution. Therefore, local values can be smoothed, especially extreme values.
Original time resolution
From 1 minute to 1 hour 1 hour
Quality Data has to go through rigorous quality control, gap filling and cross-comparison.
No need of special quality control. No gaps, relatively stable outputs if data processing systematically controlled.
Stability Sensors, measuring practices, maintenance and calibration may change over time. Thus, achieving long-term stability needs systematic attention.
In case of reanalysis, long history of data is calculated with one single stable model. Data for operational models may slightly change over time, as model development evolves
Uncertainty Uncertainty is related to the quality and maintenance of sensors and measurement practices, usually sufficient for solar energy applications.
Uncertainty is given by the resolution and accuracy of the model. Uncertainty of meteorological models is higher than uncertainty of high quality measurements. The model data may not exactly represent the local microclimate; accuracy can be enhanced by correlating them with the ground measurements.
Several models are available: a good option is to use Modern-Era Retrospective analysis for Research and
Applications (MERRA-2) model (source NASA, USA) [23] and the Climate Forecast System Version 2 (CFSv2) model
(source NOAA, NCEP, USA), which cover a long period of time with continuous data [24]. The results of these models
are implemented in Solargis.
The role of meteorological ground measurements in solar energy development has two aspects:
• Measurements are used for the validation and accuracy enhancement of historical data derived from the solar
and meteorological models
• The high frequency measurements (typically one-minute data) are used for improved understanding of the
microclimate of the site, especially for capturing the extremes.
Solar Resource Atlas
Based on regional adaptation of Solargis model
Solargis reference No. 128-09/2019
© 2019 Solargis page 24 of 76
Data from the two sources described above have their advantages and disadvantages (Table 2.8). Air temperature
derived from the meteorological models has lower spatial and temporal resolution compared to ground
measurements, and lower accuracy. Thus, the modelled parameters characterize regional climate patterns rather
than the local microclimate. Extreme values, in particular, may not be well represented.
2.2.2 Method and validation
In this project, the air temperature data is delivered. It is derived from the meteorological models: MERRA-2 and
CFSv2 (Table 2.9). As explained in Chapter 2.2.1, the numerical weather models have lower spatial and temporal
resolution compared to the solar resource data. The original spatial resolution of the models is enhanced to 1 km
for air temperature by spatial disaggregation and the use of the Digital Elevation Model SRTM-3.
Table 2.9: Original source of Solargis air temperature at 2 m for Zambia: MERRA-2 and CFSv2.
Modern-Era Retrospective analysis for Research and Applications (MERRA-2)
Climate Forecast System (CFSv2)
Time period 1994 to 2010 2011 to the present time
Original spatial resolution 45 x 50 km 19 x 22 km
Original time resolution 1 hour 1 hour
For the purpose of validating the meteorological models in Zambia, we have used the data collected at six
meteorological stations (Table 2.1, Map. 2.1). The summary of basic statistical parameters is presented in
Table 2.10.
The main issue identified is the underestimation or overestimation of night-time temperature by the model
depending on the station and the month, yet the day-time temperature is represented with higher accuracy. More
details about the validation of meteorological parameters can be seen in the report “Annual Solar Resource Report
for solar meteorological stations after completion of 24 months of measurements, Republic of Zambia, Report number:
128-07/2018” [8].
Table 2.10: Air temperature at 2 m: accuracy indicators of the model outputs [ºC].
Meteorological station
Validation period Bias mean RMSD hourly
RMSD daily
RMSD monthly
Lusaka UNZA 11/2015 – 12/2017 -1.6 2.5 1.8 1.6
Mount Makulu 11/2015 – 12/2017 -1.7 2.7 2.0 1.8
Mochipapa 11/2015 – 12/2017 -1.1 2.2 1.5 1.2
Longe 11/2015 – 12/2017 0.2 2.5 1.4 0.9
Misamfu 11/2015 – 12/2017 -1.7 2.7 2.0 1.8
Mutanda 11/2015 – 12/2017 0.8 3.4 2.2 1.9
Solar Resource Atlas
Based on regional adaptation of Solargis model
Solargis reference No. 128-09/2019
© 2019 Solargis page 25 of 76
2.2.3 Uncertainty of air temperature
In general, the data from the meteorological models represent larger area, and it is not capable to represent
accurately the microclimate. The main issue identified is underestimation or overestimation of night-time
temperature by the model, yet the day-time temperature is represented with higher accuracy than nigh-time.
The uncertainty of the model estimate for air temperature is summarised in Table 2.11.
Table 2.11: Expected uncertainty of air temperature in Zambia.
Unit Annual Monthly Hourly
Air temperature at 2 m °C ±2.0 ±2.0 ±3.5
2.3 Simulation of solar photovoltaic potential
Solar radiation is the most important parameter for PV power simulation, as it is fuel for solar power plants. The
intensity of global irradiance received by the tilted surface of PV modules (GTI) is calculated from two primary
parameters stored in the Solargis database and delivered in this project:
• Global Horizontal Irradiance (GHI)
• Direct Normal Irradiance (DNI)
There are two main types of solar energy technologies: photovoltaic (PV) and concentrating solar power
(CSP). Photovoltaics have high potential in Zambia, and this technology is discussed in this Chapter. CSP technology
is not expected to be implemented in Zambia.
Photovoltaic technology exploits global horizontal or tilted irradiation, which is the sum of direct and diffuse
components (see Equation (1) in Chapter 2.1.3). To simulate power production from a PV system, global irradiance
received by a flat surface of PV modules must be calculated. Due to clouds, PV power generation reacts to changes
in solar radiation in a matter of seconds or minutes (depending on the size of a module field), thus intermittency
(short-term variability) of the PV power production is to be considered. Similarly, the effect of seasonal variability is
to be considered as well.
For possible PV installations, several technical options are available. They are briefly described below.
Two types of mounting of PV modules can be considered:
• PV modules mounted on the ground in a fixed position or on sun-trackers
• PV modules mounted on rooftops or façades of buildings
• Three types of PV systems can be considered for Zambia:
• Grid-connected PV power plants
• Mini-grid PV systems
• Off-grid PV systems
The majority of larger PV power plants are built in an open space and often these have PV modules mounted at a
fixed position. Fixed mounting structures offer a simple and efficient choice for implementing PV power plants. A
well-designed structure is robust and ensures long-life performance, even during harsh weather conditions, at low
maintenance costs. Sun-tracking systems are another alternative for the design of a PV module field. Solar trackers
adjust the orientation of the PV modules during the day towards the sun, so the PV modules collect more solar
radiation.
Solar Resource Atlas
Based on regional adaptation of Solargis model
Solargis reference No. 128-09/2019
© 2019 Solargis page 26 of 76
Roof or façade mounted PV systems are typically small to medium size, i.e. ranging from hundreds of watts to
hundreds of kilowatts. Modules can be mounted on rooftops, façades or can be directly integrated as part of a
building structure. PV modules in this type of system are often installed in a suboptimal position (deviating from the
optimum angle), and this results in a lower performance efficiency. Some reduction of PV power output can be
expected due to nearby shading structures. Trees, masts, neighbouring buildings, roof structures or self-shading of
PV modules determine the reduced PV system performance.
Mini-grid PV systems include power generation facility and distribution grids connecting the local consumers. The
typical size of installed PV systems is in the range of 10s to 100s of kWp. Mini-grids may be adapted to meet the
requirements of local needs, they can be combined with diesel generators and battery storage. This option appears
to be most economic for supply of electricity for small rural communities.
Off-grid PV systems are small systems that are not connected into a distribution grid. They are usually equipped
with energy storage (classic lead acid or modern-type batteries, such as Li-on) and/or connected to diesel
generators. Batteries are maintained through charge controllers for protection against overcharging or deep
discharge. Depending on size and functionality of the off-grid PV system, it can work with AC (together with inverter)
or DC voltage source.
In this study, the PV power potential is studied for a system with fixed-mounted monofacial PV modules, considered
here as the mainstream technology. Installed capacity of a PV power plant is usually determined by the available
space and options to maintain the stability of the local grid.
2.3.1 Principles of PV electricity simulation
Results of PV electricity simulation, presented in Chapter 3.6, are based on software developed by Solargis. This
Chapter summarizes key elements of the simulation chain.
Table 2.12: Specification of Solargis database used in the PV calculation in this study
Data inputs for PV simulation Global tilted irradiation (GTI) derived from GHI and DNI
Air temperature at 2 m (TEMP)
Spatial grid resolution (approximate) 250 m (9 arc-sec)
Time resolution 15-minute
Geographical extent (this study) Republic of Zambia
Period covered by data (this study) 01/1994 to 12/2017
The PV software implemented by Solargis has scientifically proven methods [32 to 37] and uses full historical time
series of solar radiation and air temperature data on the input (Table 2.12). Data and model quality are checked
using field tests and ground measurements.
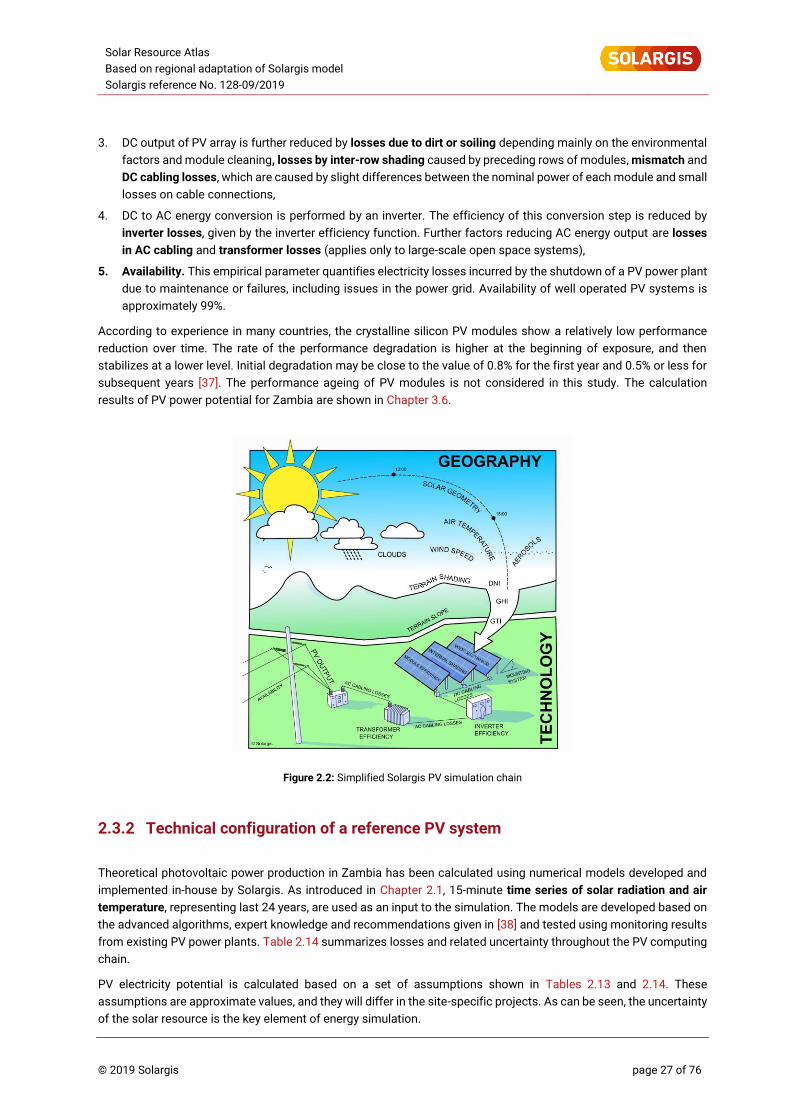
In PV energy simulation procedure, there are several energy losses that occur in the individual steps of energy
conversion (Figure 2.2):
1. Losses due to terrain shading caused by far horizon. On the other hand, shading of local features such as nearby
building, structures or vegetation is not considered in the calculation,
2. Energy conversion in PV modules is reduced by losses due to angular reflectivity, which depends on the relative
position of the sun and plane of the module and temperature losses, caused by the performance of PV modules
working outside of STC conditions defined in datasheets,
Solar Resource Atlas
Based on regional adaptation of Solargis model
Solargis reference No. 128-09/2019
© 2019 Solargis page 27 of 76
3. DC output of PV array is further reduced by losses due to dirt or soiling depending mainly on the environmental
factors and module cleaning, losses by inter-row shading caused by preceding rows of modules, mismatch and
DC cabling losses, which are caused by slight differences between the nominal power of each module and small
losses on cable connections,
4. DC to AC energy conversion is performed by an inverter. The efficiency of this conversion step is reduced by
inverter losses, given by the inverter efficiency function. Further factors reducing AC energy output are losses
in AC cabling and transformer losses (applies only to large-scale open space systems),
5. Availability. This empirical parameter quantifies electricity losses incurred by the shutdown of a PV power plant
due to maintenance or failures, including issues in the power grid. Availability of well operated PV systems is
approximately 99%.
According to experience in many countries, the crystalline silicon PV modules show a relatively low performance
reduction over time. The rate of the performance degradation is higher at the beginning of exposure, and then
stabilizes at a lower level. Initial degradation may be close to the value of 0.8% for the first year and 0.5% or less for
subsequent years [37]. The performance ageing of PV modules is not considered in this study. The calculation
results of PV power potential for Zambia are shown in Chapter 3.6.
Figure 2.2: Simplified Solargis PV simulation chain
2.3.2 Technical configuration of a reference PV system
Theoretical photovoltaic power production in Zambia has been calculated using numerical models developed and
implemented in-house by Solargis. As introduced in Chapter 2.1, 15-minute time series of solar radiation and air
temperature, representing last 24 years, are used as an input to the simulation. The models are developed based on
the advanced algorithms, expert knowledge and recommendations given in [38] and tested using monitoring results
from existing PV power plants. Table 2.14 summarizes losses and related uncertainty throughout the PV computing
chain.
PV electricity potential is calculated based on a set of assumptions shown in Tables 2.13 and 2.14. These
assumptions are approximate values, and they will differ in the site-specific projects. As can be seen, the uncertainty
of the solar resource is the key element of energy simulation.
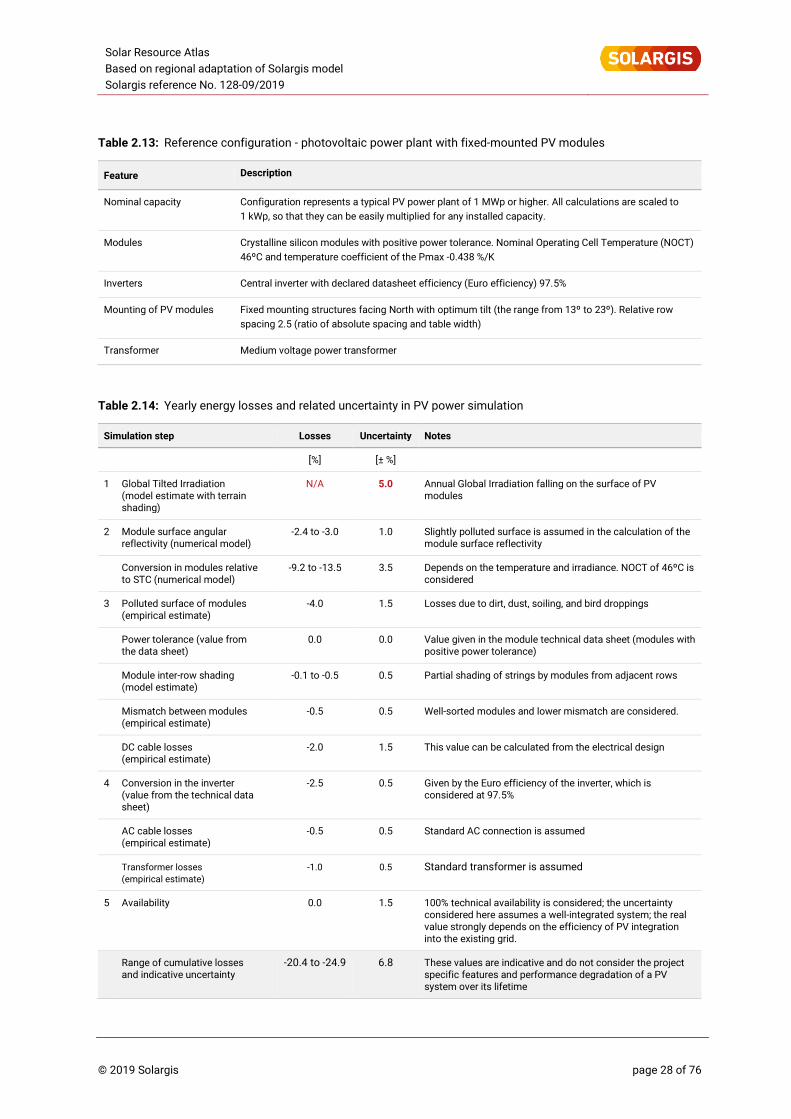
Solar Resource Atlas
Based on regional adaptation of Solargis model
Solargis reference No. 128-09/2019
© 2019 Solargis page 28 of 76
Table 2.13: Reference configuration - photovoltaic power plant with fixed-mounted PV modules
Feature Description
Nominal capacity Configuration represents a typical PV power plant of 1 MWp or higher. All calculations are scaled to
1 kWp, so that they can be easily multiplied for any installed capacity.
Modules Crystalline silicon modules with positive power tolerance. Nominal Operating Cell Temperature (NOCT)
46ºC and temperature coefficient of the Pmax -0.438 %/K
Inverters Central inverter with declared datasheet efficiency (Euro efficiency) 97.5%
Mounting of PV modules Fixed mounting structures facing North with optimum tilt (the range from 13º to 23º). Relative row
spacing 2.5 (ratio of absolute spacing and table width)
Transformer Medium voltage power transformer
Table 2.14: Yearly energy losses and related uncertainty in PV power simulation
Simulation step Losses Uncertainty Notes
[%] [± %]
1 Global Tilted Irradiation (model estimate with terrain shading)
N/A 5.0 Annual Global Irradiation falling on the surface of PV modules
2 Module surface angular reflectivity (numerical model)
-2.4 to -3.0 1.0 Slightly polluted surface is assumed in the calculation of the module surface reflectivity
Conversion in modules relative to STC (numerical model)
-9.2 to -13.5 3.5 Depends on the temperature and irradiance. NOCT of 46ºC is considered
3 Polluted surface of modules (empirical estimate)
-4.0 1.5 Losses due to dirt, dust, soiling, and bird droppings
Power tolerance (value from the data sheet)
0.0 0.0 Value given in the module technical data sheet (modules with positive power tolerance)
Module inter-row shading (model estimate)
-0.1 to -0.5 0.5 Partial shading of strings by modules from adjacent rows
Mismatch between modules (empirical estimate)
-0.5 0.5 Well-sorted modules and lower mismatch are considered.
DC cable losses (empirical estimate)
-2.0 1.5 This value can be calculated from the electrical design
4 Conversion in the inverter (value from the technical data sheet)
-2.5 0.5 Given by the Euro efficiency of the inverter, which is considered at 97.5%
AC cable losses (empirical estimate)
-0.5 0.5 Standard AC connection is assumed
Transformer losses
(empirical estimate) -1.0 0.5 Standard transformer is assumed
5 Availability 0.0 1.5 100% technical availability is considered; the uncertainty considered here assumes a well-integrated system; the real value strongly depends on the efficiency of PV integration into the existing grid.
Range of cumulative losses and indicative uncertainty
-20.4 to -24.9 6.8 These values are indicative and do not consider the project specific features and performance degradation of a PV system over its lifetime

Solar Resource Atlas
Based on regional adaptation of Solargis model
Solargis reference No. 128-09/2019
© 2019 Solargis page 29 of 76
Map 3.16 shows theoretical potential power production of a PV system installed with a typical technology
configuration for open space PV power plants. The technical parameters are described in Table 2.13.
In this study, the reference configuration for the PV potential calculation is a PV system with crystalline-silicon (c-Si)
modules mounted in a fixed position on a table facing North and inclined at an angle close to optimum, i.e. at the
angle at which the yearly sum of global tilted irradiation received by PV modules is maximized (a range between 13º
and 23º depending on latitude and geographical features). The fixed-mounting of PV modules is very common and
provides a robust solution with minimal maintenance effort. Geographic differences in potential PV production are
shown for six selected sites (Chapter 3.6).
The results presented in Chapter 3.6 do not consider the performance degradation of PV modules due to aging; they
also lack the required level of detail. Thus, these results cannot be used for financial assumptions of any specific
project. Detailed assessment of energy yield for a specific power plant is within the scope of a site-specific bankable
expert study.
2.4 Outline of solar concentrating technologies
Concentrating technologies can only utilize DNI (as diffuse irradiance cannot be concentrated). Instant (short-term)
variability of DNI is very high and this is especially relevant for Concentrating PV (CPV) systems. On the contrary,
solar thermal power plants, often denoted as Concentrating Solar Power (CSP) technology, have several methods to
control short term, as well as daily, variability. This is given by the inertia of the whole system (solar field, heat transfer
and storage), which can additionally be supported by storage or fossil fuels.
DNI solar resource availability in Zambia does not give prospects for installation of solar concentrating technologies.
This chapter presents only overview information.
2.4.1 Concentrating Solar Power (CSP)
A distinctive characteristic of Concentrated Solar Power technology (CSP) is that, when deployed with thermal
energy storage, it can produce electricity on demand, providing a dispatchable source of renewable energy.
Therefore, it can provide electricity whenever needed to meet demand, performing like a traditional base-load power
plant. There are several groups of solar thermal power plants:
• Parabolic troughs: solar fields using trough systems capture solar energy using large mirrors that track the
sun’s movement throughout the day. The curved shape reflects most of that heat onto a receiver pipe that
is filled with a heat transfer fluid. The thermal energy from the heated fluid generates steam, which in turn
generates electricity in a conventional steam turbine. Heated fluid in the trough systems can also provide
heat to thermal storage systems, which can be used to generate electricity at times when the sun is not
shining;
• Power towers: they use flat mirrors (heliostats) to reflect sunlight onto a solar receiver at the top of a central
tower. Water is pumped up the tower to the receiver, where concentrated thermal energy heats it up. The
hot steam then powers a conventional steam turbine. Some power towers use molten salt in place of water
and steam. That hot molten salt can be used immediately to generate steam and electricity, or it can be
stored and used at a later time.
• Fresnel reflectors: they are made of many thin, flat mirror strips to concentrate sunlight onto tubes through
which working fluid is pumped. The rest of the energy cycle works similarly as in the above-mentioned
systems.
Solar Resource Atlas
Based on regional adaptation of Solargis model
Solargis reference No. 128-09/2019
© 2019 Solargis page 30 of 76
• Stirling dish: consists of a stand-alone parabolic reflector that concentrates light onto a receiver positioned
at the reflector's focal point. The reflector tracks the Sun along two axes. The working fluid in the receiver
is heated and then used by a Stirling engine to generate power.
One of the advantages of technology is thermal storage, often in the form of molten salt. CSP can also be integrated
with fossil-based generation sources in a hybrid configuration.
2.4.2 Concentrating photovoltaics (CPV)
A different conversion method of DNI into electricity is Concentrated Photovoltaic (CPV). This technology is based
on the use of lenses or curved mirrors to concentrate sunlight onto a small area of high-efficiency PV cells. High
concentration CPV requires very precise solar trackers. The advantage of CPV over flat plate PV is a potential for
cost reduction due to the smaller area of photovoltaic material required. The necessity of sun tracking partially
balances out the smaller price of the semiconductor material used. CPV technology also requires more maintenance
during the lifetime of the power plant. Power production from CPV may be more sensitive to changing weather
conditions. The advantage of CPV over CSP is full scalability, similar to flat plate PV modules.
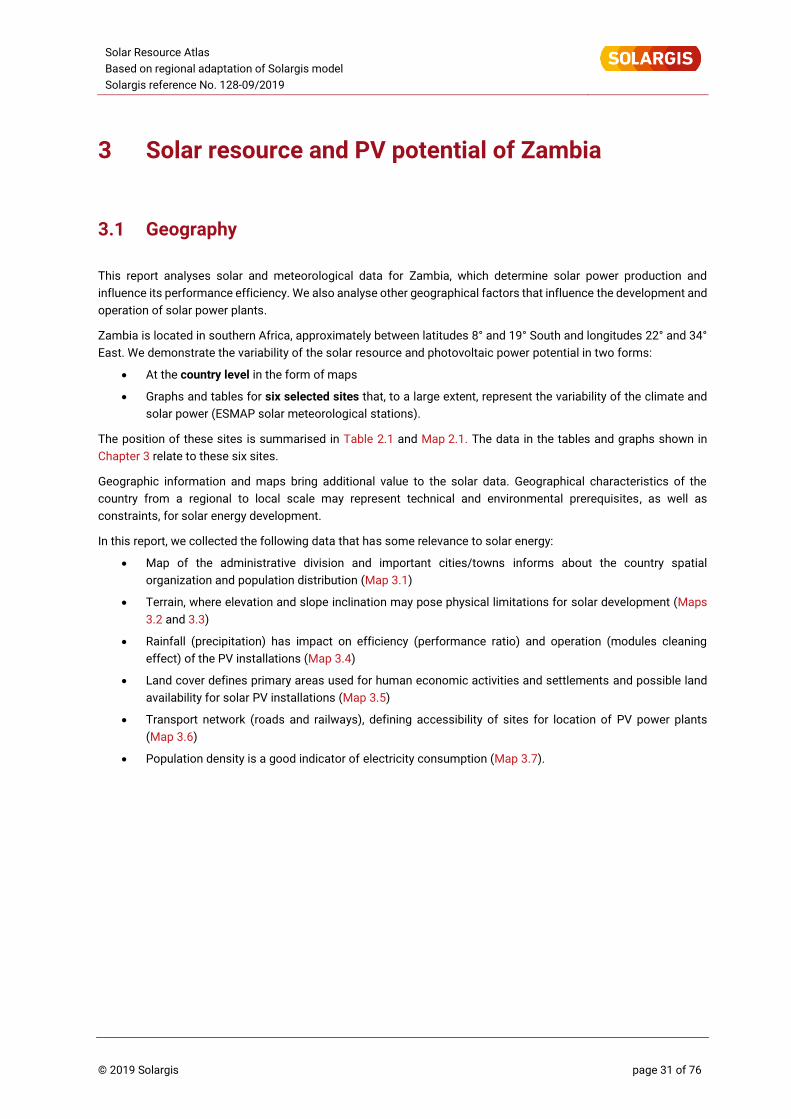
Solar Resource Atlas
Based on regional adaptation of Solargis model
Solargis reference No. 128-09/2019
© 2019 Solargis page 31 of 76
3 Solar resource and PV potential of Zambia
3.1 Geography
This report analyses solar and meteorological data for Zambia, which determine solar power production and
influence its performance efficiency. We also analyse other geographical factors that influence the development and
operation of solar power plants.
Zambia is located in southern Africa, approximately between latitudes 8° and 19° South and longitudes 22° and 34°
East. We demonstrate the variability of the solar resource and photovoltaic power potential in two forms:
• At the country level in the form of maps
• Graphs and tables for six selected sites that, to a large extent, represent the variability of the climate and
solar power (ESMAP solar meteorological stations).
The position of these sites is summarised in Table 2.1 and Map 2.1. The data in the tables and graphs shown in
Chapter 3 relate to these six sites.
Geographic information and maps bring additional value to the solar data. Geographical characteristics of the
country from a regional to local scale may represent technical and environmental prerequisites, as well as
constraints, for solar energy development.
In this report, we collected the following data that has some relevance to solar energy:
• Map of the administrative division and important cities/towns informs about the country spatial
organization and population distribution (Map 3.1)
• Terrain, where elevation and slope inclination may pose physical limitations for solar development (Maps
3.2 and 3.3)
• Rainfall (precipitation) has impact on efficiency (performance ratio) and operation (modules cleaning
effect) of the PV installations (Map 3.4)
• Land cover defines primary areas used for human economic activities and settlements and possible land
availability for solar PV installations (Map 3.5)
• Transport network (roads and railways), defining accessibility of sites for location of PV power plants
(Map 3.6)
• Population density is a good indicator of electricity consumption (Map 3.7).
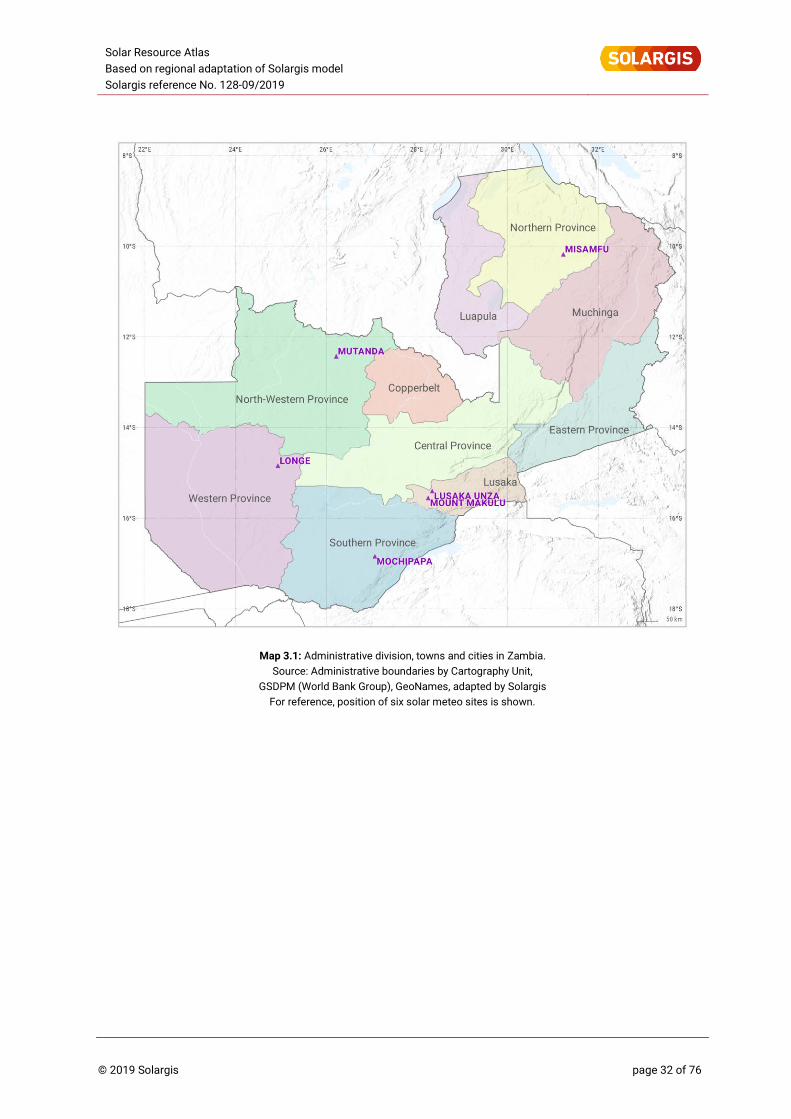
Solar Resource Atlas
Based on regional adaptation of Solargis model
Solargis reference No. 128-09/2019
© 2019 Solargis page 32 of 76
Map 3.1: Administrative division, towns and cities in Zambia.
Source: Administrative boundaries by Cartography Unit,
GSDPM (World Bank Group), GeoNames, adapted by Solargis
For reference, position of six solar meteo sites is shown.
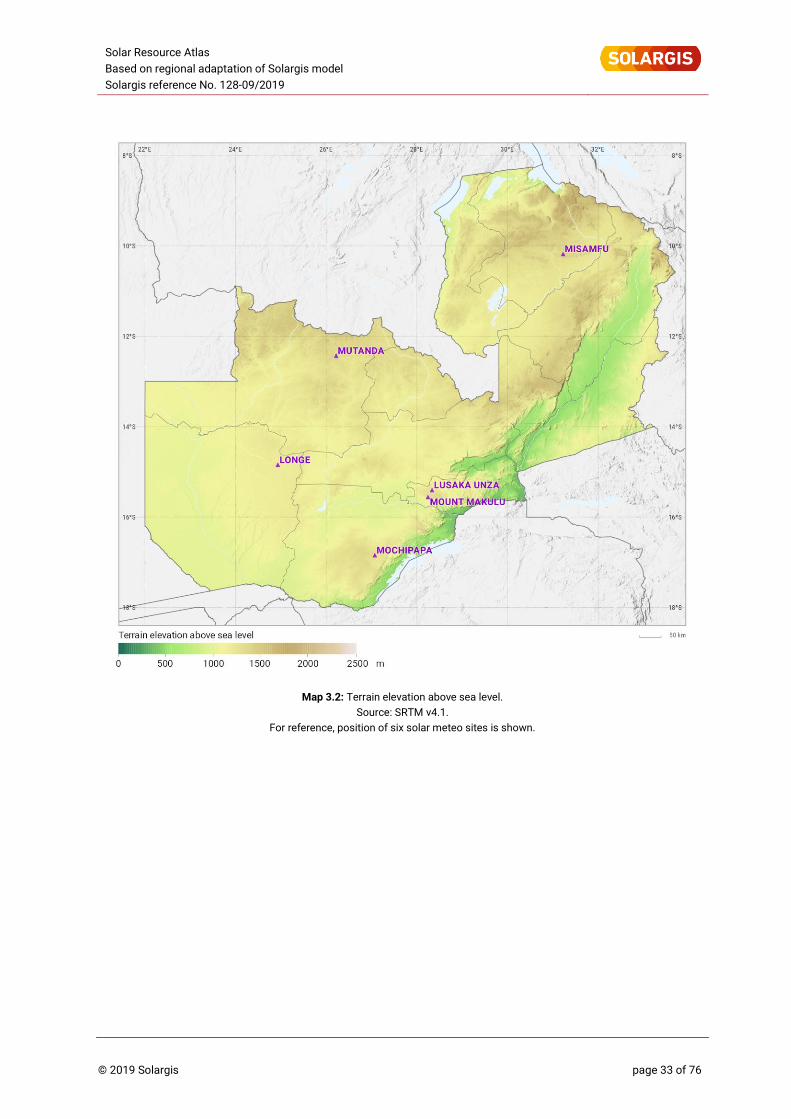
Solar Resource Atlas
Based on regional adaptation of Solargis model
Solargis reference No. 128-09/2019
© 2019 Solargis page 33 of 76
Map 3.2: Terrain elevation above sea level.
Source: SRTM v4.1.
For reference, position of six solar meteo sites is shown.
Solar Resource Atlas
Based on regional adaptation of Solargis model
Solargis reference No. 128-09/2019
© 2019 Solargis page 34 of 76
Map 3.3: Terrain slope.
Based on: SRTM v4.1 data, calculated by Solargis.
For reference, position of six solar meteo sites is shown.
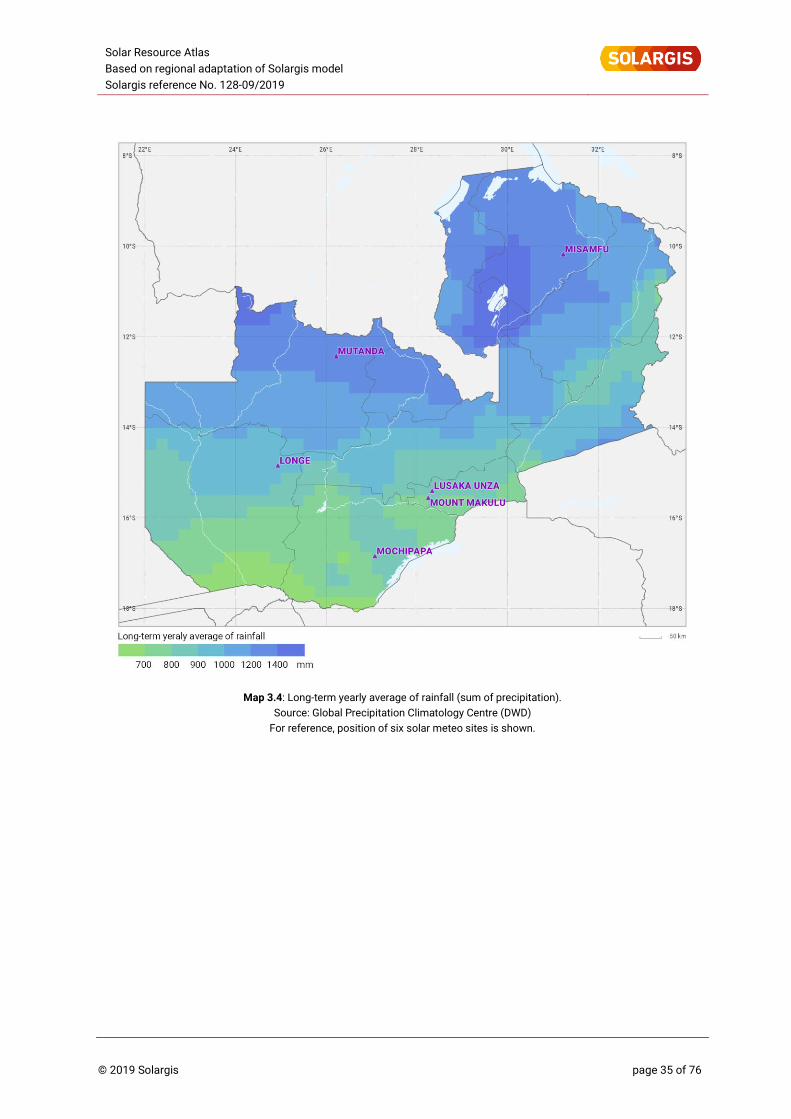
Solar Resource Atlas
Based on regional adaptation of Solargis model
Solargis reference No. 128-09/2019
© 2019 Solargis page 35 of 76
Map 3.4: Long-term yearly average of rainfall (sum of precipitation).
Source: Global Precipitation Climatology Centre (DWD)
For reference, position of six solar meteo sites is shown.
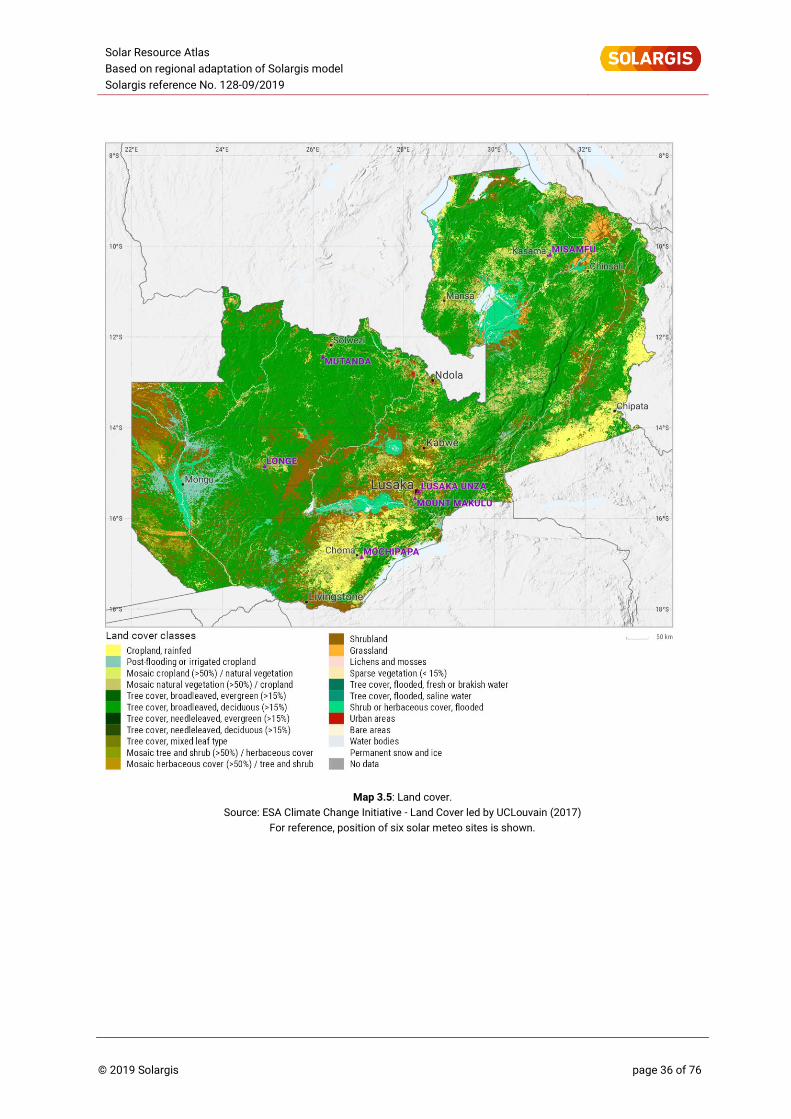
Solar Resource Atlas
Based on regional adaptation of Solargis model
Solargis reference No. 128-09/2019
© 2019 Solargis page 36 of 76
Map 3.5: Land cover.
Source: ESA Climate Change Initiative - Land Cover led by UCLouvain (2017)
For reference, position of six solar meteo sites is shown.
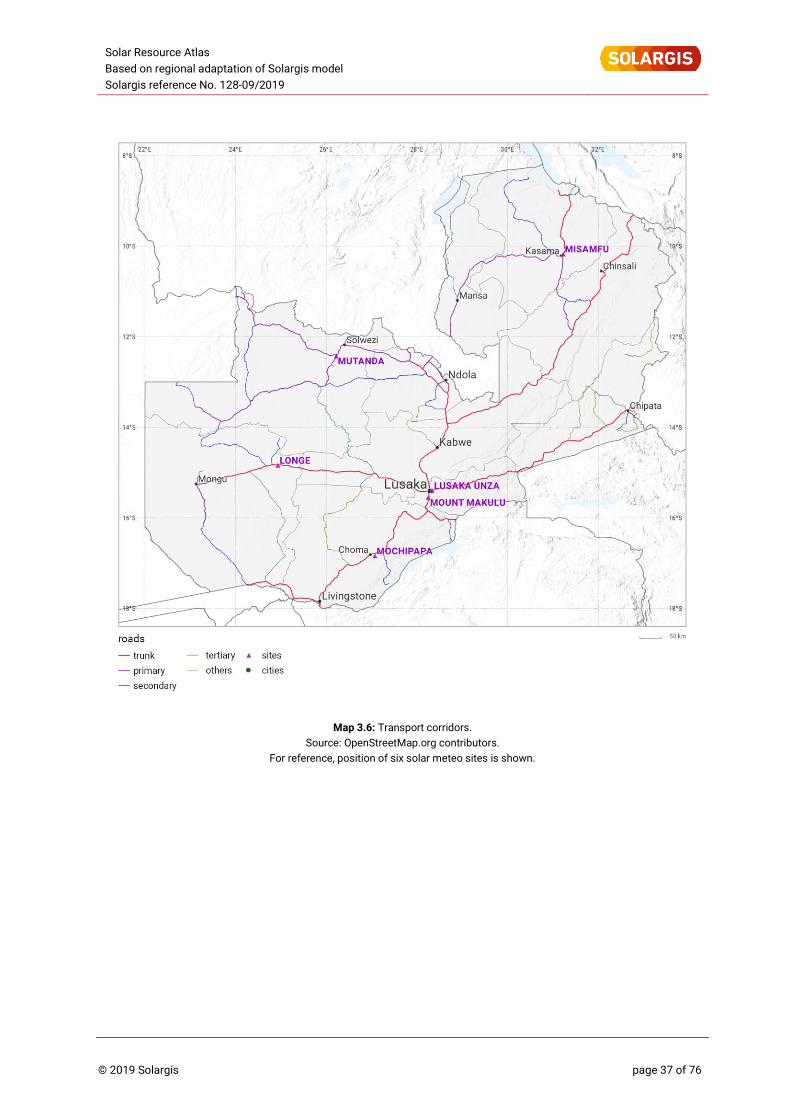
Solar Resource Atlas
Based on regional adaptation of Solargis model
Solargis reference No. 128-09/2019
© 2019 Solargis page 37 of 76
Map 3.6: Transport corridors.
Source: OpenStreetMap.org contributors.
For reference, position of six solar meteo sites is shown.
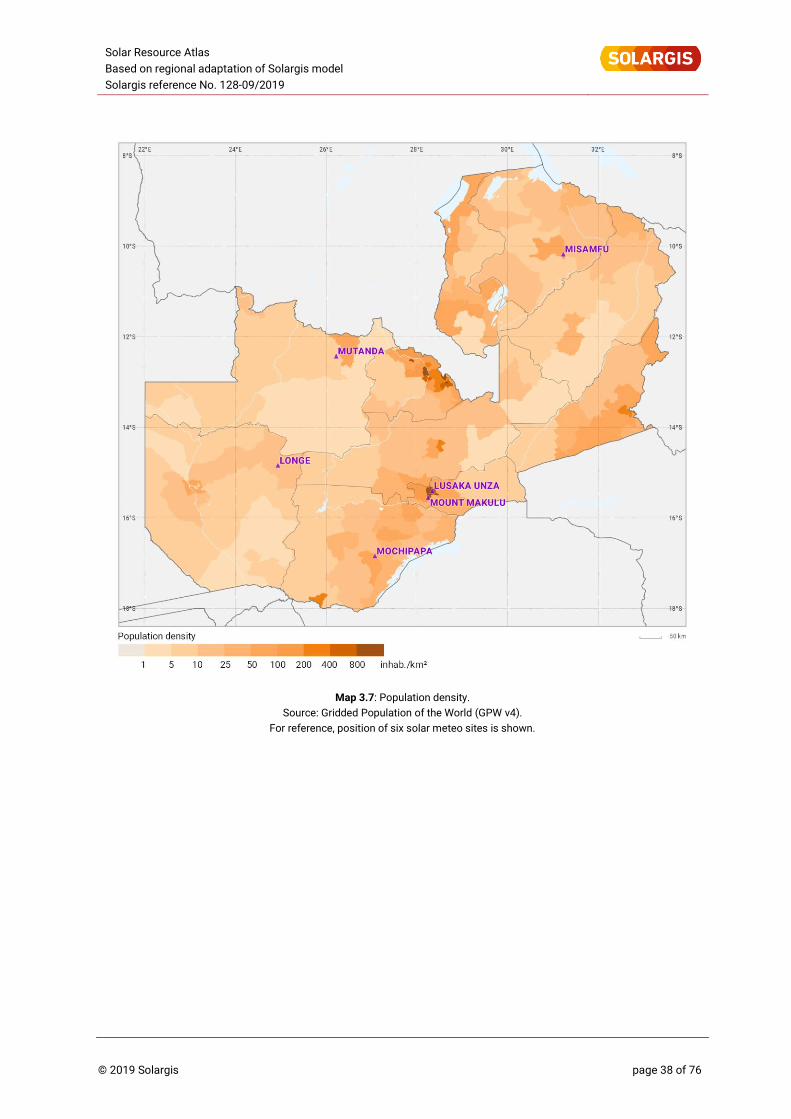
Solar Resource Atlas
Based on regional adaptation of Solargis model
Solargis reference No. 128-09/2019
© 2019 Solargis page 38 of 76
Map 3.7: Population density.
Source: Gridded Population of the World (GPW v4).
For reference, position of six solar meteo sites is shown.
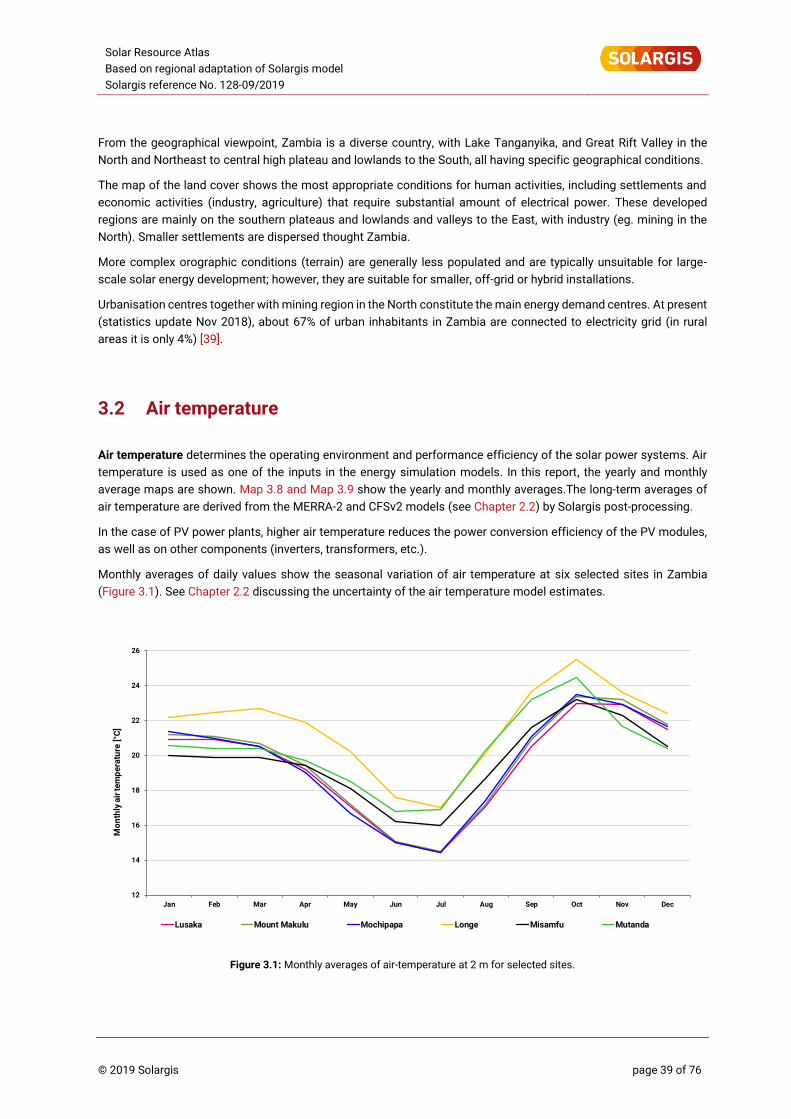
Solar Resource Atlas
Based on regional adaptation of Solargis model
Solargis reference No. 128-09/2019
© 2019 Solargis page 39 of 76
From the geographical viewpoint, Zambia is a diverse country, with Lake Tanganyika, and Great Rift Valley in the
North and Northeast to central high plateau and lowlands to the South, all having specific geographical conditions.
The map of the land cover shows the most appropriate conditions for human activities, including settlements and
economic activities (industry, agriculture) that require substantial amount of electrical power. These developed
regions are mainly on the southern plateaus and lowlands and valleys to the East, with industry (eg. mining in the
North). Smaller settlements are dispersed thought Zambia.
More complex orographic conditions (terrain) are generally less populated and are typically unsuitable for large-
scale solar energy development; however, they are suitable for smaller, off-grid or hybrid installations.
Urbanisation centres together with mining region in the North constitute the main energy demand centres. At present
(statistics update Nov 2018), about 67% of urban inhabitants in Zambia are connected to electricity grid (in rural
areas it is only 4%) [39].
3.2 Air temperature
Air temperature determines the operating environment and performance efficiency of the solar power systems. Air
temperature is used as one of the inputs in the energy simulation models. In this report, the yearly and monthly
average maps are shown. Map 3.8 and Map 3.9 show the yearly and monthly averages.The long-term averages of
air temperature are derived from the MERRA-2 and CFSv2 models (see Chapter 2.2) by Solargis post-processing.
In the case of PV power plants, higher air temperature reduces the power conversion efficiency of the PV modules,
as well as on other components (inverters, transformers, etc.).
Monthly averages of daily values show the seasonal variation of air temperature at six selected sites in Zambia
(Figure 3.1). See Chapter 2.2 discussing the uncertainty of the air temperature model estimates.
Figure 3.1: Monthly averages of air-temperature at 2 m for selected sites.
12
14
16
18
20
22
24
26
Jan Feb Mar Apr May Jun Jul Aug Sep Oct Nov Dec
Mo
nth
lya
irte
mp
era
ture
[°C
]
Lusaka Mount Makulu Mochipapa Longe Misamfu Mutanda
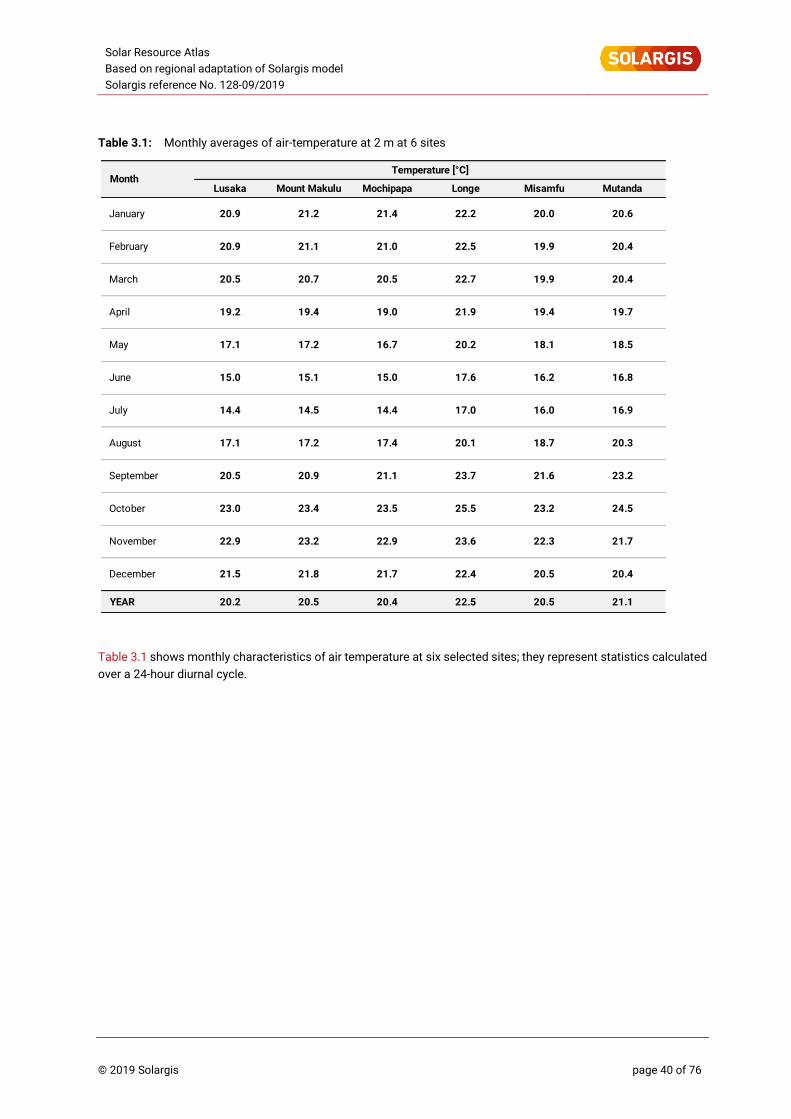
Solar Resource Atlas
Based on regional adaptation of Solargis model
Solargis reference No. 128-09/2019
© 2019 Solargis page 40 of 76
Table 3.1: Monthly averages of air-temperature at 2 m at 6 sites
Table 3.1 shows monthly characteristics of air temperature at six selected sites; they represent statistics calculated
over a 24-hour diurnal cycle.
Lusaka Mount Makulu Mochipapa Longe Misamfu Mutanda
YEAR 20.2 20.5 20.4 22.5 20.5 21.1
23.5
23.2
21.8
22.9
15.0
21.0
20.5
19.0
16.7
21.7
14.4
17.4
21.1
21.1
20.7
19.4
17.2
15.1
14.5
17.2
20.9
23.4
November
December
20.9
20.5
19.2
17.1
15.0
14.4
17.1
20.5
May
June
July
August
September
October
April
February
March
23.0
22.9
21.5
Temperature [°C]Month
20.9January 21.2 21.4 22.2
16.0
18.7
21.6
23.2
22.5
22.7
21.9
20.2
17.6
20.1
17.0
23.7
25.5
22.3
20.5
23.6
22.4
20.0
19.9
19.9
19.4
20.6
20.4
20.4
19.7
18.5
16.8
16.9
20.3
23.2
24.5
21.7
20.4
18.1
16.2
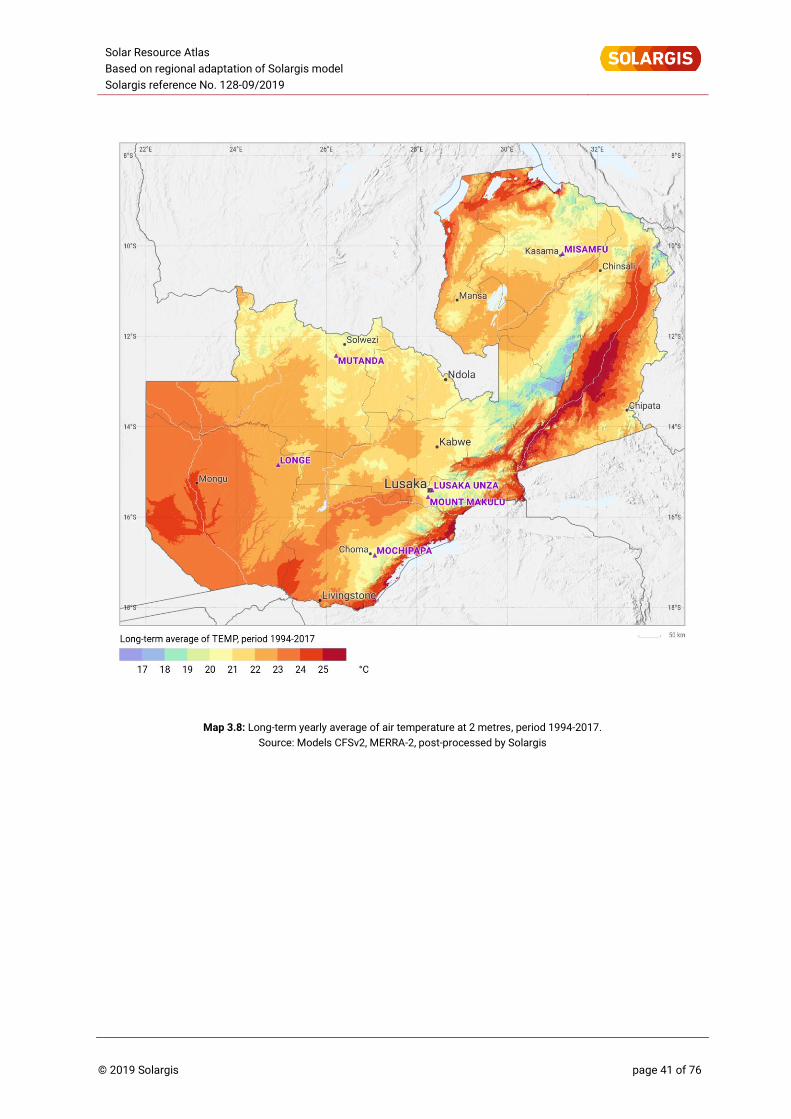
Solar Resource Atlas
Based on regional adaptation of Solargis model
Solargis reference No. 128-09/2019
© 2019 Solargis page 41 of 76
Map 3.8: Long-term yearly average of air temperature at 2 metres, period 1994-2017.
Source: Models CFSv2, MERRA-2, post-processed by Solargis
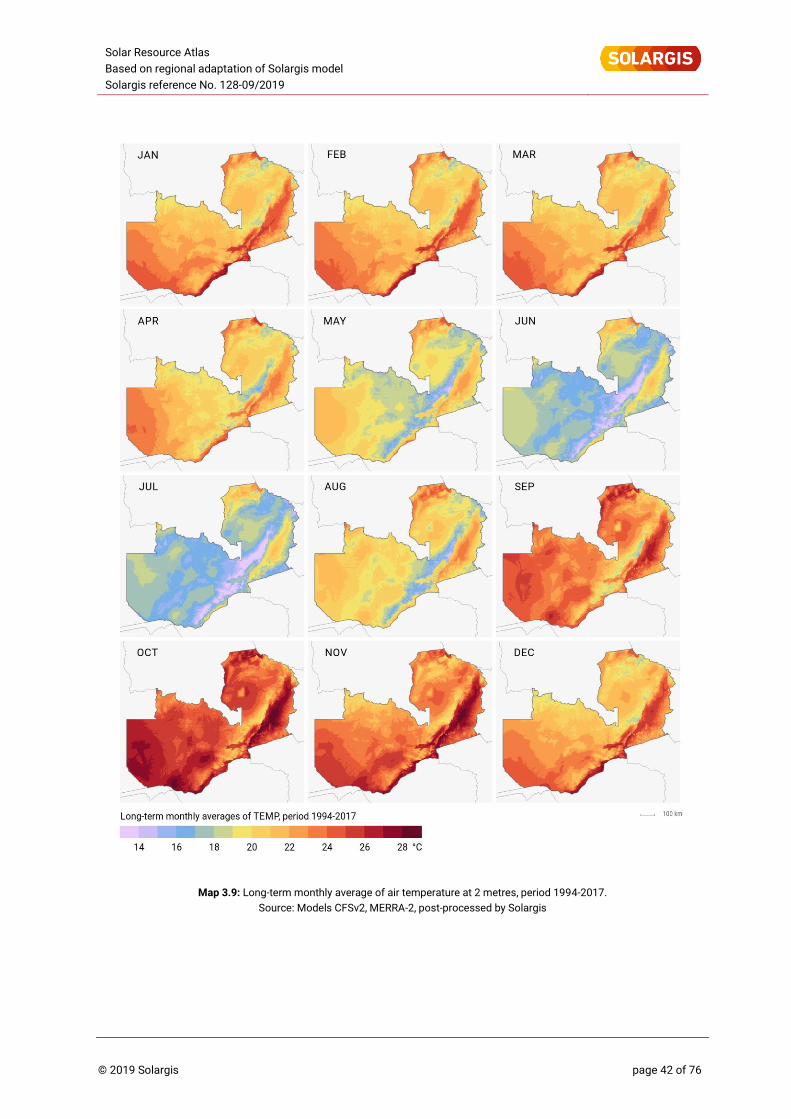
Solar Resource Atlas
Based on regional adaptation of Solargis model
Solargis reference No. 128-09/2019
© 2019 Solargis page 42 of 76
Map 3.9: Long-term monthly average of air temperature at 2 metres, period 1994-2017.
Source: Models CFSv2, MERRA-2, post-processed by Solargis
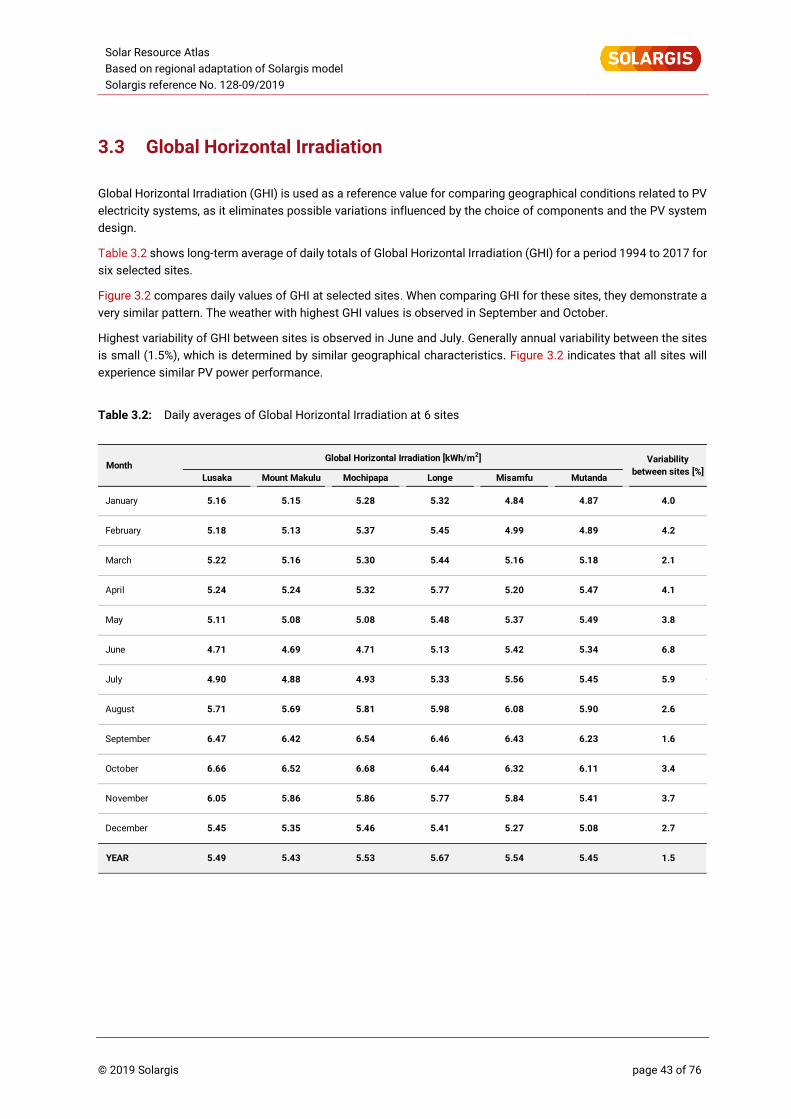
Solar Resource Atlas
Based on regional adaptation of Solargis model
Solargis reference No. 128-09/2019
© 2019 Solargis page 43 of 76
3.3 Global Horizontal Irradiation
Global Horizontal Irradiation (GHI) is used as a reference value for comparing geographical conditions related to PV
electricity systems, as it eliminates possible variations influenced by the choice of components and the PV system
design.
Table 3.2 shows long-term average of daily totals of Global Horizontal Irradiation (GHI) for a period 1994 to 2017 for
six selected sites.
Figure 3.2 compares daily values of GHI at selected sites. When comparing GHI for these sites, they demonstrate a
very similar pattern. The weather with highest GHI values is observed in September and October.
Highest variability of GHI between sites is observed in June and July. Generally annual variability between the sites
is small (1.5%), which is determined by similar geographical characteristics. Figure 3.2 indicates that all sites will
experience similar PV power performance.
Table 3.2: Daily averages of Global Horizontal Irradiation at 6 sites
Variability
between sites [%]
January
Month
Lusaka Mount Makulu Mochipapa Longe Misamfu Mutanda
5.16 5.15 4.05.28 4.874.84
Global Horizontal Irradiation [kWh/m2]
5.32
5.48
5.77 5.475.20
February
March 5.22
5.18
5.16
5.13
5.44
5.45
5.185.16
4.99 4.895.37
5.24 5.24
5.08
5.32
5.30
October
YEAR
November
December
August
September
June
July
April
May
4.2
2.1
4.1
3.7
2.7
1.5
3.8
6.8
5.9
2.6
1.6
3.4
5.67
5.41
5.77
6.44
6.46
5.98
5.33
5.13
5.43
5.35
5.86
6.52
6.42
5.69
4.88
4.69
5.86
6.68
6.54
5.81
4.93
4.71
5.53
5.46
5.49
5.45
6.05
6.66
6.47
5.71
4.90
4.71
5.085.11
5.54
5.27
5.84
6.32
6.43
6.08
5.56
5.42
5.37
5.45
5.08
5.41
6.11
6.23
5.90
5.45
5.34
5.49
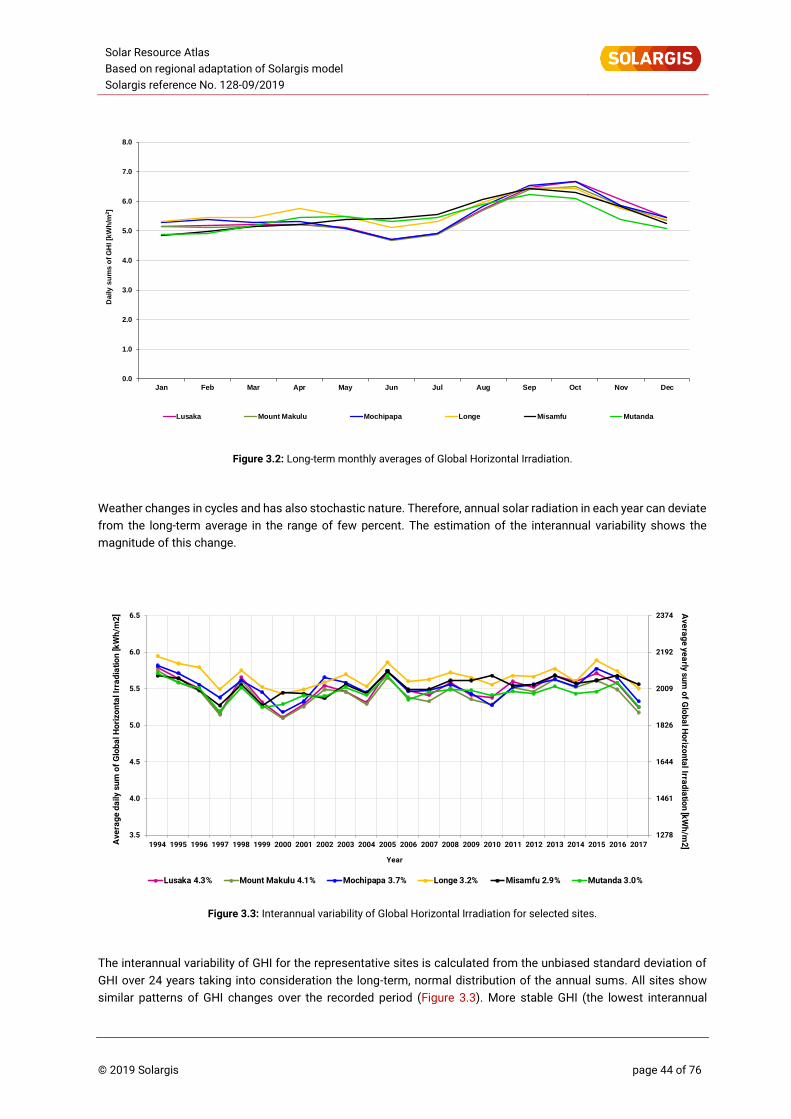
Solar Resource Atlas
Based on regional adaptation of Solargis model
Solargis reference No. 128-09/2019
© 2019 Solargis page 44 of 76
Figure 3.2: Long-term monthly averages of Global Horizontal Irradiation.
Weather changes in cycles and has also stochastic nature. Therefore, annual solar radiation in each year can deviate
from the long-term average in the range of few percent. The estimation of the interannual variability shows the
magnitude of this change.
Figure 3.3: Interannual variability of Global Horizontal Irradiation for selected sites.
The interannual variability of GHI for the representative sites is calculated from the unbiased standard deviation of
GHI over 24 years taking into consideration the long-term, normal distribution of the annual sums. All sites show
similar patterns of GHI changes over the recorded period (Figure 3.3). More stable GHI (the lowest interannual
0.0
1.0
2.0
3.0
4.0
5.0
6.0
7.0
8.0
Jan Feb Mar Apr May Jun Jul Aug Sep Oct Nov Dec
Da
ily
su
ms
of
GH
I [k
Wh
/m2]
Lusaka Mount Makulu Mochipapa Longe Misamfu Mutanda
1278
1461
1644
1826
2009
2192
2374
3.5
4.0
4.5
5.0
5.5
6.0
6.5
1994 1995 1996 1997 1998 1999 2000 2001 2002 2003 2004 2005 2006 2007 2008 2009 2010 2011 2012 2013 2014 2015 2016 2017
Ave
rag
e ye
arly
su
m o
f Glo
ba
l Ho
rizo
nta
l Irrad
iatio
n [k
Wh
/m2
]Ave
rag
e d
aily
su
m o
f G
lob
al H
ori
zon
tal I
rra
dia
tio
n [
kW
h/m
2]
Year
Lusaka 4.3% Mount Makulu 4.1% Mochipapa 3.7% Longe 3.2% Misamfu 2.9% Mutanda 3.0%
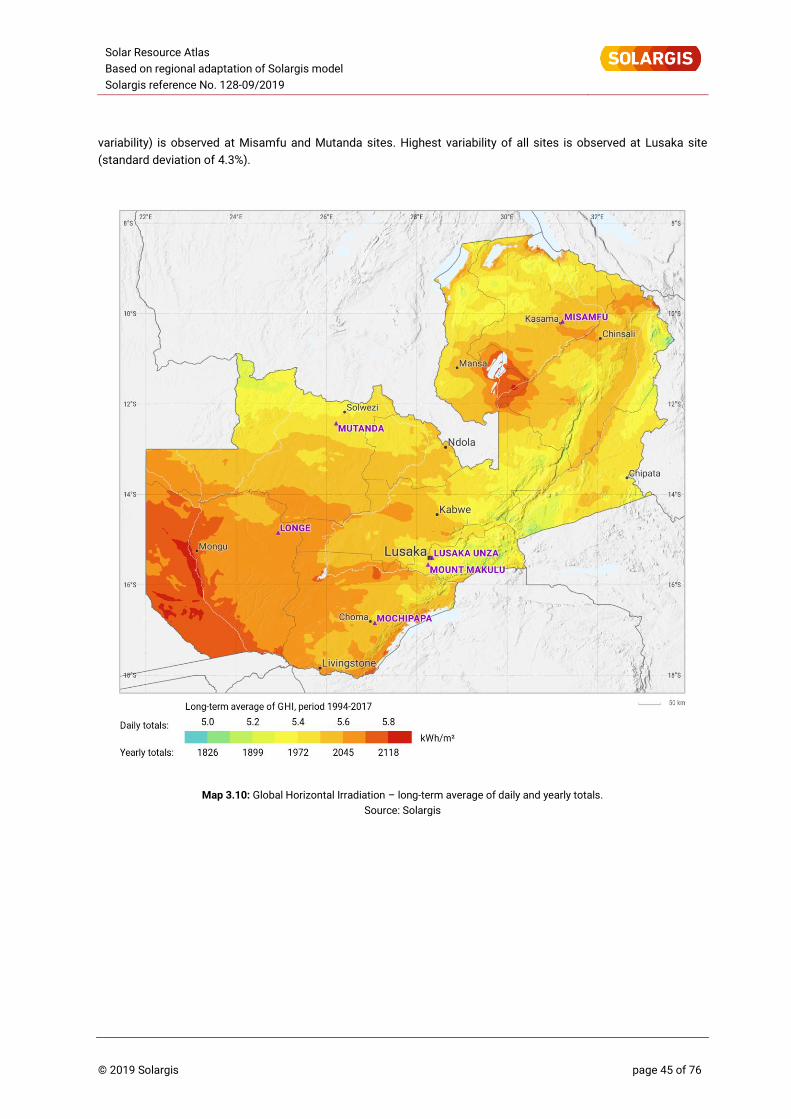
Solar Resource Atlas
Based on regional adaptation of Solargis model
Solargis reference No. 128-09/2019
© 2019 Solargis page 45 of 76
variability) is observed at Misamfu and Mutanda sites. Highest variability of all sites is observed at Lusaka site
(standard deviation of 4.3%).
Map 3.10: Global Horizontal Irradiation – long-term average of daily and yearly totals.
Source: Solargis
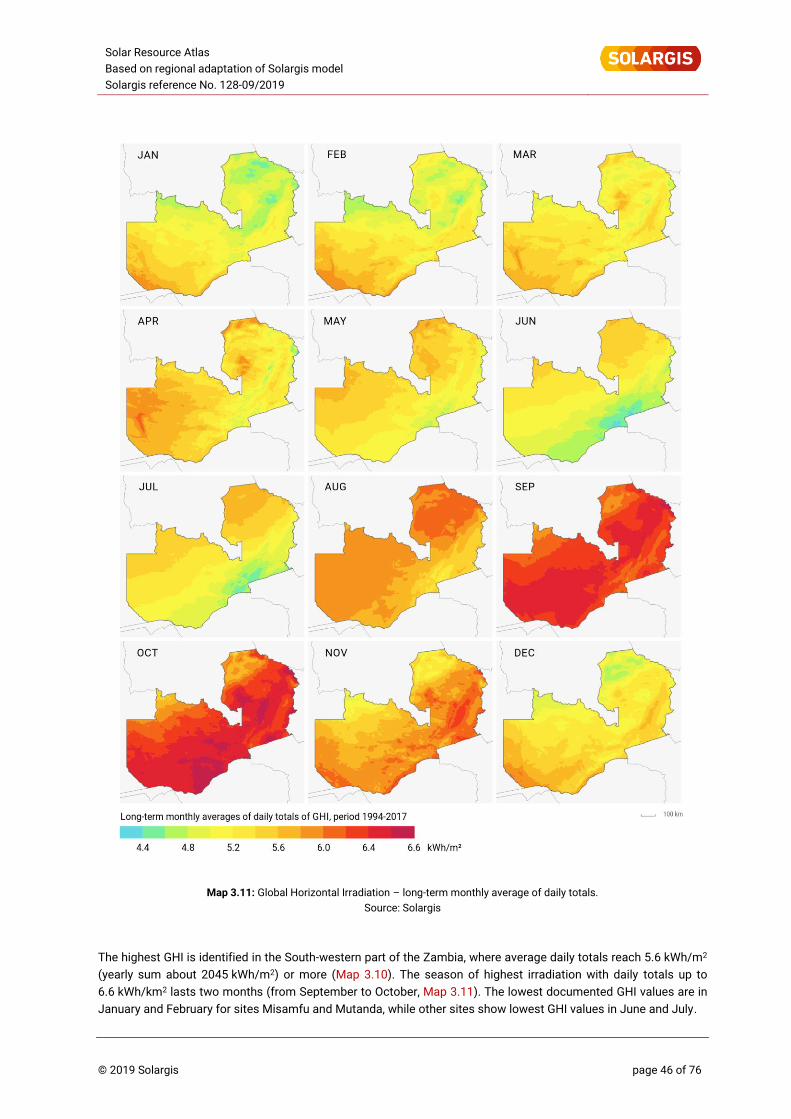
Solar Resource Atlas
Based on regional adaptation of Solargis model
Solargis reference No. 128-09/2019
© 2019 Solargis page 46 of 76
Map 3.11: Global Horizontal Irradiation – long-term monthly average of daily totals.
Source: Solargis
The highest GHI is identified in the South-western part of the Zambia, where average daily totals reach 5.6 kWh/m2
(yearly sum about 2045 kWh/m2) or more (Map 3.10). The season of highest irradiation with daily totals up to
6.6 kWh/km2 lasts two months (from September to October, Map 3.11). The lowest documented GHI values are in
January and February for sites Misamfu and Mutanda, while other sites show lowest GHI values in June and July.
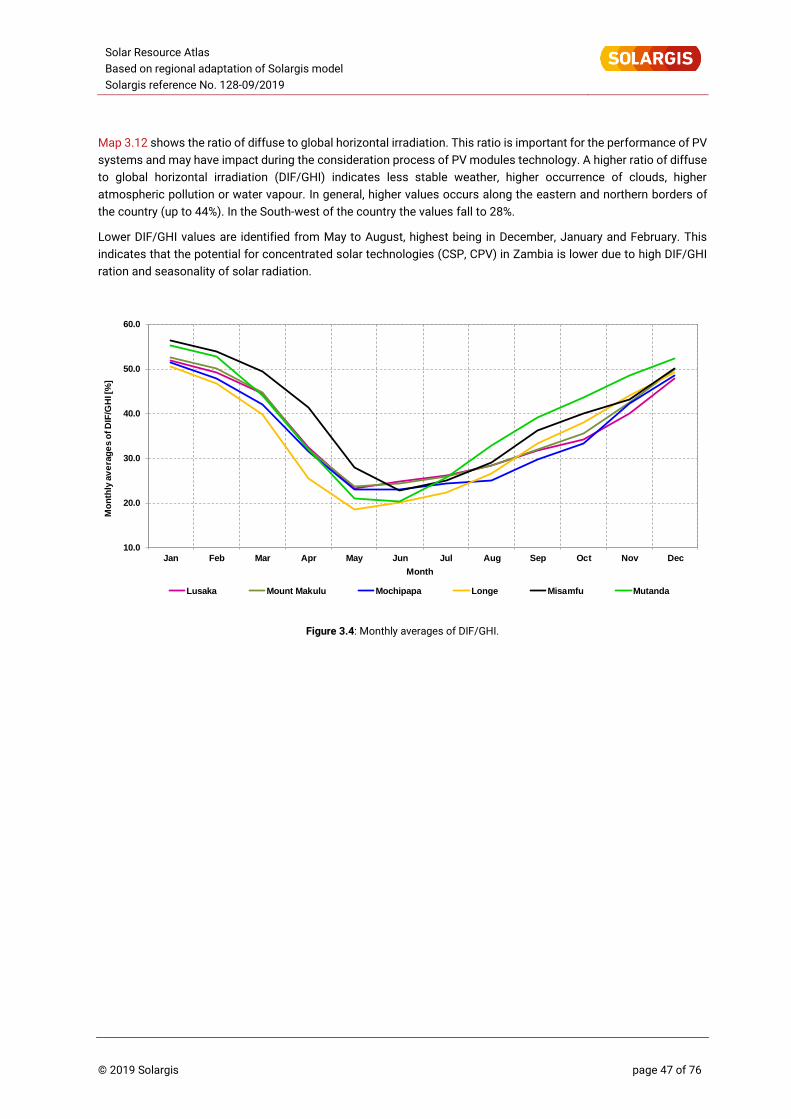
Solar Resource Atlas
Based on regional adaptation of Solargis model
Solargis reference No. 128-09/2019
© 2019 Solargis page 47 of 76
Map 3.12 shows the ratio of diffuse to global horizontal irradiation. This ratio is important for the performance of PV
systems and may have impact during the consideration process of PV modules technology. A higher ratio of diffuse
to global horizontal irradiation (DIF/GHI) indicates less stable weather, higher occurrence of clouds, higher
atmospheric pollution or water vapour. In general, higher values occurs along the eastern and northern borders of
the country (up to 44%). In the South-west of the country the values fall to 28%.
Lower DIF/GHI values are identified from May to August, highest being in December, January and February. This
indicates that the potential for concentrated solar technologies (CSP, CPV) in Zambia is lower due to high DIF/GHI
ration and seasonality of solar radiation.
Figure 3.4: Monthly averages of DIF/GHI.
10.0
20.0
30.0
40.0
50.0
60.0
Jan Feb Mar Apr May Jun Jul Aug Sep Oct Nov Dec
Mo
nth
ly a
ve
rag
es o
f D
IF/G
HI [
%]
Month
Lusaka Mount Makulu Mochipapa Longe Misamfu Mutanda
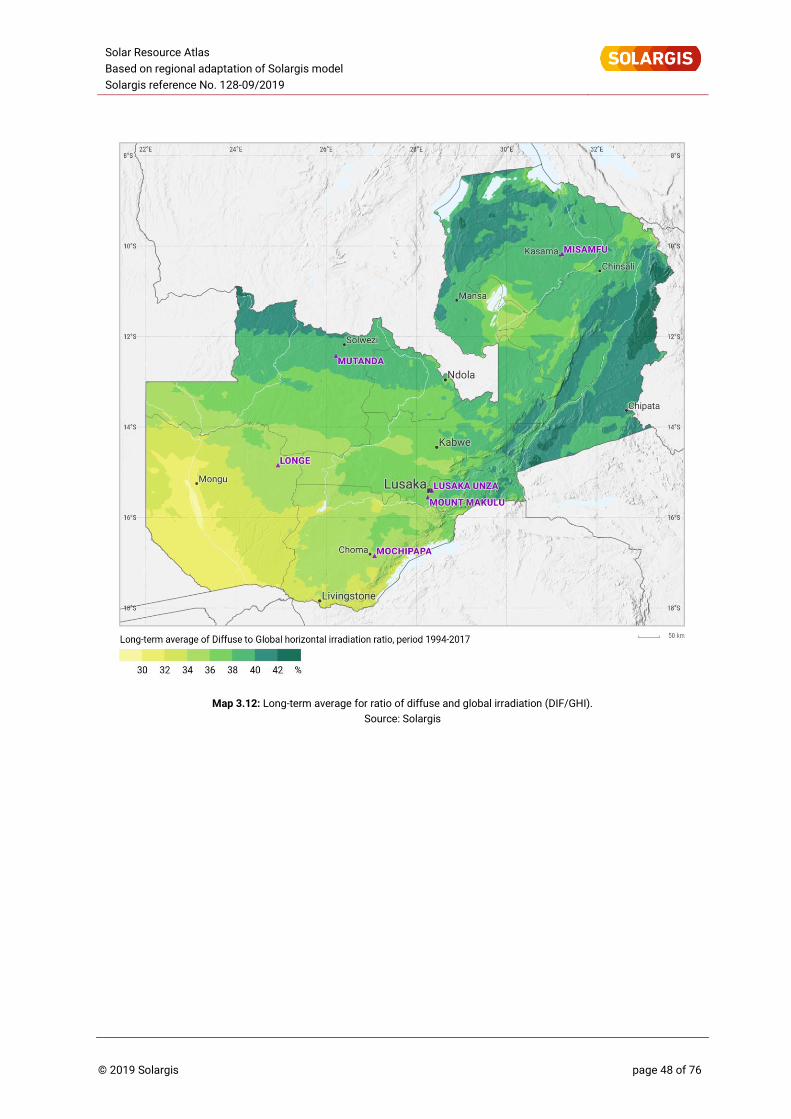
Solar Resource Atlas
Based on regional adaptation of Solargis model
Solargis reference No. 128-09/2019
© 2019 Solargis page 48 of 76
Map 3.12: Long-term average for ratio of diffuse and global irradiation (DIF/GHI).
Source: Solargis
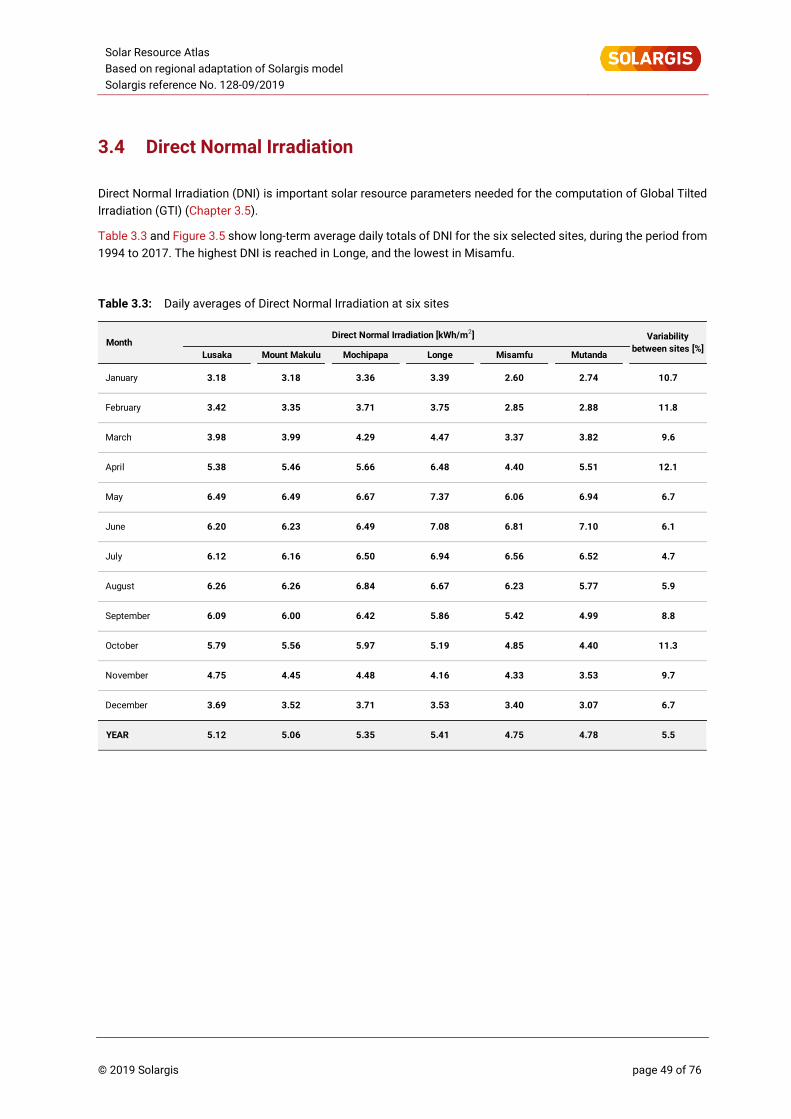
Solar Resource Atlas
Based on regional adaptation of Solargis model
Solargis reference No. 128-09/2019
© 2019 Solargis page 49 of 76
3.4 Direct Normal Irradiation
Direct Normal Irradiation (DNI) is important solar resource parameters needed for the computation of Global Tilted
Irradiation (GTI) (Chapter 3.5).
Table 3.3 and Figure 3.5 show long-term average daily totals of DNI for the six selected sites, during the period from
1994 to 2017. The highest DNI is reached in Longe, and the lowest in Misamfu.
Table 3.3: Daily averages of Direct Normal Irradiation at six sites
February 11.83.42 3.35
January 10.7
MonthVariability
between sites [%]Lusaka Mount Makulu Mochipapa Longe Misamfu Mutanda
Direct Normal Irradiation [kWh/m2]
3.18 3.18
3.75
March 9.6
April 12.15.38
3.98
5.46
3.99
5.66 6.48
4.47
5.51
3.82
May 6.7
June 6.16.20
6.49
6.23
6.49
7.08
7.37
7.10
6.94
July 4.7
August 5.96.26
6.16
6.26
6.12
6.67
6.94
5.77
6.52
September 8.8
October 11.35.56
6.00
5.79
6.09
5.19
5.86 4.99
YEAR 5.55.065.12 4.755.35
November 9.7
December 6.73.52
4.45
3.69
4.75
5.41
3.53
4.16
6.06
4.40
3.37
2.85
2.60
4.78
3.07
3.53
4.40
2.88
2.74
3.71
4.48
5.97
6.42
6.84
6.50
6.49
6.67
3.39
3.40
4.33
4.85
5.42
6.23
6.56
6.81
4.29
3.71
3.36
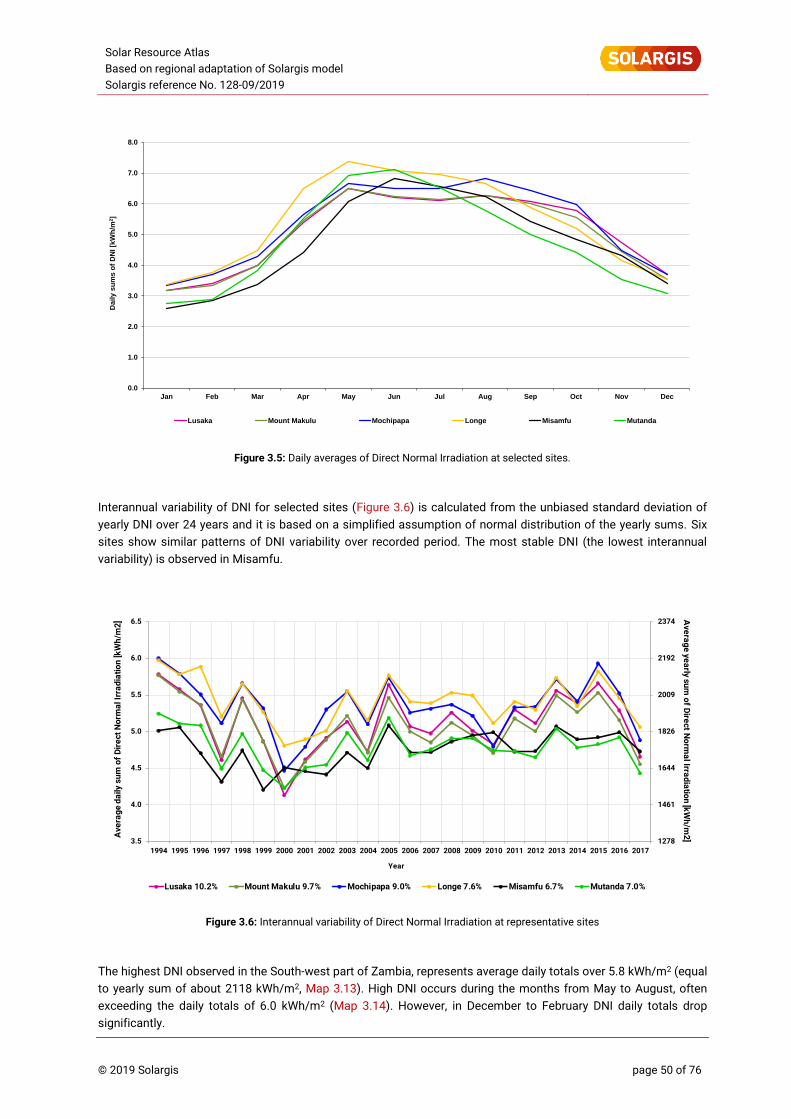
Solar Resource Atlas
Based on regional adaptation of Solargis model
Solargis reference No. 128-09/2019
© 2019 Solargis page 50 of 76
Figure 3.5: Daily averages of Direct Normal Irradiation at selected sites.
Interannual variability of DNI for selected sites (Figure 3.6) is calculated from the unbiased standard deviation of
yearly DNI over 24 years and it is based on a simplified assumption of normal distribution of the yearly sums. Six
sites show similar patterns of DNI variability over recorded period. The most stable DNI (the lowest interannual
variability) is observed in Misamfu.
Figure 3.6: Interannual variability of Direct Normal Irradiation at representative sites
The highest DNI observed in the South-west part of Zambia, represents average daily totals over 5.8 kWh/m2 (equal
to yearly sum of about 2118 kWh/m2, Map 3.13). High DNI occurs during the months from May to August, often
exceeding the daily totals of 6.0 kWh/m2 (Map 3.14). However, in December to February DNI daily totals drop
significantly.
0.0
1.0
2.0
3.0
4.0
5.0
6.0
7.0
8.0
Jan Feb Mar Apr May Jun Jul Aug Sep Oct Nov Dec
Da
ily
su
ms
of
DN
I [k
Wh
/m2]
Lusaka Mount Makulu Mochipapa Longe Misamfu Mutanda
1278
1461
1644
1826
2009
2192
2374
3.5
4.0
4.5
5.0
5.5
6.0
6.5
1994 1995 1996 1997 1998 1999 2000 2001 2002 2003 2004 2005 2006 2007 2008 2009 2010 2011 2012 2013 2014 2015 2016 2017
Ave
rag
e y
ea
rly su
m o
f Dire
ct No
rma
lIrra
dia
tion
[kW
h/m
2]A
vera
ge
da
ily s
um
of
Dir
ect
No
rma
l Irr
ad
iati
on
[kW
h/m
2]
Year
Lusaka 10.2% Mount Makulu 9.7% Mochipapa 9.0% Longe 7.6% Misamfu 6.7% Mutanda 7.0%
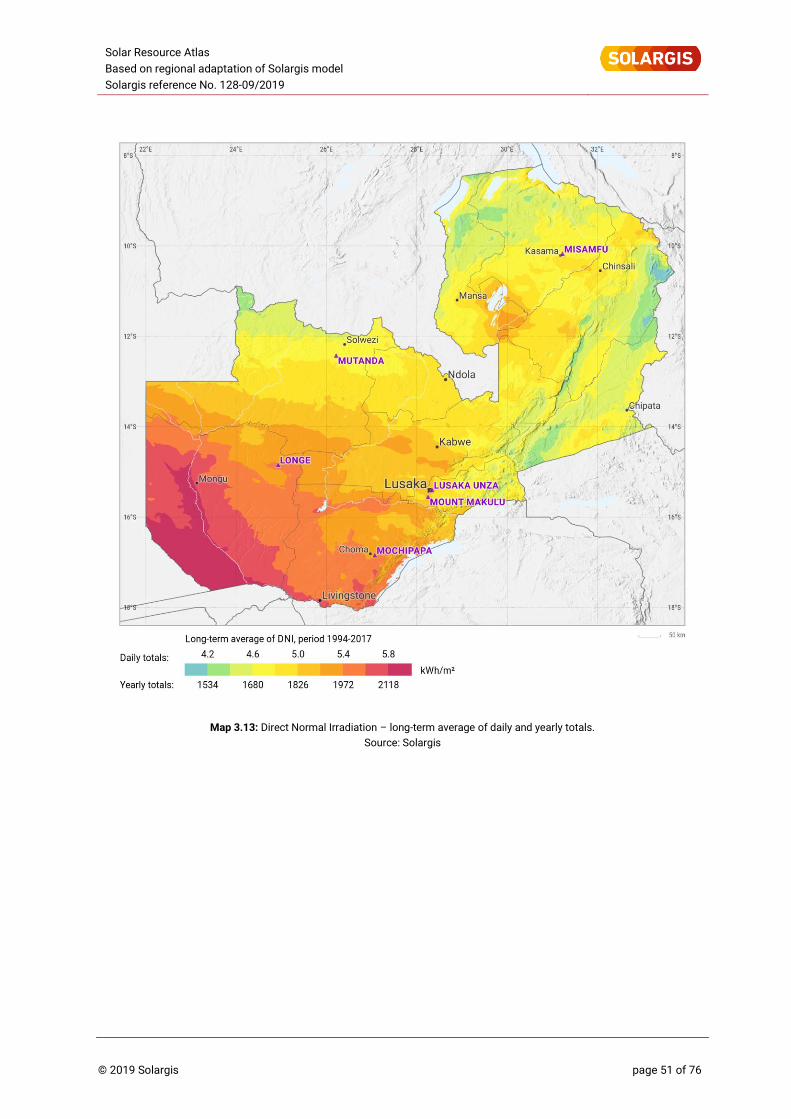
Solar Resource Atlas
Based on regional adaptation of Solargis model
Solargis reference No. 128-09/2019
© 2019 Solargis page 51 of 76
Map 3.13: Direct Normal Irradiation – long-term average of daily and yearly totals.
Source: Solargis
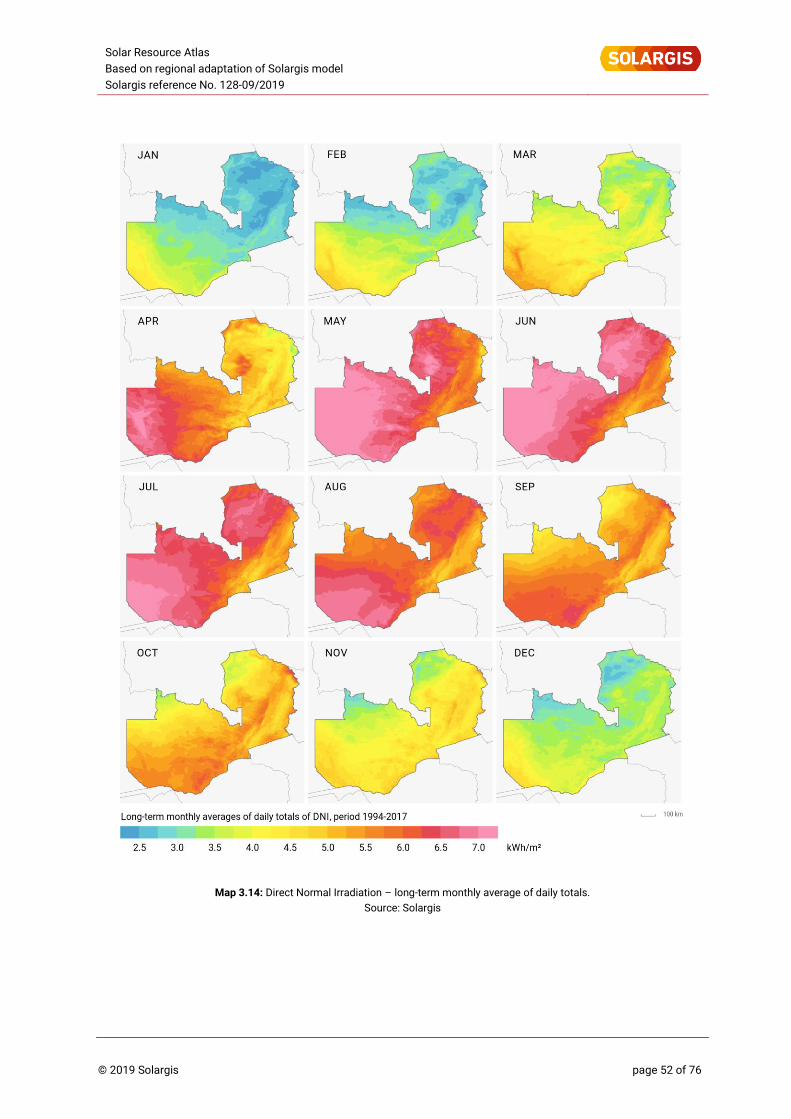
Solar Resource Atlas
Based on regional adaptation of Solargis model
Solargis reference No. 128-09/2019
© 2019 Solargis page 52 of 76
Map 3.14: Direct Normal Irradiation – long-term monthly average of daily totals.
Source: Solargis
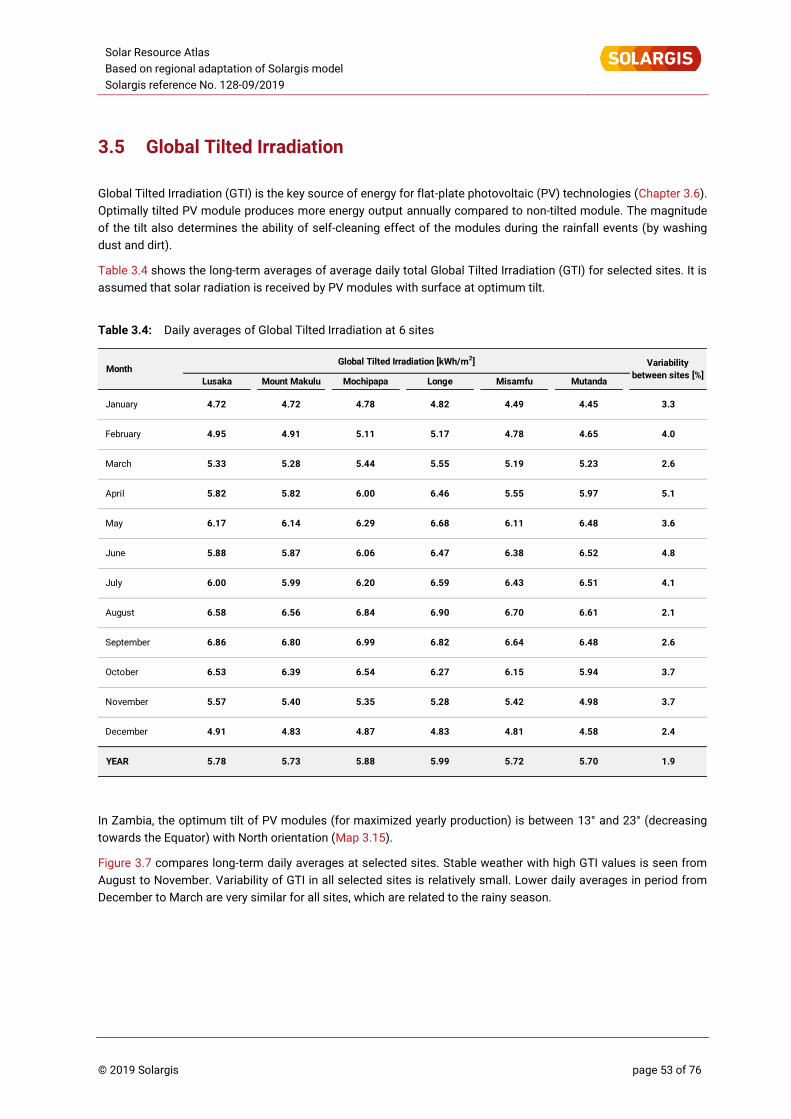
Solar Resource Atlas
Based on regional adaptation of Solargis model
Solargis reference No. 128-09/2019
© 2019 Solargis page 53 of 76
3.5 Global Tilted Irradiation
Global Tilted Irradiation (GTI) is the key source of energy for flat-plate photovoltaic (PV) technologies (Chapter 3.6).
Optimally tilted PV module produces more energy output annually compared to non-tilted module. The magnitude
of the tilt also determines the ability of self-cleaning effect of the modules during the rainfall events (by washing
dust and dirt).
Table 3.4 shows the long-term averages of average daily total Global Tilted Irradiation (GTI) for selected sites. It is
assumed that solar radiation is received by PV modules with surface at optimum tilt.
Table 3.4: Daily averages of Global Tilted Irradiation at 6 sites
In Zambia, the optimum tilt of PV modules (for maximized yearly production) is between 13° and 23° (decreasing
towards the Equator) with North orientation (Map 3.15).
Figure 3.7 compares long-term daily averages at selected sites. Stable weather with high GTI values is seen from
August to November. Variability of GTI in all selected sites is relatively small. Lower daily averages in period from
December to March are very similar for all sites, which are related to the rainy season.
4.72
February 4.04.95 5.114.91
January 3.3
MonthVariability
between sites [%]Lusaka Mount Makulu Mochipapa Longe Misamfu Mutanda
4.72 4.78
March 2.6
April 5.15.82
5.33 5.28 5.44
5.555.82 6.00
5.19 5.23
May 3.6
June 4.85.88
6.17
5.87
6.14
6.06
6.29
July 4.1
August 2.16.58
6.00
6.56
5.99
6.84
6.20
2.6
October 3.76.53
6.86September
6.39
6.80
6.54
6.99
YEAR 1.95.78 5.885.73 5.72 5.70
November 3.7
December 2.44.91
5.57
4.874.83
5.40 5.35
Global Tilted Irradiation [kWh/m2]
4.78
4.49
5.99
4.83
5.28
6.27
6.90
6.82
6.59
6.47
6.68
6.46
5.55
5.17
4.82
4.81
5.42
6.15
6.64
6.70
6.43
6.38
6.11
4.65
4.45
4.58
4.98
5.94
6.48
6.61
6.51
6.52
6.48
5.97
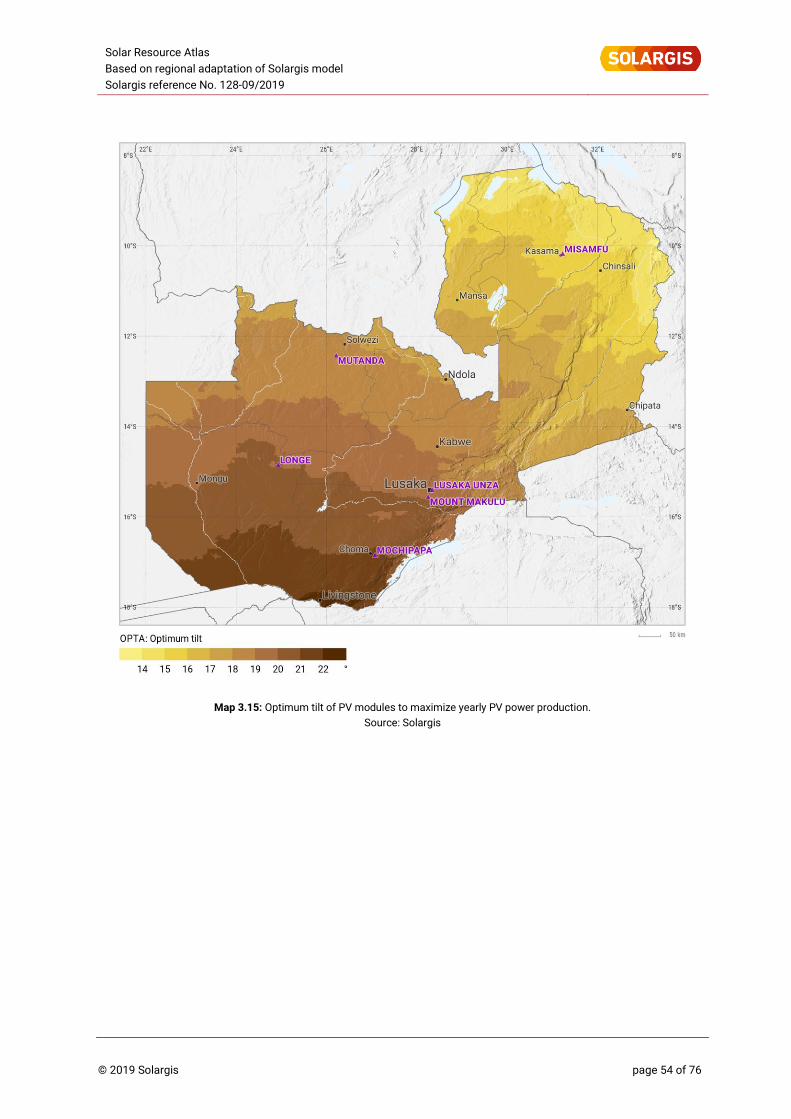
Solar Resource Atlas
Based on regional adaptation of Solargis model
Solargis reference No. 128-09/2019
© 2019 Solargis page 54 of 76
Map 3.15: Optimum tilt of PV modules to maximize yearly PV power production.
Source: Solargis
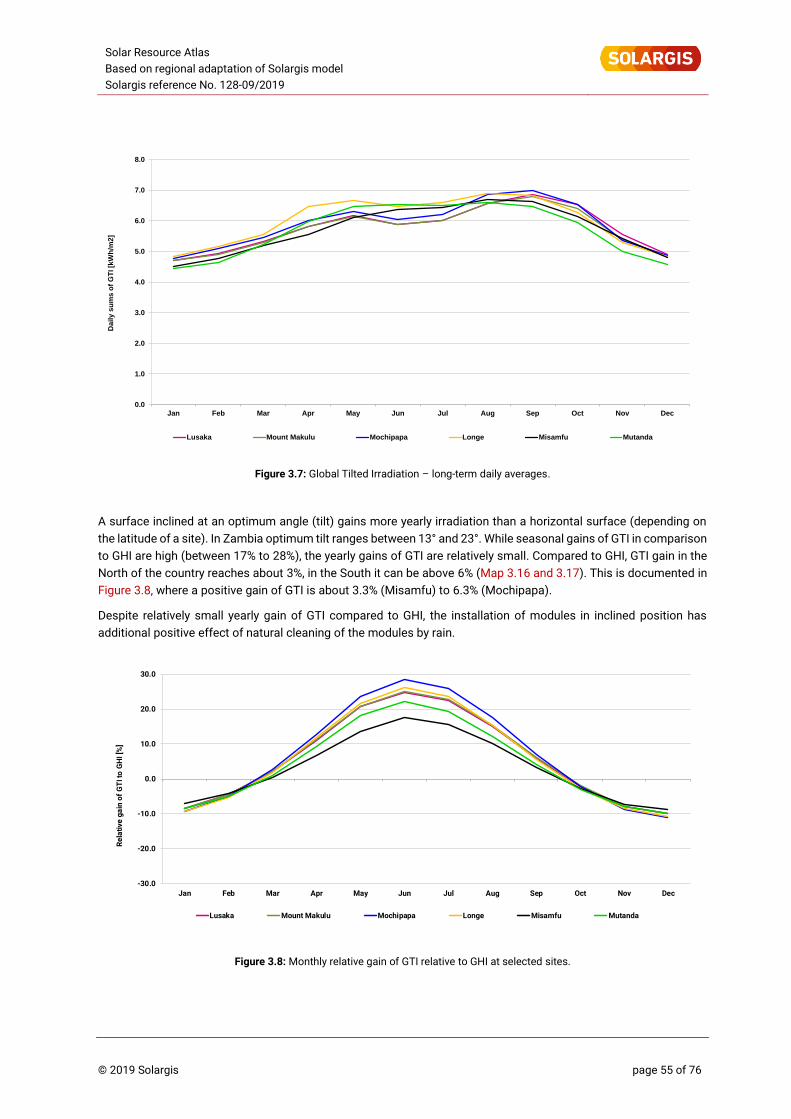
Solar Resource Atlas
Based on regional adaptation of Solargis model
Solargis reference No. 128-09/2019
© 2019 Solargis page 55 of 76
Figure 3.7: Global Tilted Irradiation – long-term daily averages.
A surface inclined at an optimum angle (tilt) gains more yearly irradiation than a horizontal surface (depending on
the latitude of a site). In Zambia optimum tilt ranges between 13° and 23°. While seasonal gains of GTI in comparison
to GHI are high (between 17% to 28%), the yearly gains of GTI are relatively small. Compared to GHI, GTI gain in the
North of the country reaches about 3%, in the South it can be above 6% (Map 3.16 and 3.17). This is documented in
Figure 3.8, where a positive gain of GTI is about 3.3% (Misamfu) to 6.3% (Mochipapa).
Despite relatively small yearly gain of GTI compared to GHI, the installation of modules in inclined position has
additional positive effect of natural cleaning of the modules by rain.
Figure 3.8: Monthly relative gain of GTI relative to GHI at selected sites.
0.0
1.0
2.0
3.0
4.0
5.0
6.0
7.0
8.0
Jan Feb Mar Apr May Jun Jul Aug Sep Oct Nov Dec
Da
ily
su
ms
of
GT
I[k
Wh
/m2
]
Lusaka Mount Makulu Mochipapa Longe Misamfu Mutanda
-30.0
-20.0
-10.0
0.0
10.0
20.0
30.0
Jan Feb Mar Apr May Jun Jul Aug Sep Oct Nov Dec
Re
lati
ve g
ain
of
GT
I to
GH
I [%
]
Lusaka Mount Makulu Mochipapa Longe Misamfu Mutanda
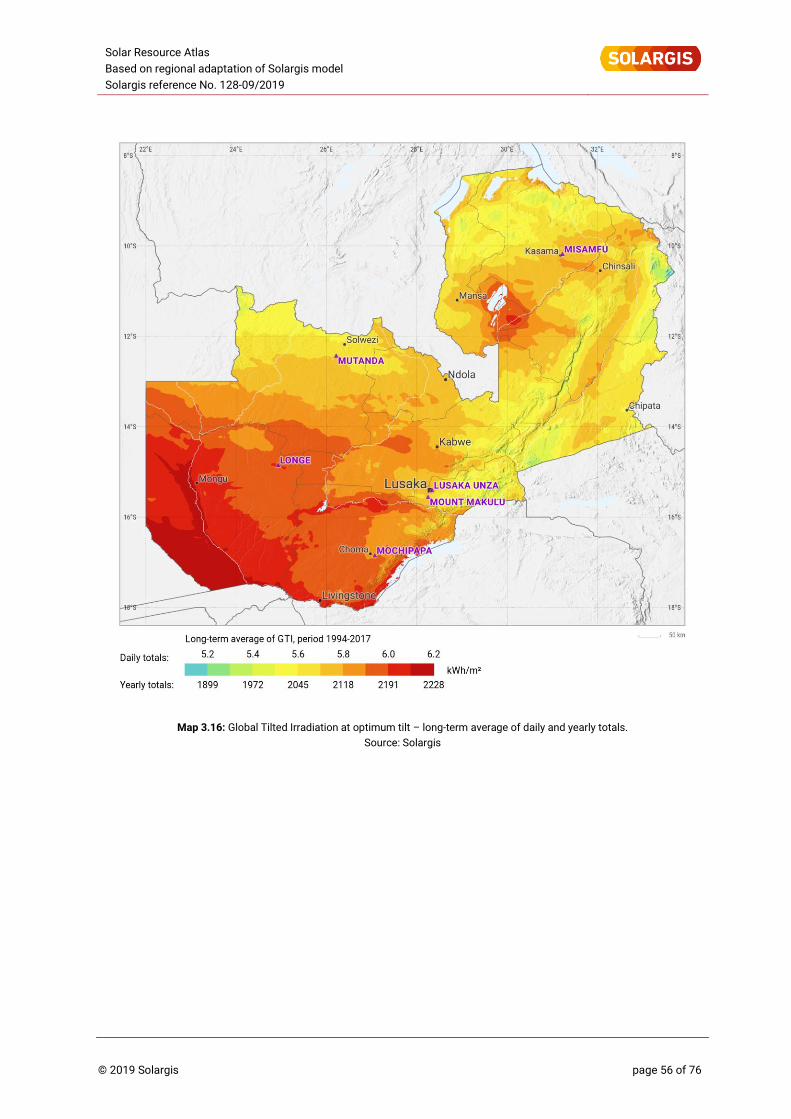
Solar Resource Atlas
Based on regional adaptation of Solargis model
Solargis reference No. 128-09/2019
© 2019 Solargis page 56 of 76
Map 3.16: Global Tilted Irradiation at optimum tilt – long-term average of daily and yearly totals.
Source: Solargis
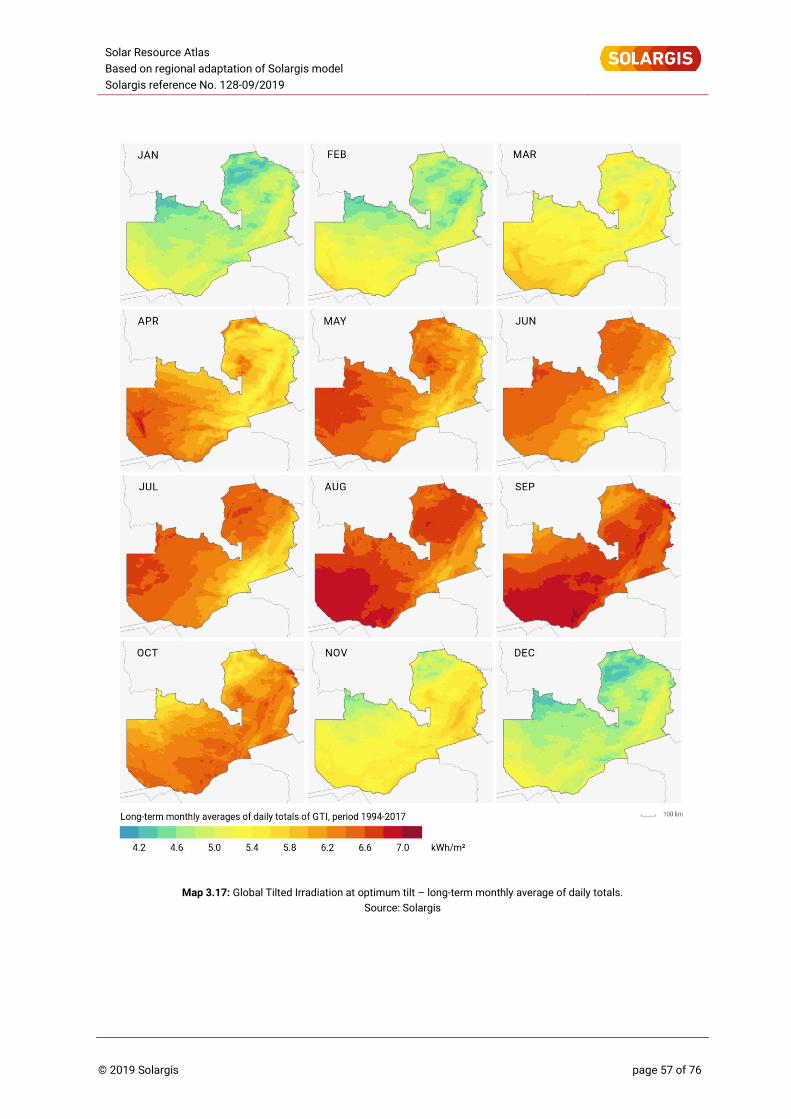
Solar Resource Atlas
Based on regional adaptation of Solargis model
Solargis reference No. 128-09/2019
© 2019 Solargis page 57 of 76
Map 3.17: Global Tilted Irradiation at optimum tilt – long-term monthly average of daily totals.
Source: Solargis
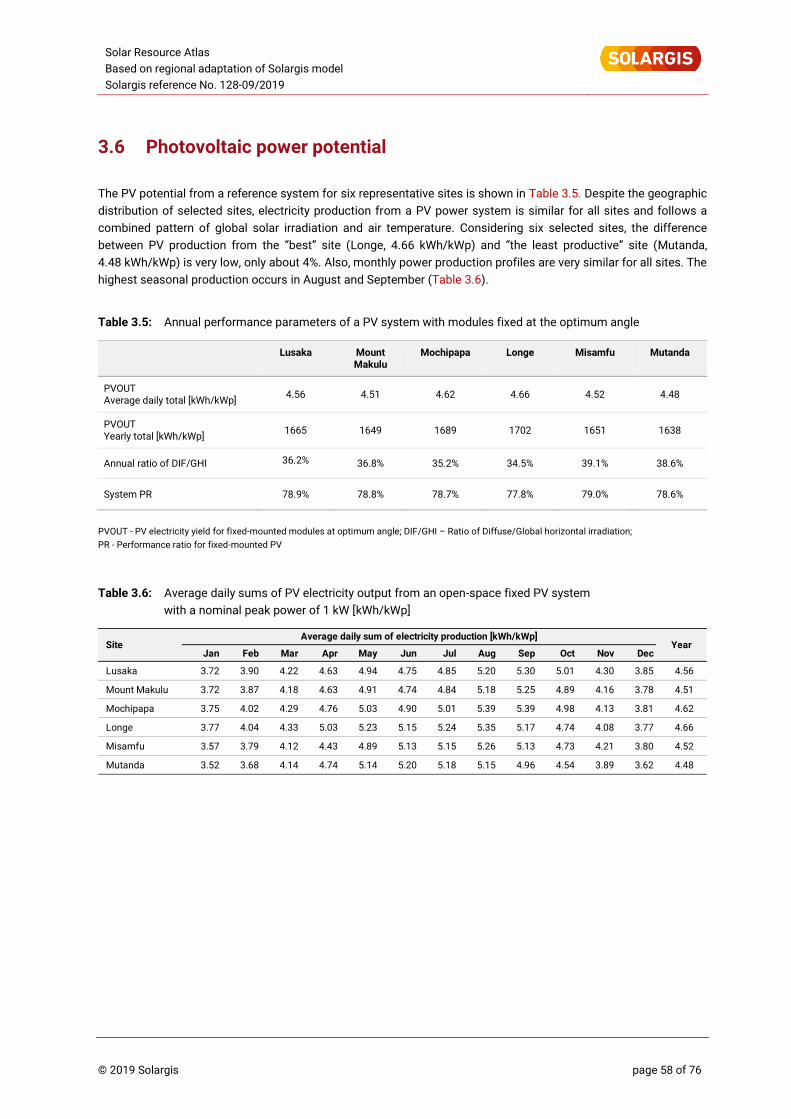
Solar Resource Atlas
Based on regional adaptation of Solargis model
Solargis reference No. 128-09/2019
© 2019 Solargis page 58 of 76
3.6 Photovoltaic power potential
The PV potential from a reference system for six representative sites is shown in Table 3.5. Despite the geographic
distribution of selected sites, electricity production from a PV power system is similar for all sites and follows a
combined pattern of global solar irradiation and air temperature. Considering six selected sites, the difference
between PV production from the “best” site (Longe, 4.66 kWh/kWp) and “the least productive” site (Mutanda,
4.48 kWh/kWp) is very low, only about 4%. Also, monthly power production profiles are very similar for all sites. The
highest seasonal production occurs in August and September (Table 3.6).
Table 3.5: Annual performance parameters of a PV system with modules fixed at the optimum angle
Lusaka Mount Makulu
Mochipapa Longe Misamfu Mutanda
PVOUT Average daily total [kWh/kWp]
4.56 4.51 4.62 4.66 4.52 4.48
PVOUT Yearly total [kWh/kWp]
1665 1649 1689 1702 1651 1638
Annual ratio of DIF/GHI 36.2% 36.8% 35.2% 34.5% 39.1% 38.6%
System PR 78.9% 78.8% 78.7% 77.8% 79.0% 78.6%
PVOUT - PV electricity yield for fixed-mounted modules at optimum angle; DIF/GHI – Ratio of Diffuse/Global horizontal irradiation;
PR - Performance ratio for fixed-mounted PV
Table 3.6: Average daily sums of PV electricity output from an open-space fixed PV system
with a nominal peak power of 1 kW [kWh/kWp]
Jan Feb Mar Apr May Jun Jul Aug Sep Oct Nov Dec
Lusaka 3.72 3.90 4.22 4.63 4.94 4.75 4.85 5.20 5.30 5.01 4.30 3.85 4.56
Mount Makulu 3.72 3.87 4.18 4.63 4.91 4.74 4.84 5.18 5.25 4.89 4.16 3.78 4.51
Mochipapa 3.75 4.02 4.29 4.76 5.03 4.90 5.01 5.39 5.39 4.98 4.13 3.81 4.62
Longe 3.77 4.04 4.33 5.03 5.23 5.15 5.24 5.35 5.17 4.74 4.08 3.77 4.66
Misamfu 3.57 3.79 4.12 4.43 4.89 5.13 5.15 5.26 5.13 4.73 4.21 3.80 4.52
Mutanda 3.52 3.68 4.14 4.74 5.14 5.20 5.18 5.15 4.96 4.54 3.89 3.62 4.48
SiteAverage daily sum of electricity production [kWh/kWp]
Year
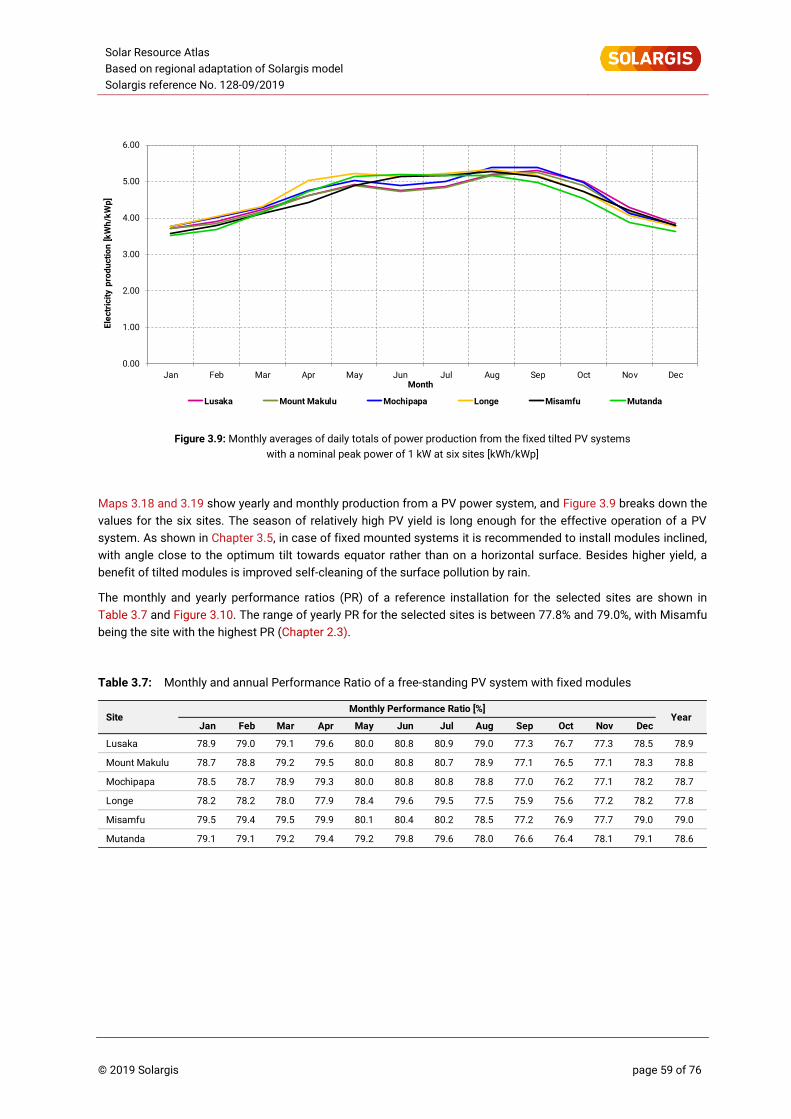
Solar Resource Atlas
Based on regional adaptation of Solargis model
Solargis reference No. 128-09/2019
© 2019 Solargis page 59 of 76
Figure 3.9: Monthly averages of daily totals of power production from the fixed tilted PV systems
with a nominal peak power of 1 kW at six sites [kWh/kWp]
Maps 3.18 and 3.19 show yearly and monthly production from a PV power system, and Figure 3.9 breaks down the
values for the six sites. The season of relatively high PV yield is long enough for the effective operation of a PV
system. As shown in Chapter 3.5, in case of fixed mounted systems it is recommended to install modules inclined,
with angle close to the optimum tilt towards equator rather than on a horizontal surface. Besides higher yield, a
benefit of tilted modules is improved self-cleaning of the surface pollution by rain.
The monthly and yearly performance ratios (PR) of a reference installation for the selected sites are shown in
Table 3.7 and Figure 3.10. The range of yearly PR for the selected sites is between 77.8% and 79.0%, with Misamfu
being the site with the highest PR (Chapter 2.3).
Table 3.7: Monthly and annual Performance Ratio of a free-standing PV system with fixed modules
0.00
1.00
2.00
3.00
4.00
5.00
6.00
Jan Feb Mar Apr May Jun Jul Aug Sep Oct Nov Dec
Ele
ctr
icit
y p
rod
uc
tio
n [
kW
h/k
Wp
]
Month
Lusaka Mount Makulu Mochipapa Longe Misamfu Mutanda
Jan Feb Mar Apr May Jun Jul Aug Sep Oct Nov Dec
Lusaka 78.9 79.0 79.1 79.6 80.0 80.8 80.9 79.0 77.3 76.7 77.3 78.5 78.9
Mount Makulu 78.7 78.8 79.2 79.5 80.0 80.8 80.7 78.9 77.1 76.5 77.1 78.3 78.8
Mochipapa 78.5 78.7 78.9 79.3 80.0 80.8 80.8 78.8 77.0 76.2 77.1 78.2 78.7
Longe 78.2 78.2 78.0 77.9 78.4 79.6 79.5 77.5 75.9 75.6 77.2 78.2 77.8
Misamfu 79.5 79.4 79.5 79.9 80.1 80.4 80.2 78.5 77.2 76.9 77.7 79.0 79.0
Mutanda 79.1 79.1 79.2 79.4 79.2 79.8 79.6 78.0 76.6 76.4 78.1 79.1 78.6
YearMonthly Performance Ratio [%]
Site
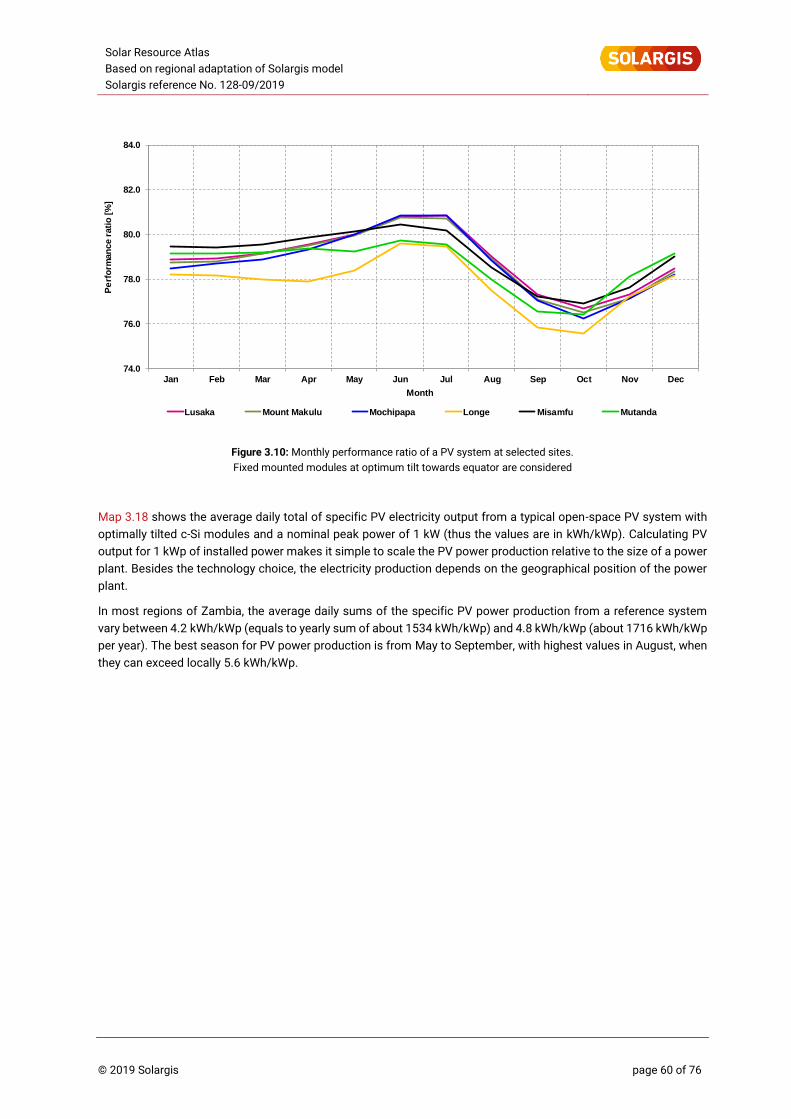
Solar Resource Atlas
Based on regional adaptation of Solargis model
Solargis reference No. 128-09/2019
© 2019 Solargis page 60 of 76
Figure 3.10: Monthly performance ratio of a PV system at selected sites.
Fixed mounted modules at optimum tilt towards equator are considered
Map 3.18 shows the average daily total of specific PV electricity output from a typical open-space PV system with
optimally tilted c-Si modules and a nominal peak power of 1 kW (thus the values are in kWh/kWp). Calculating PV
output for 1 kWp of installed power makes it simple to scale the PV power production relative to the size of a power
plant. Besides the technology choice, the electricity production depends on the geographical position of the power
plant.
In most regions of Zambia, the average daily sums of the specific PV power production from a reference system
vary between 4.2 kWh/kWp (equals to yearly sum of about 1534 kWh/kWp) and 4.8 kWh/kWp (about 1716 kWh/kWp
per year). The best season for PV power production is from May to September, with highest values in August, when
they can exceed locally 5.6 kWh/kWp.
74.0
76.0
78.0
80.0
82.0
84.0
Jan Feb Mar Apr May Jun Jul Aug Sep Oct Nov Dec
Pe
rfo
rman
ce
rati
o [
%]
Month
Lusaka Mount Makulu Mochipapa Longe Misamfu Mutanda
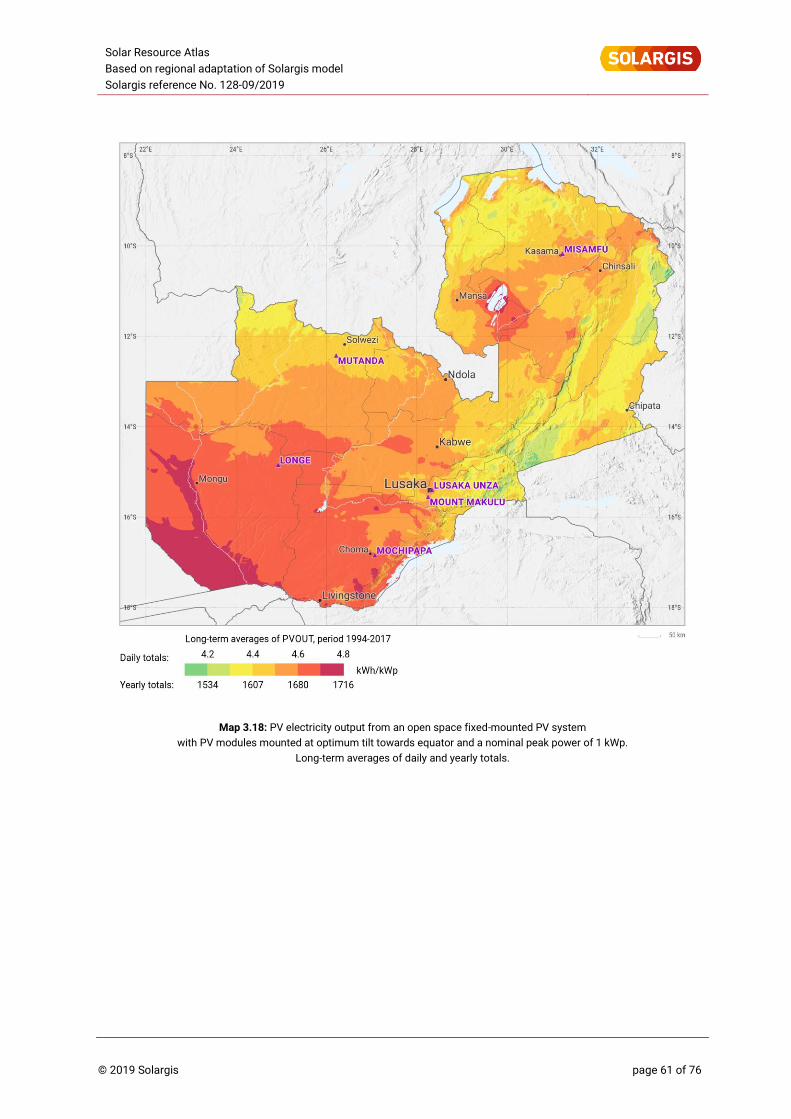
Solar Resource Atlas
Based on regional adaptation of Solargis model
Solargis reference No. 128-09/2019
© 2019 Solargis page 61 of 76
Map 3.18: PV electricity output from an open space fixed-mounted PV system
with PV modules mounted at optimum tilt towards equator and a nominal peak power of 1 kWp.
Long-term averages of daily and yearly totals.
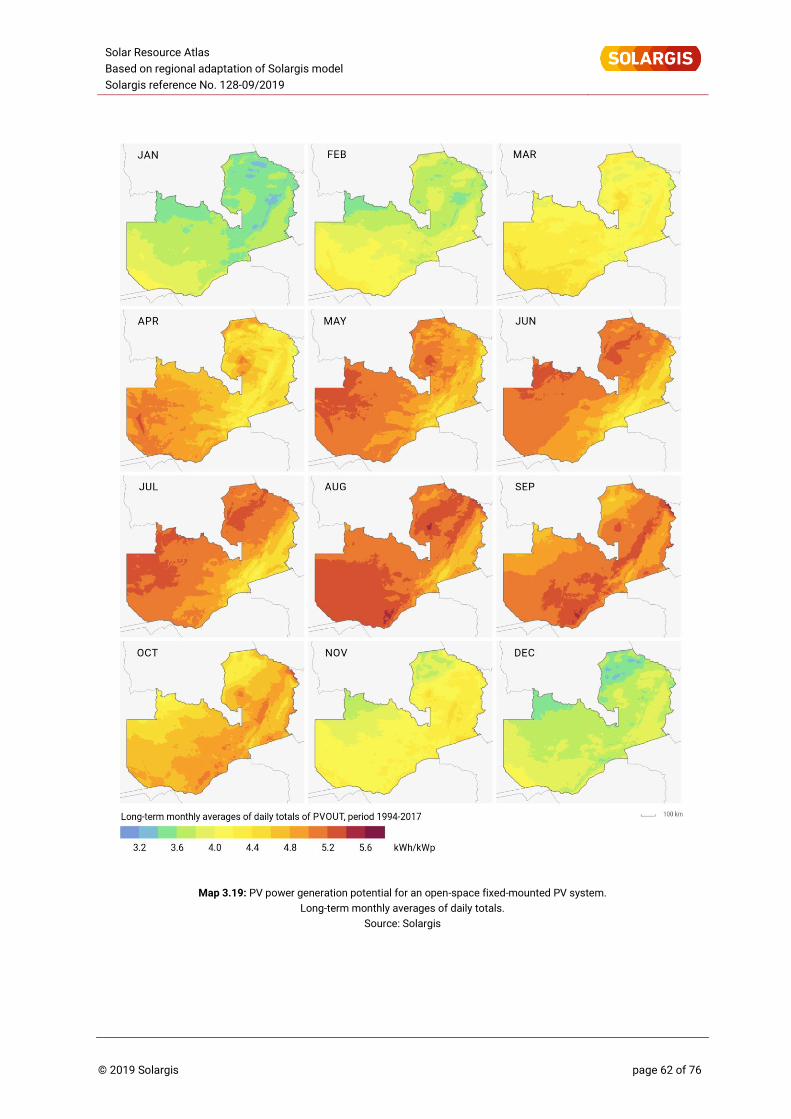
Solar Resource Atlas
Based on regional adaptation of Solargis model
Solargis reference No. 128-09/2019
© 2019 Solargis page 62 of 76
Map 3.19: PV power generation potential for an open-space fixed-mounted PV system.
Long-term monthly averages of daily totals.
Source: Solargis
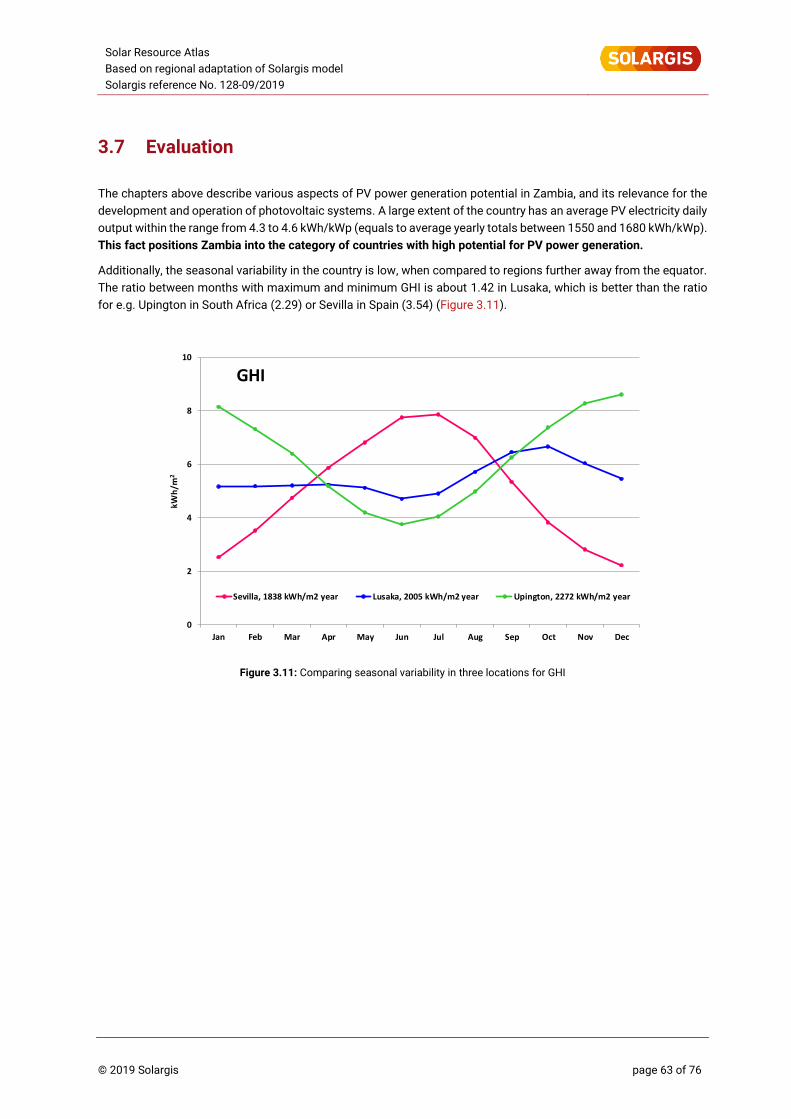
Solar Resource Atlas
Based on regional adaptation of Solargis model
Solargis reference No. 128-09/2019
© 2019 Solargis page 63 of 76
3.7 Evaluation
The chapters above describe various aspects of PV power generation potential in Zambia, and its relevance for the
development and operation of photovoltaic systems. A large extent of the country has an average PV electricity daily
output within the range from 4.3 to 4.6 kWh/kWp (equals to average yearly totals between 1550 and 1680 kWh/kWp).
This fact positions Zambia into the category of countries with high potential for PV power generation.
Additionally, the seasonal variability in the country is low, when compared to regions further away from the equator.
The ratio between months with maximum and minimum GHI is about 1.42 in Lusaka, which is better than the ratio
for e.g. Upington in South Africa (2.29) or Sevilla in Spain (3.54) (Figure 3.11).
Figure 3.11: Comparing seasonal variability in three locations for GHI
0
2
4
6
8
10
Jan Feb Mar Apr May Jun Jul Aug Sep Oct Nov Dec
kW
h/m
2
GHI
Sevilla, 1838 kWh/m2 year Lusaka, 2005 kWh/m2 year Upington, 2272 kWh/m2 year
Solar Resource Atlas
Based on regional adaptation of Solargis model
Solargis reference No. 128-09/2019
© 2019 Solargis page 64 of 76
4 Data delivered for Zambia
The following data and maps are delivered for Zambia:
1. Site-specific time series and TMY data
The data for six sites, corresponding to the locations of solar meteorological stations, can be accessed through the
web site https://energydata.info/:
• High accuracy 1-minute measurements (time series) acquired over a period of 24 months (2015-2017)
• High accuracy site-adapted 15-minute historical time series and hourly Typical Meteorological Year (TMY)
data generated by the Solargis model. The data represent history of years 1994 to 2017
2. Country-wide spatial data (GIS files) and maps
These outputs can be accessed as downloadable GIS files and maps through the map-based web application
https://globalsolaratlas.info/:
• Harmonized solar and meteorological GIS-based data. Regionally adapted solar resource and temperature
data for Zambia. The long-term averages represent history of years 1994 to 2017 at 9 arcsec (nominally
250 m) grid resolution.
• High resolution poster maps and medium size maps
More information about site specific data products is available in [29]. The information about spatial data products
is available in chapters below.
The delivered data and maps offer a good basis for knowledge-based decision making and project development.
Solargis database is updated in real time and this data can be further used in solar monitoring, performance
assessment and forecasting.
4.1 Spatial data products
High-resolution Solargis data have been delivered in the format suitable for common GIS software. The Primary data
represent solar radiation, meteorological data and PV power potential. The Supporting data include various vector
data, such as administrative borders, cities, etc. Tables 4.1 and 4.2 show information about the data layers and the
technical specification is summarized in Tables 4.3 and 4.4. File name convention, used for the individual data sets,
is described in Table 4.5.
Metadata is delivered with the data files in two formats, according to ISO 19115:2003/19139 standards:
• PDF - human readable
• XML - for machine-to-machine communication
The snapshots of most of the data can be viewed on the maps in Chapter 3.
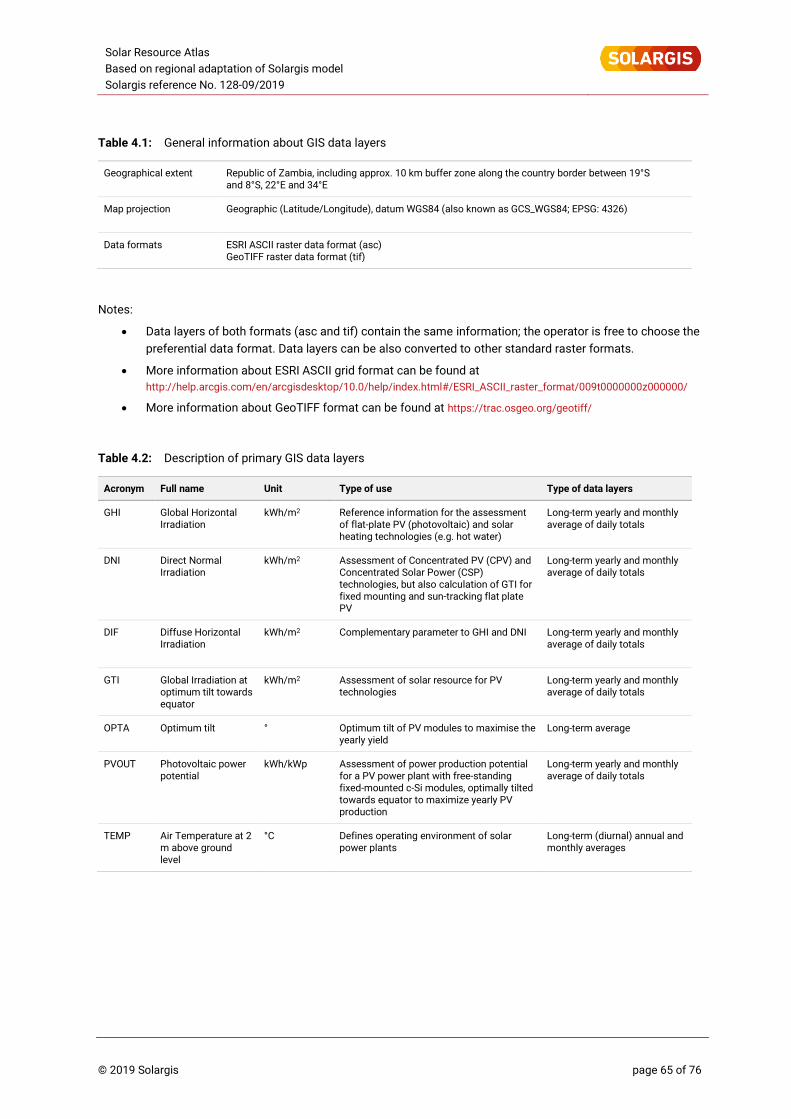
Solar Resource Atlas
Based on regional adaptation of Solargis model
Solargis reference No. 128-09/2019
© 2019 Solargis page 65 of 76
Table 4.1: General information about GIS data layers
Geographical extent
Republic of Zambia, including approx. 10 km buffer zone along the country border between 19°S and 8°S, 22°E and 34°E
Map projection
Geographic (Latitude/Longitude), datum WGS84 (also known as GCS_WGS84; EPSG: 4326)
Data formats
ESRI ASCII raster data format (asc) GeoTIFF raster data format (tif)
Notes:
• Data layers of both formats (asc and tif) contain the same information; the operator is free to choose the
preferential data format. Data layers can be also converted to other standard raster formats.
• More information about ESRI ASCII grid format can be found at
http://help.arcgis.com/en/arcgisdesktop/10.0/help/index.html#/ESRI_ASCII_raster_format/009t0000000z000000/
• More information about GeoTIFF format can be found at https://trac.osgeo.org/geotiff/
Table 4.2: Description of primary GIS data layers
Acronym Full name Unit Type of use Type of data layers
GHI Global Horizontal Irradiation
kWh/m2 Reference information for the assessment of flat-plate PV (photovoltaic) and solar heating technologies (e.g. hot water)
Long-term yearly and monthly average of daily totals
DNI Direct Normal Irradiation
kWh/m2 Assessment of Concentrated PV (CPV) and Concentrated Solar Power (CSP) technologies, but also calculation of GTI for fixed mounting and sun-tracking flat plate PV
Long-term yearly and monthly average of daily totals
DIF Diffuse Horizontal Irradiation
kWh/m2 Complementary parameter to GHI and DNI Long-term yearly and monthly average of daily totals
GTI Global Irradiation at optimum tilt towards equator
kWh/m2 Assessment of solar resource for PV technologies
Long-term yearly and monthly average of daily totals
OPTA Optimum tilt ° Optimum tilt of PV modules to maximise the yearly yield
Long-term average
PVOUT Photovoltaic power potential
kWh/kWp Assessment of power production potential for a PV power plant with free-standing fixed-mounted c-Si modules, optimally tilted towards equator to maximize yearly PV production
Long-term yearly and monthly average of daily totals
TEMP Air Temperature at 2 m above ground level
°C Defines operating environment of solar power plants
Long-term (diurnal) annual and monthly averages
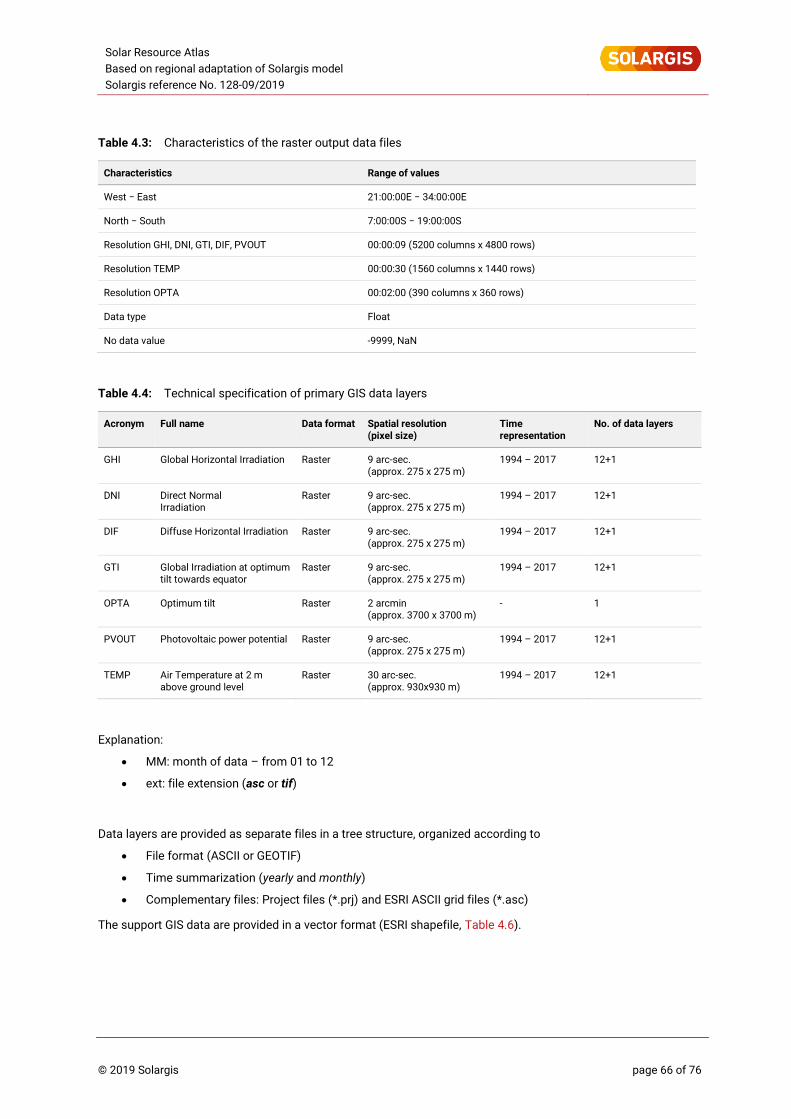
Solar Resource Atlas
Based on regional adaptation of Solargis model
Solargis reference No. 128-09/2019
© 2019 Solargis page 66 of 76
Table 4.3: Characteristics of the raster output data files
Characteristics Range of values
West − East 21:00:00E − 34:00:00E
North − South 7:00:00S − 19:00:00S
Resolution GHI, DNI, GTI, DIF, PVOUT 00:00:09 (5200 columns x 4800 rows)
Resolution TEMP 00:00:30 (1560 columns x 1440 rows)
Resolution OPTA 00:02:00 (390 columns x 360 rows)
Data type Float
No data value -9999, NaN
Table 4.4: Technical specification of primary GIS data layers
Acronym Full name Data format Spatial resolution (pixel size)
Time representation
No. of data layers
GHI Global Horizontal Irradiation Raster 9 arc-sec. (approx. 275 x 275 m)
1994 – 2017 12+1
DNI Direct Normal Irradiation
Raster 9 arc-sec. (approx. 275 x 275 m)
1994 – 2017 12+1
DIF Diffuse Horizontal Irradiation Raster 9 arc-sec. (approx. 275 x 275 m)
1994 – 2017 12+1
GTI Global Irradiation at optimum tilt towards equator
Raster 9 arc-sec. (approx. 275 x 275 m)
1994 – 2017 12+1
OPTA Optimum tilt Raster 2 arcmin (approx. 3700 x 3700 m)
- 1
PVOUT Photovoltaic power potential Raster 9 arc-sec. (approx. 275 x 275 m)
1994 – 2017 12+1
TEMP Air Temperature at 2 m above ground level
Raster 30 arc-sec. (approx. 930x930 m)
1994 – 2017 12+1
Explanation:
• MM: month of data – from 01 to 12
• ext: file extension (asc or tif)
Data layers are provided as separate files in a tree structure, organized according to
• File format (ASCII or GEOTIF)
• Time summarization (yearly and monthly)
• Complementary files: Project files (*.prj) and ESRI ASCII grid files (*.asc)
The support GIS data are provided in a vector format (ESRI shapefile, Table 4.6).

Solar Resource Atlas
Based on regional adaptation of Solargis model
Solargis reference No. 128-09/2019
© 2019 Solargis page 67 of 76
Table 4.5: File name convention for GIS data
Acronym
Full name Filename pattern Number of files
GHI Global Horizontal Irradiation, long-term yearly average of daily totals GHI.ext
1+1
GHI Global Horizontal Irradiation, long-term monthly averages of daily totals GHI_MM.ext
12+12
DNI Direct Normal Irradiation, long-term yearly average of daily totals DNI.ext
1+1
DNI Direct Normal Irradiation, long-term monthly averages of daily totals DNI_MM.ext 12+12
DIF Diffuse Horizontal Irradiation, long-term yearly average of daily totals DIF.ext
1+1
DIF Diffuse Horizontal Irradiation, long-term monthly averages of daily totals DIF_MM.ext 12+12
GTI Global Irradiation at optimum tilt towards equator, long-term yearly average of daily totals
GTI.ext
1+1
GTI Global Irradiation at optimum tilt towards equator, long-term monthly averages of daily totals
GTI_MM.ext 12+12
PVOUT Photovoltaic power potential, long-term yearly average of daily totals PVOUT.ext
1+1
PVOUT Photovoltaic power potential, long-term monthly averages of daily totals PVOUT_MM.ext 12+12
TEMP Air Temperature at 2 m above ground, long-term yearly average TEMP.ext
1+1
TEMP Air Temperature at 2 m above ground, long-term monthly averages TEMP_MM.ext 12+12
Total size of unpacked data layers is 13.6 GB, packed (with ZIP compression) 1.7 GB respectively.
Table 4.6: Support GIS data
Data type Source Data format
City location OpenStreetMap.org contributors, GeoNames.org, adapted by Solargis
Point shapefile
Administrative borders Cartography Unit, GSDPM, World Bank Group Polyline shapefile
Road network OpenStreetMap.org contributors, adapted by Solargis
Polyline shapefile
Large water bodies SWBD, USGS Polygon shapefile
Solar meteorological stations Solargis Point shapefile
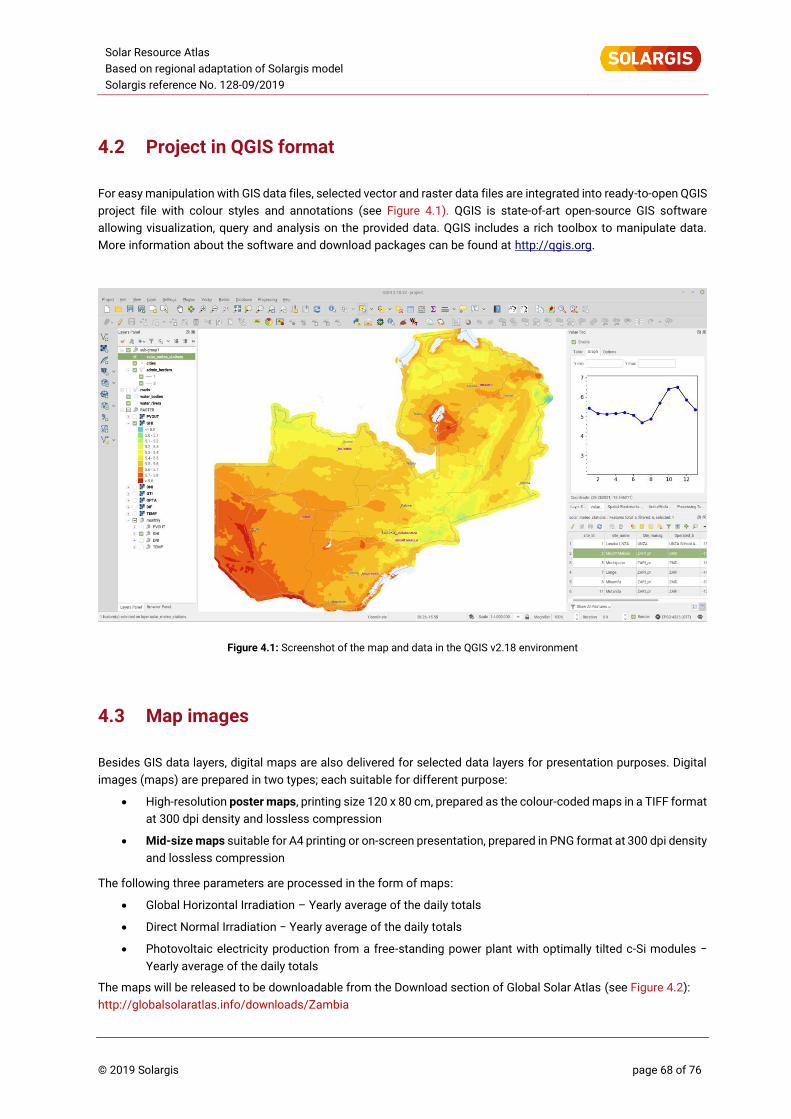
Solar Resource Atlas
Based on regional adaptation of Solargis model
Solargis reference No. 128-09/2019
© 2019 Solargis page 68 of 76
4.2 Project in QGIS format
For easy manipulation with GIS data files, selected vector and raster data files are integrated into ready-to-open QGIS
project file with colour styles and annotations (see Figure 4.1). QGIS is state-of-art open-source GIS software
allowing visualization, query and analysis on the provided data. QGIS includes a rich toolbox to manipulate data.
More information about the software and download packages can be found at http://qgis.org.
Figure 4.1: Screenshot of the map and data in the QGIS v2.18 environment
4.3 Map images
Besides GIS data layers, digital maps are also delivered for selected data layers for presentation purposes. Digital
images (maps) are prepared in two types; each suitable for different purpose:
• High-resolution poster maps, printing size 120 x 80 cm, prepared as the colour-coded maps in a TIFF format
at 300 dpi density and lossless compression
• Mid-size maps suitable for A4 printing or on-screen presentation, prepared in PNG format at 300 dpi density
and lossless compression
The following three parameters are processed in the form of maps:
• Global Horizontal Irradiation – Yearly average of the daily totals
• Direct Normal Irradiation − Yearly average of the daily totals
• Photovoltaic electricity production from a free-standing power plant with optimally tilted c-Si modules −
Yearly average of the daily totals
The maps will be released to be downloadable from the Download section of Global Solar Atlas (see Figure 4.2):
http://globalsolaratlas.info/downloads/Zambia
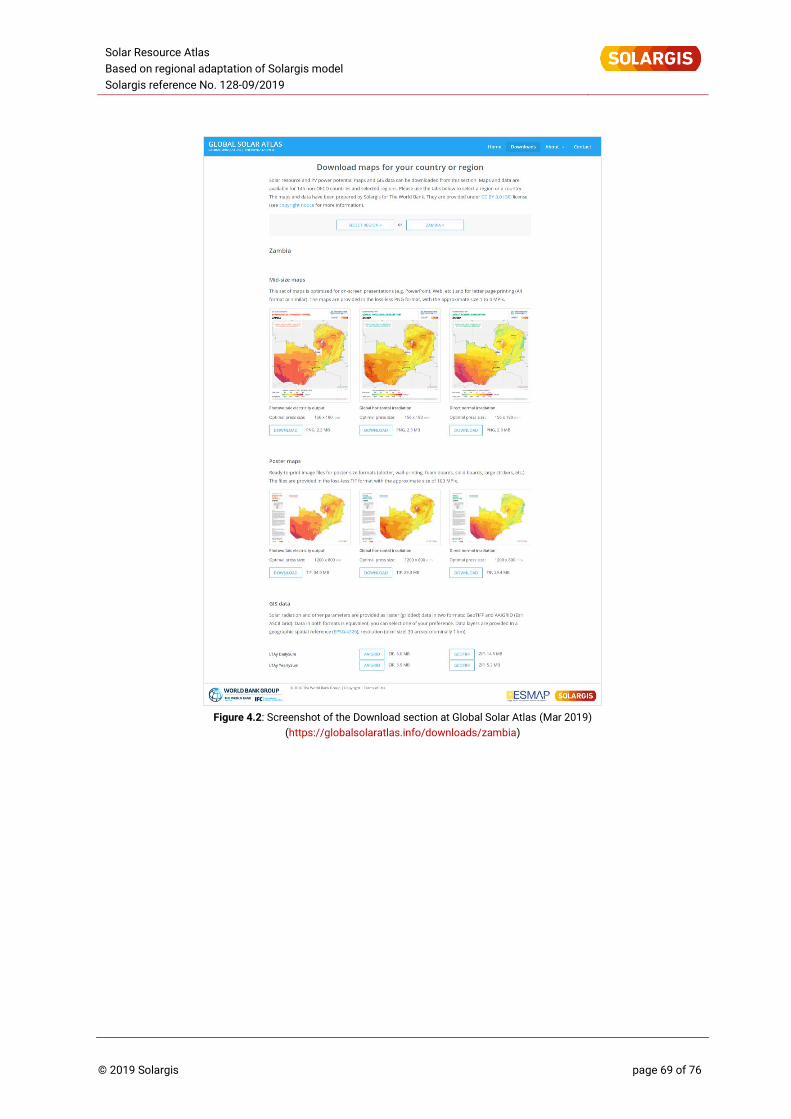
Solar Resource Atlas
Based on regional adaptation of Solargis model
Solargis reference No. 128-09/2019
© 2019 Solargis page 69 of 76
Figure 4.2: Screenshot of the Download section at Global Solar Atlas (Mar 2019)
(https://globalsolaratlas.info/downloads/zambia)
Solar Resource Atlas
Based on regional adaptation of Solargis model
Solargis reference No. 128-09/2019
© 2019 Solargis page 70 of 76
5 List of maps
Map 2.1: Position of the solar meteorological stations used for the model validation ............................................... 16
Map 2.2: Geographic distribution of the regionally adapted model uncertainty in Zambia ......................................... 22
Map 3.1: Administrative division, towns and cities in Zambia. ..................................................................................... 32
Map 3.2: Terrain elevation above sea level. ................................................................................................................... 33
Map 3.3: Terrain slope. ................................................................................................................................................... 34
Map 3.4: Long-term yearly average of rainfall (sum of precipitation). .......................................................................... 35
Map 3.5: Land cover. ....................................................................................................................................................... 36
Map 3.6: Transport corridors. ......................................................................................................................................... 37
Map 3.7: Population density. .......................................................................................................................................... 38
Map 3.8: Long-term yearly average of air temperature at 2 metres, period 1994-2017. ............................................. 41
Map 3.9: Long-term monthly average of air temperature at 2 metres, period 1994-2017. .......................................... 42
Map 3.10: Global Horizontal Irradiation – long-term average of daily and yearly totals. ............................................ 45
Map 3.11: Global Horizontal Irradiation – long-term monthly average of daily totals. ................................................ 46
Map 3.12: Long-term average for ratio of diffuse and global irradiation (DIF/GHI). .................................................... 48
Map 3.13: Direct Normal Irradiation – long-term average of daily and yearly totals. .................................................. 51
Map 3.14: Direct Normal Irradiation – long-term monthly average of daily totals. ...................................................... 52
Map 3.15: Optimum tilt of PV modules to maximize yearly PV power production. ..................................................... 54
Map 3.16: Global Tilted Irradiation at optimum tilt – long-term average of daily and yearly totals. ........................... 56
Map 3.17: Global Tilted Irradiation at optimum tilt – long-term monthly average of daily totals. .............................. 57
Map 3.18: PV electricity output from an open space fixed-mounted PV system ........................................................ 61
Map 3.19: PV power generation potential for an open-space fixed-mounted PV system. .......................................... 62
Solar Resource Atlas
Based on regional adaptation of Solargis model
Solargis reference No. 128-09/2019
© 2019 Solargis page 71 of 76
6 List of figures
Figure 2.1: Solar resource data availability. ................................................................................................................... 15
Figure 2.2: Simplified Solargis PV simulation chain ...................................................................................................... 27
Figure 3.1: Monthly averages of air-temperature at 2 m for selected sites. ................................................................ 39
Figure 3.2: Long-term monthly averages of Global Horizontal Irradiation. .................................................................. 44
Figure 3.3: Interannual variability of Global Horizontal Irradiation for selected sites. ................................................. 44
Figure 3.4: Monthly averages of DIF/GHI. ...................................................................................................................... 47
Figure 3.5: Daily averages of Direct Normal Irradiation at selected sites. ................................................................... 50
Figure 3.6: Interannual variability of Direct Normal Irradiation at representative sites ............................................... 50
Figure 3.7: Global Tilted Irradiation – long-term daily averages. .................................................................................. 55
Figure 3.8: Monthly relative gain of GTI relative to GHI at selected sites. ................................................................... 55
Figure 3.9: Monthly averages of daily totals of power production from the fixed tilted PV systems ......................... 59
Figure 3.10: Monthly performance ratio of a PV system at selected sites. ................................................................. 60
Figure 3.11: Comparing seasonal variability in three locations for GHI ....................................................................... 63
Figure 4.1: Screenshot of the map and data in the QGIS v2.18 environment .............................................................. 68
Figure 4.2: Screenshot of the Download section at Global Solar Atlas (Mar 2019) ..................................................... 69
Solar Resource Atlas
Based on regional adaptation of Solargis model
Solargis reference No. 128-09/2019
© 2019 Solargis page 72 of 76
7 List of tables
Table 1.1: Comparison of long-term GHI estimate: Solargis vs. other databases ................................................. 12
Table 2.1: Overview information on measurement stations operated in the region .............................................. 15
Table 2.2: Overview information on solar meteorological stations in Zambia ....................................................... 16
Table 2.3: Input data for Solargis solar radiation model and related GHI and DNI outputs for Zambia ............... 18
Table 2.4: Comparing solar data from solar measuring stations and from satellite models ................................ 19
Table 2.5: Direct Normal Irradiance: bias before and after regional model adaptation ......................................... 20
Table 2.6: Global Horizontal Irradiance: bias before and after regional model adaptation ................................... 20
Table 2.7: Uncertainty of the model estimate for original and regionally-adapted annual GHI, DNI and GTI ....... 21
Table 2.8: Comparing data from meteorological stations and weather models ................................................... 23
Table 2.9: Original source of Solargis air temperature at 2 m for Zambia: MERRA-2 and CFSv2. ........................ 24
Table 2.10: Air temperature at 2 m: accuracy indicators of the model outputs [ºC]. ......................................... 24
Table 2.11: Expected uncertainty of air temperature in Zambia. ........................................................................ 25
Table 2.12: Specification of Solargis database used in the PV calculation in this study .................................. 26
Table 2.13: Reference configuration - photovoltaic power plant with fixed-mounted PV modules .................. 28
Table 2.14: Yearly energy losses and related uncertainty in PV power simulation ............................................ 28
Table 3.1: Monthly averages of air-temperature at 2 m at 6 sites .......................................................................... 40
Table 3.2: Daily averages of Global Horizontal Irradiation at 6 sites ...................................................................... 43
Table 3.3: Daily averages of Direct Normal Irradiation at six sites ......................................................................... 49
Table 3.4: Daily averages of Global Tilted Irradiation at 6 sites .............................................................................. 53
Table 3.5: Annual performance parameters of a PV system with modules fixed at the optimum angle ............. 58
Table 3.6: Average daily sums of PV electricity output from an open-space fixed PV system ............................. 58
Table 3.7: Monthly and annual Performance Ratio of a free-standing PV system with fixed modules ................ 59
Table 4.1: General information about GIS data layers ............................................................................................. 65
Table 4.2: Description of primary GIS data layers ................................................................................................... 65
Table 4.3: Characteristics of the raster output data files ........................................................................................ 66
Table 4.4: Technical specification of primary GIS data layers ................................................................................ 66
Table 4.5: File name convention for GIS data .......................................................................................................... 67
Table 4.6: Support GIS data ...................................................................................................................................... 67
Solar Resource Atlas
Based on regional adaptation of Solargis model
Solargis reference No. 128-09/2019
© 2019 Solargis page 73 of 76
8 References
[1] Paul W. Stackhouse, Jr., Zhang T., Westberg D., Barnett A.J., Bristow T., Macpherson B., Hoell J. M., 2018.
POWER Release 8 (with GIS Applications) Methodology (Data Parameters, Sources, & Validation), Data Version
8.0.1. https://power.larc.nasa.gov/documents/POWER_Data_v8_methodology.pdf. Web visited on 3 Oct 2018
[2] Šúri M., Wald L., Huld T., Dunlop E., Albuisson M, 2005. Integration of HelioClim-1 database into PVGIS to
estimate solar electricity potential in Africa. In: Palz W., Ossenbrink H., Helm P., (eds.) 20th European
Photovoltaic Solar Energy Conference, Barcelona, Spain, 6-10 June 2005, Barcelona, pp. 2989-2992”
https://www.researchgate.net/publication/43406677
[3] Huld T., Müller R.W., Gambardella A., 2012. A new solar radiation database for estimating PV performance in
Europe and Africa. Solar Energy 86 (6), 1803–1815. DOI: 10.1016/j.solener.2012.03.006
[4] Lefèvre M., Wald L., Diabaté L., 2007. "Using reduced data sets ISCCP-B2 from the Meteosat satellites to assess
surface solar irradiance". Solar Energy, 81, 240-253. doi:10.1016/j.solener.2006.03.008
[5] ARMINES/MINES ParisTech/TRANSVALOR/ ECMWF − COPERNICUS Atmosphere Monitoring Service. Monthly
and yearly average Global Horizontal Irradiation maps from CAMS Radiation Service over Africa. "JADE" volume,
April 2018
[6] Meteonorm handbook, Version 7.3, Part II: Theory. Meteotest, 2018
[7] Global Solar Atlas, 2016. The World Bank Group. https://globalsolaratlas.info.
[8] Marcel Suri, Tomas Cebecauer, Branislav Schnierer, Artur Skoczek, Daniel Chrkavy, Nada Suriova, Juraj Betak,
2018. Annual Solar Resource Report for solar meteorological stations after completion of 24 months of
measurements. Republic of Zambia, Ref. Nr. 128-07/2018, https://www.esmap.org/node/55906.
[9] Perez R., Cebecauer T., Suri M., 2014. Semi-Empirical Satellite Models. In Kleissl J. (ed.) Solar Energy
Forecasting and Resource Assessment. Academic press.
[10] Cebecauer T., Šúri M., Perez R., High performance MSG satellite model for operational solar energy
applications. ASES National Solar Conference, Phoenix, USA, 2010.
[11] Šúri M., Cebecauer T., Perez P., Quality procedures of SolarGIS for provision site-specific solar resource
information. Conference SolarPACES 2010, September 2010, Perpignan, France.
[12] Šúri M., Cebecauer T., 2014. Satellite-based solar resource data: Model validation statistics versus user’s
uncertainty. ASES SOLAR 2014 Conference, San Francisco, 7-9 July 2014.
[13] Cebecauer T., Suri M., Gueymard C., Uncertainty sources in satellite-derived Direct Normal Irradiance: How can
prediction accuracy be improved globally? Proceedings of the SolarPACES Conference, Granada, Spain, 20-23
Sept 2011.
[14] Šúri M., Cebecauer T., Requirements and standards for bankable DNI data products in CSP projects,
Proceedings of the SolarPACES 2011 Conference, September 2011, Granada, Spain.
[15] Ineichen P., A broadband simplified version of the Solis clear sky model, 2008. Solar Energy, 82, 8, 758-762.
[16] Morcrette J., Boucher O., Jones L., Salmond D., Bechtold P., Beljaars A., Benedetti A., Bonet A., Kaiser J.W.,
Razinger M., Schulz M., Serrar S., Simmons A.J., Sofiev M., Suttie M., Tompkins A., Uncht A., GEMS-AER team,
2009. Aerosol analysis and forecast in the ECMWF Integrated Forecast System. Part I: Forward modelling.
Journal of Geophysical Research, 114.
[17] Benedictow A. et al. 2012. Validation report of the MACC reanalysis of global atmospheric composition:
Period 2003-2010, MACC-II Deliverable D_83.1.
[18] Cebecauer T., Perez R., Suri M., Comparing performance of SolarGIS and SUNY satellite models using monthly
and daily aerosol data. Proceedings of the ISES Solar World Congress 2011, 28 August – 2 September 2011,
Kassel, Germany.
Solar Resource Atlas
Based on regional adaptation of Solargis model
Solargis reference No. 128-09/2019
© 2019 Solargis page 74 of 76
[19] Cebecauer T., Šúri M., Accuracy improvements of satellite-derived solar resource based on GEMS re-analysis
aerosols. Conference SolarPACES 2010, September 2010, Perpignan, France.
[20] Molod, A., Takacs, L., Suarez, M., and Bacmeister, J., 2015: Development of the GEOS-5 atmospheric general
circulation model: evolution from MERRA to MERRA2, Geosci. Model Dev., 8, 1339-1356, doi:10.5194/gmd-8-
1339-2015
[21] GFS model. http://www.nco.ncep.noaa.gov/pmb/products/gfs/
[22] MERRA-2 Overview: The Modern-Era Retrospective Analysis for Research and Applications, Version 2 (MERRA-2), Ronald Gelaro, et al., 2017, J. Clim., doi: 10.1175/JCLI-D-16-0758.1
[23] CFSR model. https://climatedataguide.ucar.edu/climate-data/climate-forecast-system-reanalysis-cfsr/
[24] CFSv2 model http://www.cpc.ncep.noaa.gov/products/CFSv2/CFSv2seasonal.shtml
[25] Cano D., Monget J.M., Albuisson M., Guillard H., Regas N., Wald L., 1986. A method for the determination of the
global solar radiation from meteorological satellite data. Solar Energy, 37, 1, 31–39.
[26] Perez R., Ineichen P., Maxwell E., Seals R. and Zelenka A., 1992. Dynamic global-to-direct irradiance conversion
models. ASHRAE Transactions-Research Series, pp. 354-369.
[27] Perez, R., Seals R., Ineichen P., Stewart R., Menicucci D., 1987. A new simplified version of the Perez diffuse
irradiance model for tilted surfaces. Solar Energy, 39, 221-232.
[28] Ruiz-Arias J. A., Cebecauer T., Tovar-Pescador J., Šúri M., Spatial disaggregation of satellite-derived irradiance
using a high-resolution digital elevation model. Solar Energy, 84, 1644-1657, 2010.
[29] Marcel Suri, Tomas Cebecauer, Marcel Suri, Branislav Schnierer, Nada Suriova, Juraj Betak, Daniel Chrkavy,
Artur Skoczek, 2019. Solar Model Validation Report; Regional adaptation of Solargis model based on data
acquired in 24-months solar measurement campaign; Republic of Zambia, Ref. Nr. 128-08/2019.
https://www.esmap.org/node/55906.
[30] Ineichen P. Long term satellite hourly, daily and monthly global, beam and diffuse irradiance validation.
Interannual variability analysis. University of Geneva/IEA SHC Task 46, 2013.
http://www.unige.ch/energie/forel/energie/equipe/ineichen/annexes-iae.html
[31] Cebecauer T., Suri M., 2015. Site-adaptation of satellite-based DNI and GHI time series: overview and Solargis
approach. SolarPACES conference, September 2015, Cape Town, North Africa.
[32] King D.L., Boyson W.E. and Kratochvil J.A., Photovoltaic array performance model, SAND2004-3535, Sandia
National Laboratories, 2004.
[33] Huld T., Šúri M., Dunlop E.D., Geographical variation of the conversion efficiency of crystalline silicon
photovoltaic modules in Europe. Progress in Photovoltaics: Research and Applications, 16, 595-607, 2008.
[34] Huld T., Gottschalg R., Beyer H. G., Topic M., Mapping the performance of PV modules, effects of module type
and data averaging, Solar Energy, 84, 2, 324-338, 2010.
[35] Huld T., Friesen G., Skoczek A., Kenny R.P., Sample T., Field M., Dunlop E.D., 2011. A power-rating model for
crystalline silicon PV modules. Solar Energy Materials and Solar Cells, 95, 12, 3359-3369.
[36] Skoczek A., Sample T., Dunlop E. D., The results of performance measurements of field-aged crystalline silicon
photovoltaic modules, Progress in Photovoltaics: Research and Applications, 17, 227-240, 2009.
[37] Martin N., Ruiz J.M. Calculation of the PV modules angular losses under field conditions by means of an
analytical model. Solar Energy Material and Solar Cells, 70, 25–38, 2001.
[38] The German Energy Society, 2008: Planning and Installing Photovoltaic Systems. A guide for installers,
architects and engineers. Second edition. Earthscan, London, Sterling VA.
[39] Zambia, Power Africa fact sheet, USAID, https://www.usaid.gov/powerafrica/Zambia
Solar Resource Atlas
Based on regional adaptation of Solargis model
Solargis reference No. 128-09/2019
© 2019 Solargis page 75 of 76
Support information
Background on Solargis
Solargis is a technology company offering energy-related meteorological data, software and consultancy services
to solar energy. We support industry in the site qualification, planning, financing and operation of solar energy
systems for more than 19 years. We develop and operate the high-resolution global database and applications
integrated within Solargis® information system. Accurate, standardised and validated data help to reduce the
weather-related risks and costs in system planning, performance assessment, forecasting and management of
distributed solar power.
Solargis is ISO 9001:2015 certified company for quality management.
This report has been prepared by Nada Suriova, Branislav Schnierer, Daniel Chrkavy, Juraj Betak, Artur Skoczek,
Tomas Cebecauer, Marcel Suri and Veronika Madlenakova from Solargis
All maps in this report are prepared by Solargis
Solargis s.r.o., Mytna 48, 811 07 Bratislava, Slovakia
Reference No. (Solargis): 128-09/2019
http://solargis.com

Related Documents