INTERNATIONAL JOURNAL OF ENVIRONMENTAL SCIENCES Volume 1, No 3 ,2010
© Copyright 2010 All rights reserved Integrated Publishing services
Research Article ISSN 0976 – 4402
270
Studies on Concrete containing E plastic waste Lakshmi.R 1 Nagan.S 2
1 Research Scholar is with K.L.N.College of Information Technology, Sivagangai 2 Assistant Professor is with Thiagarajar College of Engineering , Madurai.
rlakshmi _civil @ yahoo. co. in
ABSTRACT
Utilization of waste materials and byproducts is a partial solution to environmental and ecological problems. Use of these materials not only helps in getting them utilized in cement, concrete and other construction materials, it helps in reducing the cost of cement and concrete manufacturing, but also has numerous indirect benefits such as reduction in landfill cost, saving in energy, and protecting the environment from possible pollution effects. Electronic waste, abbreviated as ewaste, consists of discarded old computers, TVs, refrigerators, radios – basically any electrical or electronic appliance that has reached its endoflife. Efforts have been made in the concrete industry to use non biodegradable components of E waste as a partial replacement of the coarse or fine aggregates. An experimental study is made on the utilization of Ewaste particles as coarse aggregates in concrete with a percentage replacement ranging from 0 % to 30% on the strength criteria of M20 Concrete. Compressive strength, Tensile strength and Flexural strength of Concrete with and without Ewaste as aggregates was observed which exhibits a good strength gain. Ultrasonic tests on strength properties were executed and the feasibility of utilizing E plastic particles as partial replacement of coarse aggregate has been presented.
Key words: Compressive strength, ewaste, Slump, Waste
1. Introduction E waste describes loosely discarded, surplus, obsolete, broken, electrical or electronic devices. Rapid technology change ,low initial cost have resulted in a fast growing surplus of electronic waste around the globe .Several tonnes of E waste need to be disposed per year. Traditional landfill or stockpile method is not an environmental friendly solution and the disposal process is also very difficult to meet EPA regulations. How to reuse the non disposable E waste becomes an important research topic.
However, technically, electronic waste is only a subset of WEEE (Waste Electrical and Electronic Equipment).According to the OECD any appliance using an electronic power supply that has reached its End –oflife would come under WEEE. E plastic waste is one of the fastest growing waste streams in the world. In developed countries, previously, it was about 1% of total solid waste generation and currently it grows to 2% by 2010. In developing countries, it ranges 0.01% to 1% of the total municipal solid waste generation.
The e waste inventory based on this obsolescence rate and installed base in India for the year 2005 has been estimated to be 146180.00 tones. This is expected to exceed 8, 00,000 tones by 2012. In India, e waste is mostly generated in large cities like Delhi, Mumbai and Bangalore. In these cities a complex e waste handling infrastructure has developed mainly based on a long tradition of waste recycling. Sixty five cities in India generate more than 60% of the total e waste generated in India. Ten states generate 70% of the total ewaste generated in India. Maharashtra ranks first followed by Tamil Nadu, Andhra

INTERNATIONAL JOURNAL OF ENVIRONMENTAL SCIENCES Volume 1, No 3 ,2010
© Copyright 2010 All rights reserved Integrated Publishing services
Research Article ISSN 0976 – 4402
271
Pradesh, Uttar Pradesh, West Bengal, Delhi, Karnataka, Gujarat, Madhya Pradesh and Punjab in the list of ewaste generating states in India. Among top ten cities generating ewaste, Mumbai ranks first followed by Delhi, Bangalore, Chennai, Kolkata, Ahmadabad, Hyderabad, Pune, Surat and Nagpur. There are two small WEEE/Ewaste dismantling facilities are functioning in Chennai and Bangalore. There is no large scale organized ewaste recycling facility in India and the entire recycling exists in un organized sector. Ahamed et.al [1] reported waste glass can be used by grinding it into a fine glass powder (GLP) for incorporation into concrete as a pozzalanic material. It under goes beneficial pozzalanic reactions in the concrete and could replace up to 30% cement in some concrete mixes with satisfactory strength development.
P.M.Subramanian [4] described the need for an integrated waste management approach to be considered involving efficient use of plastic materials, recycling and disposal mechanisms. The amounts of plastics consumed annually in the growing tends of Indian and US scenario was discussed. The possibilities of a comprehensive investigation of the technical economic and ecological aspects of recycling was addressed by the author.
Shi et al [5] reviewed glass chemistry, alkali silica reaction mechanism, expansion of concrete containing glass aggregates and micro structure of the interfacial transitional zone between cement paste and glass particles. It has been noticed that the mechanism of expansion of concrete caused by glass aggregate is different from that by traditional ASR expansion. It was conferred that the expansion of concrete containing glass aggregate reacts with alkalis in the cement to from alkali silicate or NCSH which absorbs water and cause expansion. The author suggested that it is necessary to control the pH of the concrete under 12 in order to avoid deleterious expansion and cracking of concrete containing large glass particles.
2.Recycling of E Waste
The processing of electronic waste in developing countries causes serious health and pollution problems due to the fact that electronic equipment contains serious contaminants such as lead, cadmium, Beryllium etc. This paper deals with the non hazardous and inert components of Ewaste generated out of Obsolete Computers, TV Cabins, Refrigerator, Mobile phones and washing Machine etc. Postconsumer components of above mentioned appliance have traditionally been disposed off either in domestic refuse, which ends up in landfill, were collected in designated collection spots for reuse/ recycling. The major objective of this task is to reduce as for as possible the accumulation of used and discarded electronic and electrical equipments and transfer waste into socially and industrially beneficial raw material using simple, low cost and environmental friendly technology. Iron and Steel are the most common materials found in electrical and electronic equipments and amounts to nearly half of the total weight of WEEE. Plastic are the second largest component by weight representing nearly 21 % of WEEE.
Chen[3] reported the scope for utilization of waste glass in concrete in several forms ,including fine aggregate and coarse aggregate. Reindl[2] suggested the applications of glass cullets as concrete aggregate, Road construction aggregate and building applications( Bricks, Tiles, Wall panels etc). The utilization of waste plastic components of E waste in construction applications is the major interest of the work reported here.
3. Experimental Details
3.1. Materials

INTERNATIONAL JOURNAL OF ENVIRONMENTAL SCIENCES Volume 1, No 3 ,2010
© Copyright 2010 All rights reserved Integrated Publishing services
Research Article ISSN 0976 – 4402
272
The potential applications of industry by products in concrete are to be partial aggregate replacement or partial cementious materials depending on their chemical composition and grain size. Recent studies have shown that reuse of very finely grounded ewaste in concrete has economical and technical advantages for solving the disposal of large amount of ewaste, reuse in complete industry may be the most feasible application. Ewaste particles can be used as coarse aggregate, fine aggregate, fine filler in concrete depending on its chemical composition and particle size.
E Waste sources in the form of loosely discarded , surplus, obsolete ,broken, electrical or electronic devices from commercial informal recyclers have been collected which were crushed and ground to the particle size. Table 1 represents Physical properties of E waste particle and Coarse aggregate.
Table 1: Physical properties of ewaste particles and coarse aggregate
The Ewaste contents are calculated as weight percent of coarse aggregate in the control mix. The fineness modulus of coarse aggregate with various Ewaste contents is between 1.86 and 2.78 .The E waste particles can be considered as partial coarse aggregate substitute retaining mix ratio as the same . The divided particle size is assumed to be between 1.18mm – 2.36mm. Since it possesses no cementious property, it is considered as replacement to coarse aggregate in cement concrete in various percentages.
3.2. Concrete Mixes
Control mix concrete and modified with various Ewaste contents as listed in Table 2 are prepared. By considering the use Ewaste particles in the mixes as much as possible and achieve suitable workability was attempted and strength criteria of Grade M20 concrete mix was analyzed.
Table 2:Mix Specifications
Properties Ewaste particle Coarse aggregate
Specific gravity Absorption (%) Color Shape Crushing Value Impact value
1.01 <0.2 White & Dark Angular <2% <2%
2.65 0.5 Dark Angular 27.2% 24.73%
Mix Specification Contro l Mix A
A1 A2 A3 A4 A5 A6
Proportion of E waste
0% 4% 8% 12% 16% 20% 25
%
Mix Specification Contro l
B1 B2 B3 B4 B5 B6

INTERNATIONAL JOURNAL OF ENVIRONMENTAL SCIENCES Volume 1, No 3 ,2010
© Copyright 2010 All rights reserved Integrated Publishing services
Research Article ISSN 0976 – 4402
273
3.3.Tests
Compressive strength test was conducted to evaluate the strength development of concrete containing various Ewaste contents at the age of 7, 14, 28 days respectively. Cylindrical specimens were also cast for finding the Tensile strength of specimens on 7, 14, 28 days for each mix specification following the standard test procedures.
Table 3: Compressive strength test results in N/mm 2
Mix Specification Control mix
A1 A2 A3 A4 A5 A6
Proportion of E waste
0% 4% 8% 12% 16% 20% 25%
7 Days 10.74 10.19 9.54 8.65 8.60 6.40 6.06
14 Days 13.70 13.52 12.42 10.74 10.74 8.26 6.40
28 Days 19.83 19.89 18.80 16.40 16.23 8.25 6.15
Table 4: Compressive strength test results in N/mm 2
Mix Specification Control mix B
B1 B2 B3 B4 B5 B6
Proportion of E waste + 10% Fly ash
0% 4% 8% 12% 16% 20% 25%
7 Days 18.75 18.62 18.51 18.36 17.60 15.56 12.08
14 Days 27.23 26.82 26.55 24.82 24.13 22.51 21.04
28 Days 29.79 27.83 27.27 27.45 26.98 25.45 22.42
Table 5: Tensile strength test results in N/mm 2
Mix Specification Control mix
A1 A2 A3 A4 A5 A6
Proportion of E waste
0% 4% 8% 12% 16% 20% 25%
Mix B
Proportion of E waste + 10% Fly ash
0% 4% 8% 12% 16% 20% 25
%

INTERNATIONAL JOURNAL OF ENVIRONMENTAL SCIENCES Volume 1, No 3 ,2010
© Copyright 2010 All rights reserved Integrated Publishing services
Research Article ISSN 0976 – 4402
274
7 Days 4.44 4.36 4.05 2.85 2.63 1.64 1.51
14 Days 4.68 4.52 4.10 3.05 3.16 1.80 1.74
28 Days 4.95 4.80 4.55 4.40 3.50 1.96 1.77
Table 6: Tensile strength test results in N/mm 2
Mix Specification Control mix B
B 1 B 2 B 3 B 4 B 5 B 6
Proportion of E waste
0% 4% 8% 12% 16% 20% 25%
7 Days 3.85 3.56 3.55 3.46 3.15 2.80 2.42
14 Days 4.58 4.37 4.01 4.00 5.05 3.61 3.10
28 Days 5.53 5.35 5.20 4.89 5.40 4.78 3.90
3.4.Ultrasonic Tests
The quality of concrete in terms of Homogeneity of materials, Absence of Internal flaws, Cracks can be assessed by means of Ultrasonic Pulse Velocity Method characterized by the following pulse velocity ranges.
Table 7: Quality criteria
Velocity (Km/sec ) Classification Overall Strength(mg/cm 2 ) Above 4.5 Excellent 300 to 500
3.5 to 4.5 Good 250 to 300
3.0 to 3.5 Medium 200 to 250
Below 3.0 Poor 150 to 200
Table 8: Ultrasonic Test Results
S.NO Percentage of E Waste
Age in Days
Time µs(10 6 ) Pulse Velocity Km/sec
1. 0 35.0 4.285
2. 4 35.6 4.213
3. 8 7 Days
36.8 4.076

INTERNATIONAL JOURNAL OF ENVIRONMENTAL SCIENCES Volume 1, No 3 ,2010
© Copyright 2010 All rights reserved Integrated Publishing services
Research Article ISSN 0976 – 4402
275
4. 16 40.3 3.722
5. 20 56.0 2.678
6. 25 50.0 3.0
7. 30 45.0 3.333
8. 0 34.0 4.414
9. 4 35.0 4.285
10. 8 35.6 4.210
11. 16 40.3 3.720
12. 20 42.0 3.571
13. 25 44.0 3.409
14. 30
14 Days
47.9 3.131
15. 0 30.1 4.985
16. 4 30.0 4.985
17. 8 31.1 4.811
18. 16 31.3 4.785
19. 20 36.1 4.145
20. 25 37.7 3.972
21. 30
28 Days
40.0 3.750

INTERNATIONAL JOURNAL OF ENVIRONMENTAL SCIENCES Volume 1, No 3 ,2010
© Copyright 2010 All rights reserved Integrated Publishing services
Research Article ISSN 0976 – 4402
276
0
5
10
15
20
25
0% 4% 8% 12% 16% 20% 25%
Control mix
A1 A2 A3 A4 A5 A6
Proportion of E plasic waste in %
Com
pressive strngth in N/mm2
7 Days 14 days 28 Days
Figure 1: Compressive strength Results – A Series
Figure 2: Compressive strength Results – B Series
0 5 10 15 20 25 30 35
0% 4% 8% 12% 16% 20% 25%
B
Control mix
B1 B2 B3 B4 B5 B6
Proportion of E plasic waste in %
Com
pressive strngth in N/mm2
7 Days 14 days 28 Days
INTERNATIONAL JOURNAL OF ENVIRONMENTAL SCIENCES Volume 1, No 3 ,2010
© Copyright 2010 All rights reserved Integrated Publishing services
Research Article ISSN 0976 – 4402
277
0
1
2
3
4
5
6
0% 4% 8% 12% 16% 20% 25%
Control mix
A1 A2 A3 A4 A5 A6
Proportion of E plasic waste in %
Split tensile strng
th in N/mm2
7 Days 14 days 28 Days
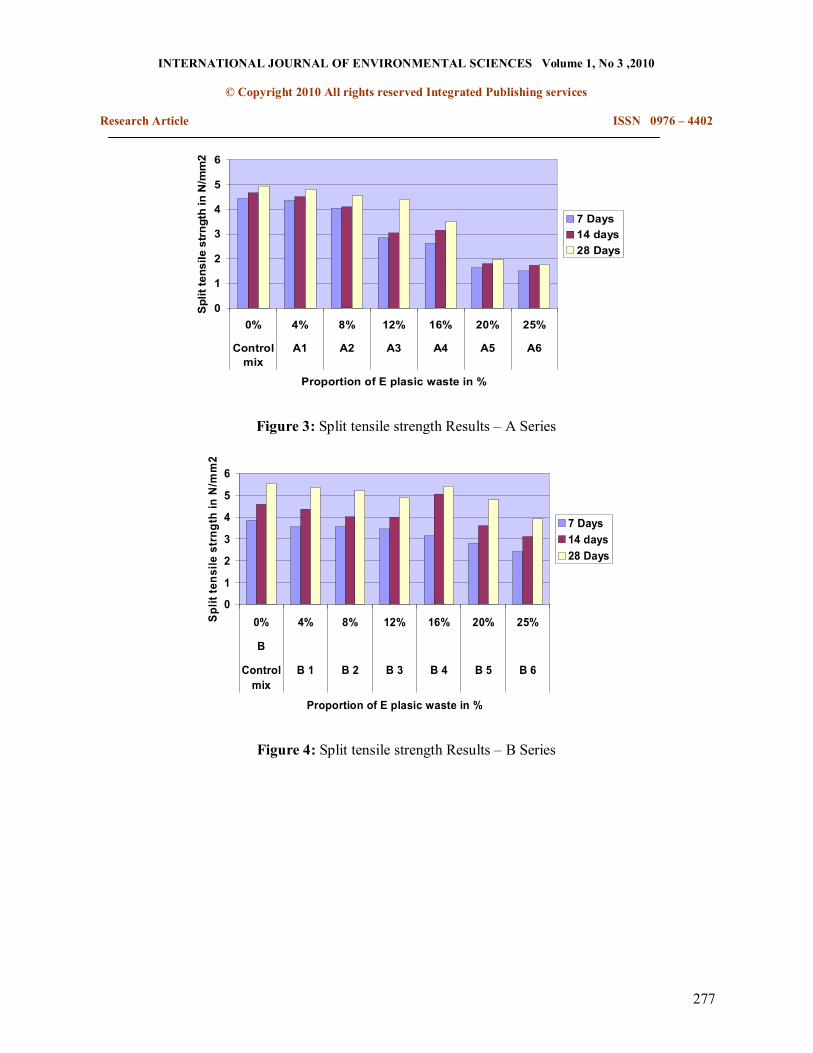
Figure 3: Split tensile strength Results – A Series
0
1
2
3
4
5
6
0% 4% 8% 12% 16% 20% 25%
B
Control mix
B 1 B 2 B 3 B 4 B 5 B 6
Proportion of E plasic waste in %
Split tens
ile strng
th in
N/m
m2
7 Days 14 days 28 Days
Figure 4: Split tensile strength Results – B Series

INTERNATIONAL JOURNAL OF ENVIRONMENTAL SCIENCES Volume 1, No 3 ,2010
© Copyright 2010 All rights reserved Integrated Publishing services
Research Article ISSN 0976 – 4402
278
0
5
10
15
20
25
7 Days 14 Days 28 Days
AGE IN DAYS
COMRES
SIVE
STR
ENGTH
IN
N/mm2
CONTROL MIX 0% A1 4% A2 8% A3 12% A4 16% A5 20% A6 25%
Figure 5: Compressive Strength Index – A Series
0
5
10
15
20
25
30
35
7 Days 14 Days 28 Days
AGE IN DAYS
COMRESSIVE STRENGTH IN
N/mm2
CONTROL MIX 0% B1 4% B2 8% B3 12% B4 16% B5 20% B6 25%
Figure 6: Compressive Strength Index – B Series
0
1
2
3
4
5
6
7 Days 14 Days 28 Days AGE IN DAYS
SPLIT TE
NSILE
STR
ENGTH
IN
N/mm2
CONTROL MIX 0% A1 4% A2 8% A3 12% A4 16% A5 20% A6 25%
Figure 7: Split Tensile Strength Index – A Series
INTERNATIONAL JOURNAL OF ENVIRONMENTAL SCIENCES Volume 1, No 3 ,2010
© Copyright 2010 All rights reserved Integrated Publishing services
Research Article ISSN 0976 – 4402
279
0
1
2
3
4
5
6
7 Days 14 Days 28 Days
AGE IN DAYS
SPLIT TE
NSILE STR
ENGTH
IN
N/mm2
CONTROL MIX 0% B1 4% B2 8% B3 12% B4 16% B5 20% B6 25%
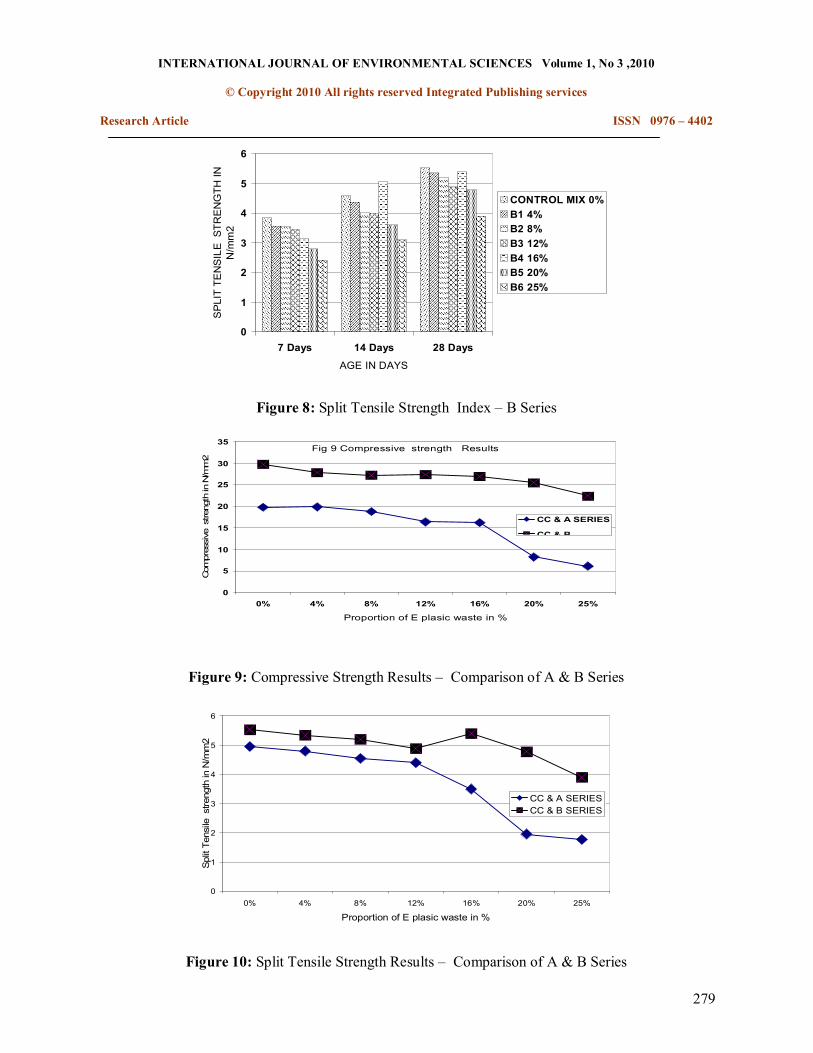
Figure 8: Split Tensile Strength Index – B Series
Fig 9 Compressive strength Results
0
5
10
15
20
25
30
35
0% 4% 8% 12% 16% 20% 25%
Proportion of E plasic waste in %
Compressive strength in N/mm2
CC & A SERIES
CC & B
Figure 9: Compressive Strength Results – Comparison of A & B Series
0
1
2
3
4
5
6
0% 4% 8% 12% 16% 20% 25%
Proportion of E plasic waste in %
Split Tensile strength in N/mm2
CC & A SERIES CC & B SERIES
Figure 10: Split Tensile Strength Results – Comparison of A & B Series

INTERNATIONAL JOURNAL OF ENVIRONMENTAL SCIENCES Volume 1, No 3 ,2010
© Copyright 2010 All rights reserved Integrated Publishing services
Research Article ISSN 0976 – 4402
280
4. Discussion
An analysis was made on the strength characteristics by conducting the tests on ewaste concrete with e plastic aggregate as well as fly ash and the results revealed that upto 20% replacement ewaste concrete is giving improvement in compressive & Tensile strength. Fig 1 and 3 show the compressive strength and flexural strength of e plastic concrete with mixing ratio of e plastic aggregate while Fig 2 &4 represent the same criteria with addition of 10% fly ash . With waste plastic content up to 20% , the addition of e plastic aggregate did not significantly affect the compressive strength and split tensile strength. However, an increase in the content of e plastic aggregate gradually enhanced 7 days, 14 days and 28 days compressive and flexural strength up to 16% replacement in the case of A series mixes. Addition of 10% fly ash to A series mixes result in B series mixes, improved the strength characteristics. When comparing to conventional concrete mix , difference in strength characteristics of Controlled concrete and B series mixes became less. Fig 5 to 8 represented the strength indices of early strength as well as 28 days . It revealed that presence of fly ash in the mixes improved the compressive and flexural strength of B5and B6 mixes to nearly 50% more while compared to A5 and A6 mixes. Table 7 & 8 represent the ultrasonic test results of e plastic concrete. According to the scale of acceptable quality criteria, small deviations in 7 days and 14 days strength was observed. However 28 days results confirmed the quality criteria of e plastic concrete as good.
5. Conclusion
This study intended to find the effective ways to reutilize the hard plastic waste particles as concrete aggregate. Analysis of the strength characteristics of concrete containing recycled waste plastic and fly ash gave the following results.
1.It is identified that ewaste can be disposed by using them as construction materials .
2.Since the ewaste is not suitable to replace fine aggregate it is used to replace the coarse aggregate.
3. The compressive strength and split tensile strength of concrete containing e plastic aggregate is retained more or less in comparison with controlled concrete specimes. However strength noticeably decreased when the e plastic content was more than 20%.
4. Addition of fly ash in the mix considerably improves strength index of control mix as well as e waste concrete. The strength development of fly ash based e plastic concrete in early days found to be less but 28 days compressive and split tensile strength has proven results in comparison with controlled concrete up to 25% e plastic replacement.
5.Has been concluded 20% of Ewaste aggregate can be incorporated as coarse aggregate replacement in concrete without any long term detrimental effects and with acceptable strength development properties.
6. References 1. Ahamed Shayan, Aimin Xu, “Value added utilization of waste glass in concrete”, Cement and
Concrete Research vol 34 (2004) pp 8189.
2. SecungBum Park, Bong Chun Lee, “Studies on expansion properties in mortar containing waste glass & fibering. Cement and Concrete Research, vol 34 (2004) pp 11451152.

INTERNATIONAL JOURNAL OF ENVIRONMENTAL SCIENCES Volume 1, No 3 ,2010
© Copyright 2010 All rights reserved Integrated Publishing services
Research Article ISSN 0976 – 4402
281
3. C.H.Chen, R.Hwang, “Waste Eglass particles used in cementious mixtures” Cement and Concrete Research, vol 36 (2006) pp 449456.
4. P.M.Subramanian, “Plastic recycling and waste Management in the US” Resources, Conservation and Recycling vol (28) pp 253263.
5. Caijun shi, “Corrosion of glasses and expansion mechanism of concrete certaining waste glasses as aggregates, Journal of Materials in Civil Engineering ASCE, October 2009, pp 529 534.
6. Hai yong kang, “Electronic waste recycling: A review of U.S. infrastructure and technology options, Resources, Conservation and Recycling vol 45 (2005) pp 368400.
7. A.S.A Xu “Value added utilization of waste glass in concrete”, Cement and Concrete Research, 2004, Vol. 34, pp. 8189.