1 Original Research Article 1 2 Politics of School Mapping: Evaluation of Spatial Distribution of Public 3 Secondary Schools in Rivers State, Nigeria. 4 5 Abstract 6 School mapping in secondary education has witnessed a lot of distortion in Nigeria 7 largely because the allocation of educational resources is embedded in politics of 8 education. Consequently, the paper examined trends in the politics of school 9 mapping and spatial distribution of secondary schools in Rivers state. Three 10 research questions guided the study. The document analysis research method was 11 utilized which involved extensive analysis of records and documents. Data 12 collected were descriptively analysed. Findings revealed spatial imbalance in the 13 distribution of public secondary schools, and neglect of population factor in siting 14 secondary schools in Rivers State. Recommendations aimed at enhancing even 15 distribution of public secondary schools were proffered. The paper concluded that 16 school distribution system that ignores basic school mapping process could 17 undermine the overall educational development in Rivers State. 18 Keywords: Politics; school mapping; evaluation; distribution; secondary 19 schools: Public. 20 Introduction 21 The politics of school mapping has to do with the use of political power in the 22 distribution of school facilities in various schools in a state or country (Nwakpa, 23 2015). Nevertheless, the overall development of education in any given society to a 24 large extent depends on the level to which there is an equitable distribution of 25 educational resources and opportunities. School mapping is a planning tool applied 26 by educational planners and policymakers to ensure that schools, teachers, and 27

Welcome message from author
This document is posted to help you gain knowledge. Please leave a comment to let me know what you think about it! Share it to your friends and learn new things together.
Transcript
1
Original Research Article 1
2
Politics of School Mapping: Evaluation of Spatial Distribution of Public 3
Secondary Schools in Rivers State, Nigeria. 4
5
Abstract 6
School mapping in secondary education has witnessed a lot of distortion in Nigeria 7
largely because the allocation of educational resources is embedded in politics of 8
education. Consequently, the paper examined trends in the politics of school 9
mapping and spatial distribution of secondary schools in Rivers state. Three 10
research questions guided the study. The document analysis research method was 11
utilized which involved extensive analysis of records and documents. Data 12
collected were descriptively analysed. Findings revealed spatial imbalance in the 13
distribution of public secondary schools, and neglect of population factor in siting 14
secondary schools in Rivers State. Recommendations aimed at enhancing even 15
distribution of public secondary schools were proffered. The paper concluded that 16
school distribution system that ignores basic school mapping process could 17
undermine the overall educational development in Rivers State. 18
Keywords: Politics; school mapping; evaluation; distribution; secondary 19
schools: Public. 20
Introduction 21
The politics of school mapping has to do with the use of political power in the 22
distribution of school facilities in various schools in a state or country (Nwakpa, 23
2015). Nevertheless, the overall development of education in any given society to a 24
large extent depends on the level to which there is an equitable distribution of 25
educational resources and opportunities. School mapping is a planning tool applied 26
by educational planners and policymakers to ensure that schools, teachers, and 27

2
facilities needed for the promotion of quality education are provided and 28
distributed equitably across the state or country. The application of school mapping 29
is, however, embedded in the politics of education in Nigeria. The political class 30
appears to have the final say on which part of a state or country should have more 31
schools, what type of schools, at what level, and when they are to be established 32
(Boles, 1995). 33
The purpose of school mapping includes, but not limited to the following 34
It assists in analyzing the existing pattern of distribution of educational 35
facilities among different geographical areas to identify locations for new 36
schools. Thus, without school mapping schools would be haphazardly 37
located without consideration for the needs of the populace (Albert, 1991). 38
School mapping examines the facilities available in existing schools and 39
determines if there are existing imbalances between school requirements and 40
planning in an area. In this regard, school mapping helps to identify areas 41
that have an excess number of schools and areas not yet covered. This 42
implies that if school mapping is professionally applied, it will save the 43
government from the unnecessary expenditure of investing in the 44
construction of schools where there are no real needs for them. 45
3
School mapping is an assertive tool in the rationalization of schools and 46
educational facilities (Varghese & Bisval, 1999). To this end, it helps the 47
government and other stakeholders in the prudent allocation and use of 48
scarce educational resources. 49
The purpose of school mapping is to set up a school network, that will meet 50
in the most efficient and equitable manner the present and future demands of 51
education. Thus, school mapping when properly applied eliminates 52
disparities in geographical areas, taking into consideration the school size, 53
pupil-teacher ratio, transition rates, enrolment rates and promotion rates 54
(Oyedeji, 2001) 55
School mapping ensures that educational institutions are sited at their most 56
advantageous locations. That is, advantages from the point of accessibility to 57
the students and full utilization of educational resources (Uwazuruike, 58
1991). 59
Arising from the above, it is obvious that school mapping is a dynamic process of 60
planning the distribution, size, and spacing of schools and facilities needed. 61
Furthermore, it is an essential planning tool, to address possibilities of spatial 62
inequalities in the provision of educational facilities. 63
64
4
Statement of the problem 65
School mapping more than ever before has become a critical aspect of educational 66
management in Rivers State. This is because errors in school mapping could result 67
in a serious imbalance in the educational development of Rivers State (2010). 68
Rivers State is the fifth most populous State in Nigeria, with a population figure of 69
5,185,400 (National Population Commission, 2006). It is also the most dynamic 70
State in Nigeria, having the advantage of the heavy presence of oil and gas related 71
industries. Accordingly, there is an increase in the influx of people into the State 72
from neighbouring States and outside Nigeria. Thus, with the increase in 73
population, the demand for secondary education is very high. 74
In spite of the existence of 245 public secondary schools in Rivers State there are 75
palpable concerns that the existing schools are seemingly not evenly distributed 76
across the State to accommodate the demand for secondary education. To this end, 77
it is important for educational managers, political authorities, and other 78
stakeholders to have a clear understanding of what school mapping entails. 79
Moreover, the central aim of school mapping is to ensure equitable distribution of 80
educational resources in a state or country. The study, therefore, is an attempt to 81
investigate the extent to which public secondary schools are evenly distributed 82
among Local Government Areas in Rivers state. 83
5
Purpose of the Study 84
This study evaluated the spatial distribution of public secondary schools in Rivers 85
State, Nigeria. However, the study was aimed at the following specific objectives: 86
1. Determine the distribution pattern of public secondary schools in Rivers 87
State. 88
2. Determine the distribution of public secondary schools in upland and 89
riverine geographical areas in Rivers State. 90
3. Determine the role of population size in siting public secondary schools in 91
Rivers State. 92
Research Questions 93
The following research questions guided the study 94
1. What is the distribution pattern of public secondary schools in Rivers State? 95
2. How are public secondary schools distributed in upland and riverine 96
geographical areas of Rivers State? 97
3. What is the role of population size in siting public secondary schools in 98
Rivers State? 99
Review of Related Literature 100
This aspect of the paper presents review of related literature as follows : 101

6
Theoretical Framework 102
The theoretical framework of the study is anchored on the social demand approach 103
to educational planning. The social demand approach is the aggregate popular 104
demand for education, meaning the sum total of individual demands for education 105
at a given place and time under prevailing cultural, political and economic 106
circumstances (Coombs, 1974). The social demand approach is the most popular 107
approach among educational planners (Adesina, 1981). Politicians resort to this 108
approach as they find other models of education planning politically difficulty to 109
defend. Nwankwo (1981) affirms that social demand approach favours those who 110
recommend free and compulsory education as a means for egalitarian and 111
permissive society. According to him, politicians who respect public opinions or 112
regard satisfaction of public demand as a key to political advancement prefer this 113
approach. The social demand approach provides that access to all levels of 114
education should be available to all those wishing to gain admission. Thus, it is 115
based on the principle that everyone who qualifies by ability and attainment should 116
pursue full time course in education (Akabue, 1991). 117
According to Uwazuruike (1991) social demand approach has two dimensions, one 118
is determined by government policy, for instance in Nigeria, the Universal Primary 119
Education UPE) programmes of the 1950s and 1976 represented public demand. 120
To this end, demand for education was high and determined along demographic 121
7
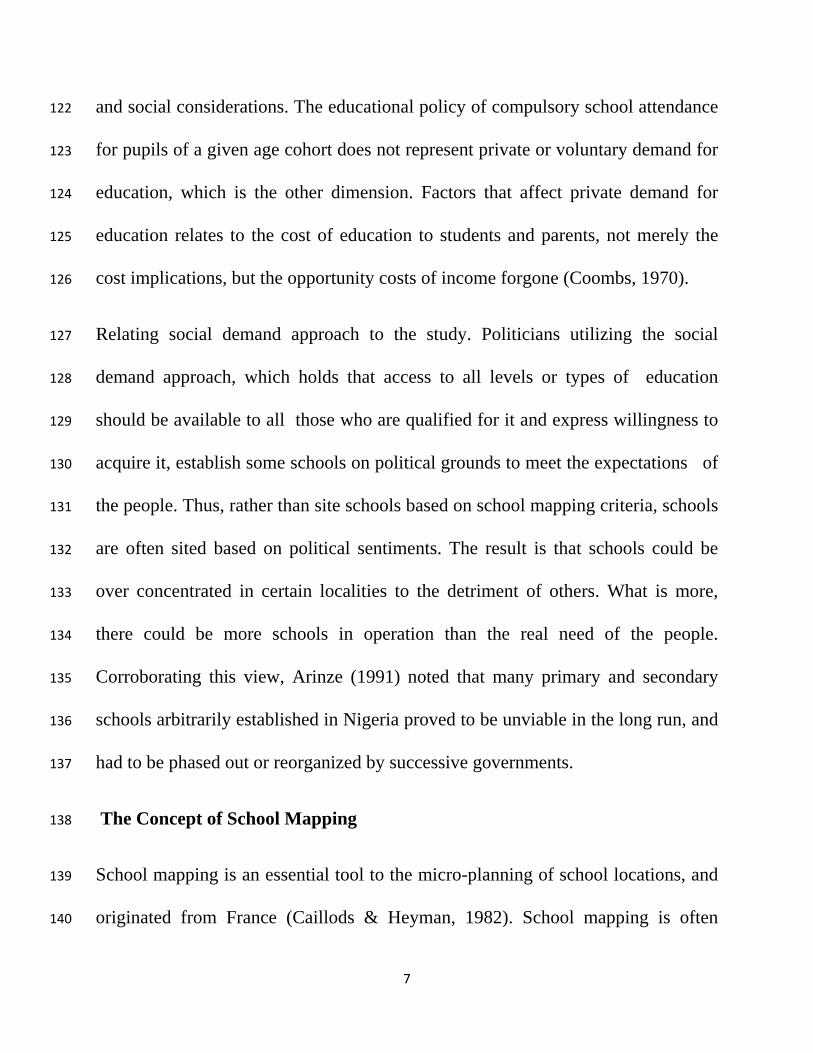
and social considerations. The educational policy of compulsory school attendance 122
for pupils of a given age cohort does not represent private or voluntary demand for 123
education, which is the other dimension. Factors that affect private demand for 124
education relates to the cost of education to students and parents, not merely the 125
cost implications, but the opportunity costs of income forgone (Coombs, 1970). 126
Relating social demand approach to the study. Politicians utilizing the social 127
demand approach, which holds that access to all levels or types of education 128
should be available to all those who are qualified for it and express willingness to 129
acquire it, establish some schools on political grounds to meet the expectations of 130
the people. Thus, rather than site schools based on school mapping criteria, schools 131
are often sited based on political sentiments. The result is that schools could be 132
over concentrated in certain localities to the detriment of others. What is more, 133
there could be more schools in operation than the real need of the people. 134
Corroborating this view, Arinze (1991) noted that many primary and secondary 135
schools arbitrarily established in Nigeria proved to be unviable in the long run, and 136
had to be phased out or reorganized by successive governments. 137
The Concept of School Mapping 138
School mapping is an essential tool to the micro-planning of school locations, and 139
originated from France (Caillods & Heyman, 1982). School mapping is often 140
8
confused or interchanged with school map. It is pertinent to note that school 141
mapping is not the same as a school map. More, than simply being a tabular, 142
graphical, or cartographical representation of a place, school mapping is used to 143
investigate and ensure the equitable distribution of educational resources within 144
and between school systems (Ibara, 2011 and Caillods, 1982). School mapping has 145
also been described as the process of setting a school network, that will meet the 146
present and future educational demands of the society in a most efficient manner 147
(Oyebade, 2009). Hallack (1977) described school mapping as part and parcel of 148
the educational planning process for determining where schools should be sited in 149
order to provide the greatest benefit to the society. It is a process of planning the 150
location and spacing of educational institutions taking into consideration the 151
demographical , pedagogical, geographical, and economic and manpower factors 152
(Igwe, 1998 and Vargnese, 1997). The main objective of school mapping is to 153
identify the most appropriate locations of schools, and to ensure the efficient and 154
equal distribution of resources within and between school systems, especially in 155
times of large scale reforms or a major expansion of an educational system 156
(Caillods, 1982). Thus, school mapping is an essential planning tool to overcome 157
possibilities of lopsided distribution of educational resources across regions. Also, 158
it aims at the identification of locations for the construction of school facilities and 159
optimization of the use of human and material resources in education. 160

9
Factors to consider in school mapping 161
School mapping is an educational planning tool aims at setting up a school network 162
that meets in the most efficient and equitable manner the future demand of 163
education. In determining the future school map, it will be necessary to consider 164
some factors as follows: 165
Demographic factors 166
These are factors that pertain to characteristics of population dynamics such as 167
birth rate, mortality rate, social structure, migration and immigration rate, school 168
drop outs and retention rates. School mapping makes use of demographical data to 169
redefine the school network. 170
Pedagogic factors 171
These factors relate to consideration of the normal period of utilization of school 172
buildings or sites, weekly timetable, class sizes, the possibility of double shifts, 173
consideration for availability or suitability of the area for special teaching facilities. 174
For instance, it may be relevant to establish a department of fisheries in a riverine 175
location. In this manner, facilities for practical teaching can be easily available. 176
Manpower factors 177
10
These factors involve the consideration of teaching force or skills in a particular 178
area. This implies that the type of occupation or skills predominant within an area 179
can influence the type of school that may be located in that area. 180
Social factors 181
These relate to the use of school mapping to satisfy the social demand of 182
education. This means that the socio-cultural outlook of a community should be 183
considered. For instance, rapid migration of people from rural to urban areas. In 184
this regard, the government could use its policy on school mapping to discourage 185
rural-urban migration. This can be achieved by establishing social amenities 186
especially schools in rural areas. 187
Geographical factors 188
These factors consider the possibilities of students having access to school, 189
transportation system, road network, topography of the area. Government may also 190
use its policy on school mapping to attract high population density into an area. For 191
instance, the siting of Federal College of Education (Technical) in Omoku , Rivers 192
State , has attracted a large number of people from within and outside Rivers state. 193
Economic factors 194
11
These factors have to do with the cost of establishing or maintaining a school. 195
These factors require cost-effectiveness in running’s schools and economic 196
benefits that will accrue to such areas. 197
Catchment Area factor 198
This factor relates to the geographical area from which the school gets learner or 199
the geographical area it serves. The essence for the siting of schools with respect to 200
catchment area is that there will be a school close to every learner’s home and that 201
the learner will by choice attend that school. Thus, if the catchment area is properly 202
captured in school mapping the distance between home and school in each case 203
will be short and could save time and expenses for learners and parents. 204
Population factor 205
Population distribution is a factor for school mapping. This factor relates to spatial 206
pattern of population distribution. Applying school mapping principles schools 207
should be located in areas with high population density in order to have enough 208
school children (Nwakpa, 2015). If this factor is neglected in siting of schools, it 209
may result into a situation where many schools exist but with few students. The 210
implication is that school building and facilities are under-utilized. 211
Politics of school mapping 212
A good school mapping concept ensures even distribution of schools. The even 213
distribution of schools across regions, communities and states cannot be 214
12
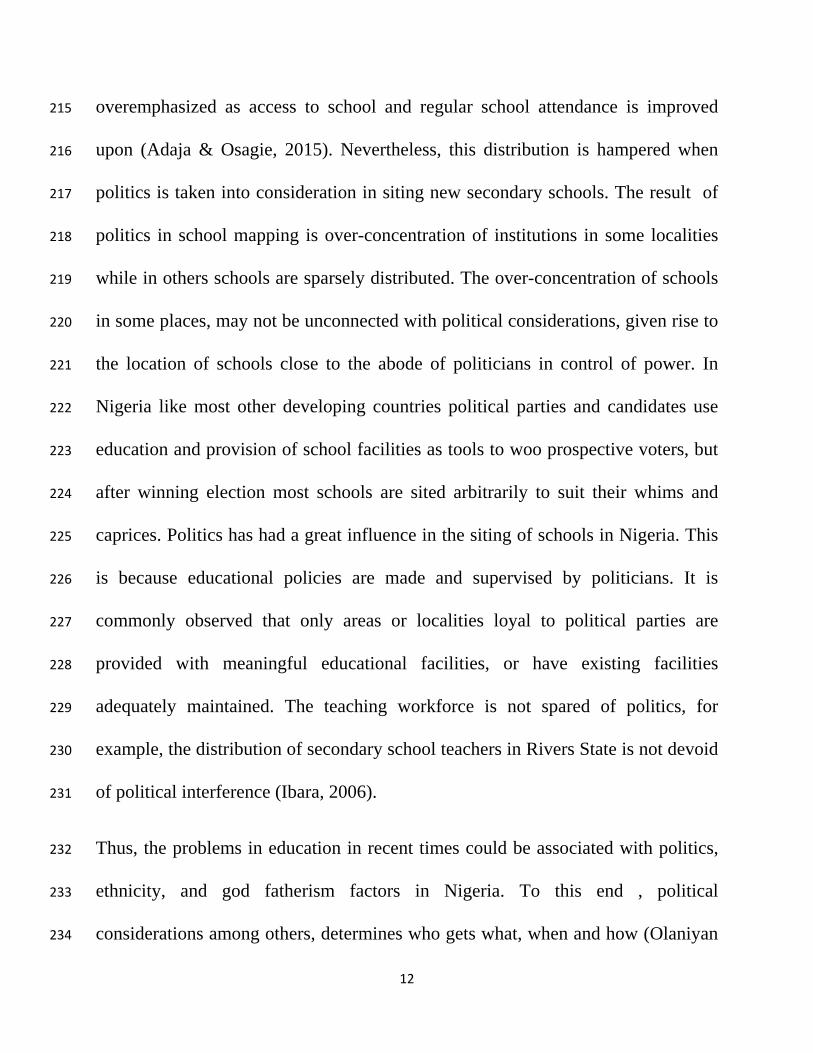
overemphasized as access to school and regular school attendance is improved 215
upon (Adaja & Osagie, 2015). Nevertheless, this distribution is hampered when 216
politics is taken into consideration in siting new secondary schools. The result of 217
politics in school mapping is over-concentration of institutions in some localities 218
while in others schools are sparsely distributed. The over-concentration of schools 219
in some places, may not be unconnected with political considerations, given rise to 220
the location of schools close to the abode of politicians in control of power. In 221
Nigeria like most other developing countries political parties and candidates use 222
education and provision of school facilities as tools to woo prospective voters, but 223
after winning election most schools are sited arbitrarily to suit their whims and 224
caprices. Politics has had a great influence in the siting of schools in Nigeria. This 225
is because educational policies are made and supervised by politicians. It is 226
commonly observed that only areas or localities loyal to political parties are 227
provided with meaningful educational facilities, or have existing facilities 228
adequately maintained. The teaching workforce is not spared of politics, for 229
example, the distribution of secondary school teachers in Rivers State is not devoid 230
of political interference (Ibara, 2006). 231
Thus, the problems in education in recent times could be associated with politics, 232
ethnicity, and god fatherism factors in Nigeria. To this end , political 233
considerations among others, determines who gets what, when and how (Olaniyan 234
13
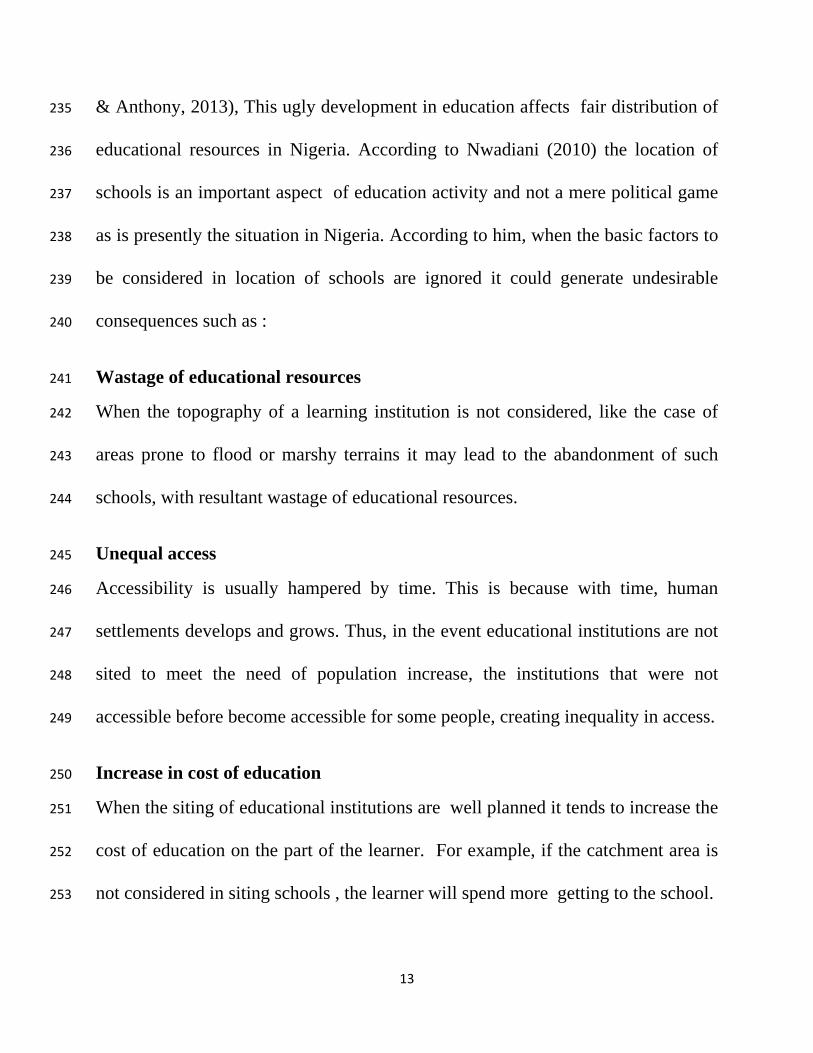
& Anthony, 2013), This ugly development in education affects fair distribution of 235
educational resources in Nigeria. According to Nwadiani (2010) the location of 236
schools is an important aspect of education activity and not a mere political game 237
as is presently the situation in Nigeria. According to him, when the basic factors to 238
be considered in location of schools are ignored it could generate undesirable 239
consequences such as : 240
Wastage of educational resources 241
When the topography of a learning institution is not considered, like the case of 242
areas prone to flood or marshy terrains it may lead to the abandonment of such 243
schools, with resultant wastage of educational resources. 244
Unequal access 245
Accessibility is usually hampered by time. This is because with time, human 246
settlements develops and grows. Thus, in the event educational institutions are not 247
sited to meet the need of population increase, the institutions that were not 248
accessible before become accessible for some people, creating inequality in access. 249
Increase in cost of education 250
When the siting of educational institutions are well planned it tends to increase the 251
cost of education on the part of the learner. For example, if the catchment area is 252
not considered in siting schools , the learner will spend more getting to the school. 253
14
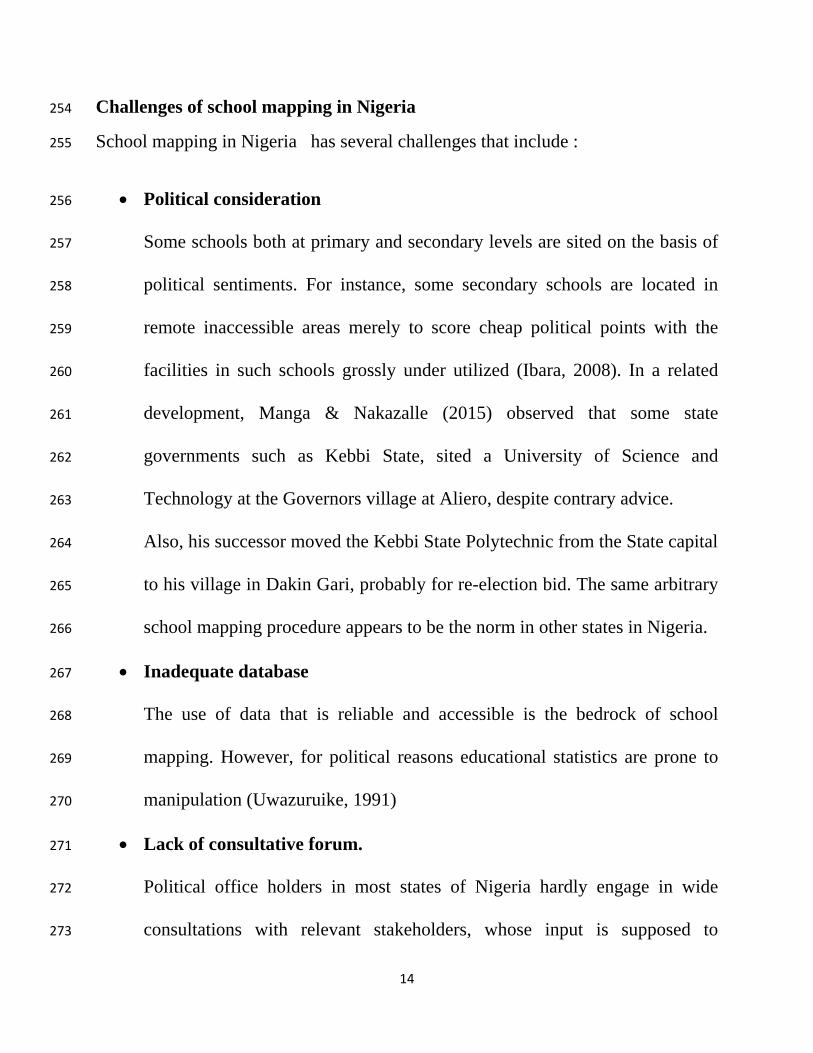
Challenges of school mapping in Nigeria 254
School mapping in Nigeria has several challenges that include : 255
Political consideration 256
Some schools both at primary and secondary levels are sited on the basis of 257
political sentiments. For instance, some secondary schools are located in 258
remote inaccessible areas merely to score cheap political points with the 259
facilities in such schools grossly under utilized (Ibara, 2008). In a related 260
development, Manga & Nakazalle (2015) observed that some state 261
governments such as Kebbi State, sited a University of Science and 262
Technology at the Governors village at Aliero, despite contrary advice. 263
Also, his successor moved the Kebbi State Polytechnic from the State capital 264
to his village in Dakin Gari, probably for re-election bid. The same arbitrary 265
school mapping procedure appears to be the norm in other states in Nigeria. 266
Inadequate database 267
The use of data that is reliable and accessible is the bedrock of school 268
mapping. However, for political reasons educational statistics are prone to 269
manipulation (Uwazuruike, 1991) 270
Lack of consultative forum. 271
Political office holders in most states of Nigeria hardly engage in wide 272
consultations with relevant stakeholders, whose input is supposed to 273

15
contribute to effective school mapping. According to Castaldi (1977) wide 274
consultations in school mapping activities minimize the tendency for errors 275
and wrong decisions. 276
Lack of principle of equity 277
A major aim of school mapping is to ensure even distribution of educational 278
resources across the states. This principle seems to be ignored or thrown into 279
winds, resulting in lopsided distribution of educational facilities across and 280
within regions (Ibara, 2006b). The implication is that some communities 281
have more schools to the detriment of others. 282
Statistical constraint 283
Nigeria has not completely resolved the problem of a national census figure, 284
despite efforts in the past ranging from 1963 to present. The issue of 285
accurate census figure is still contentious. School mapping requires reliable 286
statistical data bank, in which planning must be based. False population 287
figures could affect projections, and thus a major constraint to school 288
mapping in Nigeria 289
The constraint of manual operations 290
School mapping activities in Nigeria is dominated by the use of manual 291
methods of operation. The use of modern management information system 292
(MIS) and integration of geographical information system (GIS) are yet to 293
16
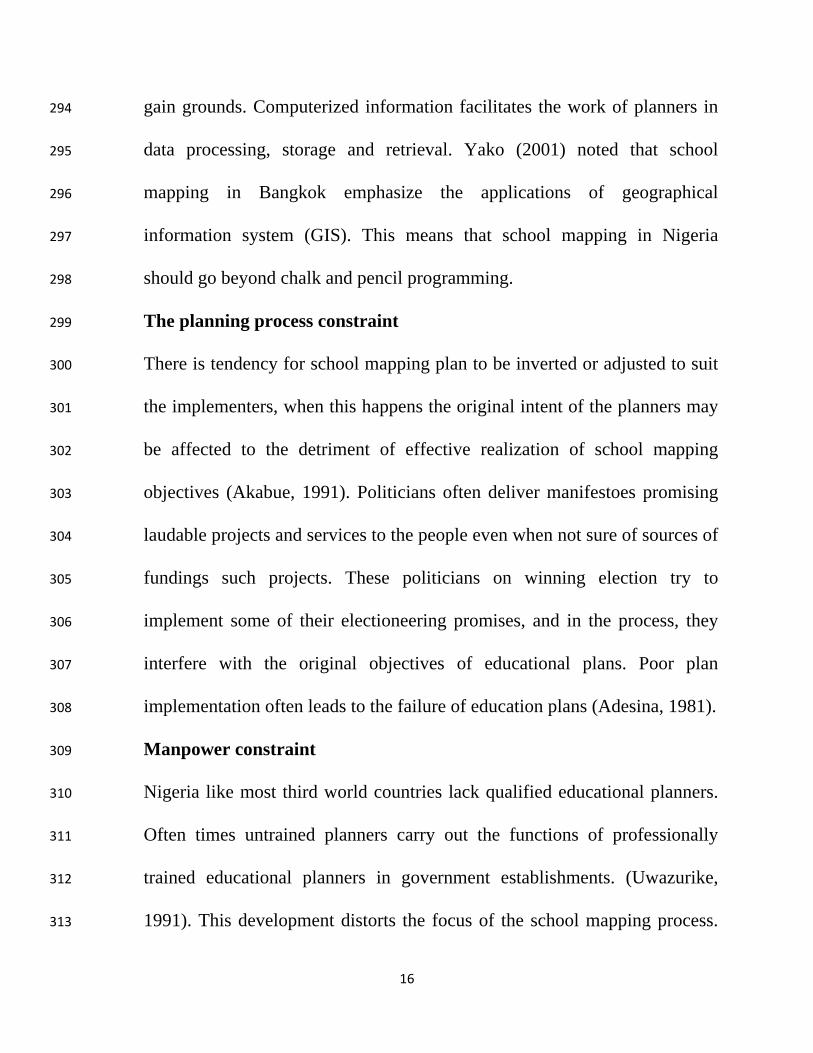
gain grounds. Computerized information facilitates the work of planners in 294
data processing, storage and retrieval. Yako (2001) noted that school 295
mapping in Bangkok emphasize the applications of geographical 296
information system (GIS). This means that school mapping in Nigeria 297
should go beyond chalk and pencil programming. 298
The planning process constraint 299
There is tendency for school mapping plan to be inverted or adjusted to suit 300
the implementers, when this happens the original intent of the planners may 301
be affected to the detriment of effective realization of school mapping 302
objectives (Akabue, 1991). Politicians often deliver manifestoes promising 303
laudable projects and services to the people even when not sure of sources of 304
fundings such projects. These politicians on winning election try to 305
implement some of their electioneering promises, and in the process, they 306
interfere with the original objectives of educational plans. Poor plan 307
implementation often leads to the failure of education plans (Adesina, 1981). 308
Manpower constraint 309
Nigeria like most third world countries lack qualified educational planners. 310
Often times untrained planners carry out the functions of professionally 311
trained educational planners in government establishments. (Uwazurike, 312
1991). This development distorts the focus of the school mapping process. 313
17
Thus, a well-conceived school mapping task may fail, if the right type and 314
quantity of manpower are not available to implement the plan. 315
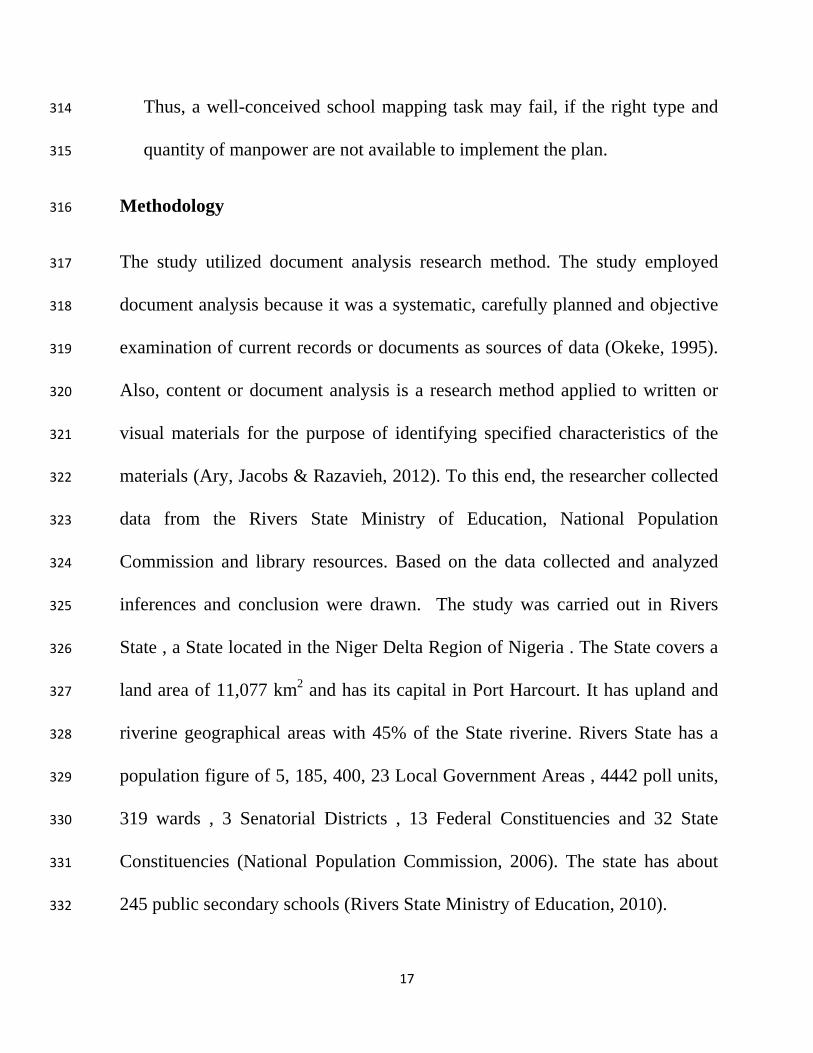
Methodology 316
The study utilized document analysis research method. The study employed 317
document analysis because it was a systematic, carefully planned and objective 318
examination of current records or documents as sources of data (Okeke, 1995). 319
Also, content or document analysis is a research method applied to written or 320
visual materials for the purpose of identifying specified characteristics of the 321
materials (Ary, Jacobs & Razavieh, 2012). To this end, the researcher collected 322
data from the Rivers State Ministry of Education, National Population 323
Commission and library resources. Based on the data collected and analyzed 324
inferences and conclusion were drawn. The study was carried out in Rivers 325
State , a State located in the Niger Delta Region of Nigeria . The State covers a 326
land area of 11,077 km2 and has its capital in Port Harcourt. It has upland and 327
riverine geographical areas with 45% of the State riverine. Rivers State has a 328
population figure of 5, 185, 400, 23 Local Government Areas , 4442 poll units, 329
319 wards , 3 Senatorial Districts , 13 Federal Constituencies and 32 State 330
Constituencies (National Population Commission, 2006). The state has about 331
245 public secondary schools (Rivers State Ministry of Education, 2010). 332
18
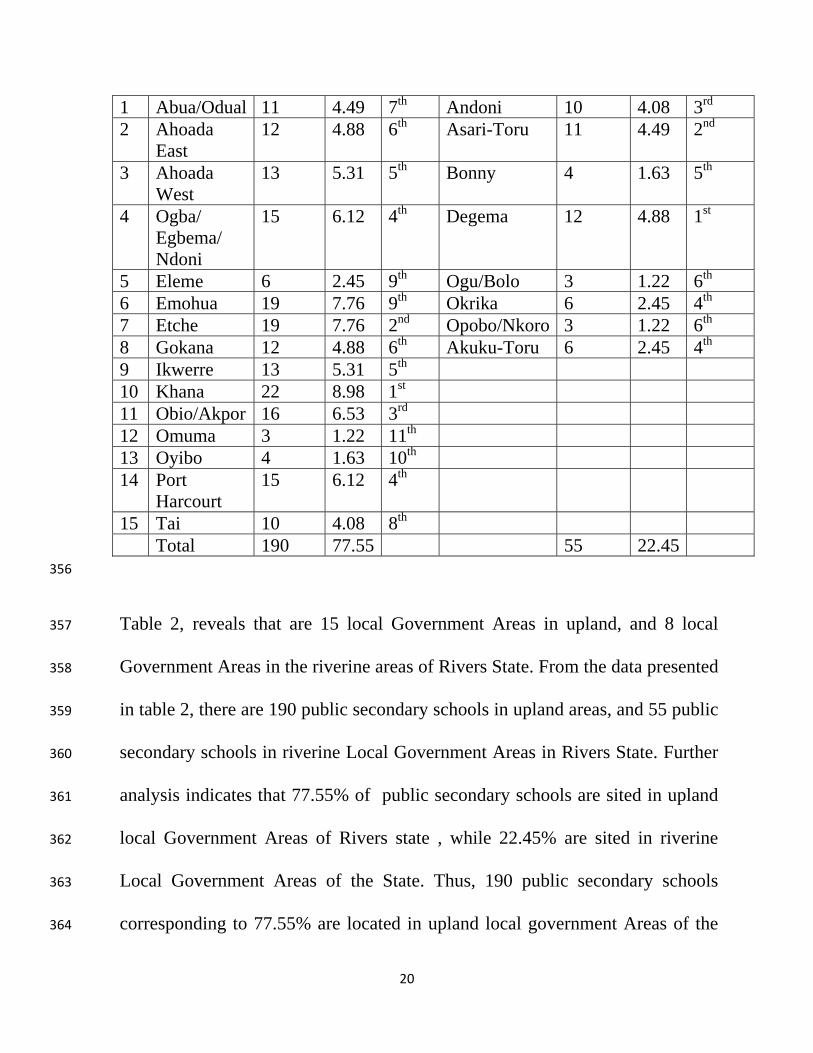
Results 333
Research question one 334
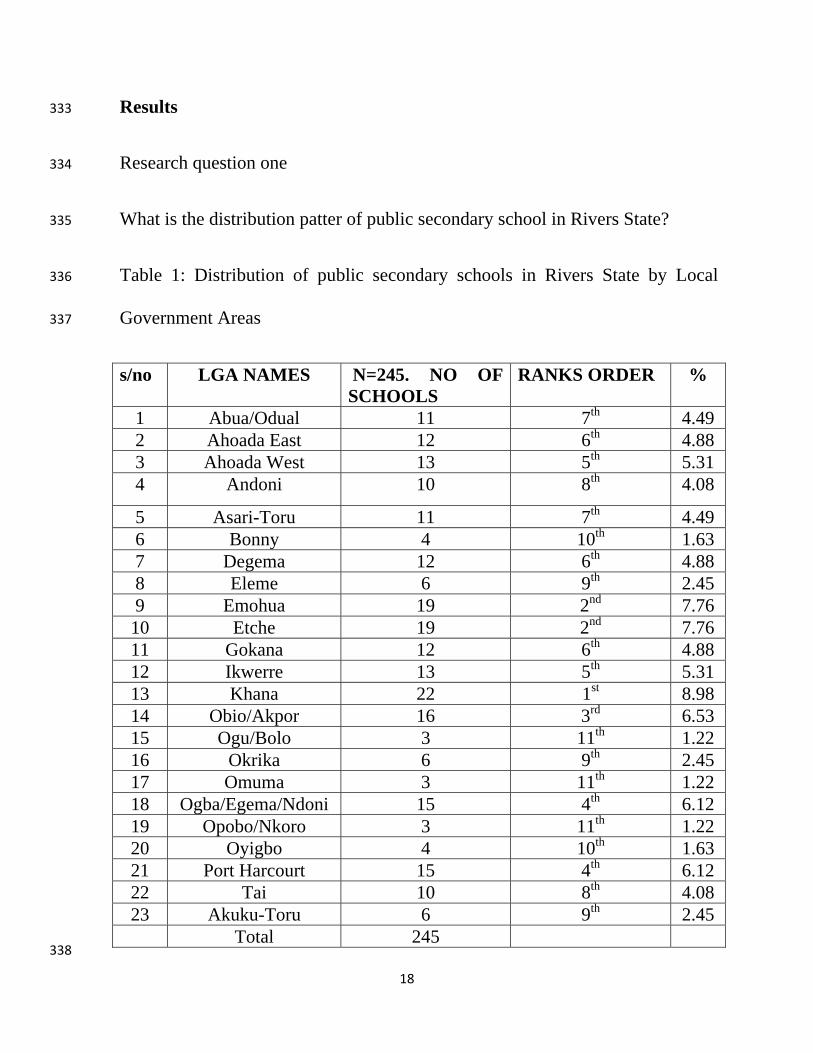
What is the distribution patter of public secondary school in Rivers State? 335
Table 1: Distribution of public secondary schools in Rivers State by Local 336
Government Areas 337
s/no LGA NAMES N=245. NO OF SCHOOLS
RANKS ORDER %
1 Abua/Odual 11 7th 4.49 2 Ahoada East 12 6th 4.88 3 Ahoada West 13 5th 5.31 4 Andoni 10 8th 4.08
5 Asari-Toru 11 7th 4.49 6 Bonny 4 10th 1.63 7 Degema 12 6th 4.88 8 Eleme 6 9th 2.45 9 Emohua 19 2nd 7.76 10 Etche 19 2nd 7.76 11 Gokana 12 6th 4.88 12 Ikwerre 13 5th 5.31 13 Khana 22 1st 8.98 14 Obio/Akpor 16 3rd 6.53 15 Ogu/Bolo 3 11th 1.22 16 Okrika 6 9th 2.45 17 Omuma 3 11th 1.22 18 Ogba/Egema/Ndoni 15 4th 6.12 19 Opobo/Nkoro 3 11th 1.22 20 Oyigbo 4 10th 1.63 21 Port Harcourt 15 4th 6.12 22 Tai 10 8th 4.08 23 Akuku-Toru 6 9th 2.45
Total 245 338

19
Analysis shows that Emohua & Etche local Government Areas (LGAs) have 339
19 public secondary schools each , representing 7.76% respectively of the total 340
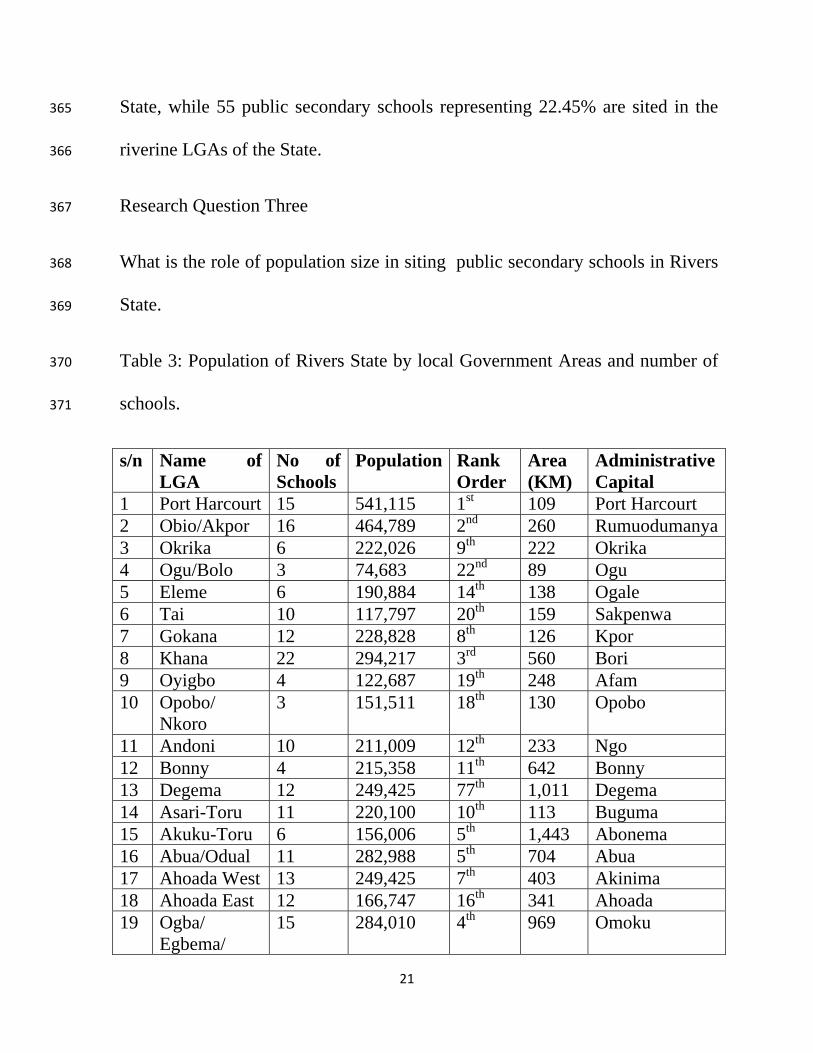
number of public secondary schools in Rivers State. Also, Oyigbo and Bonny 341
Local Government Areas have 4 public secondary schools each, representing 342
1.63% respectively of the total number of public secondary schools in Rivers 343
state. The analysis equally indicates that the total number of public secondary 344
schools in five Local Government Areas, namely, Ogu/Bolo (3-schools, 345
1.22%), Bonny (4 schools, 1.63%), Omuma (3 schools, 1.22%), Opobo/Nkoro 346
(3 schools, 1.22%) and Oyigbo ( 4 schools, 1.63%) are less than the number of 347
secondary schools in one LGA , namely , Khana Local Government Area (22 348
schools, 8.98%). Thus, a wide disparity exists among the Local Government 349
Areas in the distribution of public secondary schools in Rivers State 350
Research Question Two 351
How are public secondary schools distributed in upland and riverine areas of 352
Rivers State? 353
Table 2: Distribution of Public Secondary Schools by Upland and Riverine 354
local Government Areas. 355
s/n Upland LGAs
N=2.45 No. of Schools
% Rank Order
Riverine LGAs
No of Schools
% Rank order
20
1 Abua/Odual 11 4.49 7th Andoni 10 4.08 3rd 2 Ahoada
East 12 4.88 6th Asari-Toru 11 4.49 2nd
3 Ahoada West
13 5.31 5th Bonny 4 1.63 5th
4 Ogba/ Egbema/ Ndoni
15 6.12 4th Degema 12 4.88 1st
5 Eleme 6 2.45 9th Ogu/Bolo 3 1.22 6th 6 Emohua 19 7.76 9th Okrika 6 2.45 4th 7 Etche 19 7.76 2nd Opobo/Nkoro 3 1.22 6th 8 Gokana 12 4.88 6th Akuku-Toru 6 2.45 4th 9 Ikwerre 13 5.31 5th 10 Khana 22 8.98 1st 11 Obio/Akpor 16 6.53 3rd 12 Omuma 3 1.22 11th 13 Oyibo 4 1.63 10th 14 Port
Harcourt 15 6.12 4th
15 Tai 10 4.08 8th Total 190 77.55 55 22.45 356
Table 2, reveals that are 15 local Government Areas in upland, and 8 local 357
Government Areas in the riverine areas of Rivers State. From the data presented 358
in table 2, there are 190 public secondary schools in upland areas, and 55 public 359
secondary schools in riverine Local Government Areas in Rivers State. Further 360
analysis indicates that 77.55% of public secondary schools are sited in upland 361
local Government Areas of Rivers state , while 22.45% are sited in riverine 362
Local Government Areas of the State. Thus, 190 public secondary schools 363
corresponding to 77.55% are located in upland local government Areas of the 364
21
State, while 55 public secondary schools representing 22.45% are sited in the 365
riverine LGAs of the State. 366
Research Question Three 367
What is the role of population size in siting public secondary schools in Rivers 368
State. 369
Table 3: Population of Rivers State by local Government Areas and number of 370
schools. 371
s/n Name of LGA
No of Schools
Population Rank Order
Area (KM)
Administrative Capital
1 Port Harcourt 15 541,115 1st 109 Port Harcourt 2 Obio/Akpor 16 464,789 2nd 260 Rumuodumanya3 Okrika 6 222,026 9th 222 Okrika 4 Ogu/Bolo 3 74,683 22nd 89 Ogu 5 Eleme 6 190,884 14th 138 Ogale 6 Tai 10 117,797 20th 159 Sakpenwa 7 Gokana 12 228,828 8th 126 Kpor 8 Khana 22 294,217 3rd 560 Bori 9 Oyigbo 4 122,687 19th 248 Afam 10 Opobo/
Nkoro 3 151,511 18th 130 Opobo
11 Andoni 10 211,009 12th 233 Ngo 12 Bonny 4 215,358 11th 642 Bonny 13 Degema 12 249,425 77th 1,011 Degema 14 Asari-Toru 11 220,100 10th 113 Buguma 15 Akuku-Toru 6 156,006 5th 1,443 Abonema 16 Abua/Odual 11 282,988 5th 704 Abua 17 Ahoada West 13 249,425 7th 403 Akinima 18 Ahoada East 12 166,747 16th 341 Ahoada 19 Ogba/
Egbema/ 15 284,010 4th 969 Omoku
22
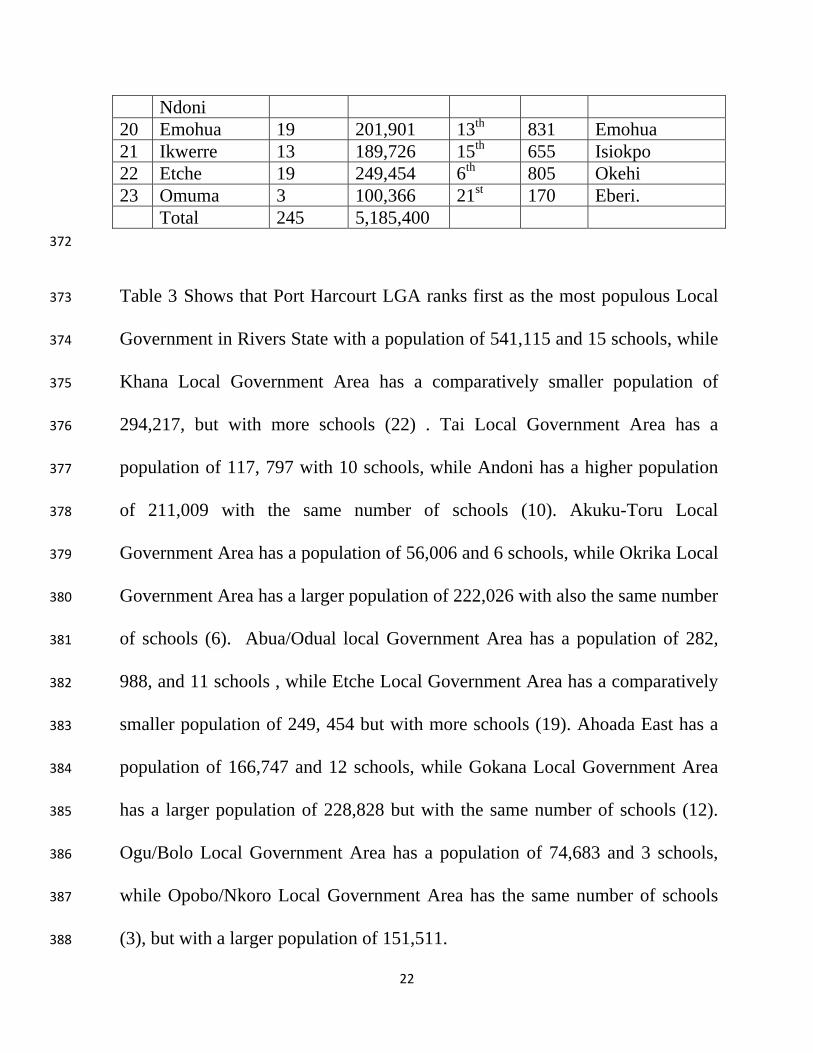
Ndoni 20 Emohua 19 201,901 13th 831 Emohua 21 Ikwerre 13 189,726 15th 655 Isiokpo 22 Etche 19 249,454 6th 805 Okehi 23 Omuma 3 100,366 21st 170 Eberi. Total 245 5,185,400 372
Table 3 Shows that Port Harcourt LGA ranks first as the most populous Local 373
Government in Rivers State with a population of 541,115 and 15 schools, while 374
Khana Local Government Area has a comparatively smaller population of 375
294,217, but with more schools (22) . Tai Local Government Area has a 376
population of 117, 797 with 10 schools, while Andoni has a higher population 377
of 211,009 with the same number of schools (10). Akuku-Toru Local 378
Government Area has a population of 56,006 and 6 schools, while Okrika Local 379
Government Area has a larger population of 222,026 with also the same number 380
of schools (6). Abua/Odual local Government Area has a population of 282, 381
988, and 11 schools , while Etche Local Government Area has a comparatively 382
smaller population of 249, 454 but with more schools (19). Ahoada East has a 383
population of 166,747 and 12 schools, while Gokana Local Government Area 384
has a larger population of 228,828 but with the same number of schools (12). 385
Ogu/Bolo Local Government Area has a population of 74,683 and 3 schools, 386
while Opobo/Nkoro Local Government Area has the same number of schools 387
(3), but with a larger population of 151,511. 388
23
From the preceding analysis it is obvious that population factor was not 389
considered in siting public secondary schools in Rivers State. 390
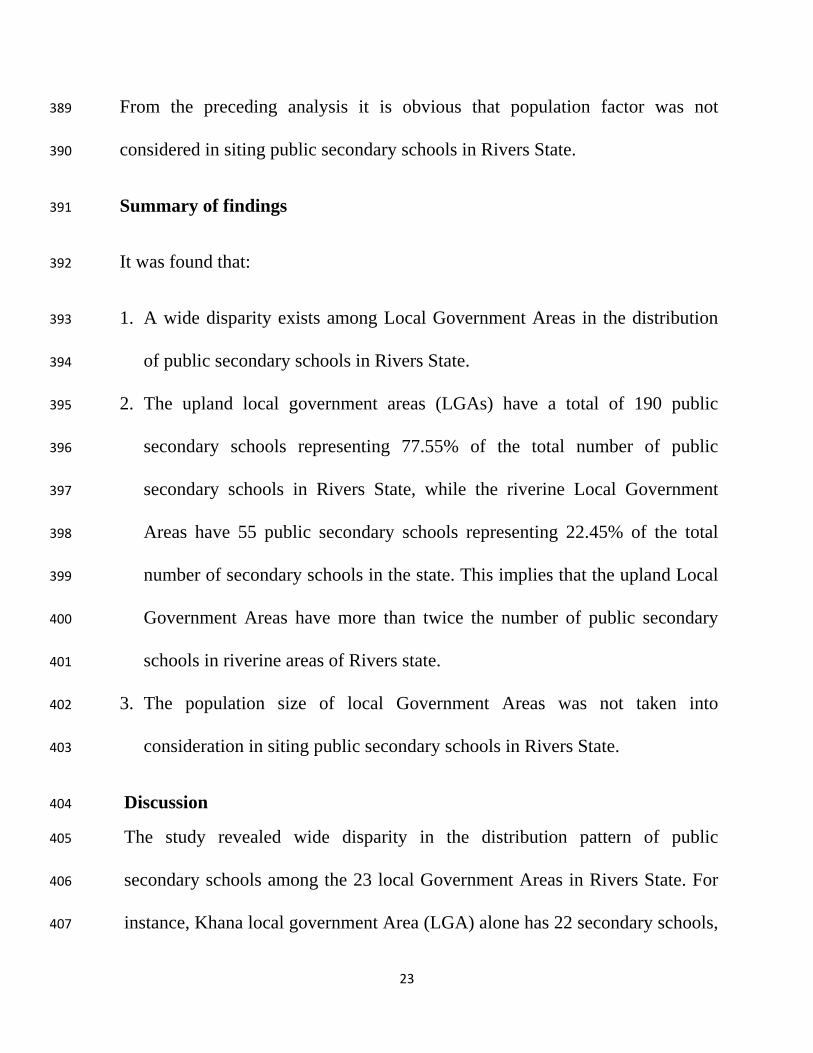
Summary of findings 391
It was found that: 392
1. A wide disparity exists among Local Government Areas in the distribution 393
of public secondary schools in Rivers State. 394
2. The upland local government areas (LGAs) have a total of 190 public 395
secondary schools representing 77.55% of the total number of public 396
secondary schools in Rivers State, while the riverine Local Government 397
Areas have 55 public secondary schools representing 22.45% of the total 398
number of secondary schools in the state. This implies that the upland Local 399
Government Areas have more than twice the number of public secondary 400
schools in riverine areas of Rivers state. 401
3. The population size of local Government Areas was not taken into 402
consideration in siting public secondary schools in Rivers State. 403
Discussion 404
The study revealed wide disparity in the distribution pattern of public 405
secondary schools among the 23 local Government Areas in Rivers State. For 406
instance, Khana local government Area (LGA) alone has 22 secondary schools, 407
24
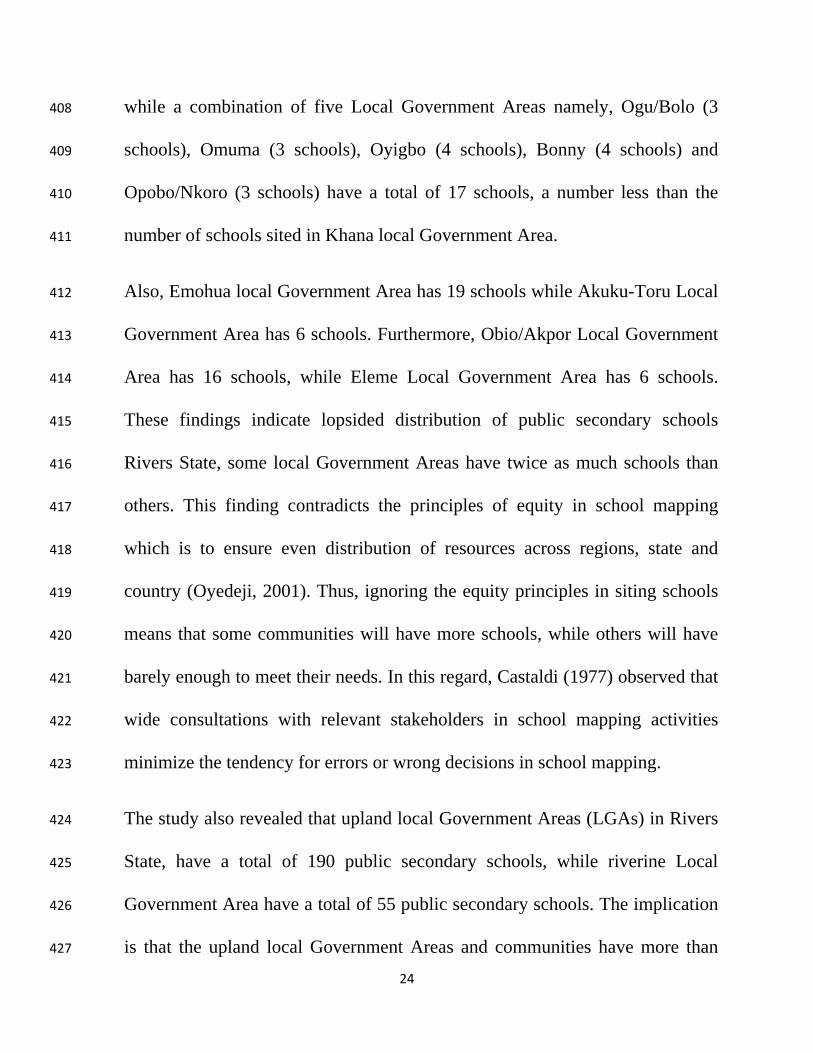
while a combination of five Local Government Areas namely, Ogu/Bolo (3 408
schools), Omuma (3 schools), Oyigbo (4 schools), Bonny (4 schools) and 409
Opobo/Nkoro (3 schools) have a total of 17 schools, a number less than the 410
number of schools sited in Khana local Government Area. 411
Also, Emohua local Government Area has 19 schools while Akuku-Toru Local 412
Government Area has 6 schools. Furthermore, Obio/Akpor Local Government 413
Area has 16 schools, while Eleme Local Government Area has 6 schools. 414
These findings indicate lopsided distribution of public secondary schools 415
Rivers State, some local Government Areas have twice as much schools than 416
others. This finding contradicts the principles of equity in school mapping 417
which is to ensure even distribution of resources across regions, state and 418
country (Oyedeji, 2001). Thus, ignoring the equity principles in siting schools 419
means that some communities will have more schools, while others will have 420
barely enough to meet their needs. In this regard, Castaldi (1977) observed that 421
wide consultations with relevant stakeholders in school mapping activities 422
minimize the tendency for errors or wrong decisions in school mapping. 423
The study also revealed that upland local Government Areas (LGAs) in Rivers 424
State, have a total of 190 public secondary schools, while riverine Local 425
Government Area have a total of 55 public secondary schools. The implication 426
is that the upland local Government Areas and communities have more than 427
25
twice the number of public secondary schools in riverine Local Government 428
Areas and communities in Rivers State. This finding equally indicates 429
imbalance in siting schools across Rivers State. This disparity in the number of 430
schools between the upland and riverine Local Government Areas and 431
communities in Rivers State, could be attributed to geographical factors and 432
political considerations. A major consideration in school mapping is the 433
possibilities of students having access to school, transportation system, and 434
road network. (Igwe, 1998 & Varghese, 1997). In this wise, the riverine areas 435
appear not very advantageous for the siting of schools. Corroborating this 436
view, Uwazuruike (1991) noted that school mapping ensures that educational 437
institutions are sited at their most advantageous locations. This means 438
advantageous from the point of accessibility to the students and full utilization 439
of educational resources. Nevertheless, political considerations could step in 440
relation to the use of school mapping to satisfy the social demand of education. 441
This implies that the socio-cultural configuration of a community should be 442
considered. For instance, rapid rural to urban migration. According to Varghese 443
& Bisval (1999) the government or the political authority could use its policy 444
on school mapping to discourage rural-urban migration, through the 445
establishment of social amenities especially school in rural areas. Based on this 446

26
premise, educational resources including siting of schools could be evenly 447
distributed across regions, state, and country. 448
Furthermore, the study revealed that population size of local government areas 449
(LGAs) was not considered in siting public secondary schools in Rivers State. 450
For instance, Port Harcourt Local Government Area is the most populated 451
Local Government in Rivers State with a population figure of 541,115 and 15 452
schools, while Khana Local Government Area with comparatively lower 453
population figure of 294,217 has as much as 22 schools. Also, Okrika Local 454
Government Area has a population figure of 222,026 and 6 schools, while 455
Akuku-Toru Local Government Area with a lower population of 156, 0006 456
has the same number of schools (6) as Okrika Local Government Area. Further 457
findings indicate that Gokana Local Government Area has a population figure 458
of 228,829 and 12 schools, while Ahoada East Local Government Area with a 459
comparatively lower population figure of 166,747 has the same number of 460
schools (12) as Gokana Local Government Area. In the same vein, Ogu/Bolo 461
Local Government Area has a population figure of 74,683 and 3 schols, while 462
Opobo/Nkoro Local Government Area with a relatively larger population 463
figure of 151,511 also has equivalent number of schools (3) as Ogu/Bolo Local 464
Government Area. These findings contradicts the position of Nwakpa (2015) 465
who observed that schools should be located in areas with high population 466
27
density in order to have enough school children. This means that neglecting 467
population factor in siting schools could result into a situation where many 468
schools exist, but with few students. In the same vein, Arinze (1991) noted that 469
many primary and secondary schools arbitrarily established in Nigeria proved 470
to be unviable in the long run and had to be phased out or reorganized by 471
successive government. Politics of school mapping could give rise to a 472
situation where there could be more schools in certain localities more than the 473
actual need of the people in such locality. According to Nwadiani (2010) this 474
could result into waste of scarce educational resources. 475
Conclusion 476
From the preceding study politicization of education has had a profound 477
influence on school mapping processes. The primary objective of school 478
mapping is the sustenance of a good educational programme. Thus, it is very 479
imperative to locate educational facilities and resources in such a manner that 480
would meet the educational programmes they are meant to serve. School 481
mapping from all indications has not been given the attention it deserves in 482
Rivers State. This calls for equitable distribution of public secondary schools to 483
ensure even educational development of Rivers state. 484
Based on the study the following recommendations were made: 485
28
1. To entrench school mapping principles in the allocation of educational 486
resources in Rivers State, educational planners should be involved in the 487
process of school mapping. 488
2. The Rivers State Ministry of Education should commission a study on the 489
development of mapping activities in Rivers State. The availability of a 490
database will enhance equitable allocation of educational resources and 491
scientific school mapping in River State. 492
3. The principle of equity in the allocation of educational resources should be 493
given prime consideration by the political class to ensure balanced 494
educational development of Rivers State. 495
4. In furtherance to the principle of equitable distribution of public secondary 496
schools , the Rivers State Government should redistribute existing schools or 497
establish additional secondary schools in some local government areas 498
(LGAs) with relatively low number of public secondary schools. The Local 499
Government Areas include Bonny, Omuma, Opobo/Nkoro, Oyibo and 500
Eleme. 501
5. There are a total of fifty-five (55) public secondary schools in riverine local 502
government areas against one hundred and ninety (190) in the upland local 503
government Areas. This gross imbalance calls for redistribution or 504
29
establishment of new schools in riverine local government areas of Rivers 505
State. 506
References 507
Adaja, C. F. & Osagie, R. O. (2015). Politics of school mapping and facilities 508
provision in higher education in Nigeria. In N.M. Abraham, D.O. 509
Durasaro, M. Nwadiani, G.G. Kpee, J.E. Okon & I.A. Odiba (eds) Politics 510
of Education and National Development in Nigeria (pp 82-86). NAEAP; 511
University of Port Harcourt Press. 512
Adesina, S. (1981). Introduction to educational planning. Ile-Ife; University of Ife 513
Press Ltd. 514
Akabue, A. U. (1991). Approaches and conceptual framework for educational 515
planning. In C.N. Uwazuruike (ed) Educational Planning and National 516
Development (pp. 40-45). Awka , Nigeria: Mekslink Publishers. 517
Albert, M. (1991). Effective management. New York: Harper and Row 518
Publications. 519
Arinze, F. O. M. (1991). School mapping: A basic function of educational 520
planning. In C.N. Uwazuruike (ed) Educational planning and National 521
Development: The Nigerian perspective (pp.251 – 257). Awka, Nigeria: 522
Mekslink Publishers. 523
Ary, D., Jacobs, L.C. & Razavieh, A. (2012). Introduction to research in 524
education. California: Thompson Learning. 525
Boles, H. W. (19995). Step by step to better school facilities. New York: Harper & 526
Row Publishers. 527
Caillods, F. & Heyman, S. (1982). Intensive training course on microplanning and 528
school mapping Tanzania/ UNESCO: IIEP. 529
Castaldi, B. (1977). Educational facilities planning, remodeling and management, 530
Bosxens Massachusetts: Allyn and Bacon. 531
Coombs, P. H. (1974). What is educational planning? Paris, France: UNESCO, 532
International Institute of Educational Planning. 533
30
Hallack, J. (1977). Planning the location of school. An instrument of educational 534
policy. Paris: UNESCO: HEP 535
Ibara, E. C. (2006). Determinants of secondary school teachers distribution in 536
Nigerian schools: A case study of Rivers State. Journal of Educational 537
Research and Policies 3(2) 75-79. 538
Ibara, E.C. (2006b). School plant utilization and and maintenance techniques in 539
Nigerian Secondary schools. The case study of Rivers State. African 540
Journal of Development Studies (1&2) 5&6, 86-93 541
Ibara, E. C. (2008). Towards the promotion of school plant maintenance culture in 542
Nigerian educational institutions. Journal of pedagogy and Educational 543
Development 13(1), 51- 54. 544
Ibara, E. C. (2011). School mapping and data indicators. Instruments for micro-545
planning in the Nigerian educational system. Educational planning, 1(20) 546
1-7. 547
Igwe, A. O. (1998). Time to start school mapping. Daily Times newspaper, June 7, 548
Lagos p.8. 549
National Population Commission (2006). Census manual. Nigeria: Abuja. 550
Nwadiani, M. (2010). Economic dimension of educational planning in Nigeria. 551
Theory and practice. Benin , Nigeria: Monose Amalgamates. 552
Nwakpa, P. (2015). Corruption: Bane of Educational Policy Implementation in 553
Nigeria. In N.M. Abraham, D.O. Durasaro, M. Nwadiani, G.G. Kpoee, J.E. 554
Okon & I.A. Odiba (eds) Politics of Education and National Development 555
in Nigeria( pp. 138-140). NAEAP; University of Port Harcourt. 556
Nwankwo, J. I. (1981). Educational planning: theory and methods. Nigeria: 557
Izharsons. 558
Okeke, B.S. (1995). Qualitative research in education: supervisors perspective. 559
Port Harcourt: Bengray publishing Co. 560
Olaniyan, O. D. & Anthony, K.I. (2013). Effect of inadequate school plant on 561
academic performance of Nigerian secondary school students. 562
International Journal of Humanities and Management Sciences 1, 198-563
200. 564

31
Oyebade, S.A. (2009). School mapping and facilties analysis. In J.B. Babalola & 565
A.O. Ayeni (eds.) Educational Management: Theories and Tasks (pp 40-566
48). Yaba, Lagos: Macmillan Nigeria Publishers Ltd. 567
Oyedeji, N. B. (2001). The palestine school mapping project. School of geography. 568
University of New South Wales. 569
Rivers State Ministry of Education (2010). Planning, research and statistics 570
bulletin. Port Harcourt. 571
Uwazuruike, C.N. (1991). Approaches and methods of educational planning in 572
Nigeria. In C.N. Uwazuruiike (ed). Educational Planning and National 573
Development (pp 15-27). Awka , Nigeria: Mekslink Publishers. 574
Varghese, V.V. & Bisval, K. K. (1999) School mapping: An analysis of 575
educational facilities in Dhenkanal District. New Delhi National Institute 576
of Educational Planning and Administration 577
Varghese, N.V. (1997). School mapping. New Delhi, India: National Institute of 578
Educational Planning and Administration. 579
Yoko, M. (2001). Application of GIS in school in Bangkok. Thailand: Asia Centre 580
for Research on Remote sensing. 581
Related Documents