BioOne sees sustainable scholarly publishing as an inherently collaborative enterprise connecting authors, nonprofit publishers, academic institutions,research libraries, and research funders in the common goal of maximizing access to critical research.
Profits and Margins along Uganda's Charcoal Value ChainAuthor(s): G. Shively, P. Jagger, D. Sserunkuuma, A. Arinaitwe and C. ChibwanaSource: International Forestry Review, 12(3):270-283. 2010.Published By: Commonwealth Forestry AssociationURL: http://www.bioone.org/doi/full/10.1505/ifor.12.3.270
BioOne (www.bioone.org) is a nonprofit, online aggregation of core research in the biological, ecological,and environmental sciences. BioOne provides a sustainable online platform for over 170 journals and bookspublished by nonprofit societies, associations, museums, institutions, and presses.
Your use of this PDF, the BioOne Web site, and all posted and associated content indicates your acceptance ofBioOne’s Terms of Use, available at www.bioone.org/page/terms_of_use.
Usage of BioOne content is strictly limited to personal, educational, and non-commercial use. Commercialinquiries or rights and permissions requests should be directed to the individual publisher as copyright holder.
Profits and margins along Uganda’s charcoal value
chain
G. SHIVELY1,2, P. JAGGER3, D. SSERUNKUUMA3, A. ARINAITWE3 and C. CHIBWANA6
1 Department of Agricultural Economics, Purdue University, 403 West State Street, West Lafayette, Indiana, USA2 Department of Economics and Resource Management, Norwegian University of Life Sciences, Ås, Norway3 Department of Public Policy, University of North Carolina at Chapel Hill, CB#3435 Abernethy Hall, Chapel Hill, NC,USA4 Department of Agricultural Economics and Agribusiness, Makerere University, P.O. Box 7062, Kampala, Uganda5 USAID, P.O. Box 7856, Kampala, Uganda6 International Food Policy Research Institute, P.O. Box 31666, Lilongwe, Malawi
Email: [email protected]
SUMMARY
This paper characterizes the charcoal value chain in Uganda, focusing on production and trade in three districts in the west central region
of the country. Data come from surveys of 407 charcoal value chain participants undertaken in 2008. The surveys included 171 charcoal-
producing households and 236 non-producer participants including agents, traders, transporters and retailers. Linear regression models are
used to study overall profits and per-unit marketing margins along the value chain and to test several hypotheses regarding the importance of
location, human and social capital, and asset ownership on observed economic returns and scale of activity. Evidence suggests the greatest
overall returns to participation in the charcoal value chain are found among traders. Returns are positively correlated with the scale of
activity. Controlling for a participant’s role in the charcoal trade, his or her characteristics, and available assets, we find little or no evidence
of differences in economic returns among districts, despite widespread popular views of differences in available supply of charcoal. Location
of production relative to major markets, and location-specific levels of monitoring and enforcement are not strongly correlated with observed
outcomes.
Keywords: forestry, marketing, sustainable forest management, supply chains
Profits et marges dans la chaîne de valeur du charbon en Uganda
G. SHIVELY, P. JAGGER, D. SSERUNKUUMA, A. ARINAITWE, ET C. CHIBWANA
Cet article inspecte les traits caractéristiques de la chaine de valeur du charbon en Uganda, en se concentrant particulièrement sur la production
et le commerce dans trois districts dans l’Ouest de la région centrale du pays. Les données proviennent d’études des 4007 participants de
la chaine de valeur du charbon conduites en 2008. Ces études comprenaient 171 foyers producteurs de charbon et 236 participants non-
producteurs, comme les agents, les commerçants, les transporteurs et les détaillants . Des modèles de régression linéaires sont utilisés pour
étudier les profits totaux et les marges de marketting par unité au long de la chaine de valeur, et pour tester plusieurs hypothèses concernant
l’importance de la location, le capital humain et social, et la posession des valeurs sur les bénéfices économiques observés et sur l’échelle
de l’activité. Les résultats suggèrent que les bénéfices totaux les plus importants provenant de la participation dans la chaine de valeur du
charbon résident chez les commerçants. Une corrélation positive existe avec l’échelle d’activité. En contrôlant le rôle des participants dans
le commerce du charbon, leurs caractéristiques et leurs ressources disponibles, on trouve peu, voire aucune preuve de différences dans les
bénéfices économiques, contrairement aux vues courantes et répandues de différences dans les quantités disponibles de charbon. La location
de la production comparée aux marchés majeurs, et les niveaux de gestion et sa mise en application en location spécifique ne sont pas liés
fortement aux résultats observés.
Los beneficios y los márgenes de ganancia en la cadena de valor del carbón vegetal en Uganda
G. SHIVELY, P. JAGGER, D. SSERUNKUUMA, A. ARINAITWE Y C. CHIBWANA
Este estudio dibuja la cadena de valor de carbón vegetal en Uganda, centrándose en la producción y el comercio en tres distritos de la región
centro-occidental del país. Los datos provienen de una encuesta que fue realizada en el año 2008, con la participación de 407 interesados de
la cadena de valor del carbón vegetal. La encuesta abarcó 171 hogares productores de carbón y 236 participantes no productores, incluyendo
agentes, comerciantes, transportistas y detallistas. Se utilizaron modelos de regresión lineal para estudiar las ganancias globales y los
márgenes de venta por unidad en toda la cadena de valor, y para probar varias hipótesis sobre la influencia de la ubicación, el capital humano
y social y la posesión de recursos sobre el rendimiento económico observado y la escala de actividad. Las evidencias sugieren que el mayor
rendimiento global para la participación en la cadena de valor de carbón se encuentra entre los comerciantes, y que los ingresos tienen una
correlación positiva con la escala de actividad. Un análisis de los papeles desempeñados por los participantes en el comercio de carbón y de
270
INTRODUCTION
A considerable body of research has focused on global
commodity chains for high value forest products (Gellert
2003, Smith 2005, Jensen 2009). Nevertheless, forestry’s
role in the development discourse has recently shifted, and
observers are increasingly interested in the contribution
of small-scale forestry and minor forest product markets
to sustainable development and poverty reduction (Singh
2008, Vyamana 2009). Moreover, little is known about
the distributional implications of the structure of these
forest product markets (Angelsen and Wunder 2003, Ribot
2006). As a result, the importance of understanding the
structure and function of value chains for commodities
produced, marketed and utilized – both domestically and
internationally – has increased (Bardhan et al. 2001, Panya
1993, Shyamsundar and Kramer 1996). Knowledge about
the structure and distribution of profits and margins along
value chains provides information to policy makers about
potential opportunities for improving the welfare gains
from forestry-related activities, identifying points of entry
for mechanisms that influence levels of production and
distribution, and brings to light the degree to which forestry
related activities contribute to local and national economies.
Value chain analysis is both a descriptive and analytical tool.
In addition to providing valuable information about markets
it provides key insights about inter-firm cooperation and
competition, governance, barriers to entry and geographic
coverage (Kaplinsky and Morris 2000, Kaplinsky 2001).
The characteristics of charcoal value chains remain
largely ignored in the literature. Understanding charcoal
production, trade and consumption has important
implications for sustainable development in the forestry
sector. Charcoal is the primary cooking and heating fuel
for urban populations in sub-Saharan Africa. Charcoal is
an attractive fuel for urban households because it offers far
greater energy per-unit volume than unprocessed fuel wood.
The majority of urban and peri-urban areas surrounding
African cities are deforested or highly degraded, which
means that biomass must be transported over relatively long
distances. Given high transportation costs throughout sub-
Saharan Africa, charcoal is much more efficient to transport
than the energy equivalent volume of fuel wood. Further,
charcoal is known as a transition fuel. As incomes rise
and cities become more heavily populated and congested,
charcoal is called upon to meet the needs of consumers in
established and rapidly urbanizing environments who cannot
afford more costly sources of energy (Barnes et al. 2005). At
a global level, use of wood fuel in many developing regions
of the world has been shown to grow at a rate roughly in
line with population (Broadhead et al. 2001). This suggests
that the size and importance of the charcoal sector in sub-
Saharan Africa will continue to grow for the foreseeable
future, particularly where income growth is slow, electricity
infrastructure is sparse, and technology adoption to support
alternative fuels is sluggish. Moreover, as climate changes,
the importance of forest loss and forest degradation due to
energy demands is likely to increase (Bonan 2008).
In most countries, charcoal consumption tends to occur
on a small scale, and involves numerous end-users who
make frequent purchases in small quantities, without much
concern for the economic and environmental impacts of their
consumption. Charcoal production generally (though not
always) takes place on a small scale and threatens the long-
term sustainability of forest ecosystems and the livelihoods of
the rural poor who depend on forest resources (Arnold et al. 2006, Girard 2002). Although studies of charcoal producers
and consumers are relatively rare (but see Ribot 1998,
Brouwer and Magane 1999, Sankhayan and Hofstad 2000,
SEI 2002, Singh 2008, World Bank 2009), some stylized
facts are known: charcoal producers are likely to be poor,
with low agricultural capacity and few productive assets.
They often turn to charcoal production because they lack the
skills or opportunities for diversifying into other livelihood
activities. Charcoal consumers, on the other hand, are drawn
from all points of the income distribution and are primarily,
though not exclusively, urban. In most settings, knowledge of
the characteristics and role of other actors in the value chain
– including middlemen, transporters, traders and retailers – is
limited and largely based on anecdotal evidence.
The focus of this paper is the structure and function
of the charcoal supply chain in Uganda. Previous work
on Uganda’s forest product sector includes ESD (1995),
Kisakye (2001, 2004), Knöpfle (2004) and Namaalwa et al. (2009). Information on the charcoal value chain is critical to
forecasting the biomass requirements for charcoal production
in the face of increasing deforestation rates, and provides
important information about the capacity for charcoal
production and trade to enhance livelihoods. Further, small
and medium enterprise development in the forestry sector
is an overarching objective of Uganda’s new National
Forestry Policy (MWLE 2001). Better information about
the charcoal value chain facilitates identifying opportunities
for the more efficient organization of charcoal markets,
producer cooperatives, and other institutions that enhance
returns to value chain participants (Auren and Krassowska
2004). The objective in this paper is to provide an accurate
and detailed portrait of the supply side of the value chain
from several of the dominant charcoal producing regions of
the country. The analysis draws on survey data collected in
2008 in three districts, among 407 individuals participating
in charcoal production and trade. A characterization of the
participants and institutions relevant to the charcoal value
chain is provided, along with a comprehensive analysis using
sus características y activos disponibles demuestra poca o ninguna evidencia de una diferencia en el rendimiento económico entre distritos,
a pesar de las opiniones expresadas de forma extendida sobre diferencias en la disponibilidad del carbón. Basándose en los resultados
observados, no parece existir una correlación fuerte con el lugar de producción y su distancia de los mercados importantes, ni con los niveles
de monitoreo y aplicación de los reglamentos en los diferentes distritos.
271
linear regression of profits and margins for participants on the
supply side of the charcoal market.1 Several hypotheses are
tested regarding the importance to economic returns of human
and social capital, asset ownership, and location of activity.
STUDY AREA, DATA AND METHODS
Study Area
Charcoal is produced throughout Uganda. The highest levels
of production occur in areas with woodland ecosystems that
support high-quality vegetation for charcoal production.
The major charcoal producing regions include central
Uganda and parts of western and northern Uganda. The
main species utilized for production include: Combretum; Terminalia; Albizia; Acacia; Allophylus and Grewia spp. Woodlands constitute roughly 3 975 000 hectares or 81 per
cent of Uganda’s total forested area (MWLE 2001). Most
of Uganda’s woodland areas are characterized by relatively
low rainfall resulting in the dominance of extensive mixed
crop-livestock farming systems. Charcoal production is
frequently undertaken as a primary activity by households
with few other income generating opportunities, or as a
complement to land clearing which produces large volumes
of raw material suitable for conversion to charcoal.
For this study, two major charcoal producing districts
(Masindi and Nakasongola), and one emerging charcoal
producing district (Hoima) were purposively selected.
Namaalwa et al. (2009) estimate that these districts,
combined with Luweero and Southern Apac account for
roughly half of the total charcoal consumed in Kampala,
the urban end market for the bulk of charcoal produced
in Uganda. Charcoal production and trade is a significant
activity in Masindi district. The eastern part of Masindi is
dry with low agricultural potential. Masindi’s range lands
were ranches controlled by the central government and the
Bunyoro kingdom until they were abandoned during the
insurgency in the early 1980s. Woodlands on abandoned
ranches underwent significant regeneration, favouring
species particularly well-suited to high quality charcoal
production. Former government ranches are currently
being privatized, leading to re-establishment of pastures.
This transformation is often preceded by land clearing and
charcoal production. In addition to small-scale charcoal
production, Masindi attracts large-scale charcoal merchants
from Kampala who purchase standing trees on areas as large
as a square mile and then bring crews of 100 or more workers
to clear the land. The economics of converting woodland to
pasture in this way are quite favourable. For example, an
acre of land costs about 300 000 UgShs (approximately 166
USD), but a landowner can sell the associated timber to a
charcoal producer for as much as 200 000 UgShs (111 USD)
1 There is a dearth of information about the demand side of
Uganda’s charcoal value chain; surveying a representative sample
of consumers in urban areas was beyond the scope of this study.
Limited information about energy demand in Uganda is provided
by Sebbit et al. (2004).
(1 800 UgShs = 1USD). Landless refugees and internally
displaced people from northern Uganda supply much of
the labour used in this activity. Many of these individuals
consider themselves to be temporary visitors to Masindi.
Relative peace in northern Uganda and repatriation of
Sudanese refugees, many of whom were believed to have
been involved in charcoal production suggest the supply of
labour for large-scale charcoal production may be declining
in Masindi. Trader networks are well established in Masindi;
the bulk of charcoal is transported to Kampala via the Gulu-
Kampala highway. In Masindi town (population roughly 39
000) there is a small urban market for charcoal.
Charcoal production in Nakasongola is generally
undertaken by local residents. The area is heavily wooded
with species well-suited to charcoal production. This area
is in the cattle corridor but contains some crop production
and presents an overall mosaic of land uses. The area is dry,
with occasional crop failures; many households use charcoal
production to cope with production risk. Given its proximity
to Kampala, farm-gate charcoal prices in Nakasongola are
relatively high and deforestation and forest degradation has
been rapid. Long-established charcoal traders operate in the
district. There is a very limited urban market for charcoal in
Nakasongola district. Virtually all charcoal sold by producers
makes its way to markets in nearby Kampala.
Of the three charcoal producing districts included in
this study, Hoima is a relative newcomer. Several factors
are perceived as contributing to the increase in charcoal
production in Hoima district. These include declining stocks
of biomass suitable for charcoal production in traditional
charcoal producing areas, land clearing for agriculture and
livestock production, and completion of a good quality all-
season tarmac road which has vastly reduced travel time
and improved conditions for transporters and traders. Much
charcoal production is confined to marginal areas with low
population density, especially along the Kafu River. Many
charcoal producers are immigrants from West Nile district
who are either landless or rent small parcels of farm land.
The presence of charcoal traders and transporters in Hoima
is a relatively new phenomenon. Transporters pick up
charcoal at various points along major roads after brokers
and traders have organized its delivery to specified pick-up
locations. Hoima town has a population of approximately
37 000 people. While some of the charcoal produced within
the district is sold in Hoima, the bulk of it is transported
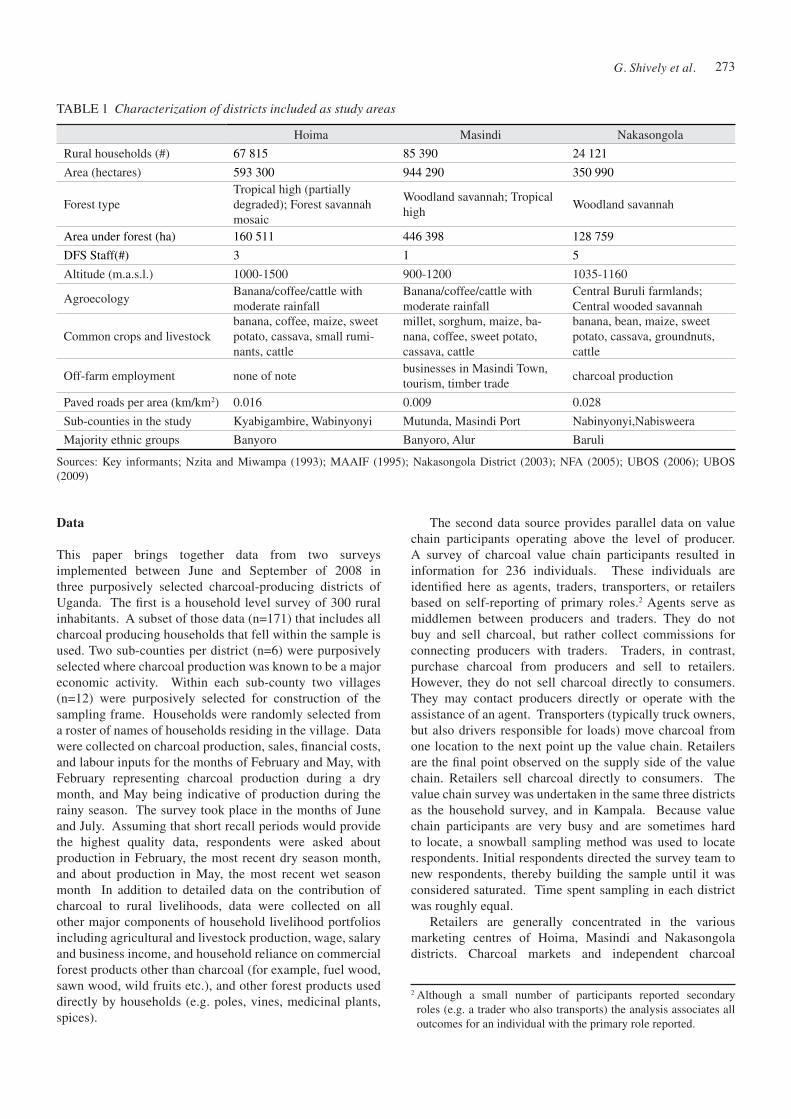
to Kampala. Characteristics of the three districts are
summarized in Table 1.
Kampala and its surrounding suburbs are the final
destinations for the bulk of the charcoal produced in the
three districts. This capital city has an estimated population
of 1.5 million, and an annual population growth rate of 4.4
per cent (UBOS 2009, United Nations 2009). Demand for
charcoal has increased substantially since the early 1990s
and is projected to continue to increase despite evidence
that the supply of wood suitable for charcoal production is
severely compromised (Namaalwa et al. 2009).
272
Data
This paper brings together data from two surveys
implemented between June and September of 2008 in
three purposively selected charcoal-producing districts of
Uganda. The first is a household level survey of 300 rural
inhabitants. A subset of those data (n=171) that includes all
charcoal producing households that fell within the sample is
used. Two sub-counties per district (n=6) were purposively
selected where charcoal production was known to be a major
economic activity. Within each sub-county two villages
(n=12) were purposively selected for construction of the
sampling frame. Households were randomly selected from
a roster of names of households residing in the village. Data
were collected on charcoal production, sales, financial costs,
and labour inputs for the months of February and May, with
February representing charcoal production during a dry
month, and May being indicative of production during the
rainy season. The survey took place in the months of June
and July. Assuming that short recall periods would provide
the highest quality data, respondents were asked about
production in February, the most recent dry season month,
and about production in May, the most recent wet season
month In addition to detailed data on the contribution of
charcoal to rural livelihoods, data were collected on all
other major components of household livelihood portfolios
including agricultural and livestock production, wage, salary
and business income, and household reliance on commercial
forest products other than charcoal (for example, fuel wood,
sawn wood, wild fruits etc.), and other forest products used
directly by households (e.g. poles, vines, medicinal plants,
spices).
The second data source provides parallel data on value
chain participants operating above the level of producer.
A survey of charcoal value chain participants resulted in
information for 236 individuals. These individuals are
identified here as agents, traders, transporters, or retailers
based on self-reporting of primary roles.2 Agents serve as
middlemen between producers and traders. They do not
buy and sell charcoal, but rather collect commissions for
connecting producers with traders. Traders, in contrast,
purchase charcoal from producers and sell to retailers.
However, they do not sell charcoal directly to consumers.
They may contact producers directly or operate with the
assistance of an agent. Transporters (typically truck owners,
but also drivers responsible for loads) move charcoal from
one location to the next point up the value chain. Retailers
are the final point observed on the supply side of the value
chain. Retailers sell charcoal directly to consumers. The
value chain survey was undertaken in the same three districts
as the household survey, and in Kampala. Because value
chain participants are very busy and are sometimes hard
to locate, a snowball sampling method was used to locate
respondents. Initial respondents directed the survey team to
new respondents, thereby building the sample until it was
considered saturated. Time spent sampling in each district
was roughly equal.
Retailers are generally concentrated in the various
marketing centres of Hoima, Masindi and Nakasongola
districts. Charcoal markets and independent charcoal
2 Although a small number of participants reported secondary
roles (e.g. a trader who also transports) the analysis associates all
outcomes for an individual with the primary role reported.
Hoima Masindi Nakasongola
Rural households (#) 67 815 85 390 24 121
Area (hectares) 593 300 944 290 350 990
Forest type
Tropical high (partially
degraded); Forest savannah
mosaic
Woodland savannah; Tropical
high Woodland savannah
Area under forest (ha) 160 511 446 398 128 759
DFS Staff(#) 3 1 5
Altitude (m.a.s.l.) 1000-1500 900-1200 1035-1160
Agroecology Banana/coffee/cattle with
moderate rainfall
Banana/coffee/cattle with
moderate rainfall
Central Buruli farmlands;
Central wooded savannah
Common crops and livestock
banana, coffee, maize, sweet
potato, cassava, small rumi-
nants, cattle
millet, sorghum, maize, ba-
nana, coffee, sweet potato,
cassava, cattle
banana, bean, maize, sweet
potato, cassava, groundnuts,
cattle
Off-farm employment none of notebusinesses in Masindi Town,
tourism, timber tradecharcoal production
Paved roads per area (km/km2) 0.016 0.009 0.028
Sub-counties in the study Kyabigambire, Wabinyonyi Mutunda, Masindi Port Nabinyonyi,Nabisweera
Majority ethnic groups Banyoro Banyoro, Alur Baruli
TABLE 1 Characterization of districts included as study areas
Sources: Key informants; Nzita and Miwampa (1993); MAAIF (1995); Nakasongola District (2003); NFA (2005); UBOS (2006); UBOS
(2009)
273
vending stalls were the focus of the data collection in
Kampala. As with the household survey, the value chain
survey included data on purchases, sales and costs for the
months of February and May. The months of February and
May were ranked by the value chain survey respondents as
1st and 3rd in terms of the frequency of market participation,
1st and 4th in terms of peak profitability, and 5th and 8th in term
of lowest profitability respectively. Additional information
was collected on participant demographics, social capital
(here proxied by the number of interactions with other
types of actors in the value chain and the longevity of these
business relationships), incidence of repeated interactions,
and respondent estimates of the total number of participants
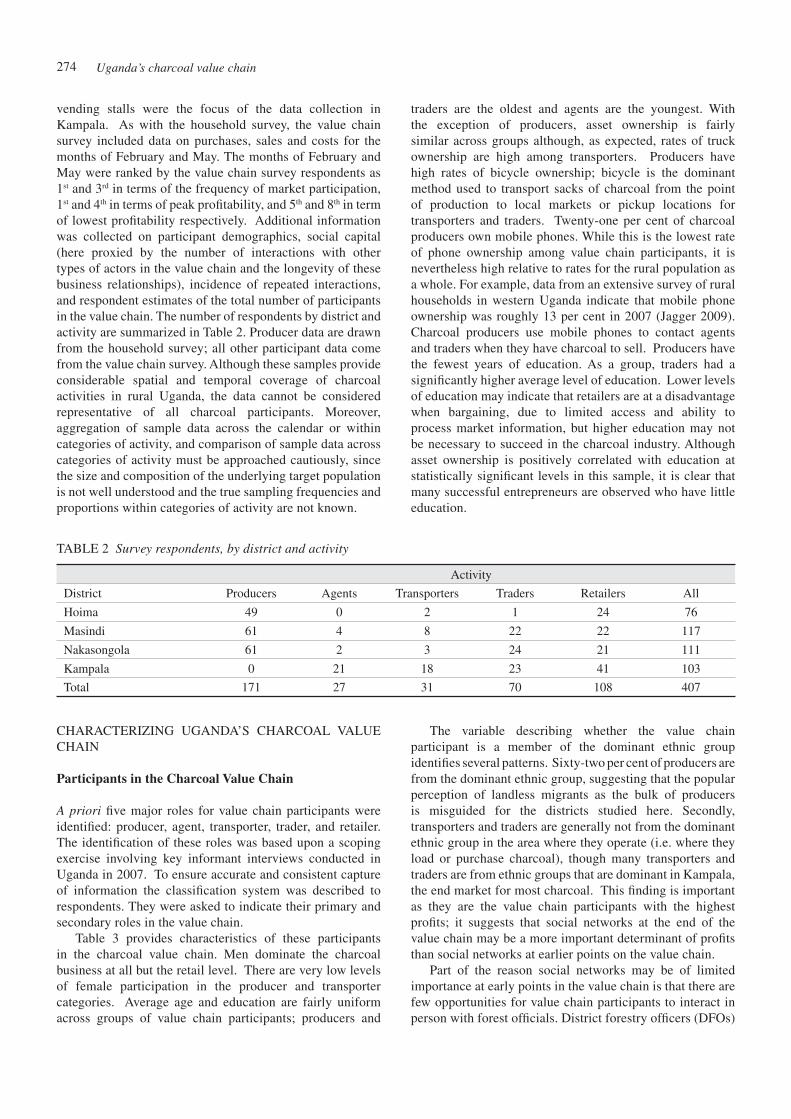
in the value chain. The number of respondents by district and
activity are summarized in Table 2. Producer data are drawn
from the household survey; all other participant data come
from the value chain survey. Although these samples provide
considerable spatial and temporal coverage of charcoal
activities in rural Uganda, the data cannot be considered
representative of all charcoal participants. Moreover,
aggregation of sample data across the calendar or within
categories of activity, and comparison of sample data across
categories of activity must be approached cautiously, since
the size and composition of the underlying target population
is not well understood and the true sampling frequencies and
proportions within categories of activity are not known.
traders are the oldest and agents are the youngest. With
the exception of producers, asset ownership is fairly
similar across groups although, as expected, rates of truck
ownership are high among transporters. Producers have
high rates of bicycle ownership; bicycle is the dominant
method used to transport sacks of charcoal from the point
of production to local markets or pickup locations for
transporters and traders. Twenty-one per cent of charcoal
producers own mobile phones. While this is the lowest rate
of phone ownership among value chain participants, it is
nevertheless high relative to rates for the rural population as
a whole. For example, data from an extensive survey of rural
households in western Uganda indicate that mobile phone
ownership was roughly 13 per cent in 2007 (Jagger 2009).
Charcoal producers use mobile phones to contact agents
and traders when they have charcoal to sell. Producers have
the fewest years of education. As a group, traders had a
significantly higher average level of education. Lower levels
of education may indicate that retailers are at a disadvantage
when bargaining, due to limited access and ability to
process market information, but higher education may not
be necessary to succeed in the charcoal industry. Although
asset ownership is positively correlated with education at
statistically significant levels in this sample, it is clear that
many successful entrepreneurs are observed who have little
education.
TABLE 2 Survey respondents, by district and activity
Activity
District Producers Agents Transporters Traders Retailers All
Hoima 49 0 2 1 24 76
Masindi 61 4 8 22 22 117
Nakasongola 61 2 3 24 21 111
Kampala 0 21 18 23 41 103
Total 171 27 31 70 108 407
CHARACTERIZING UGANDA’S CHARCOAL VALUE
CHAIN
Participants in the Charcoal Value Chain
A priori five major roles for value chain participants were
identified: producer, agent, transporter, trader, and retailer.
The identification of these roles was based upon a scoping
exercise involving key informant interviews conducted in
Uganda in 2007. To ensure accurate and consistent capture
of information the classification system was described to
respondents. They were asked to indicate their primary and
secondary roles in the value chain.
Table 3 provides characteristics of these participants
in the charcoal value chain. Men dominate the charcoal
business at all but the retail level. There are very low levels
of female participation in the producer and transporter
categories. Average age and education are fairly uniform
across groups of value chain participants; producers and
The variable describing whether the value chain
participant is a member of the dominant ethnic group
identifies several patterns. Sixty-two per cent of producers are
from the dominant ethnic group, suggesting that the popular
perception of landless migrants as the bulk of producers
is misguided for the districts studied here. Secondly,
transporters and traders are generally not from the dominant
ethnic group in the area where they operate (i.e. where they
load or purchase charcoal), though many transporters and
traders are from ethnic groups that are dominant in Kampala,
the end market for most charcoal. This finding is important
as they are the value chain participants with the highest
profits; it suggests that social networks at the end of the
value chain may be a more important determinant of profits
than social networks at earlier points on the value chain.
Part of the reason social networks may be of limited
importance at early points in the value chain is that there are
few opportunities for value chain participants to interact in
person with forest officials. District forestry officers (DFOs)
274
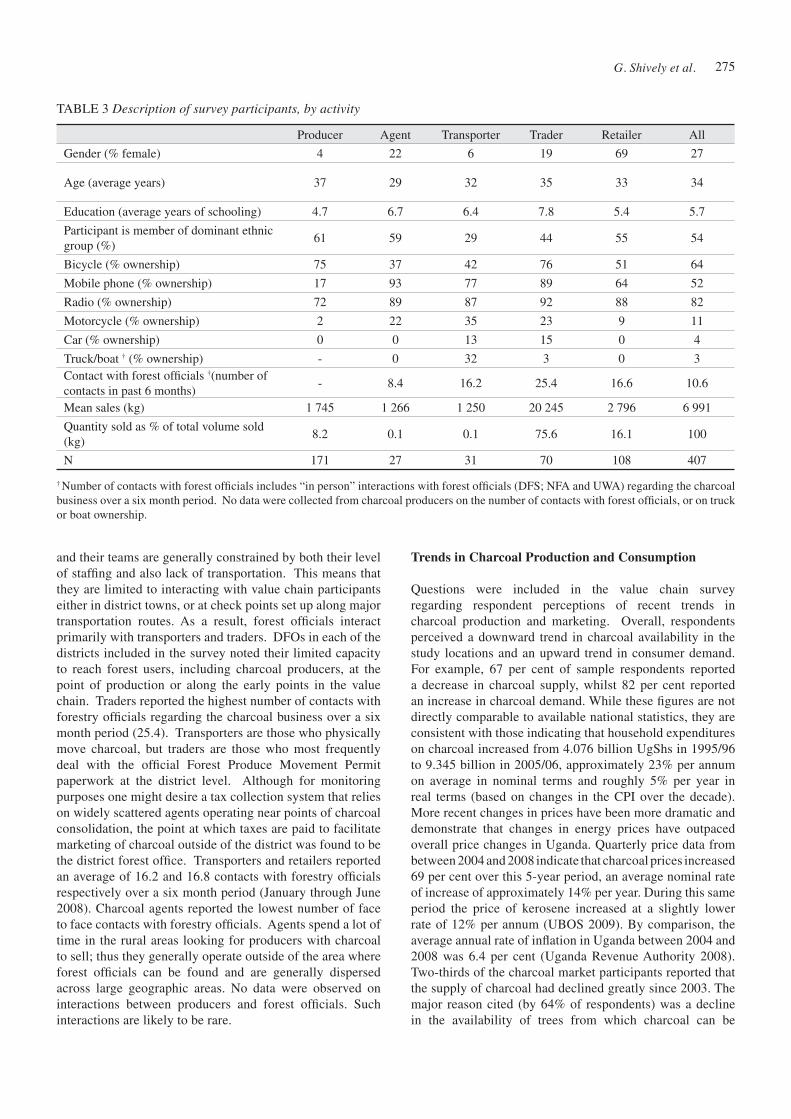
TABLE 3 Description of survey participants, by activity
Producer Agent Transporter Trader Retailer All
Gender (% female) 4 22 6 19 69 27
Age (average years) 37 29 32 35 33 34
Education (average years of schooling) 4.7 6.7 6.4 7.8 5.4 5.7
Participant is member of dominant ethnic
group (%)61 59 29 44 55 54
Bicycle (% ownership) 75 37 42 76 51 64
Mobile phone (% ownership) 17 93 77 89 64 52
Radio (% ownership) 72 89 87 92 88 82
Motorcycle (% ownership) 2 22 35 23 9 11
Car (% ownership) 0 0 13 15 0 4
Truck/boat † (% ownership) - 0 32 3 0 3
Contact with forest officials †(number of
contacts in past 6 months)- 8.4 16.2 25.4 16.6 10.6
Mean sales (kg) 1 745 1 266 1 250 20 245 2 796 6 991
Quantity sold as % of total volume sold
(kg)8.2 0.1 0.1 75.6 16.1 100
N 171 27 31 70 108 407
† Number of contacts with forest officials includes “in person” interactions with forest officials (DFS; NFA and UWA) regarding the charcoal
business over a six month period. No data were collected from charcoal producers on the number of contacts with forest officials, or on truck
or boat ownership.
and their teams are generally constrained by both their level
of staffing and also lack of transportation. This means that
they are limited to interacting with value chain participants
either in district towns, or at check points set up along major
transportation routes. As a result, forest officials interact
primarily with transporters and traders. DFOs in each of the
districts included in the survey noted their limited capacity
to reach forest users, including charcoal producers, at the
point of production or along the early points in the value
chain. Traders reported the highest number of contacts with
forestry officials regarding the charcoal business over a six
month period (25.4). Transporters are those who physically
move charcoal, but traders are those who most frequently
deal with the official Forest Produce Movement Permit
paperwork at the district level. Although for monitoring
purposes one might desire a tax collection system that relies
on widely scattered agents operating near points of charcoal
consolidation, the point at which taxes are paid to facilitate
marketing of charcoal outside of the district was found to be
the district forest office. Transporters and retailers reported
an average of 16.2 and 16.8 contacts with forestry officials
respectively over a six month period (January through June
2008). Charcoal agents reported the lowest number of face
to face contacts with forestry officials. Agents spend a lot of
time in the rural areas looking for producers with charcoal
to sell; thus they generally operate outside of the area where
forest officials can be found and are generally dispersed
across large geographic areas. No data were observed on
interactions between producers and forest officials. Such
interactions are likely to be rare.
Trends in Charcoal Production and Consumption
Questions were included in the value chain survey
regarding respondent perceptions of recent trends in
charcoal production and marketing. Overall, respondents
perceived a downward trend in charcoal availability in the
study locations and an upward trend in consumer demand.
For example, 67 per cent of sample respondents reported
a decrease in charcoal supply, whilst 82 per cent reported
an increase in charcoal demand. While these figures are not
directly comparable to available national statistics, they are
consistent with those indicating that household expenditures
on charcoal increased from 4.076 billion UgShs in 1995/96
to 9.345 billion in 2005/06, approximately 23% per annum
on average in nominal terms and roughly 5% per year in
real terms (based on changes in the CPI over the decade).
More recent changes in prices have been more dramatic and
demonstrate that changes in energy prices have outpaced
overall price changes in Uganda. Quarterly price data from
between 2004 and 2008 indicate that charcoal prices increased
69 per cent over this 5-year period, an average nominal rate
of increase of approximately 14% per year. During this same
period the price of kerosene increased at a slightly lower
rate of 12% per annum (UBOS 2009). By comparison, the
average annual rate of inflation in Uganda between 2004 and
2008 was 6.4 per cent (Uganda Revenue Authority 2008).
Two-thirds of the charcoal market participants reported that
the supply of charcoal had declined greatly since 2003. The
major reason cited (by 64% of respondents) was a decline
in the availability of trees from which charcoal can be
275
derived. Other reasons mentioned included an increase in
the number of people venturing into charcoal production for
a livelihood, growing consumer demand for charcoal, and
an overall increase in the profitability of the charcoal trade.
The general perception is that enforcement of regulations
governing charcoal production and trade has remained
unchanged since 2003 and that demand has increased
steadily in the face of constraints on supply. A rapid run-up
in prices has resulted.
In terms of overall charcoal activity represented by
responses to our surveys, producers accounted for roughly
8 per cent of all reported charcoal transactions, and charcoal
traders accounted for 76 per cent. Producers accounted for
about 16 per cent of the total volume of recorded sales in the
survey. On average, each trader sold 20 tons of charcoal over
the previous year and earned 79 per cent of the final value of
all charcoal counted as sales in the survey.3
Regulating Charcoal Production and Trade
The majority of charcoal produced in the three districts
comes from private lands which fall under the jurisdiction
of the district forest services (DFS). Since a major forest
sector decentralization reform in 2003, DFS has had
responsibility for monitoring and enforcing rules related
to charcoal production on private lands, and plays a large
role in regulating the transport of charcoal beyond district
boundaries (Jagger 2009).4 The role of forest sector
decentralization in shaping forest management in Uganda is
discussed by Turyahabwe et al. (2007). They argue that the
positive aspects of decentralization have been hindered by
lack of a clear policy regarding ownership, inadequate fiscal
support and inequitable distribution of benefits. Francis
and James (2003) also underscore some of the challenges
and inherent contradictions of forestry decentralization
in Uganda. Districts collect taxes at various stages in the
value chain, and are experimenting with different regulatory
frameworks for managing levels of production and trade.
The small number of DFS officials is an indicator of
inadequate capacity for monitoring and enforcement.
Masindi has only one District Forest Officer (DFO). Given
the vast size of the district and the relatively poor transport
infrastructure, it is nearly impossible for the DFO to monitor
charcoal production. In recognition of this, and in an effort
to capture charcoal revenues, in 2003 the district passed
an ordinance abolishing the charcoal production licensing
system and replaced it with a loading fee collected by
individuals who work under contract at the sub-county level
under the supervision of sub-county chiefs. Tenderers are
selected by a district board with the assistance of the district
forest officer. They collect fees by issuing receipts for each
bag of charcoal sold. As charcoal moves up the value chain,
for example as it is transferred from producers to traders, it
3 The weight of charcoal sacks was estimated by respondents and
averaged 50kg/sack.4 Turyahabwe and Banana (2008) review the history of forest policy
in Uganda.
is assessed a 1 000 UgShs per sack loading fee. Charcoal
sold outside the district is charged depending on the size of
the truck.5 At the time of the survey, Nakasongola had one
DFO and four forest rangers. The focus of the Nakasongola
DFO’s office is plantation development in select sub-
counties throughout the district; monitoring and enforcing
rules related to charcoal production and trade is not a major
focus of DFO staff. There are no sub-county level forest
officers working either in charcoal-producing areas or on
enforcement efforts. Charcoal production is extremely
widespread in Nakasongola. For example, according to
the Nakasongola District Forestry Plan (2003) roughly
70 per cent of households in Nakasongola districts were
involved in charcoal production, although data from the
study sites suggest the rate of household-level participation
in charcoal production was closer to 40 per cent in 2008
(Khundi et al. 2009). As a result, and because monitoring
and enforcement would require a comprehensive effort, the
district has abandoned efforts to issue licenses to producers.
Nakasongola district relies on transport related taxes (or
loading fees) tendered as a source of revenue at the sub-
county level. The approach used in Nakasongola is similar
to that used in Masindi. Private collectors are appointed by
sub-county chiefs through a competitive bidding process.
As in Masindi, permits are issued based on the size of the
transporting vehicle and revenues are shared among different
levels of administration. The official forestry revenue
benefit sharing ratios are defined as 40% to the district
government and 60% to the national government. A portion
of the funds (i.e. 35 per cent) that remain at the district level
are intended to be retained or remitted to the lower level sub-
county governments. However, this redistribution rarely
takes place. There are obvious incentives for sub-counties
to underreport revenues from charcoal, given that they retain
a minimal share of total amount collected; for example, for
every 100 000 UgShs. of revenue collected at the sub-county
level, by law the sub-county is permitted to retain only 14
000 UgShs.
Like Nakasongola, Hoima has a higher capacity for
monitoring and enforcement than Masindi; at the time of
our survey Hoima District had a relatively large DFS staff
(including a DFO, his assistant and two forest guards).
However, all staff members were concentrated in Hoima town
and appear to have been too few in number to be effective
on the ground. Lower levels of local government are not
involved in regulating charcoal production in Hoima. Hoima
district sells charcoal production permits, and has a similar
system of transport related fees as Masindi and Nakasongola
districts. In principle, forest revenues are required to be
shared between the district and the sub-counties, but none
of the sub-county officials interviewed during the study
reported receiving forestry-related revenues.
5 At the time of the survey, a tipper lorry (holding approximately
90 bags) paid 70,000 (≈ 15.55 UgSh per kg); a medium size truck
(approximately 120 bags) paid 80,000 (≈ 13.33 UgSh per kg); and
a large truck (150 bags) paid 120,000 (≈ 16 UgSh per kg).
276
ESTIMATING ECONOMIC RETURNS TO CHARCOAL
PRODUCTION AND TRADE
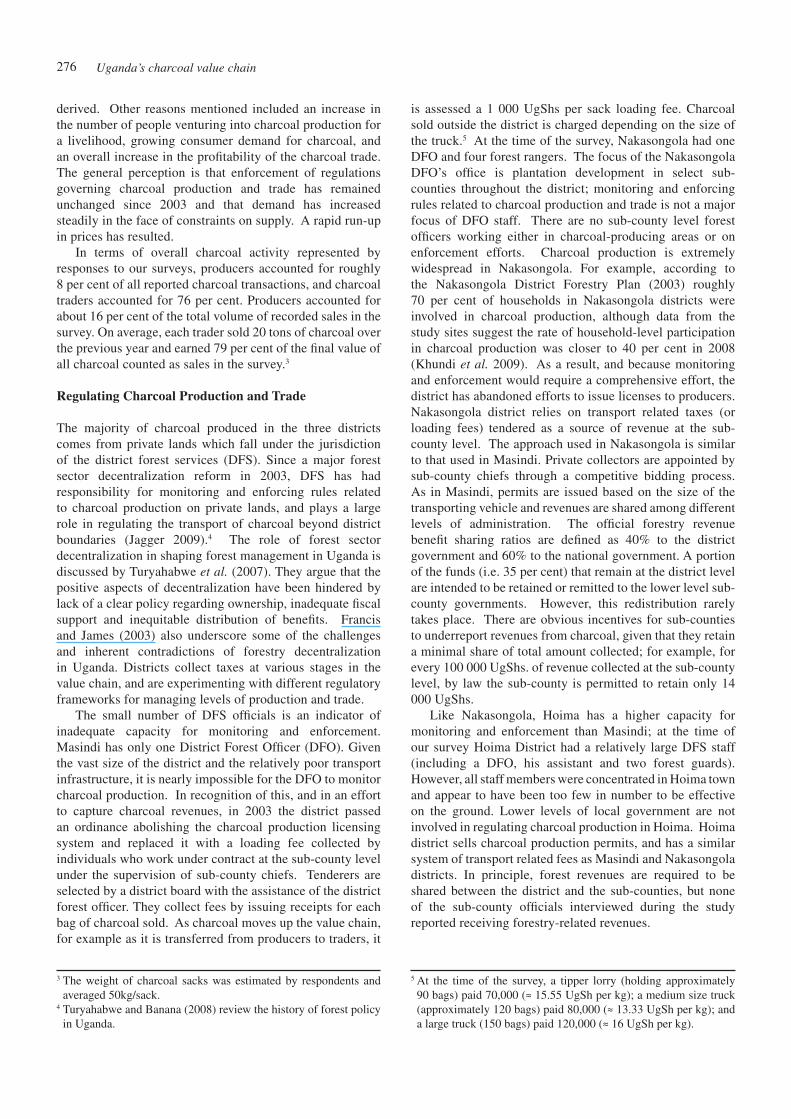
Table 4 reports average charcoal sales per value chain
participant by district for the months of February and May
2008. The bulk of all charcoal sales represented in the sample
TABLE 4 Charcoal sales by district
District
Average
quantity
sold per
value chain
participant
(kg)
Total volume
of sales (kg)
Sales as
% of total
volume in
sample
Hoima 1 524 131 103 3.7
Masindi 2 868 438 749 12.5
Nakasongola 6 669 927 028 26.4
Kampala 16 230 2 012 571 57.4
All 6 991 3 509 451 100.0
Note: Data represent outcomes for the months of February and
May 2008 combined.
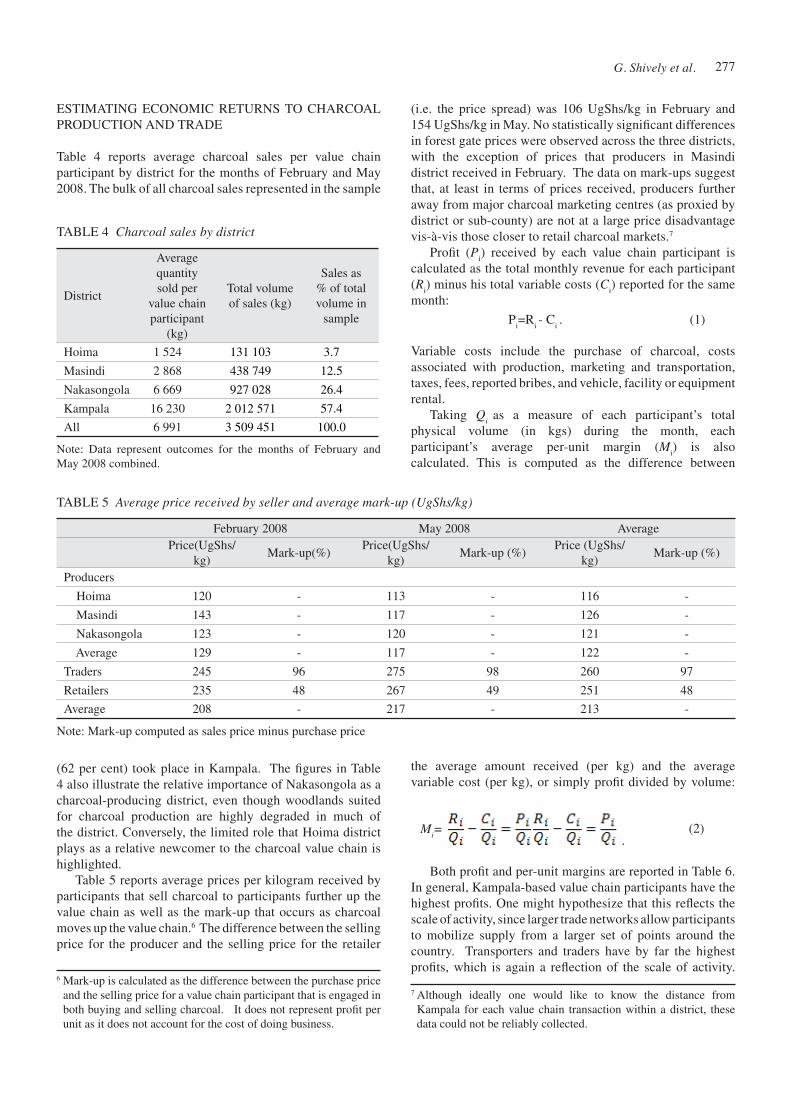
Note: Mark-up computed as sales price minus purchase price
TABLE 5 Average price received by seller and average mark-up (UgShs/kg)
February 2008 May 2008 Average
Price(UgShs/
kg)Mark-up(%)
Price(UgShs/
kg)Mark-up (%)
Price (UgShs/
kg)Mark-up (%)
Producers
Hoima 120 - 113 - 116 -
Masindi 143 - 117 - 126 -
Nakasongola 123 - 120 - 121 -
Average 129 - 117 - 122 -
Traders 245 96 275 98 260 97
Retailers 235 48 267 49 251 48
Average 208 - 217 - 213 -
(62 per cent) took place in Kampala. The figures in Table
4 also illustrate the relative importance of Nakasongola as a
charcoal-producing district, even though woodlands suited
for charcoal production are highly degraded in much of
the district. Conversely, the limited role that Hoima district
plays as a relative newcomer to the charcoal value chain is
highlighted.
Table 5 reports average prices per kilogram received by
participants that sell charcoal to participants further up the
value chain as well as the mark-up that occurs as charcoal
moves up the value chain.6 The difference between the selling
price for the producer and the selling price for the retailer
6 Mark-up is calculated as the difference between the purchase price
and the selling price for a value chain participant that is engaged in
both buying and selling charcoal. It does not represent profit per
unit as it does not account for the cost of doing business.
(i.e. the price spread) was 106 UgShs/kg in February and
154 UgShs/kg in May. No statistically significant differences
in forest gate prices were observed across the three districts,
with the exception of prices that producers in Masindi
district received in February. The data on mark-ups suggest
that, at least in terms of prices received, producers further
away from major charcoal marketing centres (as proxied by
district or sub-county) are not at a large price disadvantage
vis-à-vis those closer to retail charcoal markets.7
Profit (Pi) received by each value chain participant is
calculated as the total monthly revenue for each participant
(Ri) minus his total variable costs (C
i) reported for the same
month:
Pi=R
i - C
i . (1)
Variable costs include the purchase of charcoal, costs
associated with production, marketing and transportation,
taxes, fees, reported bribes, and vehicle, facility or equipment
rental.
Taking Qi
as a measure of each participant’s total
physical volume (in kgs) during the month, each
participant’s average per-unit margin (Mi) is also
calculated. This is computed as the difference between
the average amount received (per kg) and the average
variable cost (per kg), or simply profit divided by volume:
.(2)
Both profit and per-unit margins are reported in Table 6.
In general, Kampala-based value chain participants have the
highest profits. One might hypothesize that this reflects the
scale of activity, since larger trade networks allow participants
to mobilize supply from a larger set of points around the
country. Transporters and traders have by far the highest
profits, which is again a reflection of the scale of activity.
7 Although ideally one would like to know the distance from
Kampala for each value chain transaction within a district, these
data could not be reliably collected.
Mi=
277
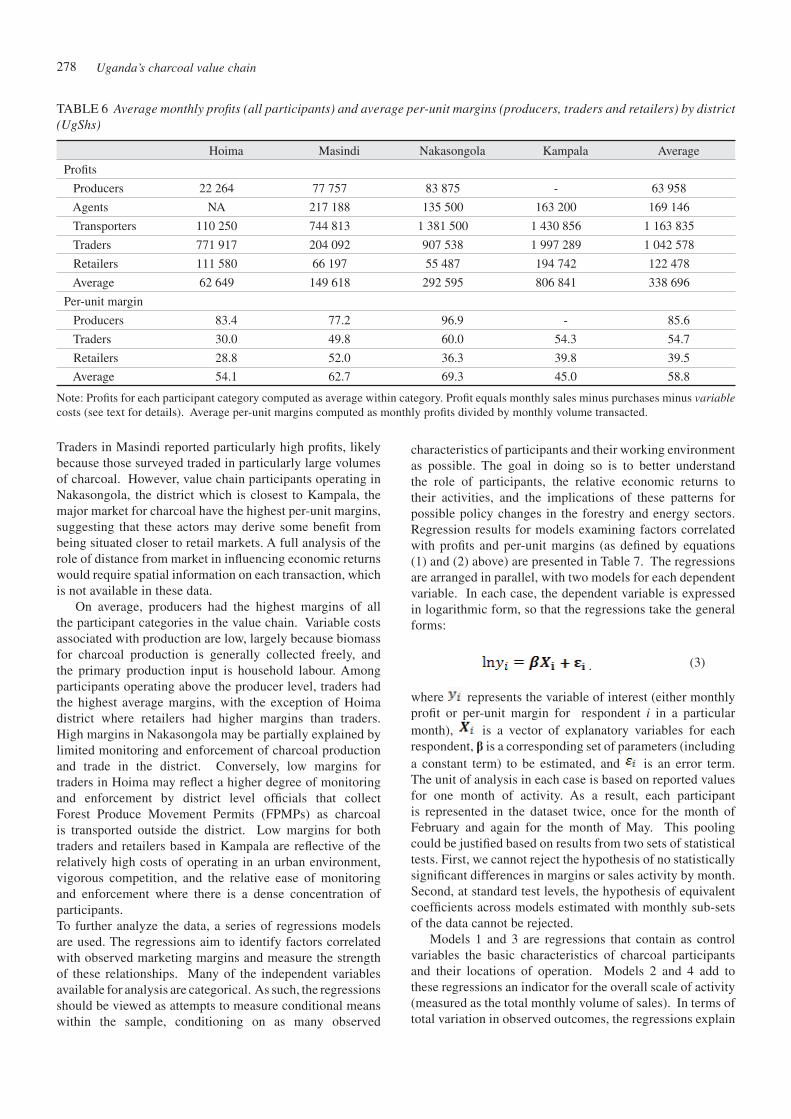
Traders in Masindi reported particularly high profits, likely
because those surveyed traded in particularly large volumes
of charcoal. However, value chain participants operating in
Nakasongola, the district which is closest to Kampala, the
major market for charcoal have the highest per-unit margins,
suggesting that these actors may derive some benefit from
being situated closer to retail markets. A full analysis of the
role of distance from market in influencing economic returns
would require spatial information on each transaction, which
is not available in these data.
On average, producers had the highest margins of all
the participant categories in the value chain. Variable costs
associated with production are low, largely because biomass
for charcoal production is generally collected freely, and
the primary production input is household labour. Among
participants operating above the producer level, traders had
the highest average margins, with the exception of Hoima
district where retailers had higher margins than traders.
High margins in Nakasongola may be partially explained by
limited monitoring and enforcement of charcoal production
and trade in the district. Conversely, low margins for
traders in Hoima may reflect a higher degree of monitoring
and enforcement by district level officials that collect
Forest Produce Movement Permits (FPMPs) as charcoal
is transported outside the district. Low margins for both
traders and retailers based in Kampala are reflective of the
relatively high costs of operating in an urban environment,
vigorous competition, and the relative ease of monitoring
and enforcement where there is a dense concentration of
participants.
To further analyze the data, a series of regressions models
are used. The regressions aim to identify factors correlated
with observed marketing margins and measure the strength
of these relationships. Many of the independent variables
available for analysis are categorical. As such, the regressions
should be viewed as attempts to measure conditional means
within the sample, conditioning on as many observed
characteristics of participants and their working environment
as possible. The goal in doing so is to better understand
the role of participants, the relative economic returns to
their activities, and the implications of these patterns for
possible policy changes in the forestry and energy sectors.
Regression results for models examining factors correlated
with profits and per-unit margins (as defined by equations
(1) and (2) above) are presented in Table 7. The regressions
are arranged in parallel, with two models for each dependent
variable. In each case, the dependent variable is expressed
in logarithmic form, so that the regressions take the general
forms:
. (3)
where represents the variable of interest (either monthly
profit or per-unit margin for respondent i in a particular
month), is a vector of explanatory variables for each
respondent, is a corresponding set of parameters (including
a constant term) to be estimated, and is an error term.
The unit of analysis in each case is based on reported values
for one month of activity. As a result, each participant
is represented in the dataset twice, once for the month of
February and again for the month of May. This pooling
could be justified based on results from two sets of statistical
tests. First, we cannot reject the hypothesis of no statistically
significant differences in margins or sales activity by month.
Second, at standard test levels, the hypothesis of equivalent
coefficients across models estimated with monthly sub-sets
of the data cannot be rejected.
Models 1 and 3 are regressions that contain as control
variables the basic characteristics of charcoal participants
and their locations of operation. Models 2 and 4 add to
these regressions an indicator for the overall scale of activity
(measured as the total monthly volume of sales). In terms of
total variation in observed outcomes, the regressions explain
TABLE 6 Average monthly profits (all participants) and average per-unit margins (producers, traders and retailers) by district (UgShs)
Hoima Masindi Nakasongola Kampala Average
Profits
Producers 22 264 77 757 83 875 - 63 958
Agents NA 217 188 135 500 163 200 169 146
Transporters 110 250 744 813 1 381 500 1 430 856 1 163 835
Traders 771 917 204 092 907 538 1 997 289 1 042 578
Retailers 111 580 66 197 55 487 194 742 122 478
Average 62 649 149 618 292 595 806 841 338 696
Per-unit margin
Producers 83.4 77.2 96.9 - 85.6
Traders 30.0 49.8 60.0 54.3 54.7
Retailers 28.8 52.0 36.3 39.8 39.5
Average 54.1 62.7 69.3 45.0 58.8
Note: Profits for each participant category computed as average within category. Profit equals monthly sales minus purchases minus variable
costs (see text for details). Average per-unit margins computed as monthly profits divided by monthly volume transacted.
278
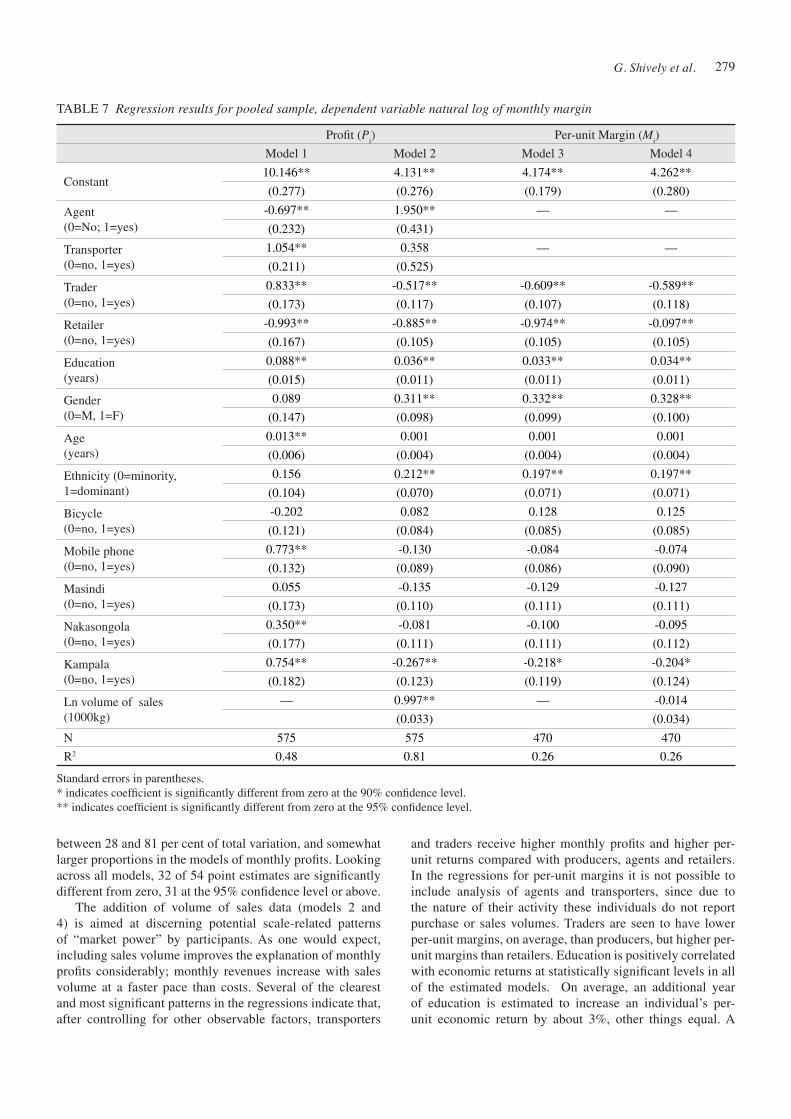
between 28 and 81 per cent of total variation, and somewhat
larger proportions in the models of monthly profits. Looking
across all models, 32 of 54 point estimates are significantly
different from zero, 31 at the 95% confidence level or above.
The addition of volume of sales data (models 2 and
4) is aimed at discerning potential scale-related patterns
of “market power” by participants. As one would expect,
including sales volume improves the explanation of monthly
profits considerably; monthly revenues increase with sales
volume at a faster pace than costs. Several of the clearest
and most significant patterns in the regressions indicate that,
after controlling for other observable factors, transporters
and traders receive higher monthly profits and higher per-
unit returns compared with producers, agents and retailers.
In the regressions for per-unit margins it is not possible to
include analysis of agents and transporters, since due to
the nature of their activity these individuals do not report
purchase or sales volumes. Traders are seen to have lower
per-unit margins, on average, than producers, but higher per-
unit margins than retailers. Education is positively correlated
with economic returns at statistically significant levels in all
of the estimated models. On average, an additional year
of education is estimated to increase an individual’s per-
unit economic return by about 3%, other things equal. A
Standard errors in parentheses.
* indicates coefficient is significantly different from zero at the 90% confidence level.
** indicates coefficient is significantly different from zero at the 95% confidence level.
TABLE 7 Regression results for pooled sample, dependent variable natural log of monthly margin
Profit (Pi) Per-unit Margin (M
i)
Model 1 Model 2 Model 3 Model 4
Constant10.146** 4.131** 4.174** 4.262**
(0.277) (0.276) (0.179) (0.280)
Agent
(0=No; 1=yes)
-0.697** 1.950** — —
(0.232) (0.431)
Transporter
(0=no, 1=yes)
1.054** 0.358 — —
(0.211) (0.525)
Trader
(0=no, 1=yes)
0.833** -0.517** -0.609** -0.589**
(0.173) (0.117) (0.107) (0.118)
Retailer
(0=no, 1=yes)
-0.993** -0.885** -0.974** -0.097**
(0.167) (0.105) (0.105) (0.105)
Education
(years)
0.088** 0.036** 0.033** 0.034**
(0.015) (0.011) (0.011) (0.011)
Gender
(0=M, 1=F)
0.089 0.311** 0.332** 0.328**
(0.147) (0.098) (0.099) (0.100)
Age
(years)
0.013** 0.001 0.001 0.001
(0.006) (0.004) (0.004) (0.004)
Ethnicity (0=minority,
1=dominant)
0.156 0.212** 0.197** 0.197**
(0.104) (0.070) (0.071) (0.071)
Bicycle
(0=no, 1=yes)
-0.202 0.082 0.128 0.125
(0.121) (0.084) (0.085) (0.085)
Mobile phone
(0=no, 1=yes)
0.773** -0.130 -0.084 -0.074
(0.132) (0.089) (0.086) (0.090)
Masindi
(0=no, 1=yes)
0.055 -0.135 -0.129 -0.127
(0.173) (0.110) (0.111) (0.111)
Nakasongola
(0=no, 1=yes)
0.350** -0.081 -0.100 -0.095
(0.177) (0.111) (0.111) (0.112)
Kampala
(0=no, 1=yes)
0.754** -0.267** -0.218* -0.204*
(0.182) (0.123) (0.119) (0.124)
Ln volume of sales
(1000kg)
— 0.997** — -0.014
(0.033) (0.034)
N 575 575 470 470
R2 0.48 0.81 0.26 0.26
279
significant correlation between economic returns and age is
observed when one controls for an individual’s role in the
charcoal value chain. At the per-unit level, female participants
received higher returns than their male counterparts.
In terms of geographic differences in economic returns,
very few of the geographic variables significantly contribute
to explaining variation in either monthly profits or per-unit
margins. Participants operating in Nakasongola report
higher economic returns overall, but the result is not robust
to the inclusion of either volume of sales or measurement of
returns at the margin. As one might expect, higher volumes
of charcoal handled (as represented by the sales variable) are
correlated with higher overall returns. This is consistent with
both a conjecture that the underlying structure of activities
can be characterized by increasing returns to scale, and with
the general observation that the licensing and loading fees
being implemented within the study sites decline with the
scale of activity.
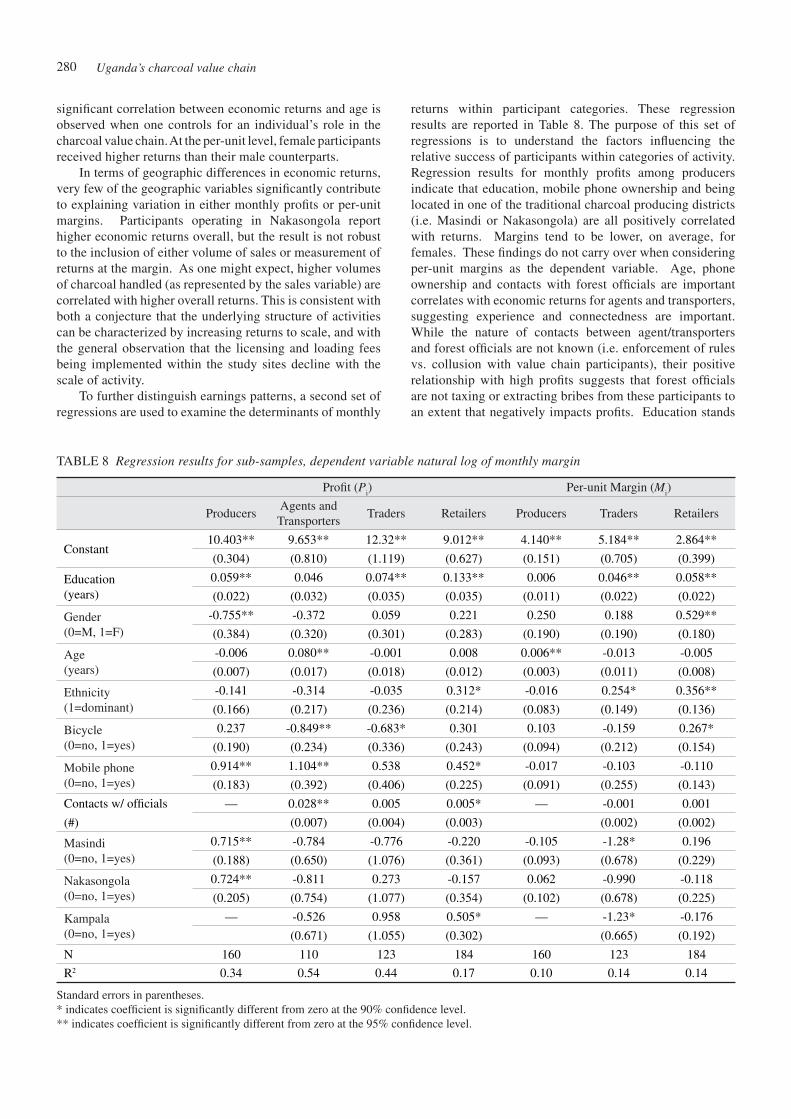
To further distinguish earnings patterns, a second set of
regressions are used to examine the determinants of monthly
returns within participant categories. These regression
results are reported in Table 8. The purpose of this set of
regressions is to understand the factors influencing the
relative success of participants within categories of activity.
Regression results for monthly profits among producers
indicate that education, mobile phone ownership and being
located in one of the traditional charcoal producing districts
(i.e. Masindi or Nakasongola) are all positively correlated
with returns. Margins tend to be lower, on average, for
females. These findings do not carry over when considering
per-unit margins as the dependent variable. Age, phone
ownership and contacts with forest officials are important
correlates with economic returns for agents and transporters,
suggesting experience and connectedness are important.
While the nature of contacts between agent/transporters
and forest officials are not known (i.e. enforcement of rules
vs. collusion with value chain participants), their positive
relationship with high profits suggests that forest officials
are not taxing or extracting bribes from these participants to
an extent that negatively impacts profits. Education stands
TABLE 8 Regression results for sub-samples, dependent variable natural log of monthly margin
Standard errors in parentheses.
* indicates coefficient is significantly different from zero at the 90% confidence level.
** indicates coefficient is significantly different from zero at the 95% confidence level.
Profit (Pi) Per-unit Margin (M
i)
ProducersAgents and
TransportersTraders Retailers Producers Traders Retailers
Constant10.403** 9.653** 12.32** 9.012** 4.140** 5.184** 2.864**
(0.304) (0.810) (1.119) (0.627) (0.151) (0.705) (0.399)
Education
(years)
0.059** 0.046 0.074** 0.133** 0.006 0.046** 0.058**
(0.022) (0.032) (0.035) (0.035) (0.011) (0.022) (0.022)
Gender
(0=M, 1=F)
-0.755** -0.372 0.059 0.221 0.250 0.188 0.529**
(0.384) (0.320) (0.301) (0.283) (0.190) (0.190) (0.180)
Age
(years)
-0.006 0.080** -0.001 0.008 0.006** -0.013 -0.005
(0.007) (0.017) (0.018) (0.012) (0.003) (0.011) (0.008)
Ethnicity
(1=dominant)
-0.141 -0.314 -0.035 0.312* -0.016 0.254* 0.356**
(0.166) (0.217) (0.236) (0.214) (0.083) (0.149) (0.136)
Bicycle
(0=no, 1=yes)
0.237 -0.849** -0.683* 0.301 0.103 -0.159 0.267*
(0.190) (0.234) (0.336) (0.243) (0.094) (0.212) (0.154)
Mobile phone
(0=no, 1=yes)
0.914** 1.104** 0.538 0.452* -0.017 -0.103 -0.110
(0.183) (0.392) (0.406) (0.225) (0.091) (0.255) (0.143)
Contacts w/ officials
(#)
— 0.028** 0.005 0.005* — -0.001 0.001
(0.007) (0.004) (0.003) (0.002) (0.002)
Masindi
(0=no, 1=yes)
0.715** -0.784 -0.776 -0.220 -0.105 -1.28* 0.196
(0.188) (0.650) (1.076) (0.361) (0.093) (0.678) (0.229)
Nakasongola
(0=no, 1=yes)
0.724** -0.811 0.273 -0.157 0.062 -0.990 -0.118
(0.205) (0.754) (1.077) (0.354) (0.102) (0.678) (0.225)
Kampala
(0=no, 1=yes)
— -0.526 0.958 0.505* — -1.23* -0.176
(0.671) (1.055) (0.302) (0.665) (0.192)
N 160 110 123 184 160 123 184
R2 0.34 0.54 0.44 0.17 0.10 0.14 0.14
280
out as an important correlate with high profits and per-unit
margins for traders. This is consistent with expectation that
more education gives value chain participants an advantage
in their business dealings. Education also matters for profits
and per-unit margins in the retailer category. Coming from
the dominant ethnic groups is an important factor explaining
outcomes for retailers, suggesting that charcoal consumers
prefer to purchase charcoal from members of their ethnic
group. Most charcoal producers are based in Kampala where
the Baganda are the dominant ethnic group. Margins for
retailers are positively associated with contact with forest
officials, suggesting that forest officials are not widely
engaged in regulatory functions such as tax collection when
dealing with value chain retailers. Non-producer participants
operating in Masindi district have smaller monthly profits
and per-unit margins than those operating elsewhere. This
may reflect the fact that, of the three districts in the sample,
Masindi is least well connected with major charcoal markets
due to long distances and poor road networks.
DISCUSSION AND POLICY IMPLICATIONS
The primary goal of this paper has been to provide a
picture of the structure and function of the supply side of
Uganda’s charcoal value chain. The characteristics of value
chain participants in two major and one emerging charcoal
producing area were examined. Data on the characteristics
of value chain participants demonstrate the degree of
heterogeneity between participant groups both with respect
to demographic and asset portfolios, and profits. Value chain
participants in the middle of the value chain (i.e. traders
and transporters) have the highest levels of education and
asset ownership. In general producers and retailers are
not as well off as transporters and traders. In addition,
regression results demonstrate that traders and transporters
are reaping very large monthly profits relative to other value
chain participants, largely because they handle much larger
volumes. The findings suggest that a tax on transporters
or traders could be used to generate significant revenue for
districts, and future research could focus on determining the
potential magnitude of revenue and behavioural responses
to taxes. Furthermore such a tax could be progressive from
a distributional perspective and relatively easy to administer,
given the small number of participants in these value
chain roles. In contrast, a tax on producers or retailers is
likely to raise less revenue because tax collection would
be more costly and harder to administer, given the large
number of widely-dispersed participants at these points in
the value chain. A tax on producers and retailers is likely
to be regressive; that is, it would have a disproportionate
effect on lower income participants. In this sense, the data
demonstrate that policies that change regulatory, fiscal and
pricing frameworks focused on the central nodes in the value
chain might be most effective in raising revenue. However,
it is important to underscore that, when considering tax
schemes as possible revenue sources, a tax on traders
would likely be shifted at least in part (depending on the
elasticity of demand) to consumers, through price hikes. We
are not currently aware of any studies that have established
a reliable estimate of price responsiveness by charcoal
consumers, but one might reasonably expect that with high
prices for alternative fuels such as propane and electricity,
opportunities to substitute away from charcoal are somewhat
limited, and that consumers would ultimately bear the brunt
of efforts to levy taxes on charcoal trade.
When considering differences within participant groups,
profits and per-unit margins are found to be correlated with
a number of demographic and socioeconomic variables.
Contact with forest officials has a positive correlation with
returns for agents/transporters and retailers. The nature
of these contacts is not known, but their correlation with
favourable economic returns for some participant categories
points to an opportunity for forest officials to play a larger
or more effective role in monitoring and enforcement of
existing regulations. However, more research is required
to fully understand the economic effects of the various
monitoring and enforcement mechanisms in place in the
three districts. The underlying incentives influencing forest
official behaviour may be an important factor explaining
the limited regulatory focus on relatively powerful charcoal
value chain participants. While it is not completely opaque,
the charcoal industry is very challenging to study.
Despite reports of exceedingly high rates of deforestation
and forest degradation in Nakasongola district, of the
three districts for this study Nakasongola remains the
primary source of charcoal destined for Kampala markets.
Conversely Hoima’s role as an emerging supplier of charcoal
for the value chain is quite limited. Counter to expectations,
district-level indicators of distance from major market were
not found to be correlated with prices received or overall
returns for producers. Evidence that distance matters for
participants higher up the value chain is also statistically
weak. High reported volumes from Nakasongola support
the conjecture that this area remains a major charcoal
producing region. Past forest loss does not appear to have
curbed charcoal extraction. Qualitative data on trends in
charcoal production and trade confirm that the supply
of charcoal from traditional charcoal producing areas is
diminishing, but currently there is only limited government
support for establishing woodlots that would propagate
species appropriate for charcoal production in Nakasongola
and Masindi districts.
ACKNOWLEDGEMENTS
Research reported in this paper was made possible,
in part, through support provided by the Bureau of
Economic Growth, Agriculture and Trade, U.S. Agency for
International Development through the BASIS Assets and
Market Access Collaborative Research Support Program.
The opinions expressed herein are those of the authors and
do not necessarily reflect the views of the sponsoring agency.
281
REFERENCES
ANGELSEN, A. and WUNDER, S. 2003. Exploring
the Forest—Poverty Link: Key Concepts, Issues and
Research Implications. CIFOR Occasion Paper No.
40. Bogor, Indonesia: Center for International Forestry
Research.
ARNOLD, J. E. M., KOHLIN, G. and PERSSON, R.
2006. Woodfuels, Livelihoods and policy interventions:
changing perspectives. World Development 34(3): 596-
611.
AUREN, R., and KRASSOWSKA, K. 2004. Small and Medium Forest Enterprise: Uganda. London:
International Institute for Environment and Development.
BARDHAN, P. J., BALAND, S., DAS, S., MOOKHERJEE,
D. and SARKAR, R. 2001. Household firewood
collection in rural Nepal: the role of poverty, collective
action and modernization, Working Paper, University of
California, Berkeley.
BARNES, D. F., KRUTILLA, K., and HYDE, W. F. 2005.
The Urban Household Energy Transition: Energy, Poverty and Environment in the Developing World Washington, DC: World Bank.
BONAN, G. B. 2008. Forests and climate change: forcings,
feedbacks, and the climate benefits of forests. Science 320 (5882): 1444-1449.
BROADHEAD, J., BAHDON, J. and WHITEMAN, A.
2001. Woodfuel consumption modeling and results. Past
trends and future prospecsts for utilization of wood for
energy. Global Forest Outlook Study Working Paper.
Rome: FAO.
BROUWER, R. and MAGANE, D. M. 1999. The charcoal
commodity chain in Maputo, Mozambique: access and
sustainability. Southern African Forestry Journal 185:
27-34.
ESD. 1995. A Study of the woody biomass derived energy supplies in Uganda. Final report to the Forest
Department, Ministry of Natural Resouces and the EC-
Financed Natural Forest Management and Conservation
Project. Kampala: Energy for Sustainable Development.
FRANCIS, P. and JAMES, R. 2003. Balancing rural poverty
reduction and citizen participation: the contradictions of
Uganda’s decentralization program. World Development 31(2): 325-337.
GELLERT, P. K. 2003. Renegotiating a timber commodity
chain: lessons from Indonesia on the political
construction of global commodity chains. Sociological Forum, 18(1), 53-84.
GIRARD, P. 2002. Charcoal production and use in Africa:
what future? Unasylva 53(211): 30-34.
JAGGER, P. 2009. Can Forest Sector Devolution Improve
Rural Livelihoods? An Analysis of Forest Income and
Institutions in Western Uganda. Ph.D. Dissertation.
Bloomington, IN: Indiana University.
JENSEN, A. 2009. Valuation of non-timber forest products
value chains. Forest Policy and Economics 11(1): 34-41. KAPLINSKY, R. 2000. Spreading the gains from
globalization: what can be learned from value chain
analysis. IDS Working Paper Nol. 110. London, UK:
Institute of Development Studies.
KAPLINSKY, R. and M. MORRIS. 2001. A handbook
for value chain analysis. Ottawa, Canada: International
Development Research Centre.
KHUNDI, F., JAGGER, P., SHIVELY, G. and
SSERUNKUUMA, D. 2009. Income and poverty effects
of charcoal production in western Uganda. Working
Paper 2009-09. West Lafayette, IN: Purdue University
Department of Agricultural Economics.
KISAKYE, R. 2001. Study on the establishment of a
sustainable charcoal production and licensing system
in Masindi and Nakasongola Districts. EPED Project.
Kampala, Uganda: Ministry of Water, Lands and
Environment.
KISAKYE, R. 2004. Final Report: Study on the
Establishment of Quantity of Charcoal Produced per
Parish and Recommended Reserve Prices for Masindi
District.
KNÖPFLE, M. 2004. A Study on Charcoal Supply in
Kampala, Final Report. Kampala: Ministry of Energy
and Mineral Development Energy Advisory Project.
MAAIF. 1995. Basic Facts on Agricultural Activities in
Uganda. Kampala, Uganda: Ministry of Agriculture,
Animal Industry and Fisheries.
MWLE. 2001. Forest Sector Review. Kampala, Uganda:
Ministry of Water, Lands and Environment.
NAKASONGOLA DISTRICT. 2003. Nakasongola District
Development Plan. Nakasongola District, Uganda.
NAMAALWA, J., HOFSTAD, O. and SANKHAYAN, P.
L. 2009. Achieving sustainable charcoal supply from
woodlands to urban consumers in Kampala, Uganda.
International Forestry Review 11(1):64-78.
NFA. 2005. Uganda’s Forests, Functions and Classifications.
Kampala, Uganda: National Forest Authority.
NZITA, R. and MIWAMPA, M. 1993. Peoples and Cultures
of Uganda. Kampala, Uganda: Fountain Publishers.
PANYA, O. 1993. Charcoal in Northeast Thailand:
Implications for Sustainable Rural Resource
Management. Expert Consultation on Data Assessment
and Analysis for Wood Energy Planning (23-27 February,
1993), Chiang Mai, Thailand.
RIBOT, J. C. 1998. Theorizing access: forest profits along
Senegal's charcoal commodity chain. Development and Change, 29(2), 307-341.
RIBOT, J.C. 2006. Policy and Distributional Equity in
Natural Resource Commodity Markets: Commodity-
Chain Analysis as a Policy Tool. Washington, DC: World
Resources Institute.
SANKHAYAN, P. L and HOFSTAD, O. 2000. Production
and spatial price differences for charcoal in Uganda.
Journal of Forest Research 5: 117-121.
SEBBIT, A., BENNETT, K. and HIGENYI, J. 2004.
Household energy demand perspectives for Uganda
in 2025. Proceedings of Domestic Use of Energy
Conference 2004. Kampala: Department of Mechanical
Engineering, Makerere University.
SEI. 2002. Charcoal Potential in Southern Africa,
282
CHAPOSA: Final Report. Stockholm, Sweden: INCO-
DEV, Stockholm Environment Institute.
SHYAMSUNDAR, P. and KRAMER, R.A. 1996. Tropical
forest protection: an empirical analysis of the costs borne
by local people. Journal of Environmental Economics 31(1):129-145.
SINGH, K. D. 2008. Balancing fuelwood production and
consumption in India. International Forestry Review
10(2):190-200.
SMITH, W. 2005. Mapping access to benefits in Cameroon
using commodity chain analysis: a case study of Azobe
timber. In Managing the Commons: Markets, Commodity Chains and Certification eds. L. Merino and J. Robson.
Palo Alto, CA: The Christiansen Fund.
TURYAHABWE, N., GELDENHUYS, J., WATTS, S. and
OBUA, J. 2007. Local organizations and decentralized
forest management in Uganda: Roles, challenges and
policy implications. International Forestry Review, 9:
581-596.
UBOS. 2006. Uganda National Household Survey
2005/2006: Report on the Socioeconomic Module.
Kampala, Uganda: Uganda Bureau of Statistics.
UBOS. 2009. 2009 Statistical Abstract. Kampala, Uganda:
Uganda Bureau of Statistics.
UGANDA REVENUE AUTHORITY. 2008. Exchange rate
data reported at www.ugrevenue.com/exchange_rates.
Accessed 28 January 2008.
UNITED NATIONS. 2009. World Statistics Pocketbook. United Nations Statistics Division. http://data.un.org/
CountryProfile.aspx?crName=Uganda. Accessed 7 June
2009.
VYAMANA, V. G. 2009. Participatory forest management
in the eastern arc mountains of Tanzania: who benefits?
International Forestry Review 11(2): 239-253.
WORLD BANK. 2009. Environmental Crisis or Sustainable Development Opportunity? Transforming the Charcoal Sector in Tanzania, A Policy Note. Washington, DC:
World Bank.
283