Multi-Layered, Hyaluronic Acid-Based Hydrogel Formulations Suitable for Automated 3D High Throughput Drug Screening of Cancer-Stromal Cell Co-Cultures
Brian J Engel,Department of BioSciences, Rice University, 6100 Main Street, Houston, Texas 77005, USA
Dr. Pamela E Constantinou,Department of BioSciences, Rice University, 6100 Main Street, Houston, Texas 77005, USA
Lindsey K Sablatura,Department of BioSciences, Rice University, 6100 Main Street, Houston, Texas 77005, USA
Nathaniel J Doty,BioTime, Incorporated, 1301 Harbor Bay Parkway, Alameda, California 94502, USA
Prof. Daniel D Carson,Department of BioSciences, Rice University, 6100 Main Street, Houston, Texas 77005, USA
Prof. Mary C Farach-Carson,Department of BioSciences, Rice University, 6100 Main Street, Houston, Texas 77005, USA
Dr. Daniel A Harrington, andDepartment of BioSciences, Rice University, 6100 Main Street, Houston, Texas 77005, USA
Thomas I ZarembinskiBioTime, Incorporated, 1301 Harbor Bay Parkway, Alameda, California 94502, USA
Pamela E Constantinou: [email protected]; Thomas I Zarembinski: [email protected]
Keywords
high throughput; drug screening; 3D culture; hyaluronic acid; co-culture
2D cell culture models are simple, low cost, well suited for automated high-throughput drug
screening, and have been successfully used to discover many clinically relevant anti-cancer
compounds.[1] However, due to its rigidity and lack of 3D architecture, tissue culture
polystyrene poorly recapitulates in vivo tumor characteristics,[2] and most candidate
chemotherapy drugs identified from 2D culture screens fail clinical trials.[3] Recently, 3D
culture systems that better recapitulate the in vivo tumor microenvironment have become a
Correspondence to: Pamela E Constantinou, [email protected]; Thomas I Zarembinski, [email protected].
B. J. Engel and P. E. Constantinou contributed equally to this work.
Supporting InformationSupporting Information is available from the Wiley Online Library or from the author.
HHS Public AccessAuthor manuscriptAdv Healthc Mater. Author manuscript; available in PMC 2016 August 05.
Published in final edited form as:Adv Healthc Mater. 2015 August 5; 4(11): 1664–1674. doi:10.1002/adhm.201500258.
Author M
anuscriptA
uthor Manuscript
Author M
anuscriptA
uthor Manuscript

priority. In several models across tissue types, changes in gene expression, signal
transduction and drug susceptibility from 3D culture better resemble in vivo results than
does 2D culture.[4–11] Many publications equate 3D cell culture with HTS of cancer
spheroids without ECM, spheroids cultured on Matrigel™ or spheroids encapsulated in
alginate.[7,12,13] Low adhesion plates exclude cell-matrix adhesion, and instead force cells to
form floating multicellular spheroids. Such systems inherently prevent the study of
extracellular matrix (ECM) influence on tumor phenotype and suffer from difficult
visualization of untethered clusters. Matrigel™ provides the most complex environment of
ECM and growth factors,[18] but lot-to-lot variation and low-temperature requirements for
solubility complicate high-throughput dispensing. Alginate matrices offer 3D cell
encapsulation, but produce non-uniform, non-transparent hydrogels that also hinder
automated microscopy. Furthermore, alginates lack the cellular attachment sites that
adherent cells require for survival.[14] Similar biologically-derived hydrogel matrices, such
as chitosan, offer comparable properties.[15] Synthetic hydrogel models are available, but
vary in their applicability to 3D cell culture and dispensing. Poly(ethylene glycol) (PEG)-
based systems are a classic example, but the most common incarnation, utilizing UV-based
photocrosslinking, can be harmful to cells.[16] However, beyond that caveat, PEG is a
relatively inert matrix which resists protein adsorption and can be functionalized with more
biocompatible crosslinking chemistry, such as the commercially available Qgel or click
chiemistry-based hyaluronic acid (HA)-furan/PEG-maleimide gels.[17] A clear need remains
for a biocompatible, controlled, bioengineered matrix that simulates native 3D organization,
and facilitates high-throughput dispensing and screening.
HA is a ubiquitous component of the ECM, and thus has broad applicability for 3D cell
culture. More specifically, HA is a highly expressed ECM component in bone, the typical
metastatic target tissue of prostate cancer (PCa),[19] is associated with prostate tumor growth
and lymph node metastasis,[20,21] and is implicated in the progression of endometrial cancer
(ECa).[22] HA interacts with CD44 and hyaluronan mediated motility receptors (RHAMM/
CD168) on the cell surface, triggering cell signaling pathways that drive tumor progression,
including phosphatidylinositol 3 kinase (PI3K) and transforming growth factor beta
receptors.[23,24] Bacterial-produced HA polymer is well-defined and can be chemically
modified to enable the formation of mechanically stable hydrogels through multiple
crosslinking strategies.[25–27] We implemented HA-based hydrogels using aqueous solutions
of thiolated hyaluronan and thiol-reactive polyethylene(glycol) diacrylate (PEGDA),[28]
which provides predictable physical parameters (e.g. viscosity), defined gelation times of
20–30 minutes,[29] remains optically clear, stable, and porous without burdensome
temperature restrictions (e.g. in Matrigel™). This biocompatible thiol-acrylate chemistry
also allows bottom-up modularity, enabling the covalent incorporation of ECM components
(e.g. thiolated denatured collagen) to further mimic the native tumor microenvironment. This
modularity enabled our orthogonal culture of both cancer and stroma in different ECM
environments. Furthermore, full encapsulation of multiple cancer spheroids within a
biologically-relevant ECM better replicates the in vivo condition (e.g. diffusion limitations,
invasion potential, etc.). This HA chemistry is compatible with existing high throughput
dispensing technology, allowing for rapid adoption with minimal adaptation.
Engel et al. Page 2
Adv Healthc Mater. Author manuscript; available in PMC 2016 August 05.
Author M
anuscriptA
uthor Manuscript
Author M
anuscriptA
uthor Manuscript
We present a novel, HA-based multi-layer system for both mono- and co-culture of cancer
cells validated for a 384-well plate format. Our multi-layer system enables paracrine
interaction between cell types while maintaining distinct localization for facile visualization.
This system provides highly reproducible cultures utilizing current high-throughput
screening infrastructure. By incorporating well-characterized ECa and PCa cell lines, we
tested our 3D model with a panel of chemotherapeutic compounds, focusing on drugs in
clinical use and those that previously failed clinical trials.
To measure thicknesses of the muti-layer system, fluorescent beads were deposited as a
landmark of layer interfaces and imaged by confocal microscopy (Figure 1a). Hydrogel
layers of 1–24 µL were dispensed with alternating 1 µL bead boundary layers (Figure S1,
Supporting Information). Dispensed volumes of 12 µL for the cushion layer (mean
thickness: 120.8 ± 26.7 µm, n = 8), 14 µL for the cancer layer (460.7 ± 136.9 µm, n = 8) and
5 µL for the stromal layer (115±28.5 µm, n = 5), were determined to be optimal for
generating a consistent cushion layer thick enough to prevent cellular sensing of the rigid
plate,[31] a cancer layer thick enough to allow multiple imaging locations, and a relatively
flat stromal layer that could fit within a thin focal plane. While the volumes are similar, the
cancer gel layer is substantially thicker than the cushion gel layer. This is due to wicking of
the cushion layer into the corners and edges upon addition into an empty well. The addition
of the cancer cell layer is less affected by this wicking and therefore results in a thicker gel
layer.
To measure thickness variability across manufacturing lots of hydrogel, all layers were
dispensed with a benchtop high throughput dispensing system. Three plates for each of 5
lots were dispensed with bead boundaries, and imaged with confocal microscopy to
calculate layer thicknesses across all 384 wells (Table S1, Supporting Information). Analysis
of inter-lot layer thickness showed mean ± standard deviation of the cushion layer was
105±86 µm, the cancer layer was 526±132 µm and the stromal layer was 415±118 µm. The
thicker than expected stromal layer is due to reduced viscosity of HA-collagen solution
compared to HA alone, resulting in a larger volume dispensed via peristaltic action as
compared to hand pipetting. However, this difference did not negatively impact the function
of the culture systems (data not shown). There was no clear bias in layer thicknesses within
individual plates indicating that there was no systemic error in the dispensing of hydrogel
layers (data not shown). Cancer layers were found between 200 µm and 425 µm from the
plate bottom for over 90% of wells, providing reliable parameters for automated imaging.
Cancer cell survival in HA hydrogels was measured by imaging three z-slices per well.
There were no clear differences in cancer cell spheroid morphology or size at different
locations within the gel (Figure S2, Supporting Information). In 3D culture, it is difficult to
accurately count individual cells stained with live/dead stain. Instead, two ratiometric
methods for quantitating viability of cells grown in 3D spheroids, metabolic survival index
(MetaSI) and nuclear survival index (NucSI), were employed as described in the
Experimental Section. To understand the bias represented by the survival indices, a
comparison was made of the cross-sectional area of both C4-2B and Ishikawa cells after 1
day of growth (Figure S3, Supporting Information). Median stained areas for calcein AM,
Hoechst 33342 and ethidium dimer-2 were 374, 332, and 139 (C4-2B) or 317, 337, and 111
Engel et al. Page 3
Adv Healthc Mater. Author manuscript; available in PMC 2016 August 05.
Author M
anuscriptA
uthor Manuscript
Author M
anuscriptA
uthor Manuscript
(Ishikawa), respectively. The similarity of the calcein and Hoechst areas indicate that each
metric represents comparable bias. To ensure accurate comparisons between culture models,
MetaSI and NucSI were calculated for all culture conditions, including 2D and 2.5D (NucSI
reported in Supporting Information).
Hydrogels were tested for optimal growth and morphology of cancer and stromal cells.
Single cell seeding was used as a direct adaptation of typical high throughput dispensing
methodology. It is possible to pre-form multicellular spheroids prior to encapsulation,
providing a larger (>100 µm) population of spheroids for testing.[32] However, use of small
diameter tubing necessary for low volume culture could become clogged when used to
dispense larger spheroids. Both Ishikawa and C4-2B formed viable multicellular spheroids
in 3D mono-culture in HA hydrogels (see Figure 2). Both ESS-1 and HS27a had high
viability and a spreading morphology in 2.5D culture only on HA-collagen hydrogels
(Figure S4, Supporting Information). Thus, the multilayer culture system consisted of 3
layers: an acellular cushion layer to prevent cancer cell interaction with the plate bottom, a
second layer for encapsulation of cancer cells, and a collagen-rich layer upon which
adherent stromal cells were seeded (2.5D culture). This enabled a multi-layer hydrogel co-
culture system with cell types grown in distinct locations (Figure 1b, left), facilitating
imaging and analysis of individual cell types (Figure 1b, right), while providing a matrix
suitable for stromal cell adherence and growth. Next, cell density was optimized for highest
viability and spheroid size in mono-culture. Optimal densities for both cancer cell types
were 5,000 cells per 14 µL hydrogel per well (Figure S5, Supporting Information). The
optimal number of stromal cells to avoid confluence before the end of culture was 2,500
cells per well (data not shown).
Ishikawa cells showed high (>90%) MetaSI at all days and grew to a maximum median size
of 19.4 µm at day 7 (Figure 2a). Similarly, C4-2B cells had high survival and a maximal
median size of 16.1 µm at day 7, with little change in size after day 3 (Figure 2b). Spheroids
comprised an average of 36 cells in 25 µm diameter Ishikawa clusters (n=4) and 19 cells in
18–20 µm diameter C4-2B clusters (n=3). Cancer cell clusters contained multiple layers of
cells, which may result in a diffusion effect of drug treatment, more closely resembling the
challenges of treating human tumor masses. Our cluster diameters parallel previously
reported data for PCa cells in similar hyaluronate systems used in cytotoxicity tests.[33]
Analysis of ESS-1 (Figure 2c) and HS27a (Figure 2d) 2.5D mono-cultures showed the
expected fibroblast morphology and high viability up to day 3, with a slight decrease in
viability at day 5 from monolayer confluence. Blue staining at the periphery of the stromal
cell images was due to the meniscus of the gel layer. Near the edges of the image, the
confocal slice passes through the bottom of the cell, resulting in detectable signal from the
nuclear stain and not from the cytoplasmic stain. Adjusting the focus shows that these cells
are viable in a similar ratio to cells at the bottom of the meniscus (data not shown).
To facilitate growth of multiple cell types in a single well, media compatibility was assessed.
As both cancer and stromal cell media were suitable for survival (>90% MetaSI) of both cell
types, cancer cell media was chosen for all co-culture models (Figure S6, Supporting
Information). Ishikawa or C4-2B cells were encapsulated in 3D HA and incubated for 2
days, then seeded with either ESS-1 or HS27a cells, respectively. After 5 days of co-culture,
Engel et al. Page 4
Adv Healthc Mater. Author manuscript; available in PMC 2016 August 05.
Author M
anuscriptA
uthor Manuscript
Author M
anuscriptA
uthor Manuscript

Ishikawa and C4-2B showed typical spheroid formation, whereas ESS-1 and HS27a showed
a distinct morphological change, forming cell-cell aggregates rather than more typical
fibroblast morphology observed in mono-culture (Figure 2e). Stromal cell clusters in co-
culture did not reach confluence (data not shown). Median diameters for Ishikawa and
C4-2B spheroids in co-culture were 25.6 µm and 29.1 µm, respectively (Figure 2f) a
statistically significant (p<0.001) increase in spheroid size compared to mono-culture.
Metabolic survival indices were high (>90%) for all cells (Figure 2g). Increased cancer
spheroid size and stromal cell aggregation indicate that this system facilitates paracrine
communication. Incorporation of basic fibroblast growth factor[34] and vascular endothelial
growth factor[35] into similar hydrogel matrices results in their slow release, demonstrating
the capacity for small protein diffusion. Furthermore, we have modeled cancer-stroma
crosstalk using HA hydrogel particles decorated with heparin as point sources to release
heparin-binding epidermal growth factor. In that system, LNCaP spheroids were
significantly larger after co-culture with synthetic stromal mimics than when cultured
alone.[36]
To automate the robust assembly of this cell culture system, mono- and co-culture systems
were prepared using a high throughput benchtop dispensing system. After 7 days of growth
(5 days for stromal cells in co-culture), cancer spheroids were stained for viability and
imaged with an automated high throughput confocal microscope. Ishikawa spheroids grew
to median diameter of 23.9 µm in mono-culture and 38.6 µm in co-culture with ESS-1.
C4-2B spheroids grew to median diameters of 28.7 µm in mono-culture and 37.7 µm in co-
culture with HS27a (Figure 2h). These values are significantly higher (p < 0.001) than the
corresponding values from hand-pipetted cultures above. In addition, co-culture increased
median spheroid diameter by 61% in Ishikawa and 31% in C4-2B cells. Assuming that
spheroids are spherical, this corresponds with a volumetric increase of 421% for Ishikawa
and 226% for C4-2B. Analysis of the MetaSI showed a slight, but significant (p < 0.001)
reduction in both mono- and co-culture for Ishikawa (88.6% and 80.1%, respectively) and
C4-2B (93.5% and 84%, respectively) from automated dispensing compared to manual
dispensing (Figure 2i). NucSI for all mono- and co-cultures can be found in Figure S7,
Supporting Information.
Phenotypic markers for PCa and ECa cells and associated stromal counterparts were
validated in 2D for each cell type (Figure 3) and employed for staining cells within HA
hydrogels. In 3D mono-culture, Ishikawa cells expressed MUC1 and EIG121 (Figure 3a),
and C4-2B cells expressed PSA and EGFR (Figure 3b), as expected. ESS-1 cells expressed
CD10 and HDAC2 (Figure 3c) when cultured in 2.5D on HA-collagen. HS27a expressed the
ubiquitous mesenchymal cell markers, CD105 and vimentin (Figure 3d). Cells were co-
cultured to identify changes in phenotypic marker expression. Both Ishikawa and C4-2B
retained expression patterns of phenotypic markers, with no significant changes due to co-
culture (Figure3a and 3b). ESS-1 and HS27a cells when co-cultured, however, demonstrated
a distinct morphological change, forming small aggregates in accordance with live/dead
staining. ESS-1 expression of HDAC2 was both cytoplasmic and nuclear in Ishikawa co-
cultures, instead of the primarily nuclear localization observed in mono-culture (Figure 3c).
Cytoplasmic sequestration of HDAC2 is associated with terminal differentiation and
inhibition with senescence.[37,38] It is possible that co-culture of ESS-1 cells with Ishikawa
Engel et al. Page 5
Adv Healthc Mater. Author manuscript; available in PMC 2016 August 05.
Author M
anuscriptA
uthor Manuscript
Author M
anuscriptA
uthor Manuscript

cells may trigger differentiation and senescence of ESS-1 cells. This is in agreement with the
observation that the stroma tends to be lost in in endometrial tumor microenvironment.[39] In
contrast, no clear change in staining of phenotypic markers in HS27a cells was seen (Figure
3d). The poor adherence of stromal cells in co-culture with cancer cells may be a result of
increased perlecan expression, which is associated with poor cellular adhesion.[40,41] In
vivo, this would be seen as a reactive stromal condensation, reported to be anti-
inflammatory,[42] and has been reported to be part of both reaction to cancer and
decidualization reactions in the uterus,[43] hence a common stromal phenomenon.
To demonstrate culture system compatibility with existing high-throughput robotics, and
assess differences in cell sensitivities in 3D culture compared to 2D culture, cancer cells
were treated with a panel of 232 unique chemotherapeutic compounds for 3 days at 10 µM.
Drugs that induced survival indices statistically significantly below the DMSO control were
considered cytotoxic (Table S2 and S3, Supporting Information). Drugs were categorized by
mechanism of action, and a comparison of drug cytotoxicity was made between 2D and 3D
culture. All drug categories that contained at least one drug with differential cytotoxicity
between 2D and 3D culture are shown in Table 1. Ishikawa cells in 3D culture were more
sensitive to two drugs and more resistant to 25 drugs, and tended to be more resistant to
signaling pathway inhibitors. C4-2B cells in 3D culture were more sensitive to 30 drugs and
more resistant to 5 drugs, and tended to be more sensitive to cell cycle and DNA replication
and repair inhibitors. In each case, differing resistance from 3D culture was highly drug- and
cell line-dependent. Given the reported[33] diffusion limitation of spheroids, increased drug
resistance would be expected. Tendency toward increased susceptibility in 3D HA C4-2B
culture contrasted with increased resistance in 3D HA Ishikawa culture, implying that cell-
specific molecular changes are more important than morphological changes associated with
3D culture. In a 3D ovarian tumor model, cells in 3D reconsituted basement membrane and
cells in 2D upregulated a number of cell survival pathways and therefore were resistant to
PI3K inhibitors. Furthermore, the authors attribute the resistance to cell-matrix
interactions.[44] In HA culture, there are cell-matrix interactions that are not activated (e.g.
integrin binding), the lack of which may explain the increased resistance in 2D in some
cases. In other studies, LNCaP cells in 3D HA culture showed increased doxycycline
resistance, associated with higher expression of multidrug-resistance associated efflux
proteins MRP and LRP1,[45] further corroborating the importance of molecular changes. In
addition, comparison of JIMT1 breast cancer cells grown in 2D, on low adhesion plates,
2.5D culture on Matrigel™ or mouse xenograft showed Matrigel™ cultures most closely
resembled the xenograft. Furthermore, the formation of spheroids from growth on low-
adhesion plates did not resemble the xenograft.[7] In addition, control of the concentrations
and combinations of ECM components is important for understanding cellular behavior, as
shown for cell fate decisions of mouse embryonic stem cells.[46] These data indicate that
cell-ECM interactions are required for maintaining an in vivo-like microenvironment and
cellular phenotype.
To assess accuracy of these 3D tumor models, clinical drug efficacy from published human
clinical trials for PCa or ECa were compared with our in vitro cytotoxicity data. An
extensive literature search was performed to identify compounds that are in clinical use as an
accepted therapy (passed clinical trials), or were shown to be ineffective for either ECa
Engel et al. Page 6
Adv Healthc Mater. Author manuscript; available in PMC 2016 August 05.
Author M
anuscriptA
uthor Manuscript
Author M
anuscriptA
uthor Manuscript

(Table S4, Supporting Information) or PCa (Table S5, Supporting Information). Clinical trial
results were pooled and estimated clinical efficacy was calculated by the number of patients
with a tumor response (partial or complete) or a PSA response (>50% reduction, PCa only)
divided by the total number of patients tested.
Cytotoxicity in 3D HA-based mono- and co-culture systems was compared with 2D and 3D-
alginate models (Figure 4a) for drug concentrations from 0–10 µM. Representative dose
response curves are presented in Figure4b and 4c. Dose response curves for all tested
compounds and both survival indexes can be found in Figures S8–S11, Supporting
Information. Some treatments lacked a sinusoidal curve and therefore IC50 values could not
be calculated. For simple comparison between culture models, the minimum effective
concentration (MEC) of each drug was calculated. The MEC is the lowest concentration of
drug that resulted in a statistically significant reduction in survival index (ANOVA with
Dunnett multiple compairsons test p-value < 0.05 vs. DMSO). This is reported for all
compounds and culture models for C4-2B (Table 2) and Ishikawa cells (Table 3). NucSI data
can be found in Tables S6 and S7, Supporting Information.
In general, 3D HA models tended to increase the resistance of cells to compounds when
compared to 2D culture. When treated with 10 µM paclitaxel, cells tended to first die at the
spheroid periphery (Figure 4d) indicating increased resistance from diffusion limitation. Co-
culture with stromal cells also tended to increase cancer cell drug resistance compared with
3D mono-culture. In the endometrial cancer model, co-culture with stromal cells elicited
insensitivity to all drugs except docetaxel. In the case of clinically used ECa compounds,
comparison of in vitro data to clinical data showed that 3D HA mono-culture performed
comparably to 2D cell culture for the majority of compounds, indicating that they predict
efficacy of compounds with proven clinical relevance. Interestingly, sunitinib, a promising
compound currently in clinical trials, was ineffective in the HA mono-culture model. For
PCa, 3D HA culture performed similarly to 2D culture for all clinically used drugs except
mitoxantrone, reported to be of modest efficacy as a single agent.[47] Notably, the 3D-
alginate model showed very high susceptibility of ECa cancer cells to all compounds, but
performed similarly to 3D HA cultures of PCa. Rapid gelation kinetics of the 3D-alginate
culture and significant heterogeneity of the hydrogel layer lead to inconsistent cytotoxicity
data (see Figures S8–S11 and S12, Supporting Information). These technical difficulties
could be, in part, responsible for the poor performance of this culture model, but nonetheless
highlights the difficulty in using alginate for high throughput screening.
The poor performance of mitoxantrone on PCa indicates that the 3D HA culture system is a
more stringent test for drug efficacy than the 2D model. Indeed, mitoxantrone, a drug that
failed clinical trials in ECa, was ineffective in 3D HA culture. However, lapatinib, which
also failed clinical trials was effective at high concentration in the 3D HA mono-culture. In
addition, the HA culture models showed no cytotoxicity for failed PCa therapeutics dasatinib
and sunitinib. Each of these drugs was cytotoxic in 2D culture. These examples underscore
the increased accuracy and predictive capability of the 3D HA culture platform over 2D
culture. By identifying drugs unlikely to translate from pre-clinical to clinical trials, the costs
associated with advanced testing of these drugs could be reduced.
Engel et al. Page 7
Adv Healthc Mater. Author manuscript; available in PMC 2016 August 05.
Author M
anuscriptA
uthor Manuscript
Author M
anuscriptA
uthor Manuscript

While the 3D HA culture system was more accurate for failed drugs, several drugs showed
no cytotoxicity in any culture condition. This included carboplatin, ifosfamide, temsirolimus
and combination of ifosfamide + cisplatin for both C4-2B and Ishikawa; cisplatin, and
estramustine for Ishikawa; and lapatinib for C4-2B (data not shown). This is likely due to
genetic and proteomic variation within the cell lines eliciting resistance to certain drug
mechanisms. Indeed, it has been reported that the Ishikawa cell line is resistant to cisplatin
treatment.[48] These variations can also have the opposite effect: in the case of lapatinib, the
Ishikawa cells may represent the 3.3% of patients to which lapatinib was effective.
Comparison of in vitro cytotoxicity to overall clinical response assumes derived cell lines
are representative of patient populations. Flexibility of our 3D culture system allows
incorporation of additional cell lines to better represent characteristics of the patient
population. This will be necessary for development of an assay system which has broader
applicability to multiple subtypes of cancer. In addition, similar hydrogel systems have been
used to culture patient derived xenograft (PDX) PCa lines,[32] which have not adapted to
growth in 2D culture. Indeed, PDX-maintained lines more closely resemble patient tumors
than 2D culture derived cell lines.[49]
In summary, we developed a highly reproducible, multilayer 3D culture model that is
compatible with existing automated high-throughput dispensing, imaging and analysis
methodologies. These culture models recapitulate cytotoxicity of compounds used clinically
for both PCa and ECa. In addition, these models performed exceptionally well in identifying
drugs that failed clinical trials. The robustness of this system supports incorporation of
additional tumor cell lines, PDX lines, other cell types, growth factors and ECM components
necessary to mimic the in vivo tumor microenvironment. This novel, high-throughput-
compatible HA hydrogel system is an effective model for high content analysis of multiple
cancer types in mono- or co-culture.
Experimental Section
Antibodies
Primary antibodies used for immunofluorescent staining were MUC1 (clone 214D4, Cat.
No. 05-652, EMD Millipore), EIG121 (Cat. No. ab156275, Abcam), EGFR (clone H11, Cat.
No. MS-316-P1, NeoMarkers), PSA (Cat. No. NB200-135, Novus Biologicals), CD105
(clone 209701, Cat. No. MAB1320, R&D Systems), vimentin (clone EPR3776, Cat. No.
ab92547, Abcam), CD10 (clone F-4, Cat. No. sc-46656, Santa Cruz Biotechnology), and
HDAC2 (Cat. No. sc-7899, Santa Cruz Biotechnology). Antibodies without an indicated
clone ID are rabbit polyclonal. Secondary antibodies included Alexa Fluor® goat anti-mouse
IgG 488 (Cat. No. A11029), Alexa Fluor® goat anti-rat IgG 488 (Cat. No. A11006), and
Alexa Fluor® goat anti-rabbit IgG 568 (Cat. No. A11011), all obtained from Life
Technologies. Antibodies were used at the following combinations and concentrations:
EGFR (1:200) and goat-anti-mouse-AF488 (1:200), PSA (1:100) and goat-anti-rabbit-
AF568 (1:100), CD105 (1:50) and goat-anti-rat-AF488 (1:200), vimentin (1:200) and goat-
anti-rabbit-AF568 (1:100), MUC1 (1:100) and goat-anti-mouse-AF488 (1:200), EIG121
(1:50) and goat-anti-rabbit-AF568 (1:100), CD10 (1:100) and goat-anti-mouse-AF488
(1:200), HDAC2 (1:50) and goat-anti-rabbit-AF568 (1:100).
Engel et al. Page 8
Adv Healthc Mater. Author manuscript; available in PMC 2016 August 05.
Author M
anuscriptA
uthor Manuscript
Author M
anuscriptA
uthor Manuscript

Cell culture
Established cell lines with known genomic characterization were used. For ECa, Ishikawa
cells, isolated from a well differentiated stage 2 endometrial adenocarcinoma[50] were
matched with the endometrial stromal sarcoma cells line ESS-1, derived from a high-grade
endometrial stromal sarcoma.[51] For PCa, C4-2B cells, a castration-resistant bone
metastatic cell line derived from LNCaP cells[52] were coupled with the bone marrow
stromal cell line HS27a, immortalized by expression of human papilloma virus E6/E7
genes.[53] The C4-2B and ESS-1 cell lines were kindly provided by MD Anderson Cancer
Center and Russell Broaddus (MD Anderson Cancer Center, Houston, TX), respectively.
HS-27a and Ishikawa cell lines were purchased from American Type Culture Collection and
Sigma-Aldrich, respectively. C4-2B cells were maintained in RPMI 1640 (Life
Technologies) supplemented with heat-inactivated FBS (10%, v/v) and L-Glutamine (2 mM)
(Life Technologies). Ishikawa cells were maintained in DMEM/F12 (Life Technologies)
supplemented with heat-inactivated FBS (10%, v/v). ESS-1 cells were grown in RPMI 1640
(Life Technologies) supplemented with heat-inactivated FBS (20%, v/v). HS-27a cells were
maintained in low glucose DMEM (Life Technologies) supplemented with heat-inactivated
FBS (10%, v/v). All cultures were maintained at 37°C in a humidified atmosphere of air /
CO2 (95:5, v/v).
Hydrogel production and characterization
Thiolated hyaluronan (Glycosil®, carboxymethylated, thiolated hyaluronic acid), thiolated
porcine gelatin (Gelin-S®), and polyethylene glycol diacrylate (PEGDA) MW 3400
(Extralink®) were manufactured at BioTime Inc. (Alameda, CA) as previously described[28].
Five independent lots of thiolated hyaluronan and porcine gelatin were synthesized, and
characterized for dissolution time, pH, appearance, sterility, endotoxin levels, and thiolation
levels. All five lots were within quality limits defined by BioTime for these specifications.
The shear elastic modulus of HyStem® (Glycosil® + Extralink®) is 340 Pa and HyStem-C®
(Glycosil® + + Gelin-S® + Extralink®) is 83 Pa.[54] These hydrogels have a water content of
approximately 98% and undergo limited swelling: approximately 20% over 50 days.[55]
High throughput dispensing
Glycosil®, Gelin-S® and Extralink® were reconstituted (1%, w/v) in degassed water for use
in HA hydrogels. Two hydrogel compositions were used: for the first and second layers (see
below), a 4:1 volumetric ratio of Glycosil®:Extralink® (HA-PEGDA) was used; for the third
layer (see below), a 2:2:1 volumetric ratio of Glycosil®:Gelin-S®:Extralink® (HA-collagen)
was prepared. Since the addition of Extralink® drives gelation, it is added just prior to
robotic dispensing. Dispensing was performed with a Multidrop™ Combi Reagent
Dispenser (Cat # 5840300, ThermoFisher Scientific, Waltham, MA, USA) with a small tube
dispensing cassette on the fast dispensing setting into Aurora 384 well plates (Cat # 1052,
Brooks Automation, Inc., Chelmsford, MA, USA). After dispensing each layer, tubing was
immediately washed with PBS (10 mL). For the multi-layer HA-based culture system, three
distinct layers were dispensed. The first (acellular cushion layer) consisted of 12 µL HA-
PEGDA per well. Plates were spun at 160 ×g for 2 minutes in a plate centrifuge (Allegra 6
with GH-3.8 rotor, Beckman-Coulter, Brea, CA, USA). Five min after gelation, the second
Engel et al. Page 9
Adv Healthc Mater. Author manuscript; available in PMC 2016 August 05.
Author M
anuscriptA
uthor Manuscript
Author M
anuscriptA
uthor Manuscript

(cancer layer), consisting of 14 µL HA-PEGDA combined with 5,000 cancer cells (C4-2B or
Ishikawa) per well, was dispensed. Five min after gelation of the second layer, the third
(stromal layer), consisting of 5 µL HA-collagen without cells, was dispensed. Total volume
of hydrogel and number of cells per plate are as follows: the cushion layer was 4 mL HA + 1
mL PEGDA per 384 well plate, the cancer layer was 2.14 million cells in 5 mL HA + 1.25
mL PEGDA per plate, and the stromal layer was 0.94 mL HA, 0.94 mL thiolated gelatin and
0.47 mL PEGDA per plate. After gelation of the final layer, growth media (50 µL) was
added to each well. After 2 days of incubation, media was removed and replaced with fresh
growth media (50 µL). For co-cultures, media replacement contained 2,500 stromal cells
(HS27a or ESS-1). 2D mono-culture was performed by mixing cancer cells into cancer cell
media (300 cells per 50 µL media). Of this mixture, 50 µL was dispensed per well. Seeding
of cells for 3D-alginate culture was performed by pre-dispensing CaCl2 (1 µL of 5%, w/v) in
PBS. Then, 5,000 C4-2B or Ishikawa cells per 26 µL 3% (w/v) alginate in PBS (typically,
2.11 million cells in 11 mL per plate) were pre-mixed then dispensed into wells. After 30
min, growth media (50 µL) was added to each well.
Layer thickness assessment
Layer thickness was determined by the addition of fluorescent bead boundaries between
hydrogel layers. A 1:100 dilution of 6 µm Fluoresbright Carboxy YO beads (Cat# 19395,
Polysciences, Inc., Warrington, PA, USA) was made into reconstituted Glycosil®. A 1:1000
dilution of a 20 mM stock of 9-anthracenylmethyl acrylate in DMSO (Cat # 577111, Sigma-
Aldrich, St. Louis, MO, USA) was added to all layers. Bead boundary layers were added to
the bottom of the well as well as after dispensing of each of the cushion, cancer and stromal
layers as described above. After dispensing each bead boundary layer, plates were spun at
160 × g for 2 min in a plate centrifuge. Subsequent dispensing was performed 5 min after
gelation of the previous layer. Imaging of the hydrogel layers was performed with a Nikon
A1-Rsi confocal microscope (Nikon Corporation, Tokyo, Japan) with a 10× objective and
10× ocular lens for 100× final magnification. Fields were imaged with 405 nm and 568 nm
lasers and the appropriate emission filters to detect acrylated anthracene and fluorescent
beads, respectively. Each well was imaged with a Z-stack from 2200 µm to 3700 µm with 25
µm slices, encompassing all hydrogel layers. All images were extracted and processed using
CellProfiler.[56] Average anthracene fluorescence was determined using the
MeasureImageIntensity module and the total number of beads per image was calculated
using the IdentifyPrimaryObjects module. Per-image bead count data was ordered by Z-slice
and grouped by well. Identification of the local maxima of fluorescent beads within each
well group was used to determine the Z-slice corresponding with each new hydrogel layer.
The number of images between local maxima multiplied by the Z-slice thickness determined
the layer thickness. Anthracene fluorescence by Z-slice was used to verify total thicknesses
calculated. A total of three 384-well plates each for 5 lots of hydrogel was dispensed and
imaged.
Live cell/dead cell/nuclei confocal microscopy
After cell growth, culture media was replaced with calcein AM (4 µM, Cat# C1430, Life
Technologies, Carlsbad, CA, USA) to stain live cells, ethidium homodimer-1 (4 µM, EthD,
Cat# E1169, Life Technologies, Carlsbad, CA, USA) to stain dead cells and bisbenzimide
Engel et al. Page 10
Adv Healthc Mater. Author manuscript; available in PMC 2016 August 05.
Author M
anuscriptA
uthor Manuscript
Author M
anuscriptA
uthor Manuscript

trihydrochloride (4 µM, Hoechst 33342, Cat# B2261, Sigma-Aldrich, St. Louis, MO, USA)
to stain all nuclei, in PBS (Cat# 17-512F, Lonza Group, Basel, Switzerland). After 1 hr of
incubation, cells were imaged by confocal microscopy. For low-throughput characterization
of cell survival and cancer spheroid formation a Nikon A1-Rsi confocal with a 10× objective
was used. For high-throughput imaging of cancer spheroids, an IN Cell 6000 Analyzer (Cat#
29-0433-23, GE Healthcare, Chalfont, Buckinghamshire, UK) with a 10x objective was
used. Stromal cells were imaged at the base of the meniscus of the stromal cell hydrogel
layer in triplicate wells. 3D cancer spheroids were imaged at 3 Z-locations 75 µm (50 µm for
high-throughput) apart in the center of triplicate wells. Cancer cell mono-cultures in 2D
were imaged at the cell monolayer in the center of triplicate wells.
Image analysis and survival assessment
Single-channel live/dead/nuclei confocal images were analyzed with CellProfiler using the
IdentifyPrimaryObjects and MeasureObjectSizeShape modules. Cancer spheroid size was
calculated by multiplying the maximum diameter in pixels of each CellProfiler-detected
object in the calcein AM channel by the microns per pixel of the confocal microscope and
objective to get diameter in microns. Diameters were plotted as Tukey box plots using
GraphPad Prism 5 (GraphPad Software, Inc., La Jolla, CA, USA). Assessment of cell
survival involved calculation of total area in each channel by multiplying the number of
identified objects by the average area of objects in pixels. Two survival indexes were then
calculated. The first is the metabolic survival index (MetaSI) which compares the live cell
staining to dead cell staining, defined as:
The second survival index, the nuclear survival index (NucSI), compares total nuclei with
dead cell staining, defined as:
Immunofluorescence
Cells in 2D culture were immunostained with antibodies against cellular markers using
conventional methods. Briefly, cells were fixed for 10 min with parafomaldehyde (4%, w/v,
PFA) solution in phosphate buffer, and then rinsed with PBS. Cells were permeabilized with
Triton X-100 (0.2%, v/v) in PBS for 5 min at 25 °C, then blocked with a solution of Triton
X-100 (0.2%, v/v) and goat serum (3%, w/v) in PBS for 15 min, aspirated, incubated with
primary antibody in blocking solution for 30 min, rinsed 3×5 min with PBS, incubated with
secondary antibody in blocking solution for 30 min, rinsed 3×5 min with PBS, and
counterstained with DAPI (3 µg/mL) and Alexa Fluor® 647 phalloidin (5 units mL−1) (Life
Technologies) according to manufacturer’s directions. Samples from 2D cultures were
sealed with ProLong Gold (Life Technologies) according to manufacturer’s directions, and
imaged on a Nikon A1-Rsi confocal microscope using appropriate laser lines. Cells in 3D
Engel et al. Page 11
Adv Healthc Mater. Author manuscript; available in PMC 2016 August 05.
Author M
anuscriptA
uthor Manuscript
Author M
anuscriptA
uthor Manuscript
culture were immunostained by the same general methods, but with these slight
modifications: fixation by either PFA or 1:1 methanol:acetone solution, Triton X-100
concentration increased to 0.3% (v/v), blocking for 1 hr, primary and secondary antibody
incubation for 2 hrs at 37 °C, and gentle rotation on an x-y rotating table during staining
steps.
Drug treatments
Both 2D and 3D cancer cell mono-cultures were tested with a panel of 232 unique
chemotherapeutic compounds. These drugs included 114 compounds from the NCI
Approved Oncology Drugs set (National Cancer Institute, Bethesda, MD, USA) as well as
an additional 118 unique compounds culled from the University of Texas Health Science
Center custom clinical oncology drug set, both generously provided by Dr. Clifford Stephan
(TAMHSC, Houston, TX, USA). The full list of compounds can be found in tables S2 and
S3, Supporting Information. After 1 day of growth for 2D or 4 days of growth for 3D mono-
culture, each drug (50 nL of 10 mM stock solutions in DMSO) were added to the media (50
µL) in each well using a Tecan Freedom EVO liquid handling robot (Tecan Group Ltd.,
Männedorf, Switzerland) for a final concentration of 10 µM in each case. One well was
treated per drug in quadruplicate plates. An additional 16 wells were treated with
staurosporin (10 µM) or doxorubicin (10 µM) as positive killing controls and 106 wells with
DMSO (0.1%, v/v) alone as negative killing controls. After 3 days of drug treatment cells
were subjected to live/dead/nuclei staining, high throughput image analysis and survival
assessment as described above.
The different culture models were tested in dose response studies with a panel of single or
combination treatments with clinical relevance for PCa or ECa (Table S4 and S5, Supporting
Information). Clinical trials were culled from the Embase biomedical database. Trials were
included if the drugs listed were the only chemotherapeutics, and the authors reported
patient tumor response and/or prostate specific antigen response (PSA, PCa only). As the
C42B cell line represents a metastatic stage disease, trials of localized PCa were not
included in the analysis. The total number of reported patients with a tumor response
(complete + partial) or a PSA reduction of >50% in all trials of a specific drug were pooled
and divided by the total number of assessable patients in each case, resulting in an estimate
of clinical efficacy. No compensation was made for variations in patient population (e.g.
previous chemotherapy, tumor stage, etc.) or in administered drug concentration or schedule.
All dose response drugs were obtained from the NCI open chemical repository. The 2D and
3D culture models described above were treated with a range of 1 pM to 10 µM drug
concentration in duplicate wells in duplicate plates. An additional 8 wells per plate were
treated with an equal volume of DMSO as a negative cytotoxicity control. After 3 days of
drug treatment cells were subjected to live/dead/nuclei staining, high throughput image
analysis and survival assessment as described above. The minimal effective concentrations
(MEC) were defined as the lowest concentration of drug resulting in significant cytotoxicity
compared to DMSO control.
Engel et al. Page 12
Adv Healthc Mater. Author manuscript; available in PMC 2016 August 05.
Author M
anuscriptA
uthor Manuscript
Author M
anuscriptA
uthor Manuscript

Statistical analyses
All statistical calculations were performed with GraphPad InStat3 (GraphPad Software, Inc.,
La Jolla, CA, USA). Spheroid diameters were compared using Mann-Whitney two-tailed
analyses. Statistical analysis of cytotoxicity and minimum effective concentration was
performed by comparing metabolic or nuclear survival indices with a one-way analysis of
variance with Dunnett multiple comparisons test against the DMSO control.
Supplementary Material
Refer to Web version on PubMed Central for supplementary material.
Acknowledgements
We would like to thank Dr. Clifford Stephan and his lab at Texas A&M Health Science Center, Institute of Biosciences and Technology for assistance with the high throughput drug screens, supported by Cancer Prevention and Research Institute of Texas grant RP110532-P2. We also thank Carleton Southworth for his assistance on pooling and interpreting clinical trial data, Mark Klein and Craig Citro for their assistance in image processing, computation and data analysis, and the members of the Carson and Farach-Carson labs for many helpful discussions. Work supported by SBIR Contract #N43CA130061; NIH/NCI Grant # CA098912; Rice University Internal Funding (DDC).
References
1. Lovitt CJ, Shelper TB, Avery VM. Biology (Basel). 2014; 3:345. [PubMed: 24887773]
2. Weigelt B, Ghajar CM, Bissell MJ. Adv. Drug Deliv. Rev. 2014; 69–70:42.
3. Hait WN. Nat. Rev. Drug Discov. 2010; 9:253. [PubMed: 20369394]
4. Chambers KF, Mosaad EMO, Russell PJ, Clements JA, Doran MR. PLoS One. 2014; 9:e111029. [PubMed: 25380249]
5. Sieh S, Taubenberger AV, Rizzi SC, Sadowski M, Lehman ML, Rockstroh A, An J, Clements Ja, Nelson CC, Hutmacher DW. PLoS One. 2012; 7:19.
6. Howes AL, Richardson RD, Finlay D, Vuori K. PLoS One. 2014; 9:e108283. [PubMed: 25247711]
7. Hongisto V, Jernström S, Fey V, Mpindi J-P, Kleivi Sahlberg K, Kallioniemi O, Perälä M. PLoS One. 2013; 8:e77232. [PubMed: 24194875]
8. Härmä V, Virtanen J, Mäkelä R, Happonen A, Mpindi J-P, Knuuttila M, Kohonen P, Lötjönen J, Kallioniemi O, Nees M. PLoS One. 2010; 5:e10431. [PubMed: 20454659]
9. Park DW, Choi DS, Ryu H-S, Kwon HC, Joo H, Min CK. Cancer Lett. 2003; 195:185. [PubMed: 12767527]
10. Takagi A, Watanabe M, Ishii Y, Morita J, Hirokawa Y, Matsuzaki T, Shiraishi T. Anticancer Res. 2007; 27:45. [PubMed: 17352215]
11. Eritja N, Llobet D, Domingo M, Santacana M, Yeramian A, Matias-Guiu X, Dolcet X. Am. J. Pathol. 2010; 176:2722. [PubMed: 20395448]
12. Park CC, Georgescu W, Polyzos A, Pham C, Ahmed KM, Zhang H, Costes SV. Integr. Biol. (Camb). 2013; 5:681. [PubMed: 23407655]
13. Fang X, Sittadjody S, Gyabaah K, Opara EC, Balaji KC. PLoS One. 2013; 8:e75187. [PubMed: 24073251]
14. Assoian RK, Zhu X. Curr. Opin. Cell Biol. 1997; 9:93. [PubMed: 9013668]
15. Zielinski BA, Aebischer P. Biomaterials. 1994; 15:1049. [PubMed: 7888575]
16. Mironi-Harpaz I, Wang DY, Venkatraman S, Seliktar D. Acta Biomater. 2012; 8:1838. [PubMed: 22285429]
17. Führmann T, Obermeyer J, Tator CH, Shoichet MS. Methods. 2015
Engel et al. Page 13
Adv Healthc Mater. Author manuscript; available in PMC 2016 August 05.
Author M
anuscriptA
uthor Manuscript
Author M
anuscriptA
uthor Manuscript

18. Kenny PA, Lee GY, Myers CA, Neve RM, Semeiks JR, Spellman PT, Lorenz K, Lee EH, Barcellos-Hoff MH, Petersen OW, Gray JW, Bissell MJ. Mol. Oncol. 2007; 1:84. [PubMed: 18516279]
19. Clark BR, Keating A. Ann. N. Y. Acad. Sci. 1995; 770:70. [PubMed: 8597383]
20. Josefsson A, Adamo H, Hammarsten P, Granfors T, Stattin P, Egevad L, Laurent AE, Wikström P, Bergh A. Am. J. Pathol. 2011; 179:1961. [PubMed: 21854754]
21. Simpson MA, Weigel JA, Weigel PH. Int. J. Cancer. 2012; 131
22. Afify AM, Craig S, Paulino AFG, Stern R. Ann. Diagn. Pathol. 2005; 9:312. [PubMed: 16308159]
23. Bourguignon LYW, Singleton PA, Zhu H, Zhou B. J. Biol. Chem. 2002; 277:39703. [PubMed: 12145287]
24. Bourguignon LYW, Singleton PA, Zhu H, Diedrich F. J. Biol. Chem. 2003; 278:29420. [PubMed: 12748184]
25. Dicker KT, Gurski LA, Pradhan-Bhatt S, Witt RL, Farach-Carson MC, Jia X. Acta Biomater. 2014; 10:1558. [PubMed: 24361428]
26. Burdick JA, Prestwich GD. Adv. Mater. 2011; 23
27. Xu X, Jha AK, Harrington DA, Farach-Carson MC, Jia X. Soft Matter. 2012; 8:3280. [PubMed: 22419946]
28. Shu XZ, Liu Y, Luo Y, Roberts MC, Prestwich GD. Biomacromolecules. 2002; 3:1304. [PubMed: 12425669]
29. Ghosh K, Shu XZ, Mou R, Lombardi J, Prestwich GD, Rafailovich MH, Clark RAF. Biomacromolecules. 2005; 6:2857. [PubMed: 16153128]
30. Liu Y, Shu XZ, Prestwich GD. Tissue Eng. 2007; 13:1091. [PubMed: 17582839]
31. Engler AJ, Sen S, Sweeney HL, Discher DE. Cell. 2006; 126:677. [PubMed: 16923388]
32. Fong ELS, Martinez M, Yang J, Mikos AG, Navone NM, Harrington DA, Farach-Carson MC. Mol. Pharm. 2014; 11:2040. [PubMed: 24779589]
33. Gurski LA, Jha AK, Zhang C, Jia X, Farach-Carson MC. Biomaterials. 2009; 30:6076. [PubMed: 19695694]
34. Cai S, Liu Y, Zheng Shu X, Prestwich GD. Biomaterials. 2005; 26:6054. [PubMed: 15958243]
35. Pike DB, Cai S, Pomraning KR, Firpo MA, Fisher RJ, Shu XZ, Prestwich GD, Peattie RA. Biomaterials. 2006; 27:5242. [PubMed: 16806456]
36. Xu X, Gurski LA, Zhang C, Harrington DA, Farach-Carson MC, Jia X. Biomaterials. 2012; 33:9049. [PubMed: 22999468]
37. Jung MO, Bakin RE. Open Cell Dev. Biol. J. 2008; 1:1.
38. Hrzenjak A, Moinfar F, Kremser M-L, Strohmeier B, Staber PB, Zatloukal K, Denk H. Mol. Cancer Ther. 2006; 5:2203. [PubMed: 16985053]
39. Silverberg SG. Mod. Pathol. 2000; 13:309. [PubMed: 10757341]
40. Warren CR, Grindel BJ, Francis L, Carson DD, Farach-Carson MC. J. Cell. Biochem. 2014; 115:1322. [PubMed: 24700612]
41. French MM, Gomes RR, Timpl R, Höök M, Czymmek K, Farach-Carson MC, Carson DD. J. Bone Miner. Res. 2002; 17:48. [PubMed: 11771669]
42. Ylöstalo JH, Bartosh TJ, Coble K, Prockop DJ. Stem Cells. 2012; 30:2283. [PubMed: 22865689]
43. Farach-Carson MC, Warren CR, Harrington DA, Carson DD. Matrix Biol. 2014; 34:64. [PubMed: 24001398]
44. Muranen T, Selfors LM, Worster DT, Iwanicki MP, Song L, Morales FC, Gao S, Mills GB, Brugge JS. Cancer Cell. 2012; 21:227. [PubMed: 22340595]
45. Xu X, Sabanayagam CR, Harrington DA, Farach-Carson MC, Jia X. Biomaterials. 2014; 35:3319. [PubMed: 24447463]
46. Ranga, a; Gobaa, S.; Okawa, Y.; Mosiewicz, K.; Negro, a; Lutolf, MP. Nat. Commun. 2014; 5:4324. [PubMed: 25027775]
47. Osborne CK, Drelichman A, Von Hoff DD, Crawford ED. Cancer Treat. Rep. 1983; 67:1133. [PubMed: 6652630]
48. Chitcholtan K, Sykes PH, Evans JJ. J. Transl. Med. 2012; 10:38. [PubMed: 22394685]
Engel et al. Page 14
Adv Healthc Mater. Author manuscript; available in PMC 2016 August 05.
Author M
anuscriptA
uthor Manuscript
Author M
anuscriptA
uthor Manuscript

49. Forrest ARR, Kawaji H, Rehli M, Baillie JK, de Hoon MJL, Lassmann T, Itoh M, Summers KM, Suzuki H, Daub CO, Kawai J, Heutink P, Hide W, Freeman TC, Lenhard B, Bajic VB, Taylor MS, Makeev VJ, Sandelin A, Hume DA, Carninci P, Hayashizaki Y. Nature. 2014; 507:462. [PubMed: 24670764]
50. Nishida M, Kasahara K, Kaneko M, Iwasaki H, Hayashi K. Nihon Sanka Fujinka Gakkai Zasshi. 1985; 37:1103. [PubMed: 4031568]
51. Gunawan B, Braun S, Cortés MJ, Bergmann F, Karl C, Füzesi L. Int. J. Cancer. 1998; 77:424. [PubMed: 9663606]
52. Wu TT, Sikes RA, Cui Q, Thalmann GN, Kao C, Murphy CF, Yang H, Zhau HE, Balian G, Chung LW. Int. J. Cancer. 1998; 77:887. [PubMed: 9714059]
53. Roecklein BA, Torok-Storb B. Blood. 1995; 85:997. [PubMed: 7849321]
54. Vanderhooft JL, Alcoutlabi M, Magda JJ, Prestwich GD. Macromol. Biosci. 2009; 9:20. [PubMed: 18839402]
55. Xiao ZS, Ahmad S, Liu Y, Prestwich GD. J. Biomed. Mater. Res. 2006; 79:902.
56. Lamprecht MR, Sabatini DM, Carpenter AE. Biotechniques. 2007; 42:71. [PubMed: 17269487]
Engel et al. Page 15
Adv Healthc Mater. Author manuscript; available in PMC 2016 August 05.
Author M
anuscriptA
uthor Manuscript
Author M
anuscriptA
uthor Manuscript

Figure 1. Multi-layer co-culture system and layer characterizationa: Illustration of bead boundary method for hydrogel layer thickness assessment (left) and
confocal 3D reconstruction (right). Fluorescent beads (red) were encapsulated in boundary
layers between HA hydrogel layers (blue) in order to measure layer thicknesses. b:
Illustration of multi-layer 3D co-culture system (left) and confocal 3D reconstruction (right).
A representative, manually pipetted three layer co-culture system of C4-2B (7 days growth)
and HS27a (5 days growth) cells was stained with calcein AM (green), EthD (red) and
Hoechst (blue). Scale bar 50 µm.
Engel et al. Page 16
Adv Healthc Mater. Author manuscript; available in PMC 2016 August 05.
Author M
anuscriptA
uthor Manuscript
Author M
anuscriptA
uthor Manuscript

Engel et al. Page 17
Adv Healthc Mater. Author manuscript; available in PMC 2016 August 05.
Author M
anuscriptA
uthor Manuscript
Author M
anuscriptA
uthor Manuscript

Engel et al. Page 18
Adv Healthc Mater. Author manuscript; available in PMC 2016 August 05.
Author M
anuscriptA
uthor Manuscript
Author M
anuscriptA
uthor Manuscript

Engel et al. Page 19
Adv Healthc Mater. Author manuscript; available in PMC 2016 August 05.
Author M
anuscriptA
uthor Manuscript
Author M
anuscriptA
uthor Manuscript

Engel et al. Page 20
Adv Healthc Mater. Author manuscript; available in PMC 2016 August 05.
Author M
anuscriptA
uthor Manuscript
Author M
anuscriptA
uthor Manuscript

Engel et al. Page 21
Adv Healthc Mater. Author manuscript; available in PMC 2016 August 05.
Author M
anuscriptA
uthor Manuscript
Author M
anuscriptA
uthor Manuscript

Figure 2. Cancer and stromal cells survive and grow in monocultureConfocal images represented as calcein AM (green), ethidium homodimer-2 (red) and
Hoechst 33342 (blue) stains with magnified inset, MetaSI represented as mean ± standard
deviation and live cell cluster diameter represented as Tukey box plots. a: Ishikawa cells in
3D HA mono-culture. b: C4-2B cells in 3D HA mono-culture. c: ESS-1 cells in 2.5D mono-
culture on HA-collagen. d: HS27a cells in 2.5D mono-culture on HA-collagen. e: Manually
dispensed cells in co-culture, Ishikawa with ESS-1 and C4-2B with HS27a. f: Quantitation
of cancer cell cluster diameter of cells from e. g: MetaSI of cells from e. h: Quantitation of
cancer cell cluster diameters from high throughput dispensing in mono- or co-culture. i: MetaSI of cancer cell clusters from high throughput dispensing in mono- or co-culture. Full
image scale bars represent 50 µm, magnified inset scale bars represent 25 µm. Two-tailed
Mann-Whitney p value < 0.001 (***) compared to day 1 (a, b) and mono- vs co-culture (h).
Engel et al. Page 22
Adv Healthc Mater. Author manuscript; available in PMC 2016 August 05.
Author M
anuscriptA
uthor Manuscript
Author M
anuscriptA
uthor Manuscript

Engel et al. Page 23
Adv Healthc Mater. Author manuscript; available in PMC 2016 August 05.
Author M
anuscriptA
uthor Manuscript
Author M
anuscriptA
uthor Manuscript

Engel et al. Page 24
Adv Healthc Mater. Author manuscript; available in PMC 2016 August 05.
Author M
anuscriptA
uthor Manuscript
Author M
anuscriptA
uthor Manuscript

Engel et al. Page 25
Adv Healthc Mater. Author manuscript; available in PMC 2016 August 05.
Author M
anuscriptA
uthor Manuscript
Author M
anuscriptA
uthor Manuscript

Figure 3. Cells maintain phenotypic markers in HA-based mono- and co-culturea: Ishikawa cells express MUC1 (green) and EIG121 (red) in all culture conditions. b:
C4-2B cells express EGFR (green) and PSA (red) in all culture conditions. c: ESS-1 cells
express CD10 (green), and HDAC2 (red) in all culture conditions. HDAC2 expression is
nuclear in mono-culture, but nuclear and cytoplasmic in co-culture. d: HS27a cells express
CD105 (bottom) and vimentin (top) in all culture conditions. Nuclei shown in blue. Scale
bar 50 µm.
Engel et al. Page 26
Adv Healthc Mater. Author manuscript; available in PMC 2016 August 05.
Author M
anuscriptA
uthor Manuscript
Author M
anuscriptA
uthor Manuscript

Engel et al. Page 27
Adv Healthc Mater. Author manuscript; available in PMC 2016 August 05.
Author M
anuscriptA
uthor Manuscript
Author M
anuscriptA
uthor Manuscript

Engel et al. Page 28
Adv Healthc Mater. Author manuscript; available in PMC 2016 August 05.
Author M
anuscriptA
uthor Manuscript
Author M
anuscriptA
uthor Manuscript

Figure 4. Dose response of clinically relevant compounds for testing in culture modelsa: Representation of each culture model tested with clinically relevant drugs. Cells were
grown on tissue culture plastic (2D), encapsulated in a single alginate layer (3D-alginate;
blue), in mono-culture (HA mono-culture) or in co-culture with corresponding stromal cells
(HA co-culture) in HA multi-layer system (cushion layer tan, cancer layer green, stromal
layer red). b,c: Typical dose response curves for cancer cell cytotoxicity. d: Calcein AM
(green), EthD (red) and Hoechst (nuclei) staining of cells treated with 10 µM paclitaxel
showing outside-in cellular death. Scale bar 50 µm.
Engel et al. Page 29
Adv Healthc Mater. Author manuscript; available in PMC 2016 August 05.
Author M
anuscriptA
uthor Manuscript
Author M
anuscriptA
uthor Manuscript

Author M
anuscriptA
uthor Manuscript
Author M
anuscriptA
uthor Manuscript
Engel et al. Page 30
Table 1Drugs with differential cytotoxicity in 2D vs 3D, organized by mechanism of action
Cells in 2D or 3D monoculture were treated with 10 µM drug for 3 days. Survival indexes statistically different
from DMSO according to ANOVA with Dunnett post-test considered cytotoxic. Comparison of 2D and 3D
cytotoxicity showed several categories of drugs with differential kill.
Ishikawa cells
2D more resistant
Mechanism Compound
DNA damage agent Valrubicin
PI3K pathway inhibitor GDC 0941
3D more resistant
Mechanism Compound
Alkylating agent Mechlorethamine HCl
Aurora kinase inhibitor ZM447439
Cox-2 inhibitor Celecoxib
DNA replication inhibitorHydroxyurea
Mitoxantrone
EGFR family inhibitor Lapatinib
GSK-3 inhibitor SB 216763
HSP inhibitorGeldenamycin
NVP AUY922
IR inhibitor BMS-536924
mTOR inhibitorRapamycin
Temsirolimus
PI3K pathway inhibitor MK-2206
PKC pathway inhibitorPKC412
U 73122
Potassium channel opener BMS 204352
ROCK inhibitor GSK 269962A
ROS generator Elesclomol
SRC inhibitorDasatinib
SU 6656
VEGFR and PDGFR family inhibitor
CHIR 258
Sunitinib
Vandetanib
Xanthine oxidase inhibitor Allopurinol
C4-2B cells
2D more resistant
Mechanism Compound
ALK inhibitor NVP TAE684
Alkylating agent Pipobroman
Autophagy inducer STF-62247
Bcl2 Inhibitor ABT-263
Adv Healthc Mater. Author manuscript; available in PMC 2016 August 05.

Author M
anuscriptA
uthor Manuscript
Author M
anuscriptA
uthor Manuscript
Engel et al. Page 31
Cell cycle inhibitor Roscovitine
Cox-2 inhibitor Celecoxib
DNA damage agent
Bleomycin sulfate
Teniposide
Valrubicin
DNA repair inhibitor Compound 401
DNA replication inhibitor
Clofarabine
Floxuridine
Fluorouracil
Gemcitabine HCl
Hydroxyurea
EGFR family inhibitorCanertinib
Gefitinib
ER inhibitor Raloxifene
IR inhibitor BMS-536924
MAPK pathway inhibitor PD 169316
MEK inhibitorCI 1040
RDEA119
PI3K pathway inhibitor
GDC 0941
MK-2206
PI-103
TGX 221
ZSTK474
VEGFR and PDGFR family inhibitorSunitinib
Vandetanib
3D more resistant
Mechanism Compound
Bcl2 Inhibitor HA14-1
PKC pathway inhibitor U 73122
Potassium channel opener BMS 204352
ROS generator Elesclomol
SRC inhibitor SU 6656
Adv Healthc Mater. Author manuscript; available in PMC 2016 August 05.
Author M
anuscriptA
uthor Manuscript
Author M
anuscriptA
uthor Manuscript
Engel et al. Page 32
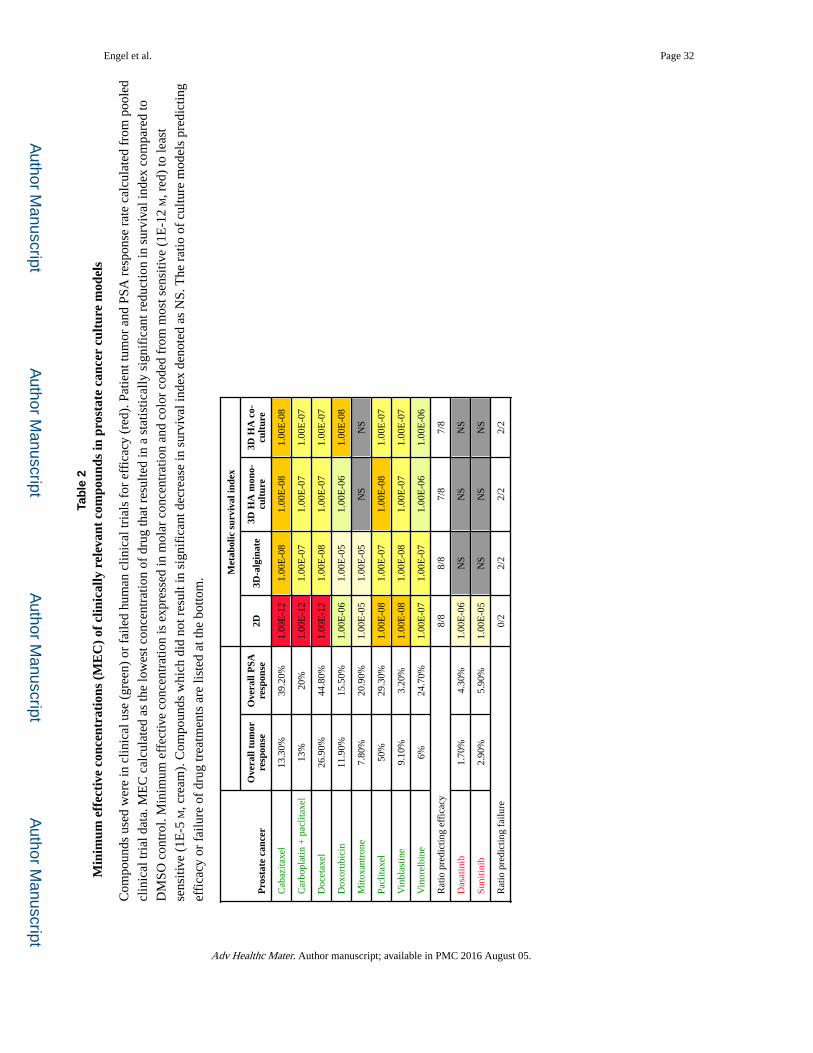
Tab
le 2
Min
imum
eff
ecti
ve c
once
ntra
tion
s (M
EC
) of
clin
ical
ly r
elev
ant
com
poun
ds in
pro
stat
e ca
ncer
cul
ture
mod
els
Com
poun
ds u
sed
wer
e in
clin
ical
use
(gr
een)
or
faile
d hu
man
clin
ical
tria
ls f
or e
ffic
acy
(red
). P
atie
nt tu
mor
and
PSA
res
pons
e ra
te c
alcu
late
d fr
om p
oole
d
clin
ical
tria
l dat
a. M
EC
cal
cula
ted
as th
e lo
wes
t con
cent
ratio
n of
dru
g th
at r
esul
ted
in a
sta
tistic
ally
sig
nifi
cant
red
uctio
n in
sur
viva
l ind
ex c
ompa
red
to
DM
SO c
ontr
ol. M
inim
um e
ffec
tive
conc
entr
atio
n is
exp
ress
ed in
mol
ar c
once
ntra
tion
and
colo
r co
ded
from
mos
t sen
sitiv
e (1
E-1
2 M
, red
) to
leas
t
sens
itive
(1E
-5 M
, cre
am).
Com
poun
ds w
hich
did
not
res
ult i
n si
gnif
ican
t dec
reas
e in
sur
viva
l ind
ex d
enot
ed a
s N
S. T
he r
atio
of
cultu
re m
odel
s pr
edic
ting
effi
cacy
or
failu
re o
f dr
ug tr
eatm
ents
are
list
ed a
t the
bot
tom
.
Pro
stat
e ca
ncer
Met
abol
ic s
urvi
val i
ndex
Ove
rall
tum
orre
spon
seO
vera
ll P
SAre
spon
se2D
3D-a
lgin
ate
3D H
A m
ono-
cult
ure
3D H
A c
o-cu
ltur
e
Cab
azita
xel
13.3
0%39
.20%
1.00
E-1
21.
00E
-08
1.00
E-0
81.
00E
-08
Car
bopl
atin
+ p
aclit
axel
13%
20%
1.00
E-1
21.
00E
-07
1.00
E-0
71.
00E
-07
Doc
etax
el26
.90%
44.8
0%1.
00E
-12
1.00
E-0
81.
00E
-07
1.00
E-0
7
Dox
orub
icin
11.9
0%15
.50%
1.00
E-0
61.
00E
-05
1.00
E-0
61.
00E
-08
Mito
xant
rone
7.80
%20
.90%
1.00
E-0
51.
00E
-05
NS
NS
Pacl
itaxe
l50
%29
.30%
1.00
E-0
81.
00E
-07
1.00
E-0
81.
00E
-07
Vin
blas
tine
9.10
%3.
20%
1.00
E-0
81.
00E
-08
1.00
E-0
71.
00E
-07
Vin
orel
bine
6%24
.70%
1.00
E-0
71.
00E
-07
1.00
E-0
61.
00E
-06
Rat
io p
redi
ctin
g ef
fica
cy8/
88/
87/
87/
8
Das
atin
ib1.
70%
4.30
%1.
00E
-06
NS
NS
NS
Suni
tinib
2.90
%5.
90%
1.00
E-0
5N
SN
SN
S
Rat
io p
redi
ctin
g fa
ilure
0/2
2/2
2/2
2/2
Adv Healthc Mater. Author manuscript; available in PMC 2016 August 05.
Author M
anuscriptA
uthor Manuscript
Author M
anuscriptA
uthor Manuscript
Engel et al. Page 33
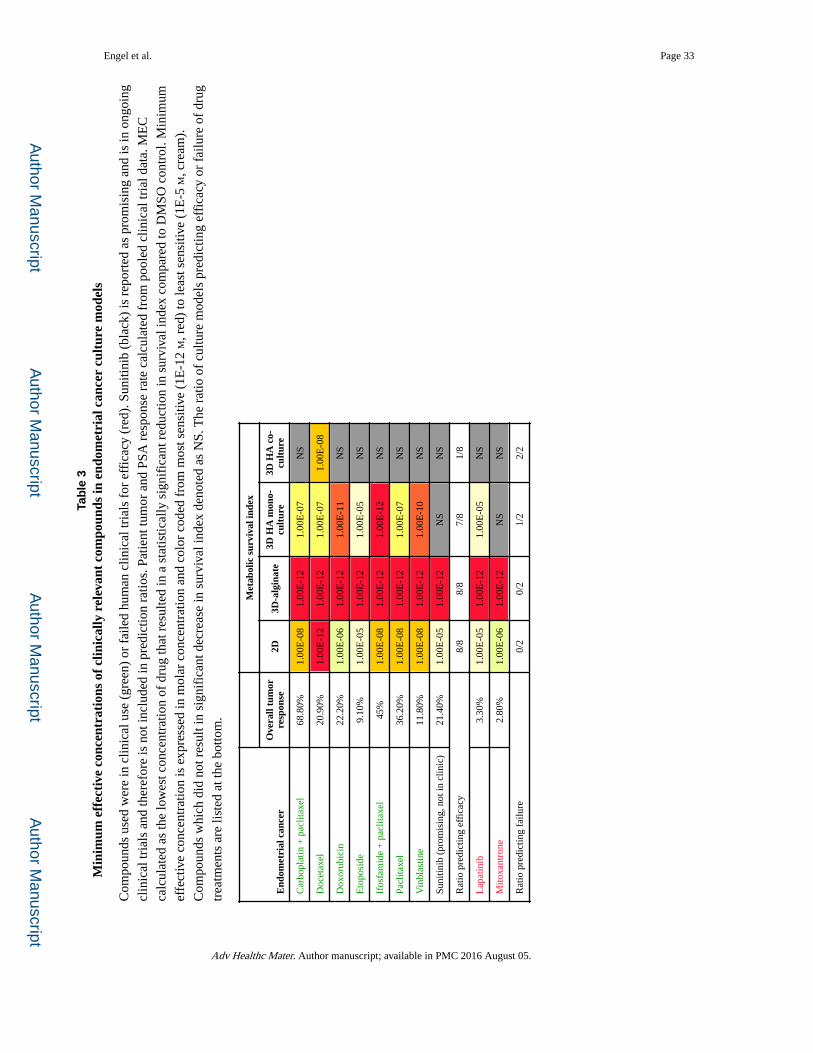
Tab
le 3
Min
imum
eff
ecti
ve c
once
ntra
tion
s of
clin
ical
ly r
elev
ant
com
poun
ds in
end
omet
rial
can
cer
cult
ure
mod
els
Com
poun
ds u
sed
wer
e in
clin
ical
use
(gr
een)
or
faile
d hu
man
clin
ical
tria
ls f
or e
ffic
acy
(red
). S
uniti
nib
(bla
ck)
is r
epor
ted
as p
rom
isin
g an
d is
in o
ngoi
ng
clin
ical
tria
ls a
nd th
eref
ore
is n
ot in
clud
ed in
pre
dict
ion
ratio
s. P
atie
nt tu
mor
and
PSA
res
pons
e ra
te c
alcu
late
d fr
om p
oole
d cl
inic
al tr
ial d
ata.
ME
C
calc
ulat
ed a
s th
e lo
wes
t con
cent
ratio
n of
dru
g th
at r
esul
ted
in a
sta
tistic
ally
sig
nifi
cant
red
uctio
n in
sur
viva
l ind
ex c
ompa
red
to D
MSO
con
trol
. Min
imum
effe
ctiv
e co
ncen
trat
ion
is e
xpre
ssed
in m
olar
con
cent
ratio
n an
d co
lor
code
d fr
om m
ost s
ensi
tive
(1E
-12
M, r
ed)
to le
ast s
ensi
tive
(1E
-5 M
, cre
am).
Com
poun
ds w
hich
did
not
res
ult i
n si
gnif
ican
t dec
reas
e in
sur
viva
l ind
ex d
enot
ed a
s N
S. T
he r
atio
of
cultu
re m
odel
s pr
edic
ting
effi
cacy
or
failu
re o
f dr
ug
trea
tmen
ts a
re li
sted
at t
he b
otto
m.
End
omet
rial
can
cer
Met
abol
ic s
urvi
val i
ndex
Ove
rall
tum
orre
spon
se2D
3D-a
lgin
ate
3D H
A m
ono-
cult
ure
3D H
A c
o-cu
ltur
e
Car
bopl
atin
+ p
aclit
axel
68.8
0%1.
00E
-08
1.00
E-1
21.
00E
-07
NS
Doc
etax
el20
.90%
1.00
E-1
21.
00E
-12
1.00
E-0
71.
00E
-08
Dox
orub
icin
22.2
0%1.
00E
-06
1.00
E-1
21.
00E
-11
NS
Eto
posi
de9.
10%
1.00
E-0
51.
00E
-12
1.00
E-0
5N
S
Ifos
fam
ide
+ p
aclit
axel
45%
1.00
E-0
81.
00E
-12
1.00
E-1
2N
S
Pacl
itaxe
l36
.20%
1.00
E-0
81.
00E
-12
1.00
E-0
7N
S
Vin
blas
tine
11.8
0%1.
00E
-08
1.00
E-1
21.
00E
-10
NS
Suni
tinib
(pr
omis
ing,
not
in c
linic
)21
.40%
1.00
E-0
51.
00E
-12
NS
NS
Rat
io p
redi
ctin
g ef
fica
cy8/
88/
87/
81/
8
Lap
atin
ib3.
30%
1.00
E-0
51.
00E
-12
1.00
E-0
5N
S
Mito
xant
rone
2.80
%1.
00E
-06
1.00
E-1
2N
SN
S
Rat
io p
redi
ctin
g fa
ilure
0/2
0/2
1/2
2/2
Adv Healthc Mater. Author manuscript; available in PMC 2016 August 05.