MODELLING ATTRITION IN THE EUROPEAN COMMUNITY
HOUSEHOLD PANEL: THE EFFECTIVENESS OF WEIGHTING
Leen Vandecasteele
Catholic University Leuven
Department of Sociology
E. Van Evenstraat 2B
3000 Leuven
Tel. 0032 16 32 31 76
c.be
Annelies Debels
Catholic University Leuven
Department of Sociology
E. Van Evenstraat 2B
3000 Leuven
Tel. 0032 16 32 31 76
Aspirant FWO-Vlaanderen
Paper prepared for the 2nd International Conference of ECHP Users –
EPUNet 2004, Berlin, June 24-26, 2004*
* Both authors contributed equally to this paper. Special thanks go to Prof. dr. J. Berghman and Prof. dr. J. Billiet for their useful comments.

2
Modelling attrition in the European Community Household Panel:
the effectiveness of weighting
ABSTRACT The European Community Household Panel is a rich source of information about living
standards and living circumstances in the European Union, but just like other panel
studies, it suffers from substantial attrition among participants. This attrition can lead to
biased results if it does not happen at random. Weighting can overcome these problems,
on condition that data are missing at random within the categories of the variables used
for weighting. This paper tries to assess the effectiveness of weighting in the ECHP, by
testing the effect of poverty on dropout propensity, under control of the variables used for
weighting. The analyses are conducted with data of the first seven waves for eleven
countries in the ECHP.
After describing initial nonresponse, different patterns of participation and indvidual
versus household nonresponse; we focus on the effect of poverty on attrition. Therefore,
the effect of poverty on dropout is investigated by means of a logistic regression model as
well as a time-discrete logistic hazard model. In line with previous research, we find poor
people dropping out significantly more than nonpoor people in the northern countries,
while this effect is reversed (though not always significant) in the southern countries and
in Ireland. Next, this paper tests whether dropout is random within the categories of the
variables used in the ECHP-weighting procedure. This is accomplished by examining if
the effect of poverty on dropout continues to exist under the control of relevant weighting
covariates, using both ordinary logistic regressions and discrete-time logistic hazard
models. The effect of poverty on dropout disappears in some countries, but remains
highly significant in others. Hence we conclude that the correction for non-random
attrition, obtained by weighting, tends to work out differently between countries.
KEY WORDS
Attrition / dropout / poverty / weighting / ECHP

3
Modelling attrition in the European Community Household Panel:
the effectiveness of weighting
1. Introduction
The unique design of panel studies offers a wide and appealing range of
opportunities to social scientists. In particular, panel data allow researchers to analyse
change on the micro-level, to investigate dynamic behaviour and transitions over time,
and to estimate the effect of events over the life course. However, panel studies also tend
to have some drawbacks, which can lead to bias in the results if neglected. The main
problem in this respect is the attrition or dropout of observation units throughout the
subsequent waves of a panel study. The consequences of this attrition are twofold (Engel
& Reinecke, 1996; Rose, 2000). First, it can strongly decrease the sample size, thereby
diminishing the efficiency of the estimates. Second, it can lead to biased estimates
whenever cases are not dropping out randomly from the original sample.
This paper examines the extent of the problem of non-random attrition in the
European Community Household Panel (ECHP). Although the ECHP offers a wide
range of variables relating to many different topics, we focus on one variable, namely
income poverty. This variable has proved to be a key variable throughout multiple
empirical researches conducted on the basis of the ECHP and similar datasets. Therefore,
it is imperative to investigate whether the attrition patterns of poor people differ
systematically from those of the non-poor.
In addition, this paper tests to what extent problems of non-random attrition with
respect to poverty can be solved by using the weights provided in the ECHP User
Database as a correction mechanism. The ECHP provides longitudinal as well as cross-
sectional weights. These weights attempt to correct not only for unequal selection
probabilities, but also for differing dropout probabilities. It is argued that weighting will
only be effective with respect to the problem of non-random dropout when the data are
missing at random within the categories of the variables used for weighting. Applied to
our variable of interest, this means that the effect of income poverty on dropout

4
probability should be cancelled when controlling for the variables that are used for
creating longitudinal weights in the ECHP. Conversely, if this effect continues to exist,
longitudinal weighting is not a satisfactory solution to the problem of non-random
dropout and these weights should not solely be relied on.
The paper is structured as follows. The first section surveys the results of previous
research concerning non-random dropout in socio-economic panel studies. Next, the
methodological rationale behind this paper is documented in a discussion of different
dropout mechanisms. The following section deals with design details of the ECHP, in
particular its construction of weights, and with the definition and operationalization of the
main concepts in this study. The final section breaks up in a descriptive and an inferential
part. The former contains descriptive statistics with respect to different types of unit-
nonresponse in the ECHP. In the latter the effect of poverty on dropout is modelled
univariately as well as multivariately under the control of variables used in the ECHP
weighting procedure.
2. Selective dropout in panel studies: previous findings
With a view to assessing the impact of panel dropout, previous research has
revealed various predictors of panel nonresponse and panel dropout in socio-economic
and/or household panels. In this section, we will focus on such research that was
conducted on the European Community Household Panel (ECHP), as well as on its
American equivalent, the Panel Study of Income Dynamics (PSID).
Researchers investigating the covariates of dropout patterns within the PSID
generally find indications of selective attrition processes. In particular, attriters tend to be
less educated, older and less frequently married than non-attriters (Fitzgerald, Gottschalk
& Moffit, 1998; Lillard & Panis, 1998; Zabel, 1998). Furthermore, divorced and
separated people display lower propensities to stay in the PSID (Fitzgerald, Gottschalk &
Moffit, 1998; Zabel, 1998). Finally, families with fewer children and with lower
household incomes, as well as people not owning a dwelling are more likely to attrite
(Fitzgerald, Gottschalk & Moffit, 1998; Zabel, 1998).

5
Similar determinants of attrition have been detected with respect to the ECHP.
Watson (2003) and Nicoletti & Peracchi (2002) show that attrition rates are higher for
young adults and older people. Similarly, Behr, Bellgardt & Rendtel (2002) find that
young people are less likely to respond. Renting a dwelling as well as moving have a
negative impact on response probabilities (Watson, 2003; Peracchi & Nicoletti, 2002),
but the latter effect is not consistent between different countries (Behr, Bellgardt &
Rendtel, 2002). Generally, the response rate of married people is higher than that of other
marital statusgroups (Watson, 2003; Behr, Bellgardt & Rendtel, 2002). Furthermore,
households with children are less likely to drop out (Watson, 2003). According to
Nicoletti & Peracchi (2002) this effect is mainly explained by the larger probability of
contact success for this group.
In addition, several studies have demonstrated that the higher educated tend to
have higher participation rates (De Keulenaer, 2003; Behr, Bellgardt & Rendtel, 2002;
Nicoletti & Peracchi, 2002). Watson (2003) has further investigated the effect of
edcucation and has found that it works out differently between countries. In Northern
European countries, higher educated people are indeed less likely to be lost, but the effect
is reversed in Southern European countries, where higher educated people are more likely
to drop out. A similar interaction effect has been established with respect to income and
country. In Southern European countries and Ireland, there is a higher attrition ratio for
high incomes, whereas in Northern European countries, individuals on the bottom of the
income distribution are more likely to drop out (Watson, 2003; Behr, Bellgardt &
Rendtel, 2002; Behr, Bellgardt & Rendtel, 2003a). Consequently, the poverty line is
underestimated in Southern European countries and Ireland, while it is overestimated in
the Northern European countries (Rendtel, Behr & Sisto, 2003).
Finally, research has also identified the importance of panel design and previous
panel experiences in explaining dropout. In particular, response probabilities decrease
when the interviewer is not the same across the waves (Nicoletti & Peracchi, 2002; Behr,
Bellgardt & Rendtel, 2002). Moreover, individuals not completing their interview in the
first wave are more prone to attrite, and so are persons with missing values on crucial
variables (e.g. income, tenure status…) in previous waves (Watson, 2003).

6
Although evidence abounds that panel attrition is selective along important social
characteristics, most studies conclude that this is not necessarily problematic for a correct
estimation of statistics. For the PSID, Lillard & Panis (1998) have demonstrated that
outcomes from analyses with household income, adult mortality, marriage formation and
marriage dissolution do not change substantively if attrition is ignored. Concerning the
ECHP, Watson (2003) as well as Behr, Rendtgardt & Rendtel (2003b) investigate the
consequences of selective attrition for the estimation of income, poverty and inequality
indicators by comparing wave one estimates for the complete sample with those for the
people that never drop out. Since these estimates only differ slightly, they conclude that
poverty and inequality indicators are not seriously biased by selective attrition in the
ECHP.
This paper will treat the problem of selective attrition from a different angle,
namely by making use of the possibilities offered by the ECHP-UDB to correct for non-
random dropout by weighting the sample. In particular, it is possible that any effect of
poverty on dropout ceases to exist within the categories of the weighting variables used in
the ECHP weighting procedure. For example, Femke de Keulenaer (2003) has shown that
for the Belgian data (PSBH), the effect of poverty on attrition probabilities disappears
when controlling for socio-economic and socio-demographic covariates. This paper will
test to what extent weighting in the ECHP can correct for selective attrition with respect
to the poverty variable.
3. Missing values in panel analysis
In the missing-data literature different types of dropout mechanisms have been
distinguished, each involving different consequences for analysis. This section discusses
these mechanisms, using the terminology originally chosen by Rubin (1976) and Rubin
and Little (1987).
Missing values can be the result of both item- and unit-nonresponse. Item-
nonresponse occurs when values on a limited number of variables are missing for a
particular observation unit. Alternatively, unit-nonresponse occurs when no values on
variables were registered for an observation unit, for instance when this unit did not

7
participate in the survey. In longitudinal panel datasets unit-nonresponse is called dropout
or attrition whenever a unit that once participated disappears from the panel for at least
one wave of the panel study.
In order to determine the dropout mechanism at work, one has to examine whether
one outcome variable Y has an influence on the response probability R. We also consider
a set of variables Xi (e.g. age, sex, nationality…) that are not subject to nonresponse. If R
is independent of Y and Xi, the missing data on the Y-variable are said to be missing-
completely-at-random (MCAR). In this case, the units with missing values on Y form a
random subsample of the complete sample (Little & Rubin, 1986). When the MCAR-
assumption holds, we can simply pursue the analyses with the subsample of non-attriters.
When missingness depends only on observed variables Xi’ and not on Y (Little, 1995),
the missing data on the Y-variable are called missing-at-random (MAR). In this case, R
depends on Xi, and under the control of Xi there is no effect of Y on R. Hence, the
subsample of units with missing values is not random with respect to Y, but within the
subclasses of Xi it is. In this instance, weighting procedures and imputation techniques
can be used to correct for possible bias in Y. The worst scenario occurs when the
response probability R is related not only to the observed variables Xi, but also to the
unobserved variable of interest Y. This missing value-mechanism is considered
problematic and non-ignorable, and as correction for it is very difficult, analyses with
these data tend to be biased.
If we want to examine to what extent the dropout-mechanism is influencing the
data in the ECHP, we need to test which of these three assumptions holds. The variable of
interest (Y) in this paper is poverty. Since we want to test whether weighting in the
ECHP is appropriate, let Xi be the variables used to construct the ECHP-UDB-weights
(e.g. age, sex, …1). Finally, R represents the probability to drop out.
Instead of using Yt (poverty measured in wave of dropout), we will use poverty
measured before the dropout of the individual (Yt-c) as a predictor of the dropout
probability Rt in wave t. The same applies for the set of weighting variables Xi(t-c). There
are two reasons for using lagged variables testing the above assumptions. First, it is not
1 For more detailed coverage, see section on ECHP weights

8
possible to test whether poverty in the year of dropout (Yt) influences the dropout
probability, because this variable is by definition unobserved for all the units dropping
out. Besides that, previous research has shown that there are reasons to believe that the
dropout probability will be influenced by poverty experienced in previous waves and by
the concomitant experience of having to answer income questions under these conditions
(Watson, 2003; Behr, Bellgardt & Rendtel, 2002; Behr, Bellgardt & Rendtel, 2003a).
Concluding, we will first examine whether our variable of interest (poverty) is
related to attrition. In a second stage, we will investigate whether the effect of poverty on
dropout remains under control of the variables used in the ECHP-weighting procedure. If
the effect of poverty disappears under control of the other covariates, we can conclude
that the dropout-mechanism is missing at random (MAR), and weighting or imputation of
the data is appropriate.
4. Data and operationalization
4.1. Dataset: European Community Household Panel
The European Community Household Panel is a standardized survey that has been
submitted annually to a panel of individuals and households in different European Union
member states (Eurostat, 2003a). For most countries2, it covers the period from 1994 to
2001. Austria joined from 1995 and Finland from 1996 onwards.
In Belgium and the Netherlands, since the outset of the study the ECHP-data are
derived from existing national panels, which only needed slight adaptation to fit the
ECHP-format (namely the Panel Study of Belgian Households-PSBH and the Dutch
Socio-Economic Panel-SEP) (Peracchi, 2000). In contrast, in Germany, Luxembourg and
the United Kingdom, the ECHP has been coexisting during three years with very similar
existing national panels: the German Social Economic Panel–GSOEP, Luxembourg’s
Social Economic Panel–PSELL and the British Household Panel Survey-BHPS. Only
2 Belgium, Denmark, France, Germany, Greece, Ireland, Italy, Luxembourg, Netherlands, Portugal, Spain, United Kingdom

9
from 1997 onwards, data for these countries are derived from the national panels.
However, the information in the earlier waves of the GSOEP, the PSELL and the BHPS
has been harmonized to enable comparison across waves.
In the first wave (1994), a sample of approximately 60.500 households and
130.000 individuals aged 16 and over was interviewed, with the aim to represent all the
individuals living in private households within the European Union of that time. The
questionnaire covers a wide range of topics, including income, poverty, health, education,
housing, demography, employment, etc.
Not all persons that have been interviewed are sample persons. Only the persons
that are drawn from the target population in the first wave and the children born out of
sample women after the first wave are considered to be sample persons. Non-sample
persons are individuals that were not initially in the sample, but started living together in
the same household with a sample person. Sample persons are eligible for the personal
interview when they have reached the age of 16 and live in a private household in the EU.
Non-sample persons living in a household with at least one sample person are eligible
under the same conditions.
At the moment of this study, seven waves of the ECHP were available, from 1994
to 2000. Only countries with complete coverage of these seven waves were included in
this paper: Belgium, Denmark, France, Germany, Greece, Ireland, Italy, the Netherlands,
Portugal, Spain and the United Kingdom.
4.2. Weighting in the ECHP
In the ECHP two types of weights can be distinguished, namely base weights (for
individuals) and cross-sectional weights (for individuals and households) (Eurostat,
2003b). The base weights are only available for sample persons. Non-sample persons
receive a zero base weight, but a nonzero cross-sectional weight.
10
The base weights are constructed as follows. Every sample person receives a
starting weight. This is the design weight3 in the first wave, or the final base weight from
the previous wave in every subsequent wave. This starting weight is multiplied by a
factor taking into account response probabilities, calculated on the basis of a logistic
regression. These weights are calibrated in order to reflect the distribution of the
population. This operation results in the base weights, suitable for longitudinal analyses,
which are typically confined to persons interviewed in all waves or persons living in an
interviewed household in all waves.
The cross-sectional weight is computed as the average of the base weights of all
the persons in a household and is assigned to all the residents in the household. It is
appropriate for cross-sectional analyses.
The variables used to adjust for response probabilities are the following: age, sex,
household size, number of economically active persons in the household, region, arrivals
to or departures from the household, type of household, tenure status, main source of
income, whether split-off household and equivalised income. Generally, researchers
assume that dropout will be random after using weighting variables in their analyses.
The aim of this paper is to test this assumption, using poverty as an explanatory
variable. However, we will exclude equivalised income from the weighting variables,
because it is a perfect predictor of poverty.
4.3. Main concepts
Dropout or attrition has been defined as a particular type of unit-nonresponse,
namely the nonresponse of complete units having participated at least once in the study,
but not continuing participation until the end of the panel study. Dropout can take place
both at the individual and the household level. In this paper the focus is on individual
dropout, in order to be able to take into account the differences in participation within
households.
3 The design weight depends on the sample selection probability of the person or the household

11
Attrition occurs for different reasons. First, it is possible that a person is no longer
eligible for the personal interview. This happens when the person dies or when (s)he
moves out of scope of the survey, for example in the case of institutionalization,
migration to a foreign country outside of the European Union, or movement of a
nonsample person to a household without sample persons. Alternatively, dropout can be
due to eligible persons no longer participating in the panel. In this respect, Lepkowski &
Couper (2002) have developed a model of panel nonresponse, in which three causes for
dropout are distinguished. First, in a panel study, problems can arise with the location of
the respondent, especially when the respondent has moved since the last wave. When the
respondent has been located, the interviewer can experience difficulties in contacting the
person. Successful contact will strongly depend on the at-home patterns of the
individuals. Finally, after locating and contacting the respondent, cooperation is required
to complete the interview. However, individuals or households can refuse further
cooperation for various reasons. Unsuccessful location, contact or cooperation are the
main causes of dropout of eligible persons. Whenever these are more likely to occur to
certain subgroups of the population, a problem of non-random dropout emerges.
Poverty is operationalized as a dummy variable indicating an income above or
under 60% of the median income poverty line in a particular country. This poverty
measure is widely used in current research with the ECHP. The income measure is
defined as the total yearly net disposable household income, divided by the OECD
equivalence scale in order to adjust for household size and composition. This equivalised
income is then attributed to each member of the household, thus creating an individual
income measure.
12
5. Findings
5.1. Descriptive statistics on unit-nonresponse in the ECHP
In this section a descriptive overview is provided of the most important
characteristics and patterns of unit-nonresponse in the eleven countries of the ECHP dealt
with in this study.
In a panel dataset, unit-nonresponse can take two forms. When it occurs in the
first wave and hence relates to the initial sample, it is called initial nonresponse.
Alternatively, when it refers to units not continuing participation in later waves, it is
labelled dropout.
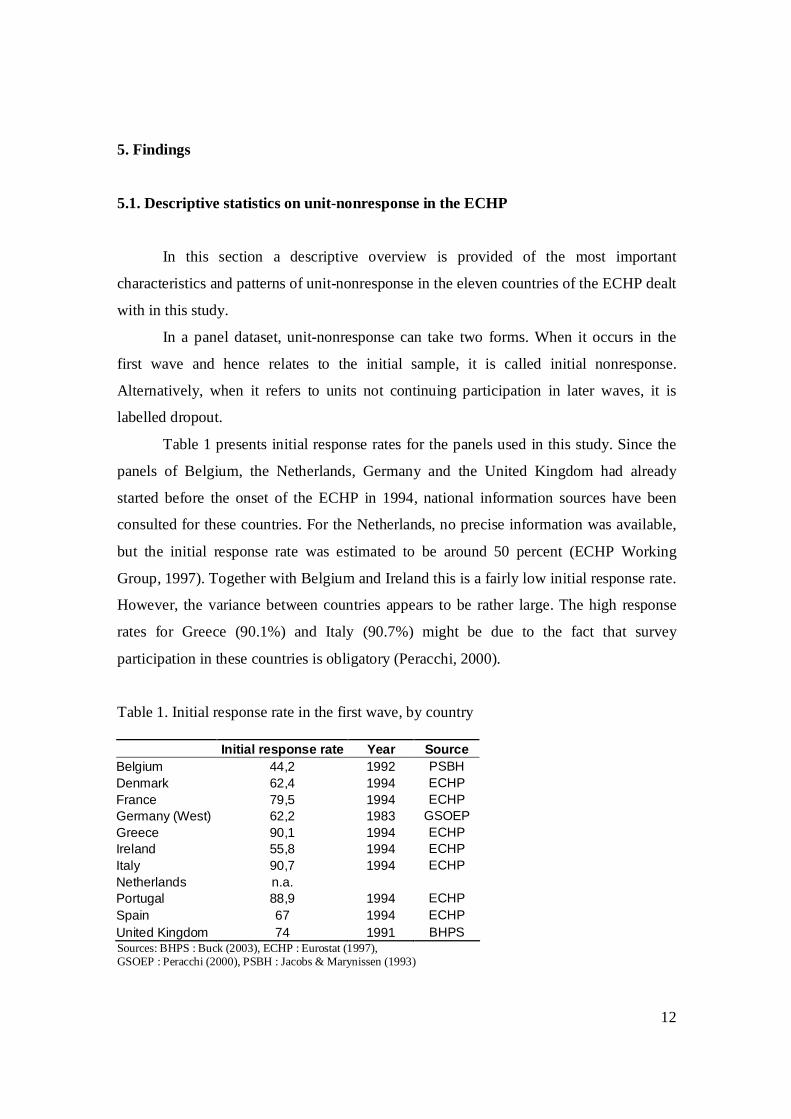
Table 1 presents initial response rates for the panels used in this study. Since the
panels of Belgium, the Netherlands, Germany and the United Kingdom had already
started before the onset of the ECHP in 1994, national information sources have been
consulted for these countries. For the Netherlands, no precise information was available,
but the initial response rate was estimated to be around 50 percent (ECHP Working
Group, 1997). Together with Belgium and Ireland this is a fairly low initial response rate.
However, the variance between countries appears to be rather large. The high response
rates for Greece (90.1%) and Italy (90.7%) might be due to the fact that survey
participation in these countries is obligatory (Peracchi, 2000).
Table 1. Initial response rate in the first wave, by country
Initial response rate Year Source Belgium 44,2 1992 PSBH Denmark 62,4 1994 ECHP France 79,5 1994 ECHP Germany (West) 62,2 1983 GSOEP Greece 90,1 1994 ECHP Ireland 55,8 1994 ECHP Italy 90,7 1994 ECHP Netherlands n.a. Portugal 88,9 1994 ECHP Spain 67 1994 ECHP United Kingdom 74 1991 BHPS Sources: BHPS : Buck (2003), ECHP : Eurostat (1997), GSOEP : Peracchi (2000), PSBH : Jacobs & Marynissen (1993)

13
A low initial response rate may indicate problems with the representativeness of
the initial sample. However, since no information is provided in the ECHP on the units
originally sampled but never participating, it is not possible to examine the biasedness of
the starting samples with respect to poverty4.
In this paper, further attention will be devoted to the other type of unit-
nonresponse, namely dropout. Table 2 summarizes the occurrence of different
participation patterns in each country under study for respondents participating for at
least one year in the panel survey. A general distinction is made between wave one-
persons, i.e. sample persons who actually participated in wave one, and new entry-
persons, i.e. sample or non-sample persons who joined the panel after the first wave.
Within each of these two broad categories, three types of participation patterns are
distinguished: 1.) always participating, i.e. staying in the panel until the end of the
observation period, 2.) monotone attrition, i.e. dropping out of the panel, but not
returning to it, and 3.) variable participation, i.e. dropping out and returning to the panel
at least once. For each country in table 2, the first row represents the percentage of all
individuals (both wave one- and new entry-persons) displaying each pattern, whereas the
second row relates to the wave one-persons only.
Considering all the individuals participating at least once, it appears from table 2
that the always-participating pattern is most frequent in every country, except in Ireland.
In the latter, monotone attrition is more important, whereas this pattern occupies a second
place for all other countries. The group of new entry-persons is less important, but not
negligible, especially not in the Netherlands.
The share of wave-one persons staying in the panel until the last wave varies from
34% in Ireland to 71 % in United Kingdom. The countries for which ECHP-data are part
of a longer-term panel study, namely the United Kingdom, Germany, Belgium and the
Netherlands, generally have moderate to high participation rates. The longer duration of
4 One exception to this is the Finnish part of the ECHP. The sample of the first wave (1996) of these data was selected from the Finnish population register, which made it possible to collect register information also for those who refused to participate in the first wave of the Finnish ECHP. From such a comparison, Rendtel, Behr & Sisto (2003) found that the initial nonresponse had a substantive effect on the distribution of income in Finland. Surprisingly, this effect tended to diminish due to subsequent dropout from the panel.

14
the panel possibly entails a selection effect of the respondents, in the sense that
respondents not attrited yet at the start of the ECHP are the ones willing to respond.
With respect to attrition, the main pattern is monotone attrition, whereas variable
participation occurs in less than 10% of the cases, except for Denmark. So if attrition
occurs, it mainly comes down to monotone attrition, and return to the panel is
uncommon. Therefore, in the rest of this paper, we will not focus on a possible return into
the panel, but limit ourselves to the first dropout of a respondent.
Table 2. Participation patterns in the ECHP
Wave one-persons New entry-persons
Always
participating monotone attrition
variable participation
always participating
monotone attrition
variable participation n
Belgium 45,34 33,24 5,11 9,48 6,47 0,36 100% 8018 54,17 39,72 6,11 100% 6710 Germany 53,49 21,72 4,17 14,52 5,83 0,27 100% 15411 67,38 27,37 5,25 100% 12233 UK 52,21 18,00 3,53 14,98 11,07 0,22 100% 12244 70,80 24,41 4,79 100% 9028 Denmark 37,34 35,19 9,47 8,99 8,25 0,75 100% 7198 45,54 42,91 11,55 100% 5903 Italy 50,35 26,18 5,63 12,32 5,13 0,40 100% 21580 61,28 31,86 6,85 100% 17729 Greece 45,06 31,54 5,65 11,23 6,30 0,22 100% 15188 54,78 38,35 6,87 100% 12492 Spain 38,94 34,91 7,80 11,39 6,55 0,40 100% 21911 47,69 42,75 9,56 100% 17893 France 52,21 37,27 6,02 11,85 6,93 0,21 100% 15008 54,67 39,02 6,31 100% 14333 Ireland 28,67 52,61 2,46 8,02 8,04 0,19 100% 11826 34,24 62,82 2,94 100% 9904 Netherlands 39,19 24,89 5,82 20,66 8,86 0,58 100% 13475 56,06 35,61 8,32 100% 9407 Portugal 52,20 19,84 5,39 16,28 5,83 0,46 100% 15008 67,41 25,63 6,96 100% 11621 Source: ECHP UDB-Version of June 2003.
In this paper, dropout for individuals is considered. Yet, individuals are always
member of a household, and we might be interested how often individual nonresponse is
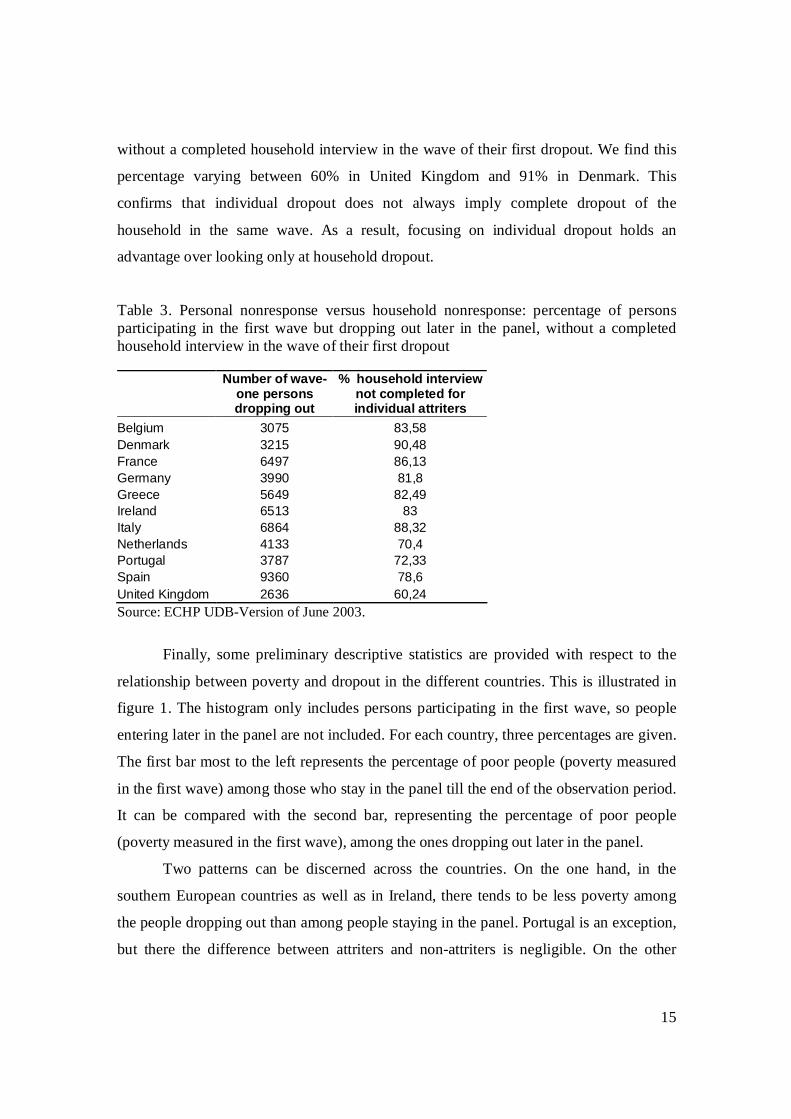
part of a larger household dropout. Table 3 indicates how often individual nonresponse
coincides with household nonresponse, by showing the percentage of wave-one persons
15
without a completed household interview in the wave of their first dropout. We find this
percentage varying between 60% in United Kingdom and 91% in Denmark. This
confirms that individual dropout does not always imply complete dropout of the
household in the same wave. As a result, focusing on individual dropout holds an
advantage over looking only at household dropout.
Table 3. Personal nonresponse versus household nonresponse: percentage of persons participating in the first wave but dropping out later in the panel, without a completed household interview in the wave of their first dropout
Number of wave-one persons dropping out
% household interview not completed for individual attriters
Belgium 3075 83,58 Denmark 3215 90,48 France 6497 86,13 Germany 3990 81,8 Greece 5649 82,49 Ireland 6513 83 Italy 6864 88,32 Netherlands 4133 70,4 Portugal 3787 72,33 Spain 9360 78,6 United Kingdom 2636 60,24 Source: ECHP UDB-Version of June 2003.
Finally, some preliminary descriptive statistics are provided with respect to the
relationship between poverty and dropout in the different countries. This is illustrated in
figure 1. The histogram only includes persons participating in the first wave, so people
entering later in the panel are not included. For each country, three percentages are given.
The first bar most to the left represents the percentage of poor people (poverty measured
in the first wave) among those who stay in the panel till the end of the observation period.
It can be compared with the second bar, representing the percentage of poor people
(poverty measured in the first wave), among the ones dropping out later in the panel.
Two patterns can be discerned across the countries. On the one hand, in the
southern European countries as well as in Ireland, there tends to be less poverty among
the people dropping out than among people staying in the panel. Portugal is an exception,
but there the difference between attriters and non-attriters is negligible. On the other

16
hand, all northern countries display the opposite pattern with higher poverty among
people dropping out. Hence, our data tend to confirm previous findings in this area
(Watson, 2003; Behr, Bellgardt & Rendtel, 2002; Behr, Bellgardt & Rendtel, 2003a). In
the next section a logistic regression analysis will be conducted to see whether the effect
of poverty on dropout is significant.
The third bar for each country in figure 1 again represents the percentage of poor
people among the people dropping out. Unlike the second bar of each histogram
however, poverty now is a time-dependent covariate, measured in the wave before the
person drops out. The proportions of poor people among attriters tend to be higher when
poverty is measured in this way. Therefore, this indicator of poverty can be assumed to
be a better predictor of dropout. This explains why in the next section we also run
dynamic logistic hazard models with poverty as a time-dependent predictor of dropout.
Figure 1. Histogram representing poverty percentages of different groups of first wave participants.
0.00
5.00
10.00
15.00
20.00
25.00
30.00
35.00
40.00
Denmar
k
Nethe
rland
s
Belgium
Fran
ce
Germ
any
United
King
dom
Portu
gal
Irelan
dIta
ly
Greec
eSpa
in
% poor (wave1) of people never dropping out% poor (wave1) of people dropping out% poor (wave before dropout) of people dropping out
Source: ECHP UDB-Version of June 2003.

17
5.2. Regression analyses
In this section dropout is modelled as a function of poverty, both univariately and
under control of the variables used for weighting in the ECHP. Four models are
estimated, two of which employ static explanatory variables, referring to the first wave of
the panel and two of which are dynamic hazard models, estimating the effect of poverty
measured in the wave before dropout. In all four models, the dependent variable is a
binary variable, indicating whether an individual does or does not drop out. Only
individuals participating in the first wave are included, so new entry-persons are not
taken into consideration in this section. Moreover, only the first attrition of each
individual is modelled.
Table 4 shows the results of a logistic regression modelling the probability to drop
out. Model 1 is a univariate model for each country, estimating the effect of poverty in
the first wave on the probability to drop out. Poor people display a significantly higher
chance to drop out in Belgium, Denmark, France, Germany, the Netherlands and the
United Kingdom. This effect is reversed in Greece and Italy. In Ireland, Spain and
Portugal no significant effect was encountered. This divide between Northern and
Southern European countries supports findings of previous researchers (Watson, 2003;
Behr, Bellgardt & Rendtel, 2002; Behr, Bellgardt & Rendtel, 2003a).
In model 2 the same effect is estimated under control of the variables used for
weighting. These variables include age, sex, household size, number of economically
active persons in the household, region, type of household, tenure status and main source
of income, all measured in the first wave.5 For countries with a significant effect of
poverty on dropout, model 2 in table 4 shows whether this effect remains significant
under control of the weighting variables. This appears to be the case only in four
countries: Denmark, France, Germany and the Netherlands. In Belgium, Greece and Italy,
the effect of poverty on dropout disappears under control of the weighting variables. For
5 However, the variables ‘arrivals to or departures from the household’ and ‘whether split-off household’ are not included since they are not available in the first wave. ‘Equivalised income’ was dropped because it is a perfect predictor of poverty. In Denmark and the Netherlands, the effect of region is not estimated. In the Netherlands the variable ‘region’ is omitted because of confidentiality reasons, and in Denmark, only one region is distinguished.

18
the United Kingdom no second model is estimated, since in the BHPS other weighting
variables are used.
Table 4. Logistic regression modelling the effect of poverty in wave 1 on the dropout probability (Model 1), under control of ECHP weighting variables (Model 2)
Model 1 Model 2
DF
Odds Ratio
Estimate
Type III Analysis of Effects p
Odds Ratio
Estimate
Type III Analysis of Effects p
Belgium 1 1,24 89,339 ** 1,03 0,0923 ns Denmark 1 1,73 37,331 *** 1,28 64,784 * France 1 1,47 629,522 *** 1,21 125,276 *** Germany 1 1,46 464,818 *** 1,38 270,993 *** Greece 1 0,79 24,526 *** 0,97 0,2878 ns Ireland 1 0,89 33,401 ns Italy 1 0,75 493,987 *** 0,94 14,861 ns Netherlands 1 1,39 206,987 *** 1,33 132,364 *** Portugal 1 1,03 0,3209 ns Spain 1 0,96 0,823 ns United Kingdom 1 1,73 843,046 *** *p<0.05, **p<0.01, ***p<0.001, ns = not significant Source: ECHP UDB-Version of June 2003.
From this, it can be concluded that weighting is effective in Belgium, Greece and
Italy, because the data are missing at random within the categories of the variables used
for weighting. Moreover, in Ireland, Portugal and Spain, weighting in order to correct for
non-random dropout of poor people is in fact not necessary, because the effect of poverty
on dropout proves to be not significant. However, in Denmark, France, Germany and the
Netherlands, weighting does not correct (sufficiently) for non-random dropout of poor
people. In these countries, dropout is non-ignorable for researchers interested in poverty
analyses.

19
Table 5. Discrete-time logistic hazard models, modelling the effect of poverty, measured in wave before dropout, on the dropout probability (Model 3), under control of ECHP weighting variables (Model 4)
Model 3 Model 4
DF
Odds Ratio
Estimate
Type III Analysis of Effects p
Odds Ratio
Estimate
Type III Analysis of Effects p
Belgium 1 1,28 17,019 *** 1,13 33,076 ns Denmark 1 1,5 43,954 *** 1,22 91,307 ** France 1 1,36 63,505 *** 1,21 201,009 *** Germany 1 1,42 46,499 *** 1,27 188,851 *** Greece 1 0,78 40,328 *** 0,96 0,7344 ns Ireland 1 0,83 16,547 *** 0,83 131,709 *** Italy 1 0,74 66,124 *** 0,93 3,143 ns Netherlands 1 1,44 39,264 *** 1,41 29,396 *** Portugal 1 1,02 0,3 ns Spain 1 0,93 4,907 ns United Kingdom 1 1,61 70,309 *** *p<0.05, **p<0.01, ***p<0.001, ns = not significant Source: ECHP UDB-Version of June 2003.
In table 5 the results of two discrete-time logistic hazard models are summarized.
In these models, poverty is measured in the wave before dropout. However, the year in
which poverty is measured does not correspond to the year in which the poverty is
experienced, because in the ECHP-interview, the income is questioned for the year
before. As a consequence, the poverty status experienced two years before the dropout is
used in the hazard models. Model 3 displays the univariate regression outcome for the
effect of poverty on the hazard of dropping out. In Belgium, Denmark, France, Germany,
the Netherlands and the United Kingdom, the hazard of dropping out is significantly
higher for poor people. For Greece, Ireland and Italy, the effect is reversed. For Portugal
and Spain, no effect of poverty is found. So, for these two countries, dropout occurs
completely at random (MCAR) with respect to the poverty variable. No weighting or
imputation is necessary.6
6 At least in order to correct for non-random dropout of poor people. Weighting is still necessary to correct for unequal sample probabilities.

20
Model 4 provides an estimate of the same effect under control of the covariates
used for weighting: age, sex, region, main source of income, tenure status, household
size, increase/decrease of household size since last wave, number of economically active
persons in the household, type of household and whether split-off household.7 Under
model 4, we can examine if the effect of poverty on the dropout hazard remains
significant after controlling for other variables. Again, the poverty estimate is measured
in the wave before dropout, but actually refers to the poverty status two waves before
dropout. Since we want to control for covariates measured at the same moment, we opted
to use covariates measured two waves before dropout. For Belgium, Greece and Italy, the
effect of poverty disappears under control of the covariates. The attrition pattern is at
random (MAR), as within the categories of the variables used for weighting, dropout is
found to be at random. As a consequence, weighting with the ECHP longitudinal weight
is effective in these countries. In Denmark, France, Germany, Ireland and the
Netherlands, the dropout pattern turns out to be non ignorable with respect to the variable
of interest, poverty, even when correcting for the variables used for weighting. As a
result, weighting with the ECHP-longitudinal weight is not a sufficient correction for the
bias that occurs in the poverty estimates.
It can be interesting to know which variables used in the ECHP-weighting
procedure have the strongest effect on the hazard of dropping out. Table 6 allows us to
investigate these parameter estimates in further detail for each country. Overall, the R² of
the different models is very low. Generally, the share of explained variance by the
covariates used for weighting does not reach 1%. Tenure status is by far the most
important predictor of dropout hazard. In all countries, people not owning a dwelling are
more likely to drop out of the panel. Furthermore, females are less likely to drop out.
Finally, in all countries except for Belgium and Germany, larger households tend to have
lower dropout hazards.
7 Again, ‘equivalised income’ was dropped because it is a perfect predictor of poverty. In Denmark and the Netherlands, the effect of region is not estimated. For the United Kingdom, no second model is estimated.

21
Table 6. Parameter estimates for the hazard of dropout by country
Main source of income
in prior year
Number of
economically
active people Household size
Poo
r
self-
em
ploy
men
t or
farm
ing
pens
ions
unem
plo
ymen
t -
redu
ndan
cy b
ene
fit
oth
er b
enef
its o
r gr
ants
priv
ate
inco
me
wag
es a
nd s
alar
ies
(ref
)
0 1
more
than
1 (ref) 2 3 4 >4 1 (ref)
no o
wn
er o
f dw
ellin
g
Fem
ale
hous
ehol
d ex
iste
d in
last
wav
e
Age
reg
ion
R²
Belgium ++ + ++ ++ ++ - - - 0,004
Denmark ++ +++ +++ - +++ / 0,009
France +++ + +++ + - - - - - - +++ - 0,005
Germany +++ +++ +++ - - 0,006
Greece - - + - - - - - - - - - - - - +++ - - - 0,024
Ireland - - - ++ + - - - - ++ - - - - 0,004
Italy +++ - + - + 0,011
Netherlands +++ ++ +++ - - - - - - - - - ++ - - - / - - - / 0,005
Portugal - +++ - - - - +++ - - - - - - 0,013
Spain - - +++ ++ ++ - - - - - - - - - - - - - - +++ - - - 0,006
- negative effect with p<0.05, --negative effect with p<0.01, --- negative effect with p<0.001 + positive effect with p<0.05, ++positive effect with p<0.01, +++positive effect with p<0.001 /: effect could not be estimated, empty: effect not significant Source: ECHP UDB-Version of June 2003.

22
6. Conclusion
The aim of this paper was to study the relationship between poverty and dropout
in eleven countries of the European Community Household Panel. Poverty was
operationalized at household level as having an income below 60% of the median
equivalised household income in a country, and was subsequently attributed to each
individual within the household. In addition, dropout was defined as a specific type of
unit-nonresponse, namely the nonresponse of observation units that have participated at
least once in the study, but do not continue participation until the end of the panel study.
However, dropout is not the only important type of unit-nonresponse in the
ECHP. This has appeared from the descriptive statistics in this paper. First, initial
nonresponse was examined. This turned out to be rather high in Belgium, the Netherlands
and Ireland, but quite low in Italy and Greece.
Subsequently, six different participation patterns were derived from the data: for
wave-one participants as well as new entry-persons, there is the possibility to be always
participating, monotone attriting or participating variably. In most countries, the group of
always participating wave one-persons turned out to be the most important one, followed
by the wave one-persons with monotone attrition. Ireland was an exception because
monotone attrition appeared to be extremely high there among persons participating in
the first wave. New entry-persons were omitted from all further analyses.
Since dropout can cause bias in research results whenever it is not random, this
paper has examined to what extent and in which countries poverty and dropout are related
in a problematic way. A preliminary exploration of the relationship between dropout and
poverty confirmed findings from previous research: in northern countries poor people
tend to drop out more often, while in the southern countries the reverse is true. The
significance of this effect was subsequently tested in regression analyses.
In performing these regressions, advantage could be taken from the panel
structure of the ECHP. In particular, the effect of poverty on dropout could be estimated
because poverty measurements are available from previous waves for each attrited
individual. Two models were estimated, a logistic regression model with a static poverty
variable (poverty in the first wave of the panel) and a discrete-time logistic hazard model
23
with a dynamic poverty variable (poverty two waves before dropout from the panel). The
results from both models were very similar. The effect of poverty on dropout turned out
to be insignificant for Portugal and Spain. In northern countries (Belgium, Denmark,
France, Germany, Netherlands and United Kingdom) poor people had a significantly
higher chance of dropping out than non-poor people. This effect was reversed in Italy and
Greece. Ireland was the only country with different results for the ordinary logistic and
the discrete-time logistic hazard model. Whereas the effect of poverty appeared
insignificant when modelling poverty in the first wave, it turned out to be highly
significant when measuring poverty in the wave before dropout. In view of the extremely
high attrition rates in Ireland, we assume this last model will be a better and safer
approximation of reality.
In the second place, we have examined whether the effect of poverty on dropout
remains under the control of the variables used in the ECHP-weighting procedure. If units
drop out randomly within the categories of these variables, weighting can correct for non-
random dropout of poor people. Again, this effect was estimated twice, once by using
poverty in the first wave as an independent variable in an ordinary logistic regression and
consequently by using poverty two waves before dropout as an independent variable in a
discrete-time hazard model. Both models gave very similar results. In Belgium, Greece
and Italy, there was no longer an effect of poverty on dropout when controlling for the
variables used in the ECHP-weighting procedure. Hence, in these countries dropout is
MAR, which implies that results will no longer be biased with respect to poverty when
using weighting variables. In contrast, in Denmark, France, Germany and the
Netherlands, poor people are still dropping out more frequently after controlling for the
variables used for weighting in the ECHP. From the time-discrete logistic model it
appeared that the reverse applies to Ireland, meaning that nonpoor people tend to drop out
more than poor people. From these results, it can be concluded that in these five countries
researchers will face non-ignorable dropout with respect to poverty, even after weighting
with weights provided in the ECHP-UDB.
24
BIBLIOGRAPHY
Behr, A., Bellgardt, E. & Rendtel, U. Extent and determinants of panel attrition in the
European Community Household Panel. CHINTEX Working Paper #7, 10 November
2002
Behr, A., Bellgardt, E. & Rendtel, U. The estimation of male earnings under panel
attrition. A cross country comparison based on the European Community Household
Panel. CHINTEX Working Paper #11, 2003a
Behr, A., Bellgardt, E. & Rendtel, U. Comparing poverty, income inequality and mobility
under panel attrition. A cross country comparison based on the European Community
Household Panel. CHINTEX Working Paper #12, 28 June 2003b
Buck, N. (2003). BHPS User Documentation [WWW]. Institute for Social and Economic
Research: http://iserwww.essex.ac.uk/ulsc/bhps/doc/index.html [26.02.2003].
De Keulenaer, F. (2003) Poverty and panel attrition in the panel study of Belgian
households: preparatory analyses and first results. Paper presented at 14th International
Workshop Household Survey Nonresponse. Leuven, 22-24 September 2003.
ECHP Working Group (1997). Response rates for the first three waves of the ECHP. Doc
PAN 92/97. Eurostat: Luxembourg.
Engel, U., & Reinecke, J. (1996). Introduction. In U. Engel, & J. Reinecke (Reds.),
Analysis of change. Advanced techniques in panel data analysis. New York: Walter de
Gruyter.
Eurostat (2003a). ECHP UDB Manual. European Community Household Panel
Longitudinal Users’ Database. Waves 1 to 8, Survey years 1994 to 2001. Doc PAN
168/2003-06. Eurostat: Luxembourg.

25
Eurostat (2003b). Construction of weights in the ECHP. Doc PAN 165/2003-06. Eurostat:
Luxembourg.
Fitzgerald, J., Gottschalk, P. & Moffit, R. (1998). An analysis of sample attrition in panel
data. The Michigan panel study of income dynamics. The Journal of Human Resources,
33(2), pp. 251-299.
Jacobs, T., & Marynissen, R. (1993). PSBH Methodebericht golf 1 (1992) [WWW]. Panel
Studie van Belgische Huishoudens: http://www.uia.ac.be/psbh/pubdocs/golf1/w1mb.pdf
[15.02.2003].
Lepkowski, J.M., & Couper, M.P. (2002) Nonresponse in the second wave of
longitudinal household surveys. In R.M. Groves, D.A. Dillman, J.L. Eltinge, R.J.A. Little
(Eds.), Survey Nonresponse (pp. 259-272). New York: John Wiley & Sons.
Lillard, L.A., Panis, C. W. A. (1998). Panel attriton from the panel study of income
dynamics. Household income, marital status, and mortality. The Journal of Human
Resources, 33(2), pp. 437-457.
Little, J.A. (1995). Modeling the drop-out mechanism in repeated-measures studies.
Journal of the American Statistical Association, 90(431).
Little, J.A., & Rubin, D.B. (1987). Statistical analysis with missing data. New York: John
Wiley & Sons.
Nicoletti, C. & Peracchi, F. A cross-country comparison of survey participation in the
ECHP. ISER Working Papers, 2002-32
Peracchi, F. (2000). The European Community Household Panel: A review. Empirical
Economics, 27(1), pp. 63-90.

26
Rendtel, U., Behr, A., & Sisto, J. (2003). Attrition effects in the European Community
Household panel. CHINTEX
Rose, D. (2000). Household panel studies: an overview. In D. Rose (Red.), Researching
social and economic change. The uses of household panel studies (pp. 3-35). London:
Routledge.
Rubin, D.B. (1976) Inference and missing data. Biometrika, 63(3), pp. 581-592.
Watson, D. (2003). Sample attrition between waves 1 and 5 in the European Community
Household Panel. European Sociological Review, 19(4), pp. 361-378.
Zabel, J.E. (1998). An analysis of attrition in the panel study of income dynamics and the
survey of income and program participation with an application to a model of labor
market behavior. The Journal of Human Resources, 33(2), pp. 479-506.