Working together for a safer world
MARIKO GmbH
Future Fuels – Options for Ship Owners & Operators
Final version – 26th September 2014


i
Contents
LNG-Initiative Nordwest i
Innovation Network for the support of gas-powered Shipping i
1. Introduction / Executive Summary 1
2. Marine bunker fuels & Legislative regime 2
2.1 Marine bunker fuels 2
2.2 Stricter sulphur content limits in marine bunker fuels 2
2.3 Compliance with stricter limits on fuel oil sulphur content 4
2.4 Tier III & NOx Control 6
2.5 Volatile organic compounds Management 8
2.6 International Code of Safety for Ships using Gases or Other Low Flashpoint Fuels 8
2.7 Inventory of Hazardous Materials (formerly known as Green Passport) 9
2.8 Garbage Management 9
2.9 Ballast Water Management Convention 10
2.10 Bio Fouling Management 10
2.10.1 Current Biofouling Management Legislation 10
2.10.2 National Regulations 11
2.11 The USCG Rules on Environmentally Acceptable Lubricants 11
3. Ship owner’s demand for alternative fuels 12
3.1 Survey findings: intentions for mitigation of SOx emissions 12
3.2 LNG bunker and newbuilding forecast (base case scenario) 13
3.2.1 LNG-fuelled newbuilding forecast 13
3.2.2 Global LNG bunker demand forecast 14
3.2.3 LNG bunker price forecasts 16
4. Alternative fuels 17
4.1 Fuel and Technology Compatibility 20
4.2 Fuel price scenarios 20
4.3 Environmental Impact 22
4.4 Fuel mix & marine fuel demand 24
5. Fleet statistics for Lower Saxony 27
5.1 General Findings 27
5.1.1 Vessel Types 27
5.1.2 Vessel Age (Pattern) 28
5.1.3 Vessel Operating Areas / Port Calls 29
5.1.4 Vessel Deadweight tonnage 32
5.1.5 Vessel Main Engine Power 33
5.2 Average Vessel Types 35

ii
6. Availability of LNG vs. Scrubber Technology 36
6.1 Summary 36
6.2 Summary of a Lloyd’s Register LNG Infrastructure study in 2014 36
6.2.1 Ports’ Readiness to make LNG Bunkering happen 37
6.2.2 LNG Bunkering Supply 40
6.2.3 Volume of LNG Supply 41
6.2.4 LNG Bunkering Methods 42
6.2.5 Drivers for worldwide adoption of LNG bunkering at ports 44
6.3 Exhaust Gas Treatment Systems 46
6.3.1 Flexibility 46
6.3.2 The risk of non-compliance 47
6.3.3 Backpressure 47
6.3.4 EGTS bypass 47
6.3.5 Exhaust gas velocity 48
6.3.6 Integration of multiple combustion devices 48
6.3.7 Maintenance, crew training and workload 48
6.4 SOx scrubbers 49
6.4.1 SOx scrubber technologies 49
6.4.2 Wet SOx scrubbers 49
6.4.3 Wet SOx scrubbers – open loop 50
6.4.4 Wet SOx scrubbers – closed loop 50
6.4.5 Wet SOx scrubbers – hybrid 52
6.4.6 Dry SOx scrubbers 53
6.4.7 Comparing SOx scrubber technologies 55
7. Which way to go? 58
7.1 Costs and benefits of LNG as fuel for Container vessels 58
7.2 Costs and benefits for using hybrid scrubber technologies for a North Sea Ferry with 100 %
ECA share 61
7.3 Two examples for costs and benefits for Lower Saxony fleet vessels using scrubber
technologies 64
8. The comparison tool – ECA Calculator 68
8.1 Purpose of the tool 68
8.2 Main outputs 68
8.3 Methodology 69
8.4 Case comparison 70
8.4.1 Operational profile 70
8.4.2 Machinery particulars and annual fuel consumptions 70
8.4.3 Fuel types 70

iii
8.4.4 Machinery particulars 71
8.4.5 Fuels, costs and scenarios 71
8.4.6 Fuels used for compliance 71
8.4.7 Today’s fuel price and price differentials 72
8.4.8 Fuel calorific value corrections 72
8.4.9 Fuel price scenarios 72
8.5 EGCS data 72
8.5.1 Machinery connected to EGCS 72
8.5.2 EGCS installation cost 73
8.5.3 EGCS operational costs and loss of revenue 73
8.5.4 EGCS additional fuel consumption 73
8.5.5 EGCS investment discount rate 74
8.6 Results to display 74
Investment evaluation 74
Appendix 1 – Fleet statistics 76
Appendix 2 – NOx Control FAQ 80
Glossary 82
Literature 84
iv
List of figures
Figure 1: MARPOL Annex VI regulations and enforcement of fuel oil sulphur limits respective timelines .. 3 Figure 2: ECA Map ................................................................................................................................................. 4 Figure 3: NO
x control limits ................................................................................................................................... 7
Figure 4: Ship owner’s intentions for mitigation of SOx emissions ................................................................ 13
Figure 5: Global LNG production versus LNG bunker demand 2012-2025 ..................................................... 15 Figure 6: Global bunker consumption all deep-sea ship types - LNG versus HFO ......................................... 16 Figure 7: Fuels price forecast (Status quo) ........................................................................................................ 21 Figure 8: Life cycle steps ..................................................................................................................................... 22 Figure 9: Life cycle emission comparison .......................................................................................................... 23 Figure 10: Life cycle assessment of marine fuels with regard to different categories ................................. 24 Figure 11: Fuel mix for containership, bulk carrier / general cargo, tanker (crude) and tanker fleet ......... 25 Figure 12: Prediction of fuel demand until 2030 (status quo) ......................................................................... 26 Figure 13: Vessel Types, relatable to companies resident in Lower Saxony .................................................. 28 Figure 14: Vessel Age (Pattern), relatable to companies resident in Lower Saxony (as of May 2014) ........ 29 Figure 15: Vessel Operating Areas, relatable to companies resident in Lower Saxony (in the twelve months, as of May) ............................................................................................................................................. 30 Figure 16: Vessel Operating Areas ..................................................................................................................... 31 Figure 17: Vessel Port Calls in ports of Lower Saxony, relatable to companies resident in Lower Saxony (in the last twelve months, as of May 2014) .................................................................................................... 32 Figure 18: Cumulative frequencies of Vessel dwt, relatable to companies resident in Lower Saxony (as of May 2014) ............................................................................................................................................................ 33 Figure 19: Cumulative frequencies of Vessel Main Engine Power, relatable to companies resident in Lower Saxony (as of May 2014) ......................................................................................................................... 34 Figure 20: Distribution of ports under survey .................................................................................................. 37 Figure 21: At present, does your port already provide or have plans to provide LNG bunkering infrastructure for the purpose of short-sea / local shipping? ......................................................................... 38 Figure 22: What type of bunkering facilities are currently provided / do you plan to provide in your port for gas fuelled shipping (not just deep sea)? ................................................................................................... 39 Figure 23: What is the expected timeframe for LNG bunkering operations to commence at your port? ... 40 Figure 24: What kind of infrastructure are you planning to develop for LNG fuel supply to the port? ..... 41 Figure 25: What proportion of the total bunkering volume at your port do you expect to be LNG within the following periods? ....................................................................................................................................... 42 Figure 26: Which kind of ships is best suited for receiving LNG as bunker at port? ..................................... 43 Figure 27 : Which ship types do you consider best suited for LNG bunkering at your port and why? ....... 44 Figure 28: What are the main factors that will help to attract the gas fuelled fleet into your port? ......... 45 Figure 29: Comparison of answers concerning the most important drivers to provide LNG bunkering infrastructure 2011 vs 2014 ................................................................................................................................ 46 Figure 30: An open loop wet SO
x scrubbing system ........................................................................................ 50
Figure 31: A closed loop wet SOx scrubbing system ........................................................................................ 51
Figure 32: A hybrid wet SOx scrubbing system (operating in loop mode) ..................................................... 52
Figure 33: A hybrid wet SOx scrubbing system (operating in closed loop mode) ......................................... 53
Figure 34: A dry SOx scrubbing system (image courtesy of Couple Systems) ................................................ 55
Figure 35: Scrubber Operating Costs ................................................................................................................. 59 Figure 36: Payback time for a 2,500 TEU vessel ................................................................................................ 60 Figure 37: Payback time North Sea Ferry .......................................................................................................... 63 Figure 38: Annual compliance costs Bulk Carrier .............................................................................................. 67 Figure 39: Annual Compliance costs General Cargo Ship ................................................................................ 67 Figure 40: ECA Calculator methodology ........................................................................................................... 69 Figure 41: Cumulative frequencies of Vessel Fuel Type, relatable to companies resident in Lower Saxony (as of May) ........................................................................................................................................................... 76

v
List of tables
Table 1: Current and confirmed ECAs ................................................................................................................... 3 Table 2: Three main options for compliance and corresponding emission reductions compared to HFO ..... 5 Table 3: NO
x control limits ..................................................................................................................................... 6
Table 4: Global newbuilding forecasts versus LNG-fuelled newbuildings ...................................................... 14 Table 5: Marine fuel bunker demand forecasts - LNG versus HFO (2012-2025) ............................................. 15 Table 6: Comparison of fuels .............................................................................................................................. 19 Table 7: Fuel & Technology Compatibility ......................................................................................................... 20 Table 8: Average Vessel Types, relatable to companies resident in Lower Saxony (as of May 2014) ......... 35 Table 9: Rough overview of pros and cons on alternative technologies ........................................................ 36 Table 10: Comparison of SO
x scrubber technologies ........................................................................................ 57
Table 11: Operational profile of a North Sea Ferry (100 % ECA share) ........................................................... 61 Table 12: OPEX & CAPEX of a scrubbing system on a North Sea Ferry (100 % ECA share) ........................... 62 Table 13: OPEX & CAPEX of a LNG system on a North Sea Ferry (100 % ECA share) ..................................... 62 Table 14: Fuel types used in the comparison ..................................................................................................... 64 Table 15: Reference vessel “General Cargo Ship” ............................................................................................. 65 Table 16: Reference vessel “Bulk Carrier” .......................................................................................................... 66 Table 17: Vessel Age (Pattern, relatable to companies resident in Lower Saxony (as of May 2014 ............ 76 Table 18: Fact Sheet of Average Vessel 'General Cargo Vessel 0.0 - 4.9 ths dwt', relatable to companies resident in Lower Saxony (as of May 2014)....................................................................................................... 77 Table 19: Fact Sheet of Average Vessel 'General Cargo Vessel 5.0 - 9.9 ths dwt', relatable to companies resident in Lower Saxony (as of May 2014)....................................................................................................... 77 Table 20: Fact Sheet of Average Vessel 'Container Vessel 5.0 - 9.9 ths dwt', relatable to companies resident in Lower Saxony (as of May 2014)....................................................................................................... 78 Table 21: Fact Sheet of Average Vessel 'Container Vessel 10.0 - 14.9 ths dwt' relatable to companies resident in Lower Saxony (as of May 2014)....................................................................................................... 78 Table 22: Fact Sheet of Average Vessel 'Tanker', relatable to companies resident in Lower Saxony (as of May 2014) ............................................................................................................................................................. 79 Table 23: Fact Sheet of Average Vessel 'Bulk Carrier', relatable to companies resident in Lower Saxony (as of May 2014) ......................................................................................................................................................... 79

vi

i
LNG-Initiative Nordwest
Innovation Network for the support of gas-powered
Shipping
The „LNG-Initiative Nordwest“ pursues the goal to assist maritime enterprises in the steps towards gas-
powered shipping. The global shipping industry is currently facing a technology leap away from marine
diesel oil towards gas-powered technologies, especially towards LNG (Liquefied Natural Gas).
Within the “LNG-Initiative Nordwest” shipping companies, shipyards, ports, research institutes, technology
developers, engine manufacturer, classification societies, gas suppliers and communes are brought
together, to increase the innovation capability in gas-powered shipping. This happens by knowledge
networking, transfer of technologies and by research. The focus is particularly on the small and medium-
sized enterprises in the northwest of Germany.
With a total of 60 network partners, the “LNG-Initiative Nordwest” provides and develops a wide ranging
knowledge considering this topic. Coordinator of the innovation network is the MARIKO GmbH in Leer.
In five fields with a total of 18 measures, companies and research institutes of the network will prepare
together for the predicted gas-powered shipping of the future.


MARIKO GmbH
Future Fuels – Options for Ship Owners & Operators study September 2014
1
1. Introduction / Executive Summary
Plenty evidences have shown that marine vessels are a significant source of air pollution around the world.
In comparison with onshore and aerial vehicles, marine transportation is still the most efficient solution. At
this moment, marine transportation keeps growing and expending in many regions. However, Heavy Fuel
Oil (HFO) is currently the only significant energy source even though it produces a large amount of air
pollutant emission such as Sulphur Oxides (SOx), Particulate Matters (PM) and Greenhouse Gases (GHGs).
The International Maritime Organization (IMO) has a special responsibility for the regulation of international
shipping, safety at sea, and the prevention of marine pollution. Because of increasing limitation and
restriction through international conventions developed by the IMO, ship owners have to face a strict
challenge to comply with the environmental regulations. In order to reach limits for Nitrogen Oxides (NOx)
and SOx and other GHG emissions regulated in International Convention of The Prevention of Pollution
From Ships (MARPOL) Annex VI, there are many solutions and methods mentioned in different researches.
Ship owners face numbers of decisions in terms of investment and trading if they want to do business
within the future Emission Control Areas (ECAs). Alternative fuel is considered as a very important method
to solve this problem.
Many different types of alternative fuels have been discussed, e.g. Marine Gas Oil (MGO) and Marine Diesel
Oil (MDO), an option for diesel powered vessels to replace the HFO, with sulphur content in compliance
with the Sulphur Emission Control Areas (SECAs) requirement. The price of MGO is currently much higher
than HFO and it can be assumed that a rising fuel price will increase the owner’s operation cost. Due to a
particularly low sulphur content, additionally Liquefied Natural Gas (LNG) has been suggested to be used as
a marine fuel. However, engine modification and fuel tank costs are extensive; the infrastructures and
bunkering of LNG are still a question mark. There are few studies mentioning methanol (CH4O), another
green energy for the future, a multi-source and multi-purpose fuel. Methanol and Di-Methyl Ether (DME), a
product converted from methanol, both can be burned in diesel engine with minor modification.
The shipping industry today is facing some serious challenges with the upcoming exhaust gas emission
regulations. The contribution of SOx and NO
x from shipping is considerable, thus the reduction has to be
made. Today there are three main solutions for the reduction of emissions which are switching to low
sulphur fuel, installing scrubbers or using LNG. While these three compliance strategies have been
investigated for years, very little information is available on methanol as a marine fuel. The aim of this study
is to compare different types of methods to comply with future laws and regulations. However, LNG,
methanol, and scrubbers all come along with a space problem on-board of the ship. Detailed constraints
will be mentioned in following chapters.
Furthermore this study will give an overview of vessels (including their main characteristics), managed and
operated by companies resident in Lower Saxony in order to gain first implications on the extent to which
they are affected by exhaust gas emission regulations of the IMO.

2
2. Marine bunker fuels & Legislative regime
HFO is the most widely used marine bunker fuel, which has a high sulphur content. However regulations
are implementing strict limits for sulphur content in marine bunker fuel oils to limit the emissions of SOx by
ships.
2.1 Marine bunker fuels
There are currently three basic types of marine bunker fuels on the market:
Residual Fuel Oil (RFO) –the traditional marine bunker fuel with high content of sulphur it is often
called HFO and the heaviest oil fraction from the oil refining processes,
Distillate Fuel Oil –lighter oil fractions from the oil refining process which only contain little sulphur,
Intermediate Fuel Oils (IFO) – a mixture of the above two fuel oils and
Alternative Low Sulphur Marine Fuel.
Within this report, MGO is referred to as covering LSFO as the price difference between the different types
of LSFOs (MDO, MGO etc.) are negligible compared to the price differences to the other fuels considered
like HFO and LNG. [LR 12d]
Fuel suppliers like ExxonMobil have meanwhile developed a new grade of marine fuel that should assist
vessel operators to comply with the upcoming 0.10 % sulphur limits, as a reaction to the current fuel
related discussions amongst marine stakeholders. This newly developed fuel is said to be a hybrid that
combines desirable qualities of both existing distillate and RFO. It is still required to be stored in heated
tanks and treated in heated fuel systems but announced to have less negative impacts normally associated
with RFO. For example, the new fuel typically is said to have less Cat Fines (Catalyst fines, fine-grained
catalysts), metal contaminates or sediment residues. [Ex 14]
2.2 Stricter sulphur content limits in marine bunker fuels
In MARPOL Annex VI (see the timeline of Annex VI regulations in Figure 1) the IMO has adopted measures
for the prevention of air pollution from ships.
From 2012 MARPOL Annex VI includes a global cap of 3.5 % on sulphur content of marine bunker fuel to
limit emissions of sulphur dioxide, a harmful substance.
It is expected a global limit of 0.5 % sulphur in marine bunker fuel oils outside ECAs from 1st January 2020
. However, this date could be deferred to 1st January 2025 depending on the outcome of further
investigation by the IMO into the global availability of LSFO for marine use by 2018. [LR 12d]

MARIKO GmbH
Future Fuels – Options for Ship Owners & Operators study September 2014
3
Figure 1: MARPOL Annex VI regulations and enforcement of fuel oil sulphur limits respective timelines
[LR 12c]
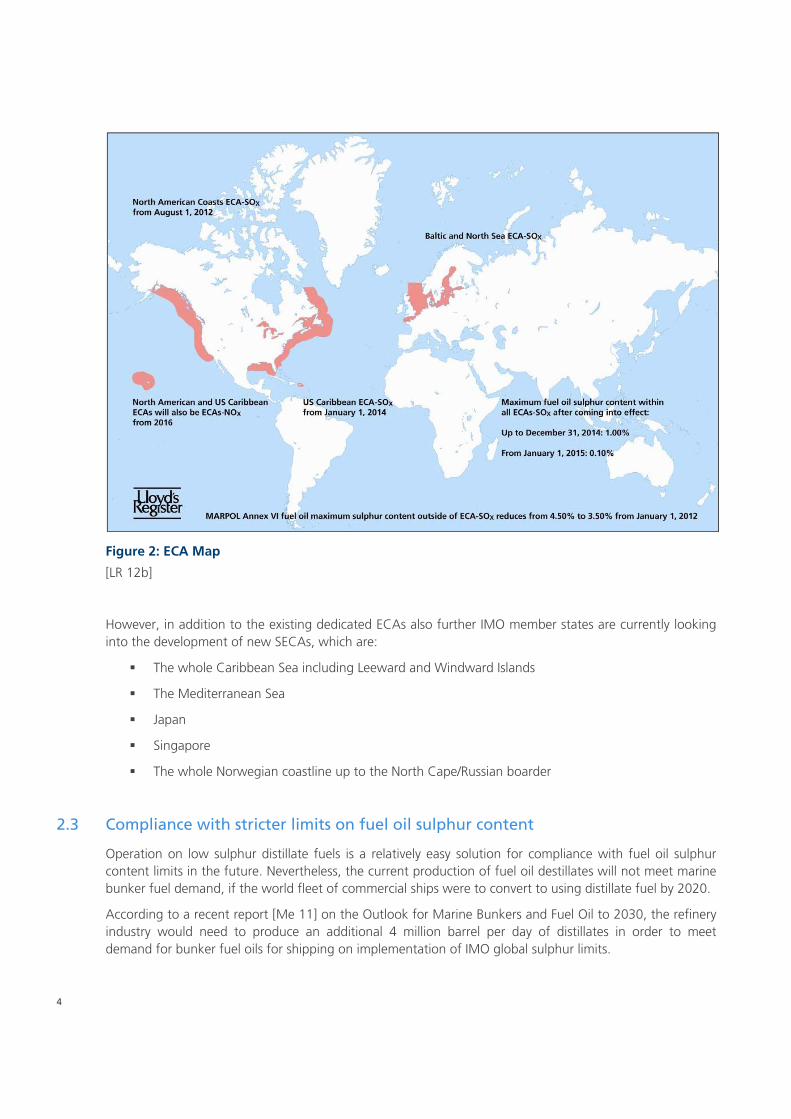
Since the beginning in 2005 a number of ECAs have been implemented, see Table 1 and the map in Figure
2. The sulphur content limit of marine bunker fuel in ECAs is far more stringent with current limits at 1 %
reducing to 0.1 % by 2015. [LR 12d]
Table 1: Current and confirmed ECAs
Current and confirmed ECAs Entry into force*
Baltic Sea (SOx) 19th May 2005
North Sea (SOx) 22nd November 2006
North America, US including Canadian coast up to 200 nm (SOx, NOx and PM) 1st August 2011
US Caribbean Sea covering Puerto Rica and US Virgin Islands ECA (SOx, NOx and PM) 1st January 2013
*Stricter limits for fuel oil sulphur content are applied one year after the date of entry into force.
[LR 12 d]
4
Figure 2: ECA Map
[LR 12b]
However, in addition to the existing dedicated ECAs also further IMO member states are currently looking
into the development of new SECAs, which are:
The whole Caribbean Sea including Leeward and Windward Islands
The Mediterranean Sea
Japan
Singapore
The whole Norwegian coastline up to the North Cape/Russian boarder
2.3 Compliance with stricter limits on fuel oil sulphur content
Operation on low sulphur distillate fuels is a relatively easy solution for compliance with fuel oil sulphur
content limits in the future. Nevertheless, the current production of fuel oil destillates will not meet marine
bunker fuel demand, if the world fleet of commercial ships were to convert to using distillate fuel by 2020.
According to a recent report [Me 11] on the Outlook for Marine Bunkers and Fuel Oil to 2030, the refinery
industry would need to produce an additional 4 million barrel per day of distillates in order to meet
demand for bunker fuel oils for shipping on implementation of IMO global sulphur limits.
MARIKO GmbH
Future Fuels – Options for Ship Owners & Operators study September 2014
5
Other options for compliance have been taken into consideration, because of the doubts about availability,
and pricing, of distillate fuels. The three main options currently being considered for future compliance
with stricter limits on fuel oil sulphur content are:
1. Operation on LSFO which depending on sulphur content limitation may require operations on MDO or MGO (i.e. distillates).
2. Operation on HFO with application of an Exhaust Gas Cleaning (or Scrubbing) System (EGCS).
3. Operation on LNG.
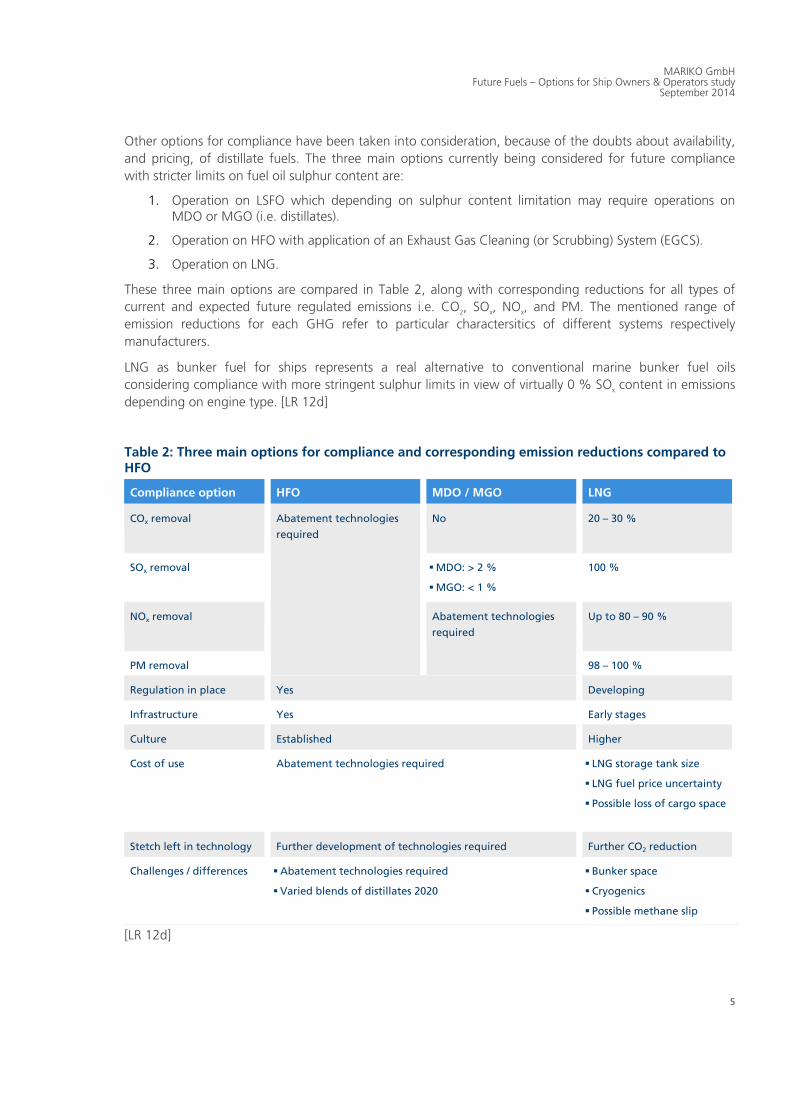
These three main options are compared in Table 2, along with corresponding reductions for all types of
current and expected future regulated emissions i.e. CO2, SO
x, NO
x, and PM. The mentioned range of
emission reductions for each GHG refer to particular charactersitics of different systems respectively
manufacturers.
LNG as bunker fuel for ships represents a real alternative to conventional marine bunker fuel oils
considering compliance with more stringent sulphur limits in view of virtually 0 % SOx content in emissions
depending on engine type. [LR 12d]
Table 2: Three main options for compliance and corresponding emission reductions compared to HFO
Compliance option HFO MDO / MGO LNG
COx removal Abatement technologies
required
No 20 – 30 %
SOx removal MDO: > 2 %
MGO: < 1 %
100 %
NOx removal Abatement technologies
required
Up to 80 – 90 %
PM removal 98 – 100 %
Regulation in place Yes Developing
Infrastructure Yes Early stages
Culture Established Higher
Cost of use Abatement technologies required LNG storage tank size
LNG fuel price uncertainty
Possible loss of cargo space
Stetch left in technology Further development of technologies required Further CO2 reduction
Challenges / differences Abatement technologies required
Varied blends of distillates 2020
Bunker space
Cryogenics
Possible methane slip
[LR 12d]
6
2.4 Tier III & NOx Control
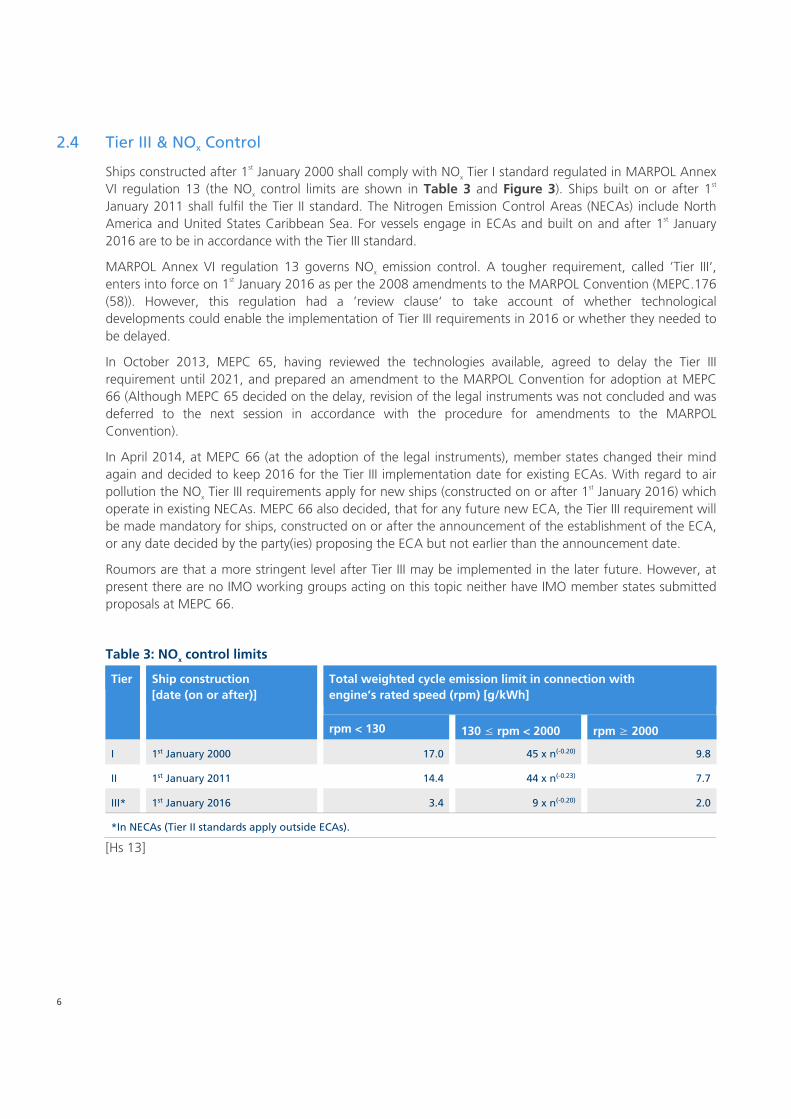
Ships constructed after 1st January 2000 shall comply with NO
x Tier I standard regulated in MARPOL Annex
VI regulation 13 (the NOx control limits are shown in Table 3 and Figure 3). Ships built on or after 1
st
January 2011 shall fulfil the Tier II standard. The Nitrogen Emission Control Areas (NECAs) include North
America and United States Caribbean Sea. For vessels engage in ECAs and built on and after 1st January
2016 are to be in accordance with the Tier III standard.
MARPOL Annex VI regulation 13 governs NOx emission control. A tougher requirement, called ’Tier III‘,
enters into force on 1st January 2016 as per the 2008 amendments to the MARPOL Convention (MEPC.176
(58)). However, this regulation had a ’review clause‘ to take account of whether technological
developments could enable the implementation of Tier III requirements in 2016 or whether they needed to
be delayed.
In October 2013, MEPC 65, having reviewed the technologies available, agreed to delay the Tier III
requirement until 2021, and prepared an amendment to the MARPOL Convention for adoption at MEPC
66 (Although MEPC 65 decided on the delay, revision of the legal instruments was not concluded and was
deferred to the next session in accordance with the procedure for amendments to the MARPOL
Convention).
In April 2014, at MEPC 66 (at the adoption of the legal instruments), member states changed their mind
again and decided to keep 2016 for the Tier III implementation date for existing ECAs. With regard to air
pollution the NOx Tier III requirements apply for new ships (constructed on or after 1
st January 2016) which
operate in existing NECAs. MEPC 66 also decided, that for any future new ECA, the Tier III requirement will
be made mandatory for ships, constructed on or after the announcement of the establishment of the ECA,
or any date decided by the party(ies) proposing the ECA but not earlier than the announcement date.
Roumors are that a more stringent level after Tier III may be implemented in the later future. However, at
present there are no IMO working groups acting on this topic neither have IMO member states submitted
proposals at MEPC 66.
Table 3: NOx control limits
Tier Ship construction
[date (on or after)]
Total weighted cycle emission limit in connection with
engine’s rated speed (rpm) [g/kWh]
rpm < 130 130 ≤ rpm < 2000 rpm ≥ 2000
I 1st January 2000 17.0 45 x n(-0.20) 9.8
II 1st January 2011 14.4 44 x n(-0.23) 7.7
III* 1st January 2016 3.4 9 x n(-0.20) 2.0
*In NECAs (Tier II standards apply outside ECAs).
[Hs 13]

MARIKO GmbH
Future Fuels – Options for Ship Owners & Operators study September 2014
7
Figure 3: NOx control limits
[Be 11a]
Although international shipping is the most efficient mode of cargo transport, a global approach, to further
improve the energy efficiency and effective emission control, is needed. Therefore, IMO has been pursuing
the limitation and reduction of GHG emissions from international shipping. The new chapter of MARPOL
Annex VI entitled ’Regulations on energy efficiency for ships’ was adopted by IMO’s MEPC (Marine
Environment Protection Committee), including Energy Efficiency Design Index (EEDI) for new ships and the
Ship Energy Efficiency Management Plan for all ship.
In summary
Sulphur limits (Annex VI regulation 14) apply to all ships visiting the ECA from the date set, but
regulation 13 on NECAs apply to ships constructed on or after the particular date.
Ships that will be operating in ECAs in America (North American and US Caribbean Sea) – Tier III
will apply to ships constructed on or after 1st January 2016. As of today, there are no other ECAs,
other than those in America, for NOx control purposes.
Ships that will be operating in future ECAs (that might be established) – Tier III will apply to ships
constructed on or after the date that the ECA is adopted by MEPC, (or a date decided by the
parties concerned but not earlier than the date of adoption).
Notwithstanding the above, yachts (ships used solely for recreational purposes) of less than
500 Gross tonnage (gt) constructed before 1st January 2021 do not need to comply with Tier III
requirements, and recreational yachts of less than 24 m will not need to comply with Tier III even
after that date.
In general, MARPOL Annex VI regulation 13 – NOx control applies on a ’construction (keel laying)’
basis. Therefore, if the keel has been laid before 1st January 2016, the Tier III requirements are not
applicable to the ship.

8
’Ships constructed‘ means keel laying. There is no ’delivery‘ limitation.
2.5 Volatile organic compounds Management
With effect from 1st July 2010, every tanker carrying crude oil will be required to implement and retain on
board a ship-specific Volatile Organic Compounds (VOC) Management Plan.
The plan should be prepared taking into account guidelines contained in resolution MEPC.185 (59) and
MEPC.1/Circ.680. The purpose of the Plan is to ensure that VOC emissions resulting from tanker operations
to which regulation 15.6 applies are prevented or minimised as much as possible.
A ship-specific VOC Management Plan must at the least provide written procedures for minimising VOC
emissions during:
loading of cargo,
sea passage and
discharge of cargo.
Additionally, VOCs generated during crude oil washing need to be considered.
If tanker design modifications (such as increasing the pressure of the cargo tanks) are to be made to
minimise VOC emissions, strength aspects need to be considered and comprehensive calculations have to
be carried out to confirm the structural strength and other related issues. This information must be
provided within the VOC Management Plan.
SOx control is a matter of ship operation, thus up to the effort of the petroleum industry, while
ship will be required to be capable of using more than one fuel in order to operate in ECAs.
NOx control relates to the engines on-board. Shipbuilders and ship owners are invited to pay due
attention to the development, especially application to existing engines installed between 1990
and 2000.
2.6 International Code of Safety for Ships using Gases or Other Low Flashpoint Fuels
The IMO Sub-Committee on Bulk Liquids and Gases (BLG) developed the mandatory International Code for
the Safety of Gas Fuelled Ships, which was renamed to the International Code of Safety for Ships using
Gases or Other Low Flashpoint Fuels (IGF-Code). The estimated entry into force date is 1st January 2017.
BLG was tasked with producing interim guidelines for ships with natural gas fuelled engine installations,
which were produced in 2009 (resolution MSC.285 (86)). These guidelines are an interim measure until an
IGF-Code is produced, which is intended to be mandatory for ships other than those regulated under the
International Code for the Construction and Equipment of Ships Carrying Liquefied Gases in Bulk (IGC-
Code).
The working Group at BLG 16 agreed to concentrate its work on natural gas as fuel. Other low flash point
fuels would be specifically addressed by separate sections of the code. Relevant parts of the section for
natural gas fuel will be referenced in the other parts together with any additional specific requirements
applicable to the various fuels.
The burning of gas fuel in ships has been carried out on LNG vessels for many years and there are
recognised practices in place detailed in the IGC-Code to mitigate the risks. The interim guidelines
produced do not align with the IGC-Code and there are concerns in some quarters that the draft IGF-Code

MARIKO GmbH
Future Fuels – Options for Ship Owners & Operators study September 2014
9
being developed may also fail to align with the IGC-Code. Thid may lead to a double standard depending
on the type of vessel with one set of requirements for Gas ships and another set for all other vessels. It
could become even more complex if the IGF-Code is made applicable to all vessels including Gas ships and
there is some indication that this is a long term goal. As the draft code under development covers all low-
flashpoint fuels, the name of the draft code has been changed accordingly.
There is a number of safety related aspects that affect design and building of such ships including the
concept of emergency shot down arrangements and the location of low flash point fuel storage tanks.
2.7 Inventory of Hazardous Materials (formerly known as Green Passport)
The Hong Kong International Convention for the Safe and Environmentally Sound Recycling of Ships aims
to improve standards of safety and reduce environmental pollution resulting from the recycling of ships. It
was adopted in 2009 but has not yet entered into force.
However, the EU Ship Recycling Regulation was ratified and entered into force in December 2013. This
applies to ships flying an EU flag.
The Regulation will require ships over 500 gt to hold an Inventory of Hazardous Materials (IHM), previously
known as a ’Green Passport‘. The IHM is a document that contains an inventory of materials on-board a
ship which may be hazardous to human health or to the environment.
Non-EU ships, as well as EU ones, will be covered by the regulation insofar as they will have to carry an IHM
when calling at EU ports. Enforcement measures, including penalties, are to be set by member states.
Next steps: The regulation will apply to ships at the earliest 2 years and at the latest 5 years after its entry
into force, the eventual date depending upon when the recycling capacity of facilities on the EU list exceeds
a threshold of 2.5 million light displacement tonnes. However, certain provisions are linked to the
publication of the European list (inventory for existing ships), and will thus apply at the earliest after 1 year
and at the latest after 3 years.
2.8 Garbage Management
The IMO’s revised MARPOL Annex V entered into force on 1st January 2013 to regulate discharges of
garbage to sea from ships. This imposes a number of requirements on ship owners and operators, including
the need to plan their garbage management.
The revised MARPOL Annex V covers all kinds of food, domestic and operational wastes which are
generated during the normal operation of the vessel and liable to be disposed continuously or periodically.
It totally prohibits the disposal of plastics anywhere into the sea; and severely restricts discharges of other
garbage from ships into coastal waters and ’special areas‘. It also obliges governments to ensure the
provision of reception facilities at ports and terminals for receiving garbage.
Every ship of 100 gt and above, and every ship certified to carry 15 or more persons, and fixed and floating
platforms are required to carry and implement a garbage management plan which can be developed
through the guidelines given by Resolution MEPC. 219(63) – 2012 Guidelines For Implementation of
MARPOL Annex V and Resolution MEPC. 220(63) – 2012 Guidelines For the Development of Garbage
Management Plans.
Every ship of 400 gt and above, and every ship certified to carry 15 or more persons engaged in voyages to
ports or offshore terminals of another party and every fixed or floating platform are to have a new Garbage
Record Book in the format specified in revised MARPOL Annex V.
10
2.9 Ballast Water Management Convention
All ships will be required to manage their ballast water on every voyage by either exchanging or treating it
using an approved ballast water treatment system (BWTS). Ballast water treatment systems must have a
type approval certificate in compliance with the IMO Guidelines for the approval of ballast water
management systems (Resolution MEPC. 174(58)), which updated Resolution MEPC. 125(53).
The Convention has not yet entered into force and may not do so for several years. The application date for
new and existing vessels is dependent on the ship construction date and the ballast water capacity.
Once the BWM Convention has entered into force all ships of 400 gross tonnes and above will be required
to have on board an approved Ballast Water Management Plan and a Ballast Water Record Book, and to be
surveyed and issued with an International Ballast Water Management Certificate.
A more immediate driver may be the United States Coast Guard’s requirements which apply to ships that
discharge ballast water into US and Canadian waters (within 12 nm off their coastlines). The compliance
dates for the USCG requirements are fixed and ships will be required to meet the D-2 discharge standard at
some time between 1st January 2014 and 31
st December 2020 depending on the ship’s ballast water
capacity and its dry docking schedule.
2.10 Bio Fouling Management
By adopting the International Convention for the Control and management of Ships’ Ballast Water and
Sediments, 2004 (the BWM Convention), member states of the IMO made a clear commitment to
minimising the transfer of invasive aquatic species by shipping.
Studies have shown that biofouling can also be a significant vector for the transfer of invasive aquatic
species. Biofouling on ships entering the waters of states may result in the establishment of invasive aquatic
species which may pose threats to human, animal and plant life, economic and cultural activities and the
aquatic environment.
While the International Convention on the Control of Harmful Anti-Fouling Systems (AFS) on Ships, 2001
(AFS-Convention) addresses AFS on ships, its focus is on the prevention of adverse impacts from the use of
AFS and the biocides they may contain, rather than preventing the transfer of invasive aquatic species.
The potential for invasive aquatic species transferred through biofouling to cause harm has been
recognised by the IMO, the Convention on Biological Diversity, several UNEP Regional Seas Conventions
(e.g., the Barcelona Convention for the Protection of the Mediterranean Sea Against Pollution), the Asia
Pacific Economic Cooperation Forum, and the Secretariat of the Pacific Region Environmental Program.
2.10.1 Current Biofouling Management Legislation
IMO Resolution MEPC.207 (62) – ’Guidelines for the control and management of ships’ biofouling to
minimize the transfer of invasive aquatic species’, adopted on 15th July 2011.
MEPC.1/Circ.811 – ‘Guidance for evaluating the 2011 guidelines’, approved on 13th June 2013.

MARIKO GmbH
Future Fuels – Options for Ship Owners & Operators study September 2014
11
2.10.2 National Regulations
US regulation 33 CFR § 151.2050(f) – entered into force on 21st June 2012, requires procedures for the
management of fouling for each vessel trading to US ports. If these procedures are part of the BWMP or
separate as Biofouling Management Plan is for US irrelevant.
Ship owners should establish a BFMP for each ship in accordance with MEPC 207(62) and include a
reference to this plan in a non-mandatory section of the BWMP.
Vessel’s General Permit (VGP) – updated version became effective on 19th December 2013, requires
comprehensive vessels’ inspections regarding to fouling organisms at least once every 12 months and
removal of fouling organisms from seawater piping on a regular basis.
2.11 The USCG Rules on Environmentally Acceptable Lubricants
Since December 2013, all vessels operating in US waters must use Environmentally Acceptable Lubricants
(EAL) in all oil-to-sea interfaces of the ship. This is a new requirement in the 2013 VGP for Discharges
Incidental to the Normal Operation of Vessels.
Within the regulation, use of non-EAL is allowed as long as it can be demonstrated that it is technically
infeasible to use EAL. Non-compliance with EAL requirements may constitute a permit violation with
significant legal and commercial consequences.
12
3. Ship owner’s demand for alternative fuels
In April 2011, a study was commissioned by Lloyd’s Register with the aim of understanding how a global
LNG bunkering infrastructure may develop as well as understanding the likely adoption of LNG as a fuel for
deep-sea shipping.
From this study, of which most of this chapter has been taken, we have:
identified strategic ports and locations globally for possible LNG bunkering infrastructure facilities,
and from a survey we secured opinions of bunkering ports on their likely provision of LNG
bunkering facilities in future and
assessed, through a proprietary interactive demand model the likely scale of demand for LNG-
fuelled newbuildings and LNG fuel for deep-sea shipping to 2025.
A critical aspect to the development of LNG as a fuel is the lack of established bunkering infrastructure and
supply chain network for delivering LNG as a marine fuel.
This is considered as a significant barrier to the widespread adoption of LNG as fuel with gas providers, and
bunker suppliers, unwilling to invest in the infrastructure necessary until there is sufficient demand to
supply commercial shipping with LNG fuel.
On the other hand ship owners are unwilling to invest in LNG-fuelled ships if supplies of LNG bunker are
difficult to obtain.
3.1 Survey findings: intentions for mitigation of SOx emissions
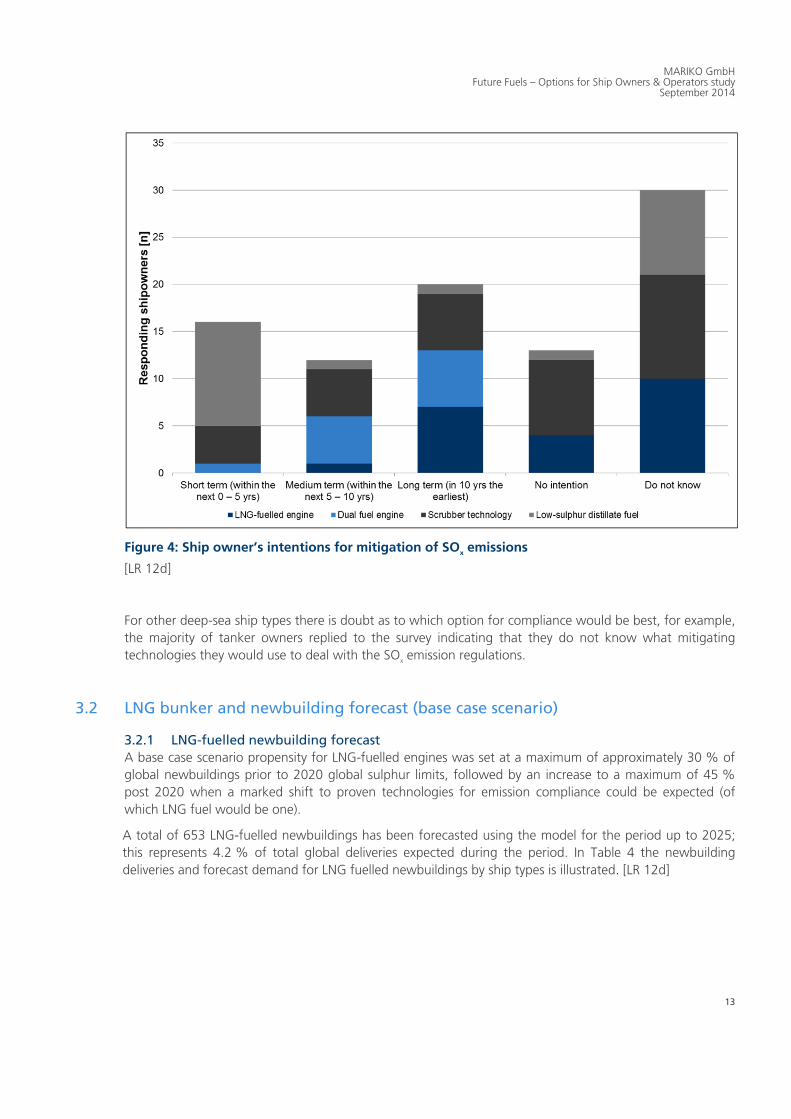
The current intentions for mitigation of SOx emissions by the ship owners are shown in Figure 4. The survey
findings for all ship types are summarised as follows:
1. Short-term solution(within the next 5 years): Low sulphur distillate fuel
2. Medium-term solution (5 to 10 years):exhaust gas scrubber
3. Long-term solution (10+ years): LNG-fuelled engines – particularly for ships on liner trade [LR 12d]
MARIKO GmbH
Future Fuels – Options for Ship Owners & Operators study September 2014
13
Figure 4: Ship owner’s intentions for mitigation of SOx emissions
[LR 12d]
For other deep-sea ship types there is doubt as to which option for compliance would be best, for example,
the majority of tanker owners replied to the survey indicating that they do not know what mitigating
technologies they would use to deal with the SOx emission regulations.
3.2 LNG bunker and newbuilding forecast (base case scenario)
3.2.1 LNG-fuelled newbuilding forecast
A base case scenario propensity for LNG-fuelled engines was set at a maximum of approximately 30 % of
global newbuildings prior to 2020 global sulphur limits, followed by an increase to a maximum of 45 %
post 2020 when a marked shift to proven technologies for emission compliance could be expected (of
which LNG fuel would be one).
A total of 653 LNG-fuelled newbuildings has been forecasted using the model for the period up to 2025;
this represents 4.2 % of total global deliveries expected during the period. In Table 4 the newbuilding
deliveries and forecast demand for LNG fuelled newbuildings by ship types is illustrated. [LR 12d]

14
Table 4: Global newbuilding forecasts versus LNG-fuelled newbuildings
Deep-sea shiptype Cumulative global forecast newbuilding
deliveries (2012 - 2025)
Share of LNG-fuelled newbuildings
(2012 - 2025)
Total [n] Thereof LNG-
fuelled
newbuildings [n]
In global forecast
newbuilding
deliveries [%]
Per shiptype in
total LNG-fuelled
newbuildings [%]
Container ship 1,898 110 5.8 16.8
Dry bulk carrier 7,305 275 3.8 42.1
Oil tanker 1,977 146 7.4 22.3
Cruise ship 230 25 10.9 3.8
Chemical tanker* 1,614 14 < 0.1 2.1
LPG tanker* 522 4 < 0.1 0.7
General cargo ship* 1,313 49 3.8 7.6
Car carrier* 711 30 4.2 4.6
Total 15,570 653 4.2 100.0
*Based on selected deep-sea shiptypes with similar trading operation.
[LR 12d]
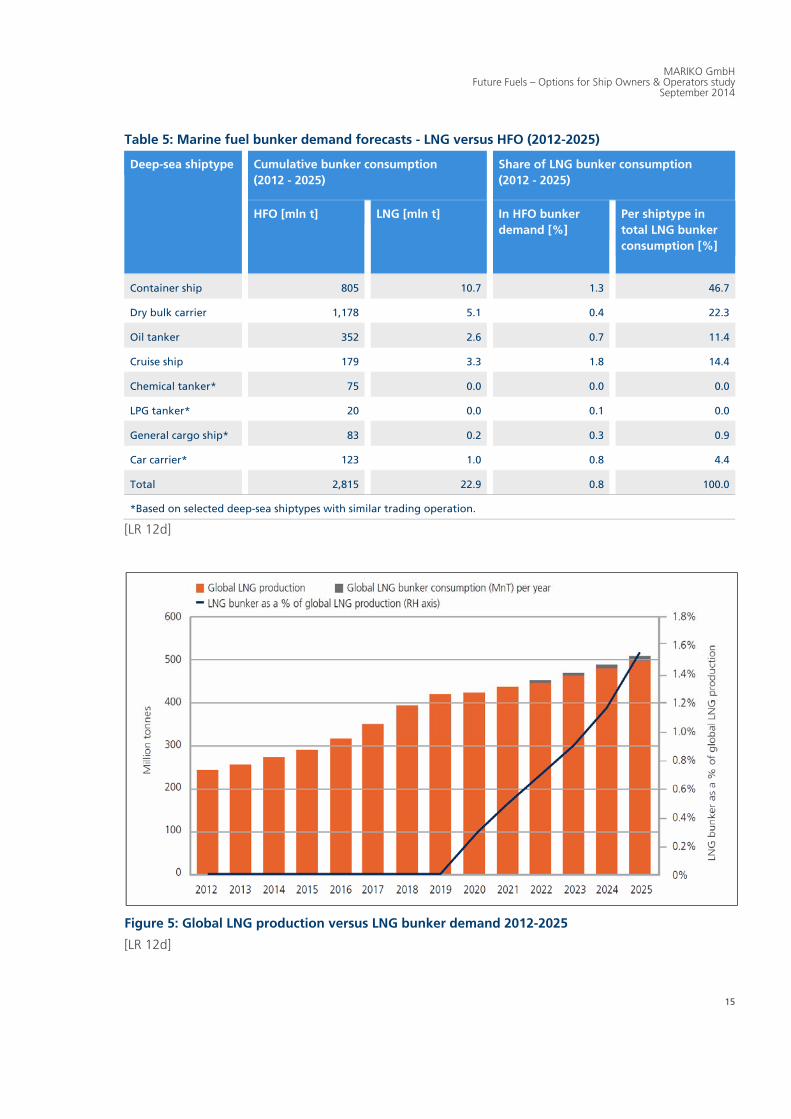
3.2.2 Global LNG bunker demand forecast
The global LNG bunker demand for deep-sea trades looks comparatively small as a percentage of global
HFO bunker demand reaching approximately 24 million tons by 2025 (0.8 % of global HFO bunker
consumption by 2025), see Table 5 and the LNG production versus LNG bunker demand in Figure 5. [LR
12d]
MARIKO GmbH
Future Fuels – Options for Ship Owners & Operators study September 2014
15
Table 5: Marine fuel bunker demand forecasts - LNG versus HFO (2012-2025)
Deep-sea shiptype Cumulative bunker consumption
(2012 - 2025)
Share of LNG bunker consumption
(2012 - 2025)
HFO [mln t] LNG [mln t] In HFO bunker
demand [%]
Per shiptype in
total LNG bunker
consumption [%]
Container ship 805 10.7 1.3 46.7
Dry bulk carrier 1,178 5.1 0.4 22.3
Oil tanker 352 2.6 0.7 11.4
Cruise ship 179 3.3 1.8 14.4
Chemical tanker* 75 0.0 0.0 0.0
LPG tanker* 20 0.0 0.1 0.0
General cargo ship* 83 0.2 0.3 0.9
Car carrier* 123 1.0 0.8 4.4
Total 2,815 22.9 0.8 100.0
*Based on selected deep-sea shiptypes with similar trading operation.
[LR 12d]
Figure 5: Global LNG production versus LNG bunker demand 2012-2025
[LR 12d]
16
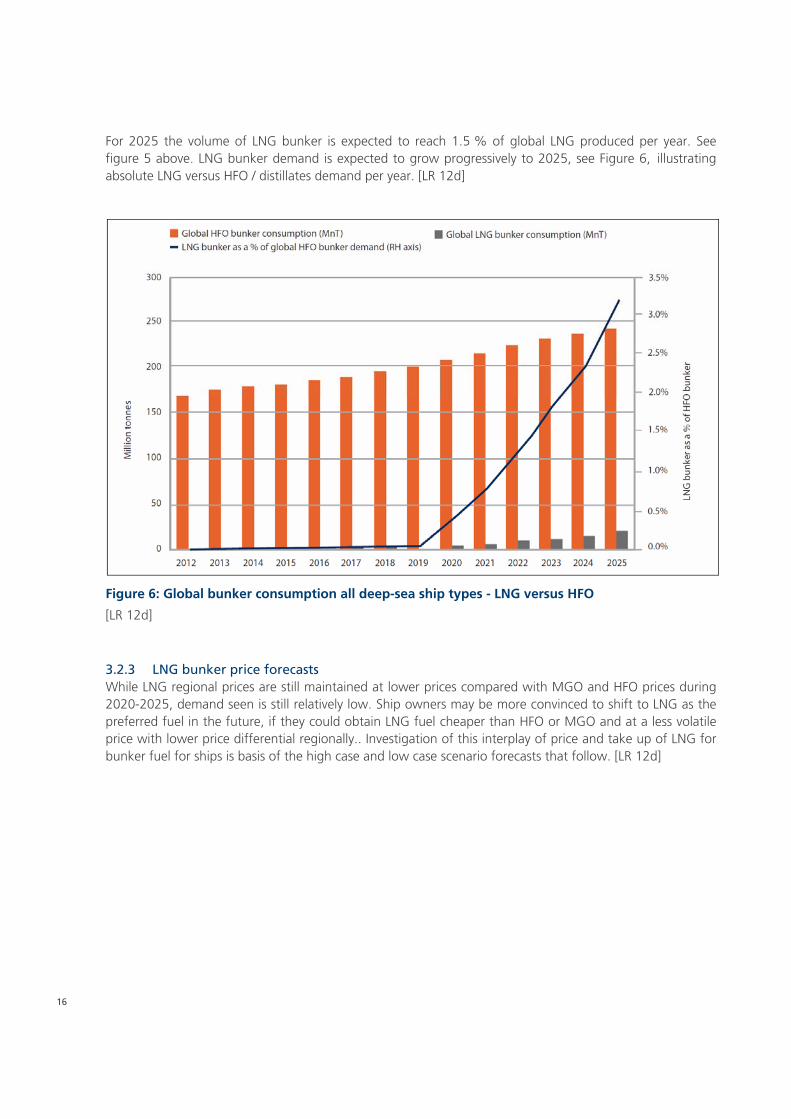
For 2025 the volume of LNG bunker is expected to reach 1.5 % of global LNG produced per year. See
figure 5 above. LNG bunker demand is expected to grow progressively to 2025, see Figure 6, illustrating
absolute LNG versus HFO / distillates demand per year. [LR 12d]
Figure 6: Global bunker consumption all deep-sea ship types - LNG versus HFO
[LR 12d]
3.2.3 LNG bunker price forecasts
While LNG regional prices are still maintained at lower prices compared with MGO and HFO prices during
2020-2025, demand seen is still relatively low. Ship owners may be more convinced to shift to LNG as the
preferred fuel in the future, if they could obtain LNG fuel cheaper than HFO or MGO and at a less volatile
price with lower price differential regionally.. Investigation of this interplay of price and take up of LNG for
bunker fuel for ships is basis of the high case and low case scenario forecasts that follow. [LR 12d]

MARIKO GmbH
Future Fuels – Options for Ship Owners & Operators study September 2014
17
4. Alternative fuels
A Global Marine Fuel Trends study has been conducted by Lloyd’s Register in cooperation with the
University College London to predict marine fuel trends until the year 2030.
This chapter is largely referring to this study and gives an extract overview. The study used a method of
three different scenarios (status quo, more economic growth, more competition) whilst we refer to the
outcome of the ’status quo‘ scenario in this review.
In summary the following statements can be made:
A complete overturn of the marine landscape is not realistic in just 16 years what is seen as an
evolution rather than a revolution.
In a scenario of status quo the shipping emission will double by 2030.
LNG will reach a maximum share of 11 % in 2030.
The segment with the higher proportion of small ships will see the highest LNG uptake.
Drawing the line between conventional and alternative marine fuels is often a matter of interpretation and
viewpoint. What is considered alternative today may be conventional in the near future.
For consistency, in this work the conventional marine fossil fuels are represented by one category of marine
distillates (MDO or MGO) and two categories of RFO of different sulphur contents - HFO and Low Sulphur
HFO (LSHFO).
Cleaner oil based fuels, such as MGO, are more expensive than HFO commonly used in shipping, and there
is an apparent risk that the cost increase in the marine shipping sector due to more expensive fuels can lead
to an unfortunate modal shift from sea to road. The road transport industry has done considerable
development work to identify alternative non-oil-based fuels such as LNG, methanol and DME.
LNG has been promoted as a marine fuel and significant development has been done. It has not been
adopted as a universal solution however, due to complexities and costs regarding infrastructure, bunkering,
and necessary conversion of engine and fuel systems. methanol was identified as a promising alternative
fuel for shipping in the EffShip project (Efficient Shipping with Low Emissions). It was concluded that
methanol could be a competitive alternative for meeting SECA guidelines. Some challenges that needed to
be investigated further included safety, regulations and engine development. [SS 14].
Excurse on methanol
Methanol is a clear, colourless liquid that looks like water and has no discernible odour in low
concentrations. It is often called wood alcohol because it was once produced chiefly as a by-product of the
destructive distillation of wood. Most methanol today is produced from the methane found in natural gas,
but methanol is also produced from all types of biomass, coal, waste, and even CO2 pollution from power
plants [MI 14]
Methanol is a basic chemical building block for other products such as acetic acid and formaldehyde. It is
used in numerous applications including plastics, paints, glues and pharmaceuticals. Methanol is also being
used increasingly in new applications, such as wastewater de-nitrification, biodiesel, gasoline blends and
fuel cells [ME 14].
It boils at 64.96° C and solidifies at -93.9° C. It forms explosive mixtures with air and burns with a non-
luminous flame. Methanol is also a toxin and should not be ingested – drinking quantities of methanol can
result in blindness and severe damage to the central nervous system [MI 14]
18
While methanol does have risks associated with it, they can be managed. To minimize the effect(s) on
people, the environment or the community:
Use metal drums or glass containers, not plastic.
Handle in a well-ventilated area or use breathing apparatus.
Wear chemical resistant gloves and safety glasses.
Eliminate heat / fire / ignition sources [ME 14].
The methanol industry spans the entire globe, with production in Asia, North and South America, Europe,
Africa and the Middle East. Worldwide, over 90 methanol plants have a combined production capacity of
about 100 million metric tons (almost 33 billion gallons or 90 billion litres), and each day more than
100,000 tons of methanol is used as a chemical feedstock or as a transportation fuel (60 million gallons or
225 million litres). Methanol is also a truly global commodity, and each day there is more than 80,000
metric tons of methanol shipped from one continent to another. In 2013, the global methanol demand
was in the order of 65 million metric tons driven in large part by the resurgence of the global housing
market and increased demand for cleaner energy [MI 14].
Methanol does not contain sulphur and when combusted the emissions are reduced compared to
traditional fuels. It is widely available, can be safely transported and distributed using existing infrastructure,
and is competitive with the price of marine distillate fuel based on energy content.
Methanol and DME had not yet been tested on board ships in marine diesel engines, and the Joint Industry
Project SPIRETH was formed to investigate these alternative fuels more thoroughly. Methanol, the simplest
alcohol, and dimethyl ether (DME) were the two fuels selected for testing and demonstration.
The main project findings are that it is feasible to convert ships to operate on methanol and DME-based
fuels, and these fuels are viable alternatives to reduce emissions. Arrangements for methanol storage,
distribution and handling were designed, assessed from a safety and risk perspective, and installed on a ro-
ro-ferry.
The SPIRETH project was completed in summer 2014 and an official report will be available in due course
[SS 14].
The alternative fuels considered include LNG, methanol, hydrogen and biomass-derived products equivalent
or substitutes for the options mentioned. The following Table 6 shows the range of fuels considered, their
technology specification and other comments such as reasons for being included.

MARIKO GmbH
Future Fuels – Options for Ship Owners & Operators study September 2014
19
Table 6: Comparison of fuels
Fuel type / Feedstock Production Comments
Destilate fuel oil
(MDO / MGO)
Oil Rafinery Composed of lighter distillate fractions than RFO
Has lower sulphur content
Biodiesel of 1st or 2nd
generation (Bio-MDO)
Rapeseed oil (1st
generation);
Lignocellulose / Wood
biomass (2nd generation)
Transesterification
gasification
Commercially available
Can be blended with marine distillates
Fully compatible with the engines
Has the potential of reducing GHG emissions
RFO (HFO) Oil Rafinery The main marine fuel used
Very competitive in price
Has high environmental impact
Straight vegetable oil
(Bio-HFO / Bio-LSHFO)
Rapeseed oil Pressing An easily accessible fuel
Able to substitute HFO
Able to reduce GHG emissions
LSFO (LSHFO) Oil Rafinery Less competitive in price than HFO
Has lower sulphur emissions (<1.5 %)
Assumed to meet 0.5 % sulphur limit
LNG Natural Gas Extraction and liquefaction Has lower GHG emissions than oil derived fuels
Competitive in prices
Already used in parts of the fleet
Biogas (Bio-LNG) Lignocellulose / Wood
biomass
Gasification Has the same benefits as LNG
Additional life cycle environmental impact reduction
Hydrogen (H2) Methane Steam methane reforming
with Carbon Capture and
Storage
No carbon emissions in the point of operation
Hydrogen (Bio-H2) Lignocellulose / Wood
biomass
Gasification Has the potential of being a carbon negative fuel
Methanol (CH4O) Methane Reforming and synthesis Has lower carbon content on a mass basis
Has good compatibility with dual fuel engines
Methanol (Bio- CH4O) Lignocellulose / Wood
biomass
Gasification Has the potential of being a carbon negative fuel
Liquid physical form gives an advantage in terms of storage
Can be used as feedstock for other alternative fuels production
Can be used as additive for conventional fuels
[LR 12e]
20
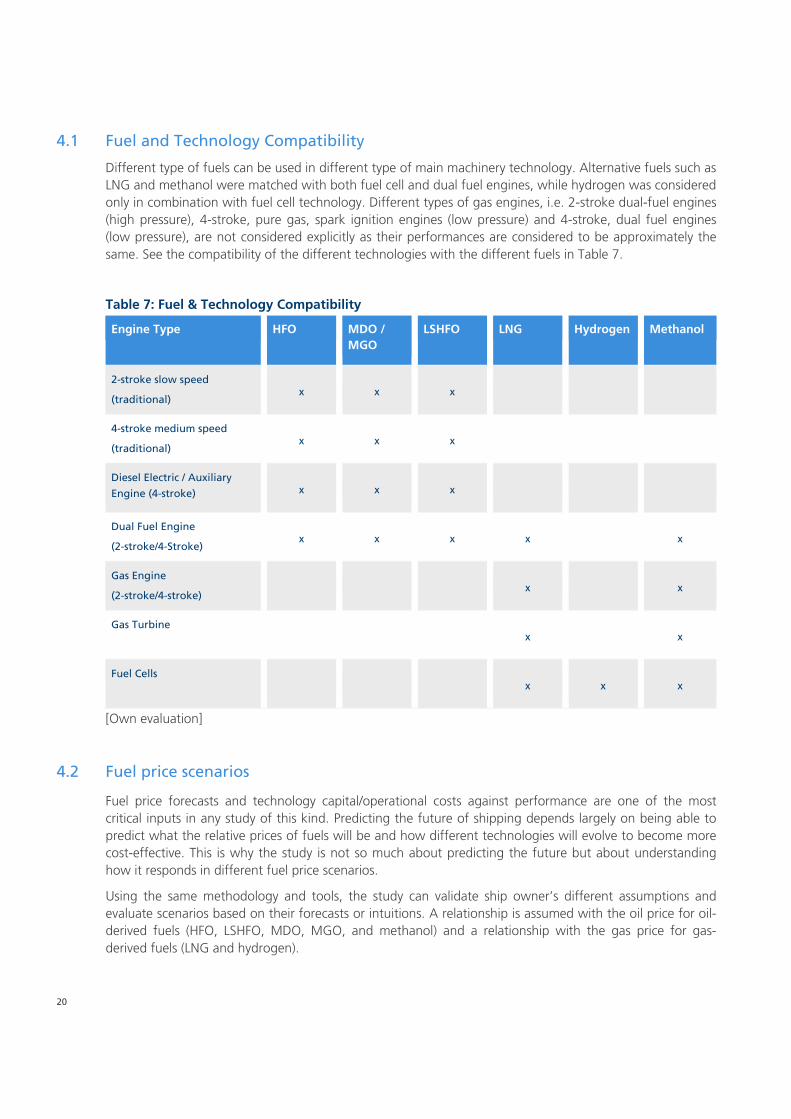
4.1 Fuel and Technology Compatibility
Different type of fuels can be used in different type of main machinery technology. Alternative fuels such as
LNG and methanol were matched with both fuel cell and dual fuel engines, while hydrogen was considered
only in combination with fuel cell technology. Different types of gas engines, i.e. 2-stroke dual-fuel engines
(high pressure), 4-stroke, pure gas, spark ignition engines (low pressure) and 4-stroke, dual fuel engines
(low pressure), are not considered explicitly as their performances are considered to be approximately the
same. See the compatibility of the different technologies with the different fuels in Table 7.
Table 7: Fuel & Technology Compatibility
Engine Type HFO MDO /
MGO
LSHFO LNG Hydrogen Methanol
2-stroke slow speed
(traditional) x x x
4-stroke medium speed
(traditional) x x x
Diesel Electric / Auxiliary
Engine (4-stroke) x x x
Dual Fuel Engine
(2-stroke/4-Stroke) x x x x x
Gas Engine
(2-stroke/4-stroke) x x
Gas Turbine x x
Fuel Cells x x x
[Own evaluation]
4.2 Fuel price scenarios
Fuel price forecasts and technology capital/operational costs against performance are one of the most
critical inputs in any study of this kind. Predicting the future of shipping depends largely on being able to
predict what the relative prices of fuels will be and how different technologies will evolve to become more
cost-effective. This is why the study is not so much about predicting the future but about understanding
how it responds in different fuel price scenarios.
Using the same methodology and tools, the study can validate ship owner’s different assumptions and
evaluate scenarios based on their forecasts or intuitions. A relationship is assumed with the oil price for oil-
derived fuels (HFO, LSHFO, MDO, MGO, and methanol) and a relationship with the gas price for gas-
derived fuels (LNG and hydrogen).
MARIKO GmbH
Future Fuels – Options for Ship Owners & Operators study September 2014
21
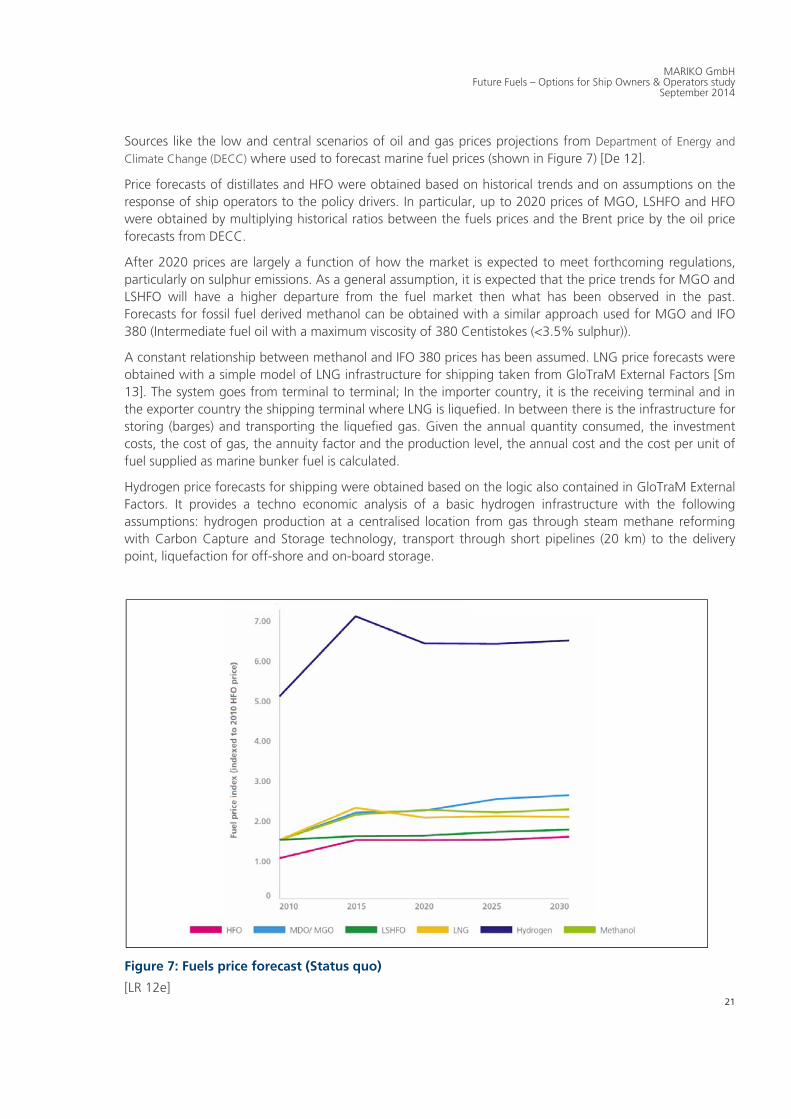
Sources like the low and central scenarios of oil and gas prices projections from Department of Energy and
Climate Change (DECC) where used to forecast marine fuel prices (shown in Figure 7) [De 12].
Price forecasts of distillates and HFO were obtained based on historical trends and on assumptions on the
response of ship operators to the policy drivers. In particular, up to 2020 prices of MGO, LSHFO and HFO
were obtained by multiplying historical ratios between the fuels prices and the Brent price by the oil price
forecasts from DECC.
After 2020 prices are largely a function of how the market is expected to meet forthcoming regulations,
particularly on sulphur emissions. As a general assumption, it is expected that the price trends for MGO and
LSHFO will have a higher departure from the fuel market then what has been observed in the past.
Forecasts for fossil fuel derived methanol can be obtained with a similar approach used for MGO and IFO
380 (Intermediate fuel oil with a maximum viscosity of 380 Centistokes (<3.5% sulphur)).
A constant relationship between methanol and IFO 380 prices has been assumed. LNG price forecasts were
obtained with a simple model of LNG infrastructure for shipping taken from GloTraM External Factors [Sm
13]. The system goes from terminal to terminal; In the importer country, it is the receiving terminal and in
the exporter country the shipping terminal where LNG is liquefied. In between there is the infrastructure for
storing (barges) and transporting the liquefied gas. Given the annual quantity consumed, the investment
costs, the cost of gas, the annuity factor and the production level, the annual cost and the cost per unit of
fuel supplied as marine bunker fuel is calculated.
Hydrogen price forecasts for shipping were obtained based on the logic also contained in GloTraM External
Factors. It provides a techno economic analysis of a basic hydrogen infrastructure with the following
assumptions: hydrogen production at a centralised location from gas through steam methane reforming
with Carbon Capture and Storage technology, transport through short pipelines (20 km) to the delivery
point, liquefaction for off-shore and on-board storage.
Figure 7: Fuels price forecast (Status quo)
[LR 12e]

22
4.3 Environmental Impact
A holistic approach of the aspects of environmental impacts of different present and future marine fuels
can be found in various discussion papers. The discourse within this study will reflect the outcome of Selma
Bengtson’s studies using the method of Life Cycle Assessment [Be 11a] to evaluate the total environmental
impact from ’well to propeller’.
In the study covering a comparative life cycle assessment of marine fuels, the life cycle impact from the
marine fuels is presented in two stages: the well-to-tank stage and the tank-to-propeller stage which
should show a better understanding of direct emissions from shipping compared to the impact considering
the whole life cycle.
The following Figure 8 describes the steps of the life cycle investigated:
Figure 8: Life cycle steps
[Be 11b]
MARIKO GmbH
Future Fuels – Options for Ship Owners & Operators study September 2014
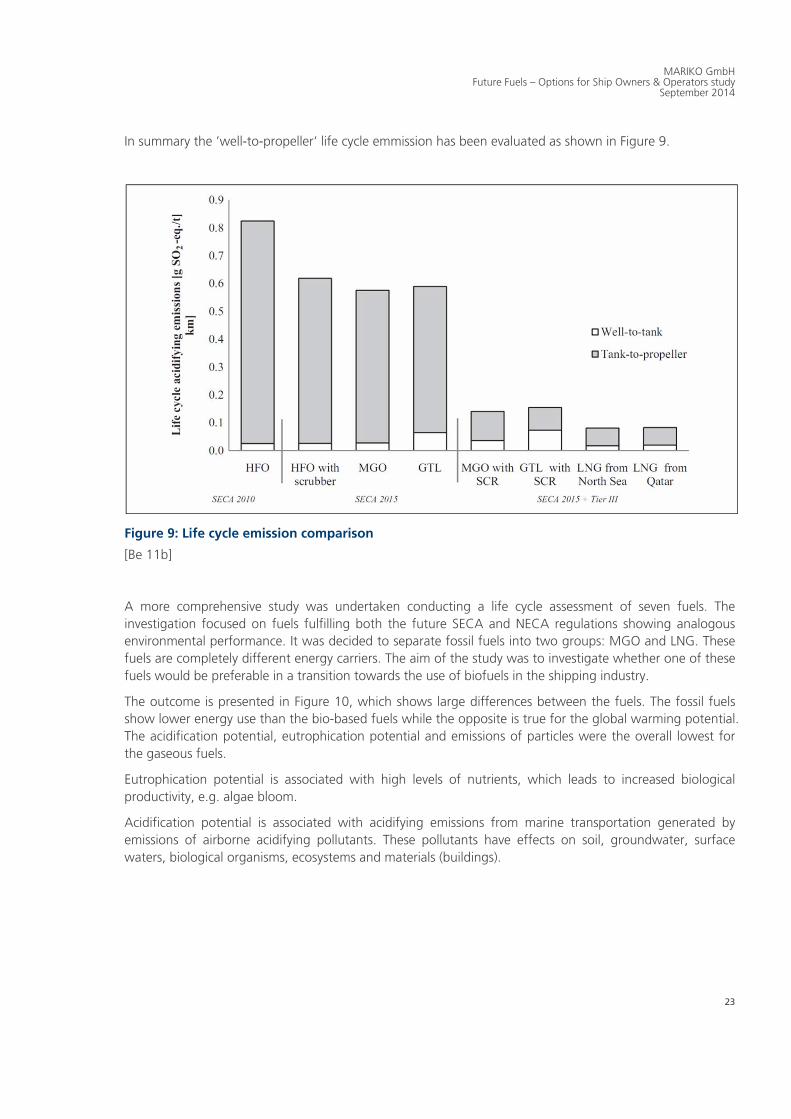
23
In summary the ’well-to-propeller‘ life cycle emmission has been evaluated as shown in Figure 9.
Figure 9: Life cycle emission comparison
[Be 11b]
A more comprehensive study was undertaken conducting a life cycle assessment of seven fuels. The
investigation focused on fuels fulfilling both the future SECA and NECA regulations showing analogous
environmental performance. It was decided to separate fossil fuels into two groups: MGO and LNG. These
fuels are completely different energy carriers. The aim of the study was to investigate whether one of these
fuels would be preferable in a transition towards the use of biofuels in the shipping industry.
The outcome is presented in Figure 10, which shows large differences between the fuels. The fossil fuels
show lower energy use than the bio-based fuels while the opposite is true for the global warming potential.
The acidification potential, eutrophication potential and emissions of particles were the overall lowest for
the gaseous fuels.
Eutrophication potential is associated with high levels of nutrients, which leads to increased biological
productivity, e.g. algae bloom.
Acidification potential is associated with acidifying emissions from marine transportation generated by
emissions of airborne acidifying pollutants. These pollutants have effects on soil, groundwater, surface
waters, biological organisms, ecosystems and materials (buildings).

24
Figure 10: Life cycle assessment of marine fuels with regard to different categories
[Be 11a]
Results for the impact categories agricultural land use, primary energy use, global warming potential,
acidification potential, eutrophication potential and particle emissions for HFO, MGO, Rapeseed Methyl
Ester, LNG, Liquefied Biogas / Liquefied Biomethane split as well-to-tank (black) and tank-to-propeller
(white).
Two main conclusions were drawn from the study:
first, that the gas route indicated better overall environmental performance than the diesel route
and
secondly, that biofuels are one possible measure to decrease the global warming impact from
shipping but that it can be at the expense of greater environmental impact for other impact
categories.
4.4 Fuel mix & marine fuel demand
One of the main outcomes of the Global Marine Fuel Study is potential scenarios for the marine fuel mix to
2030. The mix reflects fuels used by the existing fleet, the fuel changes that occur as a result of arising
regulation (e.g. sulphur emissions regulation), as well as fuels adopted by new tonnage ( see the fuel mix
forecast for the different ship types in Figure 11).
In this investigation no considerable uptake of methanol can be seen. Although, methanol is being
evaluated as an alternative to LNG in a number of current joint industry projects (METHAPU, SPIRETH). It
may be that the 2030 timeframe is too short or the drivers are not strong enough to give a valuable
feedback to this fuel type.

MARIKO GmbH
Future Fuels – Options for Ship Owners & Operators study September 2014
25
The four main ship segments are covered and a noticeable reduction in the use of HFO is considered. A
considerable proportion of the fleet, mainly older tonnage, will rely on MDO/MGO for ECA compliance. It
may not be the most cost-effective overall option, but it still remains the only technically viable option for
some ships. This is reflected in the fuel mix. Equally, LSHFO will see a step uptake between 2020 and 2025,
taking significant proportion of the fuel mix in 2030.
LNG will be adopted gradually and more profoundly in the product/chemical segment, followed by the bulk
carrier/general cargo segment.
Figure 11: Fuel mix for containership, bulk carrier / general cargo, tanker (crude) and tanker (product / chemical) fleet
[LR 12e]
The marine fuel demand in 2030 is a different concept than the fuel mix discussed previously. The fuel mix
represents the proportion of each fuel compared to the overall industry demand at each period in time. On
the other hand, the fuel demand shown here is indexed back to the total energy demand in 2010 for
comparative purposes. The drivers of total demands for each fuel are the combination of the evolving fuel
mix, the evolving transport demand and the evolving fleet’s energy efficiency (which can change both due
to differences in the uptake of energy efficiency technology and changes in design and/or operating
speed).
Overall, the fuel demand will more or less double by 2030 (see the forecast of fuel demand in Figure 11).
This is mainly due to the increase in transport demand (and subsequently energy demand) requirements
and shows that relative to this underlying growth in demand reductions in energy demand due to energy
efficiency improvements and speed reductions are small. Individually, demand for HFO will increase until
2025, and will this ultimately drop to its 2010 levels by 2030.

26
Figure 12: Prediction of fuel demand until 2030 (status quo)
[LR 12e]
It is worth to note that the figure above reflects the ’status quo‘ scenario only and further information as
well as variations hereto can be found in the quoted study.

MARIKO GmbH
Future Fuels – Options for Ship Owners & Operators study September 2014
27
5. Fleet statistics for Lower Saxony
While the previous chapters gave detailed information on globally discussed topics in scope of emerging
IMO regulations and their compliance the following sections and subchapters will concentrate on general
statements regarding the regional vessel fleet in Lower Saxony and its characteristics.
Therefore in a first step all types of seagoing vessels (identified by IMO-no.) operated, chartered, owned or
managed by companies resident in Lower Saxony completely or with at least one subsidiary (including
’single-ship-companies‘, excluding providers of ship finance with vessels in their portfolio) have been
analysed in order to draw a detailed picture of the regional managed fleet structure in the context of
outlined IMO regulations. Fleet lists relatable to companies concerned have been considered, aligned with
data from a web research and operators vessel fact sheets as well as the web tools sea-web respectively
fleetmon. In total data of 137 companies have been queried, considering vessels presently in service /
commission, keel laid or in order (including vessels temporarily laid up, excluding vessels of total loss).
Additionally in conclusion the regional fleet will be illustrated in form of six average vessels, characterizing
the most frequently operated vessel types relatable to companies resident in Lower Saxony completely or
with at least one subsidiary.
5.1 General Findings
5.1.1 Vessel Types
According to the data evaluation, the identified main seagoing vessel types of companies resident in Lower
Saxony are
‘General Cargo Vessels’ (as they are tweendecker vessels for multipurpose or project cargo usage
etc.),
‘Container Vessels’ (as they are feeder or fully cellular vessels etc.),
‘Tankers’ (especially built for LPG, crude oil, chemicals etc.),
‘Refrigerated Cargo Vessels’ (transporting perishable commodities),
‘Bulk Carriers’ (as they are handysize, supramax, panamax , capsize etc.) and
‘Other Vessels’ (like crewing vessels, anchor handling tugs, heavy load units, vessels for ro-ro,
passenger and ro-pax usage etc.).
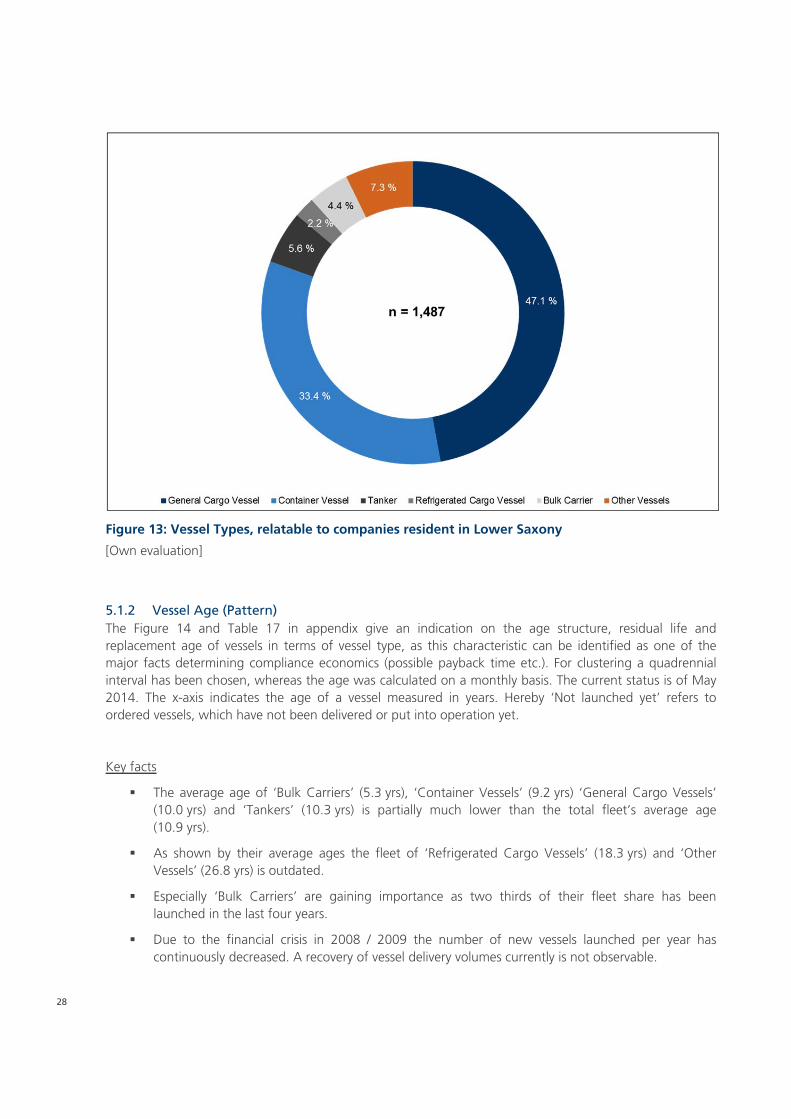
In sum, data for 1,487 vessels has been processed operating for companies resident in Lower Saxony (see
Figure 13). Almost half of all analysed vessels can be categorized as ‘General Cargo Vessels’. Another third
are ‘Container Vessels’. The remaining 19.5 % can be classified into specialised freighters (like ‘Tankers’,
‘Bulk Carriers’ or ‘Refrigerated Cargo Vessels’) and further vessel types.
28
Figure 13: Vessel Types, relatable to companies resident in Lower Saxony
[Own evaluation]
5.1.2 Vessel Age (Pattern)
The Figure 14 and Table 17 in appendix give an indication on the age structure, residual life and
replacement age of vessels in terms of vessel type, as this characteristic can be identified as one of the
major facts determining compliance economics (possible payback time etc.). For clustering a quadrennial
interval has been chosen, whereas the age was calculated on a monthly basis. The current status is of May
2014. The x-axis indicates the age of a vessel measured in years. Hereby ‘Not launched yet’ refers to
ordered vessels, which have not been delivered or put into operation yet.
Key facts
The average age of ‘Bulk Carriers’ (5.3 yrs), ‘Container Vessels’ (9.2 yrs) ‘General Cargo Vessels’
(10.0 yrs) and ‘Tankers’ (10.3 yrs) is partially much lower than the total fleet’s average age
(10.9 yrs).
As shown by their average ages the fleet of ‘Refrigerated Cargo Vessels’ (18.3 yrs) and ‘Other
Vessels’ (26.8 yrs) is outdated.
Especially ‘Bulk Carriers’ are gaining importance as two thirds of their fleet share has been
launched in the last four years.
Due to the financial crisis in 2008 / 2009 the number of new vessels launched per year has
continuously decreased. A recovery of vessel delivery volumes currently is not observable.

MARIKO GmbH
Future Fuels – Options for Ship Owners & Operators study September 2014
29
Despite the development of ‘Other Vessels’ most vessels are going to be scrapped / replaced at the
age of 21 – 24 yrs.
Figure 14: Vessel Age (Pattern), relatable to companies resident in Lower Saxony (as of May 2014)
[Own evaluation]
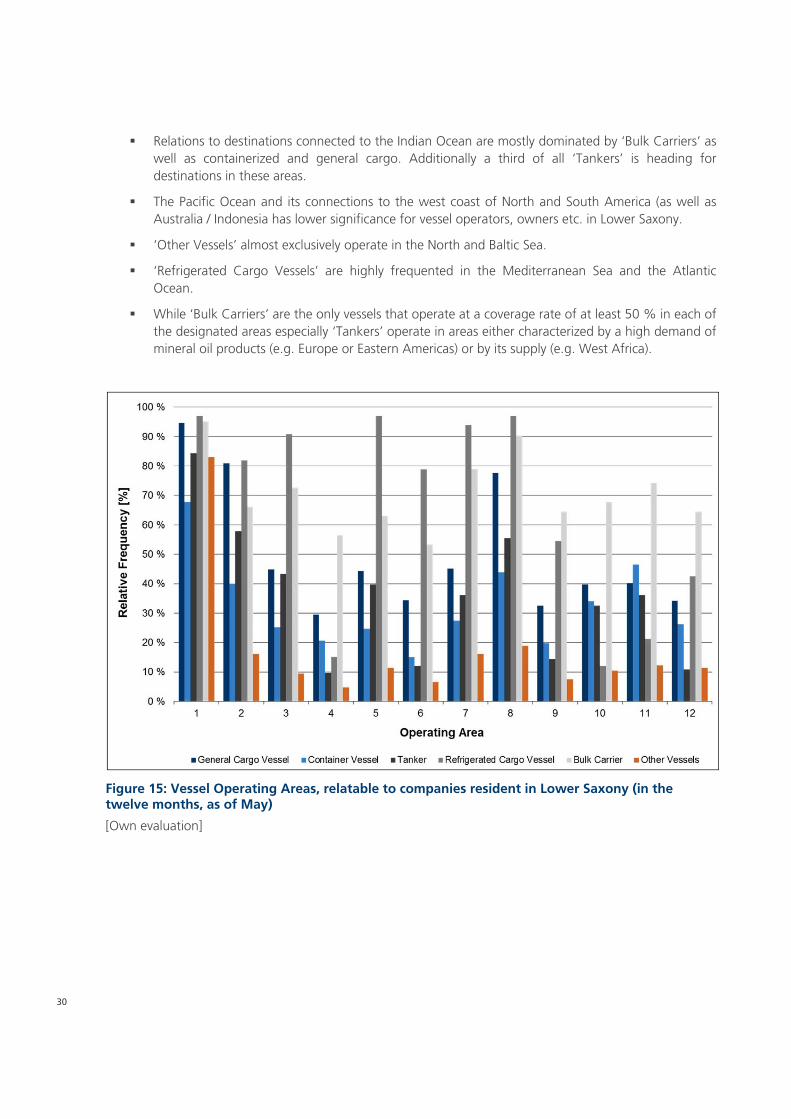
5.1.3 Vessel Operating Areas / Port Calls
The following Figure 15 shows the frequency of vessels, relatable to companies resident in Lower Saxony,
travelling different areas around the world. As shown in Figure 16, categorisation of vessel operating areas
worldwide is based on major trading routes. Within the subsequent remarks trading relations of each
vessel, with an age of at least one year, have been considered as far as they appeared in the last twelve
months (June 2013 until May 2014). It has to be stated that a relative frequency of travelling an area does
not include a quantitative conclusion on the time spent within the corresponding shipping area but rather
purchases an impression on preferred traveling areas by each type of vessel.
Key facts
For every vessel type operated, chartered, owned or managed by companies resident in Lower
Saxony North and Baltic Sea are the most frequented trading areas.
The Atlantic Ocean, including the east coast of North and South America as well as the Western
African coast indicate similar coverage patterns with ‘Refrigerated Cargo Vessels’ and ‘Bulk
Carriers’ showing the highest frequencies.
30
Relations to destinations connected to the Indian Ocean are mostly dominated by ‘Bulk Carriers’ as
well as containerized and general cargo. Additionally a third of all ‘Tankers’ is heading for
destinations in these areas.
The Pacific Ocean and its connections to the west coast of North and South America (as well as
Australia / Indonesia has lower significance for vessel operators, owners etc. in Lower Saxony.
‘Other Vessels’ almost exclusively operate in the North and Baltic Sea.
‘Refrigerated Cargo Vessels’ are highly frequented in the Mediterranean Sea and the Atlantic
Ocean.
While ‘Bulk Carriers’ are the only vessels that operate at a coverage rate of at least 50 % in each of
the designated areas especially ‘Tankers’ operate in areas either characterized by a high demand of
mineral oil products (e.g. Europe or Eastern Americas) or by its supply (e.g. West Africa).
Figure 15: Vessel Operating Areas, relatable to companies resident in Lower Saxony (in the twelve months, as of May)
[Own evaluation]

MARIKO GmbH
Future Fuels – Options for Ship Owners & Operators study September 2014
31
Figure 16: Vessel Operating Areas
[Own evaluation]
A more detailed analysis (see Figure 17) of the frequency of calls in ports of Lower Saxony by vessels
currently in service / commission in the last twelve months (June 2013 until May 2014) can help to
understand in which way the fleet of regional vessel operators, charterers, owners etc. have a local impact
on the port scene in Lower Saxony.
Key facts
In total about one out of four vessels, relatable to companies resident in Lower Saxony (27.8 %)
stops within one year in a port of Lower Saxony. Keeping in mind that about 84.2 % of all
analysed vessels are traveling the Baltic and North Sea this means that two out of three regional
owned or managed vessels regularly operating within this area just pass Lower Saxony without a
port call. In case of a stop in a port of Lower Saxony more than two thirds of the vessels call either
Brake, Cuxhaven, Emden or Wilhelmshaven.
While ‘Refrigerated Cargo Vessels’ hardly stop in Lower Saxony at all ‘Other Vessels’ show the
highest frequency of arrivals at ports in Lower Saxony every year (on average almost 23 port calls
per vessel).
On average almost one third of all ‘General Cargo Vessels’ stops at least one time per year in a
port of Lower Saxony. In almost 80.0 % the port of call is Brake, Cuxhaven or Emden.
Generally the majority of ‘Container Vessels’ and ‘Bulk Carriers’ rarely calls a port at the coast of
Lower Saxony, but especially for ‘Tankers’ the average number of calls is still up to eight per vessel
and year. This amount is strongly influenced by few small local tank suppliers, regularly supplying
regional customers in the ports of Lower Saxony. Two thirds of all port calls by ‘Tankers’ relatable
to regional companies appear in Buetzfleth or Cuxhaven.

32
Figure 17: Vessel Port Calls in ports of Lower Saxony, relatable to companies resident in Lower Saxony (in the last twelve months, as of May 2014)
[Own evaluation]
5.1.4 Vessel Deadweight tonnage
As shown in Figure 18 analysed fleet data does not only contain significant differences in age pattern and
operating areas but also in tonnage of the vessels measured in Deadweight tonnage (dwt). In contrast to
the above chosen form of relative frequencies the following figure includes cumulative frequencies in order
to clearly highlight the differences within the fleet of vessels relatable to companies resident in Lower
Saxony.
Key facts
While the average tonnage of ‘Other Vessels’ (1.4 ths dwt), ‘General Cargo Vessels’ (7.6 ths dwt),
‘Refrigerated Cargo Vessels’ (10.8 ths dwt) and ‘Tankers’ (15.2 ths dwt) is partially much lower
than the total fleet’s average tonnage (15.6 ths dwt) average tonnage of ‘Container Vessels’
(25.5 ths dwt) as well as ‘Bulk Carriers’ (52.5 ths dwt) clearly exceeds this amount.
In general the fleet statistics show that the younger the vessel (related to economies of scale) and
the wider the distance between the operating areas (excluding coastal shipping e.g. from Baltic
and North Sea to the west coast of South Africa) the larger the vessels become measured in dwt.
More than 90.0 % of the ‘General Cargo Vessels’ and ‘Refrigerated Cargo Vessels’ are smaller
than 15.0 ths dwt. In case of ‘Other Vessels’ 90.0 % are even smaller than 5.0 ths dwt.

MARIKO GmbH
Future Fuels – Options for Ship Owners & Operators study September 2014
33
Due to the worldwide distribution of natural resources and a strong influence of economies of
scale almost every second ‘Bulk Carrier’ is larger than or equal to 40.0 ths dwt. A similar effect
although less pronounced can be shown for ‘Container Vessels’ with about one third of the fleet
being larger than 30.0 ths dwt. Due to the smaller local tank suppliers and their vessels illustrated
within this statistics the share of ‘Tankers’ with at least 15.0 ths dwt is just about one third and can
be described as relatively small.
Figure 18: Cumulative frequencies of Vessel dwt, relatable to companies resident in Lower Saxony (as of May 2014)
[Own evaluation]
5.1.5 Vessel Main Engine Power
A further possibility of differentiation of vessels managed or owned by regional companies can be seen in
an analysis of each vessel’s power. Therefor cumulative frequencies of the main engine power are shown in
Figure 19 in order to exemplify the comparative fleet distribution. Figure 41 in appendix will give an
indication on the fuel types used by the different vessel types.
Key facts
According to the relative low tonnage of ‘Other Vessels’, ‘General Cargo Vessels’ and ‘Tankers’ as
shown in Figure 18 the following figure clearly indicates that between 87.2 % and 100.0 % of
theses vessel types use main engines with 9.9 MW (Megawatt) or less. Although ‘Refrigerated
Cargo Vessels’ have similar low tonnage main engine power in this vessel category exceeds
10.0 MW in about every second case. It can be assumed that this is due to the quite high average

34
age (and thereby the possibility of a lower energy efficiency of their main engines) as well as a
direct connection between the cooling / energy system for the refrigerated cargo (like perishable
goods).
The average main engine power of ‘Other Vessels’ (3.0 MW), ‘General Cargo Vessels’ (3.6 MW)
and ‘Tankers’ (4.9 MW) is substantially lower than the fleet’s average of 8.7 MW. ‘Refrigerated
Cargo Vessels’ (10.4 MW) and ‘Container Vessels’ (17.5 MW) are significantly above this value.
While ‘Bulk Carriers’ rank among the largest vessels within this statistics measured in dwt their
main engines only show average performance related to their power (8.7 MW). This can be
explained due to the fact that transportation of natural resources is mostly not time-critical and
allows slow steaming and thereby less engine capacity and does not require additional energy for
cooling (in contrast to reefer-containers or refrigerated cargo-vessels). A contrasting picture can be
drawn for ‘Container Vessels’. Although on average they show less tonnage per vessel than ‘Bulk
Carriers’, the share of vessels with a main engine power of at least 10.0 MW is almost 50.0 %
while it is for ‘Bulk Carriers’ just about 15.4 %. An explanation can be seen within the requirement
of relatively fast transportation of consumer goods or goods for production supplies and the need
for additional power for the reefer containers.
IFO180 / 380 or even HFO are the most frequently used fuel types on the market. MDO and MGO
areis hardly used by most vessel types, only ‘Other Vessels’ have a major share.
Figure 19: Cumulative frequencies of Vessel Main Engine Power, relatable to companies resident in Lower Saxony (as of May 2014)
[Own evaluation]

MARIKO GmbH
Future Fuels – Options for Ship Owners & Operators study September 2014
35
5.2 Average Vessel Types
As an extract from the analysis up to this point, six average vessel types were selected to represent the
main clusters of the given fleet. Due to the large number of ‘General Cargo Vessels’ and ‘Container
Vessels’ two clusters of each vessel type will be characterised (mainly focussing differences in dwt and
operating areas). ‘Tankers’ and ‘Bulk Carriers’ will be representing additional clusters to complete the list of
average vessels. ‘Refrigerated Vessels’ are not considered, due to their low overall percentage share as well
as the fact that they hardly ever head for ports in Lower Saxony (see Figure 17). ‘Other Vessels’ are not
further investigated at this point due to their large diversity of vessels (see Table 8). In sum the selected
average vessel types are able to illustrate characteristics of about two thirds of the vessels managed and
operated by companies located in Lower Saxony.
Table 8: Average Vessel Types, relatable to companies resident in Lower Saxony (as of May 2014)
Vessel Type Quantity [n] Average Vessel Type Share [%]
General Cargo Vessel 700 General Cargo Vessels 0.0 – 4.9 ths dwt 39.6
General Cargo Vessels 5.0 – 9.9 ths dwt 36.4
Container Vessel 497 Container Vessels 5.0 – 9.9 ths dwt 27.6
Container Vessels 10.0 – 14.9 ths dwt 26.0
Tanker 84 Tanker 100.0
Refrigerated Cargo Vessel 33 - 0.0
Bulk Carrier 65 Bulk Carrier 100.0
Other Vessels 108 - 0.0
Total 1,487 - 63.7
[Own evaluation]
A further descriptive characterisation of statistics concerning attributes of each average vessel type like
above shall be waived as deviations from the main statistics of vessels relatable to companies resident in
Lower Saxony occur sporadically and thereby do not lead to a divergence of the overall picture. Instead fact
sheets in appendix (see Table 18 to Table 23) give an idea on typical characteristic features of each vessel
type.
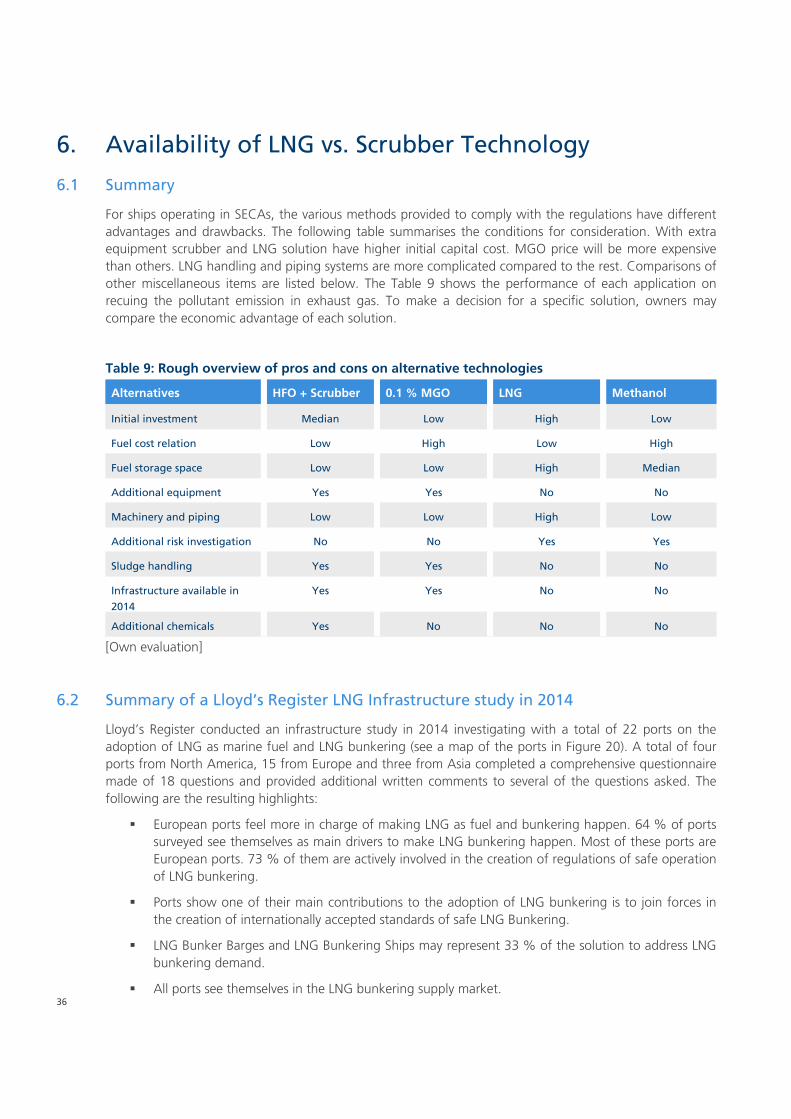
36
6. Availability of LNG vs. Scrubber Technology
6.1 Summary
For ships operating in SECAs, the various methods provided to comply with the regulations have different
advantages and drawbacks. The following table summarises the conditions for consideration. With extra
equipment scrubber and LNG solution have higher initial capital cost. MGO price will be more expensive
than others. LNG handling and piping systems are more complicated compared to the rest. Comparisons of
other miscellaneous items are listed below. The Table 9 shows the performance of each application on
recuing the pollutant emission in exhaust gas. To make a decision for a specific solution, owners may
compare the economic advantage of each solution.
Table 9: Rough overview of pros and cons on alternative technologies
Alternatives HFO + Scrubber 0.1 % MGO LNG Methanol
Initial investment Median Low High Low
Fuel cost relation Low High Low High
Fuel storage space Low Low High Median
Additional equipment Yes Yes No No
Machinery and piping Low Low High Low
Additional risk investigation No No Yes Yes
Sludge handling Yes Yes No No
Infrastructure available in
2014
Yes Yes No No
Additional chemicals Yes No No No
[Own evaluation]
6.2 Summary of a Lloyd’s Register LNG Infrastructure study in 2014
Lloyd’s Register conducted an infrastructure study in 2014 investigating with a total of 22 ports on the
adoption of LNG as marine fuel and LNG bunkering (see a map of the ports in Figure 20). A total of four
ports from North America, 15 from Europe and three from Asia completed a comprehensive questionnaire
made of 18 questions and provided additional written comments to several of the questions asked. The
following are the resulting highlights:
European ports feel more in charge of making LNG as fuel and bunkering happen. 64 % of ports
surveyed see themselves as main drivers to make LNG bunkering happen. Most of these ports are
European ports. 73 % of them are actively involved in the creation of regulations of safe operation
of LNG bunkering.
Ports show one of their main contributions to the adoption of LNG bunkering is to join forces in
the creation of internationally accepted standards of safe LNG Bunkering.
LNG Bunker Barges and LNG Bunkering Ships may represent 33 % of the solution to address LNG
bunkering demand.
All ports see themselves in the LNG bunkering supply market.
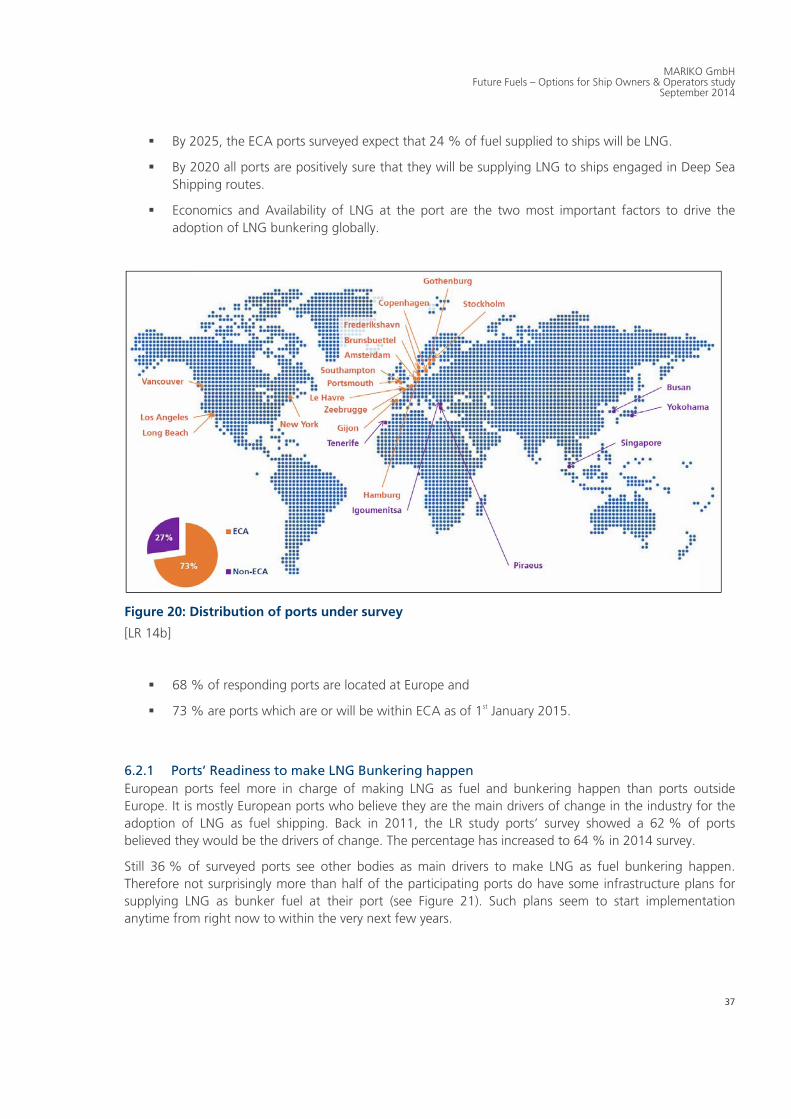
MARIKO GmbH
Future Fuels – Options for Ship Owners & Operators study September 2014
37
By 2025, the ECA ports surveyed expect that 24 % of fuel supplied to ships will be LNG.
By 2020 all ports are positively sure that they will be supplying LNG to ships engaged in Deep Sea
Shipping routes.
Economics and Availability of LNG at the port are the two most important factors to drive the
adoption of LNG bunkering globally.
Figure 20: Distribution of ports under survey
[LR 14b]
68 % of responding ports are located at Europe and
73 % are ports which are or will be within ECA as of 1st January 2015.
6.2.1 Ports’ Readiness to make LNG Bunkering happen
European ports feel more in charge of making LNG as fuel and bunkering happen than ports outside
Europe. It is mostly European ports who believe they are the main drivers of change in the industry for the
adoption of LNG as fuel shipping. Back in 2011, the LR study ports’ survey showed a 62 % of ports
believed they would be the drivers of change. The percentage has increased to 64 % in 2014 survey.
Still 36 % of surveyed ports see other bodies as main drivers to make LNG as fuel bunkering happen.
Therefore not surprisingly more than half of the participating ports do have some infrastructure plans for
supplying LNG as bunker fuel at their port (see Figure 21). Such plans seem to start implementation
anytime from right now to within the very next few years.
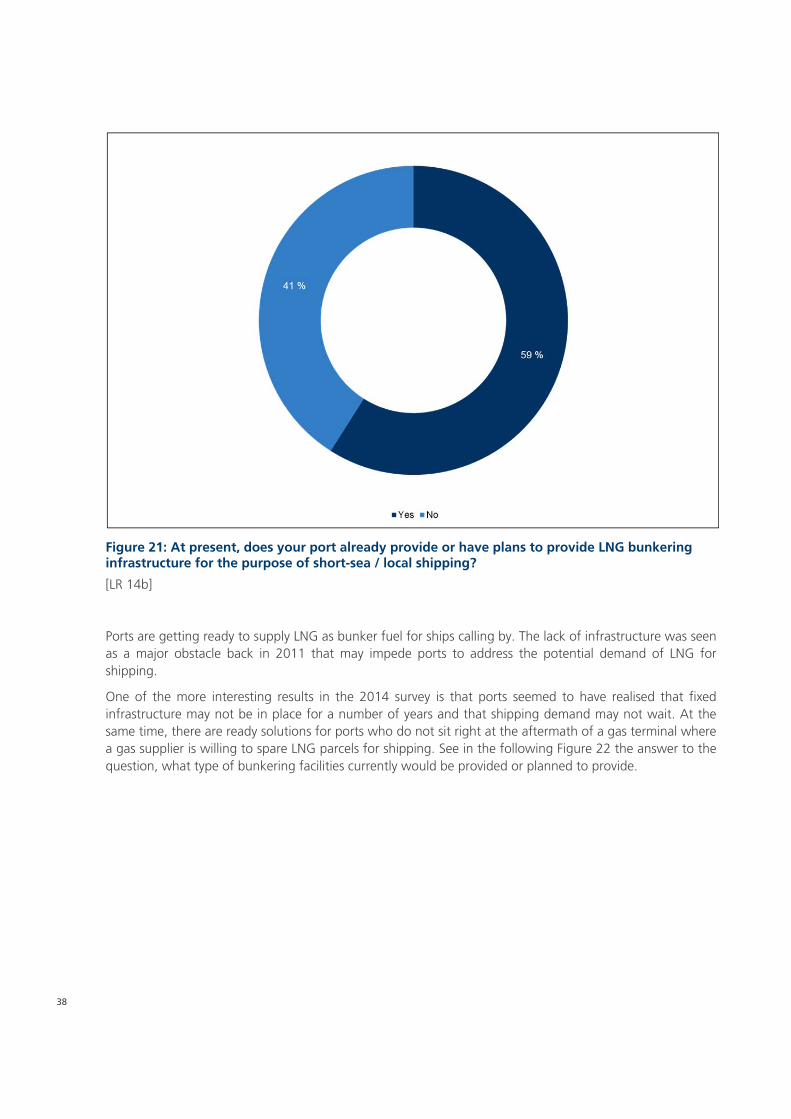
38
Figure 21: At present, does your port already provide or have plans to provide LNG bunkering infrastructure for the purpose of short-sea / local shipping?
[LR 14b]
Ports are getting ready to supply LNG as bunker fuel for ships calling by. The lack of infrastructure was seen
as a major obstacle back in 2011 that may impede ports to address the potential demand of LNG for
shipping.
One of the more interesting results in the 2014 survey is that ports seemed to have realised that fixed
infrastructure may not be in place for a number of years and that shipping demand may not wait. At the
same time, there are ready solutions for ports who do not sit right at the aftermath of a gas terminal where
a gas supplier is willing to spare LNG parcels for shipping. See in the following Figure 22 the answer to the
question, what type of bunkering facilities currently would be provided or planned to provide.
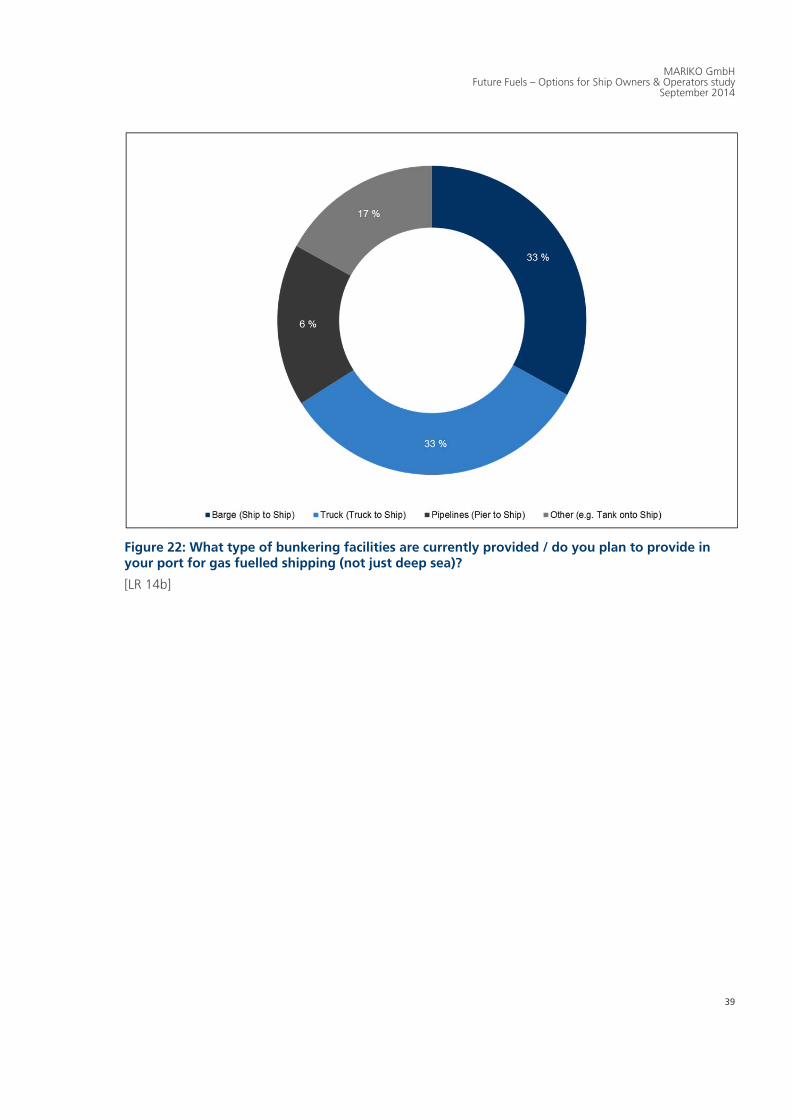
MARIKO GmbH
Future Fuels – Options for Ship Owners & Operators study September 2014
39
Figure 22: What type of bunkering facilities are currently provided / do you plan to provide in your port for gas fuelled shipping (not just deep sea)?
[LR 14b]

40
6.2.2 LNG Bunkering Supply
When would LNG be supplied as marine fuel at ports? Few of the surveyed ports are already supplying LNG
to ships, mainly for coastal or short sea trading.
More ports within Europe have joined the supply market compared to before, or have plans to join within
the next 5 years; the survey clearly shows the strong willingness to provide LNG as bunker fuel for shipping
within Europe, not constraint to the North Europe ECA zone only but spreading also across other non ECA
zone ports.
See in the following Figure 23 the answer to the question, what the expected timeframe to commence
LNG bunkering operations would be and in Figure 24 the kind of infrastructure which is planned.
Figure 23: What is the expected timeframe for LNG bunkering operations to commence at your port?
[LR 14b]
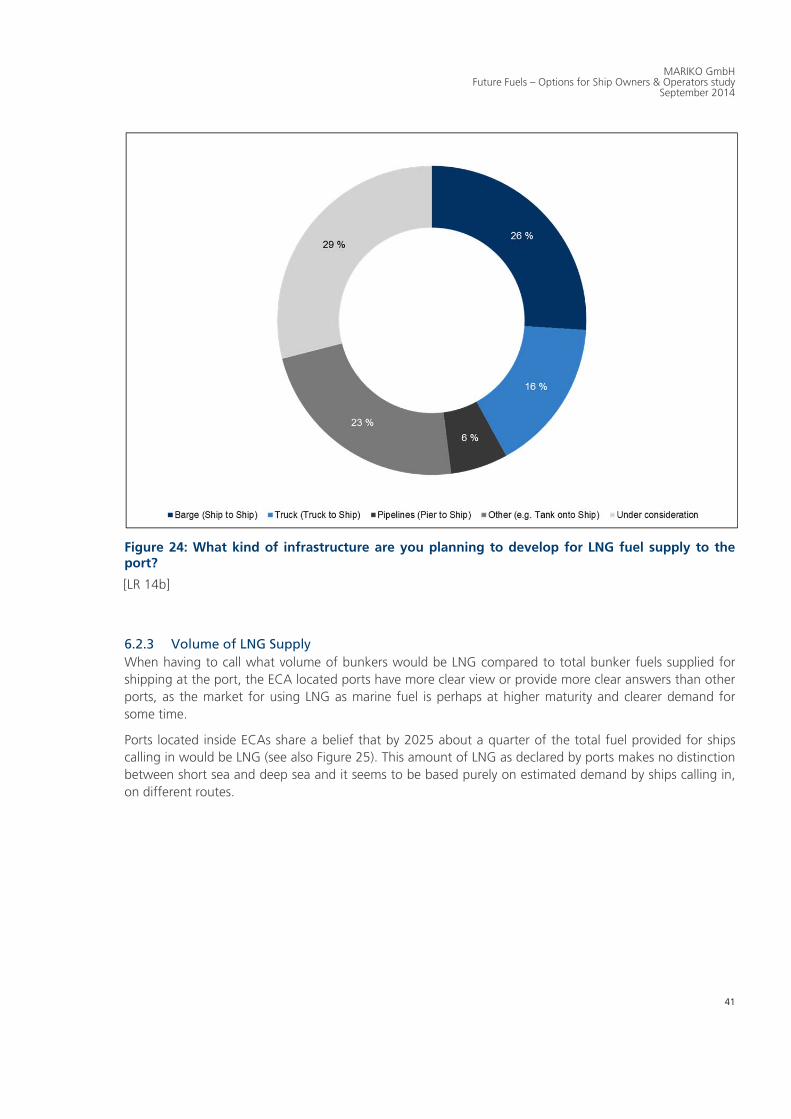
MARIKO GmbH
Future Fuels – Options for Ship Owners & Operators study September 2014
41
Figure 24: What kind of infrastructure are you planning to develop for LNG fuel supply to the port?
[LR 14b]
6.2.3 Volume of LNG Supply
When having to call what volume of bunkers would be LNG compared to total bunker fuels supplied for
shipping at the port, the ECA located ports have more clear view or provide more clear answers than other
ports, as the market for using LNG as marine fuel is perhaps at higher maturity and clearer demand for
some time.
Ports located inside ECAs share a belief that by 2025 about a quarter of the total fuel provided for ships
calling in would be LNG (see also Figure 25). This amount of LNG as declared by ports makes no distinction
between short sea and deep sea and it seems to be based purely on estimated demand by ships calling in,
on different routes.
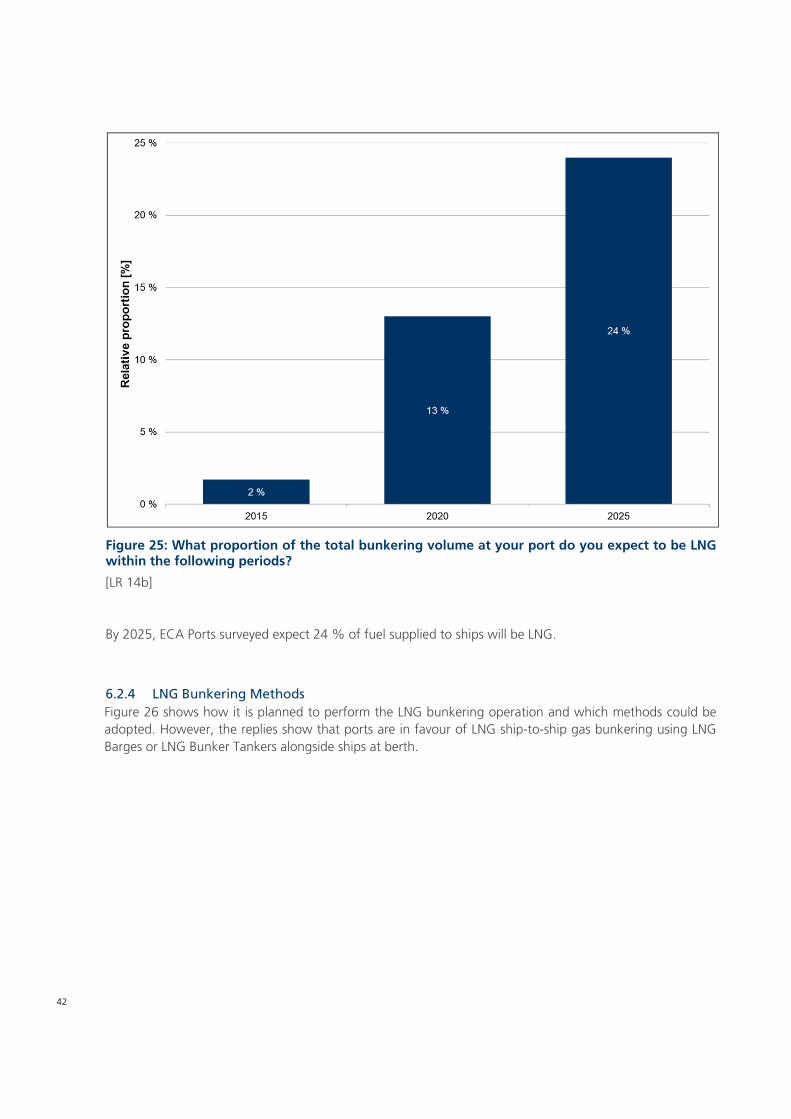
42
Figure 25: What proportion of the total bunkering volume at your port do you expect to be LNG within the following periods?
[LR 14b]
By 2025, ECA Ports surveyed expect 24 % of fuel supplied to ships will be LNG.
6.2.4 LNG Bunkering Methods
Figure 26 shows how it is planned to perform the LNG bunkering operation and which methods could be
adopted. However, the replies show that ports are in favour of LNG ship-to-ship gas bunkering using LNG
Barges or LNG Bunker Tankers alongside ships at berth.

MARIKO GmbH
Future Fuels – Options for Ship Owners & Operators study September 2014
43
Figure 26: Which kind of ships is best suited for receiving LNG as bunker at port?
[LR 14b]
The reply shows that any ship that demands LNG to be bunkered as fuel will be consider by the port as a
’suitable ship‘. In Figure 27 is shown which ship type would be most suitable for the LNG bunkering
process.

44
Figure 27 : Which ship types do you consider best suited for LNG bunkering at your port and why?
[LR 14b]
6.2.5 Drivers for worldwide adoption of LNG bunkering at ports
In the past a number of important drivers for ports to provide LNG have been identified, as the following
eight points sum up:
competition – other competitive bunkering ports along the trade route,
pricing – pricing of LNG fuel comparable to alternative fuel options,
location – location of the port relative to an ECA,
traffic – number of ship calls at the port,
infrastructure – provision of infrastructure and facilities for LNG bunkering,
LNG demand – demand from ship owners or suppliers for LNG bunkering,
public opinion – retain / develop a positive public perception of the port and
port significance – retain / attain the status of the port as a major bunker port
However, it turns out that today ports consider that economics and availability of LNG at the port are the
two most important factors to drive the adoption of LNG bunkering globally (see Figure 28). [LR 14b]
The two main factors are:
the price difference between LNG and the most available alternative fuel (possibly MDO) and

MARIKO GmbH
Future Fuels – Options for Ship Owners & Operators study September 2014
45
the port’s financial incentives / schemes for ships considered less pollutant or complying within
certain port’s parameters and standards of air quality.
Figure 28: What are the main factors that will help to attract the gas fuelled target fleet into your port?
[LR 14b]
In summary a comparison of the main drivers for ports is shown in the next Figure 29. The picture shows
how changes in the Port approach have been developed. It is very interesting to note that regulations
seems to now be considered by ports as a ’must‘ or a kind of ’homework‘ and not as a ’barrier‘ to the
adoption of LNG as fuel.
The deepest change of sentiment among ports today compared to 2011 survey is that the lack or difficulty
to provide fixed infrastructure for supplying gas at the port is not a barrier or main driver to adopt LNG as
marine fuel anymore.

46
Figure 29: Comparison of answers concerning the most important drivers to provide LNG bunkering infrastructure 2011 vs 2014
[LR 14b]
6.3 Exhaust Gas Treatment Systems
In 2012 a guideline was issued by Lloyd’s Register with the aim to provide an understanding of:
the different exhaust gas treatment technologies;
what to consider when deciding whether or not to install an exhaust gas treatment system; and
the practical challenges of installing and operating these systems on board ships.
The following chapters are an abstract of this guideline.
For the purposes of this chapter Exhaust Gas Treatment Systems (EGTS) are divided into SOx scrubbers and
NOx-reducing devices.
6.3.1 Flexibility
The operational flexibility is one of the benefits of EGTS . A SOx scrubber allows an operator to meet
emission limits by either using low-sulphur fuels or by using the SOx scrubber to clean the exhaust gas.
NOX-reducing devices will offer ships constructed after 1st January 2016 the flexibility to operate inside
NOx-ECA. [LR 12c]
MARIKO GmbH
Future Fuels – Options for Ship Owners & Operators study September 2014
47
6.3.2 The risk of non-compliance
Both should be considered, the likelihood and consequences of the failure of an EGTS when it is used to
comply with mandatory regulation.
The likelihood of failure will depend on the reliability of the system components and the redundancy
included in the system’s design. Building in redundancy reduces the likelihood that the system as a whole
will fail. For example, designing a wet SOx scrubber with three pumps each capable of meeting 50 % of the
washwater pump demand would allow the scrubber to continue to operate in the event of a single pump
failure. Other areas where redundancy can be built in include the exhaust gas and wash water monitoring
systems.
The consequences of an EGTS failure will depend on whether the ship can employ alternative means to
comply with the requirements. For example, in the event of a main engine SOx scrubber failing a ship may
be able to bypass the scrubber and use compliant fuel. If sufficient compliant fuel is to be used in the event
of a scrubber failure, it will need to be stored on board.
It is not yet apparent, how flag and port states will respond in the event that a ship cannot comply, but one
possible outcome would be to require the ship to sail to the nearest port until either the EGTS has been
fixed or an alternative method of compliance is available.
To understand the likelihood and consequences of a failure of an EGTS, will allow informed decisions to be
made on the amount of redundancy to be designed into the system. [LR 12c]
6.3.3 Backpressure
Within the technical specifications of their engines, engine manufacturers include a permitted range of
exhaust backpressures – operating outside this range may lead to accelerated wear, greatly reduced
maintenance intervals, reduced power and increased fuel consumption. Furthermore, an engine’s NOx
Technical File may also specify a range of permissible backpressures – operating outside this range will
invalidate the engine’s NOx approval.
EGTS intrinsically increase backpressure and system designers need to understand the impact of this on the
engine. If the backpressure is increased by the EGTS to a level outside allowable operating limits, it may be
reduced by adding an induced draft fan (ID fan) into the exhaust duct.
Build-up of deposits within the EGTS components (for example soot clogging of demisters or deposits on
selective catalytic reduction (SCR) catalysts) will increase backpressure while the ship is in operation.
If a cleaning is required will be indicated by monitoring the pressure differential across theEGTS. Some of
these deposits can present a significant health and safety risk to people entering the EGTS to carry out
maintenance and cleaning activities. [LR 12c]
6.3.4 EGTS bypass
An alternative path for the exhaust gas is provided by a bypass, so that it avoids the EGTS. The xxhaust gas
will pass through the EGTS, when the bypass is ‘closed’ and when it is ’open‘ the exhaust gas will exit the
ship without passing through the EGTS. Some wet SOx scrubbers are designed to ‘run dry’ whereas others
may be damaged if hot exhaust gas is passed through them while they are not operating. For systems not
designed to run dry, the bypass damper can be interlocked with the EGTS controls to provide a failsafe
protection.

48
Opening the bypass when the EGTS is not operating will prevent a build-up of soot and unburned
hydrocarbons within the system. When the bypass is open it might also be possible to undertake
maintenance of the EGTS while the associated engine(s) is running (although it should be taken care as the
bypass damper is not a secure means of isolating the EGTS chamber). [LR 12c]
6.3.5 Exhaust gas velocity
The exhaust gas may be slown by the introduction of EGTS and any cooling will slow it down further.
Consequently, to ensure the exhaust gas clears the ship, the exhaust duct outlet may have to be redesigned
to increase the velocity of the gas as it exits the funnel. This is particularly important for cruise ships and
ferries, but nevertheless relevant to all ships. It must be taken care to ensure that the resulting increase in
backpressure is acceptable. [LR 12c]
6.3.6 Integration of multiple combustion devices
A combination of the exhausts from a number of different combustion devices into a single EGTS is
possible. This may be necessary due to space restrictions, or simply to reduce the cost of the installation.
To combine exhausts is an uncommon practice within the marine industry where typically each engine has
its own independent intake and exhaust. Concerns arising from combining exhausts include:
backflow of exhaust gas into the exhaust duct of combustion devices that are not operating,
increased backpressure when two or more combustion devices are combined that have different
exhaust gas flow characteristics; and
designing the EGTS to operate effectively over a wide range of exhaust gas flow rates.
Dampers might be required for each exhaust to preclude the back flow of exhaust gas into the exhaust of
combustion devices that are not operating. To confirm that the backpressure on each device remains within
allowable limits, monitoring is required. [LR 12c]
6.3.7 Maintenance, crew training and workload
It is important to understand the impact of EGTS maintenance on system availability.The annual inspection
and cleaning of the SCR chamber for instance will result in the SCR system not being available for a period
of time. This may impact the possibility of the ship to operate in a NOx-ECA. The cleaning will either need
to be scheduled while the ship is operating in locations where the SCR system is not required or the ship
might have to be taken out of service.
Hazardous chemicals are used in a number of EGTS and adequate controls should be put in place to
protect ships’ staff. The generation of further hazardous chemicals and compounds (such as ammonium bi-
sulphate in SCR systems) is also a possible. These will require robust procedures and crew training, as well
as adequate signage and personal protective equipment.
Crew training should cover the normal operation of the EGTS, including bunkering of any chemicals
(consumables), calibration of sensors and routine maintenance, as well as the procedures to be followed in
case of system failure and deviation from normal operation.
The additional workload associated with system operation and maintenance should be assessed. In case it is
significant, measures may need to be implemented to prevent crew fatigue. [LR 12c]
MARIKO GmbH
Future Fuels – Options for Ship Owners & Operators study September 2014
49
6.4 SOx scrubbers
There are currently two main options for ship operators to meet SOx emission limits: using low-sulphur fuels
or using a SOx scrubber. The choice depends on a number of factors, including the cost of compliant low-
sulphur fuels, the Capital Expenditure (CAPEX) and operating expenditure (OPEX) of the SOx scrubber, and
the amount of time that the ship is expected to spend inside ECA-SOx.
The ‘ECA Calculator Comparison tool’ was developed by LR to help operators understand the costs
associated with different compliance options (see chapter 8).
6.4.1 SOx scrubber technologies
Currently there are two main types of SOx scrubber:
wet scrubbers that use water as the scrubbing medium; and
dry scrubbers that use a dry chemical.
Wet systems are further divided into:
‘open loop’ systems that use seawater,
‘closed loop’ systems that use fresh water with the addition of an alkaline chemical; and
‘hybrid’ systems, which can operate in both open loop and closed loop modes. [LR 12c]
6.4.2 Wet SOx scrubbers
Wet SOx scrubbing is a simple, effective technology which has been used in industrial applications for many
years and broadly comprise the following components:
a scrubber unit – a vessel or series of closely coupled components, which bring water into intimate
contact with the exhaust gas from one or more combustion units. The unit is typically mounted
high up in the ship in or around the funnel,
a treatment plant for conditioning of washwater before discharge overboard,
a residue handling facility for sludge separated from the washwater and
a scrubber control and emissions monitoring system.
Depending on the scrubber system configuration, these components will be interconnected by pipework
with various pumps, coolers and tanks. It is possible, that one piping system and washwater treatment
plantservices more than one scrubber. There will also be a monitoring and control system, with
instrumentation either dedicated to a single scrubber or shared across an integrated system.
Within wet SOx scrubbers there is a need to intimately mix washwater with the exhaust without creating a
backpressure that exceeds the combustion unit manufacturer’s limits and, if applicable, the engine’s NOx
certification limits. There are, however, incentives to make the scrubber unit as small as possible, as this will
reduce the space required for installation and will also reduce manufacturing costs. The design should
therefore make optimum use of the minimum practical washwater flow to dissolve sulphur oxides, to bring
emissions down to the required level while retaining sufficient buffering capacity. Too little effective flow,
mixing or alkalinity and the required reduction in SOx is not achieved, otherwise too much water is
inefficient in terms of pumping power and component size and weight.
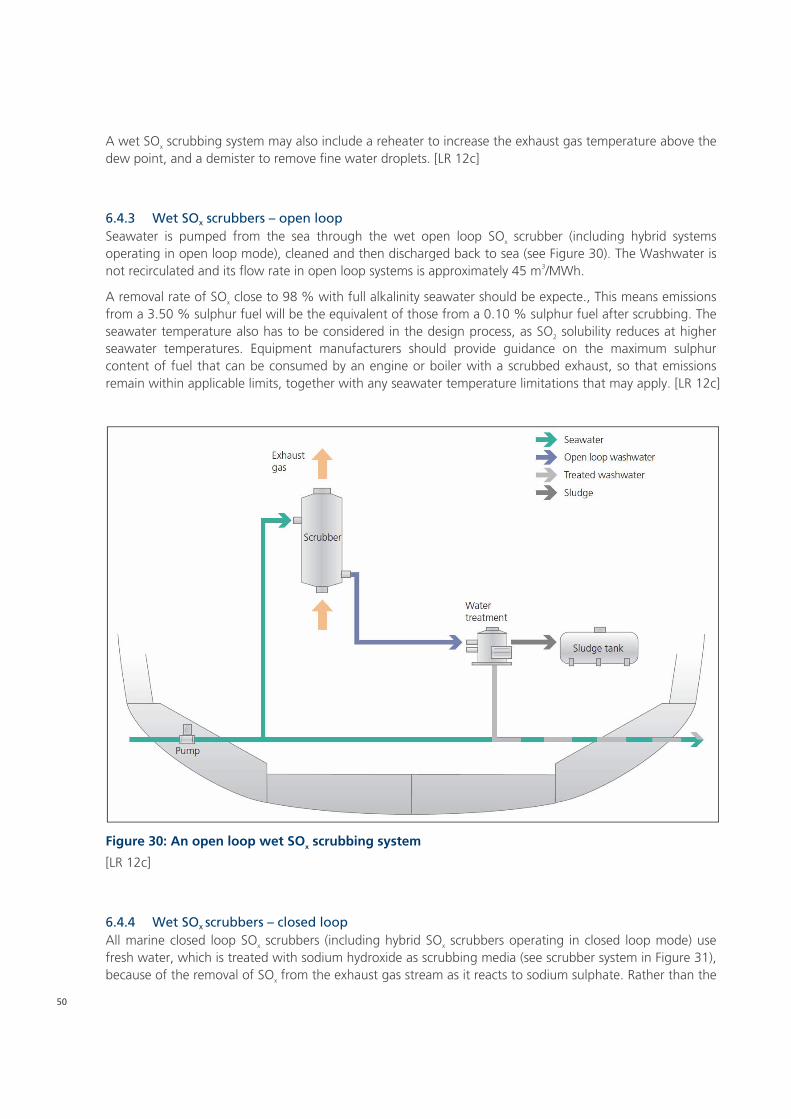
50
A wet SOx scrubbing system may also include a reheater to increase the exhaust gas temperature above the
dew point, and a demister to remove fine water droplets. [LR 12c]
6.4.3 Wet SOx scrubbers – open loop
Seawater is pumped from the sea through the wet open loop SOx scrubber (including hybrid systems
operating in open loop mode), cleaned and then discharged back to sea (see Figure 30). The Washwater is
not recirculated and its flow rate in open loop systems is approximately 45 m3/MWh.
A removal rate of SOx close to 98 % with full alkalinity seawater should be expecte., This means emissions
from a 3.50 % sulphur fuel will be the equivalent of those from a 0.10 % sulphur fuel after scrubbing. The
seawater temperature also has to be considered in the design process, as SO2 solubility reduces at higher
seawater temperatures. Equipment manufacturers should provide guidance on the maximum sulphur
content of fuel that can be consumed by an engine or boiler with a scrubbed exhaust, so that emissions
remain within applicable limits, together with any seawater temperature limitations that may apply. [LR 12c]
Figure 30: An open loop wet SOx scrubbing system
[LR 12c]
6.4.4 Wet SOx scrubbers – closed loop
All marine closed loop SOx scrubbers (including hybrid SO
x scrubbers operating in closed loop mode) use
fresh water, which is treated with sodium hydroxide as scrubbing media (see scrubber system in Figure 31),
because of the removal of SOx from the exhaust gas stream as it reacts to sodium sulphate. Rather than the

MARIKO GmbH
Future Fuels – Options for Ship Owners & Operators study September 2014
51
once-through flow of an open loop scrubber, the washwater from a closed loop scrubber passes into a
process tank to becleaned before being recirculated.
The control of pH by dosing with sodium hydroxide enables the washwater circulation rate and therefore
power consumption to be about half that of open loop systems at approximately 20 m3/MWh and between
0.5 – 1 % of the power of the engine being scrubbed. Closed loop systems can also be operated when the
ship is in enclosed waters where the alkalinity would be too low for open loop operation. [LR 12c]
Figure 31: A closed loop wet SOx scrubbing system
[LR 12c]
To reduce the concentration of sodium sulphate, closed loop systems discharge small quantities of treated
washwater. If uncontrolled, the formation of sodium sulphate crystals will lead to progressive degradation
of the washwater system. Information from scrubber manufacturers suggests that the washwater discharge
rate is approximately 0.1 m3/MWh.
The rate of fresh water replenishment to the system is not only dependent on the discharge to sea but also
losses to the exhaust through evaporation and via the washwater treatment plant. The rate of evaporation
is influenced by exhaust and scrubbing water temperatures, which in turn are governed by factors such as
engine load and the temperature of the seawater supply to the system coolers. Some of the water vapour
incorporated within the exhaust may be captured after the scrubber and reused to reduce fresh water
consumption.
Closed loop systems can operate in zero discharge mode for a period of time, with the addition of a
washwater holding tank (the exact length of time depends on the size of the holding tank). This flexibility is
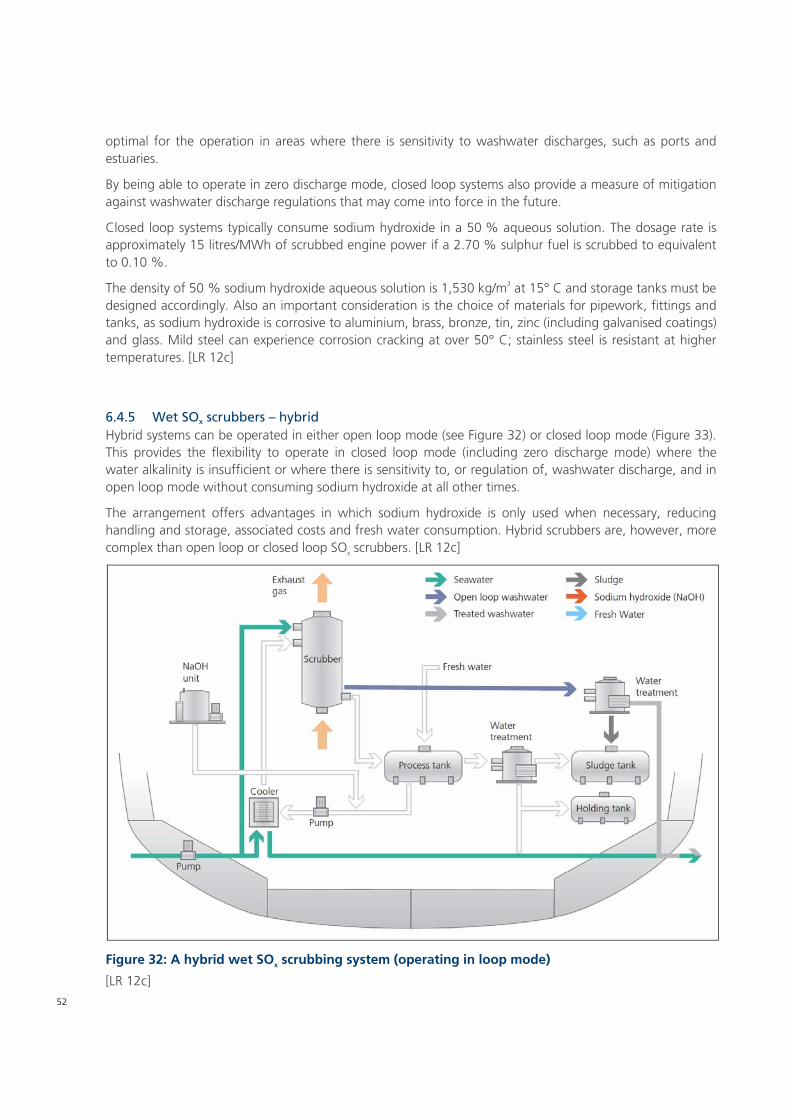
52
optimal for the operation in areas where there is sensitivity to washwater discharges, such as ports and
estuaries.
By being able to operate in zero discharge mode, closed loop systems also provide a measure of mitigation
against washwater discharge regulations that may come into force in the future.
Closed loop systems typically consume sodium hydroxide in a 50 % aqueous solution. The dosage rate is
approximately 15 litres/MWh of scrubbed engine power if a 2.70 % sulphur fuel is scrubbed to equivalent
to 0.10 %.
The density of 50 % sodium hydroxide aqueous solution is 1,530 kg/m3 at 15° C and storage tanks must be
designed accordingly. Also an important consideration is the choice of materials for pipework, fittings and
tanks, as sodium hydroxide is corrosive to aluminium, brass, bronze, tin, zinc (including galvanised coatings)
and glass. Mild steel can experience corrosion cracking at over 50° C; stainless steel is resistant at higher
temperatures. [LR 12c]
6.4.5 Wet SOx scrubbers – hybrid
Hybrid systems can be operated in either open loop mode (see Figure 32) or closed loop mode (Figure 33).
This provides the flexibility to operate in closed loop mode (including zero discharge mode) where the
water alkalinity is insufficient or where there is sensitivity to, or regulation of, washwater discharge, and in
open loop mode without consuming sodium hydroxide at all other times.
The arrangement offers advantages in which sodium hydroxide is only used when necessary, reducing
handling and storage, associated costs and fresh water consumption. Hybrid scrubbers are, however, more
complex than open loop or closed loop SOx scrubbers. [LR 12c]
Figure 32: A hybrid wet SOx scrubbing system (operating in loop mode)
[LR 12c]

MARIKO GmbH
Future Fuels – Options for Ship Owners & Operators study September 2014
53
Figure 33: A hybrid wet SOx scrubbing system (operating in closed loop mode)
[LR 12c]
6.4.6 Dry SOx scrubbers
Dry SOx scrubbers (see Figure 34) have been widely used in land-based industry since the 1970s. Basic
components are:
A scrubber unit, in this case an ‘absorber’, which brings the exhaust gas from one or more
combustion units into contact with calcium hydroxide granules. Unlike the majority of wet
scrubbers, the exhaust gas entry is perpendicular to the vertical downward flow of the scrubbing
medium. Dry scrubbers can be positioned before waste heat recovery and SCR equipment, because
no heat is removed from the exhaust gas during scrubbing.
A granule supply silo and screw conveyor for discharge, which is positioned at the top and bottom
of the absorber respectively. A pneumatic conveyor system enables granules to be transported
from and returned to on board storage facilities. The use of flexible pipework facilitates the storage
of granules at various locations on board.
A scrubber control and emission monitoring system. The removal ofused granules and any exhaust-
related PM is an automated process and may either be continuous or intermittent to ensure the
correct flow of fresh granules under gravity down through the absorber.
Dry scrubbers typically operate at exhaust temperatures between 240° C and 450° C. Calcium hydroxide
granules (Ca(OH)2) are between 2 and 8 mm in diameter with a very high surface area to maximise contact
with the exhaust gas and react within the absorber with sulphur oxides to form gypsum(CaSO4·2H
2O).

54
Trials on a 3.6 MW engine using up to 1.80 % sulphur content fuel are reported to show a 99 % and 80 %
reduction in SO2 and PM emissions respectively. It should be noted that the PM reduction was tested
according to DIN51402.
The filter is assessed either visually or by photometer, which compares the intensity of reflected light with
that from the original light source, enabling a smoke number to be derived by a standard conversion
procedure.
To reduce SOx emissions to those equivalent to fuel with a 0.10 % sulphur content, a typical marine engine
using RFO with a 2.70 % sulphur content would consume calcium hydroxide granules at a rate of
40 kg/MWh and, based on a density of 800 kg/m3, the volume of granulate required would be
approximately 0.05 m3/MWh (i.e., a 20 MW engine would require approximately 19 tonnes of granulate
per day with a volume of 24 m3).
Electrical power consumption is lower than for wet systems at approximately 0.15 – 0.20 % of the power
of the engine being scrubbed.
Consumables have to be stored and handled. Used granules must also be stored before disposal ashore.
The scrubber manufacturer can co-ordinate the logistics of supplying, removing and disposing of granulate.
Fresh granules can be supplied to the ship by silo road tankers fitted with pneumatic delivery systems or in
‘Big Bags’ to smaller ships.
The chemical is classed as harmful to eye and skin and the inhalation of dust should be avoided. Although
calcium hydroxide has hazardous properties, it is considerably less hazardous than 50 % aqueoussodium
hydroxide solutions typically used in wet scrubbing systems.
While dry scrubbing does not reduce NOx emissions by itself, it is ideally suited for use in conjunction with
SCR systems.
An optional downstream fan can be fitted so that the engine is not subject to excessive backpressure and
the complete arrangement can be bypassed. [LR 12c]
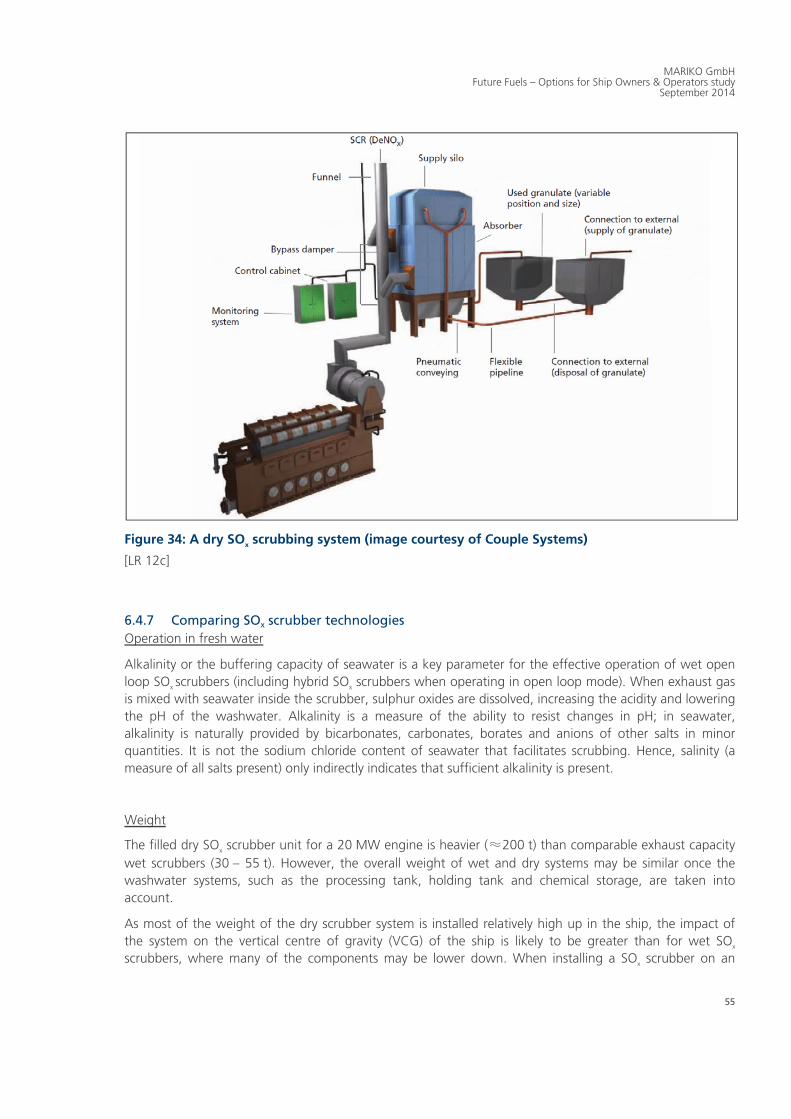
MARIKO GmbH
Future Fuels – Options for Ship Owners & Operators study September 2014
55
Figure 34: A dry SOx scrubbing system (image courtesy of Couple Systems)
[LR 12c]
6.4.7 Comparing SOx scrubber technologies
Operation in fresh water
Alkalinity or the buffering capacity of seawater is a key parameter for the effective operation of wet open
loop SOx scrubbers (including hybrid SO
x scrubbers when operating in open loop mode). When exhaust gas
is mixed with seawater inside the scrubber, sulphur oxides are dissolved, increasing the acidity and lowering
the pH of the washwater. Alkalinity is a measure of the ability to resist changes in pH; in seawater,
alkalinity is naturally provided by bicarbonates, carbonates, borates and anions of other salts in minor
quantities. It is not the sodium chloride content of seawater that facilitates scrubbing. Hence, salinity (a
measure of all salts present) only indirectly indicates that sufficient alkalinity is present.
Weight
The filled dry SOx scrubber unit for a 20 MW engine is heavier (≈200 t) than comparable exhaust capacity
wet scrubbers (30 – 55 t). However, the overall weight of wet and dry systems may be similar once the
washwater systems, such as the processing tank, holding tank and chemical storage, are taken into
account.
As most of the weight of the dry scrubber system is installed relatively high up in the ship, the impact of
the system on the vertical centre of gravity (VCG) of the ship is likely to be greater than for wet SOx
scrubbers, where many of the components may be lower down. When installing a SOx scrubber on an

56
existing ship, the resulting change in lightship weight and/or VCG may necessitate the revision of the ship’s
stability manuals.
Power consumption
The washwater flow rate in an open loop SOx scrubbers higher (≈45 m
3/MWh) than a closed loop SO
x
scrubber(≈20 m3/MWh) because the buffering capacity of seawater is less than the buffering capacity of
freshwater dosed with sodium hydroxide.
Consequently, open loop SOx scrubbers require larger pumps and have higher power requirements. The
power requirement of dry SOx scrubber systems is mainly associated with a screw conveyor that moves the
calcium hydroxide granules through the scrubber unit (known as an absorber). The power required is
therefore significantly less than for wet SOx scrubbers. The energy consumption associated with SO
x
scrubbers does not adversely impact a ship’s attained EEDI value as, for almost all conventional cargo ships,
the auxiliary power consumption will be calculated as a fixed proportion of the installed main engine power,
and is unrelated to the actual auxiliary power consumption. However, if the installation of the system
reduces cargo carrying capacity then the EEDI will be affected.
PM removal
SOx scrubbers can be an effective means of reducing PM, both indirectly by removal of SO
x and by direct
mechanical cleaning when particles come into direct contact with either washwater or chemical granules.
SOx scrubber manufacturers typically claim between 70 % and 90 % removal rates. The sulphates, which
make a significant contribution to PM, are formed post-combustion in the exhaust plume. Oxidation of SO2,
followed by further oxidation and condensation processes, contributes to the growth of complex particles
after the cylinder and the majority of sulphates form in reactions after release from the stack.
Attenuation of engine noise
SOx scrubbers are commonly installed in the place of the silencer when converting existing ships. Equipment
manufacturers have differing views on the attenuation that their equipment might provide. For wet SOx
scrubbers this attenuation will change depending on whether or not the SOx scrubber is in operation.
The energy consumption will affect any operational energy efficiency key performance indicators that
include actual energy consumption of auxiliary systems, such as the Energy Efficiency Operational Indicator.
Compatibility with waste heat recovery units and SCR systems
All wet SOx scrubbers significantly cool the exhaust gas and are therefore not suitable for installation before
a waste heat recovery unit. For the same reason, it would not be possible to install a wet SOx scrubber
before an SCR system unless a reheater was fitted after the wet scrubber to raise the exhaust gas
temperature back up to around 300° C – the temperature required for SCR systems to work effectively.
Dry SOx scrubbers do not cool the exhaust gas so they are suitable for installation before both waste heat
recovery units and SCR systems.
See also in Table 10 the comparison of the different scrubber technologies. [LR 12c]
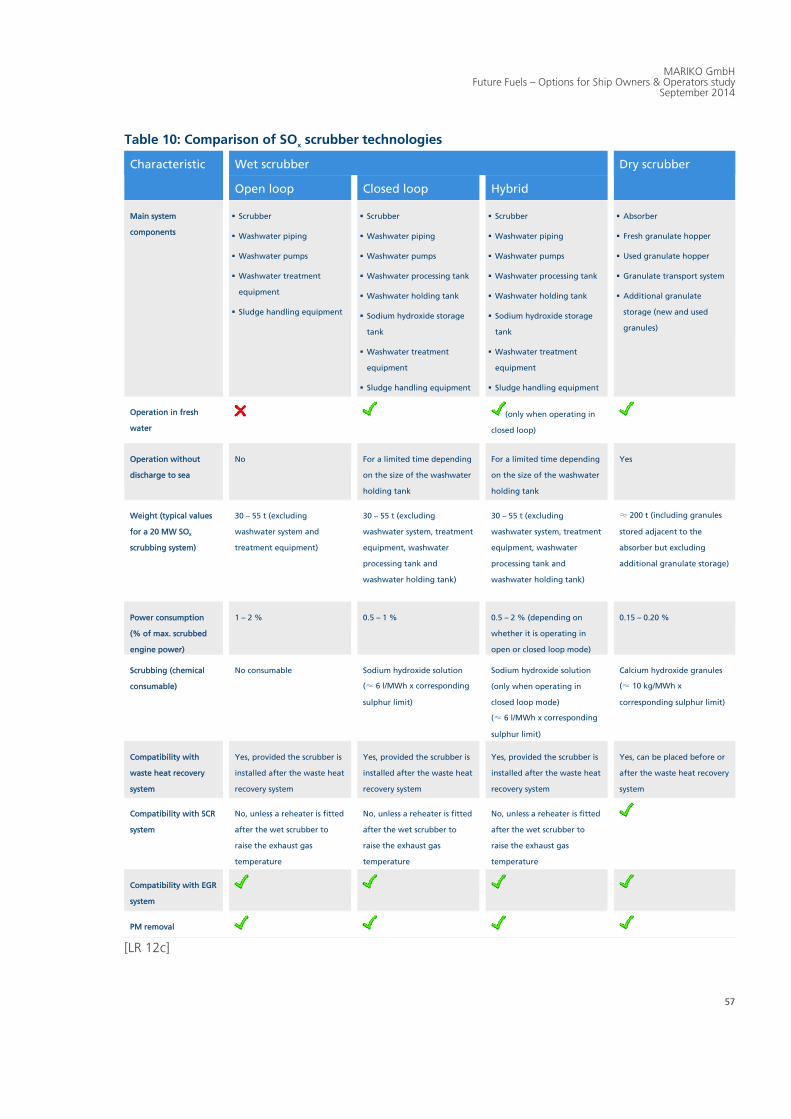
MARIKO GmbH
Future Fuels – Options for Ship Owners & Operators study September 2014
57
Table 10: Comparison of SOx scrubber technologies
Characteristic Wet scrubber Dry scrubber
Open loop Closed loop Hybrid
Main system
components
Scrubber
Washwater piping
Washwater pumps
Washwater treatment
equipment
Sludge handling equipment
Scrubber
Washwater piping
Washwater pumps
Washwater processing tank
Washwater holding tank
Sodium hydroxide storage
tank
Washwater treatment
equipment
Sludge handling equipment
Scrubber
Washwater piping
Washwater pumps
Washwater processing tank
Washwater holding tank
Sodium hydroxide storage
tank
Washwater treatment
equipment
Sludge handling equipment
Absorber
Fresh granulate hopper
Used granulate hopper
Granulate transport system
Additional granulate
storage (new and used
granules)
Operation in fresh
water
(only when operating in
closed loop)
Operation without
discharge to sea
No For a limited time depending
on the size of the washwater
holding tank
For a limited time depending
on the size of the washwater
holding tank
Yes
Weight (typical values
for a 20 MW SOx
scrubbing system)
30 – 55 t (excluding
washwater system and
treatment equipment)
30 – 55 t (excluding
washwater system, treatment
equipment, washwater
processing tank and
washwater holding tank)
30 – 55 t (excluding
washwater system, treatment
equipment, washwater
processing tank and
washwater holding tank)
≈ 200 t (including granules
stored adjacent to the
absorber but excluding
additional granulate storage)
Power consumption
(% of max. scrubbed
engine power)
1 – 2 % 0.5 – 1 % 0.5 – 2 % (depending on
whether it is operating in
open or closed loop mode)
0.15 – 0.20 %
Scrubbing (chemical
consumable)
No consumable Sodium hydroxide solution
(≈ 6 l/MWh x corresponding
sulphur limit)
Sodium hydroxide solution
(only when operating in
closed loop mode)
(≈ 6 l/MWh x corresponding
sulphur limit)
Calcium hydroxide granules
(≈ 10 kg/MWh x
corresponding sulphur limit)
Compatibility with
waste heat recovery
system
Yes, provided the scrubber is
installed after the waste heat
recovery system
Yes, provided the scrubber is
installed after the waste heat
recovery system
Yes, provided the scrubber is
installed after the waste heat
recovery system
Yes, can be placed before or
after the waste heat recovery
system
Compatibility with SCR
system
No, unless a reheater is fitted
after the wet scrubber to
raise the exhaust gas
temperature
No, unless a reheater is fitted
after the wet scrubber to
raise the exhaust gas
temperature
No, unless a reheater is fitted
after the wet scrubber to
raise the exhaust gas
temperature
Compatibility with EGR
system
PM removal
[LR 12c]
58
7. Which way to go?
Various studies have been conducted to address the question of which the optimum solution for meeting
the ECA compliance requirements could be. Appearently the outcome of each study is somehow related to
the interst of authors. At present methanol as fuel is outside scope of any comparison studies as the
technology is not ready available.
This chapter gives a brief overview of two different studies dealing with the evaluation of ECA compliance
strategies.
Basically the decision for a compliance strategy is dominated by three parameters:
The share of operation inside ECA
Price difference between LNG and HFO
CAPEX and operational costs for scrubber, engine conversion & LNG tank systems
Which party is covering the operational expenditure and which one is investing the capital?
Not to forget, a ship operator’s decision to fit a scrubber may be less dependent on the business case and
more on the confidence that the system will perform as intended and ensure a continuous and reliable
operation.
7.1 Costs and benefits of LNG as fuel for Container vessels
A study on container vessels of five different sizes has been conducted by Germanischer Lloyd together
with MAN in 2011. In result the study generally promotes LNG as fuel. The comparison is based on a
baseline reference ship operated on HFO. As the container ship reference vessels evaluated in the Lower
Saxony fleet statistics are comparable in size to a 2,500 TEU container ship, only results for this ship size are
shown in the following brief summary. [GL 11]
The cost comparison model assumes that the fuel with the lowest cost is always used. Space required by
the technologies is taken into account by reducing the benefit. Four technology variants were investigated
in the study:
Exhaust gas cleaning by ‘scrubber’
Scrubber plus Waste Heat Recovery (WHR)
LNG system (bunker station, tank, gas preparation, gas line, dual-fuel engines)
LNG system plus WHR
Running on distillate fuels for a long period of time is the straightforward solution to comply with the
forthcoming emissions regulations on maximum allowable sulphur content in the fuel oil. The fuel system
needs to be fitted with a cooler or a chiller arrangement to meet the fuel viscosity requirements for a safe
operation.
The study assumes usage of wet scrubber systems to reduce SOx emissions by scrubbing the exhaust gas
from the engines with seawater in its primary operation mode. The operating costs, depending on
operation time and engine loads, has been assumed at an average cost of 5 $ / MWh. Other operation
costs such as crew spare parts and maintenance are assumed to be 20 % higher than on vessels without a
scrubber.
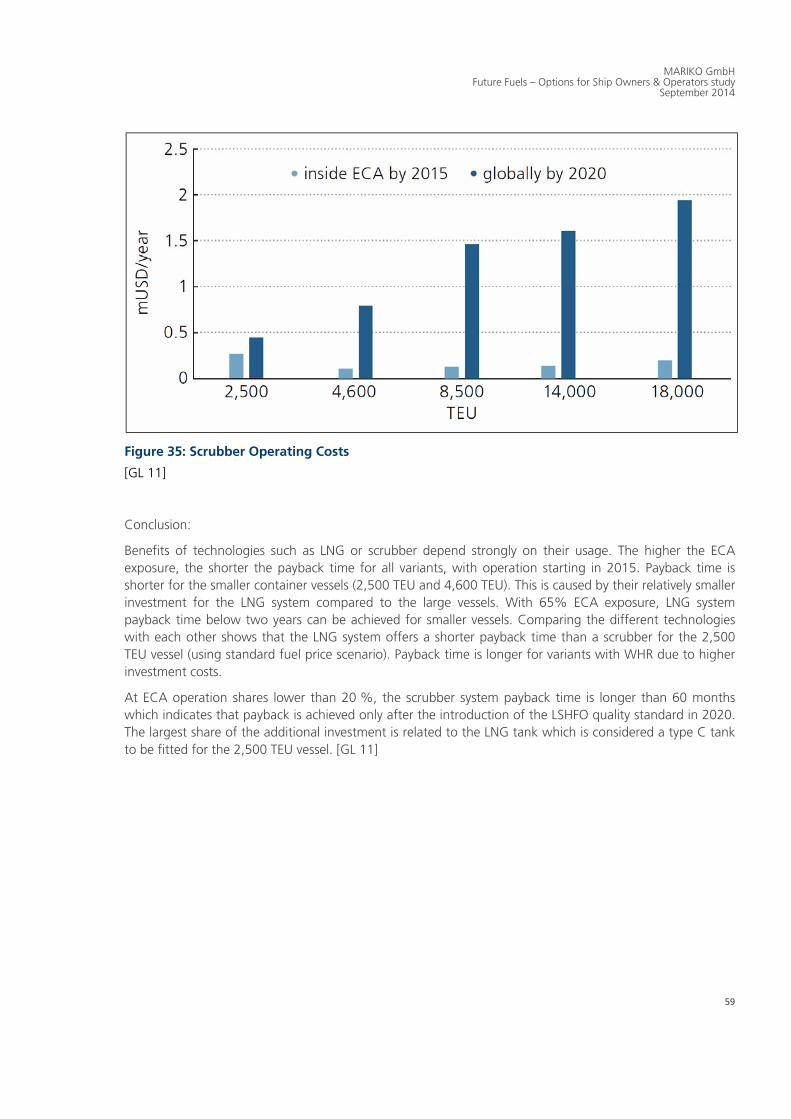
MARIKO GmbH
Future Fuels – Options for Ship Owners & Operators study September 2014
59
Figure 35: Scrubber Operating Costs
[GL 11]
Conclusion:
Benefits of technologies such as LNG or scrubber depend strongly on their usage. The higher the ECA
exposure, the shorter the payback time for all variants, with operation starting in 2015. Payback time is
shorter for the smaller container vessels (2,500 TEU and 4,600 TEU). This is caused by their relatively smaller
investment for the LNG system compared to the large vessels. With 65% ECA exposure, LNG system
payback time below two years can be achieved for smaller vessels. Comparing the different technologies
with each other shows that the LNG system offers a shorter payback time than a scrubber for the 2,500
TEU vessel (using standard fuel price scenario). Payback time is longer for variants with WHR due to higher
investment costs.
At ECA operation shares lower than 20 %, the scrubber system payback time is longer than 60 months
which indicates that payback is achieved only after the introduction of the LSHFO quality standard in 2020.
The largest share of the additional investment is related to the LNG tank which is considered a type C tank
to be fitted for the 2,500 TEU vessel. [GL 11]
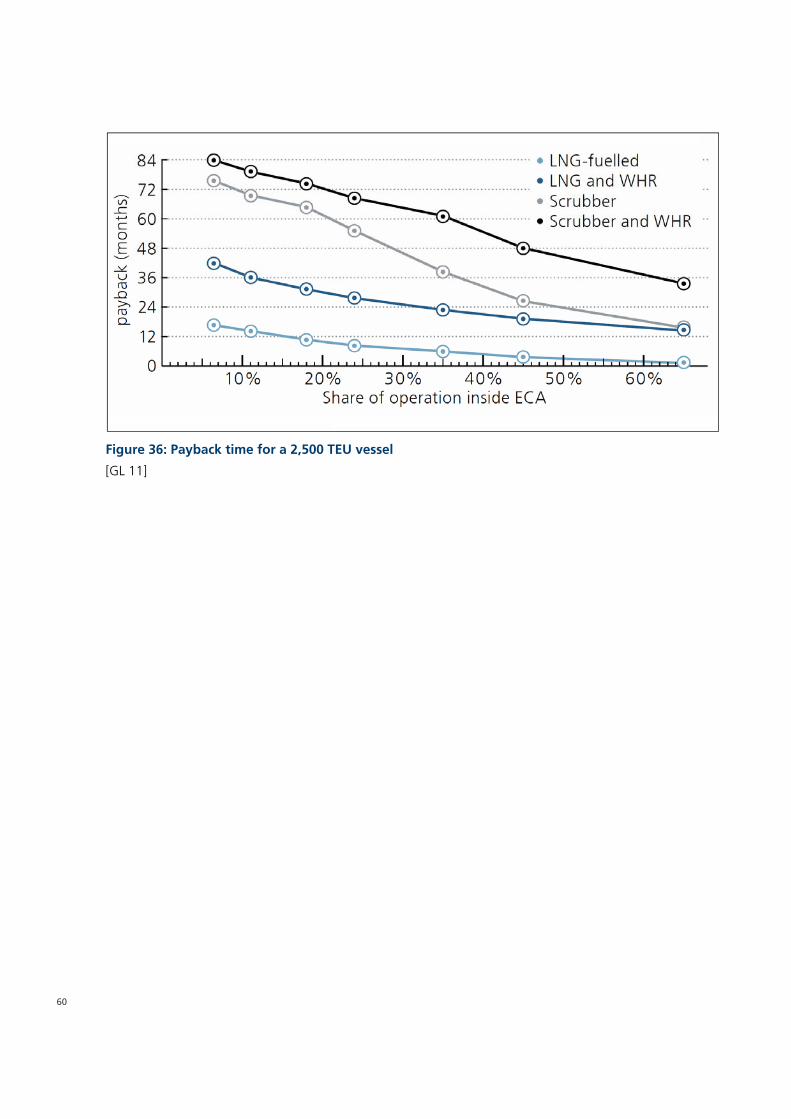
60
Figure 36: Payback time for a 2,500 TEU vessel
[GL 11]
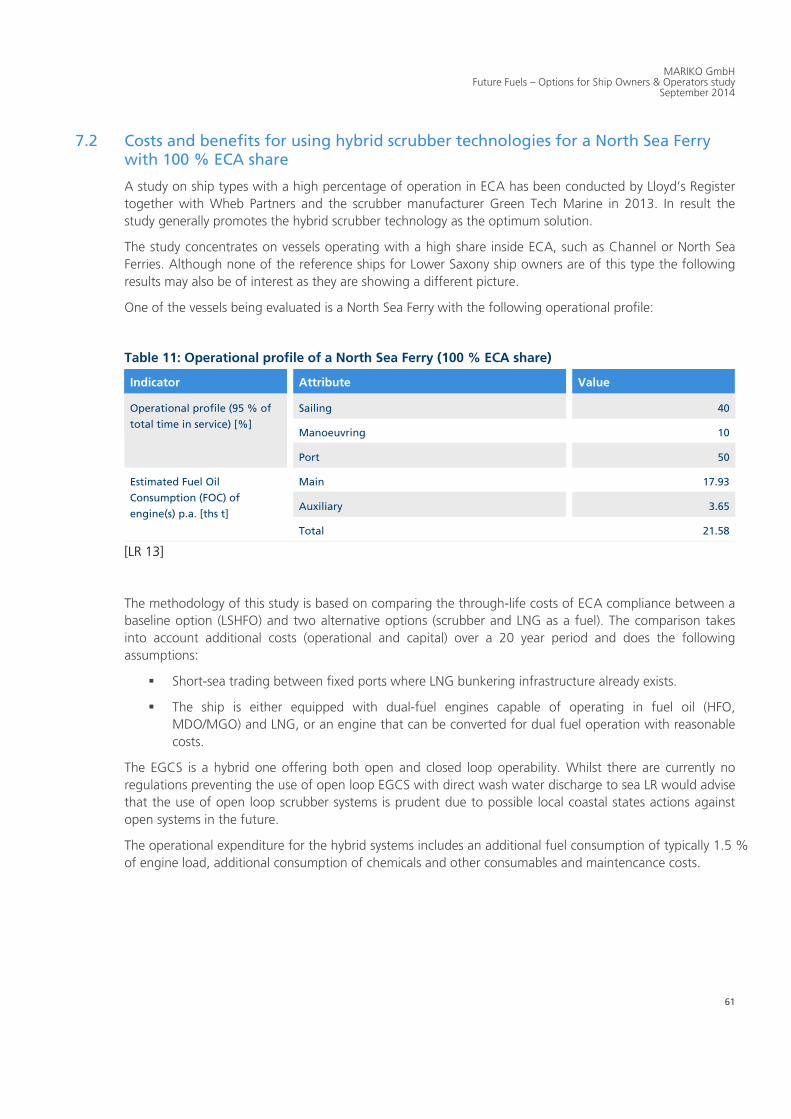
MARIKO GmbH
Future Fuels – Options for Ship Owners & Operators study September 2014
61
7.2 Costs and benefits for using hybrid scrubber technologies for a North Sea Ferry with 100 % ECA share
A study on ship types with a high percentage of operation in ECA has been conducted by Lloyd’s Register
together with Wheb Partners and the scrubber manufacturer Green Tech Marine in 2013. In result the
study generally promotes the hybrid scrubber technology as the optimum solution.
The study concentrates on vessels operating with a high share inside ECA, such as Channel or North Sea
Ferries. Although none of the reference ships for Lower Saxony ship owners are of this type the following
results may also be of interest as they are showing a different picture.
One of the vessels being evaluated is a North Sea Ferry with the following operational profile:
Table 11: Operational profile of a North Sea Ferry (100 % ECA share)
Indicator Attribute Value
Operational profile (95 % of
total time in service) [%]
Sailing 40
Manoeuvring 10
Port 50
Estimated Fuel Oil
Consumption (FOC) of
engine(s) p.a. [ths t]
Main 17.93
Auxiliary 3.65
Total 21.58
[LR 13]
The methodology of this study is based on comparing the through-life costs of ECA compliance between a
baseline option (LSHFO) and two alternative options (scrubber and LNG as a fuel). The comparison takes
into account additional costs (operational and capital) over a 20 year period and does the following
assumptions:
Short-sea trading between fixed ports where LNG bunkering infrastructure already exists.
The ship is either equipped with dual-fuel engines capable of operating in fuel oil (HFO,
MDO/MGO) and LNG, or an engine that can be converted for dual fuel operation with reasonable
costs.
The EGCS is a hybrid one offering both open and closed loop operability. Whilst there are currently no
regulations preventing the use of open loop EGCS with direct wash water discharge to sea LR would advise
that the use of open loop scrubber systems is prudent due to possible local coastal states actions against
open systems in the future.
The operational expenditure for the hybrid systems includes an additional fuel consumption of typically 1.5 %
of engine load, additional consumption of chemicals and other consumables and maintencance costs.
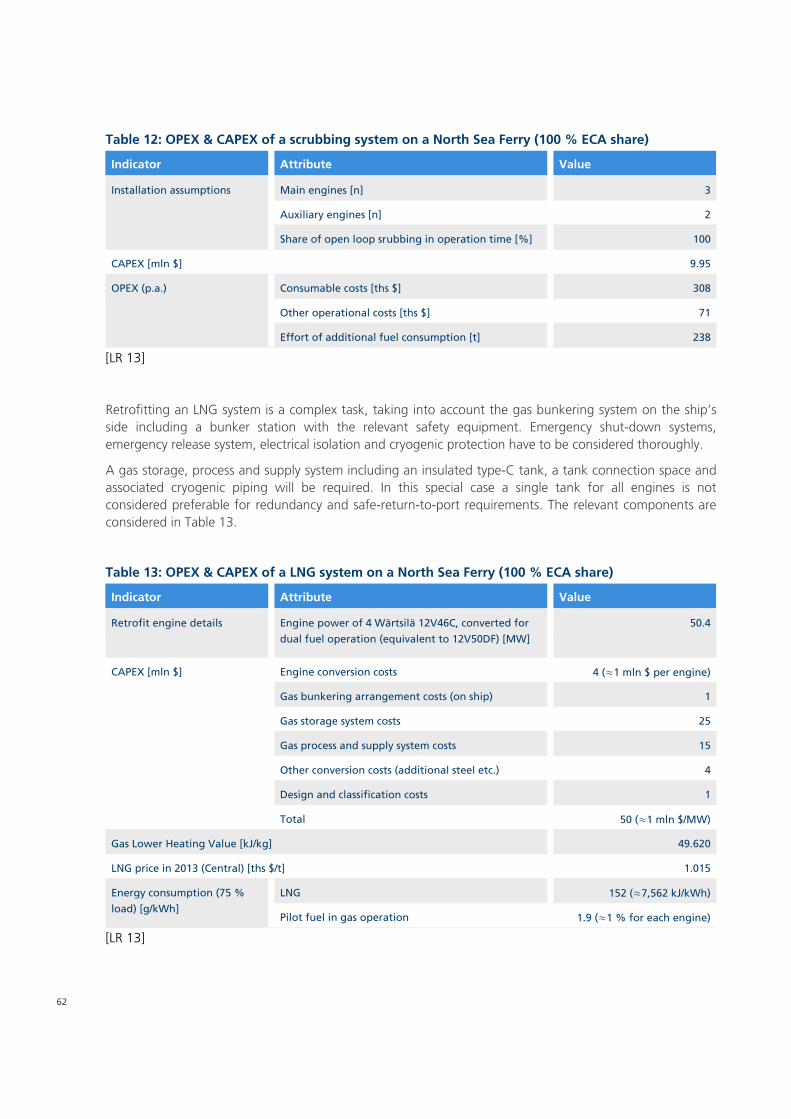
62
Table 12: OPEX & CAPEX of a scrubbing system on a North Sea Ferry (100 % ECA share)
Indicator Attribute Value
Installation assumptions Main engines [n] 3
Auxiliary engines [n] 2
Share of open loop srubbing in operation time [%] 100
CAPEX [mln $] 9.95
OPEX (p.a.) Consumable costs [ths $] 308
Other operational costs [ths $] 71
Effort of additional fuel consumption [t] 238
[LR 13]
Retrofitting an LNG system is a complex task, taking into account the gas bunkering system on the ship’s
side including a bunker station with the relevant safety equipment. Emergency shut-down systems,
emergency release system, electrical isolation and cryogenic protection have to be considered thoroughly.
A gas storage, process and supply system including an insulated type-C tank, a tank connection space and
associated cryogenic piping will be required. In this special case a single tank for all engines is not
considered preferable for redundancy and safe-return-to-port requirements. The relevant components are
considered in Table 13.
Table 13: OPEX & CAPEX of a LNG system on a North Sea Ferry (100 % ECA share)
Indicator Attribute Value
Retrofit engine details Engine power of 4 Wärtsilä 12V46C, converted for
dual fuel operation (equivalent to 12V50DF) [MW]
50.4
CAPEX [mln $] Engine conversion costs 4 (≈1 mln $ per engine)
Gas bunkering arrangement costs (on ship) 1
Gas storage system costs 25
Gas process and supply system costs 15
Other conversion costs (additional steel etc.) 4
Design and classification costs 1
Total 50 (≈1 mln $/MW)
Gas Lower Heating Value [kJ/kg] 49.620
LNG price in 2013 (Central) [ths $/t] 1.015
Energy consumption (75 %
load) [g/kWh]
LNG 152 (≈7,562 kJ/kWh)
Pilot fuel in gas operation 1.9 (≈1 % for each engine)
[LR 13]

MARIKO GmbH
Future Fuels – Options for Ship Owners & Operators study September 2014
63
Conclusion:
Notwithstanding various assumptions and uncertainties in any analysis of this kind the result of this study
shows that the scrubber retrofit option is an attractive commercial proposition compared to operation in
low sulphur fuel. In ships with high compliance costs due to continuous ECA operation the payback period
is general around three years.
Assuming that MGO costs are not likely to reduce and considering the very high upfront capital cost
required for an LNG conversion, the scrubber option has advantages in financial terms. For the newbuild
market, although an LNG-fuelled ship may be less costly compared to a conversion, the total construction
cost is still much higher compared to an equivalent new built ship fitted with scrubbers.
LNG as a fuel is claimed to be a NOx Tier III solution as opposed to scrubbers where additional abatement
technologies are still required. This is only partially true as high pressure 2-stroke dual fuel engines
(propulsion for large cargo vessels) are presently, not Tier III compliant. Furthermore NOx Tier III compliance
is only required for new ships built after 2016 and for operation in North America ECA. Therefore, this
advantage offered by LNG applies to a very limited market size compared to scrubbers. [LR 13]
Figure 37: Payback time North Sea Ferry
[LR 13]

64
7.3 Two examples for costs and benefits for Lower Saxony fleet vessels using scrubber technologies
A cost comparison for two reference vessels of the Lower Saxony fleet has been conducted to encounter
the costs and benefits related to the retrofitting of a scrubber system in relation to the use of clean fuels.
The results have been evaluated with the ECA calculator tool, a Microsft Excel based calculation tool for the
evaluation of costs and strategic planning related to future sulphur oxide compliance
For comparison purpose we have investigated in a small general cargo vessel operating in the Baltic Sea
and Northern Europe over 100% inside the ECA and a medium size bulk carrier operating on all major
trading routes with a SECA share of one third.
The operational trading patern concerned include aspects of sailing time and habour time with use of
main/auxiliary engine with different machinery rating. The global sulphur content restriction for 0.5%S has
been assumed by the year 2020.
The general cargo vessel is currently using low sulphur fuel oils with a sulphur content of 1%. For
compliance with the 2015 SECA requirement of 0.1% the vessel will have to use Marine Gas Oil or install a
scrubber system. In this case a closed loop wet scrubber system has concluded as the appropriate system as
further national environmental constrains for open loop scrubber systems are expected in the Baltic and
North Sea neighbouring countries.
The bulk carrier is using heavy fuel oil with a sulphur content of 3.5%. The vessel will have to switch to
Marine Gas Oil (0.1%S) when operating in a SECA after 2015 and to Marine Diesel Oil (0.5%S) when
operating elsewhere after 2020. Alternatively a scrubber system need to be re-fitted. In this case a hybrid
system has been chosen, operating 50% of the time in closed loop mode in order to include additional
costs for consumables.
The input parameter for the two reference vessels are as described in the following tables.
For the purpose of this cost analysis the fuels have been defined as shown in table. The fuel price scenario
has been assumed with a year-on-year 1% differential increase between MGO/MDO and HFO in line
chapter 4.
Table 14: Fuel types used in the comparison
Type of fuel Abbreviation Price in 2014 [USD/tonne]
Heavy Fuel Oil, 3.5% S IFO380 570
Low Sulphur Fuel Oil, 1.0% S LS380 660
Marine Diesel Oil, 0.5% S MDO 820
Marine Gas Oil, 0.1% S MGO 835
[Own evaluation]
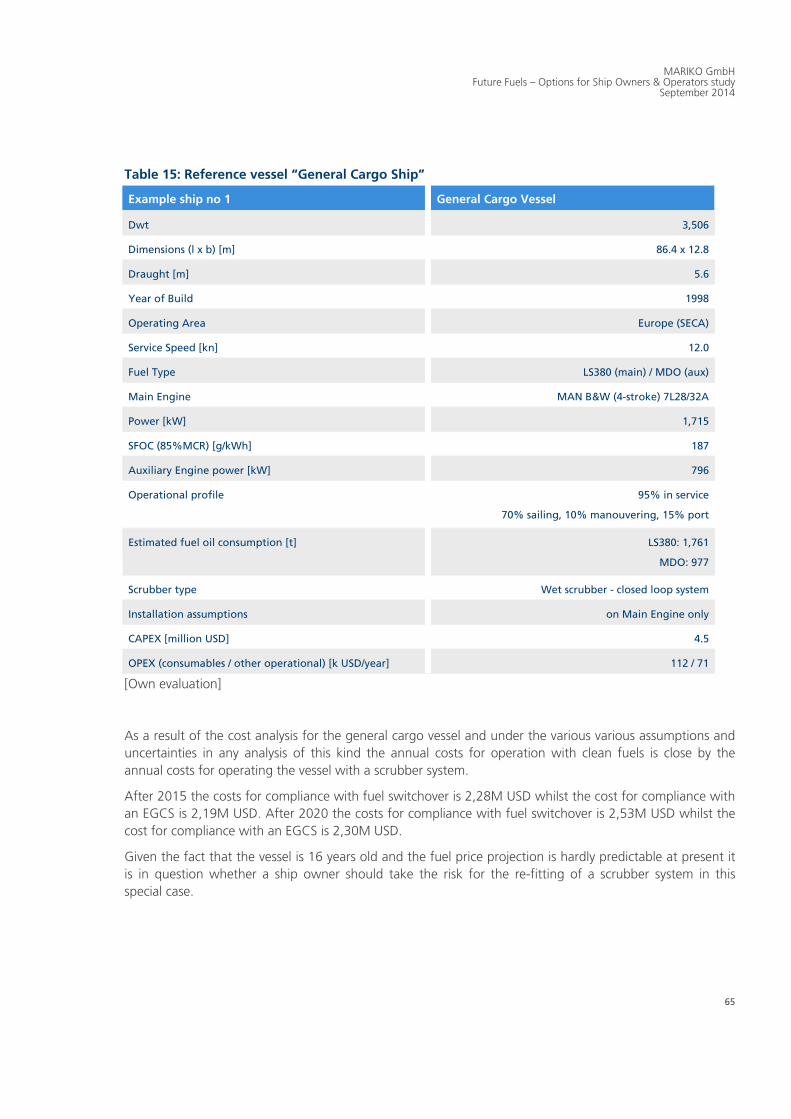
MARIKO GmbH
Future Fuels – Options for Ship Owners & Operators study September 2014
65
Table 15: Reference vessel “General Cargo Ship”
Example ship no 1 General Cargo Vessel
Dwt 3,506
Dimensions (l x b) [m] 86.4 x 12.8
Draught [m] 5.6
Year of Build 1998
Operating Area Europe (SECA)
Service Speed [kn] 12.0
Fuel Type LS380 (main) / MDO (aux)
Main Engine MAN B&W (4-stroke) 7L28/32A
Power [kW] 1,715
SFOC (85%MCR) [g/kWh] 187
Auxiliary Engine power [kW] 796
Operational profile
95% in service
70% sailing, 10% manouvering, 15% port
Estimated fuel oil consumption [t] LS380: 1,761
MDO: 977
Scrubber type Wet scrubber - closed loop system
Installation assumptions on Main Engine only
CAPEX [million USD] 4.5
OPEX (consumables / other operational) [k USD/year] 112 / 71
[Own evaluation]
As a result of the cost analysis for the general cargo vessel and under the various various assumptions and
uncertainties in any analysis of this kind the annual costs for operation with clean fuels is close by the
annual costs for operating the vessel with a scrubber system.
After 2015 the costs for compliance with fuel switchover is 2,28M USD whilst the cost for compliance with
an EGCS is 2,19M USD. After 2020 the costs for compliance with fuel switchover is 2,53M USD whilst the
cost for compliance with an EGCS is 2,30M USD.
Given the fact that the vessel is 16 years old and the fuel price projection is hardly predictable at present it
is in question whether a ship owner should take the risk for the re-fitting of a scrubber system in this
special case.

66
Table 16: Reference vessel “Bulk Carrier”
Example ship no 2 Bulk Carrier
Dwt 53,477
Dimensions (l x b) [m] 189.9 x 32.3
Draught [m] 12.5
Year of Build 2009
Operating Area Europe, all major trading routes
32.5% inside ECA & 62.5% outside ECA
Service Speed [kn] 14.5
Fuel Type IFO380 (main) / MDO (aux)
Main Engine MAN B&W (2-stroke) 6S50MC-C
Power [kW] 9,480
SFOC (85%MCR) [g/kWh] 159
Auxiliary Engine power [kW] 2 x 1,060
Operational profile
95% in service
50% sailing, 15% manouvering, 30% port
Estimated fuel oil consumption [t] IFO 380: 7,009
MDO: 1,362
Scrubber type Wet scrubber – hybrid type
Installation assumptions on Main Engine only, in closed loop mode 50%
CAPEX [million USD] 6.0
OPEX (consumables / other operational) [k USD/year] 92 / 71
[Own evaluation]
The result of the cost analysis for the bulk carrier, as well under the various various assumptions and
uncertainties, gives a clearer picture.
After 2015 the costs for compliance with fuel switchover is about 7% higher than the costs for compliance
with an EGCS. The fuel cots are 5,82M USD whilst the cost for compliance with an EGCS is 5,43M USD.
After 2020 the costs for compliance with fuel switchover is 7.31M USD whilst the cost for compliance with
an EGCS is 5.89M USD, which is nearly 20% less.
Given the fact that the vessel is only 5 years old and the cost difference is significantly higher than for the
general cargo vessel the retrofitting of a scrubber system seems to be a valuable solution.

MARIKO GmbH
Future Fuels – Options for Ship Owners & Operators study September 2014
67
Figure 38: Annual compliance costs Bulk Carrier
[Own evaluation]
Figure 39: Annual Compliance costs General Cargo Ship
[Own evaluation]

68
8. The comparison tool – ECA Calculator
The Lloyd’s Register ECA Calculator is a tool which assists with strategic planning for Sulphur oxide (SOx)
compliance with MARPOL Annex VI, Regulation 14. This chapter covers the background, purpose and
functionality of this tool and outlines the basic assumptions and equations used in the calculation.
A full user guide is available on request.
At present, the majority of vessels choose to comply with the current 1.00 % ECA requirement by
operating with a fuel of lower sulphur content where required. In the majority of cases this is RFO. In the
future however, in order to meet the 0.10 % and 0.50 % maximum allowable sulphur contents required
within an ECA from 2015 onwards, and in all other areas from 2020/2025 respectively, distillate fuel is
likely to be used by ships.
Crucially, however, MARPOL Annex VI allows, under Regulation 4, the use of an equivalent compliance
method which is at least as effective in terms of emissions reduction as the levels required by regulation 14
(which limits the sulphur content of fuel). One of these methods is the use of an EGCS.
8.1 Purpose of the tool
As a result of the current and impending situation, (i.e. 2015 0.10 % limit within an ECA and 2020/2025
0.50 % outside an ECA) operators may need to evaluate their position in terms of SOx compliance costs
and alternative options. Decisions can be affected by a number of factors including the size and type of the
fleet, the time spent within an ECA, potential introduction of additional ECAs in the future, the relative cost
of installing an EGCS (and payback period vs. age of the vessel), the cost of fuel and price differential
between fuels of different sulphur contents and many more.
In this complex environment, some decisions may affect the viability of a ship service or operation. To assist
with making such strategic decisions (which may involve either fitting an EGCS, or operating on distillate
fuels), Lloyd’s Register has developed the ECA Calculator. Assuming a core (but realistic) operational
scenario and using inputs which are easily available, the ECA Calculator projects the cost for the different
scenarios in the future and, as the reduced fuel sulphur content requirements enter into force, allows for
different fuel price scenarios to be used. Also, parameters which have increased impact on the decision
making process and, quite often, are associated with a high degree of uncertainty, can be easily adjusted
providing an instant update of the results.
The tool should be seen as a relative and comparative guide for reference and not absolute in its final
determination.
8.2 Main outputs
The main output of the ECA Calculator is a fuel cost projection using either exclusively fuel switchover (as
per Regulation 14) or an EGCS (as an equivalent compliance method). The EGCS investment is also
evaluated in terms of Net Present Value (NPV) for which the payback period is calculated.
In addition to these main outputs, other useful information is calculated at different stages of the tool, such
as annual fuel consumption figures, average cost breakdowns for key periods etc.
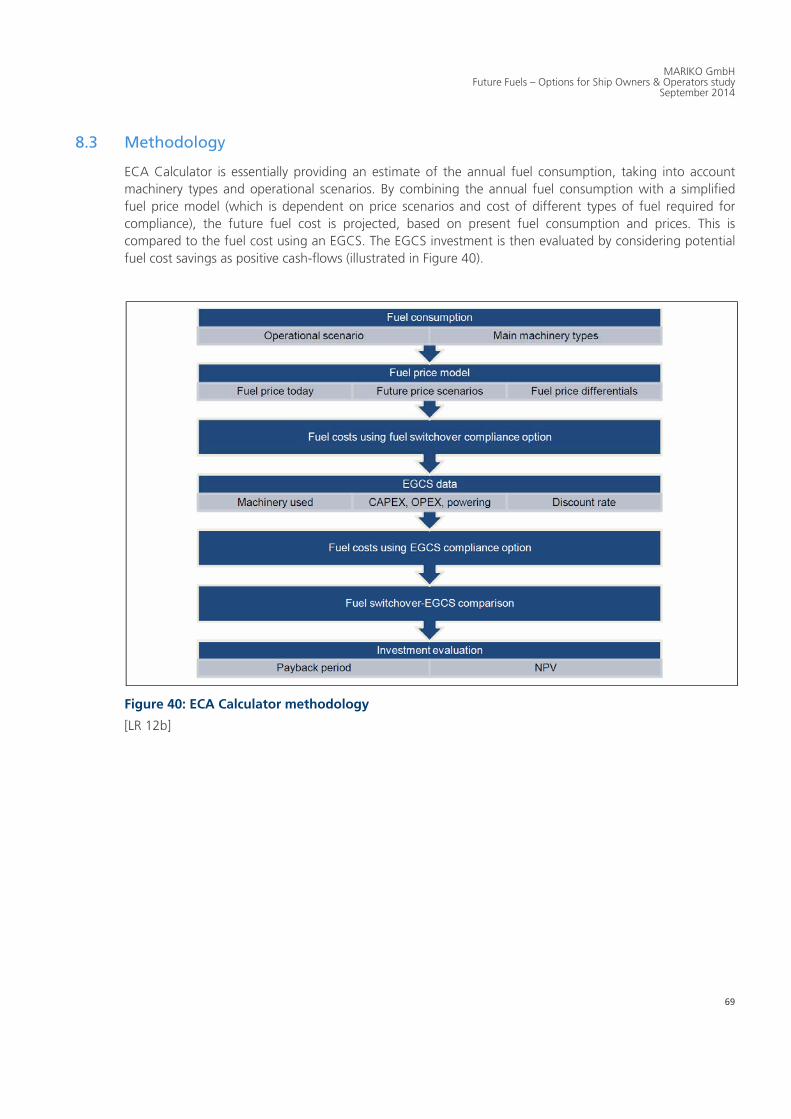
MARIKO GmbH
Future Fuels – Options for Ship Owners & Operators study September 2014
69
8.3 Methodology
ECA Calculator is essentially providing an estimate of the annual fuel consumption, taking into account
machinery types and operational scenarios. By combining the annual fuel consumption with a simplified
fuel price model (which is dependent on price scenarios and cost of different types of fuel required for
compliance), the future fuel cost is projected, based on present fuel consumption and prices. This is
compared to the fuel cost using an EGCS. The EGCS investment is then evaluated by considering potential
fuel cost savings as positive cash-flows (illustrated in Figure 40).
Figure 40: ECA Calculator methodology
[LR 12b]

70
8.4 Case comparison
The ECA Calculator is designed to accommodate up to six different cases, compared side by side. This
allows quick comparison and evaluation of:
different ships in the fleet,
the same ship but in different operational scenarios and time spent within an ECA,
the same ship but with different machinery configuration,
the same ship but with different EGCS configuration or type and
a combination of the above. [LR 12b]
8.4.1 Operational profile
A simple model is assumed, where vessel operation is split in up to five modes. These can be manually
entered by the user. Some examples are provided:
sailing (different speeds or different laden conditions),
channel transits,
manoeuvring,
port – waiting,
anchorage,
off-loading and
loading.
These modes apply universally to all compared cases (i.e. the user can not compare two ships with two
different mode names, although two ships with different time on each mode can be compared). At least
one mode is required for the calculations, it is not necessary to use all modes.
For each case and mode, the following parameter will be evaluated:
The name or type of each vessel or case name, as applicable. This name will be used throughout
the calculator.
The percentage of time for each mode, compared to the overall time in operation (off-service time
is calculated automatically as the remainder). The total figure should not exceed 100 % (time off-
service should not be negative).
The percentage of time within an ECA for each mode. [LR 12b]
8.4.2 Machinery particulars and annual fuel consumptions
This section, combined with the discourse above is used to calculate the annual fuel consumptions per fuel
type and machinery type, which are used for the fuel cost calculations. [LR 12b]
8.4.3 Fuel types
The user can type the type of fuel used (up to four types can be entered). These types will be further
available for each machinery type. At least one type must be entered, but it is not necessary to use all four

MARIKO GmbH
Future Fuels – Options for Ship Owners & Operators study September 2014
71
available fuel types. The type of fuel does not affect the calculations; it is the fuel price and differential
between the key sulphur contents required by Regulation 14 that determine the fuel cost. The fuel type
entered at this stage should be on the basis of what type of fuel the ship machinery is capable of
combusting, regardless of sulphur content. For each fuel type entered here, the corresponding type for
compliance with various stages of Regulation 14 will be entered in the next step. Fuel types (manual input)
and drop-down menu on the machinery section. [LR 12b]
8.4.4 Machinery particulars
The ECA Calculator allows for inclusion of up to three different groups of machinery (excluding boilers
which can be added as a fourth separate group). Machinery of the same type must be grouped together
based on the type fuel used. For example, group 1 may be the main engine, and group 2 may be the
auxiliary diesel generators. An alternative is to separate machinery of the same type and same fuel into
different groups if there are other differences (for example two different types of diesel generators).
For each machinery group, the following input is required:
Name of machinery (e.g. main engines, or prime mover, diesel generators etc.),
number of installed units,
MCR (Maximum Continous Rating) of each unit and
type of fuel.
In addition, for each of the operational modes entered above the following also need to be entered:
Number of units in use (not applicable to boilers),
% of MCR (or time used, in case of boilers) and
(specific) FOC (only in case of boilers).
Additional clarification can be found within the calculator when selecting each of the input cells.
Boilers are separated from the other three groups because the fuel consumption calculation is on the basis
of tonnes/hour instead of MCR × Specific FOC. The boiler hourly FOC is generally proportionate to the
boiler steam generating capacity.
The output from this section is total fuel consumption per fuel type for each ship/scenario. [LR 12b]
8.4.5 Fuels, costs and scenarios
In this part fuel types, used for compliance in the specific case, current fuel oil prices, price differentials,
future price scenarios (low, medium, high) have to be entered. This input combined with the fuel
consumption calculation of the previous step will be used to estimate the projected fuel and compliance
costs in the future. [LR 12b]
8.4.6 Fuels used for compliance
For each of the above listed fuel types, an alternative fuel, compliant with each corresponding sulphur limit
of Regulation 14, needs to be entered. If the original fuel is already compliant with this limit, it can be
entered in this step again without a further change. [LR 12b]

72
8.4.7 Today’s fuel price and price differentials
For each fuel type, the current price per tonne needs to be entered. This should reflect fuel compliant with
the 3.50 % current sulphur limit. Depending on the fuel type assumed for the specific machinery, the
sulphur content may be less in practice.
Price differentials between the fuel today and the fuel types compliant with the corresponding limit are
entered here. The differentials are focussing the price differences between the fuel on the top column and
the fuel on each row on the left. It has to be noted that prices and fuel names are used purely for
illustration purposes. [LR 12b]
8.4.8 Fuel calorific value corrections
It is likely that the fuel type used to comply with the different stages of Regulation 14 has a different
calorific value compared to the ‘fuel type today‛ entered within the previous steps of the calculator. If in the
future a fuel with higher calorific value is used in order to comply with a specific corresponding sulphur
limit requirement, the total fuel consumption will be lowered and this will have an impact on the fuel
switchover compliance costs. To account for this, appropriate correction factors can be entered at this
point. The correction factor represents the percentage difference in calorific value between the two fuels.
[LR 12b]
8.4.9 Fuel price scenarios
The fuel price projection follows a simple model: each year the price will be x% higher (or lower) compared
to the previous year. In addition, there can be two price ’spikes‘ in the key years 2015 and 2020/2025 for
fuels of less than 1.00 % sulphur content. This is to allow for potential changes in demand of low sulphur
fuels (and subsequent price adjustments) when the 0.10 % ECA limit or the 0.50 % sulphur limit (all other
areas) enter into force.
The user can also select the year when the 0.50 % sulphur limit will enter into force. Depending on this
selection, the fuel which will be used to comply will be altered automatically. [LR 12b]
8.5 EGCS data
8.5.1 Machinery connected to EGCS
For each of the machinery types (and boilers) the proportion of the exhaust gas stream going through the
EGCS must be entered. For example if machinery type 1 is identical auxiliary engines grouped together, and
two of them are connected to the EGCS, then 50 % will be used as input.
ECA Calculator will then use this input to calculate the proportion of fuel per fuel type from which the
exhaust gas is passed through the EGCS. The remainder of fuel will be subject to the applicable limits.
Therefore, the savings from using the EGCS will be determined by the percentage of fuel going through
the EGCS, the price differential between the two fuels and the operating cost of the EGCS.
The year of installation also needs to be entered. Prior to this year, it will be assumed that the ship uses fuel
switchover to comply with Regulation 14. [LR 12b]

MARIKO GmbH
Future Fuels – Options for Ship Owners & Operators study September 2014
73
8.5.2 EGCS installation cost
The installation cost is entered in million US Dollars. This should take into account the following factors (not
an exhaustive list) and should be, to the extent possible, the turn-key cost of the installation:
Type, number and size of machinery which is connected to EGCS,
complexity of the installation,
type of EGCS, size and number of units,
provisions for redundancy,
exhaust gas monitoring equipment,
time off-service during the installation and associated loss of revenue,
certification costs and
cost of monitoring equipment (exhaust gas and washwater). [LR 12b]
8.5.3 EGCS operational costs and loss of revenue
Some EGCS are using chemical addition (sodium hydroxide for closed-loop wet systems or granulated lime
for dry system) in order to remove the sulphur from the exhaust gas. The consumption rate is usually given
in kg/MWh. The price of the consumable is also entered here. The consumable cost calculated is the
maximum annual rate. The actual consumable cost will be proportional to the time the EGCS is in
operation, which prior to 2015 is assumed only when inside an ECA and after 2020/2025 is assumed at all
times.
In addition to the operational costs from the use of consumables, EGCS may also be associated with
additional operational costs which are proportional to the usage of EGCS and would normally not occur
had the ship chosen to comply using fuel switchover. These may include (but are not limited to) costs of
other consumables that are operation-dependent, cost of sludge disposal etc. These costs are added to the
costs of consumables to estimate the annual variable operational costs of the EGCS.
Finally, in addition to variable operational costs, there may be fixed costs associated with the operation of
the EGCS, such as (but not limited to) scheduled maintenance costs, time off-service for maintenance solely
for the EGCS (i.e. if not combined with other maintenance works), cost of parts and other fixed costs as
applicable. There may also be loss of revenue from the reduction in cargo carrying capacity due to the
installation of EGCS and associated machinery. This can be either due to EGCS occupying cargo space or
due to the restrictions in the maximum permissible draught posed by the additional weight of the EGCS.
This is added to the fixed costs as it is essentially treated as a fixed cost as far as the calculation is
concerned. [LR 12b]
8.5.4 EGCS additional fuel consumption
In most instances, the operation of an EGCS will be associated with additional power consumption. This
very much depends on the type of system (closed loop versus open loop or dry versus wet system) and also
the size of the system. In the event that an EGCS has other indirect effects to fuel consumption, such as
reduction in energy efficiency of the engine, these should be entered here in the form of power. The
machinery that is used to power the EGCS (from the machinery types entered previously) also needs to be
selected. This will determine the type of fuel that is consumed to power the EGCS and this consumption

74
will be added to the total fuel consumption. This additional fuel consumption will be subject to the same
fuel cost model that is used throughout the calculator and will only apply when the EGCS is in operation.
[LR 12b]
8.5.5 EGCS investment discount rate
The discount rate is used for the discounted cash-flow analysis and takes into account the time value of
money and the risk of the anticipated future cash flows. This is a common methodology applied when
evaluating an investment. [LR 12b]
8.6 Results to display
Considering that outputs are calculated for up to six different ships/ship configurations and three price
scenarios, this leads to up to 18 sets of graphs and tables. To facilitate the display of information, ECA
Calculator only allows display of a single combination at a time. [LR 12b]
Applying the input entered in the previous sections, the summary fuel cost for the fuel switchover or the
EGCS option in the chosen configuration is presented graphically. The horizontal axis is the year and the
vertical axis is the fuel cost to achieve compliance with the provisions of MARPOL Annex VI, Regulation 14.
[LR 12b]
The time required for the cost of the EGCS option to become equal to the cost of the fuel switchover
option is shown (in years/months). If this never happens, ’Never� will be displayed instead.
The average fuel costs are displayed in three key periods
Between now and 2015 (excluding 2015);
between 2015 and 2020 (excluding 2020) and
between 2020 and 2035 (year when the calculation stops).
In addition to the averaged fuel cost graphs, tables for each ship are included, displaying average annual
figures in the same three periods as follows:
Baseline cost (assumed use of 3.5 % sulphur fuel globally)
Added fuel costs using fuel switchover for compliance;
Added fuel costs using EGCS for compliance
Savings or losses using EGCS. [LR 12b]
Investment evaluation
In this step, the EGCS investment has to be evaluated by using a Net Present Value methodology. The basic
elements of this methodology can be summarised as:
The current investment expenditure is the installation cost of the EGCS entered. This is added at
the year of installation.
For each year, the savings (or losses) by using the EGCS compared to compliance using fuel
switchover are the cash-flows. Positive cash-flows are any savings by using the EGCS due to lower
fuel costs and negative cash-flows are the operational costs of the EGCS;
Future cash-flows are discounted to the present value using the discount rate entered.

MARIKO GmbH
Future Fuels – Options for Ship Owners & Operators study September 2014
75
The discount rate represents the cost of capital;
The NPV is calculated at each year[LR 12b]

76
Appendix 1 – Fleet statistics
Table 17: Vessel Age (Pattern, relatable to companies resident in Lower Saxony (as of May 2014
Vessel Type Minimum
[yrs]
25 %
Quantile
[yrs]
Median
[yrs]
75 %
Quantile
[yrs]
Maximum
[yrs]
Average
[yrs]
General Cargo Vessel -1.9 4.1 7.8 14.3 87.3 10.0
Container Vessel -0.6 5.9 8.2 11.9 27.0 9.2
Tanker -0.2 4.5 6.0 13.4 53.6 10.3
Refrigerated Cargo Vessel 11.8 15.3 20.3 21.3 22.3 18.3
Bulk Carrier 0.1 3.1 4.1 6.2 19.6 5.3
Other Vessels -1.3 6.2 29.4 39.6 78.8 26.8
Total -1.9 4.8 8.0 14.4 87.3 10.9
[Own evaluation]
Figure 41: Cumulative frequencies of Vessel Fuel Type, relatable to companies resident in Lower Saxony (as of May)
[Own evaluation]

MARIKO GmbH
Future Fuels – Options for Ship Owners & Operators study September 2014
77
Table 18: Fact Sheet of Average Vessel 'General Cargo Vessel 0.0 - 4.9 ths dwt', relatable to companies resident in Lower Saxony (as of May 2014)
Average Vessel General Cargo Vessel 0.0 – 4.9 ths dwt
� dwt 3,556
� Dimensions (l x b) [m] 88.6 x 12.9
� Draught [m] 5.2
� Age [yrs] 14.6
Main Operating Areas Europe; West Africa
Vessels stopping in ports of Lower Saxony [%] 49.5
� Stops in ports of Lower Saxony [no/yr] 2
� Service Speed [kn] 11.7
Main Fuel Type [%] MDO / MGO (53.9 %)
� Consumption [mt/d] 7.8
� Power [kW] 1,780
Standard No. of Strokes [%] 4 (99.6 %)
[Own evaluation]
Table 19: Fact Sheet of Average Vessel 'General Cargo Vessel 5.0 - 9.9 ths dwt', relatable to companies resident in Lower Saxony (as of May 2014)
Average Vessel General Cargo Vessel 5.0 – 9.9 ths dwt
� dwt 7,232
� Dimensions (l x b) [m] 114.8 x 17.2
� Draught [m] 6.8
� Age [yrs] 7.8
Main Operating Areas Europe; Eastern Americas; West Africa; Asia
Vessels stopping in ports of Lower Saxony [%] 31.4
� Stops in ports of Lower Saxony [no/yr] 1
� Service Speed [kn] 14.0
Main Fuel Type [%] IFO 180 / 380 (100.0 %)
� Consumption [mt/d] 16.2
� Power [kW] 3,925
Standard No. of Strokes [%] 4 (98.0 %)
[Own evaluation]
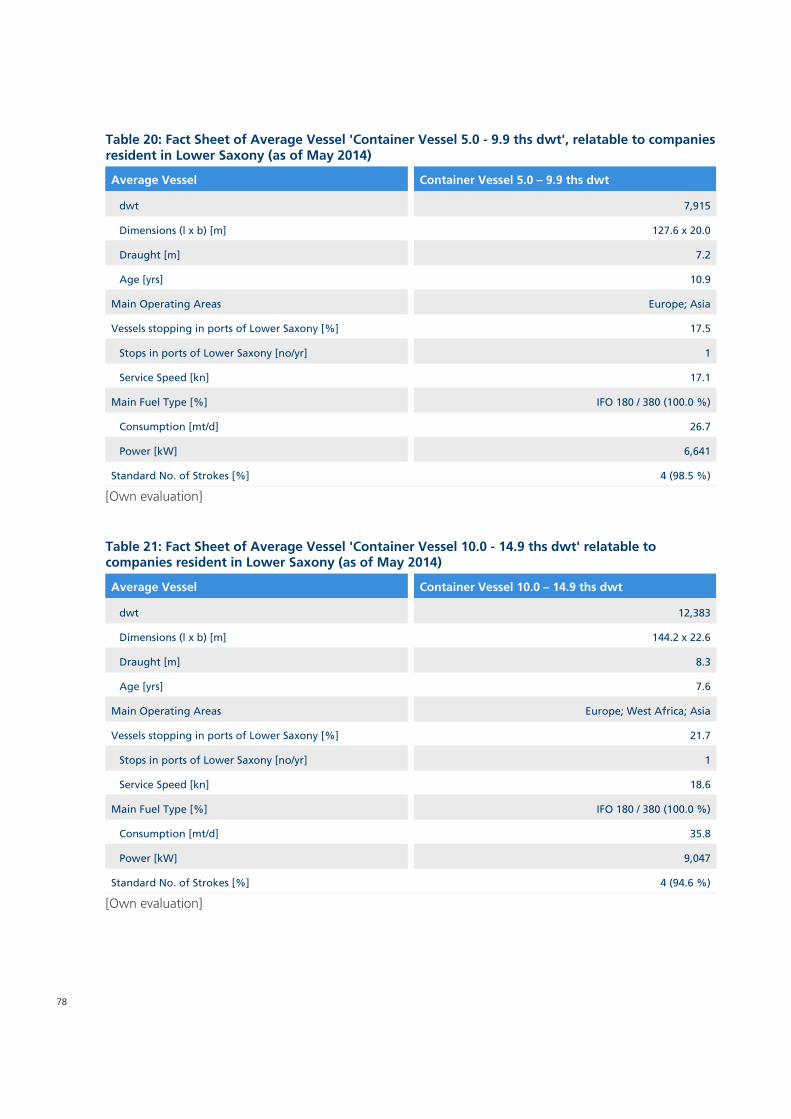
78
Table 20: Fact Sheet of Average Vessel 'Container Vessel 5.0 - 9.9 ths dwt', relatable to companies resident in Lower Saxony (as of May 2014)
Average Vessel Container Vessel 5.0 – 9.9 ths dwt
� dwt 7,915
� Dimensions (l x b) [m] 127.6 x 20.0
� Draught [m] 7.2
� Age [yrs] 10.9
Main Operating Areas Europe; Asia
Vessels stopping in ports of Lower Saxony [%] 17.5
� Stops in ports of Lower Saxony [no/yr] 1
� Service Speed [kn] 17.1
Main Fuel Type [%] IFO 180 / 380 (100.0 %)
� Consumption [mt/d] 26.7
� Power [kW] 6,641
Standard No. of Strokes [%] 4 (98.5 %)
[Own evaluation]
Table 21: Fact Sheet of Average Vessel 'Container Vessel 10.0 - 14.9 ths dwt' relatable to companies resident in Lower Saxony (as of May 2014)
Average Vessel Container Vessel 10.0 – 14.9 ths dwt
� dwt 12,383
� Dimensions (l x b) [m] 144.2 x 22.6
� Draught [m] 8.3
� Age [yrs] 7.6
Main Operating Areas Europe; West Africa; Asia
Vessels stopping in ports of Lower Saxony [%] 21.7
� Stops in ports of Lower Saxony [no/yr] 1
� Service Speed [kn] 18.6
Main Fuel Type [%] IFO 180 / 380 (100.0 %)
� Consumption [mt/d] 35.8
� Power [kW] 9,047
Standard No. of Strokes [%] 4 (94.6 %)
[Own evaluation]

MARIKO GmbH
Future Fuels – Options for Ship Owners & Operators study September 2014
79
Table 22: Fact Sheet of Average Vessel 'Tanker', relatable to companies resident in Lower Saxony (as of May 2014)
Average Vessel Tanker
� dwt 15,158
� Dimensions (l x b) [m] 126.0 x 19.4
� Draught [m] 7.8
� Age [yrs] 10.3
Main Operating Areas Europe; Eastern Americas; West Africa; Asia
Vessels stopping in ports of Lower Saxony [%] 14.3
� Stops in ports of Lower Saxony [no/yr] (strongly influenced by small local tank suppliers) 7
� Service Speed [kn] 13.9
Main Fuel Type [%] IFO 180 / 380 (96.1 %)
� Consumption [mt/d] 20.0
� Power [kW] 4,866
Standard No. of Strokes [%] 4 (59.0 %)
[Own evaluation]
Table 23: Fact Sheet of Average Vessel 'Bulk Carrier', relatable to companies resident in Lower Saxony (as of May 2014)
Average Vessel Bulk Carrier
� dwt 52,463
� Dimensions (l x b) [m] 192.5 x 29.7
� Draught [m] 11.6
� Age [yrs] 5.3
Main Operating Areas All major trading routes
Vessels stopping in ports of Lower Saxony [%] 16.9
� Stops in ports of Lower Saxony [no/yr] 2
� Service Speed [kn] 14.4
Main Fuel Type [%] IFO 180 / 380 (100 %)
� Consumption [mt/d] 30.2
� Power [kW] 8,677
Standard No. of Strokes [%] 2 (83.1 %)
[Own evaluation]
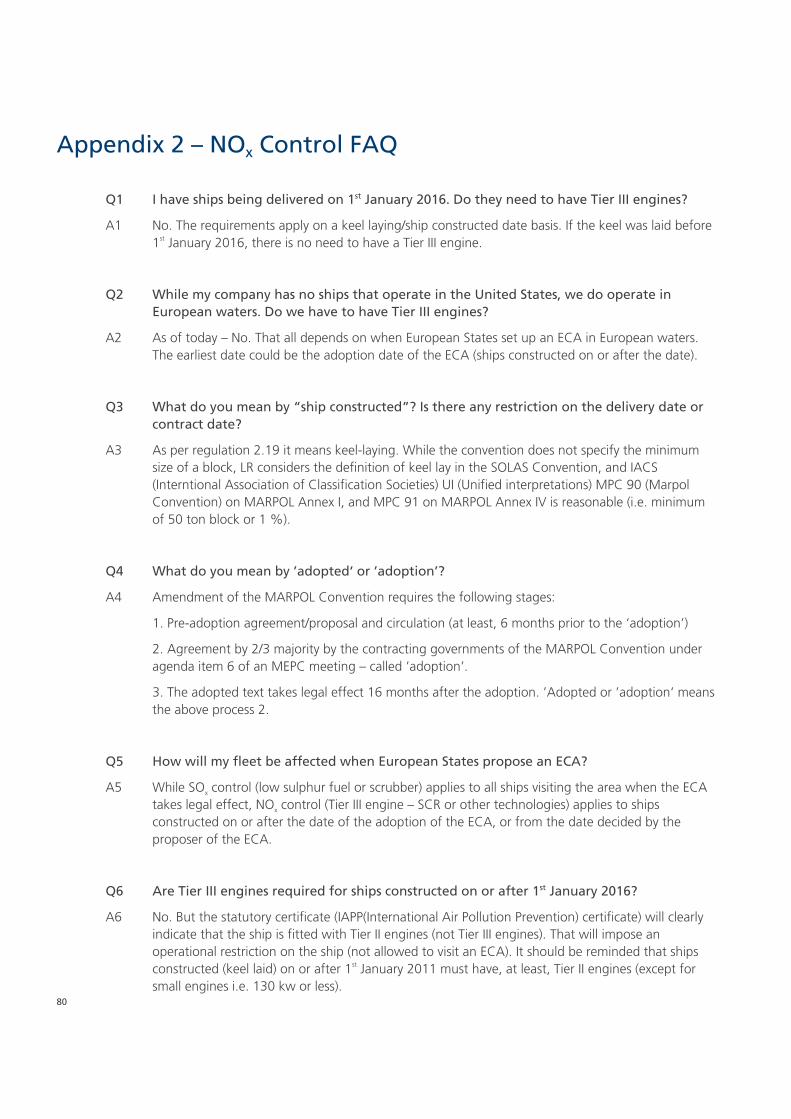
80
Appendix 2 – NOx Control FAQ
Q1 I have ships being delivered on 1st January 2016. Do they need to have Tier III engines?
A1 No. The requirements apply on a keel laying/ship constructed date basis. If the keel was laid before
1st January 2016, there is no need to have a Tier III engine.
Q2 While my company has no ships that operate in the United States, we do operate in
European waters. Do we have to have Tier III engines?
A2 As of today – No. That all depends on when European States set up an ECA in European waters.
The earliest date could be the adoption date of the ECA (ships constructed on or after the date).
Q3 What do you mean by “ship constructed”? Is there any restriction on the delivery date or
contract date?
A3 As per regulation 2.19 it means keel-laying. While the convention does not specify the minimum
size of a block, LR considers the definition of keel lay in the SOLAS Convention, and IACS
(Interntional Association of Classification Societies) UI (Unified interpretations) MPC 90 (Marpol
Convention) on MARPOL Annex I, and MPC 91 on MARPOL Annex IV is reasonable (i.e. minimum
of 50 ton block or 1 %).
Q4 What do you mean by ’adopted‘ or ’adoption’?
A4 Amendment of the MARPOL Convention requires the following stages:
1. Pre-adoption agreement/proposal and circulation (at least, 6 months prior to the ‘adoption’)
2. Agreement by 2/3 majority by the contracting governments of the MARPOL Convention under
agenda item 6 of an MEPC meeting – called ’adoption’.
3. The adopted text takes legal effect 16 months after the adoption. ’Adopted or ’adoption‘ means
the above process 2.
Q5 How will my fleet be affected when European States propose an ECA?
A5 While SOx control (low sulphur fuel or scrubber) applies to all ships visiting the area when the ECA
takes legal effect, NOx control (Tier III engine – SCR or other technologies) applies to ships
constructed on or after the date of the adoption of the ECA, or from the date decided by the
proposer of the ECA.
Q6 Are Tier III engines required for ships constructed on or after 1st January 2016?
A6 No. But the statutory certificate (IAPP(International Air Pollution Prevention) certificate) will clearly
indicate that the ship is fitted with Tier II engines (not Tier III engines). That will impose an
operational restriction on the ship (not allowed to visit an ECA). It should be reminded that ships
constructed (keel laid) on or after 1st January 2011 must have, at least, Tier II engines (except for
small engines i.e. 130 kw or less).

MARIKO GmbH
Future Fuels – Options for Ship Owners & Operators study September 2014
81
Q7 What about sister ships already contracted for construction?
A7 As the requirement applies based upon the construction (keel lay) date of each individual ship, the
subsequent sister ship(s) may need to change the engine to be Tier III compliant, if their intended
operation area includes an ECA.
Q8 What extra surveys will LR do/require during plan approval, construction, sea trial and in-
service?
A8 Tier III engines will most likely require an exhaust gas cleaning system (EGCS), such as selective
catalytic reduction (SCR). This will pose extra elements for engine approvals and surveys. EGCSs are
to be approved in accordance with Pt.5 Ch.24 of the LR Rules for Ships.
Q9 What do I need to be preparing for ships staff training on these new engines?
A9 SCR will require chemical reductant (most typically urea for operation). Exhaust Gas Recirculation
systems intended to operate with high sulphur residual fuels will incorporate a wet scrubbing
system which uses sodium hydroxide so as to clean and cool the exhaust gas prior to re-entry into
the scavenge air system. Crew must be trained and be fully conversant with the risk associated
with such substances. Additionally SCR systems are susceptible to a variety of failure and
degradation mechanisms such as fouling, plugging and poisoning which require crew awareness.
Q10 What will port state control/class do to verify the level of NOx emissions for my Tier III
engine?
A10 The engine type (Tier II or III) will be clearly indicated in the supplement to the International Air
Pollution Prevention certificate. Any non-compliant engine can be immediately spotted by Port
State Control authorities. There are several possibilities as per chapter 2 of the NOx Technical Code
for carrying out surveys but the two most likely are parameter checks using the engine technical
file or direct measurement records.
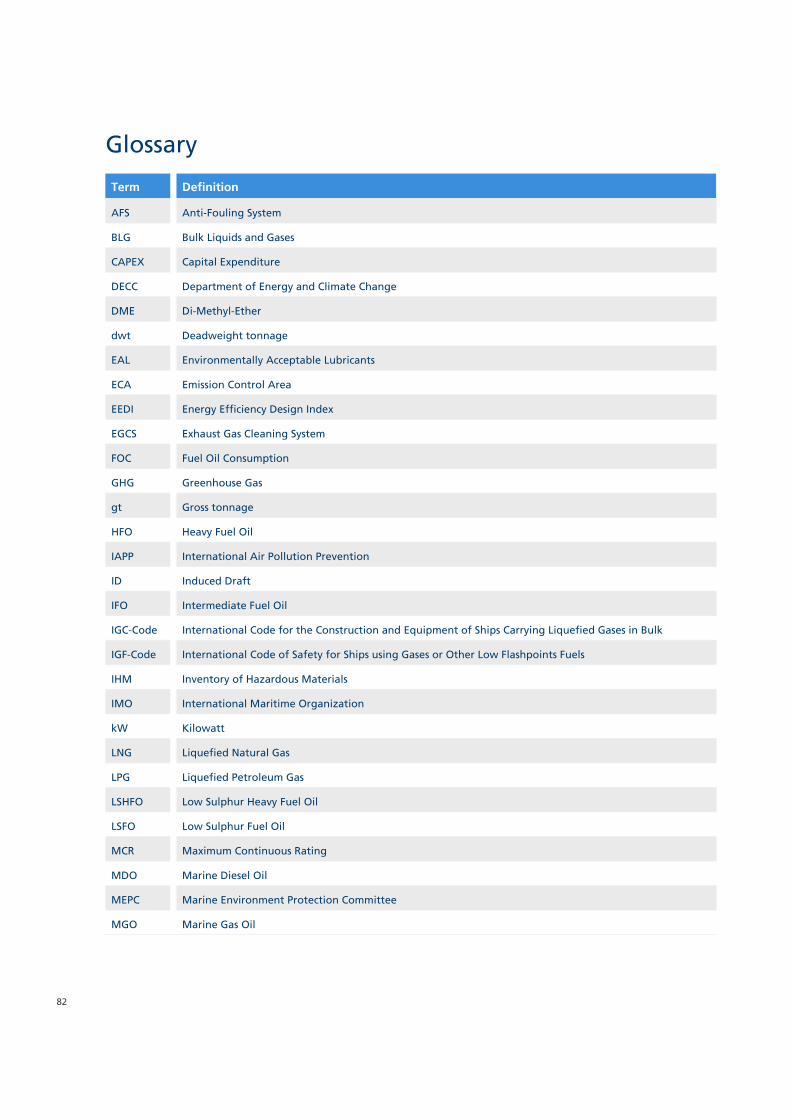
82
Glossary
Term Definition
AFS Anti-Fouling System
BLG Bulk Liquids and Gases
CAPEX Capital Expenditure
DECC Department of Energy and Climate Change
DME Di-Methyl-Ether
dwt Deadweight tonnage
EAL Environmentally Acceptable Lubricants
ECA Emission Control Area
EEDI Energy Efficiency Design Index
EGCS Exhaust Gas Cleaning System
FOC Fuel Oil Consumption
GHG Greenhouse Gas
gt Gross tonnage
HFO Heavy Fuel Oil
IAPP International Air Pollution Prevention
ID Induced Draft
IFO Intermediate Fuel Oil
IGC-Code International Code for the Construction and Equipment of Ships Carrying Liquefied Gases in Bulk
IGF-Code International Code of Safety for Ships using Gases or Other Low Flashpoints Fuels
IHM Inventory of Hazardous Materials
IMO International Maritime Organization
kW Kilowatt
LNG Liquefied Natural Gas
LPG Liquefied Petroleum Gas
LSHFO Low Sulphur Heavy Fuel Oil
LSFO Low Sulphur Fuel Oil
MCR Maximum Continuous Rating
MDO Marine Diesel Oil
MEPC Marine Environment Protection Committee
MGO Marine Gas Oil

MARIKO GmbH
Future Fuels – Options for Ship Owners & Operators study September 2014
83
NECA Nitrogen Emission Control Area
nm Nautical Mile
NOx Nitrogen Oxides
NPV Net Present Value
OPEX Operating Expenditure
PM Particulate Matter
PSC Port State Control
RFO Residual Fuel Oil
SCR Selective Catalytic Reduction
SECA Sulphur Emission Control Area
SOx Sulphur Oxides
ths thousand
VGP Vessel’s General Permit
VOC Volatile Organic Compounds
yrs Years

84
Literature
Shortcu Author; Publishing Info Title
Be 11a Bengtson, University Gothenburg, 2011 Life Cycle Assessment of Present and Future Marine
Fuels
Be 11b Bengtson, Anderson, Fridell - Journal of
Engineering for the Maritime Environment, 2011
A comparative life cycle assessment of marine fuels
DE 12 The Department of
Energy & Climate Change, 2012
DECC Fossil Fuel Price Projections
Ex 14 Exxon Mobile Technical Bulletin, 2014 Alternative Low Sulfur Marine Fuel
GL 11 Lyder Andersen (MAN), Clausen (MAN), Sames (GL),
2011
Costs and benefits of LNG as ship fuel for container
vessels
Hs 13 Pao-Chi Hsu, 2013 A life cycle cost analysis of using alternative
technologies on short sea shipping vessels in ECAs
LR 12a Lloyd’s Register Group, 2012 ECA Calculator - Tool
LR 12b Lloyd’s Register Group, 2012 ECA Calculator - Helping you plan your compliance
with MARPOL Annex VI, Regulation 14
LR 12c Lloyd’s Register Group, 2012 Understanding exhaust gas treatment systems -
Guidance for shipowners and operators
LR 12d Lloyd’s Register Group, 2012 LNG fuelled deep sea shipping - The outlook for
LNG bunker and LNG-fuelled newbuild demand up
to 2025
LR 12e Lloyd’s Register Group, 2012 Global Marine Fuel Trends 2030 report
LR 13 Lloyd’s Register Group, 2013 Green Tech Marine due Diligence Study
LR 14a Lloyd’s Register Group & UCL Energy Institute, 2014 Global Marine Trends 2030 report
LR 14b Lloyd’s Register Group, 2014 Lloyd’s Register LNG Bunkering Infrastructure
Survey 2014
Me 11 Meech, Marine and Energy Consultation Ltd., 2011 Outlook for Marine Bunkers and Fuel Oil to 2030 –
A Key to Understanding the Future of Marine
Bunkers and Fuel Oil Markets
ME 14 Methanex, 2014 What is Methanol? – Safe Handling Information
MI 14 The Methanol Institute, 2014 Homepage
Sm 13 Smith, O’Keefe, Haji, Agnolucci, 2013 GloTraM external factors
SS 14 SSPA Sweden AB, 2014 SPIRETH – End of Project Report - Activities and
Outcomes of the SPIRETH (Alcohol (Spirits) and
Ethers as Marine Fuel) Project


www.lr.org Lloyd’s Register Group Limited, its subsidiaries and affiliates and their respective officers, employees or agents are, individually and collectively,
referred to in this clause as ‘Lloyd’s Register’. Lloyd’s Register assumes no responsibility and shall not be liable to any person for any loss,
damage or expense caused by reliance on the information or advice in this document or howsoever provided, unless that person has signed a
contract with the relevant Lloyd’s Register entity for the provision of this information or advice and in that case any responsibility or liability is
exclusively on the terms and conditions set out in that contract.
Lloyd’s Register and variants of it are trading names of Lloyd’s Register Group Limited, its subsidiaries and affiliates.
Copyright © Lloyd’s Register EMEA 2014
A member of the Lloyd’s Register group.