JAGUAR LAND ROVERRESULTS FOR THE YEAR AND QUARTER ENDED 31 MARCH 2017
23rd MAY 2017
- 2 -
DISCLAIMER
Statements in this presentation describing the objectives, projections, estimates and expectations of Jaguar Land Rover Automotive plc and its direct and indirect subsidiaries (the “Company”, “Group” or “JLR”) may be “forward-looking statements” within the meaning of applicable securities laws and regulations. Actual results could differ materially from those expressed or implied. Important factors that could make a difference to the Company’s operations include, among others, economic conditions affecting demand / supply and price conditions in the domestic and overseas markets in which the Company operates, changes in Government regulations, tax laws and other statutes and incidental factors.
- Q4 FY17 represents the 3 month period from 1 January 2017 to 31 March 2017- Q4 FY16 represents the 3 month period from 1 January 2016 to 31 March 2016- FY17 represents the 12 month period from 1 April 2016 to 31 March 2017- FY16 represents the 12 month period from 1 April 2015 to 31 March 2016
Consolidated results of Jaguar Land Rover Automotive plc and its subsidiaries contained in the presentation are unaudited and presented under IFRS as approved in the EU.
Retail volume data includes and wholesale volume excludes sales from the Company’s unconsolidated Chinese joint venture (“CJLR”).
EBITDA defined to include the revaluation of current assets and liabilities and realised FX and commodity hedges but excludes the revaluation of foreign currency debt, unrealised FX and commodity hedges, as well as exceptional items
EBIT defined to include the revaluation of current assets and liabilities and realised FX and commodity hedges as well as profits from CJLR but excludes the revaluation of foreign currency debt, unrealised FX and commodity hedges, and exceptional items
Certain analysis undertaken and represented in this document may constitute an estimate from the Company and may differ from the actual underlying results

- 4 -
AGENDA
Financial performance for the quarter and the year
JLR Strategy
Other developments
Looking ahead
Closing Q&A
5
12
20
21
Company participants
Dr. Ralf Speth, CEO, Jaguar Land Rover
C. Ramakrishnan, Group CFO, Tata Motors
Bennett Birgbauer, Treasurer, Jaguar Land Rover

- 5 -
RECORD RETAIL SALES FY17 604K UNITS, UP 16% AND Q4 180K UNITS, UP 13%
XJ
LUXURY
XF
XE
F-TYPE Coupe
SPORTS
F-TYPE CONVERTIBLE
F-PACE
LIFESTYLE
LAND ROVER DEFENDER*ALL NEW DISCOVERYRANGE ROVER
RANGE ROVER SPORT
LUXURY – RANGE ROVER LEISURE - DISCOVERY DUAL PURPOSE - DEFENDER
* Discontinued. – Replacement in development.
DISCOVERY SPORT
DISCOVERY SPORT
XFL Range Rover
XEEVOQUE DISCOVERY SPORT
JAGUAR XF WINNER
GOLDEN STEERING
WHEEL AWARD
2016 BEST SALOON CAR
JAGUAR F-PACE WINNER
WORLD CAR AWARDS
2017 WORLD CAR
OF THE YEAR
JAGUAR F-PACE WINNER
WORLD CAR AWARDS
2017 WORLD CAR
DESIGN OF THE YEAR
LAND ROVER
DISCOVERY SPORT
RANGE ROVER
BEST LUXURY BUY
RANGE ROVER SPORT SVR
AUTOCAR STAR AWARD
DISCOVERY
RANGE ROVER EVOQUE
F-TYPE
- 6 -
Revenue EBITDA PBT
Q4
Full
ye
ar
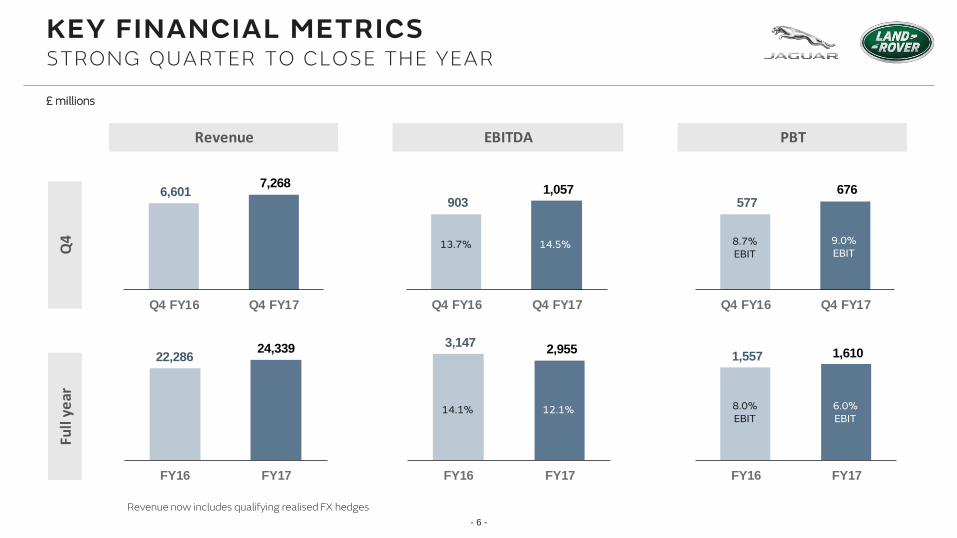
22,286 24,339
FY16 FY17
6,601 7,268
Q4 FY16 Q4 FY17
577 676
Q4 FY16 Q4 FY17
903 1,057
Q4 FY16 Q4 FY17
1,557 1,610
FY16 FY17
3,147 2,955
FY16 FY17
KEY FINANCIAL METRICSSTRONG QUARTER TO CLOSE THE YEAR
8.0%EBIT
6.0%EBIT
12.1%14.1%
9.0%EBIT
8.7%EBIT
13.7% 14.5%
£ millions
Revenue now includes qualifying realised FX hedges
- 7 -
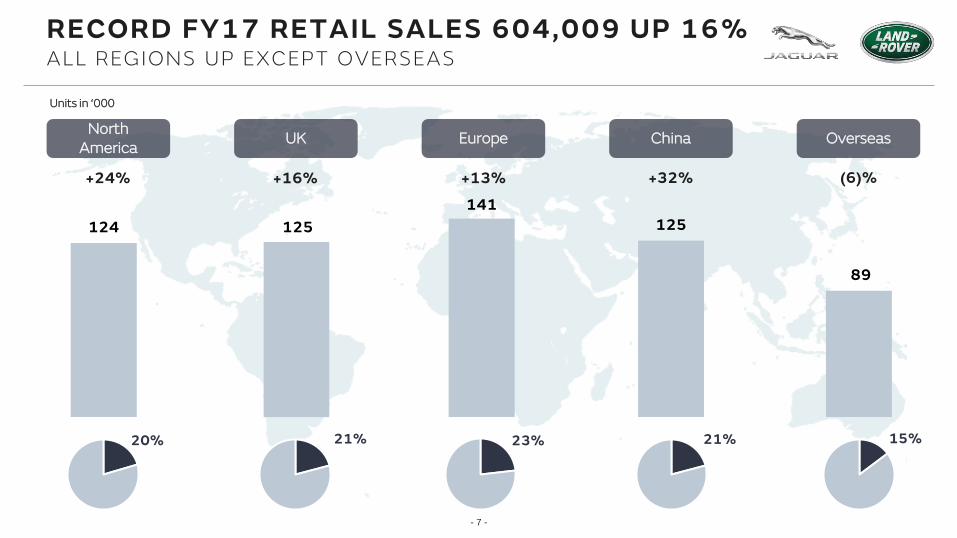
RECORD FY17 RETAIL SALES 604,009 UP 16%ALL REGIONS UP EXCEPT OVERSEAS
Units in ‘000
North America
UK Europe China Overseas
+24% +16% +13% +32% (6)%
125
141
124 125
89
21%20% 23% 21% 15%

- 8 -
1,557 1,610
456
10
308
(376)
(107)(238)
PBT FY16 Volume, mix& market
Netpricing
Material &operating costs
D&A Exchange &commodities
Tianjinexceptional
PBT FY17
YEAR ON YEAR PBTFAVOURABLE VOLUME/MIX OFFSET BY NET PRICING
For analytical purposes only
£ millions
8.0% 1.3% (1.5)% (0.3)% (1.0)% (0.5)% N/A 6.0%
FY17 £151mFY16 £(157)m
Market Equation
EBIT Margin:

- 9 -
£ millions
64
151
FY16 FY17
32
65
FY16 FY17
CHINA JOINT VENTUREINCREASED SALES AND PROFITS
Full year retail volumes JLR share of profit
Units in 000’s

- 10 -
FULL YEAR CASH FLOWPOSITIVE FREE CASH FLOW AFTER INVESTMENT
£ millions
1,610
3,266
295
1,855
467
(199)
(3,438)
PBTFY17
D&A andnon-cash
Tax Cash profitafter tax
Investment Workingcapital &accruals
Freecash flow
- 11 -
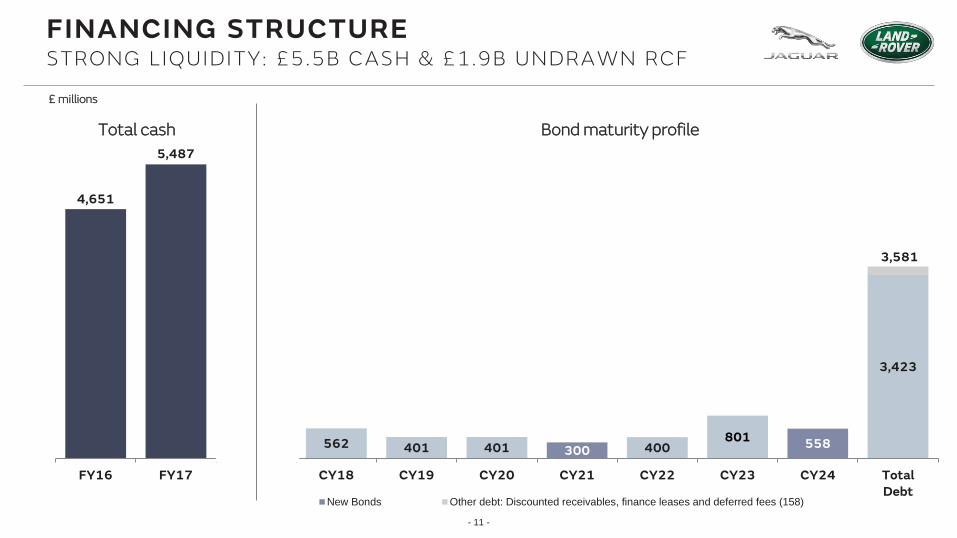
4,651
5,487
562 401 401 300 400801 558
3,423
FY16 FY17 CY18 CY19 CY20 CY21 CY22 CY23 CY24 TotalDebt
New Bonds Other debt: Discounted receivables, finance leases and deferred fees (158)
Total cash
FINANCING STRUCTURESTRONG LIQUIDITY: £5.5B CASH & £1.9B UNDRAWN RCF
3,581
Bond maturity profile
£ millions

- 12 -
JLR STRATEGYBLUEPRINT FOR LASTING SUCCESS
What We Do To Excel
What We Need To Do To Be Profitable
Experiences
people love,
for life
Customer
FirstEnvironmental
Innovation
More Great
Products
Global
Growth
Transformed
Cost Structure
Business
Excellence
Engaged
Passionate
People
Integrity, Pioneering, Excellence, Unity and ResponsibilityOur most valuable asset is our people, nothing is more important than their safety and wellbeing
Strong global brands
Substantial investment
Exciting new
products & services
Provide experiences people love
for life
Profitable volume growth
Maintain strong
liquidity

- 13 -
JLR STRATEGYEXTERNAL ENVIRONMENT & JLR PROFITABILITY TARGET
Geopolitical and economic environment,
including Brexit
Electrification and emissions compliance
Market and competitive forces
Driver assistance, connectivity and mobility trends
Investment requiredfor growth
Growing premium segments & balanced
market mix
Investment in hybrid and BEV technology
Exciting new products
Cost efficiency management
Investment in new technologies and
services
FY17 EBIT margin:
6.0%
EBIT marginplanning target (medium term):
8 - 10%

- 14 -
JLR STRATEGYEXCITING NEW PRODUCTS TO DRIVE FUTURE GROWTH
Discovery (Feb 2017) Range Rover Velar (Summer 2017)
I-PACE Concept (2018)XF Sportbrake (Summer 2017)
First premium SUV BEV
Watch this space!
- 15 -
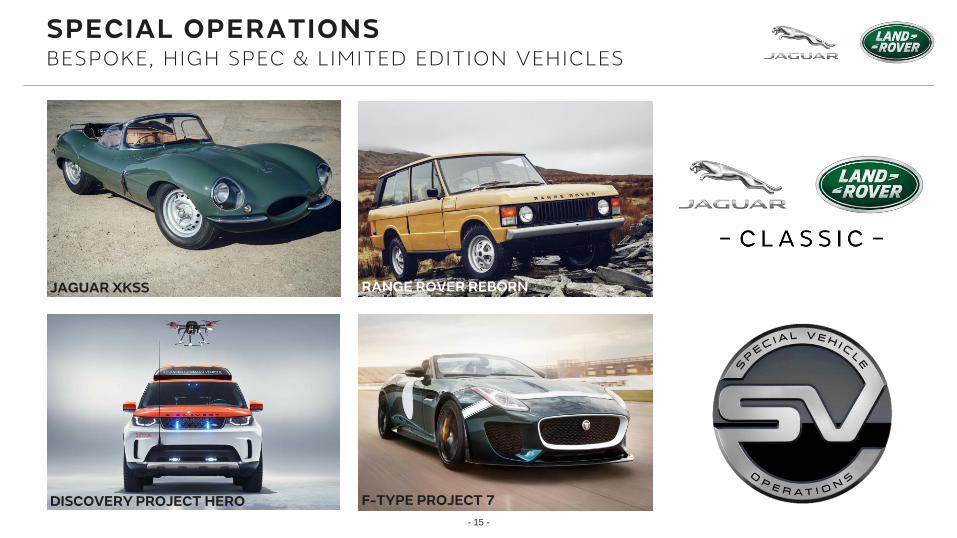
SPECIAL OPERATIONSBESPOKE, HIGH SPEC & LIMITED EDITION VEHICLES
F-TYPE PROJECT 7
JAGUAR XKSS RANGE ROVER REBORN
DISCOVERY PROJECT HERO
- 16 -
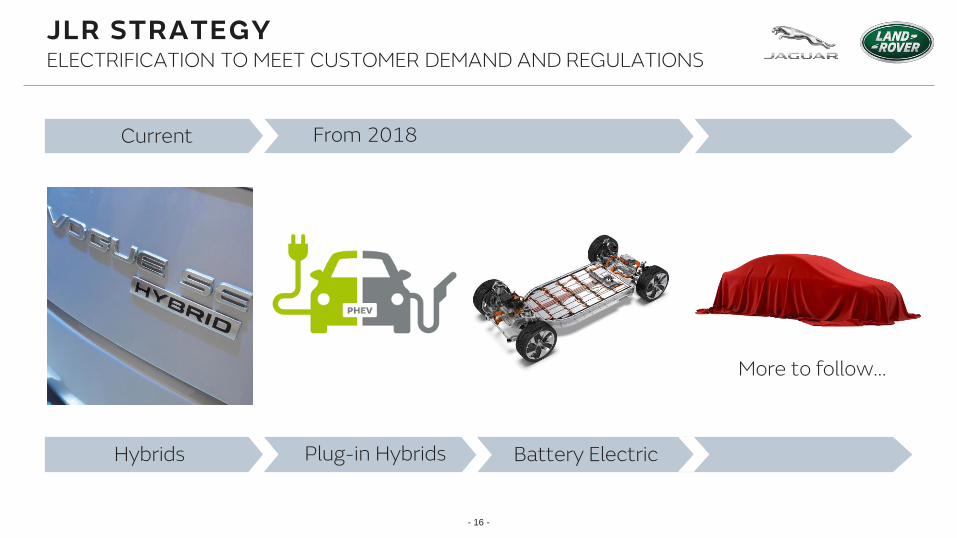
From 2018
JLR STRATEGYELECTRIFICATION TO MEET CUSTOMER DEMAND AND REGULATIONS
Hybrids
More to follow…
Current
Plug-in Hybrids Battery Electric
- 17 -
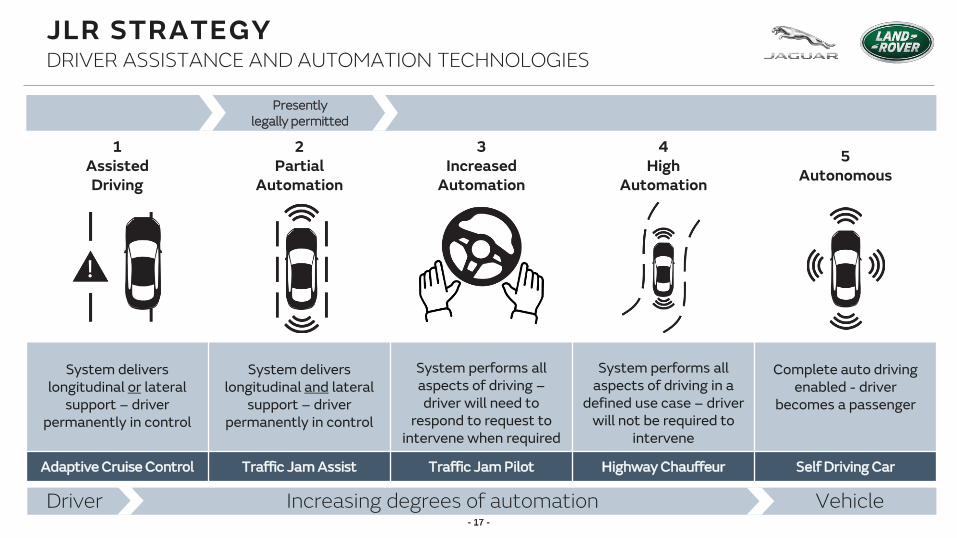
1AssistedDriving
2Partial
Automation
3Increased
Automation
4 High
Automation
5 Autonomous
System delivers longitudinal or lateral
support – driver permanently in control
System delivers longitudinal and lateral
support – driver permanently in control
System performs all aspects of driving –driver will need to
respond to request to intervene when required
System performs all aspects of driving in a
defined use case – driver will not be required to
intervene
Complete auto driving enabled - driver
becomes a passenger
Adaptive Cruise Control Traffic Jam Assist Traffic Jam Pilot Highway Chauffeur Self Driving Car
JLR STRATEGYDRIVER ASSISTANCE AND AUTOMATION TECHNOLOGIES
- 17 -
Driver Increasing degrees of automation Vehicle
Presently legally permitted
- 18 -
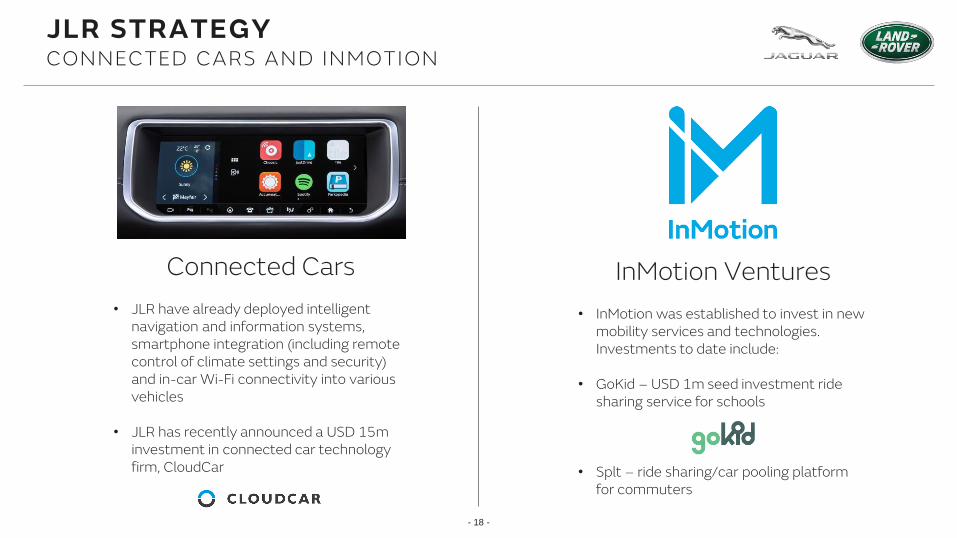
JLR STRATEGYCONNECTED CARS AND INMOTION
Connected Cars
• JLR have already deployed intelligent navigation and information systems, smartphone integration (including remote control of climate settings and security) and in-car Wi-Fi connectivity into various vehicles
• JLR has recently announced a USD 15m investment in connected car technology firm, CloudCar
InMotion Ventures
• InMotion was established to invest in new mobility services and technologies. Investments to date include:
• GoKid – USD 1m seed investment ride sharing service for schools
• Splt – ride sharing/car pooling platform for commuters
- 19 -
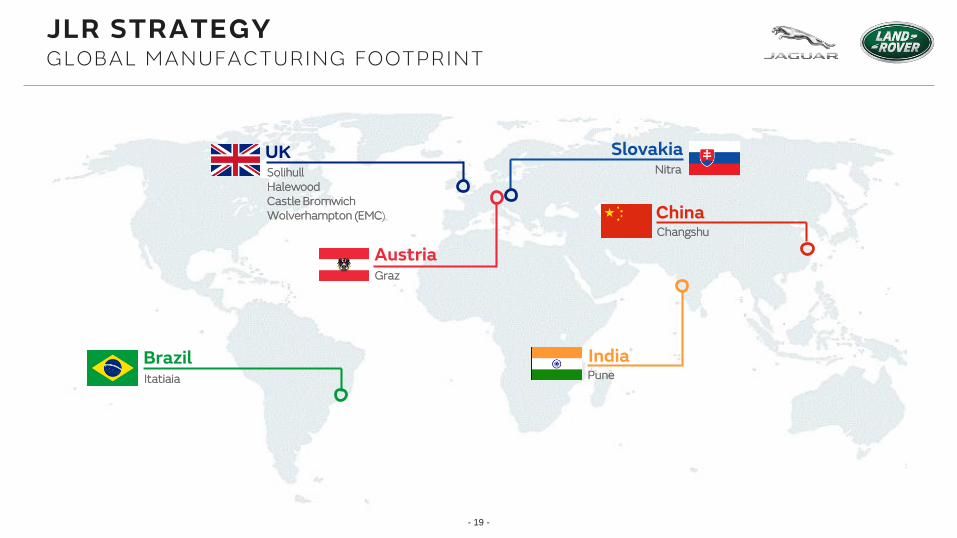
SolihullHalewoodCastle BromwichWolverhampton (EMC)
UK Slovakia
China
Nitra
Changshu
BrazilItatiaia
India
Graz
Austria
JLR STRATEGYGLOBAL MANUFACTURING FOOTPRINT
Pune
- 20 -
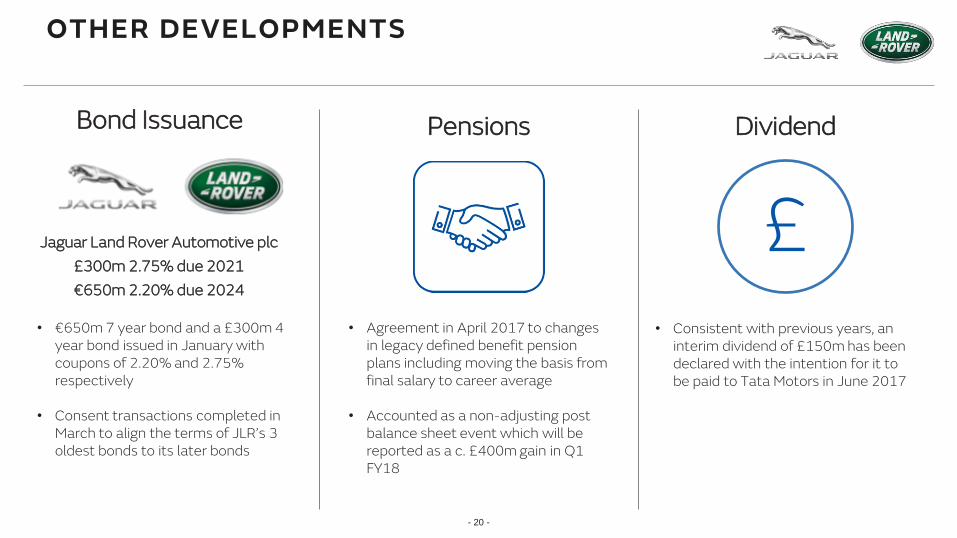
OTHER DEVELOPMENTS
• €650m 7 year bond and a £300m 4 year bond issued in January with coupons of 2.20% and 2.75% respectively
• Consent transactions completed in March to align the terms of JLR’s 3 oldest bonds to its later bonds
• Agreement in April 2017 to changes in legacy defined benefit pension plans including moving the basis from final salary to career average
• Accounted as a non-adjusting post balance sheet event which will be reported as a c. £400m gain in Q1 FY18
Bond Issuance Pensions
Jaguar Land Rover Automotive plc
£300m 2.75% due 2021
€650m 2.20% due 2024
• Consistent with previous years, an interim dividend of £150m has been declared with the intention for it to be paid to Tata Motors in June 2017
Dividend
£

- 21 -
LOOKING AHEADCONTINUING TO INVEST TO DRIVE PROFITABLE GROWTH
• JLR’s strategy is to achieve sustainable profitable growth by investing proportionally more in new products, technology and manufacturing capacity. Consistent with this, FY18 investment spending is expected to be over £4b, including investment in the new Slovakia plant
• Despite increased geo-political uncertainty (e.g Brexit in the UK), major markets including China, the US, Europe and the UK continue to see solid economic growth with only selected markets such as the Middle East, Russia and Brazil showing more fundamental weakness
• JLR’s planning target is to achieve an 8-10% EBIT margin in the medium term, supported by the continued launch of new products and technologies to drive growth with greater operating leverage. However, JLR expects margin pressures seen in FY17 and historical seasonality of volume and profit by Quarter to continue in FY18
• The ramp-up of exciting new products including Land Rover Discovery, the Range Rover Velar and other new models are expected to drive solid growth in FY18 and beyond

- 22 -
Thank You Dr. Ralf Speth
CEO, Jaguar Land Rover
C. Ramakrishnan
Group CFO, Tata Motors
Bennett Birgbauer
Treasurer, Jaguar Land Rover
Jaguar Land Rover Investor Relations
Tata Motors Investor Relations
Jaguar Land Rover
Abbey Road, Whitley, Coventry
CV3 4LF
Jaguarlandrover.com
ADDITIONAL SLIDES

- 24 -
KEY FINANCIAL METRICSSTRONG QUARTER TO CLOSE THE YEAR
(£ millions) Quarter vs prior year Full year
33 36
Retail volumes ('000 units) 179.5 20.7 604.0 82.4
Wholesale volumes ('000 units) 158.9 9.0 534.7 25.4
Revenues 7,268 667 24,339 2,053
EBITDA 1,057 154 2,955 (192)
EBITDA % 14.5% 0.8 ppt 12.1% (2.0 ppt)
EBIT 654 80 1,458 (335)
EBIT % 9.0% 0.3 ppt 6.0% (2.0 ppt)
Profit before tax 676 99 1,610 53
Investment 1,036 294 3,438 303
Free cash flow (before financing) 804 (589) 295 (496)
vs prior year
Period ended 31 March 2017
- 25 -
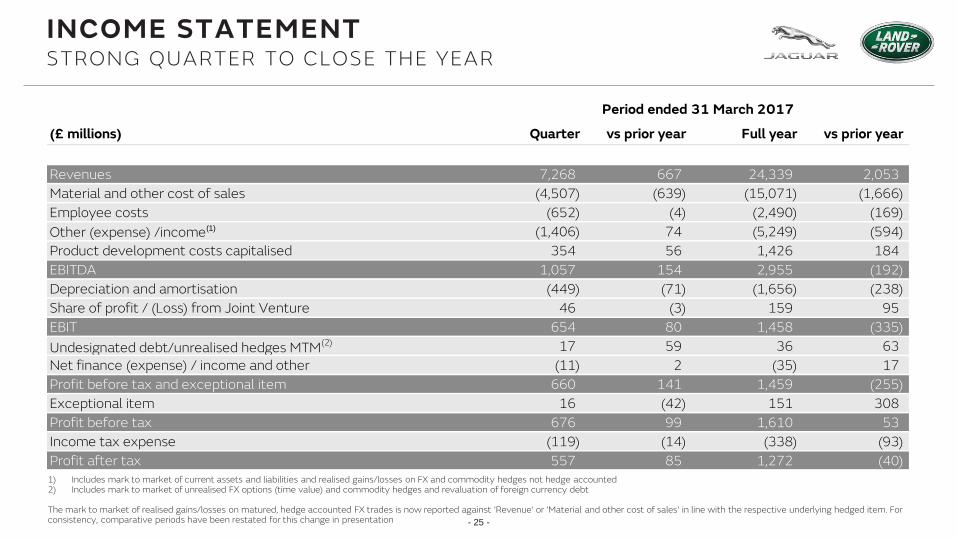
INCOME STATEMENTSTRONG QUARTER TO CLOSE THE YEAR
1) Includes mark to market of current assets and liabilities and realised gains/losses on FX and commodity hedges not hedge accounted2) Includes mark to market of unrealised FX options (time value) and commodity hedges and revaluation of foreign currency debt
The mark to market of realised gains/losses on matured, hedge accounted FX trades is now reported against 'Revenue' or 'Material and other cost of sales' in line with the respective underlying hedged item. For consistency, comparative periods have been restated for this change in presentation
(£ millions) Quarter vs prior year Full year vs prior year
33 36
Revenues 7,268 667 24,339 2,053
Material and other cost of sales (4,507) (639) (15,071) (1,666)
Employee costs (652) (4) (2,490) (169)
Other (expense) /income(1) (1,406) 74 (5,249) (594)
Product development costs capitalised 354 56 1,426 184
EBITDA 1,057 154 2,955 (192)
Depreciation and amortisation (449) (71) (1,656) (238)
Share of profit / (Loss) from Joint Venture 46 (3) 159 95
EBIT 654 80 1,458 (335)
Undesignated debt/unrealised hedges MTM(2) 17 59 36 63
Net finance (expense) / income and other (11) 2 (35) 17
Profit before tax and exceptional item 660 141 1,459 (255)
Exceptional item 16 (42) 151 308
Profit before tax 676 99 1,610 53
Income tax expense (119) (14) (338) (93)
Profit after tax 557 85 1,272 (40)
Period ended 31 March 2017
- 26 -
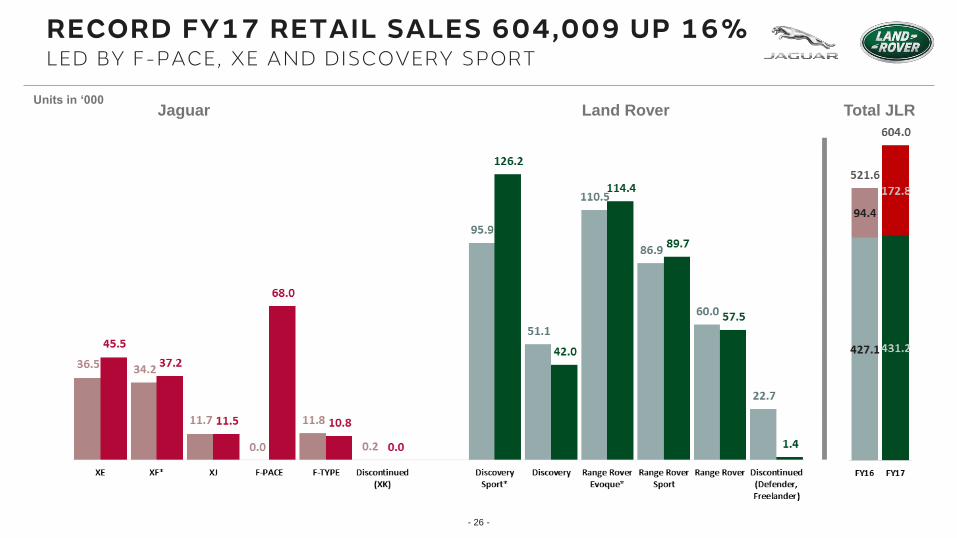
RECORD FY17 RETAIL SALES 604,009 UP 16%LED BY F-PACE, XE AND DISCOVERY SPORT
Units in ‘000Land RoverJaguar Total JLR

- 27 -
RECORD Q4 RETAIL SALES OF 179,509 UP 13%ALL REGIONS UP EXCEPT OVERSEAS
Units in ‘000
North America
UK Europe China Overseas
+22% +20% +6% +22% (5)%
Volumes include sales from Chery Jaguar Land Rover – Q4 FY17 18,097 units
43
35
43
34
25
24% 24%20% 19% 14%
- 28 -
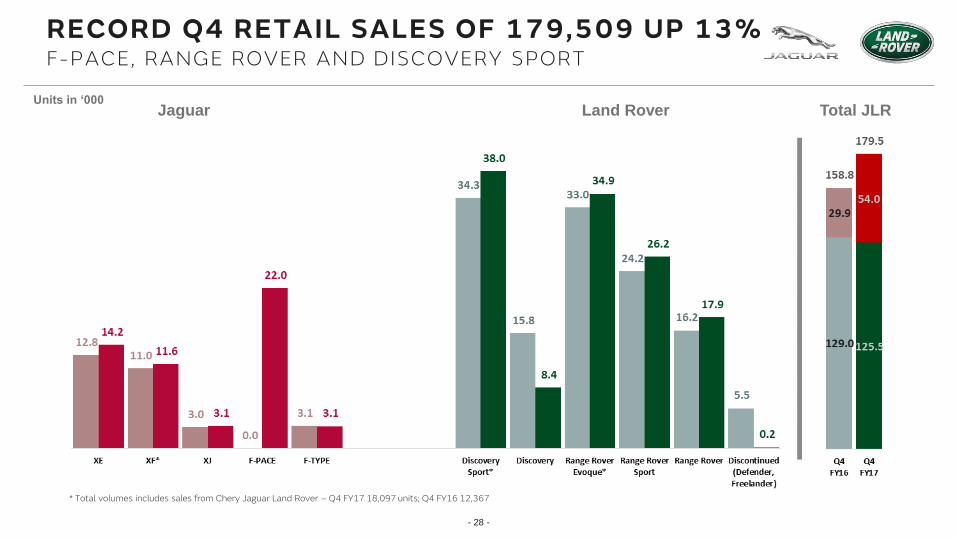
RECORD Q4 RETAIL SALES OF 179,509 UP 13%F-PACE, RANGE ROVER AND DISCOVERY SPORT
* Total volumes includes sales from Chery Jaguar Land Rover – Q4 FY17 18,097 units; Q4 FY16 12,367
Units in ‘000Land RoverJaguar Total JLR
- 29 -
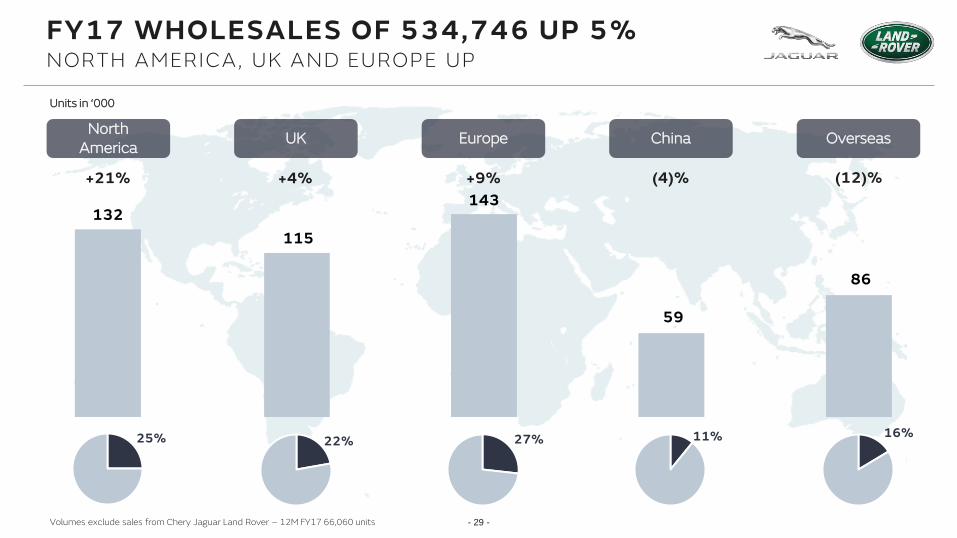
FY17 WHOLESALES OF 534,746 UP 5%NORTH AMERICA, UK AND EUROPE UP
Units in ‘000
North America
UK Europe China Overseas
+21% +4% +9% (4)% (12)%
86
16%
59
11%
143
27%
115
22%
132
25%
Volumes exclude sales from Chery Jaguar Land Rover – 12M FY17 66,060 units

- 30 -
FY17 WHOLESALES OF 534,746 UP 5%MAINLY F-PACE, RUN-OUT OF DISCOVERY AND DEFENDER
* Total volumes excludes sales from Chery Jaguar Land Rover – 12M FY17 66,060 units. 12M FY16 34,751
Units in ‘000Land RoverJaguar Total JLR
- 31 -
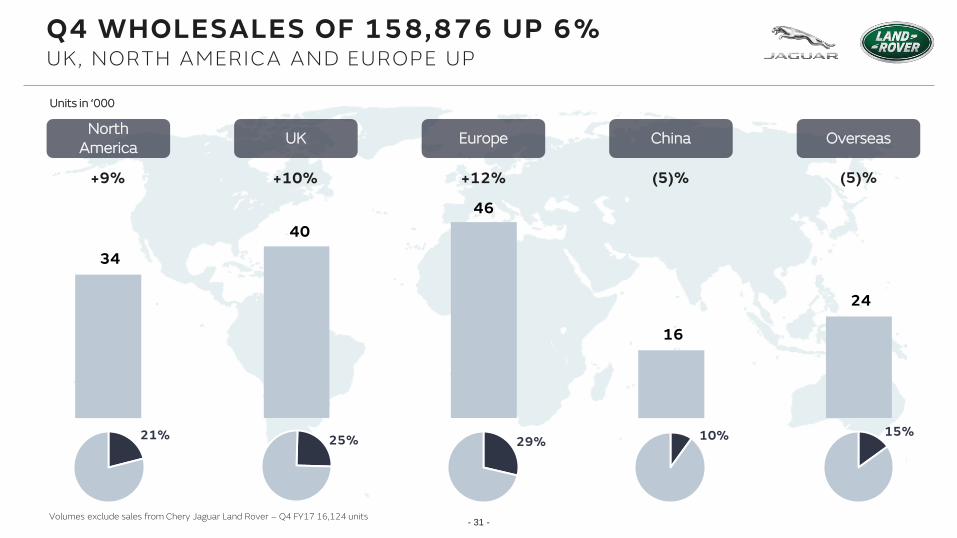
Q4 WHOLESALES OF 158,876 UP 6%UK, NORTH AMERICA AND EUROPE UP
Units in ‘000
North America
UK Europe China Overseas
+9% +10% +12% (5)% (5)%
Volumes exclude sales from Chery Jaguar Land Rover – Q4 FY17 16,124 units
24
46
15%29%
16
10%
40
25%
34
21%

- 32 -
Q4 WHOLESALES OF 158,876 UP 6%LED BY F-PACE, NEW DISCOVERY SALES STARTED
* Total volumes excludes sales from Chery Jaguar Land Rover – Q4 FY17 16,124 units. Q4 FY16 12,532
Units in ‘000Land RoverJaguar Total JLR
- 33 -
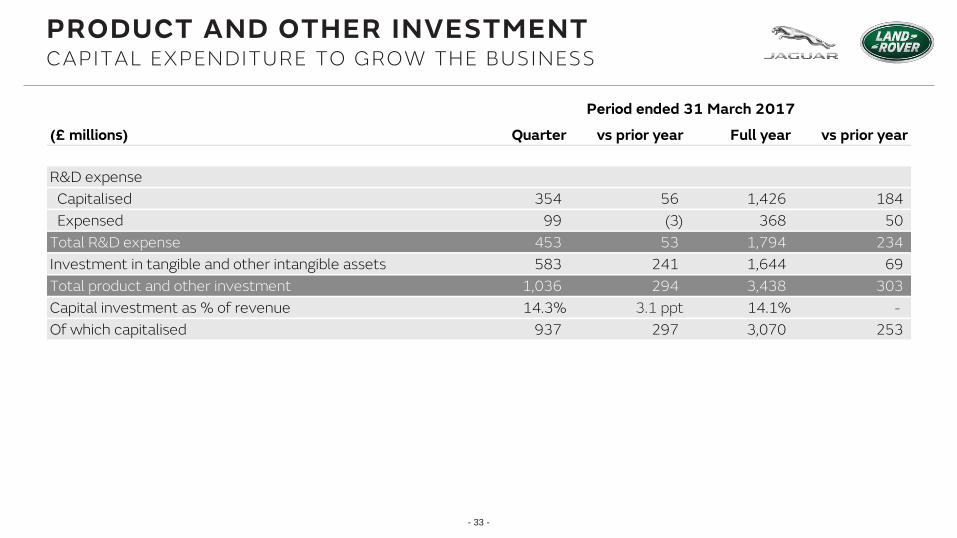
PRODUCT AND OTHER INVESTMENTCAPITAL EXPENDITURE TO GROW THE BUSINESS
(£ millions) Quarter vs prior year Full year vs prior year
33 36
R&D expense
Capitalised 354 56 1,426 184
Expensed 99 (3) 368 50
Total R&D expense 453 53 1,794 234
Investment in tangible and other intangible assets 583 241 1,644 69
Total product and other investment 1,036 294 3,438 303
Capital investment as % of revenue 14.3% 3.1 ppt 14.1% -
Of which capitalised 937 297 3,070 253
Period ended 31 March 2017

- 34 -
FX AND HEDGINGHEDGING LOSSES MORE THAN OFFSET BY OPERATIONAL GAINS
• JLR has significant operational FX exposures, particularly USD and RMB revenue and net EUR cost with each of these currencies accounting for over 20% of sales but in the case of the Euro, this is more than offset by over 50% of JLR components being sourced from the eurozone
• As these are structural exposures which cannot be quickly changed, JLR hedges in descending percentages over 5 years, historically up to 85% 1 year out decreasing to 10% 5 years out in order to mitigate currency volatility/risk whether unfavourable or favourable
• In FY17 with Brexit, the pound moved to historically low levels, resulting in significant hedging losses, however, these have been offset by favourable operating exchange on the underlying exposures as shown below:
• Favourable operating exchange with growing volumes is generally expected to continue to offset hedging losses in FY18 and at 31 March exchange rates (e.g $1.246), hedging losses would be expected to start to reduce in Q4 FY18
1) The operating exchange variance is calculated by flexing the year over year exchange rates on the FX exposures but as there is no revenue or cost contract rate the absolute amount of hedging losses and gains cannot be calculated as it can for hedge contracts.
(£ millions) FY16 FY17 YoY
Operational exchange1 n/a n/a 982
Realised FX hedges and other (266) (1,246) (980)
Operating exchange net of realised hedges n/a n/a 2
Other FX and commodity revaluation (184) (177) 8
- 35 -
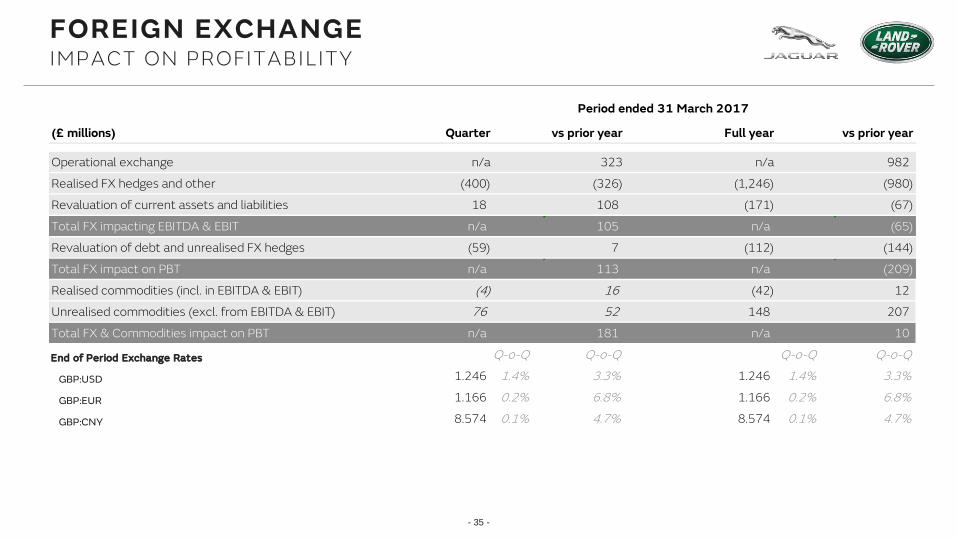
FOREIGN EXCHANGEIMPACT ON PROFITABILITY
(£ millions) Quarter vs prior year Full year vs prior year33 36
Operational exchange n/a 323 n/a 982
Realised FX hedges and other (400) (326) (1,246) (980)
Revaluation of current assets and liabilities 18 108 (171) (67)
Total FX impacting EBITDA & EBIT n/a 105 n/a (65)
Revaluation of debt and unrealised FX hedges (59) 7 (112) (144)
Total FX impact on PBT n/a 113 n/a (209)
Realised commodities (incl. in EBITDA & EBIT) (4) 16 (42) 12
Unrealised commodities (excl. from EBITDA & EBIT) 76 52 148 207
Total FX & Commodities impact on PBT n/a 181 n/a 10
End of Period Exchange Rates Q-o-Q Q-o-Q Q-o-Q Q-o-Q
GBP:USD 1.246 1.4% 3.3% 1.246 1.4% 3.3%
GBP:EUR 1.166 0.2% 6.8% 1.166 0.2% 6.8%
GBP:CNY 8.574 0.1% 4.7% 8.574 0.1% 4.7%
Period ended 31 March 2017
- 36 -
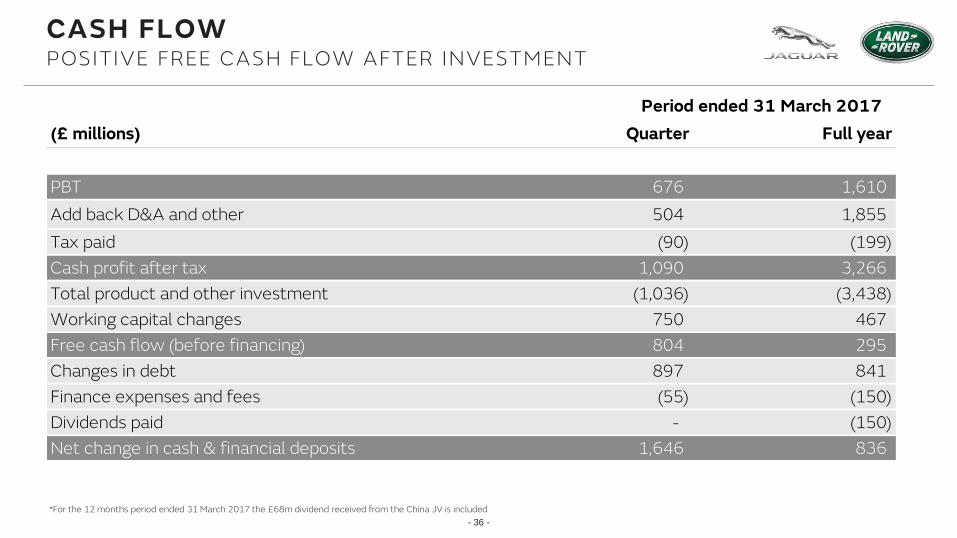
CASH FLOWPOSITIVE FREE CASH FLOW AFTER INVESTMENT
*For the 12 months period ended 31 March 2017 the £68m dividend received from the China JV is included
(£ millions) Quarterv
s Full year
33 36
PBT 676 1,610
Add back D&A and other 504 1,855
Tax paid (90) (199)
Cash profit after tax 1,090 3,266
Total product and other investment (1,036) (3,438)
Working capital changes 750 467
Free cash flow (before financing) 804 295
Changes in debt 897 841
Finance expenses and fees (55) (150)
Dividends paid - (150)
Net change in cash & financial deposits 1,646 836
Period ended 31 March 2017
- 37 -
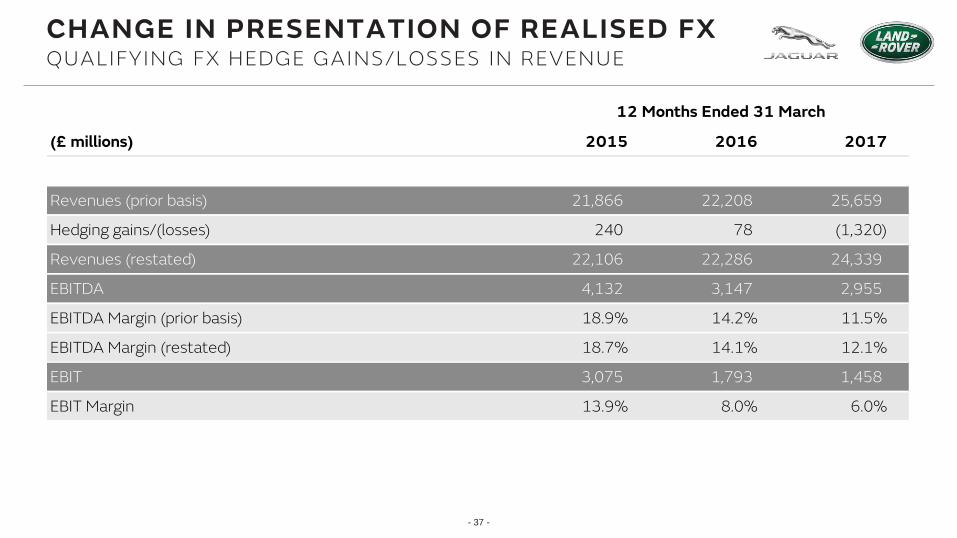
CHANGE IN PRESENTATION OF REALISED FXQUALIFYING FX HEDGE GAINS/LOSSES IN REVENUE
(£ millions) 2015 2016 2017
33 25
Revenues (prior basis) 21,866 22,208 25,659
Hedging gains/(losses) 240 78 (1,320)
Revenues (restated) 22,106 22,286 24,339
EBITDA 4,132 3,147 2,955
EBITDA Margin (prior basis) 18.9% 14.2% 11.5%
EBITDA Margin (restated) 18.7% 14.1% 12.1%
EBIT 3,075 1,793 1,458
EBIT Margin 13.9% 8.0% 6.0%
12 Months Ended 31 March