İSTANBUL TECHNICAL UNIVERSITY INSTITUTE OF SCIENCE AND TECHNOLOGY
M.Sc. Thesis by Sermet SARIÜNAL, B.Sc.
Department : Textile Engineering
Programme : Textile Engineering
OCTOBER 2008
SUPPLY CHAIN MANAGEMENT AND ITS APPLICATIONS IN TEXTILE INDUSTRY
İSTANBUL TECHNICAL UNIVERSITY INSTITUTE OF SCIENCE AND TECHNOLOGY
M.Sc. Thesis by Sermet SARIÜNAL, B.Sc.
(503041811)
Date of submission : 15 September 2008 Date of defence examination: 22 October 2008
Supervisors (Chairmans) : Assoc. Prof. Dr. N. Çiğdem GÜRSOY Dr. Halil Halefşan SÜMEN
Members of the Examining Committee : Prof. Dr. Ali DEMİR (ITU) Prof. Dr. Fatma KALAOĞLU (ITU) Assis. Prof.Dr. H. Bersam BOLAT (ITU)
OCTOBER 2008
SUPPLY CHAIN MANAGEMENT AND ITS APPLICATIONS IN TEXTILE INDUSTRY
EKİM 2008
İSTANBUL TEKNİK ÜNİVERSİTESİ FEN BİLİMLERİ ENSTİTÜSÜ
YÜKSEK LİSANS TEZİ Müh. Sermet SARIÜNAL
(503041811)
Tezin Enstitüye Verildiği Tarih : 15 Eylül 2008 Tezin Savunulduğu Tarih : 22 Ekim 2008
Tez Danışmanları : Doç. Dr. Nevin Çiğdem GÜRSOY Öğr. Gör. Dr. Halil Halefşan SÜMEN
Diğer Jüri Üyeleri : Prof. Dr. Ali DEMİR (İTÜ) Prof. Dr. Fatma KALAOĞLU (İTÜ) Yrd. Doç. Dr. H. Bersam BOLAT (İTÜ)
TEDARİK ZİNCİRİ YÖNETİMİ VE TEKSTİL ENDÜSTRİSİNDEKİ UYGULAMALARI
ii
ACKNOWLEGMENT
I would like to express my sincere appreciation to my supervisor, Dr. H. Halefşan Sümen, for his invaluable guidance, provided direction, continuous support, encouragement and insight throughout this study and supporting me to face the problems. Thanks to Assoc. Prof. Dr. N. Çiğdem Gürsoy for her contributing at the beginning of this study. Thanks to Dagi company for giving me the chance to make practice, which set the skeleton of my study.
Finally, I wish to express my deepest gratitude to my parents and my friends for their endless support, care and patience.
September 2008
Sermet SARIÜNAL
Textile Engineer
iii
TABLE OF CONTENTS
Page
ABBREVIATIONS……………………………………………………………………………….v LIST OF TABLES………………………………………………………………………………vi LIST OF FIGURES…………………………………………………………………………….vii SUMMARY……………………………………………………………………………………..viii ÖZET……………………………………………………………………………………………..ix 1. INTRODUCTION……………………………………………………………………………..1
1.1 What Is A Supply Chain?.………………………………………………………………1 1.2 Decision Phases in a Supply Chain……………………………………………………3 1.3 Process View of a Supply Chain……………………………………………………….5
1.3.1 Cycle view of supply chain processes………………………………...………..5 1.3.1.1 Customer order cycle…………………………….……………………...7 1.3.1.2 Replenishment cycle…………………………………………………….9 1.3.1.3 Manufacturing cycle……………………………………………………10 1.3.1.4 Procurement cycle………..…………………………………….………12
1.3.2 Push/Pull view of supply chain processes………………………………...….13 1.4 Supply Chain Macro Processes in a Firm…………………………………………...16 1.5 The Goal of a Supply Chain…………………………………………………………..17
2. SUPPLY CHAIN MANAGEMENT………………………………………………………...18 2.1 Basic Concepts of Supply Chain Management……………………………………..18 2.2 How the Supply Chain Works…………………………………………………………21
2.2.1. Production……………………………………………………………………….22 2.2.2 Inventory………………………………………………………………………….23 2.2.3 Location…………………………………………………………………………..24 2.2.4 Transportation……………………………………………………………………25 2.2.5 Information……………………………………………………………………….27
2.3 Participants in the Supply Chain……………………………………………………...29 2.3.1 Producers………………………………………………………………………...29 2.3.2 Distributors……………………………………………………………………….30 2.3.3 Retailers…………………………………………………………………………..30 2.3.4 Customers………………………………………………………………………..30 2.3.5 Service providers………………………………………………………………..31
2.4 Supply Chain Operations……………………………………………………………...33 2.4.1 Supply chain operations reference (SCOR) model……...…………………..34
2.4.1.1 The SCOR framework………………………………………………....36 2.4.1.2 Process categories……………………………………………………..42
2.5 Demand Chain Management………………………………………………………….49 2.5.1 Supply chains lead the way…………………………………………………….49 2.5.2 Selling through the demand chain……………………………………………..50 2.5.3 Evolution of demand chain management…………………….……………….50
2.6 Supply Chain Coordination and Use of Technology………………………………..52 2.6.1 The “Bullwhip” effect…………………………………………………………….52 2.6.2 Effect of lack of coordination on performance………………………………..54
2.6.2.1 Manufacturing cost……………………………………………………..55 2.6.2.2 Inventory cost…………………………………………………………...55 2.6.2.3 Replenishment lead time………………………………………………55 2.6.2.4 Transportation cost……………………………………………………..55 2.6.2.5 Labor cost for shipping and receiving………………………………..55 2.6.2.6 Level of product availability……………………………………………56
iv
2.6.2.7 Relationships across the supply chain………………………………56 2.6.3 Coordination in the supply chain……………………………………………...57
2.7 Demand Forecasting……………………………..……………………………………59 2.7.1 The importance of demand forecasting…...................................................64 2.7.2 Demand forecasting principles…………………………………………………65 2.7.3 Forecasting components………………………………………………………..66
3. THE STRUCTURE OF THE TEXTILE AND CLOTHING SECTOR…………………..68 3.1 The Supply Chain in the Textiles and Clothing Sectors……………………………69
3.1.1 The retail sector………………………………………………………………….70 3.1.2 Clothing…………………………………………………………………………...72 3.1.3 Textiles……………………………………………………………………………74 3.1.4 The integrated supply chain – some examples………………………………76
3.2 Supply Chain Networks in the Textile Sector………………………………………..78 3.2.1 The agency theory as an analytical framework………………………………79 3.2.2 Agency relationships in supply chain networks………………………………81 3.2.3 Target costing in agency supply chain relationships…………………….…..85 3.2.4 Perspectives on further work…………………………………………………...86
3.3 Some preliminary remarks on the textile industry and the cases analyzed……...87 3.4 The textile chain………………………………………………………………………..88
3.4.1 Product design…………………………………………………………………...89 3.4.2 Fiber production………………………………………………………………….89 3.4.3 Yarn and fabric production……………………………………………………..90 3.4.4 Fabric dyeing and finishing……………………………………………………..90 3.4.5 Clothing production……………………………………………………………...90 3.4.6 Selling and distribution………………………………………………………….91 3.4.7 Recycling and disposal………………………………………………………….91
3.5 The Clothing Chain…………………………………………………………………….91 3.5.1 The clothing supply chain and its weak points……………………………….91
3.5.1.1 Weak points in forward supply chain logistics……………………….92 3.5.1.2 Weak points in return logistics………………………………………...98 3.5.1.3 Possible consequences of weak points…………………………….100
4. APPLICATIONS OF SCM IN THE TEXTILE INDUSTRY…………………………….104 4.1 About DAGI……………………………………………………………………………104
4.1.1 History of Dagi………………………………………………………………….105 4.1.2 Product of Dagi…………………………………………………………………105
4.2 Supply Chain Steps of Dagi………………………………………………………….105 4.3 Demand Forecasting in Dagi………………………………………………………...116
4.3.1 Qualitative forecasting methods……………………………………………...116 4.3.2 Quantitative demand forecasting methods……………………..…………...118
5. CONCLUSION……………………………………………………………………………..126 REFERENCES ………………………………………………………………………………..128 RESUME………………………………………………………………………………………133
v
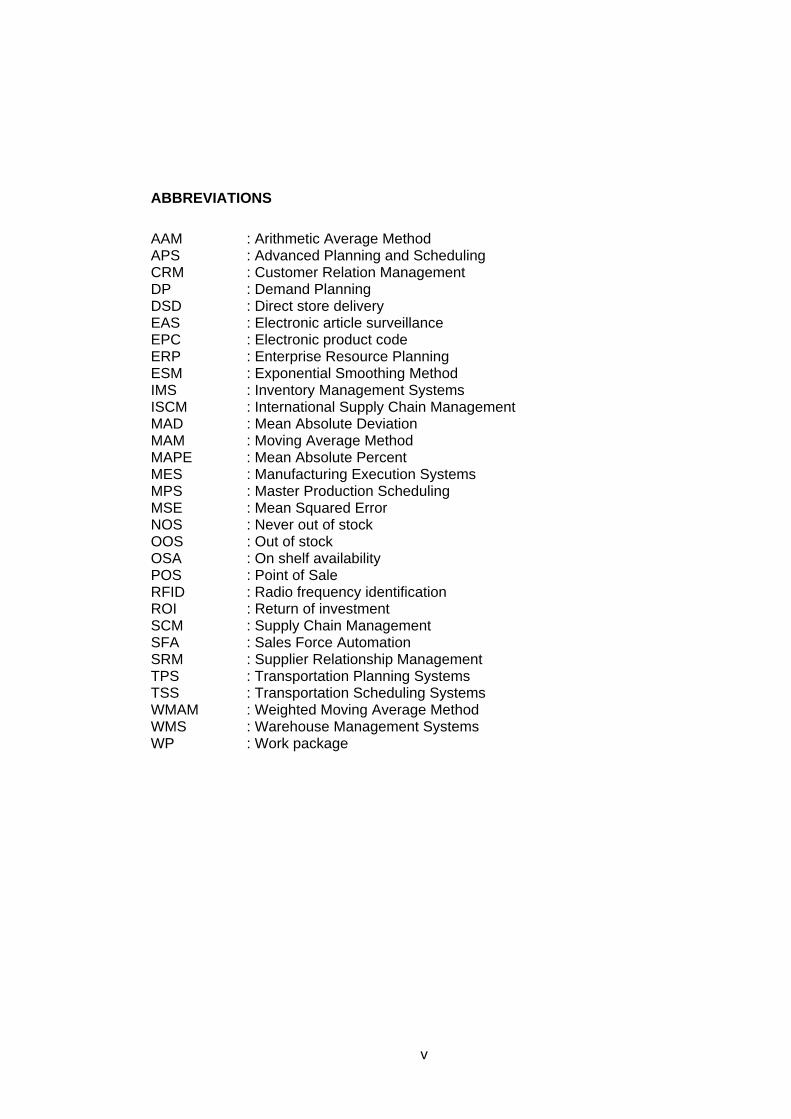
ABBREVIATIONS
AAM : Arithmetic Average Method APS : Advanced Planning and Scheduling CRM : Customer Relation Management DP : Demand Planning DSD : Direct store delivery EAS : Electronic article surveillance EPC : Electronic product code ERP : Enterprise Resource Planning ESM : Exponential Smoothing Method IMS : Inventory Management Systems ISCM : International Supply Chain Management MAD : Mean Absolute Deviation MAM : Moving Average Method MAPE : Mean Absolute Percent MES : Manufacturing Execution Systems MPS : Master Production Scheduling MSE : Mean Squared Error NOS : Never out of stock OOS : Out of stock OSA : On shelf availability POS : Point of Sale RFID : Radio frequency identification ROI : Return of investment SCM : Supply Chain Management SFA : Sales Force Automation SRM : Supplier Relationship Management TPS : Transportation Planning Systems TSS : Transportation Scheduling Systems WMAM : Weighted Moving Average Method WMS : Warehouse Management Systems WP : Work package
vi
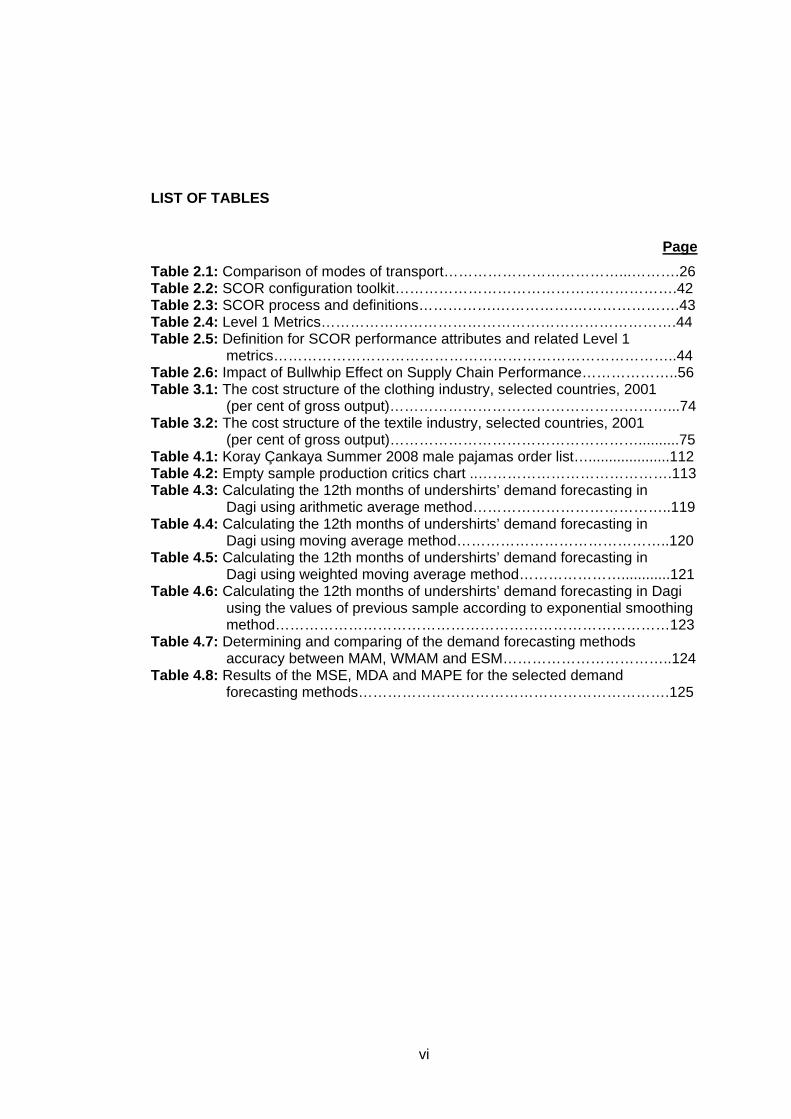
LIST OF TABLES
Page Table 2.1: Comparison of modes of transport………………………………...……….26 Table 2.2: SCOR configuration toolkit………………………………………………….42 Table 2.3: SCOR process and definitions…………….…………….………………….43 Table 2.4: Level 1 Metrics……………………………………………………………….44 Table 2.5: Definition for SCOR performance attributes and related Level 1
metrics………………………………………………………………………..44 Table 2.6: Impact of Bullwhip Effect on Supply Chain Performance………………..56 Table 3.1: The cost structure of the clothing industry, selected countries, 2001
(per cent of gross output)…………………………………………………...74 Table 3.2: The cost structure of the textile industry, selected countries, 2001
(per cent of gross output)……………………………………………..........75 Table 4.1: Koray Çankaya Summer 2008 male pajamas order list…....................112 Table 4.2: Empty sample production critics chart ..………………………………….113 Table 4.3: Calculating the 12th months of undershirts’ demand forecasting in
Dagi using arithmetic average method…………………………………..119 Table 4.4: Calculating the 12th months of undershirts’ demand forecasting in
Dagi using moving average method……………………………………..120 Table 4.5: Calculating the 12th months of undershirts’ demand forecasting in
Dagi using weighted moving average method…………………............121 Table 4.6: Calculating the 12th months of undershirts’ demand forecasting in Dagi
using the values of previous sample according to exponential smoothing method………………………………………………………………………123
Table 4.7: Determining and comparing of the demand forecasting methods accuracy between MAM, WMAM and ESM……………………………..124
Table 4.8: Results of the MSE, MDA and MAPE for the selected demand forecasting methods……………………………………………………….125
vii
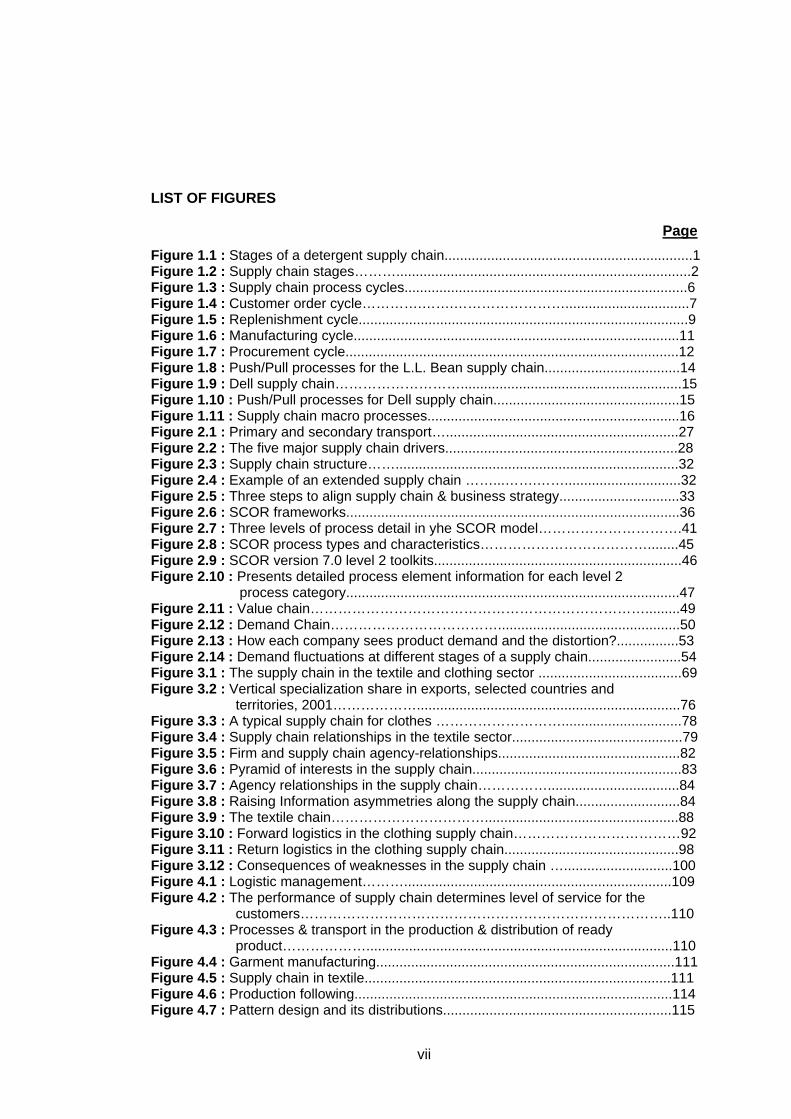
LIST OF FIGURES
Page Figure 1.1 : Stages of a detergent supply chain................................................................1 Figure 1.2 : Supply chain stages………............................................................................2 Figure 1.3 : Supply chain process cycles.........................................................................6 Figure 1.4 : Customer order cycle………….…….……………………................................7 Figure 1.5 : Replenishment cycle.....................................................................................9 Figure 1.6 : Manufacturing cycle....................................................................................11 Figure 1.7 : Procurement cycle......................................................................................12 Figure 1.8 : Push/Pull processes for the L.L. Bean supply chain...................................14 Figure 1.9 : Dell supply chain……………………….........................................................15 Figure 1.10 : Push/Pull processes for Dell supply chain................................................15 Figure 1.11 : Supply chain macro processes.................................................................16 Figure 2.1 : Primary and secondary transport…............................................................27 Figure 2.2 : The five major supply chain drivers............................................................28 Figure 2.3 : Supply chain structure…….........................................................................32 Figure 2.4 : Example of an extended supply chain ……...…….……..............................32 Figure 2.5 : Three steps to align supply chain & business strategy...............................33 Figure 2.6 : SCOR frameworks......................................................................................36 Figure 2.7 : Three levels of process detail in yhe SCOR model………………………….41 Figure 2.8 : SCOR process types and characteristics………………………………........45 Figure 2.9 : SCOR version 7.0 level 2 toolkits................................................................46 Figure 2.10 : Presents detailed process element information for each level 2
process category......................................................................................47 Figure 2.11 : Value chain……………………………………………………………….........49 Figure 2.12 : Demand Chain………………………………...............................................50 Figure 2.13 : How each company sees product demand and the distortion?................53 Figure 2.14 : Demand fluctuations at different stages of a supply chain........................54 Figure 3.1 : The supply chain in the textile and clothing sector .....................................69 Figure 3.2 : Vertical specialization share in exports, selected countries and
territories, 2001………………....................................................................76 Figure 3.3 : A typical supply chain for clothes ………………………...............................78 Figure 3.4 : Supply chain relationships in the textile sector............................................79 Figure 3.5 : Firm and supply chain agency-relationships...............................................82 Figure 3.6 : Pyramid of interests in the supply chain......................................................83 Figure 3.7 : Agency relationships in the supply chain……………..................................84 Figure 3.8 : Raising Information asymmetries along the supply chain...........................84 Figure 3.9 : The textile chain……………………………..................................................88 Figure 3.10 : Forward logistics in the clothing supply chain………………………………92 Figure 3.11 : Return logistics in the clothing supply chain.............................................98 Figure 3.12 : Consequences of weaknesses in the supply chain …............................100 Figure 4.1 : Logistic management……….....................................................................109 Figure 4.2 : The performance of supply chain determines level of service for the
customers……………………………………………………………………..110 Figure 4.3 : Processes & transport in the production & distribution of ready
product………………...............................................................................110 Figure 4.4 : Garment manufacturing.............................................................................111 Figure 4.5 : Supply chain in textile...............................................................................111 Figure 4.6 : Production following..................................................................................114 Figure 4.7 : Pattern design and its distributions...........................................................115
viii
SUPPLY CHAIN MANAGEMENT AND ITS APPLICATIONS IN TEXTILE INDUSTRY
SUMMARY
Supply chain management (SCM) system is the integrated and collaborative
network of suppliers, factories, warehouses, distribution centers, and retailers,
through which the complete chain of logistic processes is administered resulting in
the efficient and flexible coordination of a company, its suppliers and end users. The
supply chain members collaborate, i.e. share information, resources, risk and
activities, this plays a critical role in the implementation of an effective SCM. An
increasing number of companies subscribe to the idea that developing long-term
collaboration, cooperation and partnership can remove significant wastage from the
supply chain and result in commercial advantage.
In the textile supply chain, a partner apparel manufacturer's production processes,
and the technologies used, are investigated. Information about apparel production
and its problems are examined. The Turkish textile industry now operates in an
extremely competitive market, and must overcome this by researching, investigating
and developing distinct product systems. Competitively priced products can be
delivered to the international market by the efficient use of newly developed
technology, the internet and modern transportation methods. Turkish textile
companies, have their own brands throughout chain stores in Turkey and around the
world, and achieve this by developing an understanding of the various dynamic
factors in the economic environment. The Integrated Logistic function is one of the
important factors for newly developed products in the new economic system, which
creates competitive advantages and higher value add. This function is used to
develop new possibilities among suppliers, intermediaries and distributors. This is
the system known as "Supply Chain Management".
ix
TEDARİK ZİNCİRİ YÖNETİMİ VE TEKSTİL ENDÜSTRİSİNDEKİ UYGULAMALARI
ÖZET
Tedarik zinciri yönetim sistemi; tedarikçilerden, fabrikalardan, ambarlardan, dağıtım
merkezlerinden ve bayilerden oluşan; üzerinde, bir şirketin, o şirketin müşterilerinin
ve tedarikçilerinin hızlı ve esnek koordinasyonu için gerekli tüm lojistik işlerinin
yönetildiği; bütünleşmiş ve ortak (işbirlikçi) bir ağdır. Tedarik zincirinin üyeleri
arasındaki, bilgi paylaşımı, kaynak paylaşımı, risk paylaşımı ve faaliyet paylaşımı
gibi "paylaşma" temeline dayalı "işbirliği," etkili bir tedarik zinciri yönetiminin
uygulanmasında çok önemli bir rol oynamaktadır. Bu nedenle de, uzun dönemli
işbirliklerin ve ortaklıkların, tedarik zincirlerini önemli harcamalardan arındırdığı ve
tedarik zincirlerine önemli rekabet avantajı sağladığı fikrini benimseyen şirketlerin
sayısı gün geçtikçe artmaktadır. Bununla birlikte, işbirlikleri ve ortaklıklar, önemli
değişiklikler gerektiren, kurulması ve yürütülmesi zor, karşılıklı fedakârlık isteyen
beraberliklerdir.
Tekstil tedarik zincirinde, bir ortak hazır giyim fabrikasının üretim aşamaları ve
kullanılan teknolojiler incelenir. Konfeksiyon üretimi ve sorunları ile ilgili bilgiler tetkik
edilir. Türk tekstil endüstrisi şuan son derece rekabetçi bir pazarı idare etmektedir ve
araştırma yaparak, inceleme yaparak ve farklı ürün sistemlerini geliştirerek ancak
bunun üstesinden gelinebilinir. Fiyat rekabet edecek şekilde olan ürünler yeni
teknolojilerin, internet ve modern taşımacılık sistemlerinin etkili kullanımıyla
uluslararası pazara katılırlar. Türk tekstil firmaları Türkiye ve dünya çapında kendi
markalarının olduğu zincir mağazalara sahiptir ve bunu ekonomik çevredeki çeşitli
dinamik faktörleri geliştirme anlayışı ile başarmıştır
Bütünleşmiş lojistik fonksiyonu yeni gelişmekte olan ürünlerin yeni ekonomik
sistemlerindeki en önemli faktörlerden biridir. Bu da rekabetçi avantajı ve katma
değeri arttırmayı sağlar. Bu fonksiyon tedarikçiler, aracılar ve dağıtıcılar arasındaki
yeni imkânların gelişiminde kullanılır. Bu sistem “Tedarik Zinciri Yönetimi” olarak
bilinir.
1
1. INTRODUCTION
1.1 What Is A Supply Chain?
The term ‘supply chain’ may need definition since many people think of it as a purely
linear model. It is a common misconception that the term describes a horizontal
chain of action and reaction. Obviously such a ‘chain’ would by definition include all
parties involved, directly or indirectly, in fulfilling customer requests i.e.
manufacturers, suppliers, transporters, warehouses, retailers, and consumers. This
remit also covers functions, including, (but not exclusively), new product
development, marketing, operations, distribution, finance, and customer service
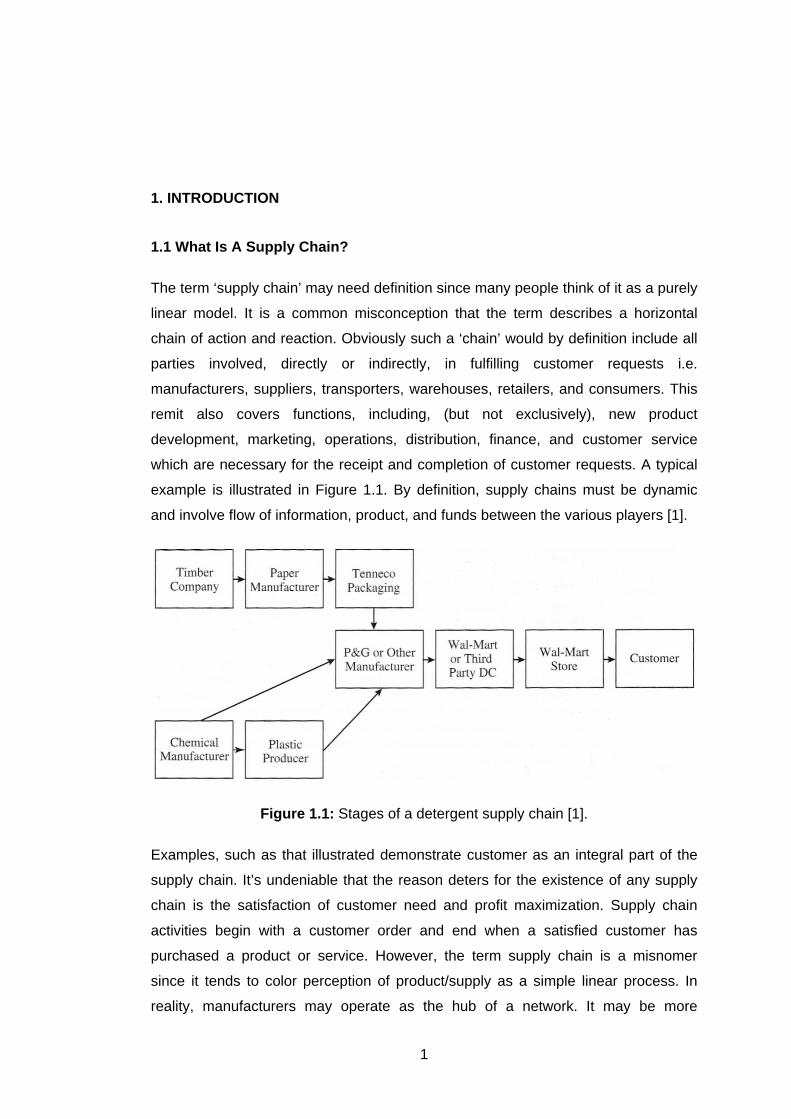
which are necessary for the receipt and completion of customer requests. A typical
example is illustrated in Figure 1.1. By definition, supply chains must be dynamic
and involve flow of information, product, and funds between the various players [1].
Figure 1.1: Stages of a detergent supply chain [1].
Examples, such as that illustrated demonstrate customer as an integral part of the
supply chain. It’s undeniable that the reason deters for the existence of any supply
chain is the satisfaction of customer need and profit maximization. Supply chain
activities begin with a customer order and end when a satisfied customer has
purchased a product or service. However, the term supply chain is a misnomer
since it tends to color perception of product/supply as a simple linear process. In
reality, manufacturers may operate as the hub of a network. It may be more
2
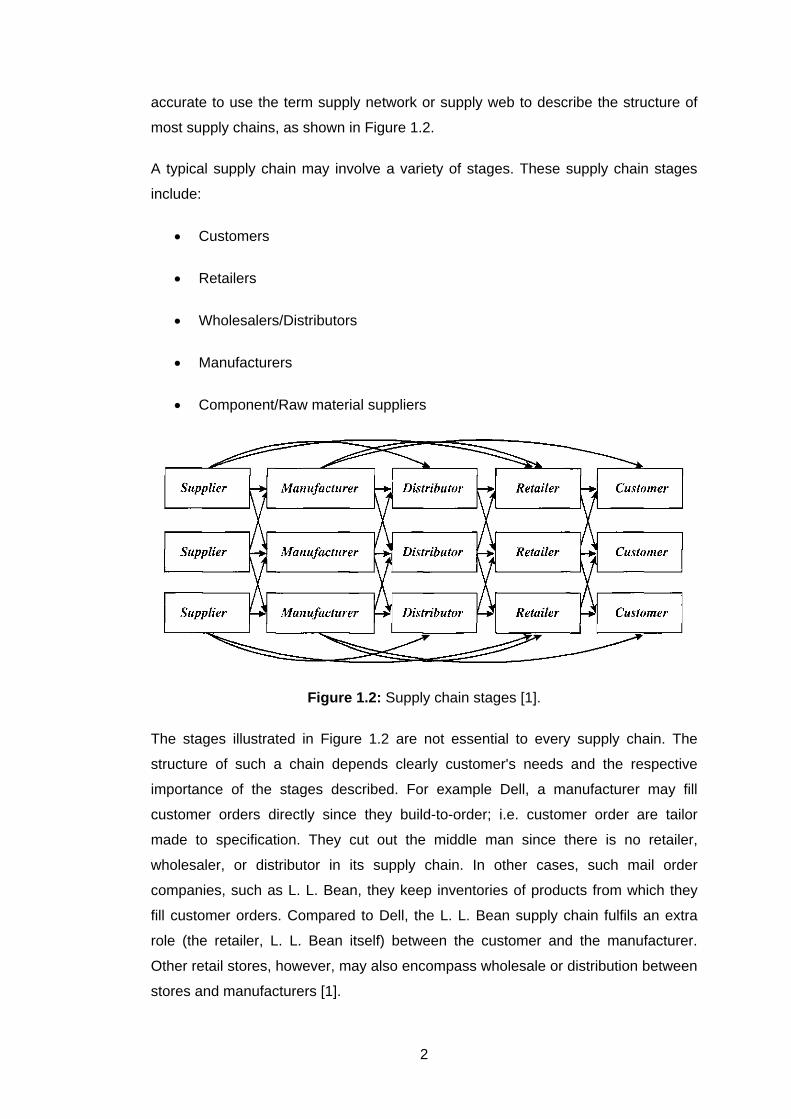
accurate to use the term supply network or supply web to describe the structure of
most supply chains, as shown in Figure 1.2.
A typical supply chain may involve a variety of stages. These supply chain stages
include:
• Customers
• Retailers
• Wholesalers/Distributors
• Manufacturers
• Component/Raw material suppliers
Figure 1.2: Supply chain stages [1].
The stages illustrated in Figure 1.2 are not essential to every supply chain. The
structure of such a chain depends clearly customer's needs and the respective
importance of the stages described. For example Dell, a manufacturer may fill
customer orders directly since they build-to-order; i.e. customer order are tailor
made to specification. They cut out the middle man since there is no retailer,
wholesaler, or distributor in its supply chain. In other cases, such mail order
companies, such as L. L. Bean, they keep inventories of products from which they
fill customer orders. Compared to Dell, the L. L. Bean supply chain fulfils an extra
role (the retailer, L. L. Bean itself) between the customer and the manufacturer.
Other retail stores, however, may also encompass wholesale or distribution between
stores and manufacturers [1].
3
The Objective of a Supply Chain
The goal of every supply chain is to increase overall profitability i.e. the difference
between the value of the final product to the customer and the cost the supply chain
expends in bringing the product to the customer. We can call this supply chain
profitability, this being the difference between revenue from the customer and the
overall cost across the supply chain. For example, a customer may pay $2,000 for a
computer. This sum should cover any costs incurred by the various agents in the
supply chain such as costs to convey information, production, storage,
transportation, etc. Any difference between the $2,000 the customer paid and the
sum of all costs incurred by the supply chain represents the supply chain
profitability, which is the total profit to be distributed across all supply chain stages.
The higher this profitability, the more successful is the supply chain. Therefore
supply chain success should be measured in terms of supply chain profitability and
not in terms of the profits at an individual stage [1].
Having defined the success of a supply chain in terms of supply chain profitability,
we should next investigate the sources of revenue and cost. For any supply chain,
there is only one source of revenue: the customer who as the purchaser is the only
one providing positive cash flow for the supply chain. All other transactions are
merely fund exchanges that occur within the supply chain. When a retailer such as
Wal-Mart pays its supplier, it takes a portion of the customer funds and passing that
money on to the supplier. All activities or flows generate costs within the supply
chain. Hence, the effective management of these flows is a key to supply chain
success. Supply chain management involves the management of flows between and
among stages in a supply chain to maximize total supply chain profitability [1].
1.2 Decision Phases in a Supply Chain
Successful supply chain management requires many decisions, which can be
separated into three groups, relating to the flow of information, product, and funds.
1. Supply chain strategy or design: Initially, a company must determine how to
structure the supply chain over the next several years. It decides the chain's
configuration, how resources will be allocated, and the processes each stage will
perform. Such decisions include location and capacities of production and
warehousing facilities, the products to be manufactured or stored, modes of
transportation used, and the type of information system to be utilized. A firm must
ensure that the supply chain configuration supports its strategic objectives during
4
this phase. Supply chain design decisions are typically made for the long term (a
matter of years) and are very expensive to alter on short notice. Thus, when making
these decisions, companies must be ready for uncertainty in anticipated market
conditions over the next few years.
2. Supply chain planning: For decisions made during this phase, the time frame
considered is a quarter to a year. Therefore, the supply chain's configuration
determined in the strategic phase is fixed. This configuration establishes constraints
within which planning must be done. Companies start the planning phase with a
forecast for the coming year (or a comparable time frame) of demand in different
markets. Planning includes decisions regarding which markets will be supplied from
which locations, the subcontracting of manufacturing, the inventory policies to be
followed, and the timing and size of marketing promotions. Dell's decisions
regarding markets a given production facility will supply and target production
quantities at different locations are classified as planning decisions. Planning
establishes parameters within which a supply chain will function over a specified
period of time. In the planning phase, companies must include uncertainty in
demand, exchange rates, and competition over this time horizon in their decisions.
Given a shorter time horizon and better forecasts than the design phase, companies
in the planning phase try to incorporate any flexibility built into the supply chain in
the design phase and exploit it to optimize performance. As a result of the planning
phase, companies define a set of operating policies that govern short-term
operations.
3. Supply chain operation: The time horizon here is weekly or daily, and during this
phase companies make decisions regarding individual customer orders. At the
operational level, supply chain configuration is considered fixed and planning
policies are already defined. The goal of supply chain operations is to handle
incoming customer orders in the best possible manner. During this phase, firms
allocate inventory or production to individual orders, set a date that an order is to be
filled, generate pick lists at a warehouse, allocate an order to a particular shipping
mode and shipment, set delivery schedules of trucks, and place replenishment
orders. Because operational decisions are being made in the short term (minutes,
hours, or days), there is less uncertainty about demand information. Given the
constraints established by the configuration and planning policies, the goal during
the operation phase is to exploit the reduction of uncertainty and optimize
performance.
5
The design, planning, and operation of a supply chain have a strong impact on
overall profitability and success. Continuing with our example, consider Dell
Computer. In the early 1990s, Dell management began to focus on improving the
design, planning, and operation of the supply chain, with the result of significantly
improved performance. Both profitability and the stock price have soared and Dell
stock has had outstanding returns over this period.
As a summary, identify the three key supply chain decision phases and explain the
significance of each one.
Supply chain decisions may be characterized as strategic (design), planning, or
operational depending on the duration over which they apply. Strategic decisions
relate to supply chain configuration. These decisions have a long-term impact
lasting several years. Planning decisions cover a period of a few months to a year
and include decisions such as production plans, subcontracting, and promotions
over that period. Operational decisions span from minutes to days and include
sequencing production and filling specific orders. Strategic decisions define the
constraints for planning decisions and planning decisions define the constraints for
operational decisions [1].
1.3 Process View of a Supply Chain
A supply chain is a sequence of processes and flows that take place within and
between different stages and combine to fill a customer need for a product. There
are two different ways to view the processes performed in a supply chain:
1. Cycle view: The processes in a supply chain are divided into a series of cycles,
each performed at the interface between two successive stages of a supply chain.
2. Push/pull view: The processes in a supply chain are divided into two categories
depending on whether they are executed in response to a customer order or in
anticipation of customer orders. Pull processes are initiated by a customer order
whereas push processes are initiated and performed in anticipation of customer
orders [1].
1.3.1 Cycle view of supply chain processes
Given the five stages of a supply chain shown in Figure 1.2, all supply chain
processes can be broken down into the following four process cycles, as shown in
Figure 1.3:
6
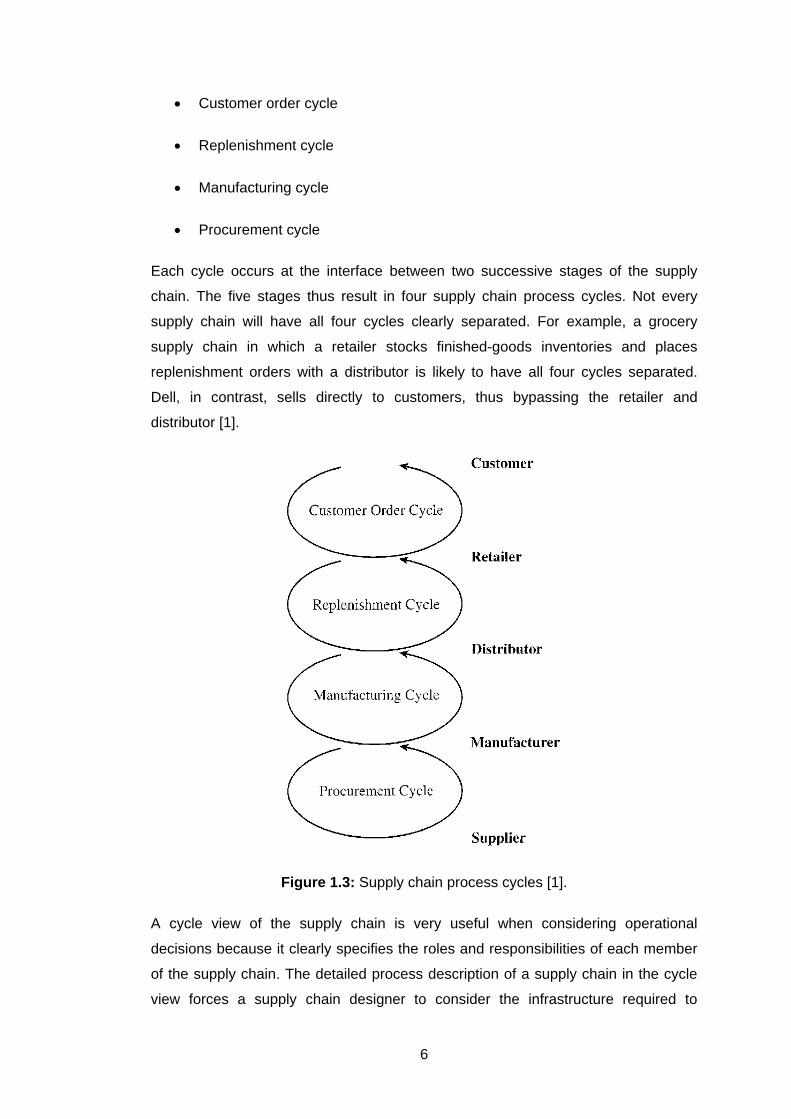
• Customer order cycle
• Replenishment cycle
• Manufacturing cycle
• Procurement cycle
Each cycle occurs at the interface between two successive stages of the supply
chain. The five stages thus result in four supply chain process cycles. Not every
supply chain will have all four cycles clearly separated. For example, a grocery
supply chain in which a retailer stocks finished-goods inventories and places
replenishment orders with a distributor is likely to have all four cycles separated.
Dell, in contrast, sells directly to customers, thus bypassing the retailer and
distributor [1].
Figure 1.3: Supply chain process cycles [1].
A cycle view of the supply chain is very useful when considering operational
decisions because it clearly specifies the roles and responsibilities of each member
of the supply chain. The detailed process description of a supply chain in the cycle
view forces a supply chain designer to consider the infrastructure required to
7
support these processes. The cycle view is useful, for example, when setting up
information systems to support supply chain operations, as process ownership and
objectives are clearly defined. We now describe the various supply chain cycles in
greater detail [1].
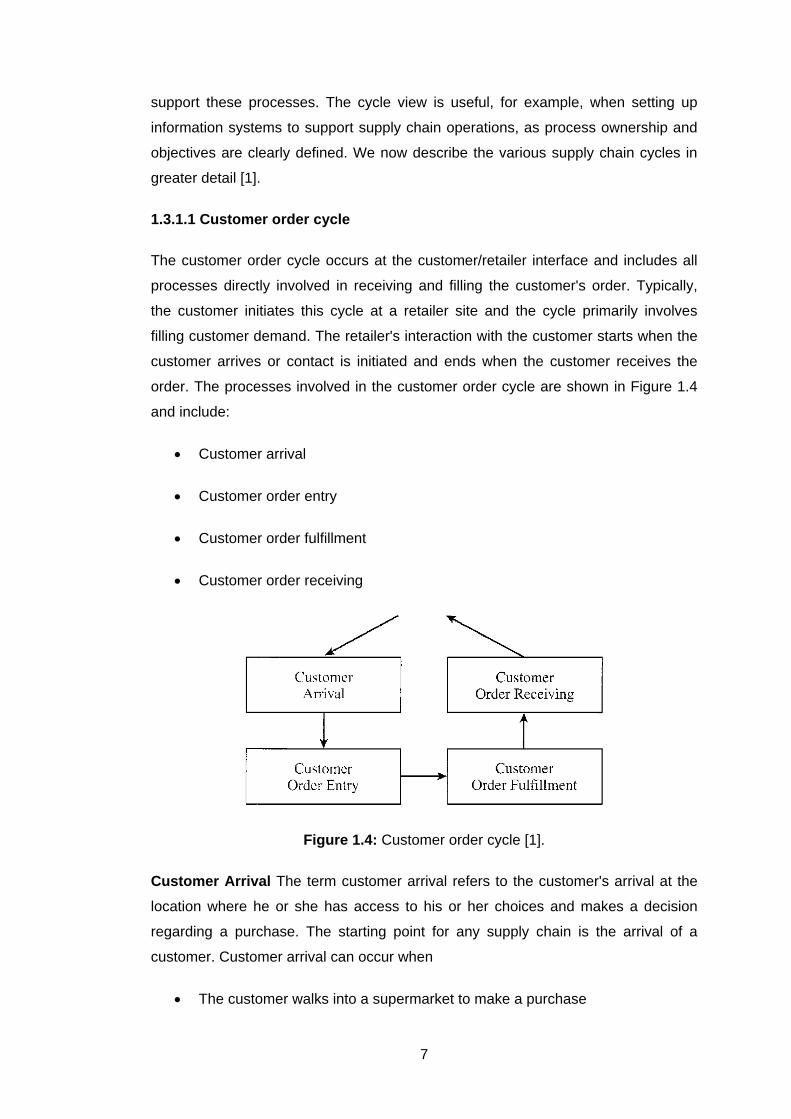
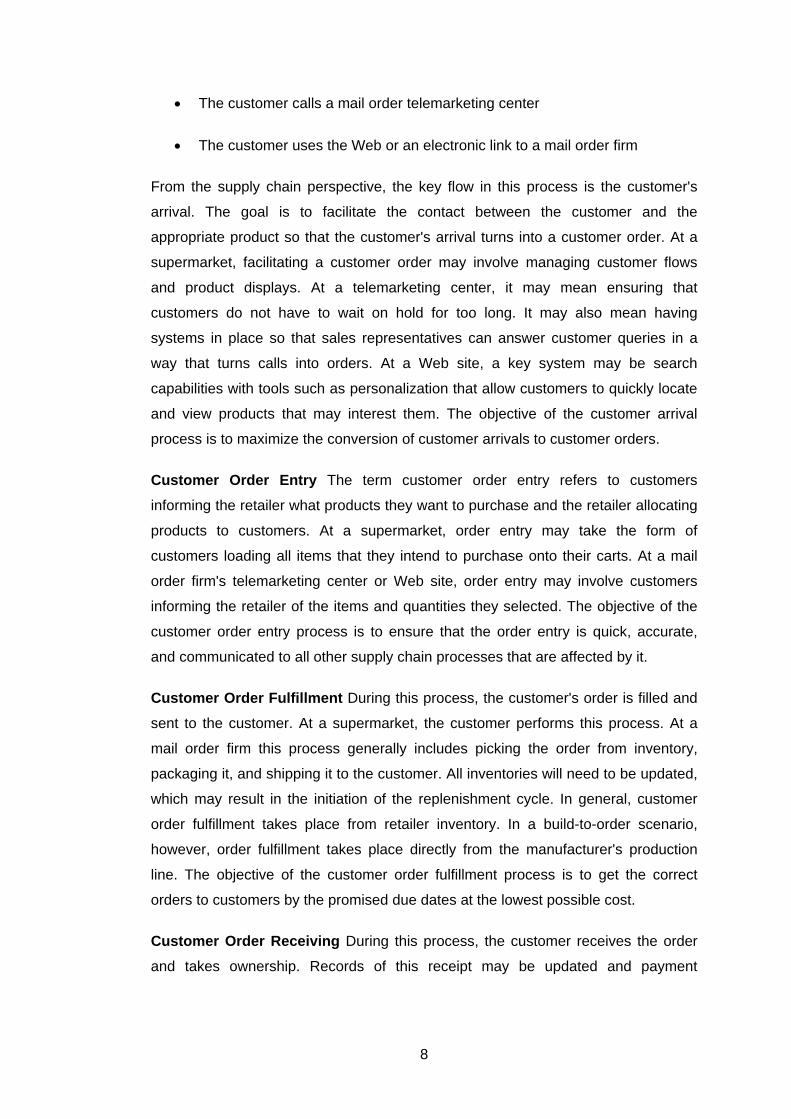
1.3.1.1 Customer order cycle
The customer order cycle occurs at the customer/retailer interface and includes all
processes directly involved in receiving and filling the customer's order. Typically,
the customer initiates this cycle at a retailer site and the cycle primarily involves
filling customer demand. The retailer's interaction with the customer starts when the
customer arrives or contact is initiated and ends when the customer receives the
order. The processes involved in the customer order cycle are shown in Figure 1.4
and include:
• Customer arrival
• Customer order entry
• Customer order fulfillment
• Customer order receiving
Figure 1.4: Customer order cycle [1].
Customer Arrival The term customer arrival refers to the customer's arrival at the
location where he or she has access to his or her choices and makes a decision
regarding a purchase. The starting point for any supply chain is the arrival of a
customer. Customer arrival can occur when
• The customer walks into a supermarket to make a purchase
8
• The customer calls a mail order telemarketing center
• The customer uses the Web or an electronic link to a mail order firm
From the supply chain perspective, the key flow in this process is the customer's
arrival. The goal is to facilitate the contact between the customer and the
appropriate product so that the customer's arrival turns into a customer order. At a
supermarket, facilitating a customer order may involve managing customer flows
and product displays. At a telemarketing center, it may mean ensuring that
customers do not have to wait on hold for too long. It may also mean having
systems in place so that sales representatives can answer customer queries in a
way that turns calls into orders. At a Web site, a key system may be search
capabilities with tools such as personalization that allow customers to quickly locate
and view products that may interest them. The objective of the customer arrival
process is to maximize the conversion of customer arrivals to customer orders.
Customer Order Entry The term customer order entry refers to customers
informing the retailer what products they want to purchase and the retailer allocating
products to customers. At a supermarket, order entry may take the form of
customers loading all items that they intend to purchase onto their carts. At a mail
order firm's telemarketing center or Web site, order entry may involve customers
informing the retailer of the items and quantities they selected. The objective of the
customer order entry process is to ensure that the order entry is quick, accurate,
and communicated to all other supply chain processes that are affected by it.
Customer Order Fulfillment During this process, the customer's order is filled and
sent to the customer. At a supermarket, the customer performs this process. At a
mail order firm this process generally includes picking the order from inventory,
packaging it, and shipping it to the customer. All inventories will need to be updated,
which may result in the initiation of the replenishment cycle. In general, customer
order fulfillment takes place from retailer inventory. In a build-to-order scenario,
however, order fulfillment takes place directly from the manufacturer's production
line. The objective of the customer order fulfillment process is to get the correct
orders to customers by the promised due dates at the lowest possible cost.
Customer Order Receiving During this process, the customer receives the order
and takes ownership. Records of this receipt may be updated and payment
9
completed. At a supermarket, receiving occurs at the checkout counter. For a mail
order firm, receiving occurs when the product is delivered to the customer [1].
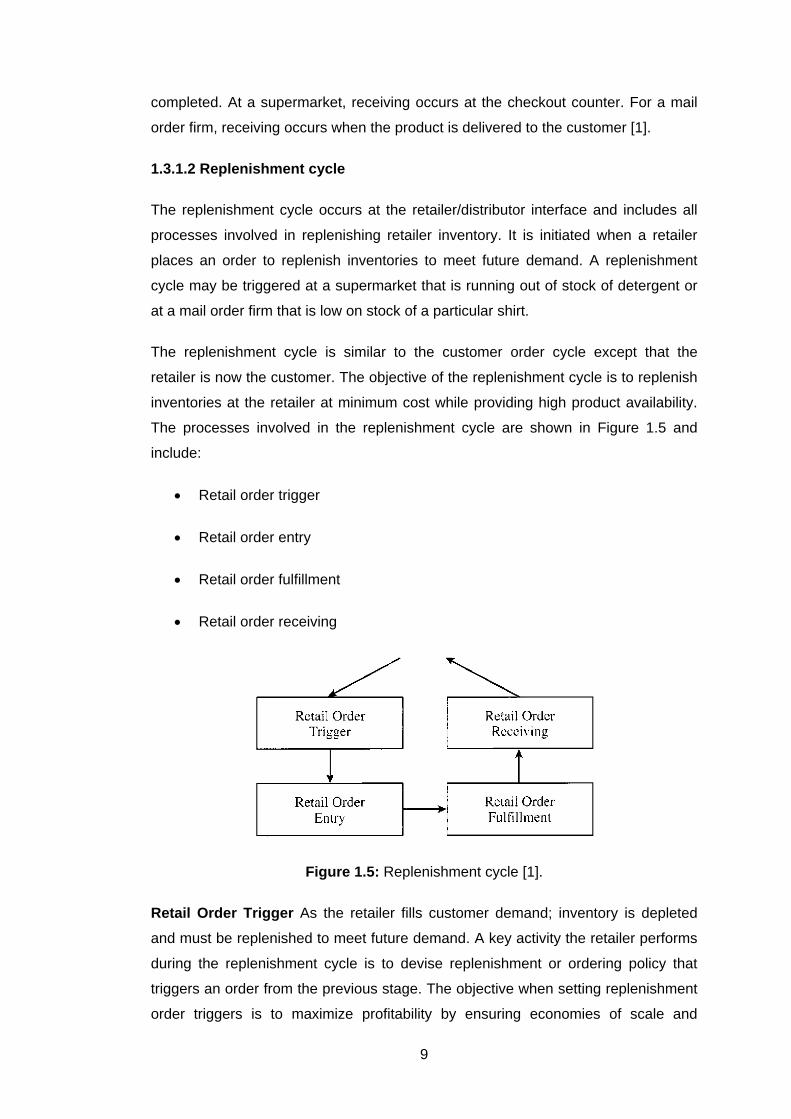
1.3.1.2 Replenishment cycle
The replenishment cycle occurs at the retailer/distributor interface and includes all
processes involved in replenishing retailer inventory. It is initiated when a retailer
places an order to replenish inventories to meet future demand. A replenishment
cycle may be triggered at a supermarket that is running out of stock of detergent or
at a mail order firm that is low on stock of a particular shirt.
The replenishment cycle is similar to the customer order cycle except that the
retailer is now the customer. The objective of the replenishment cycle is to replenish
inventories at the retailer at minimum cost while providing high product availability.
The processes involved in the replenishment cycle are shown in Figure 1.5 and
include:
• Retail order trigger
• Retail order entry
• Retail order fulfillment
• Retail order receiving
Figure 1.5: Replenishment cycle [1].
Retail Order Trigger As the retailer fills customer demand; inventory is depleted
and must be replenished to meet future demand. A key activity the retailer performs
during the replenishment cycle is to devise replenishment or ordering policy that
triggers an order from the previous stage. The objective when setting replenishment
order triggers is to maximize profitability by ensuring economies of scale and
10
balancing product availability and the cost of holding inventory. The outcome of the
retail order trigger process is the generation of a replenishment order that is ready to
be passed on to the distributor or manufacturer.
Retail Order Entry This process is similar to customer order entry at the retailer.
The only difference is that the retailer is now the customer placing the order that is
conveyed to the distributor. This may be done electronically or by some other
medium. Inventory or production is then allocated to the retail order. The objective of
the retail order entry process is that an order be entered accurately and conveyed
quickly to all supply chain processes affected by the order.
Retail Order Fulfillment This process is very similar to customer order fulfillment
except that it takes place at the distributor. A key difference is the size of each order
as customer orders tend to be much smaller than replenishment orders. The
objective of the retail order fulfillment is to get the replenishment order to the retailer
on time while minimizing costs.
Retail Order Receiving Once the replenishment order arrives at a retailer, the
retailer must receive it physically and update all inventory records. This process
involves product flow from the distributor to the retailer as well as information
updates at the retailer and the flow of funds from the retailer to the distributor. The
objective of the retail order receiving process is to update inventories and displays
quickly and accurately at the lowest possible cost [1].
1.3.1.3 Manufacturing cycle
The manufacturing cycle typically occurs at the distributor/manufacturer (or
retailer/manufacturer) interface and includes all processes involved in replenishing
distributor (or retailer) inventory. The manufacturing cycle is triggered by customer
orders (as is the case with Dell), replenishment orders from a retailer or distributor
(Wal-Mart ordering from P&G), or by the forecast of customer demand and current
product availability in the manufacturer's finished-goods warehouse.
One extreme in a manufacturing cycle is an integrated steel mill that collects orders
that are similar enough to enable the manufacturer to produce in large quantities. In
this case, the manufacturing cycle is reacting to customer demand (referred to as a
pull process). Another extreme is a consumer products firm that must produce in
anticipation of demand. In this case the manufacturing cycle is anticipating customer
11
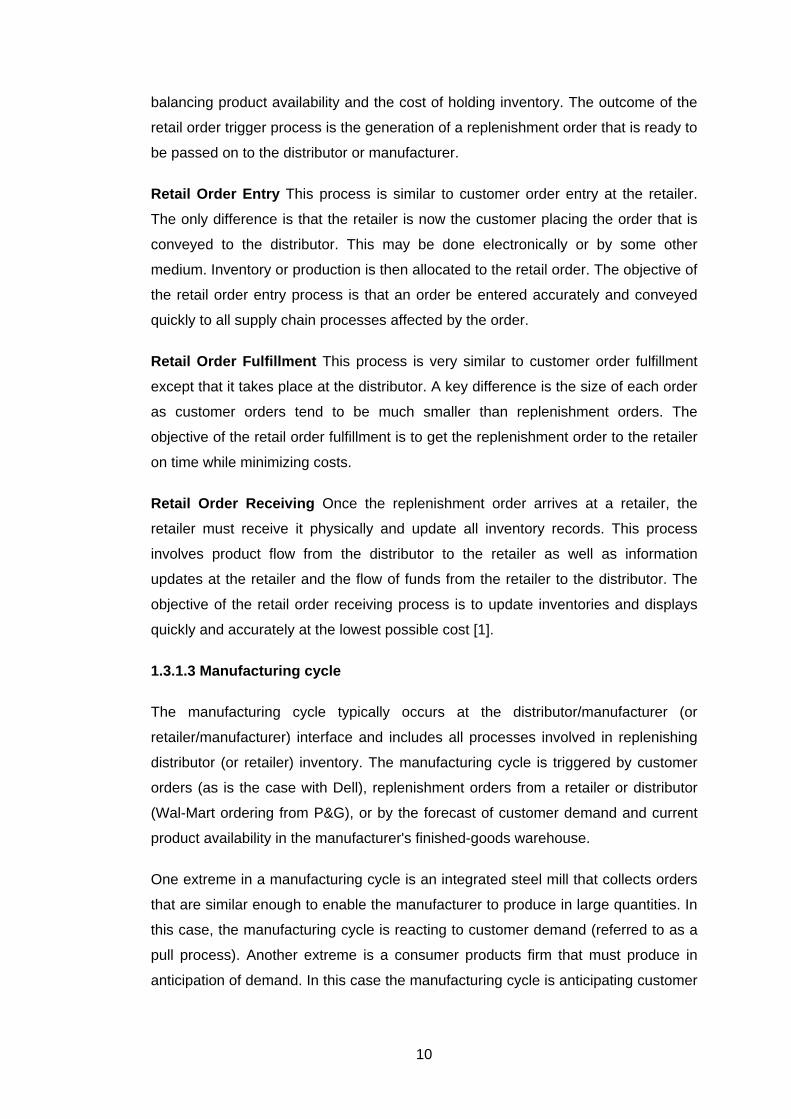
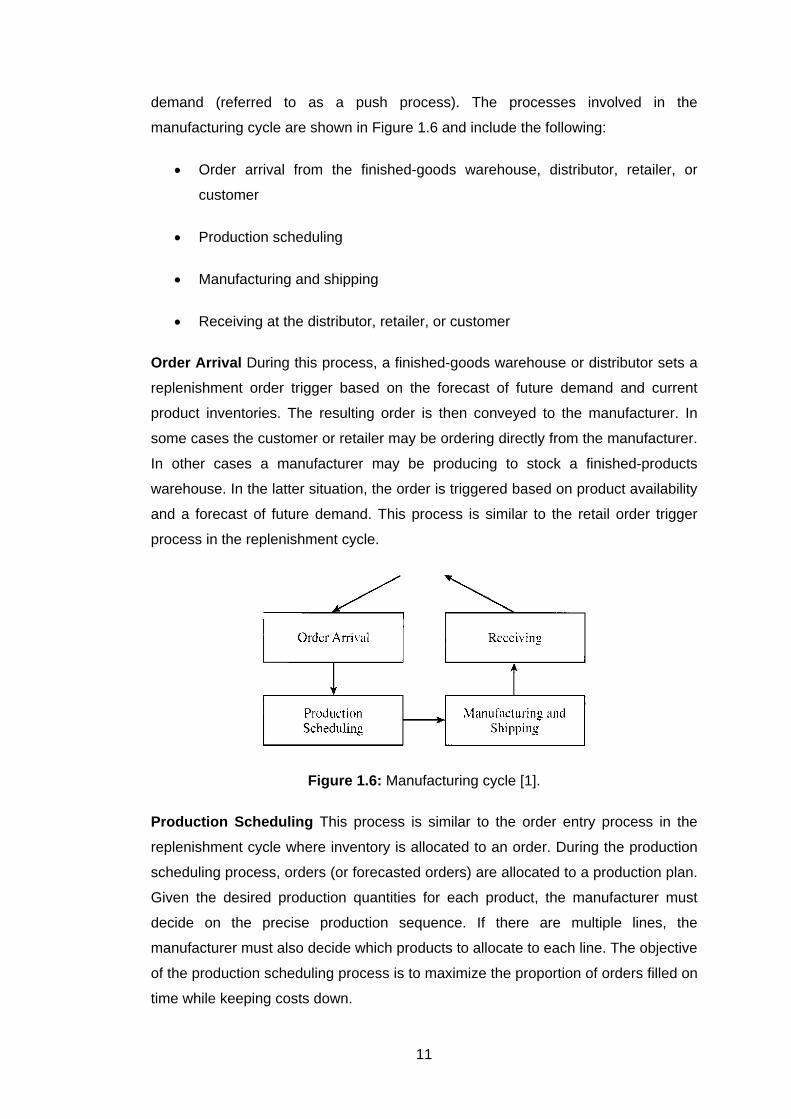
demand (referred to as a push process). The processes involved in the
manufacturing cycle are shown in Figure 1.6 and include the following:
• Order arrival from the finished-goods warehouse, distributor, retailer, or
customer
• Production scheduling
• Manufacturing and shipping
• Receiving at the distributor, retailer, or customer
Order Arrival During this process, a finished-goods warehouse or distributor sets a
replenishment order trigger based on the forecast of future demand and current
product inventories. The resulting order is then conveyed to the manufacturer. In
some cases the customer or retailer may be ordering directly from the manufacturer.
In other cases a manufacturer may be producing to stock a finished-products
warehouse. In the latter situation, the order is triggered based on product availability
and a forecast of future demand. This process is similar to the retail order trigger
process in the replenishment cycle.
Figure 1.6: Manufacturing cycle [1].
Production Scheduling This process is similar to the order entry process in the
replenishment cycle where inventory is allocated to an order. During the production
scheduling process, orders (or forecasted orders) are allocated to a production plan.
Given the desired production quantities for each product, the manufacturer must
decide on the precise production sequence. If there are multiple lines, the
manufacturer must also decide which products to allocate to each line. The objective
of the production scheduling process is to maximize the proportion of orders filled on
time while keeping costs down.
12
Manufacturing and Shipping This process is equivalent to the order fulfillment
process described in the replenishment cycle. During the manufacturing phase of
the process, the manufacturer produces to the production schedule. During the
shipping phase of this process, the product is shipped to the customer, retailer,
distributor, or finished-product warehouse. The objective of the manufacturing and
shipping process is to create and ship the product by the promised due date while
meeting quality requirements and keeping costs down.
Receiving In this process, the product is received at the distributor, finished-goods
warehouse, retailer, or customer and inventory records are updated. Other
processes related to storage and fund transfers also take place [1].
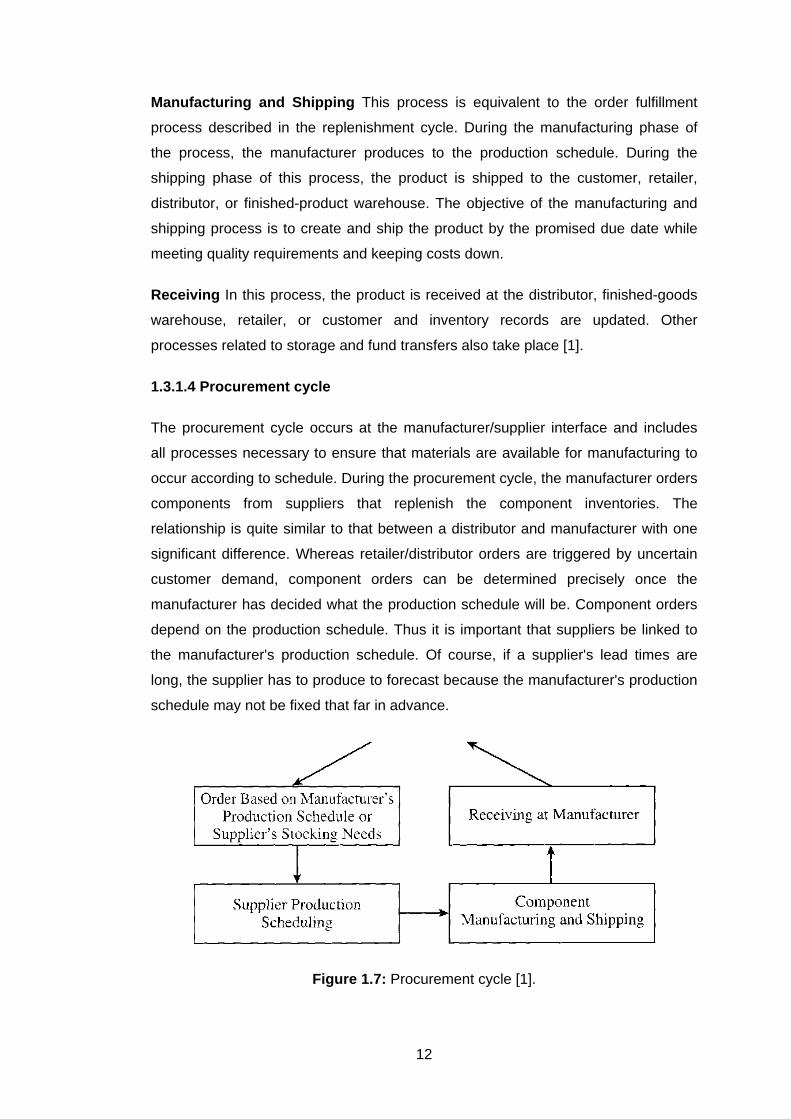
1.3.1.4 Procurement cycle
The procurement cycle occurs at the manufacturer/supplier interface and includes
all processes necessary to ensure that materials are available for manufacturing to
occur according to schedule. During the procurement cycle, the manufacturer orders
components from suppliers that replenish the component inventories. The
relationship is quite similar to that between a distributor and manufacturer with one
significant difference. Whereas retailer/distributor orders are triggered by uncertain
customer demand, component orders can be determined precisely once the
manufacturer has decided what the production schedule will be. Component orders
depend on the production schedule. Thus it is important that suppliers be linked to
the manufacturer's production schedule. Of course, if a supplier's lead times are
long, the supplier has to produce to forecast because the manufacturer's production
schedule may not be fixed that far in advance.
Figure 1.7: Procurement cycle [1].
13
In practice, there may be several tiers of suppliers, each producing a component for
the next tier. A similar cycle would then flow back from one stage to the next. The
processes in the procurement cycle are shown in Figure 1.7 [1].
1.3.2 Push/Pull view of supply chain processes
All processes in a supply chain fall into one of two categories depending on the
timing of their execution relative to end customer demand. With pull processes,
execution is initiated in response to a customer order. With push processes,
execution is initiated in anticipation of customer orders. Therefore, at the time of
execution of a pull process, customer demand is known with certainty whereas at
the time of execution of a push process, demand is not known and must be forecast.
Pull processes may also be referred to as reactive processes because they react to
customer demand. Push processes may also be referred to as speculative
processes because they respond to speculated (or forecasted) rather than actual
demand. The push/pull boundary in a supply chain separates push processes from
pull processes. At Dell, for example, the beginning of PC assembly represents the
push/pull boundary. All processes before PC assembly are push processes and all
processes after and including assembly are initiated in response to a customer order
and are thus pull processes.
A push/pull view of the supply chain is very useful when considering strategic
decisions relating to supply chain design. This view forces a more global
consideration of supply chain processes as they relate to a customer order. Such a
view may, for instance, result in responsibility for certain processes being passed on
to a different stage of the supply chain if making this transfer allows a push process
to become a pull process.
Let us consider two distinct supply chains that we have discussed and relate them to
the push/pull and cycle views. One supply chain is a mail order company like L. L.
Bean that receives customer orders through its telemarketing center or Web site.
The other is a build-to-order computer manufacturer like Dell.
L. L. Bean executes all processes in the customer order cycle after the customer
arrives. All processes that are part of the customer order cycle are thus pull
processes. Order fulfillment takes place from product in inventory that is built up in
anticipation of customer orders. The goal of the replenishment cycle is to ensure
product availability when a customer order arrives. All processes in the
replenishment cycle are performed in anticipation of demand and are thus push
14
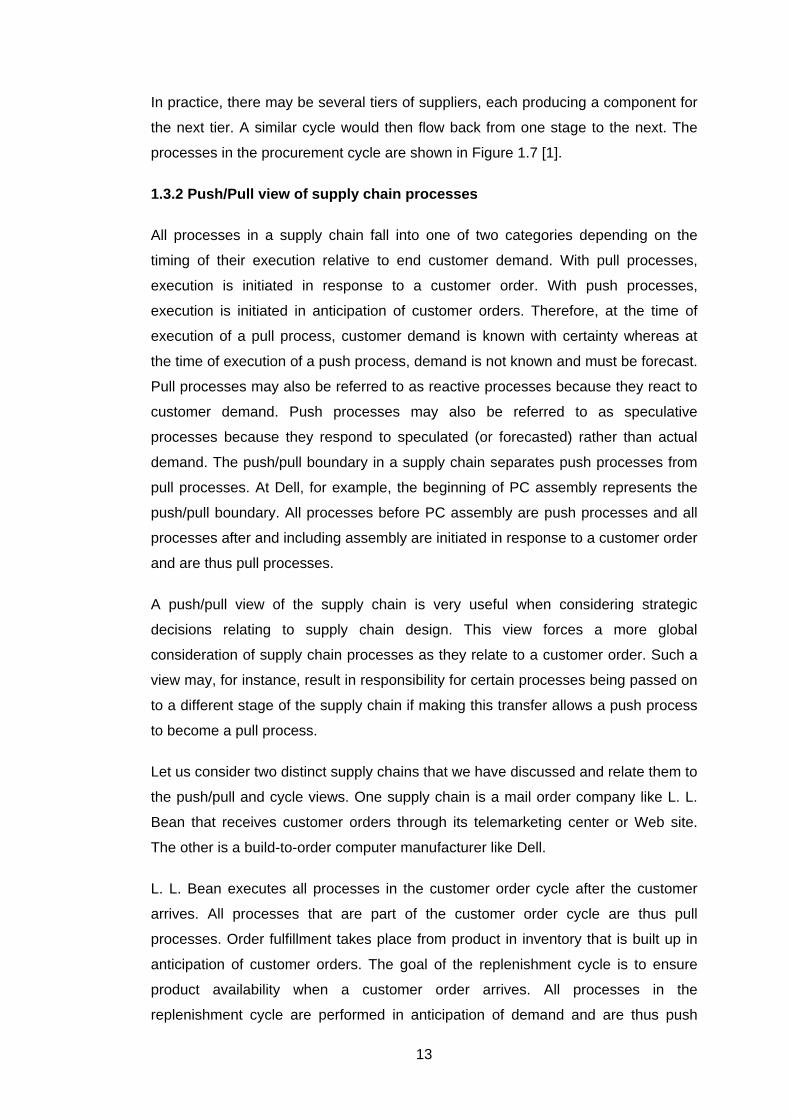
processes. The same holds true for processes in the manufacturing and
procurement cycle. In fact, raw material like fabric is often purchased six to nine
months before customer demand is expected. Manufacturing itself begins three to
six months before the point of sale. All processes in the manufacturing and
procurement cycle are thus push processes. The processes in the L. L. Bean supply
chain break up into pull and push processes, as shown in Figure 1.8.
Figure 1.8: Push/Pull processes for the L.L. Bean supply chain [1].
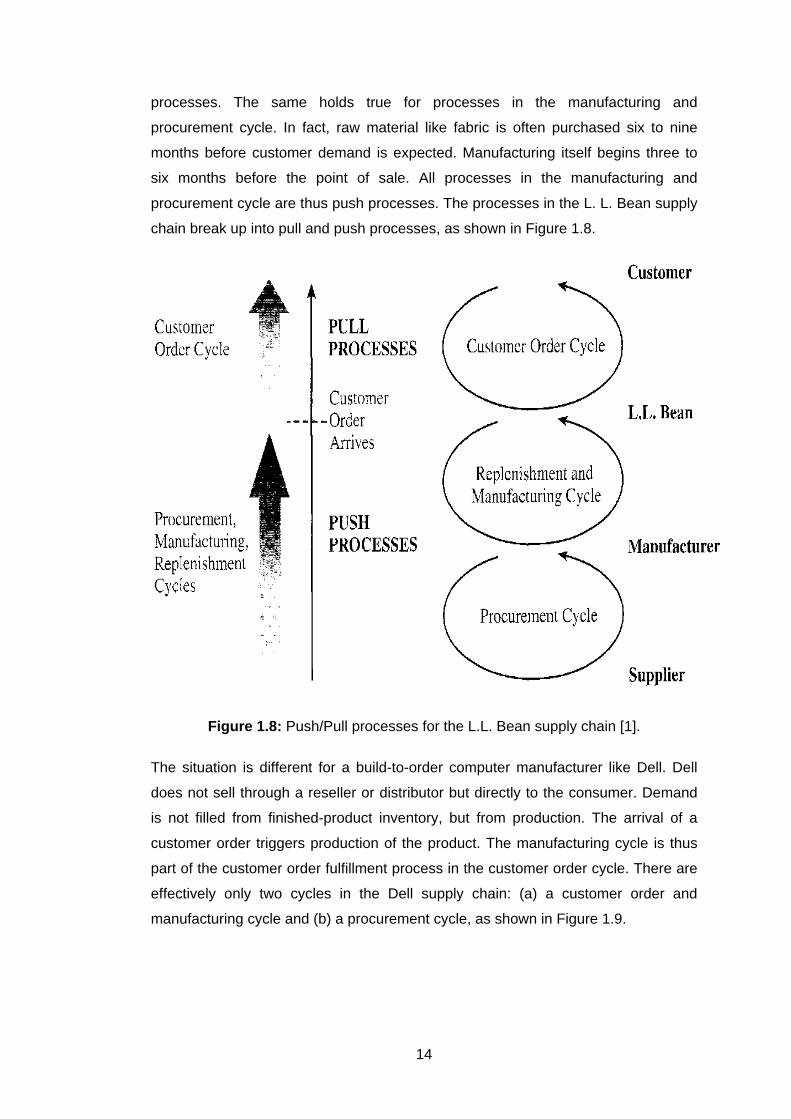
The situation is different for a build-to-order computer manufacturer like Dell. Dell
does not sell through a reseller or distributor but directly to the consumer. Demand
is not filled from finished-product inventory, but from production. The arrival of a
customer order triggers production of the product. The manufacturing cycle is thus
part of the customer order fulfillment process in the customer order cycle. There are
effectively only two cycles in the Dell supply chain: (a) a customer order and
manufacturing cycle and (b) a procurement cycle, as shown in Figure 1.9.
15
Figure 1.9: Dell supply chain [1].
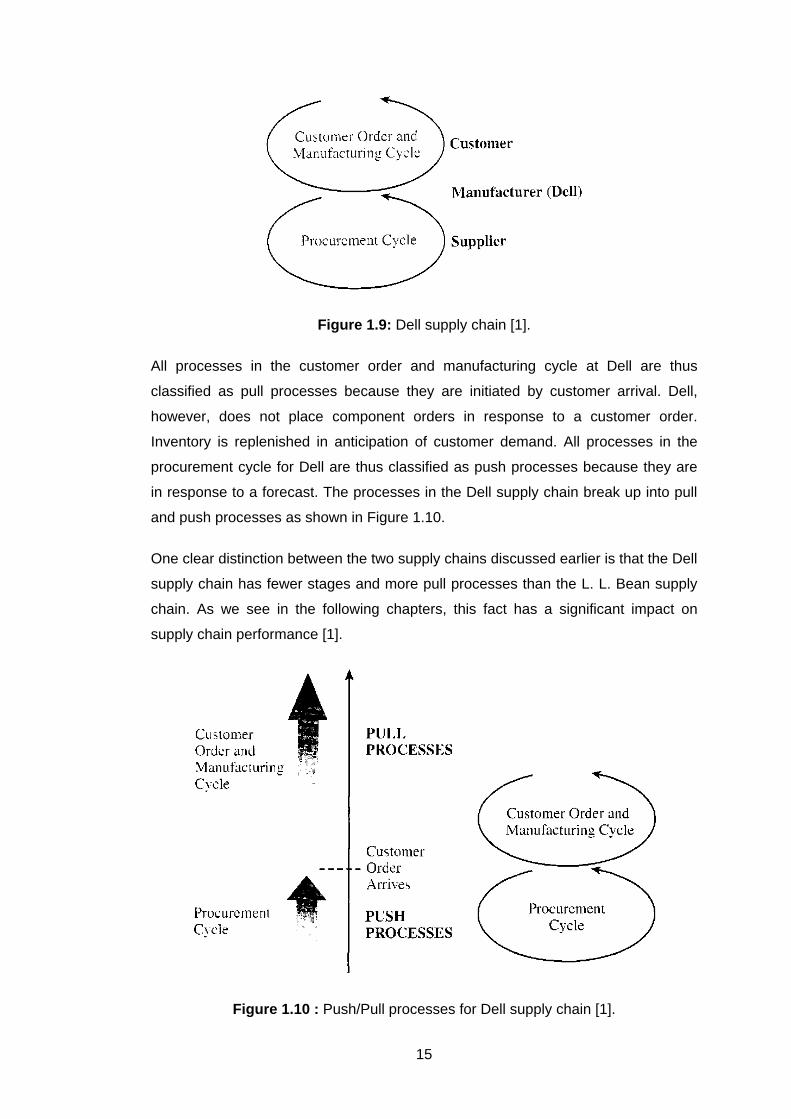
All processes in the customer order and manufacturing cycle at Dell are thus
classified as pull processes because they are initiated by customer arrival. Dell,
however, does not place component orders in response to a customer order.
Inventory is replenished in anticipation of customer demand. All processes in the
procurement cycle for Dell are thus classified as push processes because they are
in response to a forecast. The processes in the Dell supply chain break up into pull
and push processes as shown in Figure 1.10.
One clear distinction between the two supply chains discussed earlier is that the Dell
supply chain has fewer stages and more pull processes than the L. L. Bean supply
chain. As we see in the following chapters, this fact has a significant impact on
supply chain performance [1].
Figure 1.10 : Push/Pull processes for Dell supply chain [1].
16
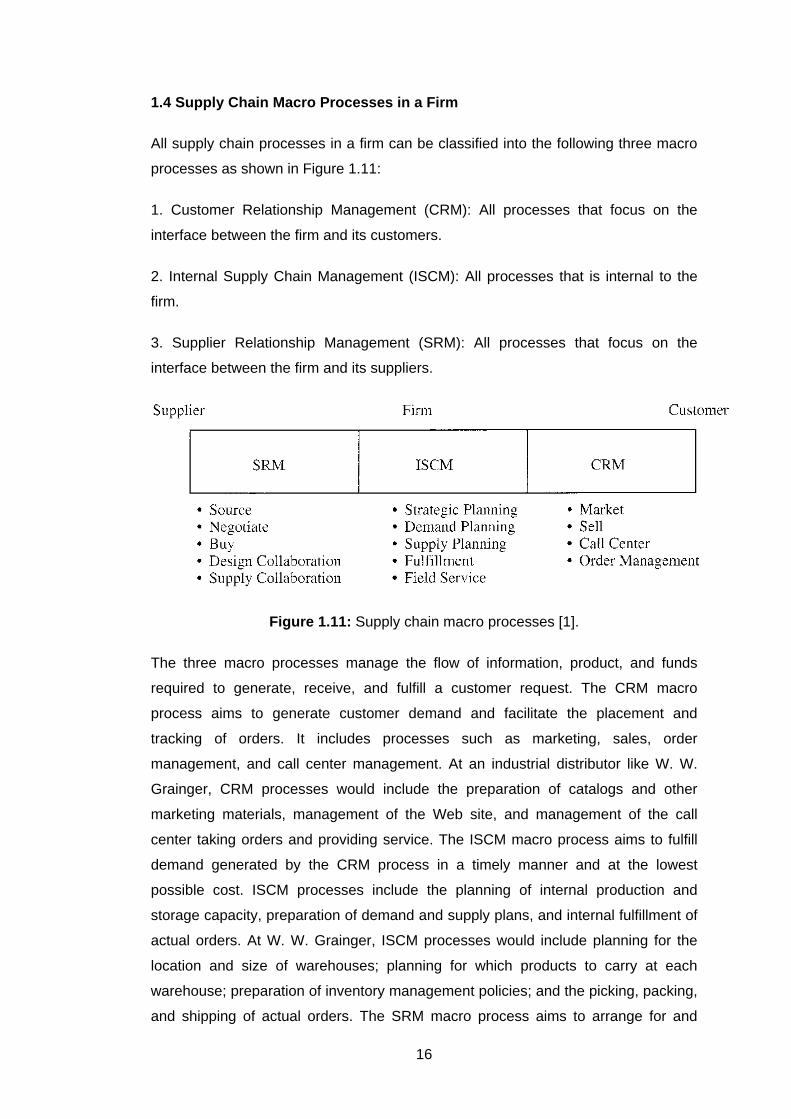
1.4 Supply Chain Macro Processes in a Firm
All supply chain processes in a firm can be classified into the following three macro
processes as shown in Figure 1.11:
1. Customer Relationship Management (CRM): All processes that focus on the
interface between the firm and its customers.
2. Internal Supply Chain Management (ISCM): All processes that is internal to the
firm.
3. Supplier Relationship Management (SRM): All processes that focus on the
interface between the firm and its suppliers.
Figure 1.11: Supply chain macro processes [1].
The three macro processes manage the flow of information, product, and funds
required to generate, receive, and fulfill a customer request. The CRM macro
process aims to generate customer demand and facilitate the placement and
tracking of orders. It includes processes such as marketing, sales, order
management, and call center management. At an industrial distributor like W. W.
Grainger, CRM processes would include the preparation of catalogs and other
marketing materials, management of the Web site, and management of the call
center taking orders and providing service. The ISCM macro process aims to fulfill
demand generated by the CRM process in a timely manner and at the lowest
possible cost. ISCM processes include the planning of internal production and
storage capacity, preparation of demand and supply plans, and internal fulfillment of
actual orders. At W. W. Grainger, ISCM processes would include planning for the
location and size of warehouses; planning for which products to carry at each
warehouse; preparation of inventory management policies; and the picking, packing,
and shipping of actual orders. The SRM macro process aims to arrange for and
17
manage supply sources for various goods and services. SRM processes include the
evaluation and selection of suppliers, negotiation of supply terms, and
communication regarding new products and orders with suppliers. At W. W.
Grainger, SRM processes would include the selection of suppliers for various
products, negotiation of pricing and delivery terms with suppliers, sharing of demand
and supply plans with suppliers, and the placement of replenishment orders [1].
1.5 The Goal of a Supply Chain
Discuss the goal of a supply chain and explain the impact of supply chain decisions
on the success of a firm.
The goal of a supply chain should be to maximize overall supply chain profitability.
Supply chain profitability is the difference between the revenue generated from the
customer and the total cost incurred across all stages of the supply chain. Supply
chain decisions have a large impact on the success or failure of each firm because
they significantly influence both the revenue generated as well as the cost incurred.
Successful supply chains manage flows of product, information, and funds to
provide a high level of product availability to the customer while keeping costs low
[1].
18
2. SUPPLY CHAIN MANAGEMENT
2.1 Basic Concepts of Supply Chain Management
The practice of supply chain management is guided by some basic underlying
concepts that have not changed much over the centuries. Several hundred years
ago, Napoleon made the remark, “An army marches on its stomach.” Napoleon was
a master strategist and a skillful general and this remark shows that he clearly
understood the importance of what we would now call an efficient supply chain.
Unless the soldiers are fed, the army cannot move.
Along these same lines, there is another saying that goes, “Amateurs talk strategy
and professionals talk logistics.” People can discuss all sorts of grand strategies and
dashing maneuvers but none of that will be possible without first figuring out how to
meet the day-to-day demands of providing an army with fuel, spare parts, food,
shelter, and ammunition. It is the seemingly mundane activities of the quartermaster
and the supply sergeants that often determine an army’s success. This has many
analogies in business.
The term “supply chain management” arose in the late 1980s and came into
widespread use in the 1990s.Prior to that time, businesses used terms such as
“logistics” and “operations management” instead. Some definitions of a supply chain
are offered below:
• “A supply chain is the alignment of firms that bring products or services to
market.” [3].
• “A supply chain consists of all stages involved, directly or indirectly, in
fulfilling a customer request. The supply chain not only includes the
manufacturer and suppliers, but also transporters, warehouses, retailers, and
customers themselves.” [1].
• “A supply chain is a network of facilities and distribution options that
performs the functions of procurement of materials, transformation of these
19
materials into intermediate and finished products, and the distribution of
these finished products to customers.” [4], [5].
If this is what a supply chain is then we can define supply chain management as the
things we do to influence the behavior of the supply chain and get the results we
want. Some definitions of supply chain management are:
• “The systemic, strategic coordination of the traditional business functions
and the tactics across these business functions within a particular company
and across businesses within the supply chain, for the purposes of
improving the long-term performance of the individual companies and the
supply chain as a whole.” [6].
• “Supply chain management is the coordination of production, inventory,
location, and transportation among the participants in a supply chain to
achieve the best mix of responsiveness and efficiency for the market being
served.” [2].
There is a difference between the concept of supply chain management and the
traditional concept of logistics. Logistics typically refers to activities that occur within
the boundaries of a single organization and supply chains refer to networks of
companies that work together and coordinate their actions to deliver a product to
market. Also traditional logistics focuses its attention on activities such as
procurement, distribution, maintenance, and inventory management. Supply chain
management acknowledges all of traditional logistics and also includes activities
such as marketing, new product development, finance, and customer service.
In the wider view of supply chain thinking, these additional activities are now seen
as part of the work needed to fulfill customer requests. Supply chain management
views the supply chain and the organizations in it as a single entity. It brings a
systems approach to understanding and managing the different activities needed to
coordinate the flow of products and services to best serve the ultimate customer.
This systems approach provides the framework in which to best respond to business
requirements that otherwise would seem to be in conflict with each other.
Taken individually, different supply chain requirements often have conflicting needs.
For instance, the requirement of maintaining high levels of customer service calls for
maintaining high levels of inventory, but then the requirement to operate efficiently
calls for reducing inventory levels. It is only when these requirements are seen
20
together as parts of a larger picture that ways can be found to effectively balance
their different demands.
Effective supply chain management requires simultaneous improvements in both
customer service levels and the internal operating efficiencies of the companies in
the supply chain. Customer service at its most basic level means consistently high
order fill rates, high on-time delivery rates, and a very low rate of products returned
by customers for whatever reason. Internal efficiency for organizations in a supply
chain means that these organizations get an attractive rate of return on their
investments in inventory and other assets and that they find ways to lower their
operating and sales expenses.
There is a basic pattern to the practice of supply chain management. Each supply
chain has its own unique set of market demands and operating challenges and yet
the issues remain essentially the same in every case. Companies in any supply
chain must make decisions individually and collectively regarding their actions in five
areas:
1. Production What products does the market want? How much of which products
should be produced and by when? This activity includes the creation of master
production schedules that take into account plant capacities, workload balancing,
quality control, and equipment maintenance.
2. Inventory What inventory should be stocked at each stage in a supply chain?
How much inventory should be held as raw materials, semi finished, or finished
goods? The primary purpose of inventory is to act as a buffer against uncertainty in
the supply chain. However, holding inventory can be expensive, so what are the
optimal inventory levels and reorder points?
3. Location Where should facilities for production and inventory storage be located?
Where are the most cost efficient locations for production and for storage of
inventory? Should existing facilities be used or new ones built? Once these
decisions are made they determine the possible paths available for product to flow
through for delivery to the final consumer.
4. Transportation How should inventory be moved from one supply chain location
to another? Air freight and truck delivery are generally fast and reliable but they are
expensive. Shipping by sea or rail is much less expensive but usually involves
longer transit times and more uncertainty. This uncertainty must be compensated for
21
by stocking higher levels of inventory. When is it better to use which mode of
transportation?
5. Information How much data should be collected and how much information
should be shared? Timely and accurate information holds the promise of better
coordination and better decision making. With good information, people can make
effective decisions about what to produce and how much, about where to locate
inventory and how best to transport it.
The sum of these decisions will define the capabilities and effectiveness of a
company’s supply chain. The things a company can do and the ways that it can
compete in its markets are all very much dependent on the effectiveness of its
supply chain. If a company’s strategy is to serve a mass market and compete on the
basis of price, it had better have a supply chain that is optimized for low cost. If a
company’s strategy is to serve a market segment and compete on the basis of
customer service and convenience, it had better have a supply chain optimized for
responsiveness. Who a company is and what it can do is shaped by its supply chain
and by the markets it serves [2].
2.2 How the Supply Chain Works
The goal or mission of supply chain management can be defined using Mr.
Goldratt’s words as “Increase throughput while simultaneously reducing both
inventory and operating expense [7].” In this definition throughput refers to the rate
at which sales to the end customer occur. Depending on the market being served,
sales or throughput occurs for different reasons. In some markets customers value
and will pay for high levels of service. In other markets customers seek simply the
lowest price for an item.
As we saw in the previous section, there are five areas where companies can make
decisions that will define their supply chain capabilities: Production; Inventory;
Location; Transportation; and Information. Chopra and Meindl define these areas as
performance drivers that can be managed to produce the capabilities needed for a
given supply chain.
Effective supply chain management calls first for an understanding of each driver
and how it operates. Each driver has the ability to directly affect the supply chain
and enable certain capabilities. The next step is to develop an appreciation for the
results that can be obtained by mixing different combinations of these drivers [2].
22
2.2.1. Production
Production refers to the capacity of a supply chain to make and store products. The
facilities of production are factories and warehouses. The fundamental decision that
managers face when making production decisions is how to resolve the trade-off
between responsiveness and efficiency. If factories and warehouses are built with a
lot of excess capacity, they can be very flexible and respond quickly to wide swings
in product demand. Facilities where all or almost all capacity is being used are not
capable of responding easily to fluctuations in demand. On the other hand, capacity
costs money and excess capacity is idle capacity not in use and not generating
revenue. So the more excess capacity that exists, the less efficient the operation
becomes.
Factories can be built to accommodate one of two approaches to manufacturing:
1. Product focus A factory that takes a product focus performs the range of
different operations required to make a given product line from fabrication of
different product parts to assembly of these parts.
2. Functional focus A functional approach concentrates on performing just a few
operations such as only making a select group of parts or only doing assembly.
These functions can be applied to making many different kinds of products.
A product approach tends to result in developing expertise about a given set of
products at the expense of expertise about any particular function. A functional
approach results in expertise about particular functions instead of expertise in a
given product. Companies need to decide which approach or what mix of these two
approaches will give them the capability and expertise they need to best respond to
customer demands.
As with factories, warehouses too can be built to accommodate different
approaches. There are three main approaches to use in warehousing:
1. Stock keeping unit (SKU) storage — In this traditional approach, all of a given
type of product is stored together. This is an efficient and easy to understand way to
store products.
23
2. Job lot storage — In this approach, all the different products related to the needs
of a certain type of customer or related to the needs of a particular job are stored
together. This allows for an efficient picking and packing operation but usually
requires more storage space than the traditional SKU storage approach.
3. Cross docking — An approach that was pioneered by Wal-Mart in its drive to
increase efficiencies in its supply chain. In this approach, product is not actually
warehoused in the facility. Instead the facility is used to house a process where
trucks from suppliers arrive and unload large quantities of different products. These
large lots are then broken down into smaller lots. Smaller lots of different products
are recombined according to the needs of the day and quickly loaded onto outbound
trucks that deliver the products to their final destination [2].
2.2.2 Inventory
Inventory is spread throughout the supply chain and includes everything from raw
material to work in process to finished goods that are held by the manufacturers,
distributors, and retailers in a supply chain. Again, managers must decide where
they want to position themselves in the trade-off between responsiveness and
efficiency. Holding large amounts of inventory allows a company or an entire supply
chain to be very responsive to fluctuations in customer demand. However, the
creation and storage of inventory is a cost and to achieve high levels of efficiency,
the cost of inventory should be kept as low as possible.
There are three basic decisions to make regarding the creation and holding of
inventory:
1. Cycle Inventory This is the amount of inventory needed to satisfy demand for the
product in the period between purchases of the product. Companies tend to produce
and to purchase in large lots in order to gain the advantages that economies of
scale can bring. However, with large lots also come increased carrying costs.
Carrying costs come from the cost to store, handle, and insure the inventory.
Managers face the trade-off between the reduced cost of ordering and better prices
offered by purchasing product in large lots and the increased carrying cost of the
cycle inventory that comes with purchasing in large lots.
2. Safety Inventory Inventory that is held as a buffer against uncertainty. If demand
forecasting could be done with perfect accuracy, then the only inventory that would
be needed would be cycle inventory. But since every forecast has some degree of
24
uncertainty in it, we cover that uncertainty to a greater or lesser degree by holding
additional inventory in case demand is suddenly greater than anticipated. The trade-
off here is to weigh the costs of carrying extra inventory against the costs of losing
sales due to insufficient inventory.
3. Seasonal Inventory This is inventory that is built up in anticipation of predictable
increases in demand that occur at certain times of the year. For example, it is
predictable that demand for anti-freeze will increase in the winter. If a company that
makes anti-freeze has a fixed production rate that is expensive to change, then it will
try to manufacture product at a steady rate all year long and build up inventory
during periods of low demand to cover for periods of high demand that will exceed
its production rate. The alternative to building up seasonal inventory is to invest in
flexible manufacturing facilities that can quickly change their rate of production of
different products to respond to increases in demand. In this case, the trade-off is
between the cost of carrying seasonal inventory and the cost of having more flexible
production capabilities [2].
2.2.3 Location
Location refers to the geographical sitting of supply chain facilities. It also includes
the decisions related to which activities should be performed in each facility. The
responsiveness versus efficiency trade-off here is the decision whether to centralize
activities in fewer locations to gain economies of scale and efficiency, or to
decentralize activities in many locations close to customers and suppliers in order
for operations to be more responsive.
When making location decisions, managers need to consider a range of factors that
relate to a given location including the cost of facilities, the cost of labor, skills
available in the workforce, infrastructure conditions, taxes and tariffs, and proximity
to suppliers and customers. Location decisions tend to be very strategic decisions
because they commit large amounts of money to long-term plans.
Location decisions have strong impacts on the cost and performance characteristics
of a supply chain. Once the size, number, and location of facilities is determined,
that also defines the number of possible paths through which products can flow on
the way to the final customer. Location decisions reflect a company’s basic strategy
for building and delivering its products to market [2].
25
2.2.4 Transportation
This refers to the movement of everything from raw material to finished goods
between different facilities in a supply chain. In transportation the trade-off between
responsiveness and efficiency is manifested in the choice of transport mode. Fast
modes of transport such as airplanes are very responsive but also more costly.
Slower modes such as ship and rail are very cost efficient but not as responsive.
Since transportation costs can be as much as a third of the operating cost of a
supply chain, decisions made here are very important.
There are six basic modes of transport that a company can choose from:
1. Ship which is very cost efficient but also the slowest mode of transport. It is
limited to use between locations that are situated next to navigable waterways and
facilities such as harbors and canals.
2. Rail which is also very cost efficient but can be slow. This mode is also restricted
to use between locations that are served by rail lines.
3. Pipelines can be very efficient but are restricted to commodities that are liquids
or gases such as water, oil, and natural gas.
4. Trucks are a relatively quick and very flexible mode of transport. Trucks can go
almost anywhere. The cost of this mode is prone to fluctuations though, as the cost
of fuel fluctuates and the condition of roads varies.
5. Airplanes are a very fast mode of transport and are very responsive. This is also
the most expensive mode and it is somewhat limited by the availability of
appropriate airport facilities.
6. Electronic Transport is the fastest mode of transport and it is very flexible and
cost efficient. However, it can only be used for movement of certain types of
products such as electric energy, data, and products composed of data such as
music, pictures, and text. Someday technology that allows us to convert matter to
energy and back to matter again may completely rewrite the theory and practice of
supply chain management.
Given these different modes of transportation and the location of the facilities in a
supply chain, managers need to design routes and networks for moving products. A
route is the path through which products move and networks are composed of the
26
collection of the paths and facilities connected by those paths. As a general rule, the
higher the value of a product (such as electronic components or pharmaceuticals),
the more its transport network should emphasize responsiveness and the lower the
value of a product (such as bulk commodities like grain or lumber), the more its
network should emphasize efficiency (See in Table 2.2) [2].
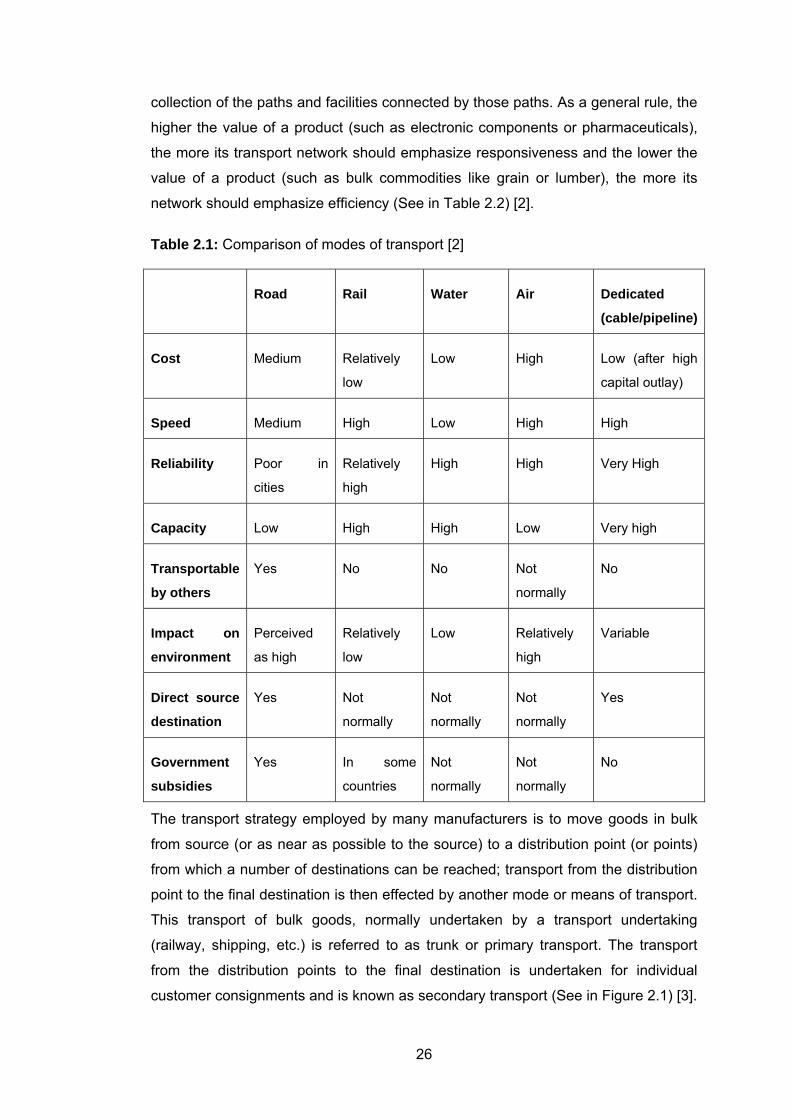
Table 2.1: Comparison of modes of transport [2]
Road Rail Water Air Dedicated
(cable/pipeline)
Cost Medium Relatively
low
Low High Low (after high
capital outlay)
Speed Medium High Low High High
Reliability Poor in
cities
Relatively
high
High High Very High
Capacity Low High High Low Very high
Transportable
by others
Yes No No Not
normally
No
Impact on
environment
Perceived
as high
Relatively
low
Low Relatively
high
Variable
Direct source
destination
Yes Not
normally
Not
normally
Not
normally
Yes
Government
subsidies
Yes In some
countries
Not
normally
Not
normally
No
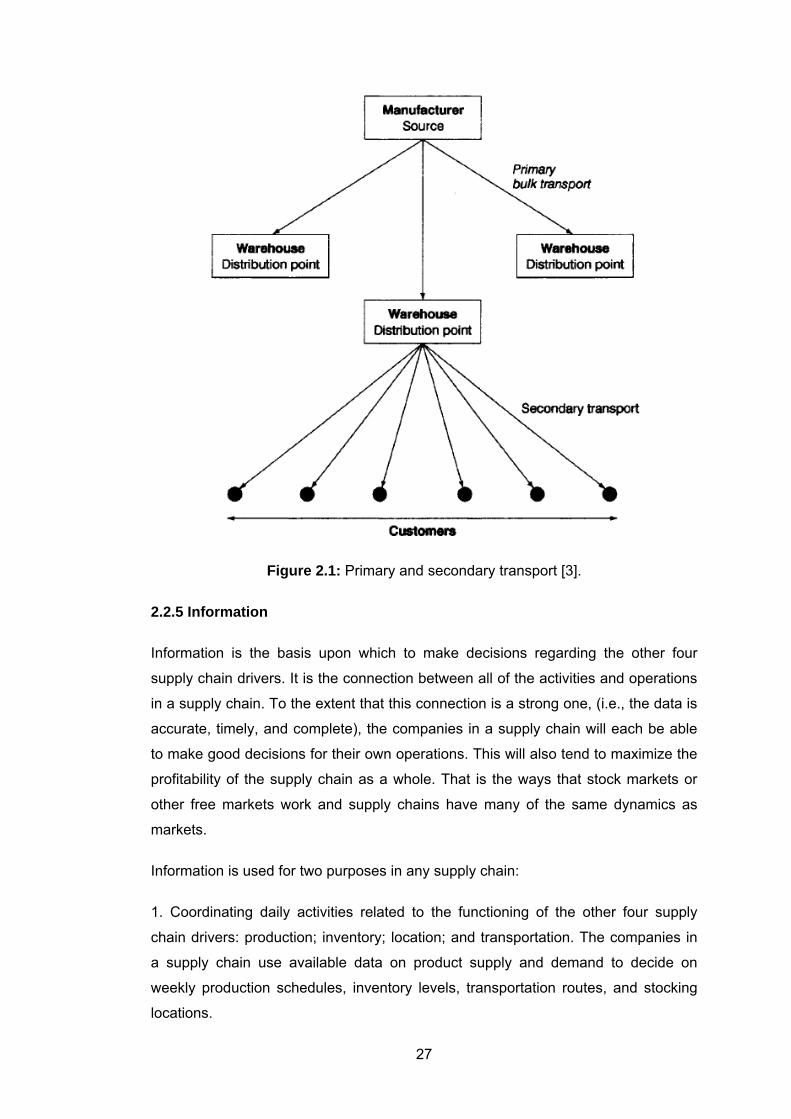
The transport strategy employed by many manufacturers is to move goods in bulk
from source (or as near as possible to the source) to a distribution point (or points)
from which a number of destinations can be reached; transport from the distribution
point to the final destination is then effected by another mode or means of transport.
This transport of bulk goods, normally undertaken by a transport undertaking
(railway, shipping, etc.) is referred to as trunk or primary transport. The transport
from the distribution points to the final destination is undertaken for individual
customer consignments and is known as secondary transport (See in Figure 2.1) [3].
27
Figure 2.1: Primary and secondary transport [3].
2.2.5 Information
Information is the basis upon which to make decisions regarding the other four
supply chain drivers. It is the connection between all of the activities and operations
in a supply chain. To the extent that this connection is a strong one, (i.e., the data is
accurate, timely, and complete), the companies in a supply chain will each be able
to make good decisions for their own operations. This will also tend to maximize the
profitability of the supply chain as a whole. That is the ways that stock markets or
other free markets work and supply chains have many of the same dynamics as
markets.
Information is used for two purposes in any supply chain:
1. Coordinating daily activities related to the functioning of the other four supply
chain drivers: production; inventory; location; and transportation. The companies in
a supply chain use available data on product supply and demand to decide on
weekly production schedules, inventory levels, transportation routes, and stocking
locations.
28
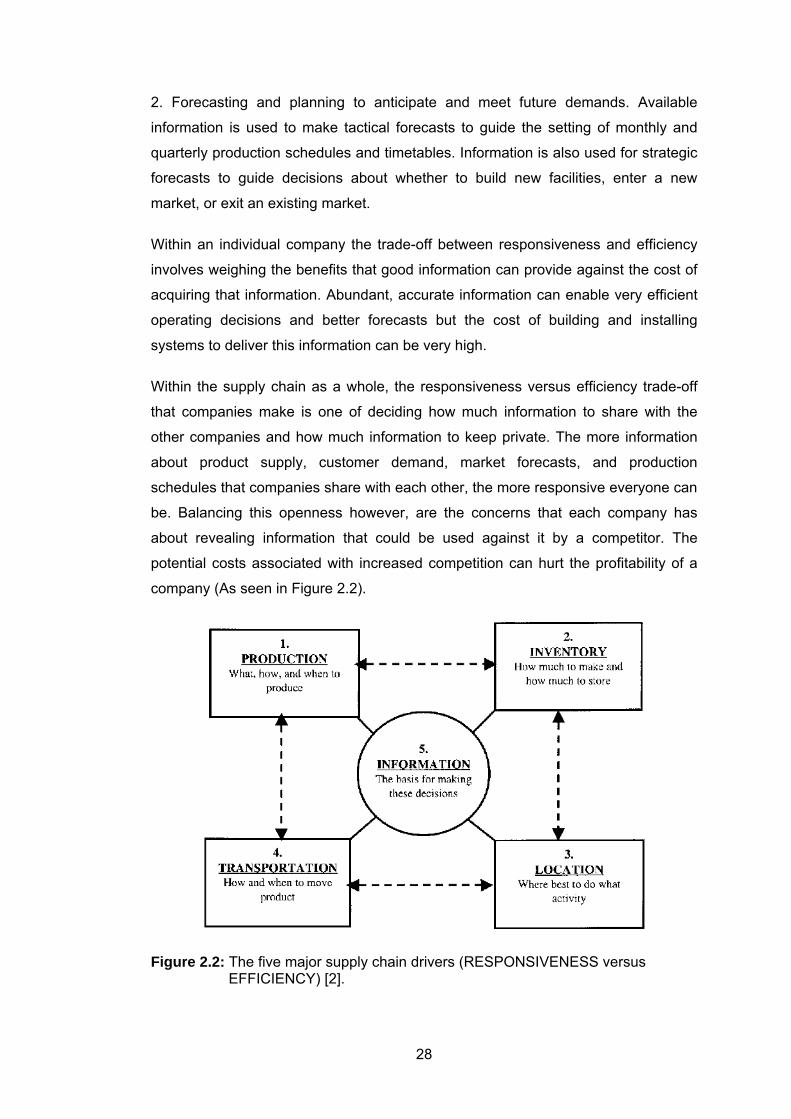
2. Forecasting and planning to anticipate and meet future demands. Available
information is used to make tactical forecasts to guide the setting of monthly and
quarterly production schedules and timetables. Information is also used for strategic
forecasts to guide decisions about whether to build new facilities, enter a new
market, or exit an existing market.
Within an individual company the trade-off between responsiveness and efficiency
involves weighing the benefits that good information can provide against the cost of
acquiring that information. Abundant, accurate information can enable very efficient
operating decisions and better forecasts but the cost of building and installing
systems to deliver this information can be very high.
Within the supply chain as a whole, the responsiveness versus efficiency trade-off
that companies make is one of deciding how much information to share with the
other companies and how much information to keep private. The more information
about product supply, customer demand, market forecasts, and production
schedules that companies share with each other, the more responsive everyone can
be. Balancing this openness however, are the concerns that each company has
about revealing information that could be used against it by a competitor. The
potential costs associated with increased competition can hurt the profitability of a
company (As seen in Figure 2.2).
Figure 2.2: The five major supply chain drivers (RESPONSIVENESS versus EFFICIENCY) [2].
29
The right combination of responsiveness and efficiency in each of these drivers
allows a supply chain to "increase throughput while simultaneously reducing
inventory and operating expense [2]."
2.3 Participants in the Supply Chain
In its simplest form, a supply chain is composed of a company and the suppliers and
customers of that company. This is the basic group of participants that creates a
simple supply chain. Extended supply chains contain three additional types of
participants. First there is the supplier’s supplier or the ultimate supplier at the
beginning of an extended supply chain. Then there is the customer’s customer or
ultimate customer at the end of an extended supply chain. Finally there is a whole
category of companies who are service providers to other companies in the supply
chain. These are companies who supply services in logistics, finance, marketing,
and information technology.
In any given supply chain there is some combination of companies who perform
different functions. There are companies that are producers, distributors or
wholesalers, retailers, and companies or individuals who are the customers, the final
consumers of a product. Supporting these companies there will be other companies
that are service providers that provide a range of needed services [2].
2.3.1 Producers
Producers or manufacturers are organizations that make a product. This includes
companies that are producers of raw materials and companies that are producers of
finished goods. Producers of raw materials are organizations that mine for minerals,
drill for oil and gas, and cut timber. It also includes organizations that farm the land,
raise animals, or catch seafood. Producers of finished goods use the raw materials
and subassemblies made by other producers to create their products.
Producers can create products that are intangible items such as music,
entertainment, software, or designs. A product can also be a service such as
mowing a lawn, cleaning an office, performing surgery, or teaching a skill. In many
instances the producers of tangible, industrial products are moving to areas of the
world where labor is less costly. Producers in the developed world of North America,
Europe, and parts of Asia are increasingly producers of intangible items and
services [2].
30
2.3.2 Distributors
Distributors are companies that take inventory in bulk from producers and deliver a
bundle of related product lines to customers. Distributors are also known as
wholesalers. They typically sell to other businesses and they sell products in larger
quantities than an individual consumer would usually buy. Distributors buffer the
producers from fluctuations in product demand by stocking inventory and doing
much of the sales work to find and service customers. For the customer, distributors
fulfill the “Time and Place” function—they deliver products when and where the
customer wants them.
A distributor is typically an organization that takes ownership of significant
inventories of products that they buy from producers and sell to consumers. In
addition to product promotion and sales, other functions the distributor performs are
inventory management, warehouse operations, and product transportation as well
as customer support and post-sales service. A distributor can also be an
organization that only brokers a product between the producer and the customer
and never takes ownership of that product. This kind of distributor performs mainly
the functions of product promotion and sales. In both these cases, as the needs of
customers evolve and the range of available products changes, the distributor is the
agent that continually tracks customer needs and matches them with products
available [2].
2.3.3 Retailers
Retailer’s stock inventory and sell in smaller quantities to the general public. This
organization also closely tracks the preferences and demands of the customers that
it sells to. It advertises to its customers and often uses some combination of price,
product selection, service, and convenience as the primary draw to attract
customers for the products it sells. Discount department stores attract customers
using price and wide product selection. Upscale specialty stores offer a unique line
of products and high levels of service. Fast food restaurants use convenience and
low prices as their draw [2].
2.3.4 Customers
Customers or consumers are any organization that purchases and uses a product. A
customer organization may purchase a product in order to incorporate it into another
31
product that they in turn sell to other customers. Or a customer may be the final end
user of a product who buys the product in order to consume it [2].
2.3.5 Service providers
These are organizations that provide services to producers, distributors, retailers,
and customers. Service providers have developed special expertise and skills that
focus on a particular activity needed by a supply chain. Because of this, they are
able to perform these services more effectively and at a better price than producers,
distributors, retailers, or consumers could do on their own.
Some common service providers in any supply chain are providers of transportation
services and warehousing services. These are trucking companies and public
warehouse companies and they are known as logistics providers. Financial service
providers deliver services such as making loans, doing credit analysis, and
collecting on past due invoices. These are banks, credit rating companies, and
collection agencies. Some service providers deliver market research and
advertising, while others provide product design, engineering services, legal
services, and management advice. Still other service providers offer information
technology and data collection services. All these service providers are integrated to
a greater or lesser degree into the ongoing operations of the producers, distributors,
retailers, and consumers in the supply chain.
Supply chains are composed of repeating sets of participants that fall into one or
more of these categories. Over time the needs of the supply chain as a whole
remain fairly stable. What changes is the mix of participants in the supply chain and
the roles that each participant plays. In some supply chains, there are few service
providers because the other participants perform these services on their own. In
other supply chains very efficient providers of specialized services have evolved and
the other participants outsource work to these service providers instead of doing it
themselves. Examples of supply chain structures are shown in Figure 2.3 and
Figure 2.4 [2]. Three steps to align supply chain & business strategy also seen in
Figure 2.5 [2].
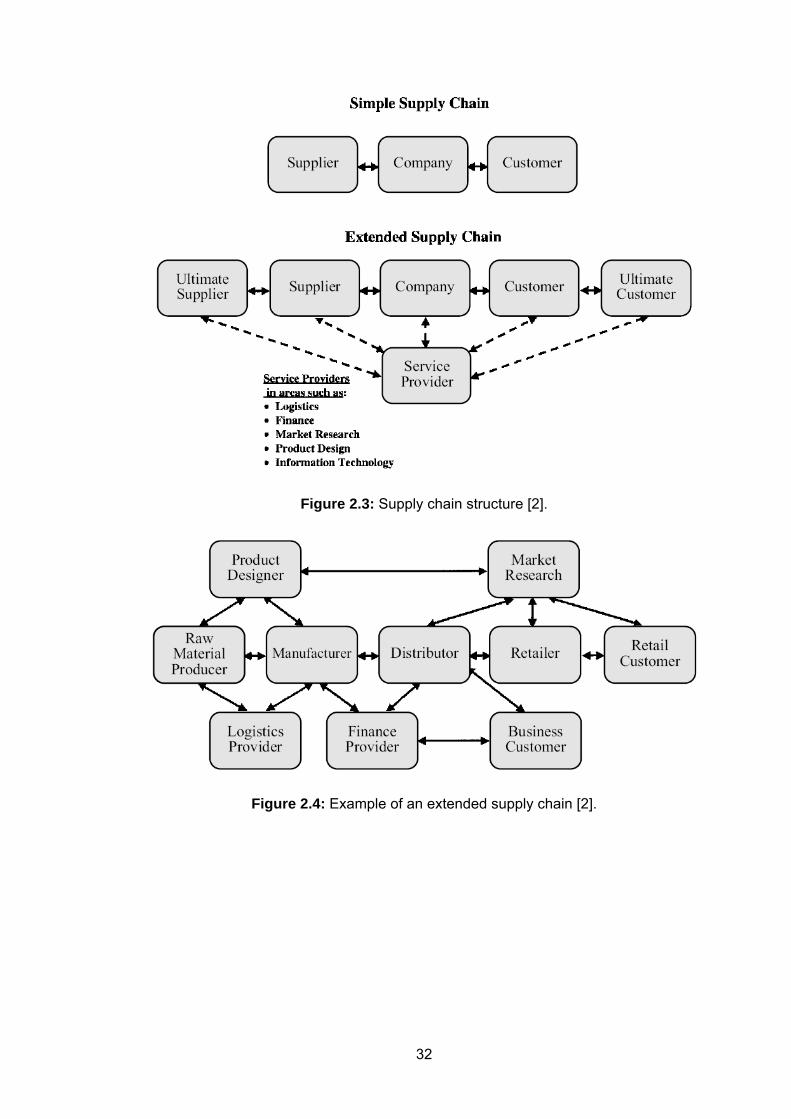
32
Figure 2.3: Supply chain structure [2].
Figure 2.4: Example of an extended supply chain [2].
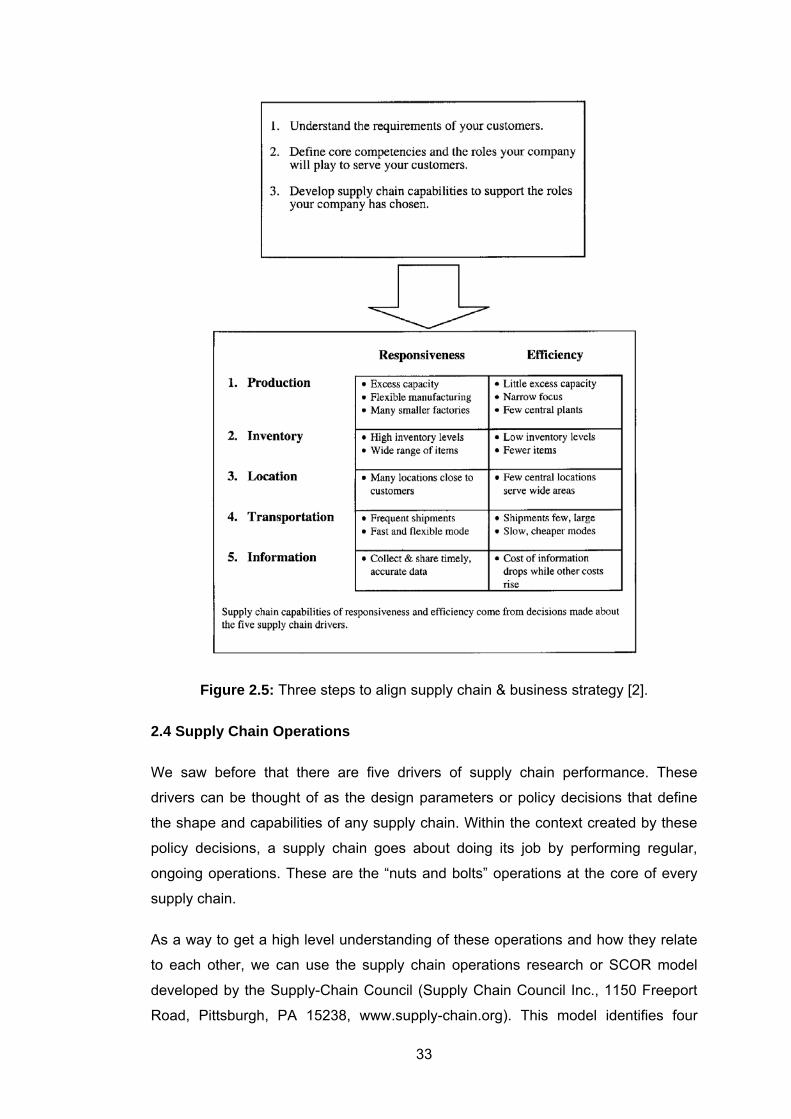
33
Figure 2.5: Three steps to align supply chain & business strategy [2].
2.4 Supply Chain Operations
We saw before that there are five drivers of supply chain performance. These
drivers can be thought of as the design parameters or policy decisions that define
the shape and capabilities of any supply chain. Within the context created by these
policy decisions, a supply chain goes about doing its job by performing regular,
ongoing operations. These are the “nuts and bolts” operations at the core of every
supply chain.
As a way to get a high level understanding of these operations and how they relate
to each other, we can use the supply chain operations research or SCOR model
developed by the Supply-Chain Council (Supply Chain Council Inc., 1150 Freeport
Road, Pittsburgh, PA 15238, www.supply-chain.org). This model identifies four
34
categories of operations. We will use these following five categories to organize and
discuss supply chain operations: Plan, Source, Make, Deliver, and Return [9], [10].
2.4.1 Supply chain operations reference (SCOR) model
The Supply Chain Operation Reference (SCOR) Model is developed by the Supply
Chain Council (SCC), an independent, not-for-profit, global corporation with
membership open to all companies and organizations interested in applying and
advancing the state-of-the-art in SCM systems and practices. SCC was organized in
1996 by Pittigiio Rabin Todd & McGrath (PRTM) and AMR Research and initially
included 69 voluntary member companies.
The SCOR model is a reference model that links process elements, metrics, best
practices, and the features associated with the execution of a supply chain in a
unique format. The model focuses on the activity involved and it contains five basic
management processes that provide the organizational structure of the SCOR
model. These processes are: Plan, Source, Make, Deliver, and Return. Currently the
model does not attempt to develop supply chain transformation methodology in the
areas of human resources, quality assurance, and training. The model also provides
a balanced approach to measure overall supply chain.
SCOR is a hierarchical model with specific boundaries in regard to scope. There are
at least four hierarchical levels in the model. SCC focuses on three process levels
and does not attempt to prescribe how a particular organization should tailor its
systems. These hierarchical levels are: Level 1: Top Level (Process Types), Level 2:
Configuration Level (Process Categories), Level 3: Process Element Level
(Decompose Processes), and Level 4: Implementation Level (Decompose Process
Elements). Level 1 defines the scope and content of the SCOR Model. In addition,
basis of competition performance targets are set in this level. In Level 2, a
company's supply chain can be "configured-to-order" from 26 core process
categories. Companies also implement their operation strategy at this level.
Companies fine-tune operation strategy at Level 3. This level defines a company's
ability to compete successfully in its chosen markets. Level 3 also consists of
process element definition, process element information inputs and outputs, process
performance metrics, best practices -where applicable-, and system capabilities
required to support best practices. At Level 4, companies implement specific SCM
practices to achieve competitive advantage. Since this level is company specific
35
organizations that use the SCOR Model will need to extend the Model at least at
Level 4 [11].
The five management processes—Plan, Source, Make, Deliver and Return—are
discussed first. The Plan process consists of processes that balance aggregated
demand and supply to develop a course of action which best meets the business
goals. Plan processes deal with demand/supply planning, which include the
activities to assess supply resources, aggregate and prioritize demand
requirements, plan inventory, distribution requirements, production, material, and
rough-cut capacity for all products and all channels. The Source process contains
processes that procure goods and services to meet planned or actual demand.
Sourcing/material acquisition includes the jobs of obtaining, receiving, inspecting,
holding, and issuing material. Management of sourcing infrastructure includes
vendor certification and feedback, sourcing quality, in-bound freight, component
engineering, vendor contracts, and vendor payments. The Make process includes
functions that transform goods to a finished state to meet planned or actual demand.
Make is the core process of the system in which actual production execution takes
place. It includes the jobs of requesting and receiving material, manufacturing and
testing product, packaging, holding and/or releasing the product eventually. The
Deliver process consists of processes that provide finished goods and services to
meet planned or actual demand. This typically includes the functions of order
management, transportation management, and distribution management. Managing
the deliver process includes managing channel business rules, ordering rules,
managing deliver inventories, and managing deliver quality. Return is the latest
addition to SCOR model. It deals with managing reverse flow of material and
information related to defective, surplus and MRO products. This includes
authorizing, scheduling, receiving, verifying, disposing and replacement or credit for
the above types of materials. Each basic supply chain is a ‘chain’ of Source, Make,
Deliver and Return execution process. Each interaction of two execution processes
is a ‘link’ in the supply chain. Planning sits on top of these links and manages them
[9], [10].
SCOR® provides:
• A structured approach & practical methodology, blended with latest concepts
like business process reengineering, process configuration, operation
modeling and performance measurement, for starting supply chain initiatives
and conducting supply chain improvement projects;
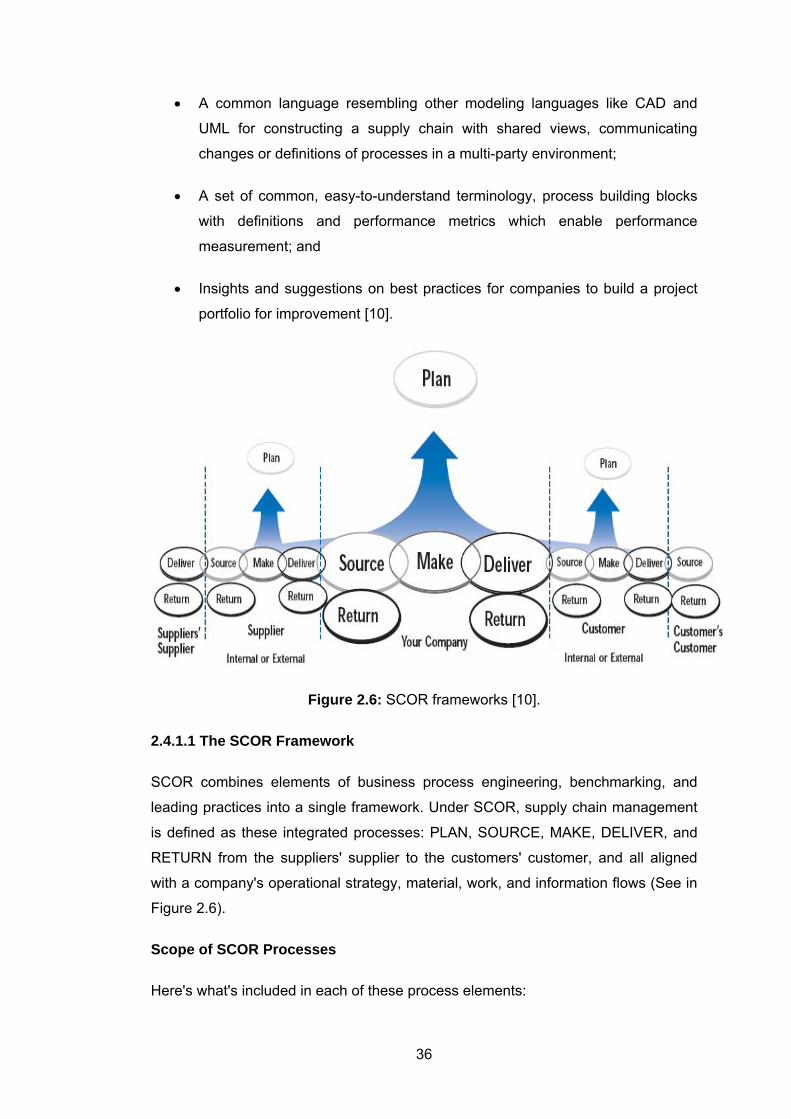
36
• A common language resembling other modeling languages like CAD and
UML for constructing a supply chain with shared views, communicating
changes or definitions of processes in a multi-party environment;
• A set of common, easy-to-understand terminology, process building blocks
with definitions and performance metrics which enable performance
measurement; and
• Insights and suggestions on best practices for companies to build a project
portfolio for improvement [10].
Figure 2.6: SCOR frameworks [10].
2.4.1.1 The SCOR Framework
SCOR combines elements of business process engineering, benchmarking, and
leading practices into a single framework. Under SCOR, supply chain management
is defined as these integrated processes: PLAN, SOURCE, MAKE, DELIVER, and
RETURN from the suppliers' supplier to the customers' customer, and all aligned
with a company's operational strategy, material, work, and information flows (See in
Figure 2.6).
Scope of SCOR Processes
Here's what's included in each of these process elements:
37
PLAN: Assess supply resources; aggregate and prioritize demand requirements;
plan inventory for distribution, production, and material requirements; and plan
rough-cut capacity for all products and all channels.
Demand/Supply Planning and Management;
- Balance resources with requirements and establish/communicate plans for the
whole supply chain, including Return, and the execution processes of Source, Make,
and Deliver.
- Management of business rules, supply chain performance, data collection,
inventory, capital assets, transportation, planning configuration, and regulatory
requirements and compliance.
- Align the supply chain unit plan with the financial plan.
SOURCE: Obtain, receive, inspect, hold, issue, and authorize payment for raw
materials and purchased finished goods.
Sourcing Stocked, Make-to-Order, and Engineer-to-Order Product;
- Schedule deliveries; receive, verify, and transfer product; and authorize supplier
payments.
- Identify and select supply sources when not predetermined, as for engineer-to-
order product.
- Manage business rules, assess supplier performance, and maintain data.
- Manage inventory, capital assets, incoming product, supplier network,
import/export requirements, and supplier agreements.
MAKE: Request and receive material; manufacture and test product; package, hold,
and/or release product.
Make-to-Stock, Make-to-Order, and Engineer-to-Order Production Execution;
- Schedule production activities, issue product, produce and test, package, stage
product, and release product to deliver.
- Finalize engineering for engineer-to-order product.
38
- Manage rules, performance, data, in-process products (WIP), equipment and
facilities, transportation, production network, and regulatory compliance for
production.
DELIVER: Execute order management processes; generate quotations; configure
product; create and maintain customer database; maintain product/price database;
manage accounts receivable, credits, collections, and invoicing; execute warehouse
processes including pick, pack, and configure; create customer-specific
packaging/labeling; consolidate orders; ship products; manage transportation
processes and import/ export; and verify performance.
Order, Warehouse, Transportation, and Installation Management for Stocked, Make-to-Order, and Engineer-to-Order Product;
- All order management steps from processing customer inquiries and quotes to
routing shipments and selecting carriers.
- Warehouse management from receiving and picking product to load and ship
product.
- Receive and verify product at customer site and install, if necessary.
- Invoicing customer.
- Manage Deliver business rules, performance, information, finished product
inventories, capital assets, transportation, product life cycle, and import/export
requirements.
RETURN: Defective, warranty, and excess return processing, including
authorization, scheduling, inspection, transfer, warranty administration, receiving
and verifying defective products, disposition, and replacement.
Return of Raw Materials and Receipt of Returns of Finished Goods;
- All Return Defective Product steps from source – identify product condition,
disposition product, request product return authorization, schedule product
shipment, and return defective product – and deliver – authorized product return,
schedule return receipt, receive product, and transfer defective product.
- All Return Maintenance, Repair, and Overhaul product steps from source – identify
product condition, disposition product, request product return authorization,
39
schedule product shipment, and return MRO product – and deliver – authorize
product return, schedule return receipt, receive product, and transfer MRO product.
- All Return Excess Product steps from source – identify product condition,
disposition product, request product return authorization, schedule product
shipment, and return excess product – and deliver – authorize product return,
schedule return receipt, receive product, and transfer excess product.
- Manage Return business rules, performance, data collection, return inventory,
capital assets, transportation, network configuration, and regulatory requirements
and compliance [10], [12] and [13].
SCOR spans all customer, product, and market interactions surrounding sales
orders, purchase orders, work orders, return authorizations, forecasts, and
replenishment orders. It also encompasses material movements of raw material,
work-in-process, finished goods, and return goods.
The SCOR model includes three levels of process detail. In practice, Level One
defines the number of supply chains and how their performance is measured. Level
Two defines the configuration of planning and execution processes in material flow,
using standard categories like stock, to-order, and engineer-to-order. Level Three
defines the business process used to transact sales orders, purchase orders, work
orders, and return authorizations, replenishment orders, and forecasts.
Level 1 defines the supply chain using five key processes: Plan, Source, Make,
Deliver and Return. The SCOR model Level 1 metrics characterize performance
from customer-facing and internal-facing perspectives. Therefore, at Level 1, basis
of competition is defined and broad guidelines are provided to meet the competition.
Specific tasks to be completed at Level 1 are: set business requirements and define
basis of competition, evaluate the performance of current operation vis-à-vis
required performance, set the SCOR model metrics and targets, and define the gap,
set business priorities and state what needs to change. Also at Level 1, current
supply chain is modeled considering asset, product volume and mix, and technology
requirements and constraints.
Level 2 defines different categories within the Level 1 processes. At this level,
processes are configured in line with supply chain strategy. At Level 2, internal
redundancies can be identified and eliminated:
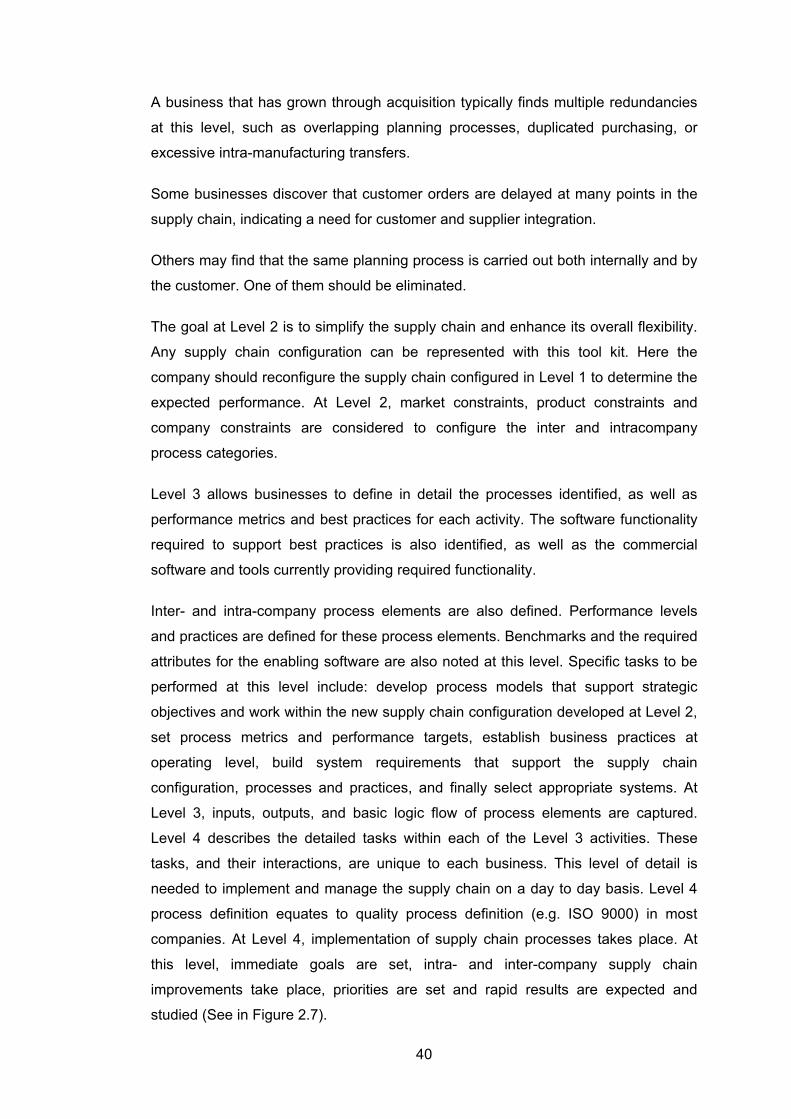
40
A business that has grown through acquisition typically finds multiple redundancies
at this level, such as overlapping planning processes, duplicated purchasing, or
excessive intra-manufacturing transfers.
Some businesses discover that customer orders are delayed at many points in the
supply chain, indicating a need for customer and supplier integration.
Others may find that the same planning process is carried out both internally and by
the customer. One of them should be eliminated.
The goal at Level 2 is to simplify the supply chain and enhance its overall flexibility.
Any supply chain configuration can be represented with this tool kit. Here the
company should reconfigure the supply chain configured in Level 1 to determine the
expected performance. At Level 2, market constraints, product constraints and
company constraints are considered to configure the inter and intracompany
process categories.
Level 3 allows businesses to define in detail the processes identified, as well as
performance metrics and best practices for each activity. The software functionality
required to support best practices is also identified, as well as the commercial
software and tools currently providing required functionality.
Inter- and intra-company process elements are also defined. Performance levels
and practices are defined for these process elements. Benchmarks and the required
attributes for the enabling software are also noted at this level. Specific tasks to be
performed at this level include: develop process models that support strategic
objectives and work within the new supply chain configuration developed at Level 2,
set process metrics and performance targets, establish business practices at
operating level, build system requirements that support the supply chain
configuration, processes and practices, and finally select appropriate systems. At
Level 3, inputs, outputs, and basic logic flow of process elements are captured.
Level 4 describes the detailed tasks within each of the Level 3 activities. These
tasks, and their interactions, are unique to each business. This level of detail is
needed to implement and manage the supply chain on a day to day basis. Level 4
process definition equates to quality process definition (e.g. ISO 9000) in most
companies. At Level 4, implementation of supply chain processes takes place. At
this level, immediate goals are set, intra- and inter-company supply chain
improvements take place, priorities are set and rapid results are expected and
studied (See in Figure 2.7).
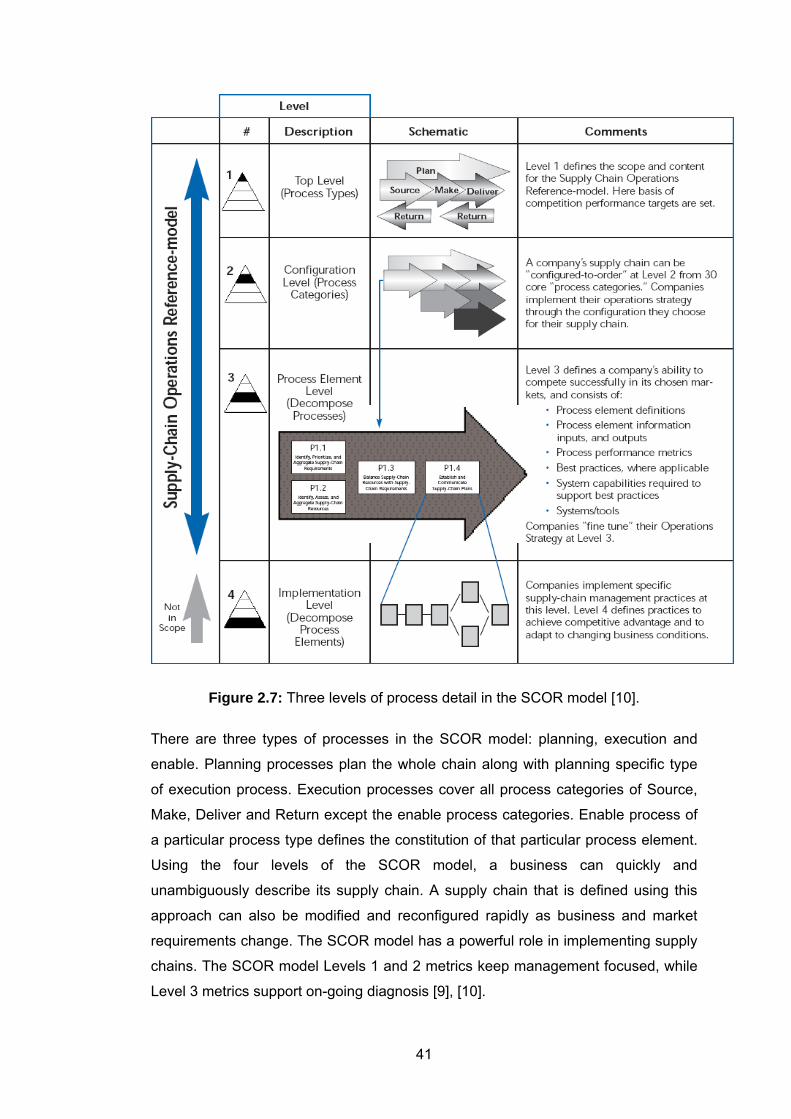
41
Figure 2.7: Three levels of process detail in the SCOR model [10].
There are three types of processes in the SCOR model: planning, execution and
enable. Planning processes plan the whole chain along with planning specific type
of execution process. Execution processes cover all process categories of Source,
Make, Deliver and Return except the enable process categories. Enable process of
a particular process type defines the constitution of that particular process element.
Using the four levels of the SCOR model, a business can quickly and
unambiguously describe its supply chain. A supply chain that is defined using this
approach can also be modified and reconfigured rapidly as business and market
requirements change. The SCOR model has a powerful role in implementing supply
chains. The SCOR model Levels 1 and 2 metrics keep management focused, while
Level 3 metrics support on-going diagnosis [9], [10].
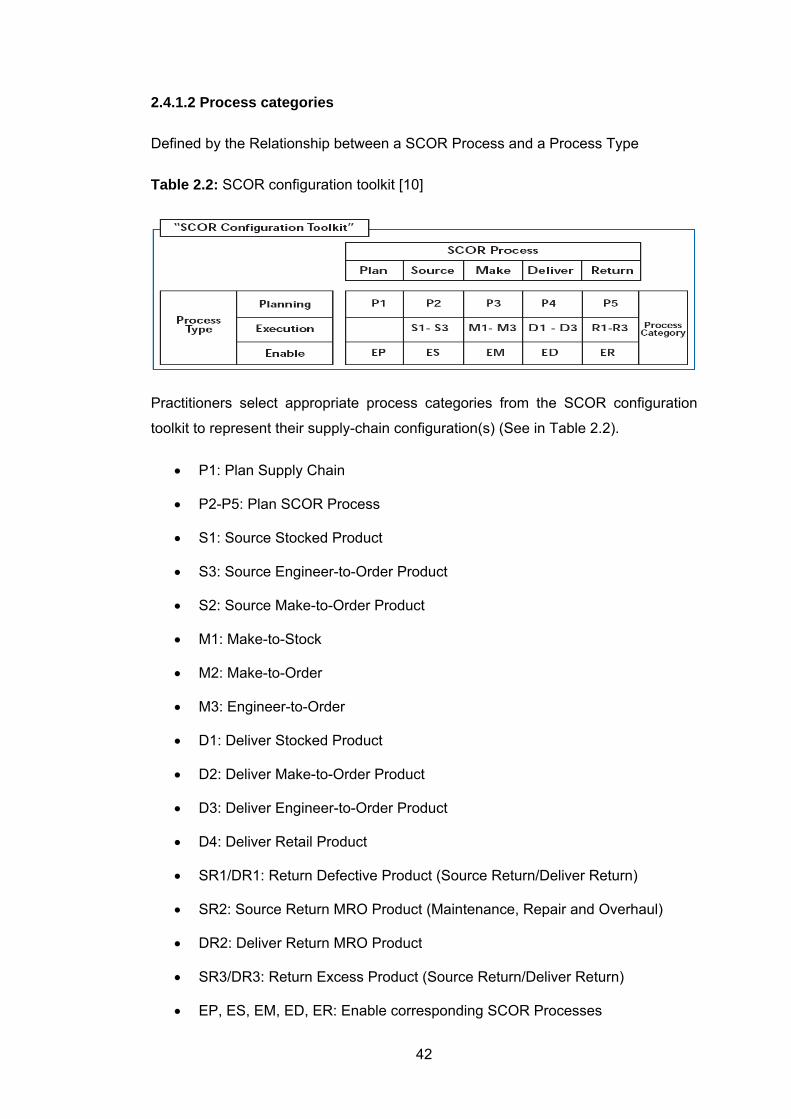
42
2.4.1.2 Process categories
Defined by the Relationship between a SCOR Process and a Process Type
Table 2.2: SCOR configuration toolkit [10]
Practitioners select appropriate process categories from the SCOR configuration
toolkit to represent their supply-chain configuration(s) (See in Table 2.2).
• P1: Plan Supply Chain
• P2-P5: Plan SCOR Process
• S1: Source Stocked Product
• S3: Source Engineer-to-Order Product
• S2: Source Make-to-Order Product
• M1: Make-to-Stock
• M2: Make-to-Order
• M3: Engineer-to-Order
• D1: Deliver Stocked Product
• D2: Deliver Make-to-Order Product
• D3: Deliver Engineer-to-Order Product
• D4: Deliver Retail Product
• SR1/DR1: Return Defective Product (Source Return/Deliver Return)
• SR2: Source Return MRO Product (Maintenance, Repair and Overhaul)
• DR2: Deliver Return MRO Product
• SR3/DR3: Return Excess Product (Source Return/Deliver Return)
• EP, ES, EM, ED, ER: Enable corresponding SCOR Processes
43
Level Metrics Facts
• Level 1 Metrics are primary, high level measures that may cross multiple SCOR processes.
• They do not necessarily relate to a SCOR Level 1 process (Plan-Source-Make-Deliver-Return).
• There is hierarchy among the metrics in different levels.
• Level 1 Metrics are created from lower level calculations (Level 2 metrics)
• Level 2 Metrics:
- Associated with a narrower subset of processes.
Example:
• Metric related with Delivery Performance: Total number of products delivered on time and in full based on a commit date.
• Metric related with Production: Ratio of Actual to Theoretical Cycle Time
Level 1 Process Definitions
SCOR Is Based on Five Core Management Processes (See in Table 2.3).
Table 2.3: SCOR process and definitions [10]
SCOR Process Definitions
Plan Processes that balance aggregate demand and supply to develop a course of action which best meets sourcing, production and delivery requirements
Source Processes that procure goods and services to meet planned or actual demand
Make Processes that transform product to a finished state to meet planned or actual demand
Deliver Processes that provide finished goods and services to meet planned or actual demand, typically including order management, transportation management, and distribution management
Return Processes associated with returning or receiving returned products for any reason. These processes extend into post-delivery customer support
Performance Attributes and Level 1 Metrics
Level 1 Metrics are primary, high level measures that may cross multiple SCOR
processes (See in Table 2.4 and Table 2.5). Level 1 Metrics do not necessarily
relate to a SCOR Level 1 process (PLAN, SOURCE, MAKE, DELIVER, and
RETURN) [11].
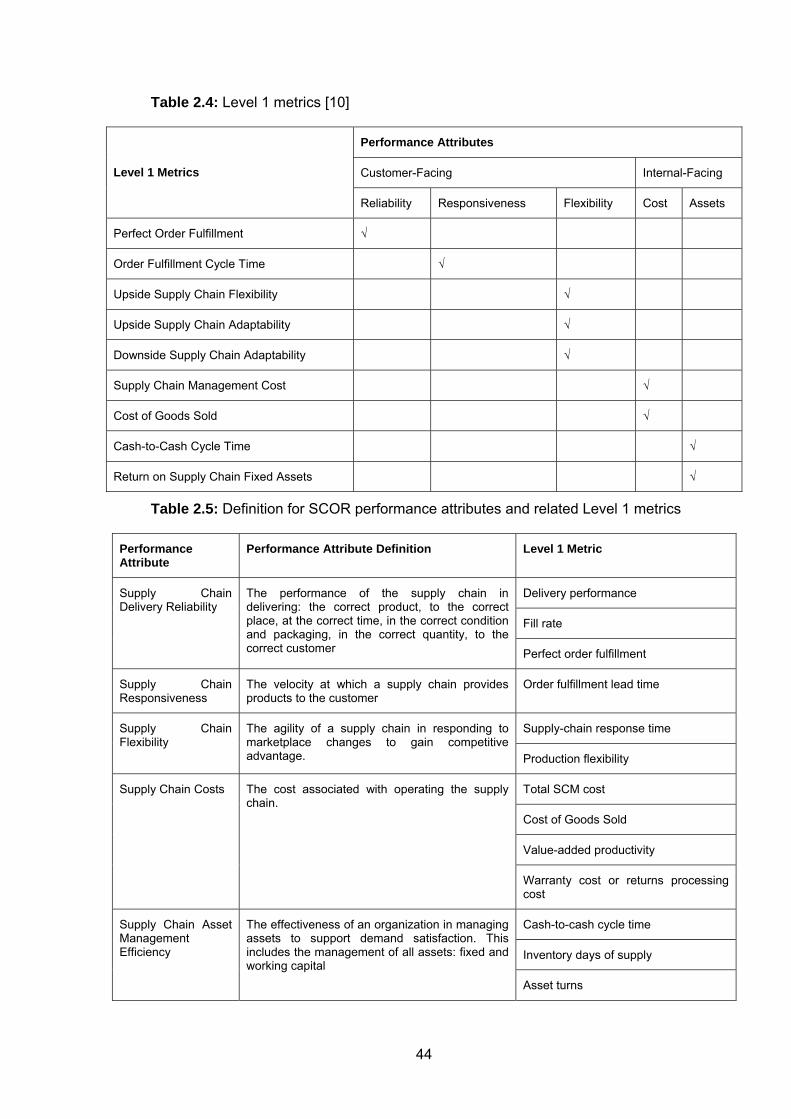
44
Table 2.4: Level 1 metrics [10]
Performance Attributes
Customer-Facing Internal-Facing Level 1 Metrics
Reliability Responsiveness Flexibility Cost Assets
Perfect Order Fulfillment √
Order Fulfillment Cycle Time √
Upside Supply Chain Flexibility √
Upside Supply Chain Adaptability √
Downside Supply Chain Adaptability √
Supply Chain Management Cost √
Cost of Goods Sold √
Cash-to-Cash Cycle Time √
Return on Supply Chain Fixed Assets √
Table 2.5: Definition for SCOR performance attributes and related Level 1 metrics
Performance Attribute
Performance Attribute Definition Level 1 Metric
Delivery performance
Fill rate
Supply Chain Delivery Reliability
The performance of the supply chain in delivering: the correct product, to the correct place, at the correct time, in the correct condition and packaging, in the correct quantity, to the correct customer Perfect order fulfillment
Supply Chain Responsiveness
The velocity at which a supply chain provides products to the customer
Order fulfillment lead time
Supply-chain response time Supply Chain Flexibility
The agility of a supply chain in responding to marketplace changes to gain competitive advantage. Production flexibility
Total SCM cost
Cost of Goods Sold
Value-added productivity
Supply Chain Costs The cost associated with operating the supply chain.
Warranty cost or returns processing cost
Cash-to-cash cycle time
Inventory days of supply
Supply Chain Asset Management Efficiency
The effectiveness of an organization in managing assets to support demand satisfaction. This includes the management of all assets: fixed and working capital
Asset turns
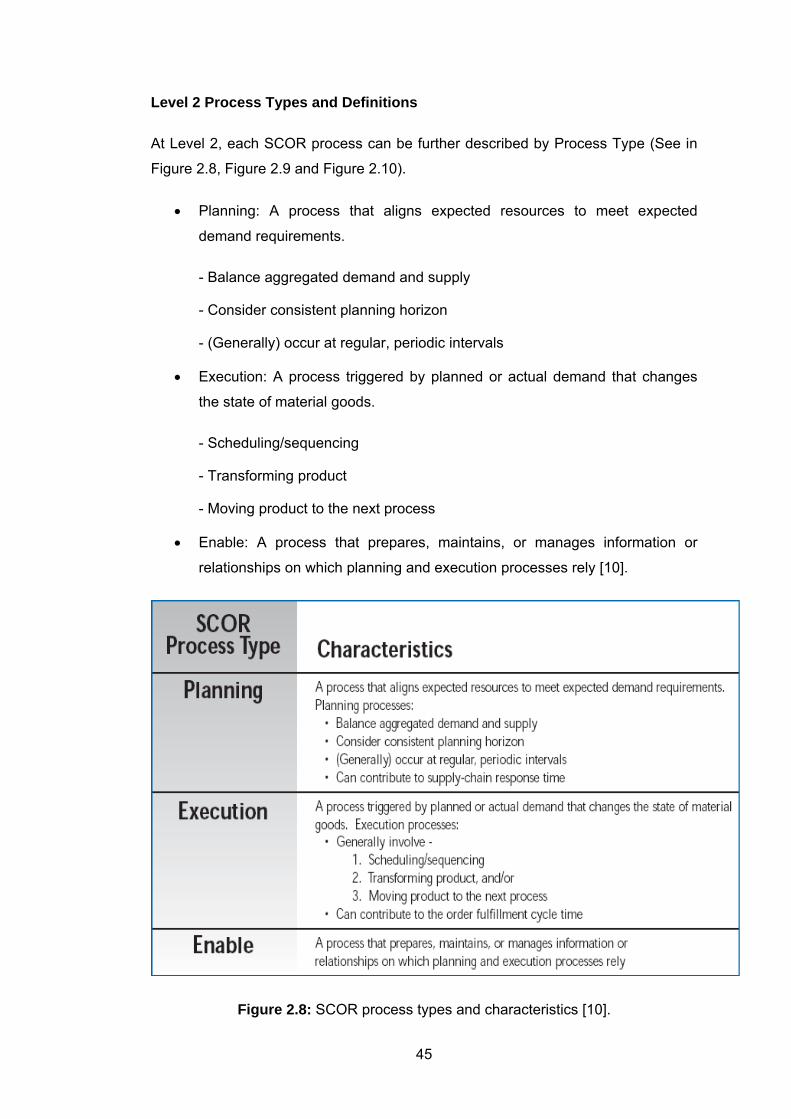
45
Level 2 Process Types and Definitions
At Level 2, each SCOR process can be further described by Process Type (See in
Figure 2.8, Figure 2.9 and Figure 2.10).
• Planning: A process that aligns expected resources to meet expected
demand requirements.
- Balance aggregated demand and supply
- Consider consistent planning horizon
- (Generally) occur at regular, periodic intervals
• Execution: A process triggered by planned or actual demand that changes
the state of material goods.
- Scheduling/sequencing
- Transforming product
- Moving product to the next process
• Enable: A process that prepares, maintains, or manages information or
relationships on which planning and execution processes rely [10].
Figure 2.8: SCOR process types and characteristics [10].
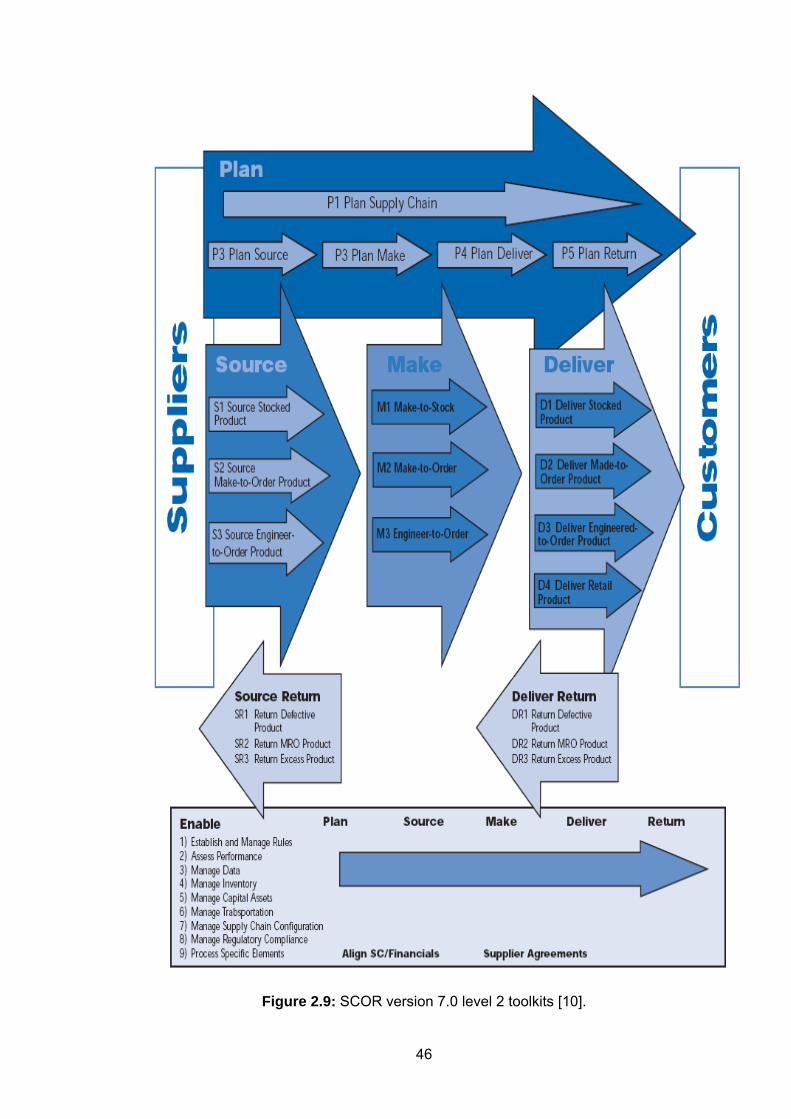
46
Figure 2.9: SCOR version 7.0 level 2 toolkits [10].
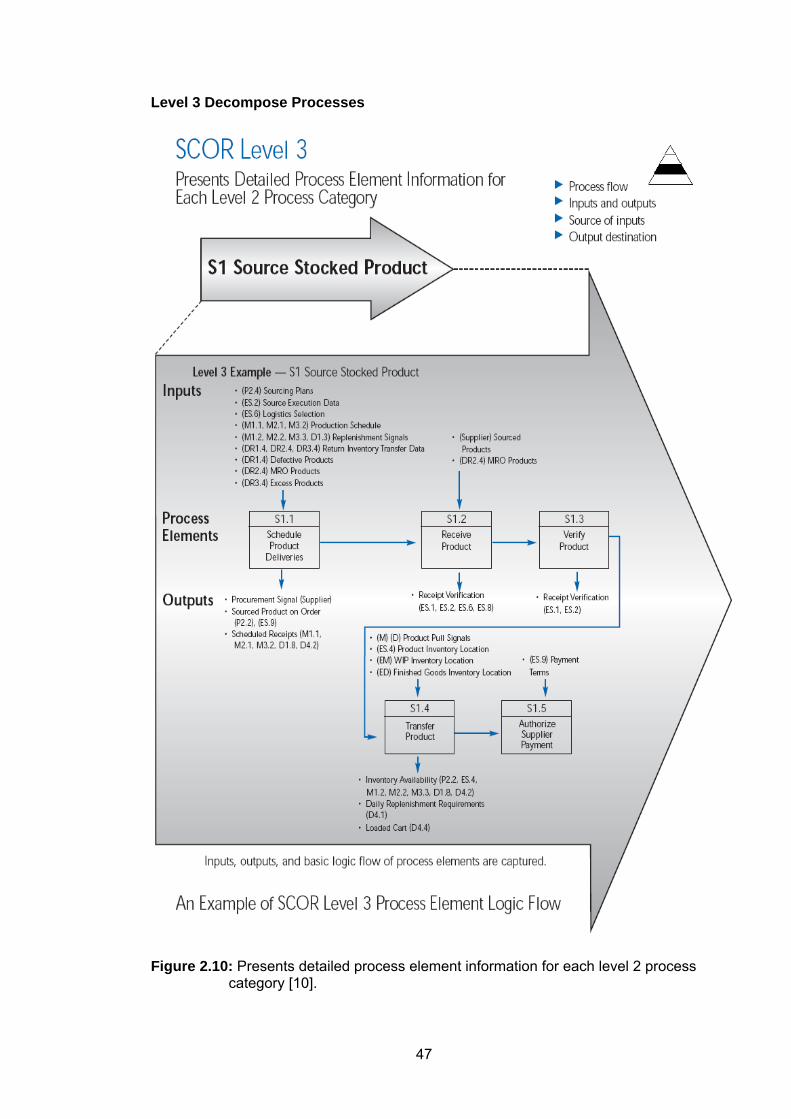
47
Level 3 Decompose Processes
Figure 2.10: Presents detailed process element information for each level 2 process category [10].
48
Extended benefits of SCOR;
• 16%-18% improvement on performance of deliveries
• 25%- 60% reducing inventory
• 30%-50% improvement on circuit time
• 25%-80% improvement on true forecasting
• 10%-16% total productivity boost
• 25%-50% cost benefits of supply chain
• 20%-30% improvement on ratio of supply to order
• 10%-20% increase on use of capacity
In conclusion, with SCOR model;
• Optimization of processes,
• Decreasing of stock costs,
• Providing the communication with suppliers in electronic form,
• Decreasing of service costs,
• Improvement on customer times of delivery,
• Formations of a giant supply chain,
• Standardization on processes,
• A common communication language,
• Measuring of process performance with using metrics,
• Effectively using of information technologies according to the performance
metrics,
• To holding a meeting and receive training of employees in order that a
common aim,
• Developing of the corporate culture senses,
in the sense of modern management [10].
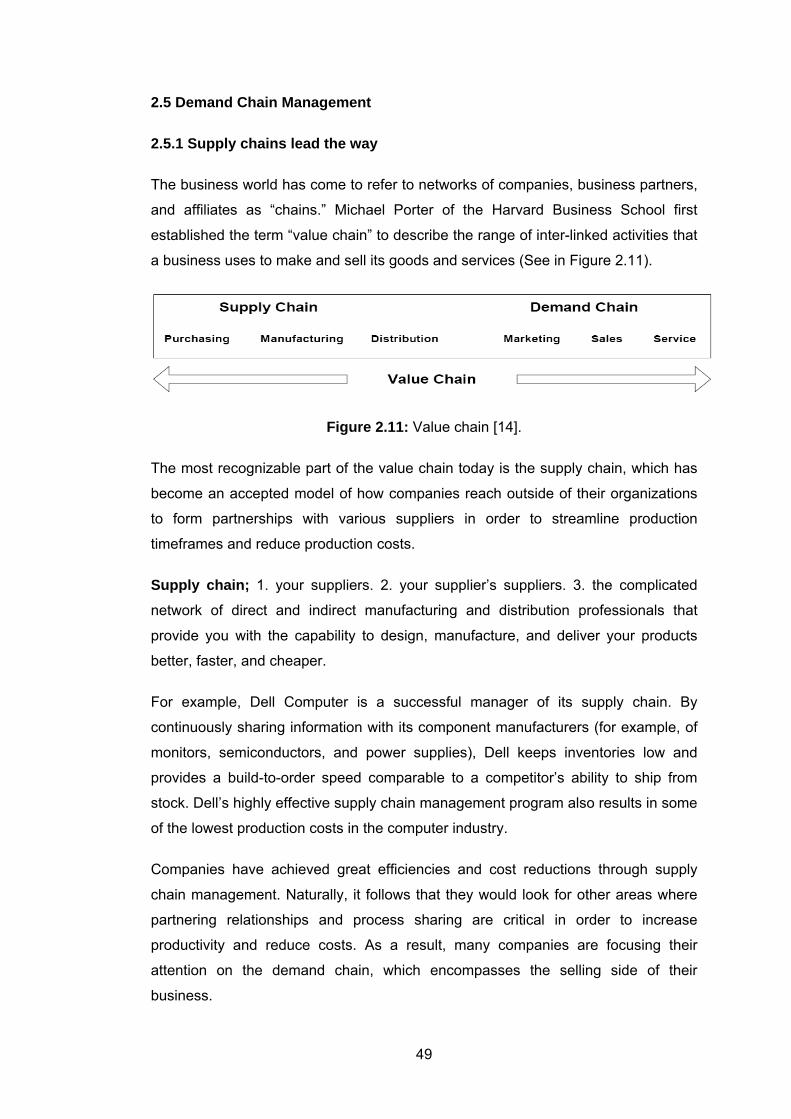
49
2.5 Demand Chain Management
2.5.1 Supply chains lead the way
The business world has come to refer to networks of companies, business partners,
and affiliates as “chains.” Michael Porter of the Harvard Business School first
established the term “value chain” to describe the range of inter-linked activities that
a business uses to make and sell its goods and services (See in Figure 2.11).
Figure 2.11: Value chain [14].
The most recognizable part of the value chain today is the supply chain, which has
become an accepted model of how companies reach outside of their organizations
to form partnerships with various suppliers in order to streamline production
timeframes and reduce production costs.
Supply chain; 1. your suppliers. 2. your supplier’s suppliers. 3. the complicated
network of direct and indirect manufacturing and distribution professionals that
provide you with the capability to design, manufacture, and deliver your products
better, faster, and cheaper.
For example, Dell Computer is a successful manager of its supply chain. By
continuously sharing information with its component manufacturers (for example, of
monitors, semiconductors, and power supplies), Dell keeps inventories low and
provides a build-to-order speed comparable to a competitor’s ability to ship from
stock. Dell’s highly effective supply chain management program also results in some
of the lowest production costs in the computer industry.
Companies have achieved great efficiencies and cost reductions through supply
chain management. Naturally, it follows that they would look for other areas where
partnering relationships and process sharing are critical in order to increase
productivity and reduce costs. As a result, many companies are focusing their
attention on the demand chain, which encompasses the selling side of their
business.
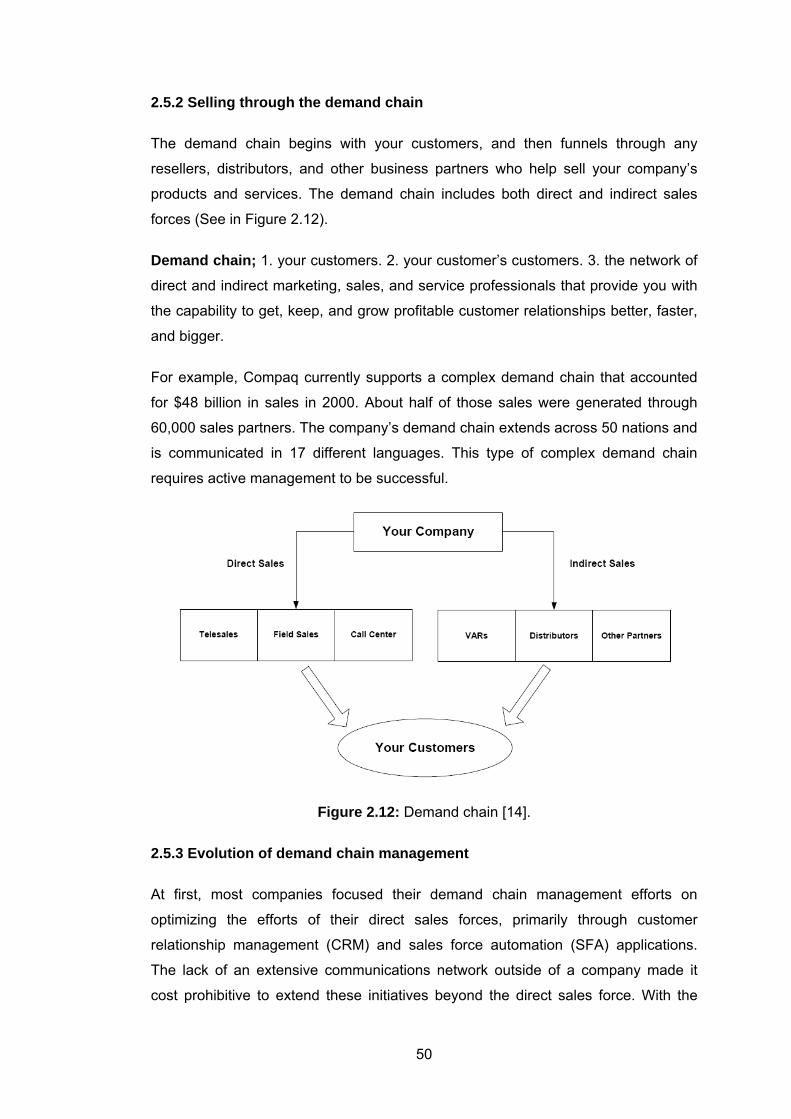
50
2.5.2 Selling through the demand chain
The demand chain begins with your customers, and then funnels through any
resellers, distributors, and other business partners who help sell your company’s
products and services. The demand chain includes both direct and indirect sales
forces (See in Figure 2.12).
Demand chain; 1. your customers. 2. your customer’s customers. 3. the network of
direct and indirect marketing, sales, and service professionals that provide you with
the capability to get, keep, and grow profitable customer relationships better, faster,
and bigger.
For example, Compaq currently supports a complex demand chain that accounted
for $48 billion in sales in 2000. About half of those sales were generated through
60,000 sales partners. The company’s demand chain extends across 50 nations and
is communicated in 17 different languages. This type of complex demand chain
requires active management to be successful.
Figure 2.12: Demand chain [14].
2.5.3 Evolution of demand chain management
At first, most companies focused their demand chain management efforts on
optimizing the efforts of their direct sales forces, primarily through customer
relationship management (CRM) and sales force automation (SFA) applications.
The lack of an extensive communications network outside of a company made it
cost prohibitive to extend these initiatives beyond the direct sales force. With the
51
advent of the Internet, communications opportunities expanded and became cost-
effective. As a result, companies started to communicate outside of their
organizations and are now directing more of their efforts toward managing their
indirect sales relationships as well.
The successful management of these sales partner relationships depends on two
key components:
1) The administration and management of the business relationship between the
company and its sales partners.
2) The collaborative management of the customer life cycle across a multi-channel
demand chain.
The first component, the administration and management of partner relationships,
has been addressed by vendors offering web-based partner relationship
management (PRM) portals. These portals help companies manage the
administrative aspects of their business relationships with sales partners. For
example, PRM portals provide the capability to maintain partner profiles; track
partner attainment, discount levels, and incentives; co manage
market development funds (MDFs); and administer training and certification
programs. While PRM portals may increase efficiencies and reduce costs, they do
not deliver the big win - the substantial revenue and market share gains and true
competitive advantages that come from collaborative management of the customer
life cycle, which is the second, and key, component of demand chain management.
Why do these portals fail to manage the customer life cycle across the demand
chain?
Quite simply, they impose your system onto the business partner. In an environment
where the typical sales partner represents six to eight different vendor offerings, this
is simply a burdensome and unworkable solution. This approach forces sales
partners to deal with a disparate set of vendor web portals, in addition to their own
in-house system, which invariably leads to a lack of adoption and acceptance of the
portal by the partner community.
PRM portals just aren’t built to handle the challenges of complex, two-way
collaborative sales relationships, which require information sharing and mutual
business process support based on the needs of the customer. In essence, what is
52
missing in today’s PRM and web portal technology is joint management of the
customer relationship itself, which is the essential component of a successful sales
strategy [14].
2.6 Supply Chain Coordination and Use of Technology
2.6.1 The “Bullwhip” effect
One of the most common dynamics in supply chains is a phenomenon that has
been dubbed “the bullwhip effect.” What happens is that small changes in product
demand by the consumer at the front of the supply chain translate into wider and
wider swings in demand experienced by companies’ further back in the supply
chain. Companies at different stages in the supply chain come to have very different
pictures of market demand and the result is a breakdown in supply chain
coordination. Companies behave in ways that at first create product shortages and
then lead to an excess supply of products.
This dynamic plays out on a larger scale in certain industries in what is called a
“boom to bust” business cycle. In particular this affects industries that serve
developing and growth markets where demand can suddenly grow. Good examples
of this can be found in the industries that serve the telecommunications equipment
or computer components markets. The cycle starts when strong market demand
creates a shortage of product. Distributors and manufacturers steadily increase their
inventories and production rates in response to the demand. At some point either
demand changes or the supply of product exceeds the demand level. Distributors
and manufacturers do not at first realize that supply exceeds demand and they
continue building the supply. Finally the glut of product is so large that everyone
realizes there is too much. Manufacturers shut down plants and lay off workers.
Distributors are stuck with inventories that decrease in value and can take years to
work down.
This dynamic can be modeled in a simple supply chain that contains a retailer, a
distributor, and a manufacturer. In the 1960s a simulation game was developed by
the Massachusetts Institute of Technology’s Sloan School of Management that
illustrates how the bullwhip effect develops. The simulation game they developed is
called the “beer game.” It shows what happens in a hypothetical supply chain that
supports a group of retail stores that sell beer, snacks, and other convenience items.
The results of the beer game simulation teach a lot about how to coordinate the
actions of different companies in a supply chain.
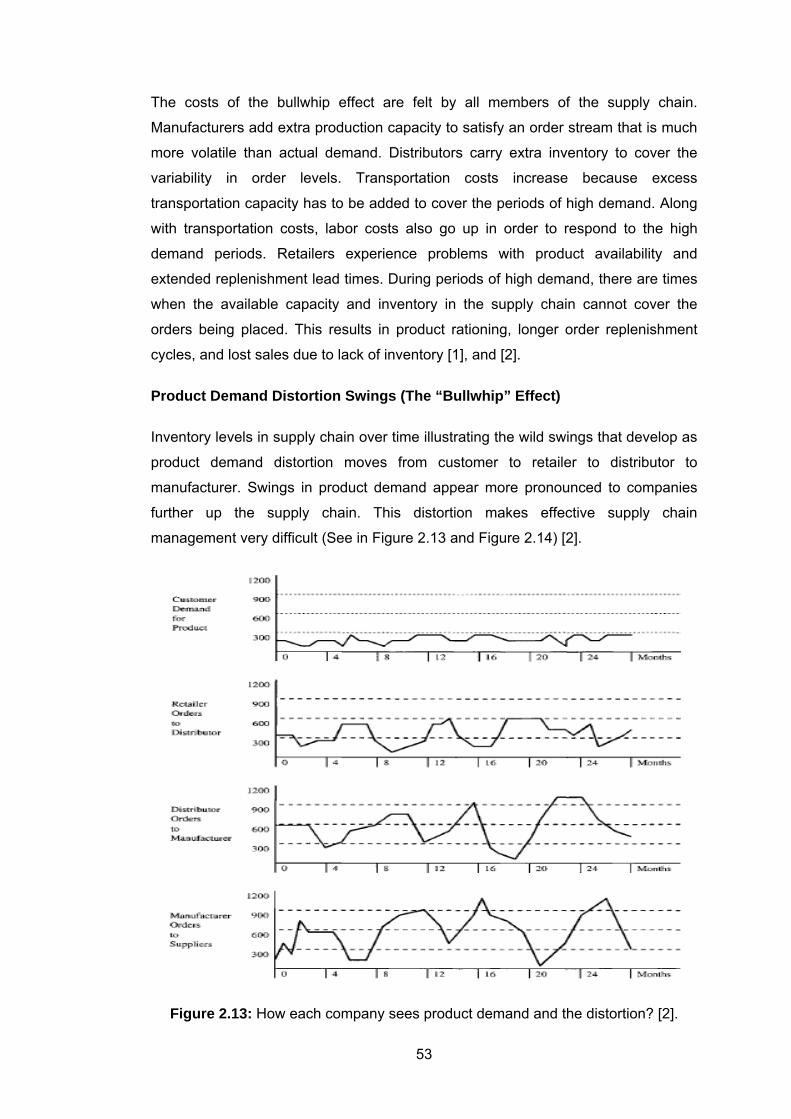
53
The costs of the bullwhip effect are felt by all members of the supply chain.
Manufacturers add extra production capacity to satisfy an order stream that is much
more volatile than actual demand. Distributors carry extra inventory to cover the
variability in order levels. Transportation costs increase because excess
transportation capacity has to be added to cover the periods of high demand. Along
with transportation costs, labor costs also go up in order to respond to the high
demand periods. Retailers experience problems with product availability and
extended replenishment lead times. During periods of high demand, there are times
when the available capacity and inventory in the supply chain cannot cover the
orders being placed. This results in product rationing, longer order replenishment
cycles, and lost sales due to lack of inventory [1], and [2].
Product Demand Distortion Swings (The “Bullwhip” Effect)
Inventory levels in supply chain over time illustrating the wild swings that develop as
product demand distortion moves from customer to retailer to distributor to
manufacturer. Swings in product demand appear more pronounced to companies
further up the supply chain. This distortion makes effective supply chain
management very difficult (See in Figure 2.13 and Figure 2.14) [2].
Figure 2.13: How each company sees product demand and the distortion? [2].
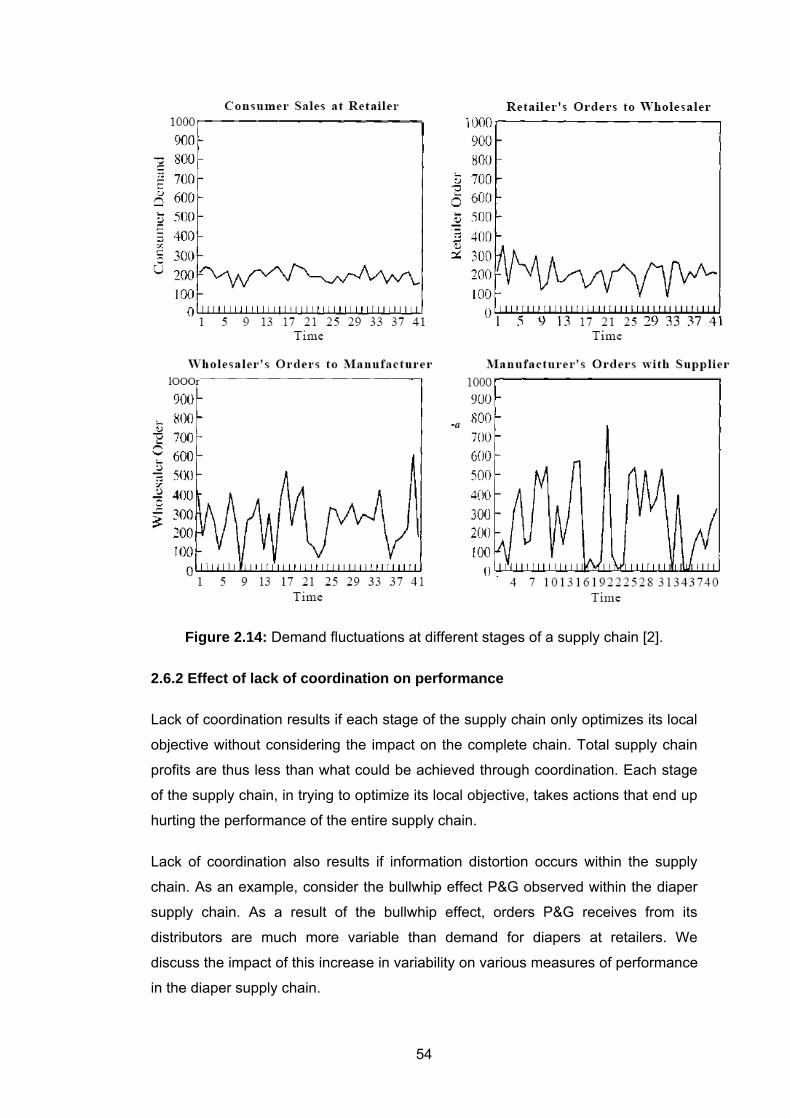
54
Figure 2.14: Demand fluctuations at different stages of a supply chain [2].
2.6.2 Effect of lack of coordination on performance
Lack of coordination results if each stage of the supply chain only optimizes its local
objective without considering the impact on the complete chain. Total supply chain
profits are thus less than what could be achieved through coordination. Each stage
of the supply chain, in trying to optimize its local objective, takes actions that end up
hurting the performance of the entire supply chain.
Lack of coordination also results if information distortion occurs within the supply
chain. As an example, consider the bullwhip effect P&G observed within the diaper
supply chain. As a result of the bullwhip effect, orders P&G receives from its
distributors are much more variable than demand for diapers at retailers. We
discuss the impact of this increase in variability on various measures of performance
in the diaper supply chain.
55
2.6.2.1 Manufacturing cost
The bullwhip effect increases manufacturing cost in the supply chain. As a result of
the bullwhip effect, P&G and its suppliers try to satisfy a stream of orders that is
much more variable than customer demand. P&G can respond to the increased
variability by either building excess capacity or holding excess inventory, both of
which increase the manufacturing cost per unit produced.
2.6.2.2 Inventory cost
The bullwhip effect increases inventory cost in the supply chain. To handle the
increased variability in demand, P&G has to carry a higher level of inventory than
would be required in the absence of the bullwhip effect. As a result, inventory costs
in the supply chain increase. The high levels of inventory also increase the
warehousing space required and thus the warehousing cost incurred.
2.6.2.3 Replenishment lead time
The bullwhip effect increases replenishment lead times in the supply chain. The
increased variability as a result of the bullwhip effect makes scheduling at P&G and
supplier plants much more difficult compared to a situation with level demand. There
are times when the available capacity and inventory cannot supply the orders
coming in. This results in higher replenishment lead times within the supply chain
from both P&G and its suppliers.
2.6.2.4 Transportation cost
The bullwhip effect increases transportation cost within the supply chain. The
transportation requirements over time at P&G and its suppliers are correlated with
the orders being filled. As a result of the bullwhip effect, transportation requirements
fluctuate significantly over time. This raises transportation cost because surplus
transportation capacity needs to be maintained to cover high-demand periods.
2.6.2.5 Labor cost for shipping and receiving
The bullwhip effect increases labor costs associated with shipping and receiving in
the supply chain. Labor requirements for shipping at P&G and its suppliers fluctuate
with orders. A similar fluctuation will occur for the labor requirements for receiving at
distributors and retailers. The various stages have the option of carrying excess
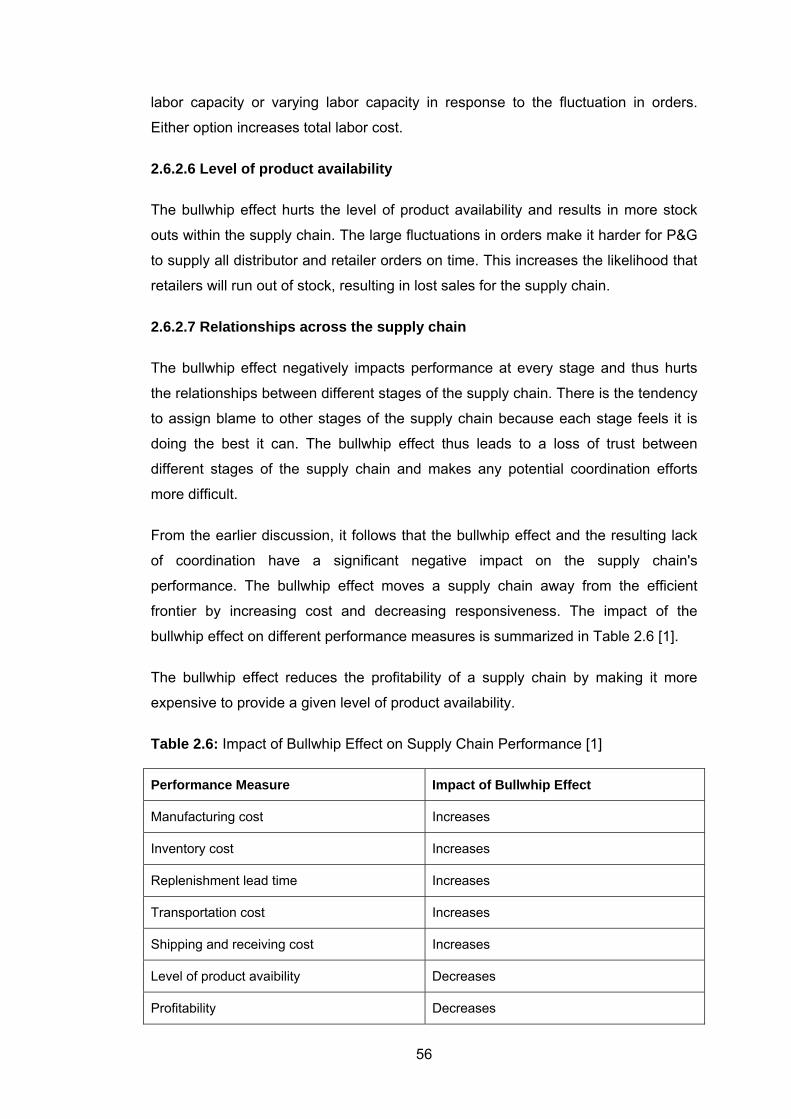
56
labor capacity or varying labor capacity in response to the fluctuation in orders.
Either option increases total labor cost.
2.6.2.6 Level of product availability
The bullwhip effect hurts the level of product availability and results in more stock
outs within the supply chain. The large fluctuations in orders make it harder for P&G
to supply all distributor and retailer orders on time. This increases the likelihood that
retailers will run out of stock, resulting in lost sales for the supply chain.
2.6.2.7 Relationships across the supply chain
The bullwhip effect negatively impacts performance at every stage and thus hurts
the relationships between different stages of the supply chain. There is the tendency
to assign blame to other stages of the supply chain because each stage feels it is
doing the best it can. The bullwhip effect thus leads to a loss of trust between
different stages of the supply chain and makes any potential coordination efforts
more difficult.
From the earlier discussion, it follows that the bullwhip effect and the resulting lack
of coordination have a significant negative impact on the supply chain's
performance. The bullwhip effect moves a supply chain away from the efficient
frontier by increasing cost and decreasing responsiveness. The impact of the
bullwhip effect on different performance measures is summarized in Table 2.6 [1].
The bullwhip effect reduces the profitability of a supply chain by making it more
expensive to provide a given level of product availability.
Table 2.6: Impact of Bullwhip Effect on Supply Chain Performance [1]
Performance Measure Impact of Bullwhip Effect
Manufacturing cost Increases
Inventory cost Increases
Replenishment lead time Increases
Transportation cost Increases
Shipping and receiving cost Increases
Level of product avaibility Decreases
Profitability Decreases
57
2.6.3 Coordination in the supply chain
Research into the bullwhip effect has identified five major factors that cause the
effect. These factors interact with each other in different combinations in different
supply chains but the net effect is that they generate the wild demand swings that
make it so hard to run an efficient supply chain. These factors must be understood
and addressed in order to coordinate the actions of any supply chain. They are:
1) Demand Forecasting
Demand forecasting based on orders received instead of end user demand data will
inherently become more and more inaccurate as it moves up the supply chain.
Companies that are removed from contact with the end user can lose touch with
actual market demand if they view their role as simply filling the orders placed with
them by their immediate customers. Each company in a supply chain sees
fluctuations in the orders that come to them that are caused by the bullwhip effect.
When they use this order data to do their demand forecasts, they just add further
distortion to the demand picture and pass this distortion along in the form of orders
that they place with their suppliers.
Clearly, one way to counteract this distortion in demand forecasts is for all
companies in a supply chain to share a common set of demand data from which to
do their forecasting. The most accurate source of this demand data is the supply
chain member closest to the end use customer (if not the end use customers
themselves). Sharing point-of-sales (POS) data among all the companies in a
supply chain goes a long way toward taming the bullwhip effect because it lets
everyone respond to actual market demand instead of supply chain distortions.
2) Order Batching
Order batching occurs because companies place orders periodically for amounts of
product that will minimize their order processing and transportation costs. As
discussed in the section on inventory control in Chapter 2, companies tend to order
in lot sizes determined by the EOQ (economic order quantity). Because of order
batching, these orders vary from the level of actual demand and this variance is
magnified as it moves up the supply chain.
The way to address demand distortion caused by order batching is to find ways to
reduce the cost of order processing and transportation. This will cause EOQ lot
58
sizes to get smaller and orders to be placed more frequently. The result will be a
smoother flow of orders that distributors and manufacturers will be able to handle
more efficiently. Ordering costs can be reduced by using electronic ordering
technology. Transportation costs can be reduced by using third party logistics
suppliers (3PLs) to cost effectively pick up many small shipments from suppliers and
deliver small orders to many customers.
3) Product Rationing
This is the response that manufacturers take when they are faced with more
demand than they can meet. One common rationing approach is for a manufacturer
to allocate the available supply of product based on the number of orders received.
Thus, if the available supply equals 70 percent of the orders received, the
manufacturer will fill 70 percent of the amount of each order and back order the rest.
This leads distributors and retailers in the supply chain to raise their order quantities
artificially in order to increase the amount of product that gets rationed to them. This
behavior greatly overstates product demand and it is called “shortage gaming.”
There are several ways to respond to this. Manufacturers can base their rationing
decisions on the historical ordering patterns of a given distributor or retailer and not
on their present order sizes. This eliminates much of the motivation for the shortage
gaming that otherwise occurs. Manufacturers and distributors can also alert their
customers in advance if they see demand outstripping supply. This way product
shortage will not take buyers by surprise and there will be less panic buying.
4) Product Pricing
Product pricing causes product prices to fluctuate, resulting in distortions of product
demand. If special sales are offered and product prices are lowered, it will induce
customers to buy more products or to buy product sooner than they otherwise would
(forward buying).Then prices return to normal levels and demand falls off. Instead of
a smooth flow of products through the supply chain, price fluctuations can create
waves of demand and surges of product flow that are hard to handle efficiently.
Answers to this problem generally revolve around the concept of “everyday low
prices.” If the end customers for a product believe that they will get a good price
whenever they purchase the product, they will make purchases based on real need
and not other considerations. This in turn makes demand easier to forecast and
companies in the supply chain can respond more efficiently.
59
5) Performance Incentives
These are often different for different companies and individuals in a supply chain.
Each company can see its job as managing its position in isolation from the rest of
the supply chain. Within companies, individuals can also see their job in isolation
from the rest of the company. It is common for companies to structure incentives
that reward a company’s sales force on sales made each month or each quarter.
Therefore as the end of a month or a quarter approaches, the sales force offers
discounts and takes other measures to move product in order to meet quotas. This
results in product for which there is no real demand being pushed into the supply
chain. It is also common for managers within a company to be motivated by
incentives that conflict with other company objectives. For instance, a transportation
manager may take actions that minimize transportation costs at the expense of
customer service or inventory carrying costs.
Alignment of performance incentives with supply chain efficiencies is a real
challenge. It begins with the use of accurate activity based costing (ABC) data that
can highlight the associated costs. Companies need to quantify the expenses
incurred by forward buying due to month-end or end-of-quarter sales incentives.
Companies also need to identify the effect of conflicting internal performance
incentives. The next step is to experiment with new incentive plans that support
efficient supply chain operation. This is a process that each company needs to work
through in its own way [2].
2.7 Demand Forecasting
Forecasting customer demand for products and services is one of the most
fundamental tasks that a business must perform. It is a proactive process of
determining what products are needed where, when, and in what quantities.
Consequently, demand forecasting is a customer–focused activity.
Demand forecasting is also the foundation of a company’s entire logistics process. It
supports other planning activities such as capacity planning, master production
scheduling (MPS), inventory planning, and even overall business planning [15].
I. Benefits of Effective Demand Forecasting
Profit is revenue less expenses, and the ultimate goal of business is to maximize
profit. Effective demand forecasting will help your business reach its goals. From the
60
customer’s perspective, their needs will be satisfied by having your goods available
when they want them. From the business’s perspective, revenue will increase since
lost sales are minimized. Also, your business’s cost structure will improve due to
more efficient use of capital. The company’s income statement, balance sheet, and
cash flow statements can all be positively influenced by effective demand
forecasting.
In addition to the raw financial benefits mentioned above, there are other
advantages to improved performance in demand forecasting. They include:
• Improved customer service levels.
• Fewer backorders and lost sales.
• Less inventory investment in safety stock.
• Improved production planning processes.
• Earlier recognition of marketplace trends.
II. A Fact about Forecasting
A simple fact about forecasting is that they are usually wrong. What is important is
the direction and amount the forecast deviates from that which actually occurs.
Because forecasts are looking into the unknown future, some level of error between
demand forecasts and actual demand is expected. The magnitude of the error,
referred to as forecast accuracy, is what determines whether your forecasts are
good or bad.
Careful selection of appropriate forecasting techniques and following best practices
will help your business improve forecast accuracy.
III. Demand Characteristics
Before a discussion of popular forecasting methods, it is important to be familiar with
the five major characteristics of demand:
1. Average: Demand tends to cluster around a specific level.
2. Trend: Demand consistently increases or decreases over time.
3. Seasonality: Demand shows peaks and valleys at consistent intervals. These
intervals can be hours, days, weeks, months, years, or seasons.
61
4. Cyclical: Demand gradually increases and decreases over an extended period of
time, such as years. Business cycles (recession and expansion) and product life
cycles influence this component of demand.
5. Random Error: Variations that cannot be explained or predicted.
IV. Forecasting Methods and Techniques
There are three types of forecasting methods available to predict demand: (1)
judgment methods, (2) time series analysis, and (3) causal methods. Each of these
methods are described below with the techniques used to apply the method.
1. Judgment Methods
These methods utilize opinions to develop forecasts and are generally used when
historical data is not available. The basis for judgment methods is that the decision
maker(s) possess sufficient experience to establish forecasts. In general, they are
low cost and have a rapid development time. However, they are not consistently
accurate and are subject to bias by the group creating the forecast.
a. Sales force estimates: The sales force, which is closest to the customer and immersed in the marketplace, creates estimates of customer demand.
Because of their proximity to the consumers, information from the sales force can be
very reliable. However, individual biases and can decrease the effectiveness of this
technique.
b. Executive opinion: Executives, who usually have a good understanding of the broad–based factors that influence demand, create estimates of customer demand.
This can be a good method to use when creating forecasts for new or very strategic
products. However, it consumes valuable executive time and requires consensus
between executives.
c. Delphi method: The Delphi method is a facilitated process of gaining consensus within a group of anonymous participants. The facilitator sends a forecast questionnaire to each member of the Delphi group. Anonymity is critical in this method to prevent a few group members from dominating the decision. When the questionnaire is returned, the responses are statistically summarized and then sent back out to the group. Each Delphi member has the choice to modify their previous
62
responses based on the responses of the group. This is a reiterative process that continues until a consensus is obtained.
The Delphi method is used for new products or for very long–range forecasts.
However, it is a time–consuming process that is highly dependent on the quality of
the questionnaires. Furthermore, participants may provide inadequate responses
because there is no accountability.
2. Time Series Analysis
Time series forecasting methods, also known as intrinsic methods, use prior
demand history to generate a forecast. The techniques that make up this category
assume that the past patterns of demand will continue into the future. In the short–
term, they perform very well; in the long–term, they generally perform poorly.
A commonly used analogy is that using time series analysis techniques is like
driving a car by looking at the rear–view mirror. On a straight road this is an
acceptable approach, but on windy roads, this would lead to disastrous results. As a
result, these techniques are best used for (1) mature products, (2) products with a
large amount of historical data, or (3) products with smooth, random demand
variations.
Demand forecasting software easily systematizes these forecasting methods.
Because of this, forecasting large numbers of items by these methods is easily
performed with software.
1. Naïve: The naïve technique is simply the forecast for the next period is equal to
the demand for the current period. This is a simple, low–cost method that only takes
trend into account. However, if demand is variable, this is a poor method to use.
2. Moving Average (simple and weighted): The simple moving average method is
used to determine the average amount of demand over a given time period. The
weighted moving average technique allows each period in the calculation to carry
it’s own weight. The user can specify that recent demand will be weighted more
heavily in the calculation than older data.
Moving average techniques are most appropriate for stable demand patterns, when
demand does exhibit trend or seasonality components. Unfortunately, if trend or
seasonality exists in the demand, the forecasts will lag in their ability to predict future
demand.
63
3. Exponential Smoothing (single, double, triple): Exponential smoothing methods
require user–specified factors to calculate the forecast:
- Smoothing (averaging): reactivity of forecast to current demand period
- Trend: dampen or accelerate trend in the forecast
- Seasonality: dampen or enhance the effect of seasonality on the forecast
Single exponential smoothing uses the smoothing factor only in the forecast
calculation. Double exponential smoothing uses the smoothing and trend factors in
the forecast calculation. Triple exponential smoothing uses the smoothing, trend,
and seasonality factors in the forecast calculation. These techniques are popular
and are easily calculated with demand planning software. Unfortunately, a great
deal of effort may be required to estimate the three factors used in forecast
calculations. Also, while they perform well in short–term forecasts, they do not
perform as well on products with low demand.
3. Causal Methods
Causal methods create forecasts by determining a cause–effect relationship
between independent variables and the demand for the product. Two examples
where causal methods could be used to create forecasts will help to illustrate this:
- Forecasting snowblowers: Long range forecasts for winter snowfall can be used to forecast snowblower consumption.
- Promotion planning: If the consumer price of a product is reduced by $1.50 per unit, how will it affect demand?
One of the benefits is that causal methods provide good long–term forecast
accuracy. For instance, if a weatherman predicts that it will be a cold winter, then the
demand for heavy jackets will be greater.
Perhaps their most beneficial aspect is that causal methods support “What if?”
analyses. However, the forecasts are only as good as the independent variables
identified and the model created. They require careful thought and insight into the
variables that effect demand [15].
64
2.7.1 The importance of demand forecasting
Demand forecasting is the estimation of demand according to place and period of
time and the stock charter for planning to logistic operations. It is impossible to being
well and confidential without studies on production planning while a priori planning
phase. Renfro and Morrison emphasize the importance of anything is important then
well-planned demand estimation for adapting itself to changing environment and for
developing logical and extensive system with holding management and capacity.
Five hundred firms which were published in Fortuna Magazine, expense
approximately quarter million dollars to demand estimation for each year.
Demand forecasting is the base of determination for business production level.
Which product will produce, which amount will be demanded on that product and
generally which term it will occur, all these are understand with demand forecasting.
In addition, it also supplies the basic date for the rest of production planning. All
these functions translate estimation which was made before, to facility, machine,
raw material, spare part, semi finished product, human force, programming and the
other decisions.
Correct forecasting’s let the managers improve their source demand instead of
making unexpected increase both capacity and huge amount inventory. Demand
forecasting is redounded with altering knowledge and coordination instead of logistic
efficiency inventory. Designed cash flow and business activities lean on forecasting
strategy purposes. Production and facility capacity demands rely on capacity
constraint estimation. Forecasting of logistic necessity determines production
allocation to distribution centres’, wholesalers and retailers. Production necessity
estimation affects production programmers and supply necessity on this way. It is
seen that the necessity of inducement of all activities for main forecasting to provide
integration of supply chain. For this reason it is important to develop a forecasting
procedure which combines financial, marketing, sale, production and logistic
aspects.
If the company produced more productions then the expectation of the market with
according to unsuccessful estimation, there will be formed many finished
productions stock for the company. That situation is financial demolition for the
company. But it is also bad financial situation if production is low. If the company
does not produce enough goods, sales will not come true. For that reason it is high
unit cost for each production.
65
Demand forecasting is not selling target; when we determine selling target we can
be optimistic. For instance, a company can aim %20 increase for its selling’s. But
when estimating, it is estimated that what should be demand under the hard truth. It
does not %20 increases of production instruments and materials, just leaning on
trade aim. Even if it is advantage to having the collecting knowledge’s via selling
department, this information’s should analyze and should make essential
arrangements. On the other side, demand forecasting should not restrict according
to production capacity. Otherwise it does not obtain information for necessity
development. Forecasting should predict reel selling as much as possible.
There are some different methods and techniques for demand forecasting
realization. It is true that planned forecasting more valuable and reel then intuitive
estimation. As, which method or technique whatever you use, all made demand
forecasting’s have a certain correction and any estimation does not possess % 100
correction. Despite of this reality, all forecasting for the future have a kind of
estimation decisions inside [16].
2.7.2 Demand forecasting principles
In demand forecasting possibly the most being affected and being utilize unite is
production planning and control. For this reason, officers who work in production
planning and control, more or less should have some basic principles and methods
concerning issue.
In demand forecasting there are some important principles can count as below.
1. It should be more suitable for forecasting when we use it on huge amount or
items for product group. It is easier to make forecasting for special product than
whole products or going components. For instance, selling forecasting of total 2.500
units lathe which will be made by a company, money flow can be useful. However, it
is essential to have more product details for main production programme. If the
production of the combination of 12 modules is 100 different turning lathes, the
prediction of 12 modules will be more correct than the prediction of 100 lathes and it
will suffice the requirements of the main production.
2. Short-term forecasting is more benefit. We will not forget 'you are in trouble when
you go away from centre', all studies are made for diminishing duration for product
production.
66
3. Forecasting is always wrong. In spite of being forecasting fault, it is important that
having opinion about this fault. It is possible to calculate potential faults with
mathematical techniques. For example, weekly demand can be 100. However, it can
spread (+)(-) %7 range with leaning on the previous average refracting.
4. Forecasting method should be tested before use. There are some patterns in
forecasting use and it is recommended to use different techniques which have same
history. The technique which was use in the past will be the most probably useful
technique for the future.
5. Forecasting is not as same as certain demand. There is a forecasting tolerance.
The reduction of the predicted production period as possible as it is will make bigger
impact on the real demand of the main production. This is the most wanted thing. If
montage programme leans on customers' orders, there will not mentioned about
loading levels and capacity cost [16].
2.7.3 Forecasting components
For logistic planning and coordination foreseeable amount is needed. Forecasting is
a weekly or monthly amount for each distribution and stock office. Although the
foreseeable amount is a single number, it is a result of six components. This
components are, sub-claim, seasonal factors, trend, periodic factors, promotion and
irregular amounts. If we assume that the sub-claim is the average selling rate, the
other components are the indexes or factors which are multiplied with the sub-rate
for making the negative and positive changes. As a result claim model:
Ft = (Bt x St x T x Ct x Pt) + I (2.1)
Ft = foreseeable amount for t period
Bt = sub-rate for t period
St = seasonal factor for t period
T = trend factor, amount changes for time period
Ct = periodic factor for t period
Pt = promotion factor for t period
I = irregular quantities
Some forecasts could not contain all the factors. But understanding the behavior of
each factor is useful for tracking and combining them appropriately. If we specify the
67
characteristics of each factor; sub-rate is the last part after the extraction of other
components. Taking the average of a long time period is a right way of getting the sub-
rate. Sub-rate is a proper forecasting for the products which don’t have seasonal, trend,
periodic and promotion components.
Seasonal factor generally is the repetitious up-down movement during the behavior of
the claim on an annual base.
Trend, is the general changes during the periodic sales for a long time period, trend can
be negative, positive and neutral. Positive means the increasing sales for a period of
time. This can change few times during the life time of the product. Changes on the
trend is depended on population and its’ consumption style. It is important to know which
factor is more effective on the sales. Although, trend has a lesser effect on short time
logistic appraisals, it should be considered while the forecasts are shaping. As a
difference from other components, trend affects the sub-claim in the consequent
periods. Relation is:
Bt+1 = Bt x T (2.2)
Bt+1 = sub-claim for t+1 period
Bt = sub-claim for t period
T = periodic trend index
Trend index ( bi ) which is bigger than 1.0 shows the rising claim; smaller than 1.0 show
the decreasing claim.
Periodic component defines as the swinging on the claim rate for more than a year
period. This swinging can be as up or down side movements.
Promotion component shows the swinging which is related to the company’s marketing
activities like; advertisements, agreements and promotions. This swinging can
characterize like the rising sales during the promotion and the falling sales after
promotion. Promotions are the agreements which are offered to the customers or to the
agents like; merchants and sales-mans. Because of the big effect especially on the
consumer industries, it is important to track promotion component. It differs from the
other components with the ability of time and magnitude controlling by the companies.
Irregular component covers the non-appraisable and coincidental amounts. It’s not
possible to track this component because of its nature. During the forecasting process,
the object is minimizing the irregular component by tracking it and appraising the other
components [17].
68
3. THE STRUCTURE OF THE TEXTILE AND CLOTHING SECTOR
The clothing sector is both a labor-intensive, low wage industry and a dynamic,
innovative sector, depending on which market segments one focuses upon. In the
high-quality fashion market, the industry is characterized by modern technology,
relatively well-paid workers and designers and a high degree of flexibility. The
competitive advantage of firms in this market segment is related to the ability to
produce designs that capture tastes and preferences, and even better – influence
such tastes and preferences – in addition to cost effectiveness. The core functions
of firms servicing this market segment are largely located in developed countries
and often in limited geographical areas or clusters within these countries. The
Emilia-Romagna district in the so-called Third Italy is one of the most prominent and
prosperous textile and clothing clusters in the world, while Italy is the second largest
exporter of both textiles and clothing when intra-EU trade is included. However, this
market segment has also seen a significant amount of relocation of production and
outsourcing to lower-cost producers, often in geographical proximity to the major
market [18].
The other major market segment is mass production of lower-quality and/or
standard products such as t-shirts, uniforms, white underwear etc. Manufacturers for
this market segment are largely found in developing countries, often in export
processing zones and/or under so-called outward processing agreements with major
importers. They employ mainly female workers – semi-skilled and unskilled – and
outsourcing to household production is quite common in the low end of the market.
In the low to middle priced market, the role of the retailer has become increasingly
prominent in the organization of the supply chain. The retail market has become
more concentrated, leaving more market power to multinational retailers. These
have market power not only in the consumer market, but perhaps more importantly
they have considerable buying power. In addition, high-volume discount chains have
developed their own brands and source their clothing directly from the suppliers,
whether foreign or local. According to Gereffi (2001), retailers accounted for half of
total garment imports in the European Union in the mid-1990s, a trend that probably
has continued during the second half of the 1990s [19].
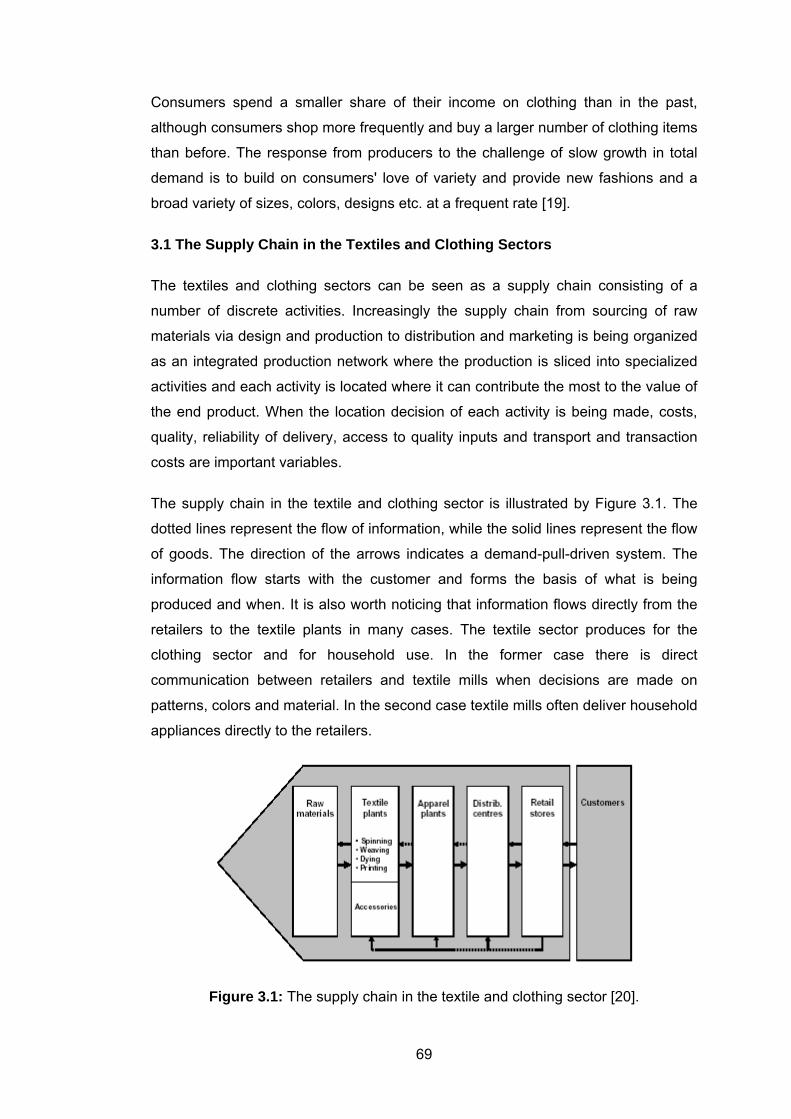
69
Consumers spend a smaller share of their income on clothing than in the past,
although consumers shop more frequently and buy a larger number of clothing items
than before. The response from producers to the challenge of slow growth in total
demand is to build on consumers' love of variety and provide new fashions and a
broad variety of sizes, colors, designs etc. at a frequent rate [19].
3.1 The Supply Chain in the Textiles and Clothing Sectors
The textiles and clothing sectors can be seen as a supply chain consisting of a
number of discrete activities. Increasingly the supply chain from sourcing of raw
materials via design and production to distribution and marketing is being organized
as an integrated production network where the production is sliced into specialized
activities and each activity is located where it can contribute the most to the value of
the end product. When the location decision of each activity is being made, costs,
quality, reliability of delivery, access to quality inputs and transport and transaction
costs are important variables.
The supply chain in the textile and clothing sector is illustrated by Figure 3.1. The
dotted lines represent the flow of information, while the solid lines represent the flow
of goods. The direction of the arrows indicates a demand-pull-driven system. The
information flow starts with the customer and forms the basis of what is being
produced and when. It is also worth noticing that information flows directly from the
retailers to the textile plants in many cases. The textile sector produces for the
clothing sector and for household use. In the former case there is direct
communication between retailers and textile mills when decisions are made on
patterns, colors and material. In the second case textile mills often deliver household
appliances directly to the retailers.
Figure 3.1: The supply chain in the textile and clothing sector [20].
70
At each link in the production chain to the left of the distribution centre in Figure 3.1,
there are usually several companies. In order to make goods, information and
payments flow smoothly, a number of logistics and business services are needed.
Depending on the size and development of the host economy, such services are
provided by the lead firm in the supply chain or independent service providers in the
more advanced countries.
An illustration of how a supply chain operates is as follows: lean retailers in the
United States typically replenish their stores on a weekly basis. Point of sales data
are extracted and analyzed over the weekend and replenishment orders placed with
the manufacturer on Monday morning. The manufacturer is typically required to fill
the order within a week, which implies that the manufacturer will always have to
carry larger inventories of finished goods than the retailer. How much larger
depends on his own lead time and demand volatility. The larger the fluctuations in
demand, and the larger the number of varieties (e.g. style, size, color) the larger the
inventory has to be. On the other hand, the shorter the manufacturer's lead time, the
better the demand forecasts and the larger the market, the less the inventory
needed relative to sales. The size of the market matters, since the variation of
aggregate demand from a large number of consumers are less than the variation
over time of a few consumers. Upon receiving the replenishment order, the
manufacturer will fill it from its inventory and then on the basis of the gap between
remaining inventory and the desired inventory level, will make a production order to
the production plant, of which the manufacturer may have several in different
locations. The retailers may order large quantities of, say, shirts spread over a
number of producers in several low-wage countries. In order to ensure that the shirts
are similar and can sell under the same label, the buyer often buys fabric and
accessories in bulk and provides its clothing suppliers with these inputs. In addition,
buyers often also specify the design and assist the producers in providing the
desired quality [20].
The underlying technological developments of modern supply chain management
are discussed below. Given the demand-pull nature of the supply chain, it is natural
to start the discussion with the retail sector, followed by clothing and then textiles.
3.1.1 The retail sector
Substantial changes in the retail sector have been observed during the past few
decades and modern retailing has been called "lean retailing" in a recent
71
comprehensive study [20]. The technological building blocks of lean retailing are bar
codes and uniform product codes, electronic data interchange (EDI) and data
processing, distribution centers and common standards across firms. The change
most visible to consumers is the expansion of large shopping malls at the outskirts
of the cities at the expense of city centre department stores and boutiques. As
already mentioned, the retail sector has become more concentrated, particularly in
the United States. Concentration implies more buying power for the retailer and thus
increased bargaining power towards suppliers.
The bar code and complementary equipment for reading it are crucial for the retailer
to collect point of sales information in real time. Bar codes were first introduced in
the food industry in the 1970s and became widespread in the clothing sector from
the mid 1980s. The technology allows retailers continuously to monitor which
products sell and which do not – down to the details on size, color and other
characteristics. The technology also allows retailers to keep track of inventories.
Such information is only valuable if it can be used for adjusting the supply of
garments to consumer tastes as the information becomes available. Such
adjustments require more frequent supply of garments in smaller quantities as
opposed to the traditional stocking of the store before the season and clearance
sales at the end of the season. In order for suppliers to be able to provide frequent
supplies and make changes in the product specters at short notice, retailers need to
share point of sales data with a supplier, which requires frequent communication
between retailers and their suppliers. For this purpose, EDI and data processing
programmers’ are necessary. These provide a direct and often automated
information exchange between retailers and suppliers and require that both parties
invest in compatible software. A very crucial technology applied throughout the
textile and clothing supply chain is the laser which is used for reading bar codes and
transmitting the information content to the EDI and data processing equipment.
Efficient and timely information flows are of little use if not complemented by equally
efficient and timely flows of the goods for sale. The emergence of distribution
centers, replacing traditional wholesalers and storage facilities ensures efficient and
timely flows of goods. A distribution centre consists of bays for trucks to unload or
load goods. Incoming goods are packed in standard containers with barcodes that
are scanned as they enter conveyor belts. The information on the bar codes is
matched with information on purchase orders by means of information processing
systems. The goods are then routed to the correct bay for outgoing trucks to the
72
store that has ordered them. Only when the information on the bar code does not
match purchasing orders are containers routed to manned stations. The information
processing system also process financial information and may be linked to
automatic invoicing and thus an equally efficient flow of financial transactions
between buyers and suppliers. Distribution centers are usually smaller in terms of
floor area than traditional wholesale storage buildings, but the distribution centre is
much more capital-intensive and automated.
Finally, the integration of information flows, flows of goods, and payments are only
possible if all the links in the chain use compatible standards. Suppliers are required
to add bar codes that comply with industry standards to garments before they are
shipped. Often they are also required to place the apparel on hangers such that it
can go straight from the truck to the shop floor. Evidently, lean retailing has a
bearing on suppliers and the technology applied in the clothing and textiles sectors.
3.1.2 Clothing
The basic production technology of the apparel industry has not changed much over
the past century, and is characterized by the progressive bundle system. Work is
organized such that each worker is specialized in one or a few operations. The
fabric is first cut and then grouped by parts of the garment, tied into bundles (pre-
assembly) and then sewed together. The individual sewing tasks are organized in a
systematic fashion and specialized sewing machines have been developed for the
individual tasks. A worker receives a bundle of unfinished garments, performs her
single task and places the bundle in a buffer. A buffer of about one day's work has
been common at each operation. It takes about 40 operations to complete a pair of
pants, which implies that there is about 40 days of in-process inventory. For men's
blazers, however, it takes as much as 100 operations. Although a number of
improvements in terms of systematizing the operations and reducing the time at
each individual operation has taken place over time, the basic system has remained
the same. One explanation for this is that technology changes cannot be
implemented in a partial fashion involving only a few operations. This would
unbalance the system and any major technological change therefore needs to
involve the entire system [20].
In the early days of industrial development in Europe and the United States, the
bundles of unfinished garments could either be sewn together in a factory, or
workers took the bundles home to sew them together there, after which they were
73
returned to the shop or factory for finishing. The latter arrangement dominated in the
early days and is still a feature of the apparel industry in developing countries today.
Even though the basic technology and the sequence of operations have not
changed much, new innovations have improved efficiency at each stage of
production and not least, improved coordination between stages and provided a
more seamless interface between them. One major innovation was the automatic
cutting machine introduced in 1969. This machine has made it possible to cut
increasingly thick layers of cloth accurately. Moreover, cutting machines, pattern
layouts and other functions are computer-assisted and in many cases designs can
be transformed to patterns which are directly fed into cutting machines via electronic
networks. These innovations are mainly related to the so-called pre-assembly phase
of production, where technological developments have been more prominent than at
the assembly stage. Preassembly is also the most capital intensive stage in the
clothing sector and where quality and precision is the most important. If, for example
the fabric is not cut precisely, the quality of the finished garment can be seriously
damaged. Pre-assembly is therefore the stage in the production chain that is most
likely to be done in-house by major clothing firms [20].
However modern, the assembly stage of the clothing sector is still labor-intensive
and it is the stage that is most likely to be farmed out to lower-cost firms. Table 1
below shows the cost structure of the clothing sector, given as percentages of gross
value of the sector's production. The countries included in the table constitute the
major exporters or importers under the ATC for which data are available.
The table should be interpreted with caution since everything that is not wages and
salaries is registered as capital income in the GTAP database. The income of self-
employed persons, for example, is not included in wage income and consequently
appears as capital income in the data. Nevertheless, the table indicates the
unskilled labor-intensity of the clothing sector.
India and China have very low import shares, reflecting the fact that most of the
supply chain from textiles to ready-made clothing is located within the country. India
has a number of restrictions and regulations in the cotton industry throughout the
supply chain from farmers producing cotton to final garments. In Vietnam, a recent,
but fast-growing entrant to the world market in textile and clothing, the value-added
share is very low and import content high. The Vietnamese structure illustrates the
ease of entry into the clothing sector for poor countries that lack an industrial base,
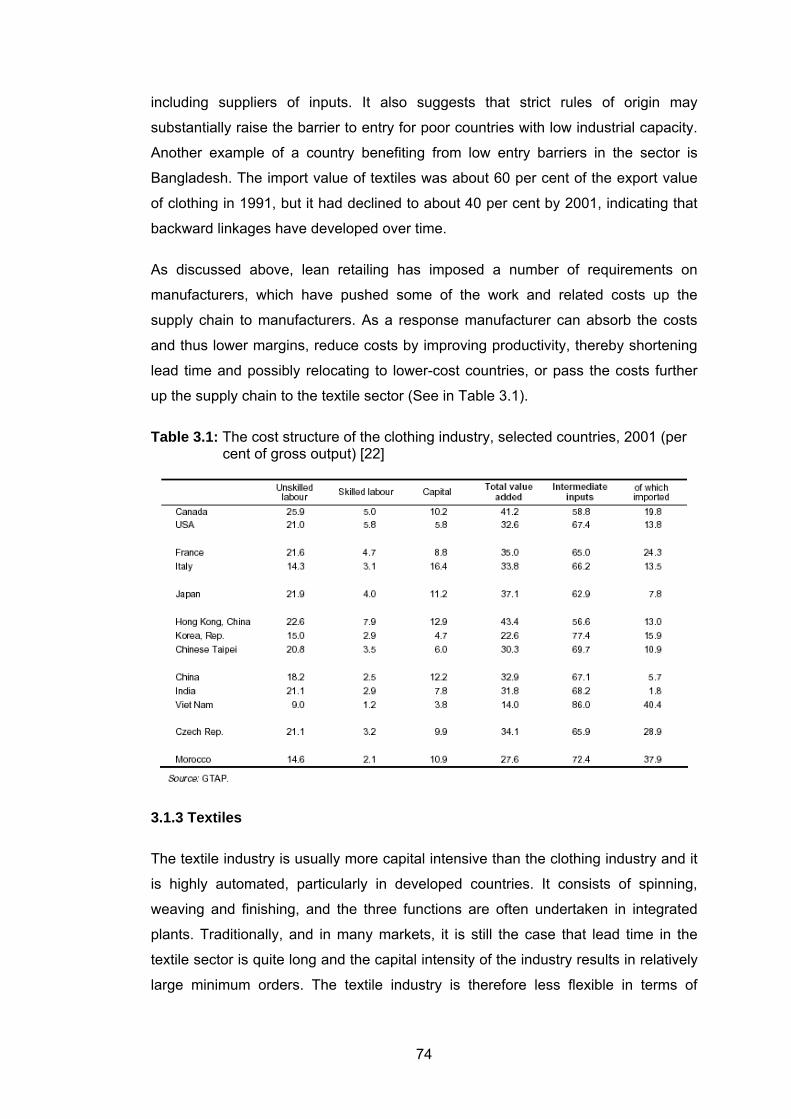
74
including suppliers of inputs. It also suggests that strict rules of origin may
substantially raise the barrier to entry for poor countries with low industrial capacity.
Another example of a country benefiting from low entry barriers in the sector is
Bangladesh. The import value of textiles was about 60 per cent of the export value
of clothing in 1991, but it had declined to about 40 per cent by 2001, indicating that
backward linkages have developed over time.
As discussed above, lean retailing has imposed a number of requirements on
manufacturers, which have pushed some of the work and related costs up the
supply chain to manufacturers. As a response manufacturer can absorb the costs
and thus lower margins, reduce costs by improving productivity, thereby shortening
lead time and possibly relocating to lower-cost countries, or pass the costs further
up the supply chain to the textile sector (See in Table 3.1).
Table 3.1: The cost structure of the clothing industry, selected countries, 2001 (per cent of gross output) [22]
3.1.3 Textiles
The textile industry is usually more capital intensive than the clothing industry and it
is highly automated, particularly in developed countries. It consists of spinning,
weaving and finishing, and the three functions are often undertaken in integrated
plants. Traditionally, and in many markets, it is still the case that lead time in the
textile sector is quite long and the capital intensity of the industry results in relatively
large minimum orders. The textile industry is therefore less flexible in terms of
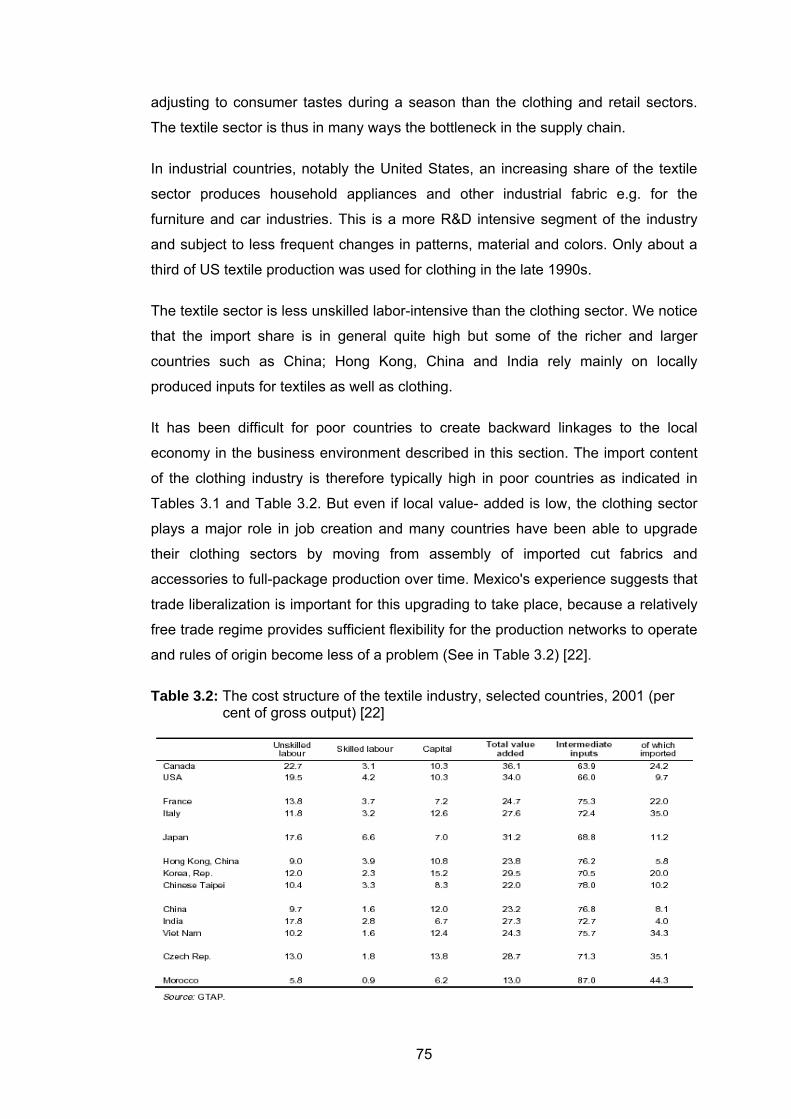
75
adjusting to consumer tastes during a season than the clothing and retail sectors.
The textile sector is thus in many ways the bottleneck in the supply chain.
In industrial countries, notably the United States, an increasing share of the textile
sector produces household appliances and other industrial fabric e.g. for the
furniture and car industries. This is a more R&D intensive segment of the industry
and subject to less frequent changes in patterns, material and colors. Only about a
third of US textile production was used for clothing in the late 1990s.
The textile sector is less unskilled labor-intensive than the clothing sector. We notice
that the import share is in general quite high but some of the richer and larger
countries such as China; Hong Kong, China and India rely mainly on locally
produced inputs for textiles as well as clothing.
It has been difficult for poor countries to create backward linkages to the local
economy in the business environment described in this section. The import content
of the clothing industry is therefore typically high in poor countries as indicated in
Tables 3.1 and Table 3.2. But even if local value- added is low, the clothing sector
plays a major role in job creation and many countries have been able to upgrade
their clothing sectors by moving from assembly of imported cut fabrics and
accessories to full-package production over time. Mexico's experience suggests that
trade liberalization is important for this upgrading to take place, because a relatively
free trade regime provides sufficient flexibility for the production networks to operate
and rules of origin become less of a problem (See in Table 3.2) [22].
Table 3.2: The cost structure of the textile industry, selected countries, 2001 (per cent of gross output) [22]
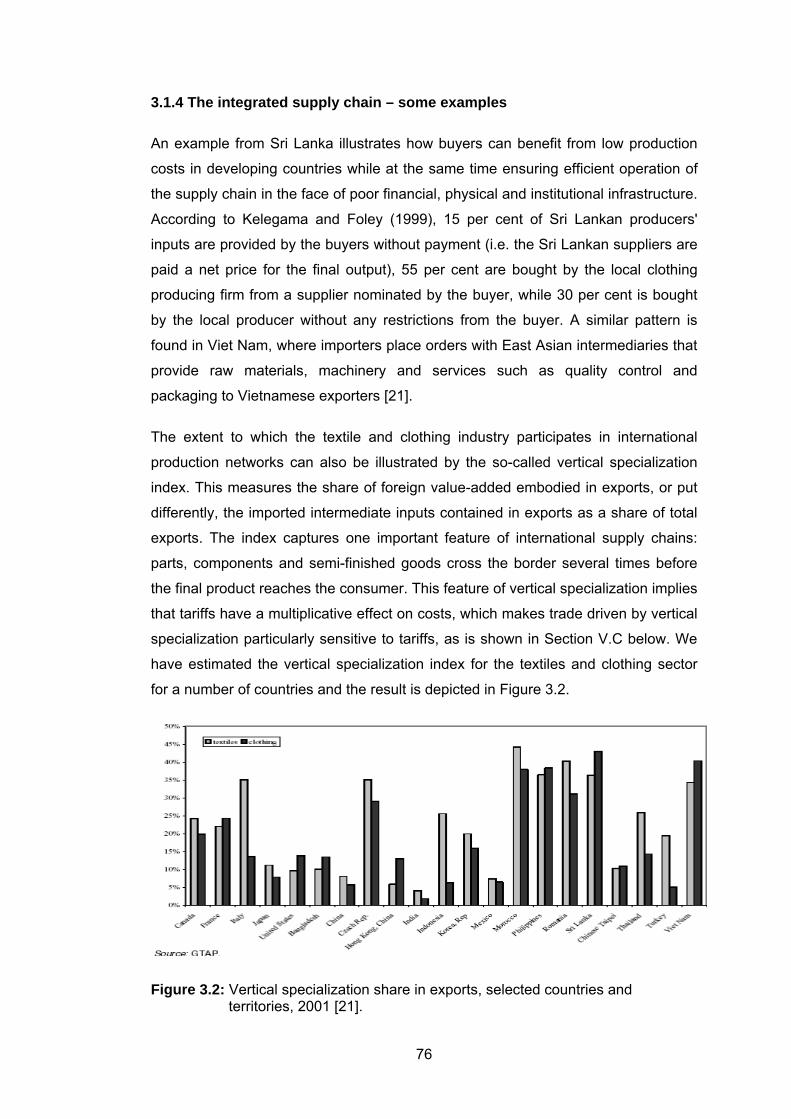
76
3.1.4 The integrated supply chain – some examples
An example from Sri Lanka illustrates how buyers can benefit from low production
costs in developing countries while at the same time ensuring efficient operation of
the supply chain in the face of poor financial, physical and institutional infrastructure.
According to Kelegama and Foley (1999), 15 per cent of Sri Lankan producers'
inputs are provided by the buyers without payment (i.e. the Sri Lankan suppliers are
paid a net price for the final output), 55 per cent are bought by the local clothing
producing firm from a supplier nominated by the buyer, while 30 per cent is bought
by the local producer without any restrictions from the buyer. A similar pattern is
found in Viet Nam, where importers place orders with East Asian intermediaries that
provide raw materials, machinery and services such as quality control and
packaging to Vietnamese exporters [21].
The extent to which the textile and clothing industry participates in international
production networks can also be illustrated by the so-called vertical specialization
index. This measures the share of foreign value-added embodied in exports, or put
differently, the imported intermediate inputs contained in exports as a share of total
exports. The index captures one important feature of international supply chains:
parts, components and semi-finished goods cross the border several times before
the final product reaches the consumer. This feature of vertical specialization implies
that tariffs have a multiplicative effect on costs, which makes trade driven by vertical
specialization particularly sensitive to tariffs, as is shown in Section V.C below. We
have estimated the vertical specialization index for the textiles and clothing sector
for a number of countries and the result is depicted in Figure 3.2.
Figure 3.2: Vertical specialization share in exports, selected countries and territories, 2001 [21].
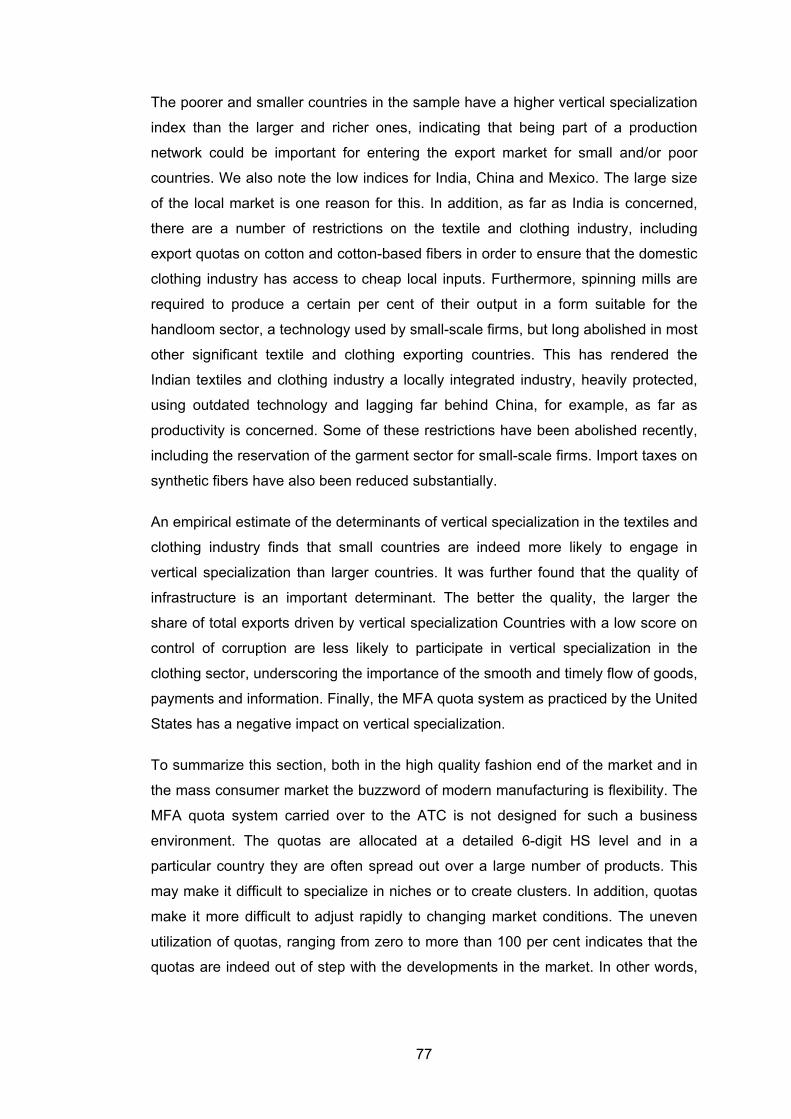
77
The poorer and smaller countries in the sample have a higher vertical specialization
index than the larger and richer ones, indicating that being part of a production
network could be important for entering the export market for small and/or poor
countries. We also note the low indices for India, China and Mexico. The large size
of the local market is one reason for this. In addition, as far as India is concerned,
there are a number of restrictions on the textile and clothing industry, including
export quotas on cotton and cotton-based fibers in order to ensure that the domestic
clothing industry has access to cheap local inputs. Furthermore, spinning mills are
required to produce a certain per cent of their output in a form suitable for the
handloom sector, a technology used by small-scale firms, but long abolished in most
other significant textile and clothing exporting countries. This has rendered the
Indian textiles and clothing industry a locally integrated industry, heavily protected,
using outdated technology and lagging far behind China, for example, as far as
productivity is concerned. Some of these restrictions have been abolished recently,
including the reservation of the garment sector for small-scale firms. Import taxes on
synthetic fibers have also been reduced substantially.
An empirical estimate of the determinants of vertical specialization in the textiles and
clothing industry finds that small countries are indeed more likely to engage in
vertical specialization than larger countries. It was further found that the quality of
infrastructure is an important determinant. The better the quality, the larger the
share of total exports driven by vertical specialization Countries with a low score on
control of corruption are less likely to participate in vertical specialization in the
clothing sector, underscoring the importance of the smooth and timely flow of goods,
payments and information. Finally, the MFA quota system as practiced by the United
States has a negative impact on vertical specialization.
To summarize this section, both in the high quality fashion end of the market and in
the mass consumer market the buzzword of modern manufacturing is flexibility. The
MFA quota system carried over to the ATC is not designed for such a business
environment. The quotas are allocated at a detailed 6-digit HS level and in a
particular country they are often spread out over a large number of products. This
may make it difficult to specialize in niches or to create clusters. In addition, quotas
make it more difficult to adjust rapidly to changing market conditions. The uneven
utilization of quotas, ranging from zero to more than 100 per cent indicates that the
quotas are indeed out of step with the developments in the market. In other words,
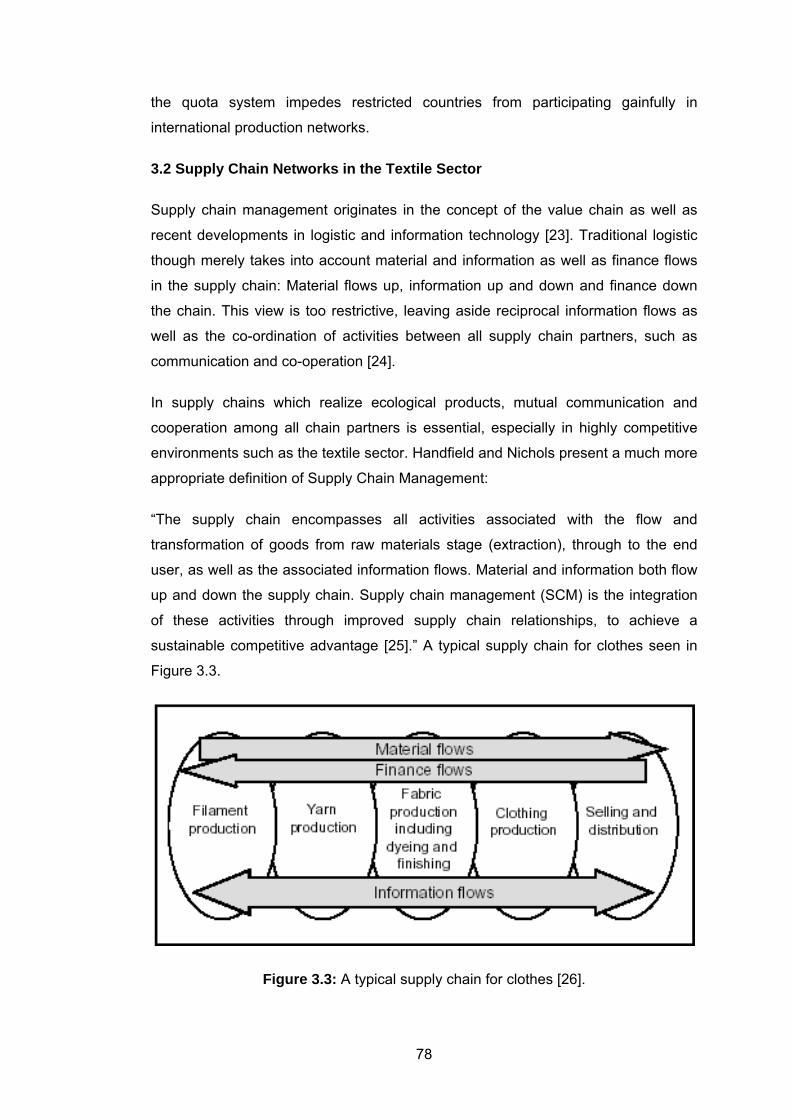
78
the quota system impedes restricted countries from participating gainfully in
international production networks.
3.2 Supply Chain Networks in the Textile Sector
Supply chain management originates in the concept of the value chain as well as
recent developments in logistic and information technology [23]. Traditional logistic
though merely takes into account material and information as well as finance flows
in the supply chain: Material flows up, information up and down and finance down
the chain. This view is too restrictive, leaving aside reciprocal information flows as
well as the co-ordination of activities between all supply chain partners, such as
communication and co-operation [24].
In supply chains which realize ecological products, mutual communication and
cooperation among all chain partners is essential, especially in highly competitive
environments such as the textile sector. Handfield and Nichols present a much more
appropriate definition of Supply Chain Management:
“The supply chain encompasses all activities associated with the flow and
transformation of goods from raw materials stage (extraction), through to the end
user, as well as the associated information flows. Material and information both flow
up and down the supply chain. Supply chain management (SCM) is the integration
of these activities through improved supply chain relationships, to achieve a
sustainable competitive advantage [25].” A typical supply chain for clothes seen in
Figure 3.3.
Figure 3.3: A typical supply chain for clothes [26].
79
The following illustration gives an idea of the multiple relationships in a supply chain
for ecological textiles with the trader as supply chain coordinator (See Figure 3.4).
Figure 3.4: Supply chain relationships in the textile sector [26].
The underlying structure resembles a network rather than a chain. The term supply
chain network stresses the interactions between all network partners, not only those
between neighboring chain partners.
The supply chain network can be divided into direct value-added activities (material
and finance flows between traditional chain partners) and indirect value-added
activities (communication and co-operation in the network which imply information
flows and co-ordination activities between chain partners that do not usually
communicate directly such as the trader and the yarn producer.) The indirect value
added activities do not add value but are necessary to support and improve the
value-added process in the supply chain network.
This work will focus on the communication and co-operation aspect, i.e. the indirect
value-added activities in the supply chain network.
3.2.1 The agency theory as an analytical framework for supply chain relations
How can the relationships between different actors in the supply chain be analyzed
in an institutional context?
The New Institutional Economics provide an analytical framework explaining
structure, behavioral implications, change and efficiency of economic institutions.
80
The agency theory as one of the three pillars in institutional economics – Property
Rights, Transaction Costs, and Agency – focuses on the contractual arrangements
of institutions [27-29].
Jensen/Meckling “defines an agency relationship as a contract under which one or
more persons (the principal(s)) engage another person (the agent) to perform some
service on their behalf which involves delegating some decision making authority to
the agent. If both parties to the relationship are utility maximizers, there is a good
reason to believe that the agent will not always act in the best interests of the
principal” [29]. Institutions or organizations as the object of research are defined as
“legal fictions which serve as a nexus for a set of contracting relationships among
individuals” [29]. As the supply chain network is based on multiple contracts, the
agency theory provides an appropriate analytical framework.
The actors in Agency Theory (principal and agent) are individuals characterized as
utility maximizes with limited rationality and opportunistic behavior. The principal
asks the agent to provide a service for him because he considers the agent’s know
how to be superior to his own. The agent is paid for his service by the principal. The
main agency problems occurring in this context are interest dissonance and
information asymmetries in favor of the agent.
In the textile sector for example, the trader (principal) asks the clothing producer
(agent) to produce ecologically optimized clothes for him because he considers the
clothing producer to be better qualified and specialized in this task. The intention of
the agent is to sell the “eco-product” at the highest price possible without necessarily
respecting the high ecological standards defined by the principal. The principal
though demands a product that is ecologically optimized to a certain standard, at a
reasonable price.
These intentions lead to interest dissonance between the two partners. The agent
being a specialist in his domain is better informed about his capabilities and
intentions than the principal. This leads to two types of information asymmetries
[27].
- Hidden information means that before conclusion of the contract, the agent
disposes of information to which the principal has no access, at least not at zero
costs.
81
- Hidden action refers to the agent’s actions (determined by his capabilities and
intentions) after conclusion of the contract up to fulfillment which diverges from the
principal’s aims.
These agency problems cause costs. Jensen/Meckling identifies several costs
which occur in an agency relationship, called agency costs [29].
These are the sum of
- Monitoring expenditures by the principal: Incentives and control mechanisms to
limit harming activities carried out by the agent
- Bonding expenditures by the agent: Guarantee of the agent that he will not take
actions diverging from the principal’s interests
- The residual loss: Quantified divergence between the agent’s decision and the
decision which would maximize the welfare of the principal.
The challenge of agency theory consists in defining information, control and
incentive mechanisms susceptible to maximize the principal’s interests.
The following reflections will focus on positive agency theory by Jensen/Meckling.
This qualitative-empirical approach is more descriptive and less precise on a formal
level, but closer to reality than a quantitative-empirical analysis.
3.2.2 Agency relationships in supply chain networks
The multiple relationships between supply chain partners visualized in Figure 3.5
rely on explicit and implicit contracts which form the essence for any organization,
both on the internal and external level: “Since the specification of rights is generally
effected through contracting (implicit as well as explicit), individual behavior in
organizations [...] will depend upon the nature of these contracts” [29].
In traditional agency theory, the actors are individuals and not firms [29]. Extending
the agency theory to the supply chain context, the firm as an institution is replaced
by the supply chain; principal and agent are no more individuals but firms:
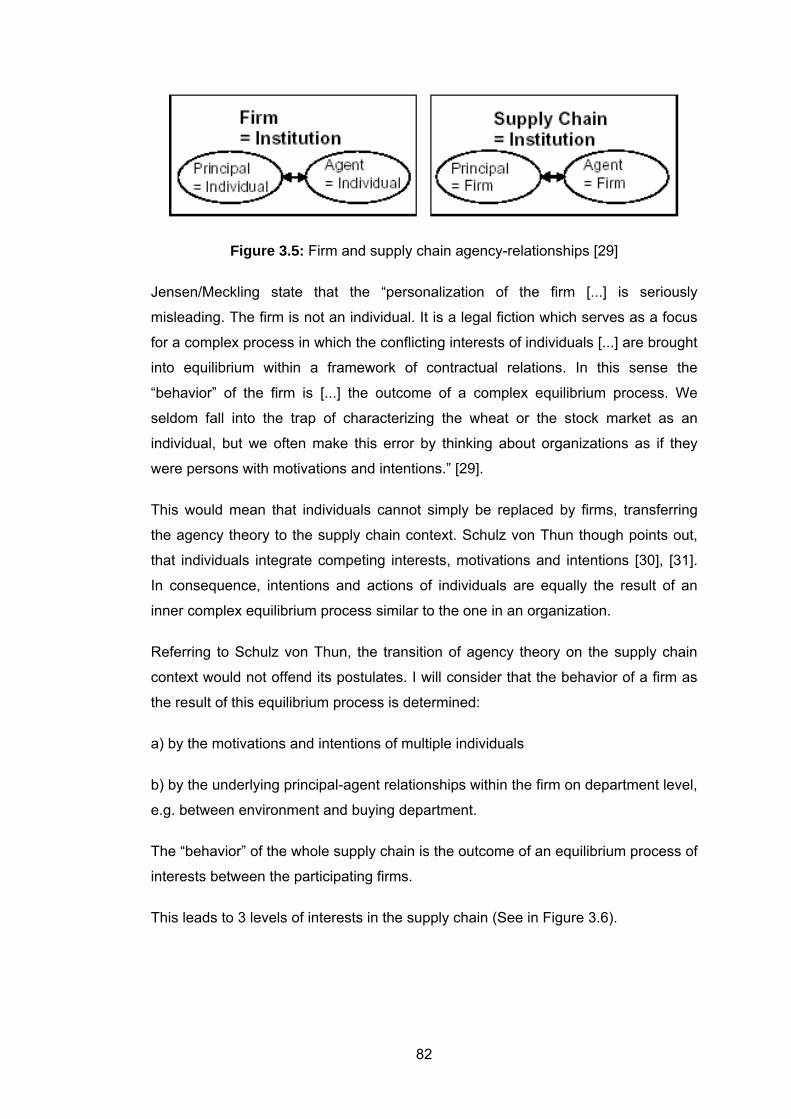
82
Figure 3.5: Firm and supply chain agency-relationships [29]
Jensen/Meckling state that the “personalization of the firm [...] is seriously
misleading. The firm is not an individual. It is a legal fiction which serves as a focus
for a complex process in which the conflicting interests of individuals [...] are brought
into equilibrium within a framework of contractual relations. In this sense the
“behavior” of the firm is [...] the outcome of a complex equilibrium process. We
seldom fall into the trap of characterizing the wheat or the stock market as an
individual, but we often make this error by thinking about organizations as if they
were persons with motivations and intentions.” [29].
This would mean that individuals cannot simply be replaced by firms, transferring
the agency theory to the supply chain context. Schulz von Thun though points out,
that individuals integrate competing interests, motivations and intentions [30], [31].
In consequence, intentions and actions of individuals are equally the result of an
inner complex equilibrium process similar to the one in an organization.
Referring to Schulz von Thun, the transition of agency theory on the supply chain
context would not offend its postulates. I will consider that the behavior of a firm as
the result of this equilibrium process is determined:
a) by the motivations and intentions of multiple individuals
b) by the underlying principal-agent relationships within the firm on department level,
e.g. between environment and buying department.
The “behavior” of the whole supply chain is the outcome of an equilibrium process of
interests between the participating firms.
This leads to 3 levels of interests in the supply chain (See in Figure 3.6).
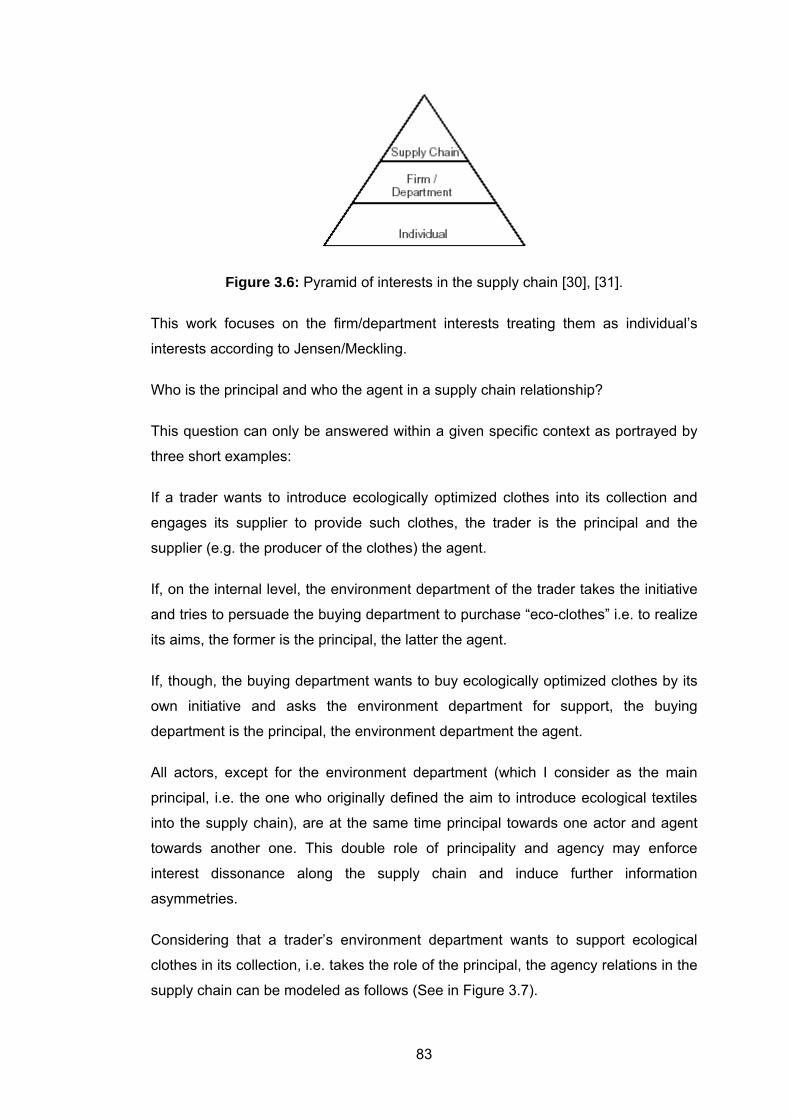
83
Figure 3.6: Pyramid of interests in the supply chain [30], [31].
This work focuses on the firm/department interests treating them as individual’s
interests according to Jensen/Meckling.
Who is the principal and who the agent in a supply chain relationship?
This question can only be answered within a given specific context as portrayed by
three short examples:
If a trader wants to introduce ecologically optimized clothes into its collection and
engages its supplier to provide such clothes, the trader is the principal and the
supplier (e.g. the producer of the clothes) the agent.
If, on the internal level, the environment department of the trader takes the initiative
and tries to persuade the buying department to purchase “eco-clothes” i.e. to realize
its aims, the former is the principal, the latter the agent.
If, though, the buying department wants to buy ecologically optimized clothes by its
own initiative and asks the environment department for support, the buying
department is the principal, the environment department the agent.
All actors, except for the environment department (which I consider as the main
principal, i.e. the one who originally defined the aim to introduce ecological textiles
into the supply chain), are at the same time principal towards one actor and agent
towards another one. This double role of principality and agency may enforce
interest dissonance along the supply chain and induce further information
asymmetries.
Considering that a trader’s environment department wants to support ecological
clothes in its collection, i.e. takes the role of the principal, the agency relations in the
supply chain can be modeled as follows (See in Figure 3.7).
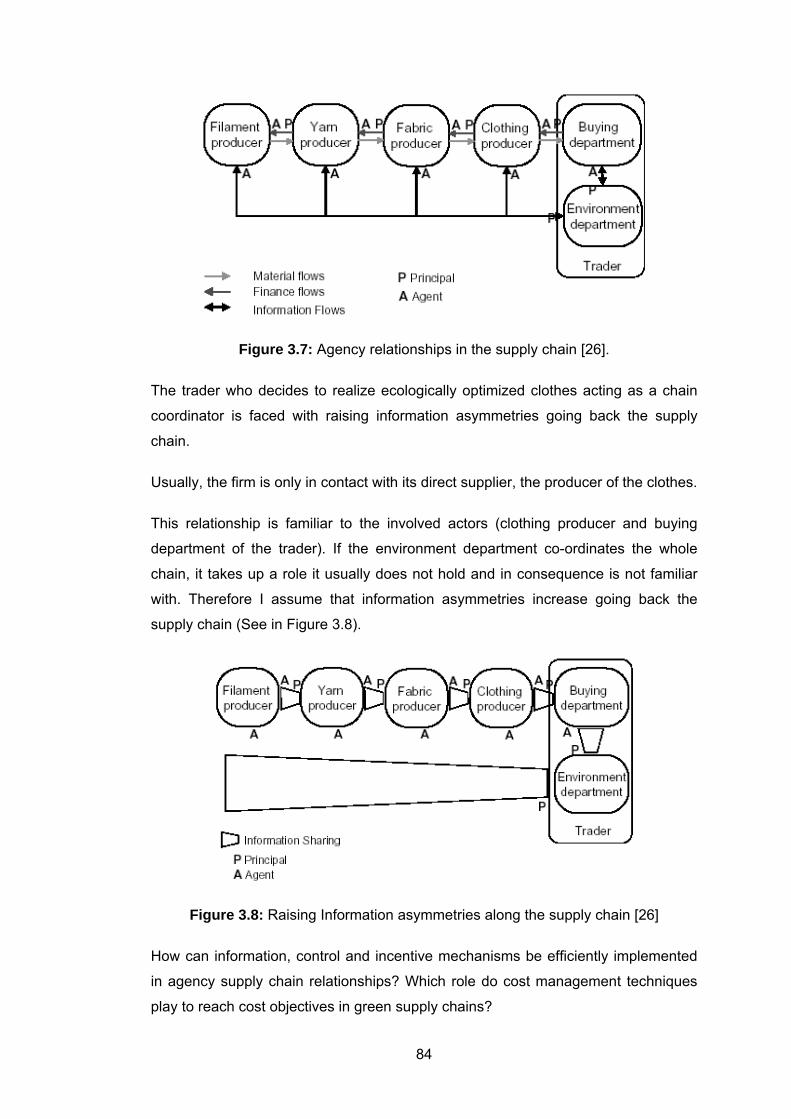
84
Figure 3.7: Agency relationships in the supply chain [26].
The trader who decides to realize ecologically optimized clothes acting as a chain
coordinator is faced with raising information asymmetries going back the supply
chain.
Usually, the firm is only in contact with its direct supplier, the producer of the clothes.
This relationship is familiar to the involved actors (clothing producer and buying
department of the trader). If the environment department co-ordinates the whole
chain, it takes up a role it usually does not hold and in consequence is not familiar
with. Therefore I assume that information asymmetries increase going back the
supply chain (See in Figure 3.8).
Figure 3.8: Raising Information asymmetries along the supply chain [26]
How can information, control and incentive mechanisms be efficiently implemented
in agency supply chain relationships? Which role do cost management techniques
play to reach cost objectives in green supply chains?

85
3.2.3 Target costing in agency supply chain relationships
Supply Chain Costing aims at providing cost management instruments for the whole
supply chain which serve as a basis for decision makers to actively influence and
manage costs. In this view an important aspect is left aside: Costs are not only
information instruments but perception patterns susceptible to induce specific
actions of the involved actors [26], [35].
The following paragraphs focus on target costing in the supply chain as a control
instrument that increases transaction efficiency by influencing actors’ behavior [35].
Target costing is carried out in several steps:
1. Definition of the target selling price based on the market conditions.
2. Deducting the target profit margin from the target selling price to obtain the
allowable target costs.
3. Splitting of the allowable target costs if these are not equal to the current ones.
4. Different mechanisms are applied to approach target and current costs [32], [33].
To assure the competitiveness of ecological textiles in the mass-market, a trader
may realize a price equal or similar to the conventional one using target costing. The
suppliers, i.e. the agents from the trader’s point of view, are the partners competent
in reducing production costs, the technical know-how being on their side. The
mechanism of fixing target costs to the suppliers can be illustrated as follows:
Market target price (market conditions)
- target profit margin
- internal surcharges
= Supplier’s target price
This approach is illustrated in the following example:
The environment department of a trader as the main principal in the supply chain
makes use of the target costing mechanism to solve the problem of increased prices
for eco-textiles. The higher costs of the end product, caused by more expensive
production costs– for example for organic cotton and yarn [34] – a surcharge
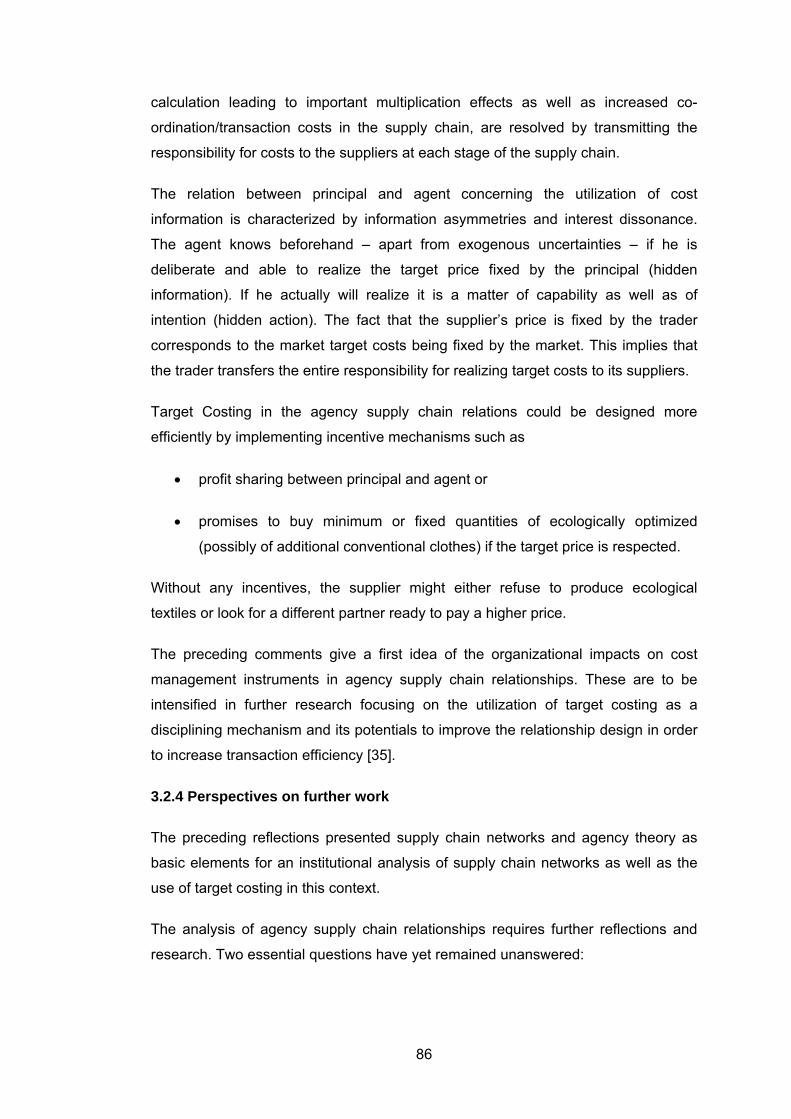
86
calculation leading to important multiplication effects as well as increased co-
ordination/transaction costs in the supply chain, are resolved by transmitting the
responsibility for costs to the suppliers at each stage of the supply chain.
The relation between principal and agent concerning the utilization of cost
information is characterized by information asymmetries and interest dissonance.
The agent knows beforehand – apart from exogenous uncertainties – if he is
deliberate and able to realize the target price fixed by the principal (hidden
information). If he actually will realize it is a matter of capability as well as of
intention (hidden action). The fact that the supplier’s price is fixed by the trader
corresponds to the market target costs being fixed by the market. This implies that
the trader transfers the entire responsibility for realizing target costs to its suppliers.
Target Costing in the agency supply chain relations could be designed more
efficiently by implementing incentive mechanisms such as
• profit sharing between principal and agent or
• promises to buy minimum or fixed quantities of ecologically optimized
(possibly of additional conventional clothes) if the target price is respected.
Without any incentives, the supplier might either refuse to produce ecological
textiles or look for a different partner ready to pay a higher price.
The preceding comments give a first idea of the organizational impacts on cost
management instruments in agency supply chain relationships. These are to be
intensified in further research focusing on the utilization of target costing as a
disciplining mechanism and its potentials to improve the relationship design in order
to increase transaction efficiency [35].
3.2.4 Perspectives on further work
The preceding reflections presented supply chain networks and agency theory as
basic elements for an institutional analysis of supply chain networks as well as the
use of target costing in this context.
The analysis of agency supply chain relationships requires further reflections and
research. Two essential questions have yet remained unanswered:
87
- Are there any differences other than the transition of roles from individual to firm
and from firm to supply chain in the analysis of agency supply chain relationships?
- Is it sufficient to focus on the firm (and department) – supply chain interests or is
there a necessity for an integrated analysis taking into account the different levels of
interest, as well as their complex interactions?
The further analysis of Target Costing in agency supply chain relationships should
focus on three questions:
- How can a target costs relationship between a firm and its supplier be
characterized?
- What are appropriate control and incentive mechanisms for the principal to assert
target costs?
- How do the actors use target costing and how can its utilization be optimized and designed applying agency theory?
Different criteria as well as influencing parameters on alternative possibilities are to
be identified to provide an analytical framework allowing to evaluate alternative
institutional designs and their implications to support the principal’s decision
process.
The empirical work which has merely focused on the principal’s behavior so far, is to
be extended on an analysis of the agent’s intentions and capabilities to achieve valid
empirical results about the agency relationship.
The combined theoretical – qualitative-empirical approach aims at opening design
options for an active supply chain costing at the example of target costing that takes
into account the institutional impacts influencing supply chain relationships [36].
3.3 Some preliminary remarks on the textile industry and the cases analyzed
The textile industry is a valuable example of integrated chain management for
various reasons. Even though the political or societal levels are included in the
description of each case study, it is important to highlight some issues as a
background for all cases. The textile industry is a global one. Fibers might be
produced in one country, spun to yield yarns in the second, woven to fabrics in the
third and sewn to clothing in yet another one before being sold somewhere else [37].
Often, this causes great environmental and social problems [38]. From this, the
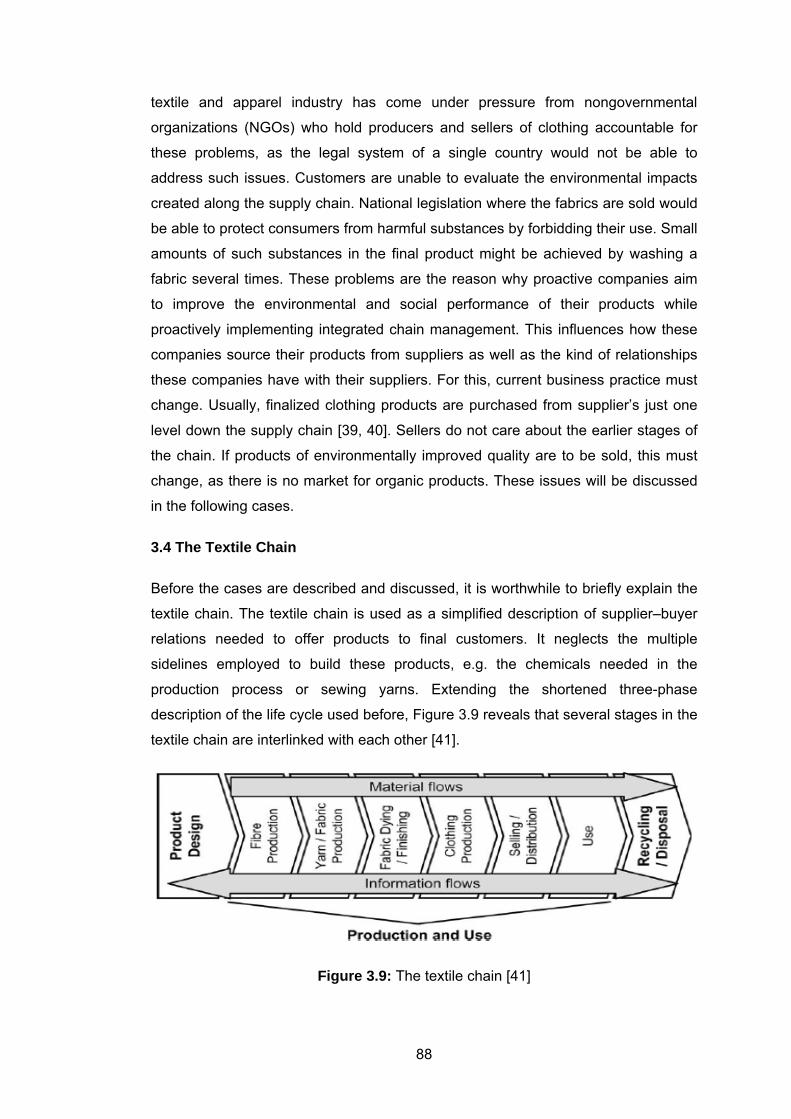
88
textile and apparel industry has come under pressure from nongovernmental
organizations (NGOs) who hold producers and sellers of clothing accountable for
these problems, as the legal system of a single country would not be able to
address such issues. Customers are unable to evaluate the environmental impacts
created along the supply chain. National legislation where the fabrics are sold would
be able to protect consumers from harmful substances by forbidding their use. Small
amounts of such substances in the final product might be achieved by washing a
fabric several times. These problems are the reason why proactive companies aim
to improve the environmental and social performance of their products while
proactively implementing integrated chain management. This influences how these
companies source their products from suppliers as well as the kind of relationships
these companies have with their suppliers. For this, current business practice must
change. Usually, finalized clothing products are purchased from supplier’s just one
level down the supply chain [39, 40]. Sellers do not care about the earlier stages of
the chain. If products of environmentally improved quality are to be sold, this must
change, as there is no market for organic products. These issues will be discussed
in the following cases.
3.4 The Textile Chain
Before the cases are described and discussed, it is worthwhile to briefly explain the
textile chain. The textile chain is used as a simplified description of supplier–buyer
relations needed to offer products to final customers. It neglects the multiple
sidelines employed to build these products, e.g. the chemicals needed in the
production process or sewing yarns. Extending the shortened three-phase
description of the life cycle used before, Figure 3.9 reveals that several stages in the
textile chain are interlinked with each other [41].
Figure 3.9: The textile chain [41]
89
As depicted, the production and use phase have been extended here to a total of six
stages, which is helpful in gaining a better understanding of the processes involved.
In the later analysis, only the three stages used for the conceptualization of
integrated chain management will be built upon. Material usually flows in one
direction, and excluding minor quantities for testing materials and designs, starts
with fiber production. Information is exchanged among all firms in the chain,
assuming co-operative interaction by companies along the supply chain. The
recycling and disposal phase is also very much simplified, as it might involve returns
to previous stages. Here, material can be reused, but a wider discussion of this
extends beyond the scope of this section.
Brief explanations for the activities carried out at each step of the textile chain are
given. Reference is made to the cotton supply chain as an example of the most-
used natural fiber for clothing, and to polyester as the most-used synthetic fiber for
clothing. Some observable environmental problems at the single production stages
are highlighted to address the need for greening these supply chains. For details on
the environmental problems in cotton production, Myers and Stolton offer a detailed
discussion, while those in polyester production are discussed by Schmidt [41].
3.4.1 Product design
Product design is usually done by focal companies in the supply chain. Sometimes
they integrate to either side of the supply chain, i.e. they perform some stages of
production or distribute and sell the apparel they buy from suppliers, which produce
it to their pegged requirements. Hence, these companies are often the target of
pressure from NGOs, as they hold the link to the customer and have some control
over the supply chain (as has already been discussed).
3.4.2 Fiber production
Cotton is a traditional crop grown by farmers within the cotton belt. Vast amounts of
water and pesticides, especially insecticides, are applied during conventional cotton
farming. As the application of the latter is forbidden in organic cotton farming, extra
(manual) work is needed to protect the plants from insects and weeds. Furthermore,
irrigation has led to water shortages in various regions of the world as can be seen
most dramatically in the drying out of the Aral Sea in Uzbekistan.
Polyester is a man-made fiber, produced from limited natural stocks of crude oil. The
processing of crude oil applies to all product groups, so it will not be taken into
90
further account. The raw material is polymerized and cleaned, creating polyester
chips. For the production of polyester chips, heavy metal catalysts (mainly antimony
trioxide) are used, which cause problems in treating reaction residues and
wastewater. An improved non-toxic, titanium dioxide-based catalyst that yields a
higher output rate is available, but is so far rarely used [42].
3.4.3 Yarn and fabric production
After the cotton is harvested, the yarn (one-dimensional) is produced by spinning the
cotton fibers. Weaving or knitting the yarn leads to the creation of fabrics (two-
dimensional). During these manufacturing steps, a number of often environmentally
harmful additives are applied to allow easier production. Furthermore, huge amounts
of heavily polluted wastewater as well as dust and noise are side effects of yarn and
textile production.
Within polyester production, filaments (one-dimensional) are produced by melting
the polyester chips and forcing it through spinneret holes. The extruded filaments
are collected into thread forms. Next, they are stretched and drawn to yield polyester
yarns. Weaving or knitting the yarn leads to the creation of fabrics (two-
dimensional). As in cotton production, these manufacturing steps include the use of
a number of environmentally harmful additives to allow for an easier production.
Furthermore, organic solvents and/or polluted wastewater as well as dust and noise
are side effects of yarn and textile production.
3.4.4 Fabric dyeing and finishing
Dyeing and finishing of both cotton and polyester textile fabrics include processes
that specify color and improve the wearing properties of the fabric or modify its look
or feel. The environmental problems of these steps are similar to those in yarn and
fabric production. To green these processes, more expensive colors and additives
are used to avoid these problems during production and dyeing and finishing of the
yarn and fabric. Additional storage and handling processes are required to separate
the green products from ‘‘regular’’ material.
3.4.5 Clothing production
The next step is manufacturing the apparel itself. The finished fabrics are combined
with other materials such as zippers or buttons. While this step creates only a limited
environmental burden, the work is regularly carried out in second or third world
91
countries where the workers, mainly women, work under enormous pressure and
humiliating labor conditions. Even though these social problems are very important
and need to be addressed by the textile industry, they are not the subject of further
discussion within the paper.
3.4.6 Selling and distribution
Apart from transport, only limited environmental problems occur during this phase.
Selling and distribution can be carried out by a single company or within a
distribution system (wholesalers, retailers) of varying depth. As mentioned before,
this stage of the production process is often closely linked to product design.
3.4.7 Recycling and disposal
Product take-back systems and recycling play an important role for the overall
environmental profile of apparel. The main environmental impacts of the disposal
phase are the demand for landfill space, the formation of emissions as a
consequence of incineration or deposition, and the environmental and
developmental impacts of trading used clothes. Of all the used textiles gathered
separately, only one-half are reused (e.g. in second hand), since the collected
products are often soiled or torn. These goods, mainly clothes, are either sold on the
German market or to third world countries. Textiles, for which there is no possibility
of reuse, may be used further in lower quality products (e.g. cleaning rags). Textiles,
for which there is no possibility of reuse, can be recycled on the material level if they
consist of homogenous or separable fiber [43], [44].
3.5 The Clothing Chain
3.5.1 The clothing supply chain and its weak points
The supply chain of the clothing sector has very distinctive processes. Different
supply methods, push and pull logistics as well as the non replenishment
approaches especially for the fast fashion sector are affecting processes in the
supply chain. In addition, the depth and range of assortments such as different
sizes, colors, and cuts of a collection requires very efficient and optimized logistics.
Furthermore time efficiency is one of the key factors for this industry to provide a
competitive advantage.
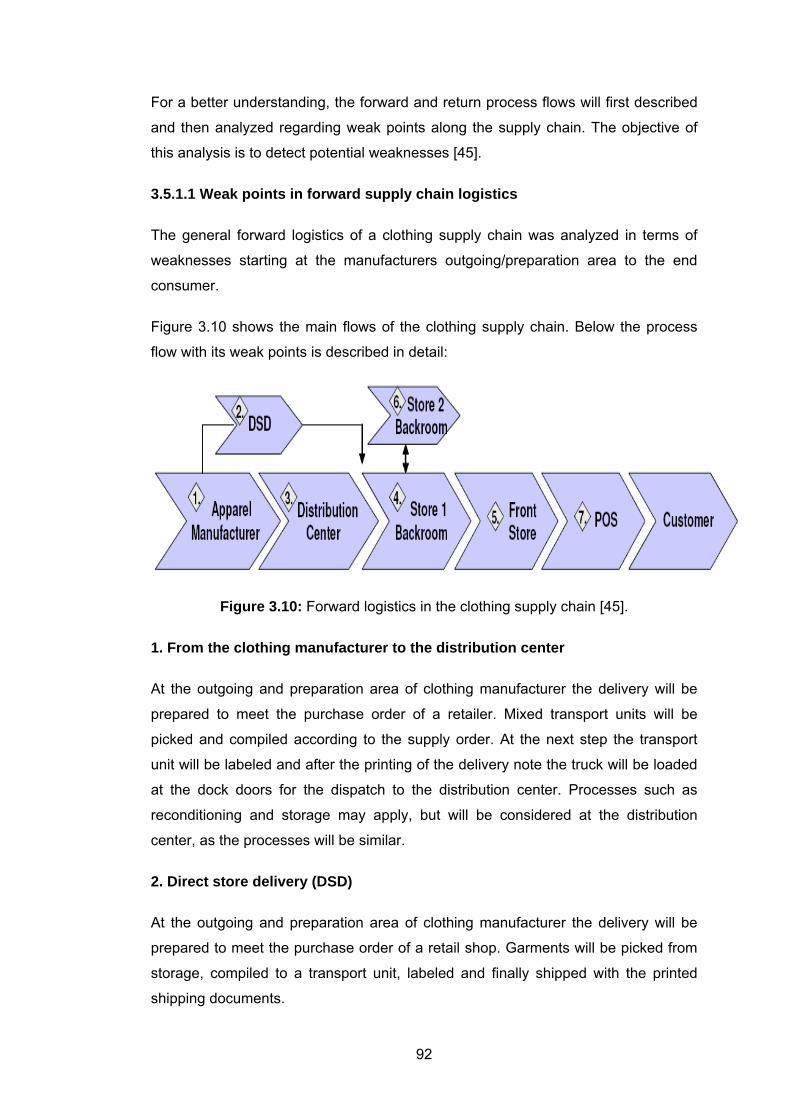
92
For a better understanding, the forward and return process flows will first described
and then analyzed regarding weak points along the supply chain. The objective of
this analysis is to detect potential weaknesses [45].
3.5.1.1 Weak points in forward supply chain logistics
The general forward logistics of a clothing supply chain was analyzed in terms of
weaknesses starting at the manufacturers outgoing/preparation area to the end
consumer.
Figure 3.10 shows the main flows of the clothing supply chain. Below the process
flow with its weak points is described in detail:
Figure 3.10: Forward logistics in the clothing supply chain [45].
1. From the clothing manufacturer to the distribution center
At the outgoing and preparation area of clothing manufacturer the delivery will be
prepared to meet the purchase order of a retailer. Mixed transport units will be
picked and compiled according to the supply order. At the next step the transport
unit will be labeled and after the printing of the delivery note the truck will be loaded
at the dock doors for the dispatch to the distribution center. Processes such as
reconditioning and storage may apply, but will be considered at the distribution
center, as the processes will be similar.
2. Direct store delivery (DSD)
At the outgoing and preparation area of clothing manufacturer the delivery will be
prepared to meet the purchase order of a retail shop. Garments will be picked from
storage, compiled to a transport unit, labeled and finally shipped with the printed
shipping documents.
93
The weak points at the manufacturer:
In the manufacturers' storage area processes usually are very efficient. The
challenge is to ensure the accurate configuration of transport units for either retail
stores or distribution centers in time.
The manufacturer usually gets little information regarding sales and store
availabilities of the garments. Hence the forecast quality is often not very reliable. In
many cases electronic data interchange (EDI) is used between manufacturer and
retailer/distribution center to guarantee the information flow. Nevertheless the time
delayed transmission of sales and inventory reports typically cause problems to the
manufacturer to identify the exact store inventory. Especially for never out of stock
(NOS) items this will cause problems.
For direct store deliveries (DSD) the picking processes require a lot of time. It is
usually labor intensive work as the mixed transport units have to be collected from
the storage area. In addition, errors may occur during picking processes and the
updating of inventory management systems. The depth and range of a product line
also have to be considered. For instance a high number of different sizes and colors
do require higher process optimization than a limited product line.
Further reasons for inaccurate inventory can be shrinkage, theft, and wrong
pickings.
3. Distribution Center
Distribution centers are the foundation of a retailing network. They could be run by
manufacturers, retailers or service providers. Each center usually supplies a number
of stores. The principal task of a distribution center is the reception of large
quantities of garments and to ship small quantities to individual stores. This avoids
the time-consuming processes of garment receptions from multiple suppliers at
individual stores. A second point is the storage of garments to guarantee the timely
replenishment of the retail shops. The process flow may vary after the reception of
the transport units and the quantity control. Further functions such as reconditioning
processes, cross docking, and storage can apply.
94
a) Receiving area
At the receiving area all incoming goods are unloaded and the quantity will be
checked and verified before the goods will be transported to further processing
areas.
The weak points:
− The manual verification of deliveries requires time and may cause errors.
b) Reconditioning processes:
At the reconditioning area, goods will be unpackaged and prepared for the store.
Such processes are ironing, hanging up of items, and attaching price labels as well
as security tags. They may also apply at the manufacturer site. Depending on the
flow, the garments will be shipped to the storage area or to the cross docking area.
The weak points:
− The tracking and tracing of garments through the reconditioning processes is
difficult to organize. Often a “black box” in data and physical process flows may
exist, which makes it difficult to provide accurate information regarding the current
location of garments.
− Due to the difficulties to locate garments, items may get lost. Also theft and
shrinkage may occur. This will significantly slow down the lead times.
c) Cross Docking processes
Cross docking is a practice of unloading products from an incoming truck and
loading these products in outbound trucks, with nearly no storage in between. In the
clothing supply chain this may be done to sort clothing intended for multiple different
stores, or to combine clothing from different origins for stores. A transport unit will be
picked and compiled to meet a purchase order from a store. Finally the transport
unit will be labeled and shipped to the outgoing area of the distribution center.
The weak points:
− As already described above, the verification as well as the picking and packaging
processes for the consolidation of transport units may cause delays and errors.
95
− The high degree of labor-intensive and time-critical processes may cause
bottlenecks in the whole operations.
− Unpredictable events such as late receptions may cause delays, which will affect
the whole cross docking processes.
− Inaccurate data through misplaced items, shrinkage, and theft will lead to
differences between data and physical process flows.
These problems can lead to wrong, late, inaccurate, and incomplete deliveries to
retail stores.
d) Warehousing of clothing
One of the main functions of distribution centers is the storage of products until
needed by the retail location. They ensure the replenishment of stores and may
require unpackaging processes.
Regularly inventory controls shall ensure the availability of products. The picking of
items and the consolidation of transport units is be done to meet the purchase
orders of the destined shops and dispatched to the outgoing area.
The weak points:
− Regular inventory captures require time and labor and will increase storage costs.
Still the inventory data will not be updated continuously. This forces companies to
have higher storage amounts and costs to compensate discrepancies caused by
theft, shrinkage, data errors, wrong storage, etc.
− Yet replenishment cannot be guaranteed when the demand of stores fluctuates
significantly.
− Another important issue is the obsolescence of garments which may be detected
too late. Through an increasing number of collections and higher stock turnovers,
the non detection of obsolescent garments may cause depreciations.
− Further already mentioned weak points are: picking errors, delays, etc.
e) Outgoing area
At the outgoing area, transport units will be shipped to the multiple retail shops. The
goods will either come from the cross docking area or the storage area. Usually the
96
transport units are already compiled for dispatch and only the shipping documents
will be printed before the truck is loaded.
The weak points:
− At the outgoing area, already aggregated transport units could be loaded in the
wrong truck and shipped to a wrong destination.
4. Retail store – back store
The back store of a retail shop has two main functions. The reception of clothing
from distribution centers or manufacturers is the first function. Along with the
unloading of the truck, the verification of delivered items is done. At a next step
items will be selected for storage in the back store or for the display in the front
store. The second function is the replenishment of the sales floor.
The weak points:
− The verification of incoming deliveries requires time and labor.
− If those deliveries are not accurate, additional time consuming processes such as
identifying missing garments, placing additional purchase orders, or even returning
wrong deliveries may occur. If delivery errors are not detected, there will be
discrepancies between data and physical inventory.
− Delays during previous processes at the manufacturer or distribution center will
lead to out of stock (OOS) situations at the retail store. This will affect sales, when
garments are not available.
− Because of the continuous replenishment of the front store, the inventory of the
back store cannot be exactly identified. Garments may be placed at the front store
or the back store. Therefore the tracking and tracing of garments is not guaranteed.
− High labor costs may apply for locating items in front and back stores. Additional
regularly inventory controls have to be executed to achieve an overview of the items
in the store.
5. Sales floor
At the sales floor the garments will be placed on shelves or rails. The main
responsibility of sales staff is to provide customer service. The second duty is the
97
already mentioned replenishment of items from the back store. Inventory checks on
the sales floor and the replacement of misplaced garments to the original shelf or
hanger are also part of the processes.
The weak points:
− The searching and replenishment of items will bind service staff and therefore lead
to less time for customer service because of additional handlings.
− Due to the time consuming processes on the sales floor, more staff is needed to
provide service, accurate item availability and correct inventory.
− Theft and shrinkage on the sales floor will lead to inaccurate inventory data.
Regular inventory controls are also essential on the sales floor.
− The retailer does not get any information about item movements on the sales
floor. Helpful information, why a customer does not buy selected items are not
detected (e.g., tracking items from fitting room to shelf).
− Customers are not able to check the availability of items by themselves. If the
sales staff is busy with store operations, potential sales might be lost.
6. Store-to-store transfers
Store-to-store transfers occur when single shops have an oversupply which cannot
be sold. Stores might also offer item transfers between shops according to the
customers´ requests. After checking the availability, for example, by checking the
computer system or calling a store, the garment will be picked in the back store or
the front store, verified, packaged, and then dispatched to the outgoing area and
finally to the shop.
The weak points:
− A multitudes of additional manual processes such as locating, verifying, packaging
and shipping processes are added to the already time-consuming store operation
processes.
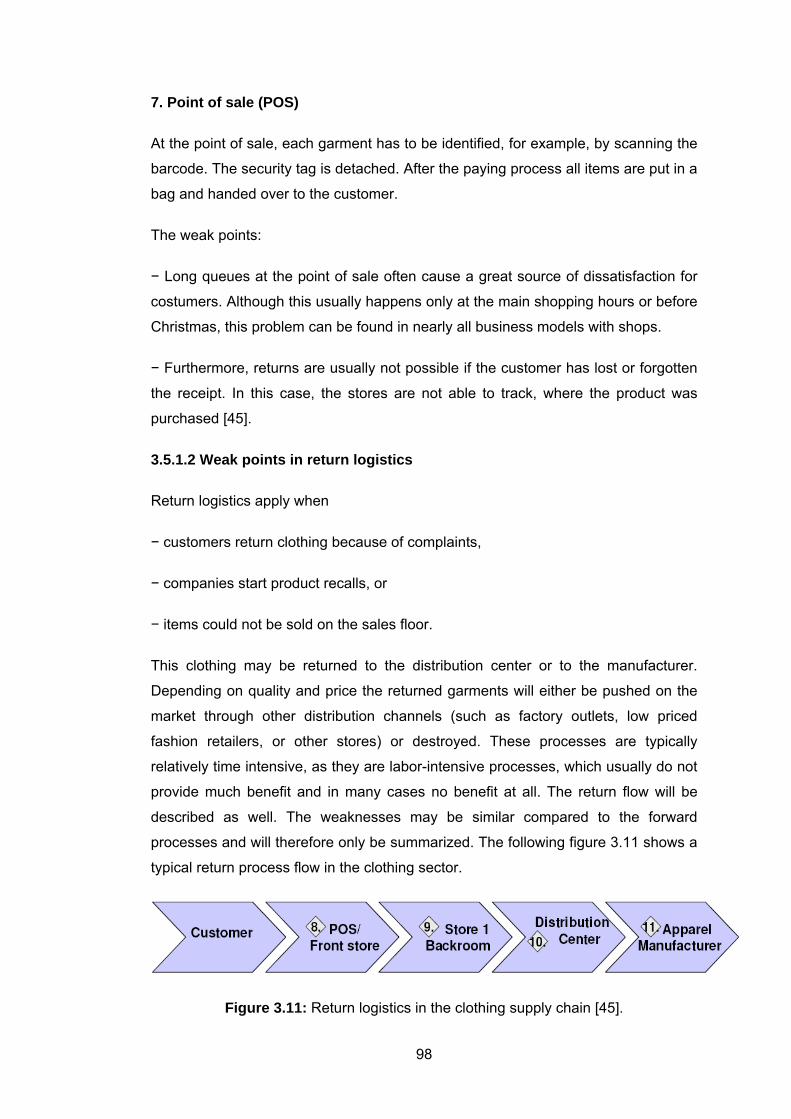
98
7. Point of sale (POS)
At the point of sale, each garment has to be identified, for example, by scanning the
barcode. The security tag is detached. After the paying process all items are put in a
bag and handed over to the customer.
The weak points:
− Long queues at the point of sale often cause a great source of dissatisfaction for
costumers. Although this usually happens only at the main shopping hours or before
Christmas, this problem can be found in nearly all business models with shops.
− Furthermore, returns are usually not possible if the customer has lost or forgotten
the receipt. In this case, the stores are not able to track, where the product was
purchased [45].
3.5.1.2 Weak points in return logistics
Return logistics apply when
− customers return clothing because of complaints,
− companies start product recalls, or
− items could not be sold on the sales floor.
This clothing may be returned to the distribution center or to the manufacturer.
Depending on quality and price the returned garments will either be pushed on the
market through other distribution channels (such as factory outlets, low priced
fashion retailers, or other stores) or destroyed. These processes are typically
relatively time intensive, as they are labor-intensive processes, which usually do not
provide much benefit and in many cases no benefit at all. The return flow will be
described as well. The weaknesses may be similar compared to the forward
processes and will therefore only be summarized. The following figure 3.11 shows a
typical return process flow in the clothing sector.
Figure 3.11: Return logistics in the clothing supply chain [45].
99
8. Costumer Returns in Store
Customer returns will be received by the staff at the point of sale (POS). The items
will be identified by receipt and label, if it is still attached. The returned garments
might be displayed again in the store after a quality check. In this case new labels
and security tags must be attached. Garments that cannot be sold in the store will
be returned to either the distribution center or the manufacturer.
9. Back store
Garments dispatched to the distribution center or the manufacturer will be stored
temporarily at the back store. After quantities are verified, security tags and labels
will be detached and then the garments are shipped to their destination.
10. Distribution Center
At the distribution center the returned garments are identified and the quantity will be
checked. When garments are faulty, they might temporarily be stored and then
either returned to the manufacturer or put on the market through other distribution
channels.
11. Manufacturer
The manufacturer verifies the items.
The weak points of reverse logistics
Reverse logistics usually cause costs that cannot be put against a return on
investment. Therefore the process-related efforts amount for additional costs, which
may not provide any benefit at all. Looking at the different areas of the process
chain, problems can be identified in the store, at the distribution center, and finally at
the manufacturer. As these processes can be compared to the already identified
processes in forward logistics, the individual weak points will not be explained
separately. The main problems are
− picking errors
− increase in manual operations
− insufficient transparency and related tracking and tracing problems
− discrepancies between physical flow and inventory management system
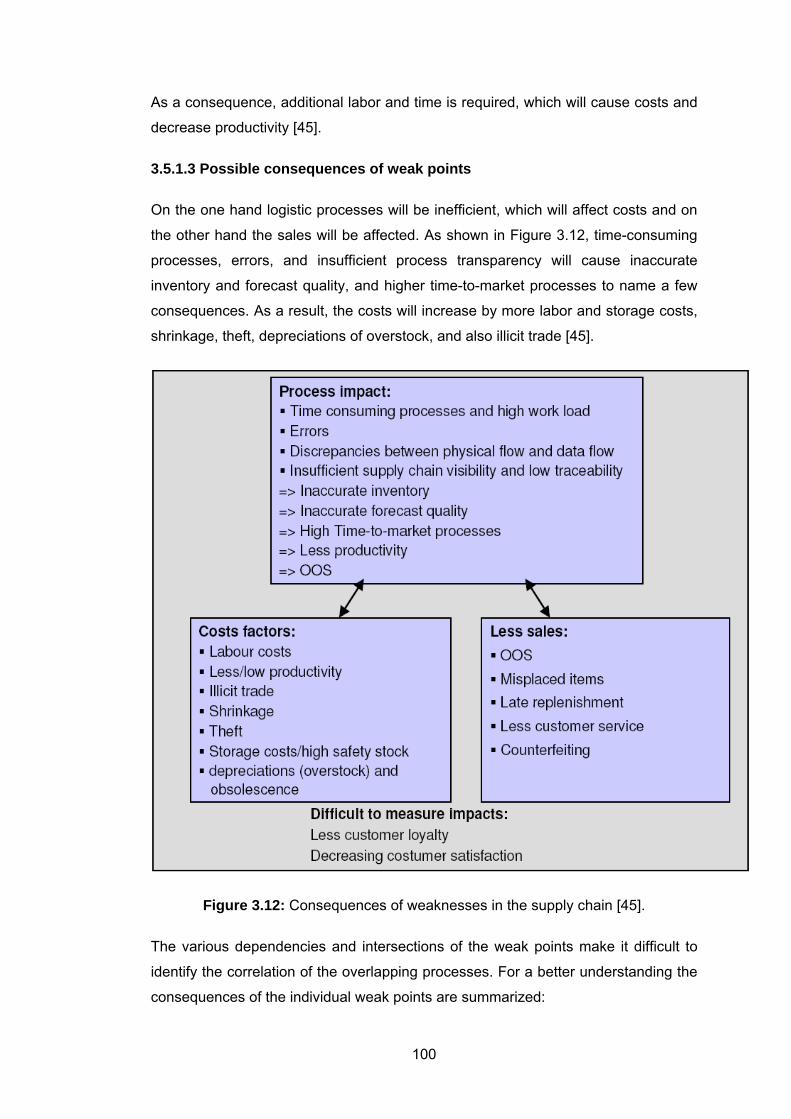
100
As a consequence, additional labor and time is required, which will cause costs and
decrease productivity [45].
3.5.1.3 Possible consequences of weak points
On the one hand logistic processes will be inefficient, which will affect costs and on
the other hand the sales will be affected. As shown in Figure 3.12, time-consuming
processes, errors, and insufficient process transparency will cause inaccurate
inventory and forecast quality, and higher time-to-market processes to name a few
consequences. As a result, the costs will increase by more labor and storage costs,
shrinkage, theft, depreciations of overstock, and also illicit trade [45].
Figure 3.12: Consequences of weaknesses in the supply chain [45].
The various dependencies and intersections of the weak points make it difficult to
identify the correlation of the overlapping processes. For a better understanding the
consequences of the individual weak points are summarized:
101
1. Transparency of the supply chain
The transparency of the supply chain is often insufficient. The EU Directive
1081/2003 for non food products forces companies involved in the supply chain to
record ingoing and outgoing merchandise or parts. Due to a weak automation of
multiple clothing companies a registry often cannot be generated automatically. In
addition, the management of a withdrawn product requires a very deep traceability
with a high degree of granularity. Depending on the automation process, this
problem is more or less significant for all business models.
Inadequate transparency can result in a series of reactions of further challenges
such as out of stock (OOS) situations, late replenishment, and further labor for
locating stock and items in stores and warehouses. Inaccurate inventory will cause
higher stocks to guarantee replenishment processes. Furthermore shrinkage, theft,
and illicit trade might not be detected or noticed too late. Also obsolescence and
overstock will be realized late, which may cause depreciations. The whole
productivity will be affected and the final result will be higher costs and fewer sales
through OOS situations and less customer service.
2. Out of stock situation (OOS)
An out-of-stock situation may occur when a product demand from a customer
cannot be satisfied immediately. OOS situations may apply to nearly all business
models such as specialized chains, independent multi-brand stores, or even hyper-
and supermarkets. Exceptions may occur in the case of promotional sales, which
are pushed to the stores and not replenished. The out of stock situation can be
explained by many reasons. The most common reasons are:
− errors in the demand forecast,
− delays and errors in the dispatch or reception of products,
− unexpected demand,
− discrepancies between physical and data related inventory.
− illicit trade and
− lack of on shelf availability, even if it is available in the back room or in another
place of the store (for example, wrong shelf or left items in a fitting room).
102
3. Operational efficiency
The exact verification of deliveries does require manual quantity controls, for
instance by reading each barcode manually to update the inventory system. These
are time-consuming and labor-intensive processes. Furthermore regular manual
inventory controls are necessary because discrepancies always exist on a higher or
lower scale. In the supply chain, manual verifications appear at multiple points: at
the reception, during storing and picking processes in warehouses, when items are
shipped, etc.
4. Shrinkage
Shrinkage is mainly due to external and internal theft, or shipments of products to an
incorrect destination. It does apply to all business models on a varying degree of
importance.
The degree of shrinkage is influenced by factors such as the automation degree,
process optimization, and workforce culture.
5. Management of obsolescence and depreciations
In the clothing sector, most products have a limited commercial life cycle. Because
of the high rotation of merchandise, obsolescent goods may not be detected due to
a non-existing or inefficient inventory management in the retail store or warehouse.
Necessary measures such as price reductions to prevent this obsolescence may not
be conducted in time. The obsolescence can be found for instance at department
stores, private label fashion, and also brand fashion.
6. Illicit trade
Illicit trade consists of merchandise sales – generally by third parties – at points of
sales different than planned by the manufacturer. It could happen that products are
turned aside towards markets with higher prices. This deviation reduces the product
availability, the market quota and, in some cases, generates the impossibility to
manage suitable post sale service, which results in a damaged image of the
manufacturer. Illicit trade typically occurs in the high level brand fashion business
model. The price margins are comparatively high in this area and therefore
considerably profitable.
103
7. Counterfeiting
The counterfeiting of luxury goods and brand labels is widely spread nowadays. The
consequences can vary from the simple loss of sales to greater risks regarding
credibility and brand image.
8. Customer service
Time consuming store operations will affect customer service. The sales staff is
often busy conducting store operations. On this account customers often have to
wait and potential sales may get lost. Also OOS situations and insufficient product
information will affect customer satisfaction. Customer loyalty may decrease and in
the worst case may be completely lost.
In addition, most retail stores – regardless their business model – decline to manage
a return or a change if the customer does not have the receipt of payment. The
reason is that stores are not able to verify in which establishment and to what price
the product has been acquired [45].
104
4. APPLICATIONS OF SCM IN THE TEXTILE INDUSTRY
4.1 About DAGI
DAGI, which is one of the brands that Turkey has created in the last two decades,
has always been perceived as a foreign brand for 25 years, however, "100%
Turkish" brand DAGI has had many international successes in its own sector. Dagi,
which aims at eliminating foreign brand perception that has been formed in
consumers and in public opinion, has started to use "100% Turkish" slogan for the
last 25 years. However this slogan was withdrawn for it had been embraced by
Turkey and for the first time something which had never been done before was done
- brand logo was put on the underwear. Undershirts, vests, shorts and underpants
were added to men's underwear product range in addition to briefs. Raw materials
were chosen among those which had never been used before and in 1985 pajamas,
sports wear and home cloths were started to be produced.
Dagi commenced the production of girls' and boys' cloths in 1988. A collection for
children was formed from the same products present in the men's collection. Dagi,
which demonstrated its success in this period by its tax records, became the tax
record holder in 1986, 1987 and 1988. Dagi opened its first store in 1988 in
Halaskargazi Street of Şişli, Istanbul. For Dagi shopping mall storekeeping started
with Akmerkez. Afterwards it found itself places in malls such as Profilo, Capitol,
Olivium, Carousel, Galleria, Beylikdüzü Migros, Carrefour Kozyatağı, Carrefour
Ümraniye, Carrefour Maltepe, İzmit Dolphin, Konya Kulecity, Ankara Optimum,
Ankara Migros, İzmir Kipa, İzmir Agora, İzmir Bornova, Bursa Zafer Plaza, Bursa
Carrefour, Gaziantep Migros and Eskişehir Neo.
Dagi owns more than 30 stores all around the country currently and aims at
reaching 40 stores by the end of 2007 and opening stores abroad. Dagi products
that are placed on the departments of big stores of Turkey reach retail dealers
through wholesale distributors located in cities such as Istanbul, Ankara, İzmir and
Adana. Dagi also exports its products to many countries having started exportation
in 2007.

105
Dagi, which became more powerful within the frame of a new partnership in the
second half of 2004, restructured itself in order to carry out production in a closed
area of 7500 m2. According to numbers belonging to the end of 2004 Dagi held
market leadership in boutique style men's and women's underwear, pajamas and
sweat suits and reached 30 retail dealers around the country. Moreover it serves to
its consumers via nearly 100 corners, 15 distributors and almost 1000 sale points in
addition to its regional representatives in Ankara, İzmir, Istanbul and Adana [46].
4.1.1 History of Dagi
At the beginning there was only the production of men's underwear in Dagi which is
the leader enterprise of the sector. Dagi has always broken new grounds from
product presentation to promotions it devised since the date it was established.
In 1983, men's underwear that were sold within original metal boxes up to that date
were presented to the market by putting soaps into these boxes. These metal boxes
that were produced more than 15 million units were greeted with an interest above
the expected rate. Consumers liked this product that they met for the first time so
much that it broke sale records. Moreover imitations of Dagi spread with great
speed. Many of the firms started to follow Dagi's example [46].
4.1.2 Product of Dagi
The logo of Dagi whose product range has been developed since 2004 has been
renewed. Dagi, which redesigned its all underwear collection all over in the same
period, started the production of women's underwear, morning gown and satin night
gown. The change was not limited to these developments and Dagi changed raw
materials used in the products too.
Dagi, which is the most well-known brand of Turkey in men's underwear, is placed
at the top for brand recognition and quality. It adopts a strategy that works in
boutique style and that does not make concession in respect of quality.
Dagi manufactures underwear, pajama, sweat suit, sweat-shirt, t-shirt, shirt, short,
Bermuda shorts, socks, sports bag and swimsuits for men, women and children [46].
4.2 Supply Chain Steps of Dagi
In DAGI, the Supply chain has 8 main steps for preparing and selling a product. If
we take an example of a producing pajama set [47-53].
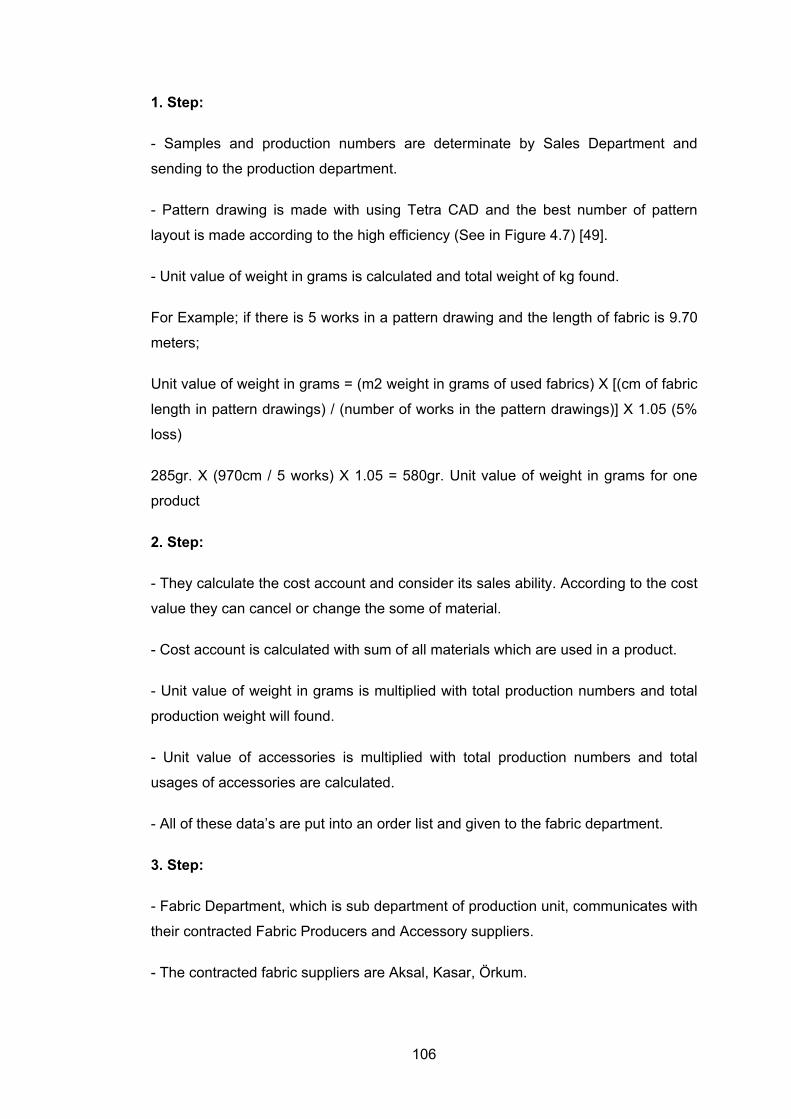
106
1. Step:
- Samples and production numbers are determinate by Sales Department and
sending to the production department.
- Pattern drawing is made with using Tetra CAD and the best number of pattern
layout is made according to the high efficiency (See in Figure 4.7) [49].
- Unit value of weight in grams is calculated and total weight of kg found.
For Example; if there is 5 works in a pattern drawing and the length of fabric is 9.70
meters;
Unit value of weight in grams = (m2 weight in grams of used fabrics) X [(cm of fabric
length in pattern drawings) / (number of works in the pattern drawings)] X 1.05 (5%
loss)
285gr. X (970cm / 5 works) X 1.05 = 580gr. Unit value of weight in grams for one
product
2. Step:
- They calculate the cost account and consider its sales ability. According to the cost
value they can cancel or change the some of material.
- Cost account is calculated with sum of all materials which are used in a product.
- Unit value of weight in grams is multiplied with total production numbers and total
production weight will found.
- Unit value of accessories is multiplied with total production numbers and total
usages of accessories are calculated.
- All of these data’s are put into an order list and given to the fabric department.
3. Step:
- Fabric Department, which is sub department of production unit, communicates with
their contracted Fabric Producers and Accessory suppliers.
- The contracted fabric suppliers are Aksal, Kasar, Örkum.
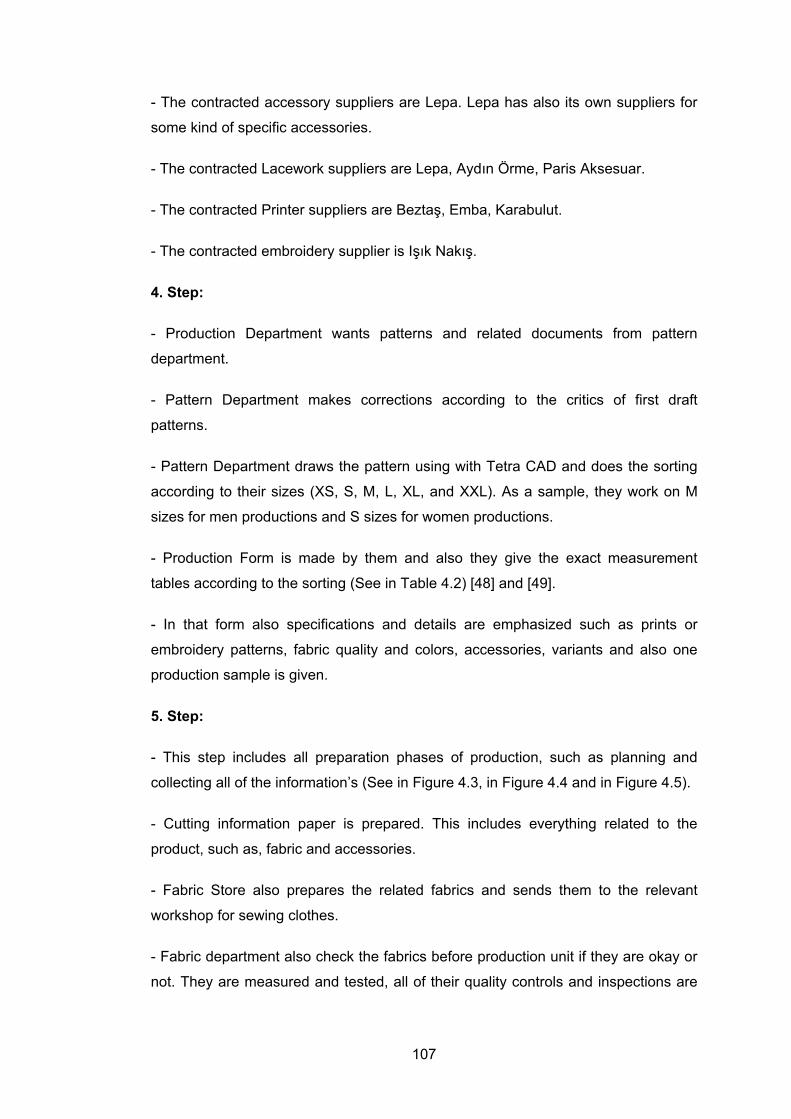
107
- The contracted accessory suppliers are Lepa. Lepa has also its own suppliers for
some kind of specific accessories.
- The contracted Lacework suppliers are Lepa, Aydın Örme, Paris Aksesuar.
- The contracted Printer suppliers are Beztaş, Emba, Karabulut.
- The contracted embroidery supplier is Işık Nakış.
4. Step:
- Production Department wants patterns and related documents from pattern
department.
- Pattern Department makes corrections according to the critics of first draft
patterns.
- Pattern Department draws the pattern using with Tetra CAD and does the sorting
according to their sizes (XS, S, M, L, XL, and XXL). As a sample, they work on M
sizes for men productions and S sizes for women productions.
- Production Form is made by them and also they give the exact measurement
tables according to the sorting (See in Table 4.2) [48] and [49].
- In that form also specifications and details are emphasized such as prints or
embroidery patterns, fabric quality and colors, accessories, variants and also one
production sample is given.
5. Step:
- This step includes all preparation phases of production, such as planning and
collecting all of the information’s (See in Figure 4.3, in Figure 4.4 and in Figure 4.5).
- Cutting information paper is prepared. This includes everything related to the
product, such as, fabric and accessories.
- Fabric Store also prepares the related fabrics and sends them to the relevant
workshop for sewing clothes.
- Fabric department also check the fabrics before production unit if they are okay or
not. They are measured and tested, all of their quality controls and inspections are
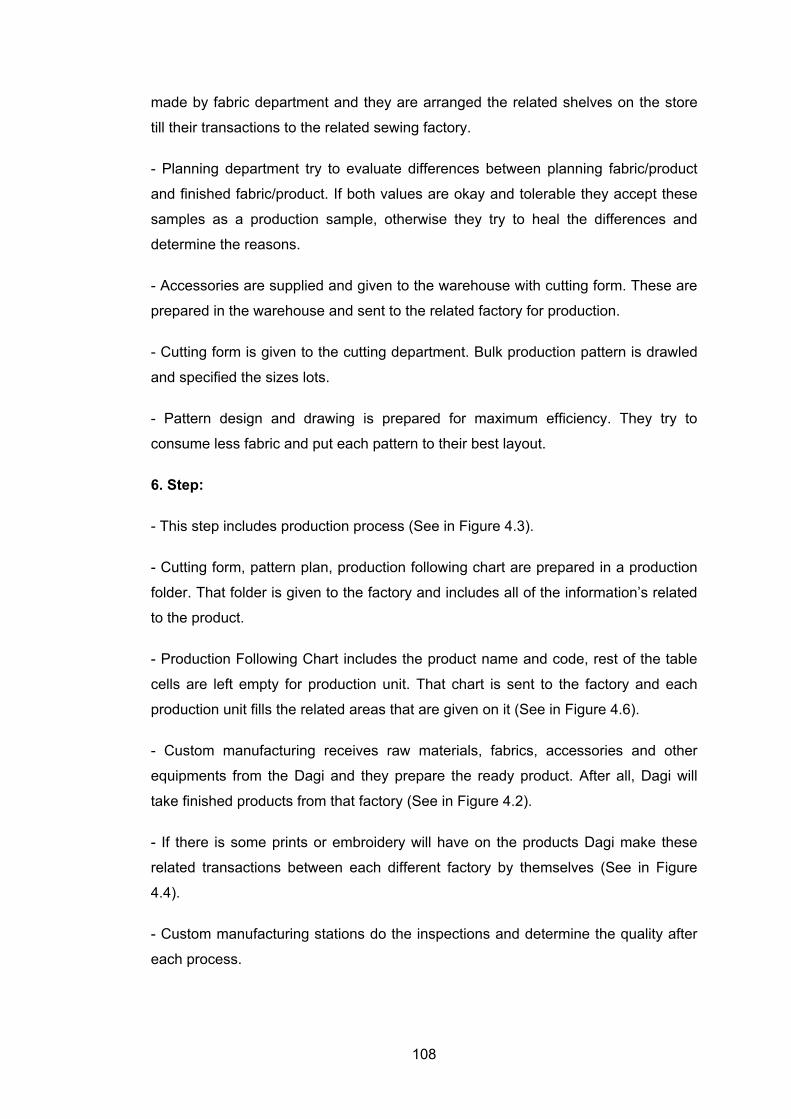
108
made by fabric department and they are arranged the related shelves on the store
till their transactions to the related sewing factory.
- Planning department try to evaluate differences between planning fabric/product
and finished fabric/product. If both values are okay and tolerable they accept these
samples as a production sample, otherwise they try to heal the differences and
determine the reasons.
- Accessories are supplied and given to the warehouse with cutting form. These are
prepared in the warehouse and sent to the related factory for production.
- Cutting form is given to the cutting department. Bulk production pattern is drawled
and specified the sizes lots.
- Pattern design and drawing is prepared for maximum efficiency. They try to
consume less fabric and put each pattern to their best layout.
6. Step:
- This step includes production process (See in Figure 4.3).
- Cutting form, pattern plan, production following chart are prepared in a production
folder. That folder is given to the factory and includes all of the information’s related
to the product.
- Production Following Chart includes the product name and code, rest of the table
cells are left empty for production unit. That chart is sent to the factory and each
production unit fills the related areas that are given on it (See in Figure 4.6).
- Custom manufacturing receives raw materials, fabrics, accessories and other
equipments from the Dagi and they prepare the ready product. After all, Dagi will
take finished products from that factory (See in Figure 4.2).
- If there is some prints or embroidery will have on the products Dagi make these
related transactions between each different factory by themselves (See in Figure
4.4).
- Custom manufacturing stations do the inspections and determine the quality after
each process.
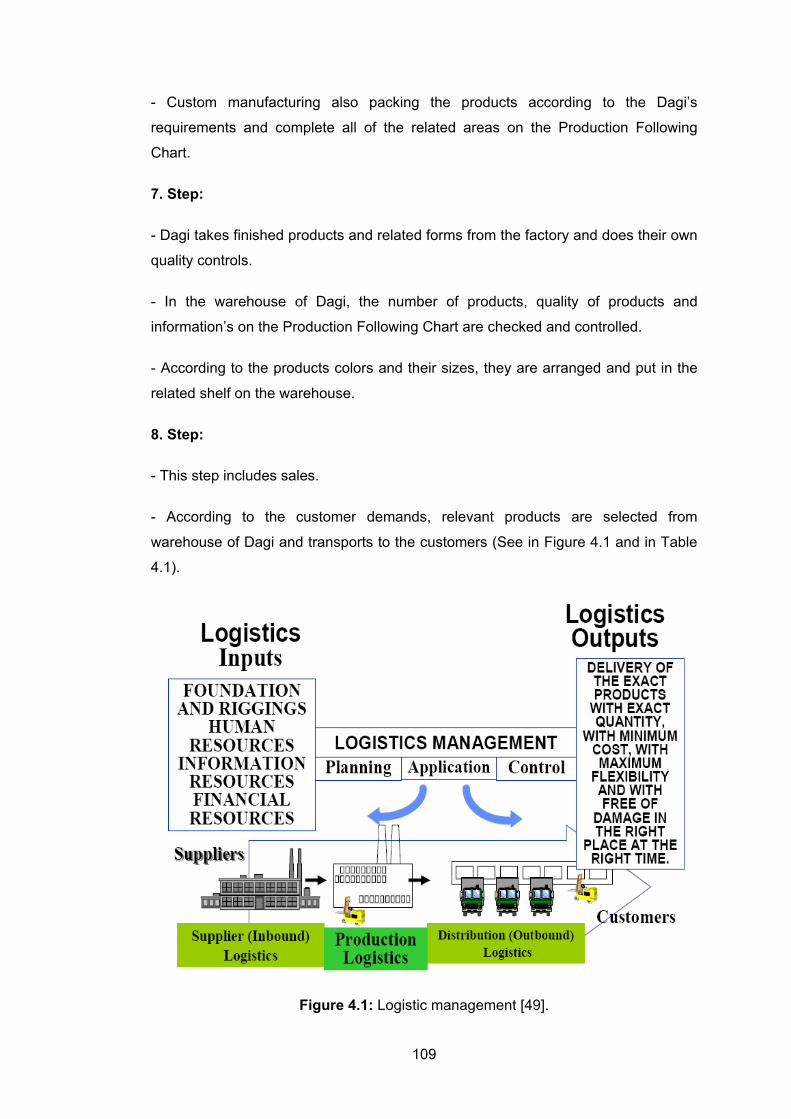
109
- Custom manufacturing also packing the products according to the Dagi’s
requirements and complete all of the related areas on the Production Following
Chart.
7. Step:
- Dagi takes finished products and related forms from the factory and does their own
quality controls.
- In the warehouse of Dagi, the number of products, quality of products and
information’s on the Production Following Chart are checked and controlled.
- According to the products colors and their sizes, they are arranged and put in the
related shelf on the warehouse.
8. Step:
- This step includes sales.
- According to the customer demands, relevant products are selected from
warehouse of Dagi and transports to the customers (See in Figure 4.1 and in Table
4.1).
Figure 4.1: Logistic management [49].
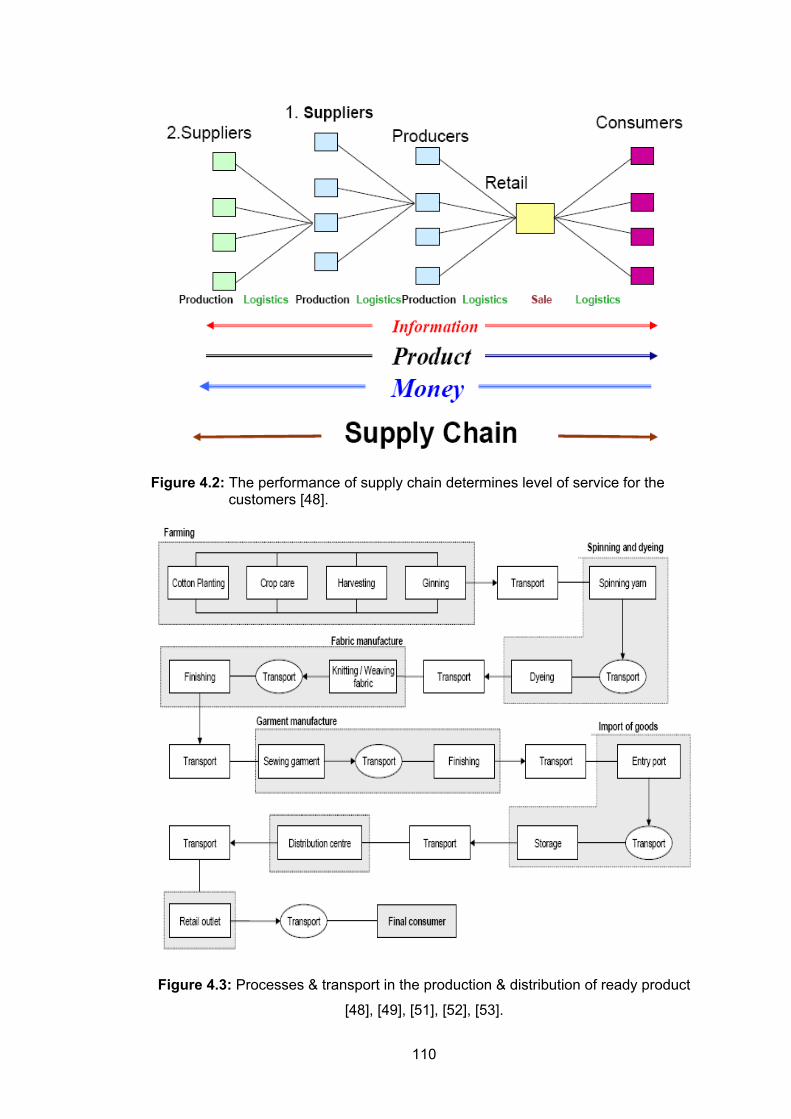
110
Figure 4.2: The performance of supply chain determines level of service for the customers [48].
Figure 4.3: Processes & transport in the production & distribution of ready product
[48], [49], [51], [52], [53].
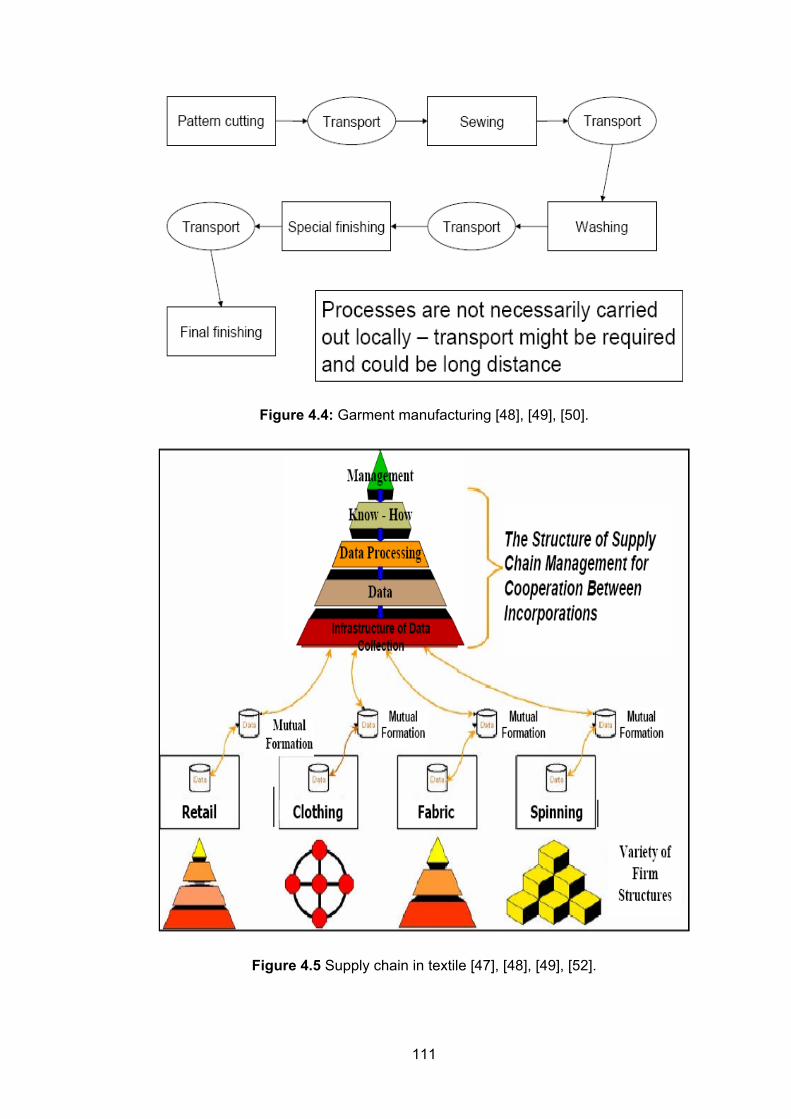
111
Figure 4.4: Garment manufacturing [48], [49], [50].
Figure 4.5 Supply chain in textile [47], [48], [49], [52].
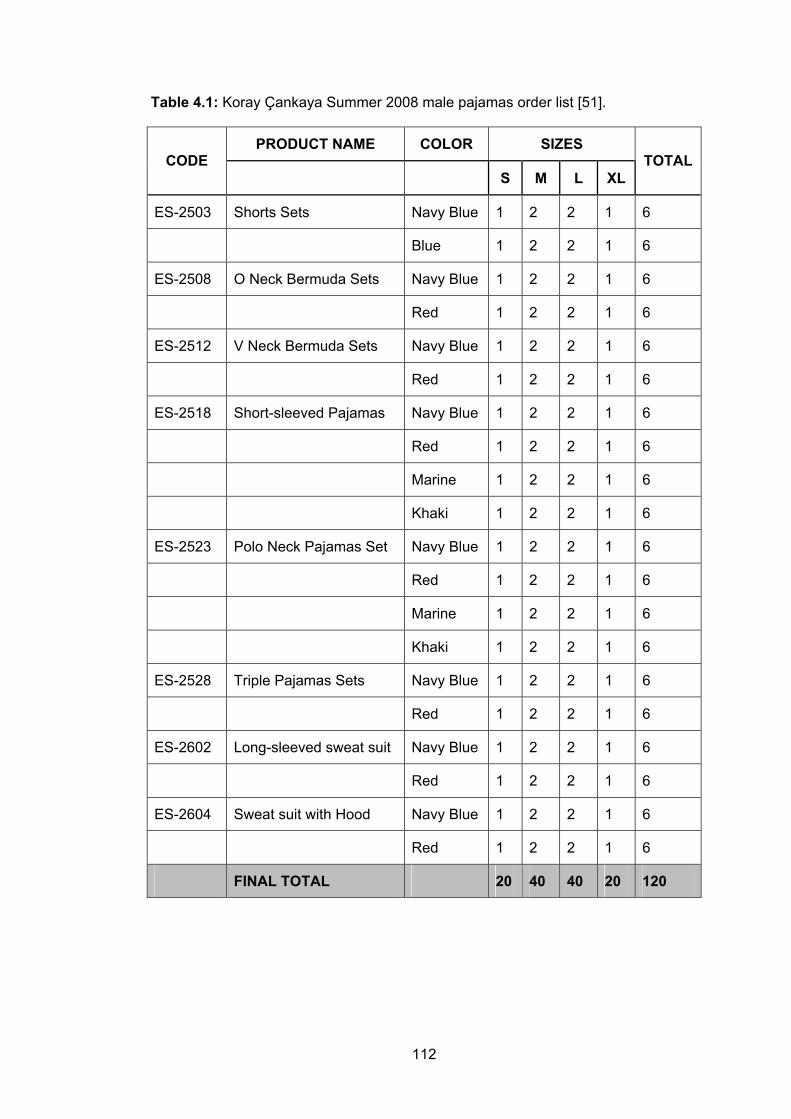
112
Table 4.1: Koray Çankaya Summer 2008 male pajamas order list [51].
PRODUCT NAME COLOR SIZES CODE
S M L XL TOTAL
ES-2503 Shorts Sets Navy Blue 1 2 2 1 6
Blue 1 2 2 1 6
ES-2508 O Neck Bermuda Sets Navy Blue 1 2 2 1 6
Red 1 2 2 1 6
ES-2512 V Neck Bermuda Sets Navy Blue 1 2 2 1 6
Red 1 2 2 1 6
ES-2518 Short-sleeved Pajamas Navy Blue 1 2 2 1 6
Red 1 2 2 1 6
Marine 1 2 2 1 6
Khaki 1 2 2 1 6
ES-2523 Polo Neck Pajamas Set Navy Blue 1 2 2 1 6
Red 1 2 2 1 6
Marine 1 2 2 1 6
Khaki 1 2 2 1 6
ES-2528 Triple Pajamas Sets Navy Blue 1 2 2 1 6
Red 1 2 2 1 6
ES-2602 Long-sleeved sweat suit Navy Blue 1 2 2 1 6
Red 1 2 2 1 6
ES-2604 Sweat suit with Hood Navy Blue 1 2 2 1 6
Red 1 2 2 1 6
FINAL TOTAL 20 40 40 20 120
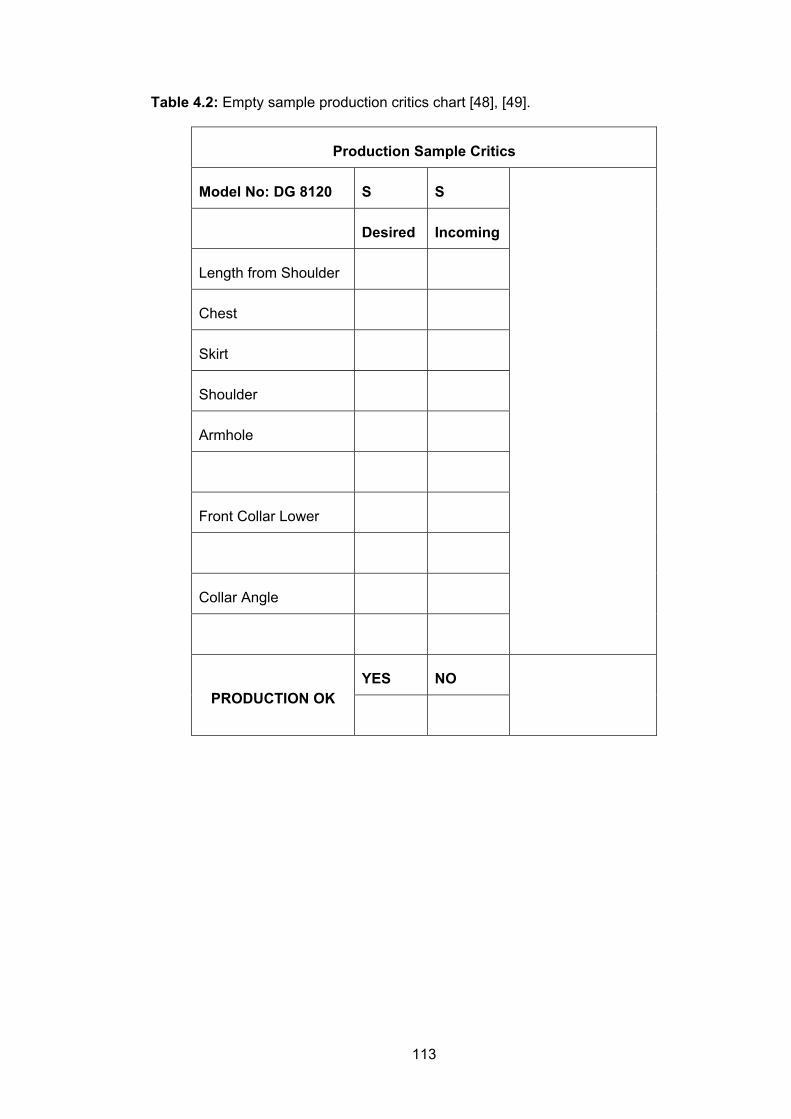
113
Table 4.2: Empty sample production critics chart [48], [49].
Production Sample Critics
Model No: DG 8120 S S
Desired Incoming
Length from Shoulder
Chest
Skirt
Shoulder
Armhole
Front Collar Lower
Collar Angle
YES NO PRODUCTION OK
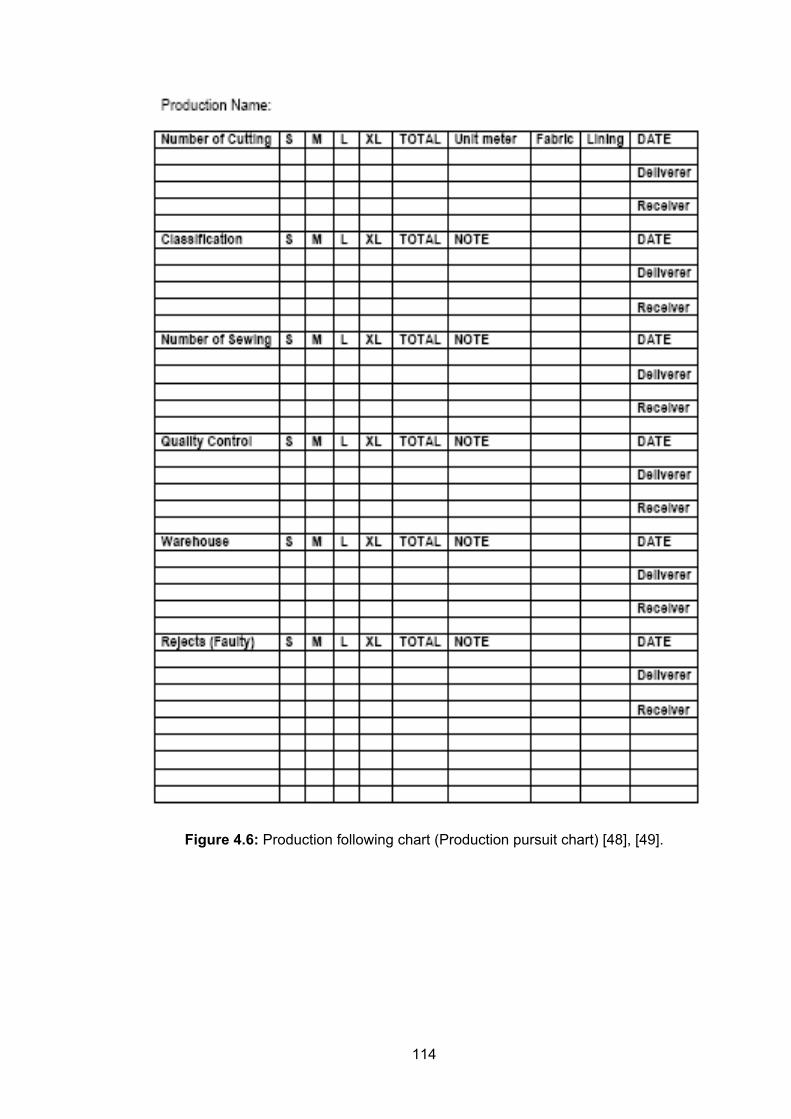
114
Figure 4.6: Production following chart (Production pursuit chart) [48], [49].
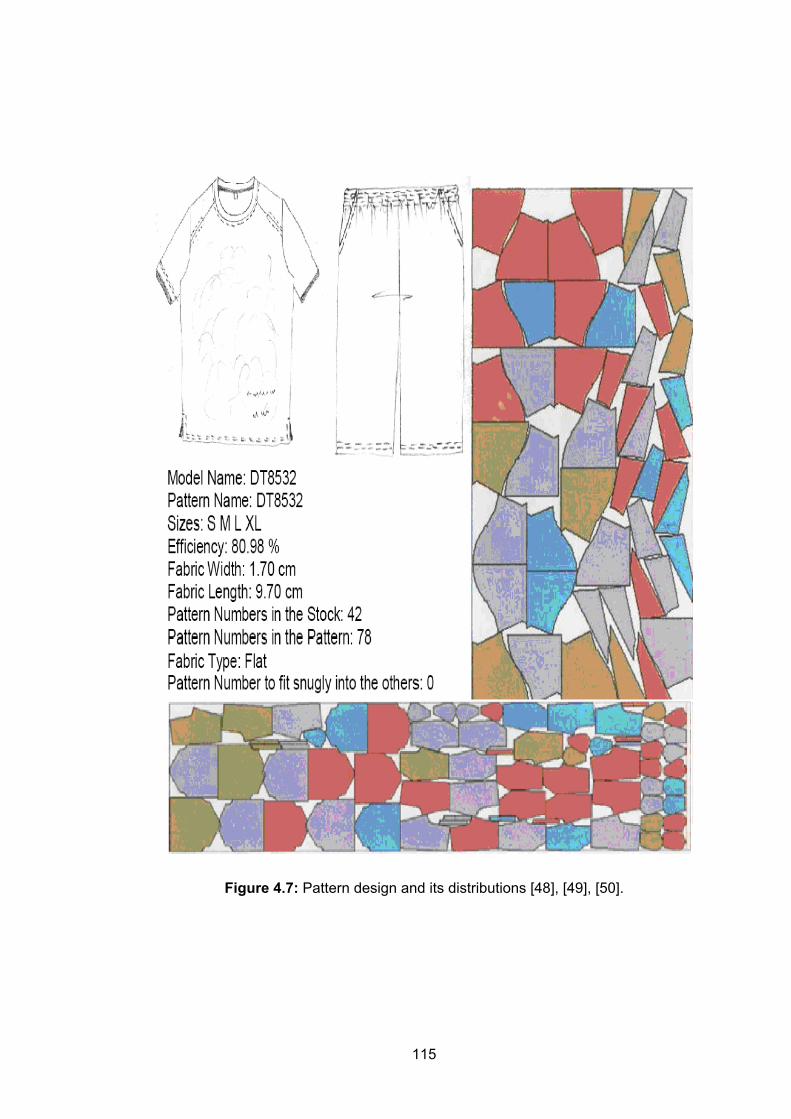
115
Figure 4.7: Pattern design and its distributions [48], [49], [50].
116
4.3 Demand Forecasting in DAGI
All the economic affiliations based on consumer demands. Any company which runs
on production without considering the targeted markets’ demand level will produce
inappropriate amounts of goods. In the state of shortfall production, there will be an
increase in the fixed cost per a unit because of idle capacity hence; there will be an
increase in a unit cost. On the other hand, in the excess production the circulation
rate of capital will decrease while stocking problems arise.
It is a significant issue that being aware of a market’s demands of a product that is
about being produced in a not yet running company which is under the phase of
project evaluation.
In the countries that the numbers of modern and large companies increase
drastically in order to forecast long run relations in business, the intrinsic method of
forecasting base on the methods which express by numbers. In other words by a
method which does not based on statistic analyses, it is impossible to forecast.
There is not only one method to forecast demand. In an economy, there are lots of
goods and services such as; intermediate goods, final goods, consumption goods
and etc, also whose production stages are completely different. This leads not to
rely on just one forecasting method. Furthermore it would be unreliable to apply only
one method in order to get true results
All forecasting methods have not been listed below. Indeed the most used ones
have been defined.
4.3.1 Qualitative forecasting methods
In demand forecasting, some subjective method and other controversial methods on
scientific aspects can be used other than various techniques basing on mathematics
and statistics. For instance, in Dagi, some kind of qualitative forecasting methods
are used.
1. Forecasting methods basing on the opinions of executive management
Officers of productions, purchasing, financial operations, and administrative
managers in the upper steps of the Dagi use their experiences and information, and
forecast the sales in the planning period. Although this method prevents faltering of
the managers in the statistical data, this provides sharing of sales forecasting
117
responsibility among various managers. However, it doesn’t provide solution of this
task with seriously and scientific methods [52], [53].
2. Opinions of key personnel
If demand forecasting has been carried out for extension of a current establishment
or establishment of a new unit of an established enterprise, opinions of the
personnel in the sales department may have great importance. For example, in
Dagi, sales department both stores and wholesale concerned staff members have
sufficient estimations according to their previous quantity of sales for each model
and product. That’s why they can easily forecast the next season’s potential
circulations.
Since the factor of subjectivity dominates the forecast of managers and the opinions
of key personnel, it doesn’t rely on these techniques in demand forecasts. However,
these forecast methods basing on subjectivity and experience may be used in the
examining the results found with mathematical and statistical methods [52], [53].
3. Questionnaires
Organizations to be established or other organizations which were established but
will manufacture a new goods or service may determined the demand by means of
sending questionnaires to the consumers directly or to the persons using the goods.
It will not be expected from all of the persons or establishments to answer
questionnaires. The answers will be analyzed covering all consumers by the help of
statistical methods, and demand forecasting will be carried out. Dagi sometimes
arranges meetings in the specific areas and takes each zone demands. These
zones supervisors evaluate their demands according to their consumers.
Even though the method of questionnaire is the most used market research method
in developed countries, it is the least scientific method. Lack of objectivity and
reliability of the information obtained with these methods, denying answering the
questions requested by the relevant persona, communication errors lower the
importance of the said method. However, the opportunity to provide the information
required for market research makes the method of questionnaire as a versatile and
frequently used method [52], [53].
118
4.3.2 Quantitative demand forecasting methods
Time Serial Analysis
Time serial analysis is a method which is used considering past investigations to
estimate future option value. This analysis making use of the past statistical values
or using the time serial investigations is made. By means of time series, consuming
trend of the goods and services is calculated then, the production estimation of them
is decided.
1. Arithmetic Average Method
This method conjecture that available average of the past data helps us is making
the optimum forecasting about future. According to this supposition the most
suitable estimate the future values can be obtain calculating the average of past
values. This demand forecasting method is very simple;
n
yAAM
n
t t∑== 1 (4.1)
According to this formula the past values are summed up then, this number,
calculated, is dividend to count of the past value (See Table 4.3).
Thus, the estimating of future values equals this average value. Besides, for the new
accounts this operation is repeated. However, it is not forgotten for every new
operation, previous operation must be processed [17].
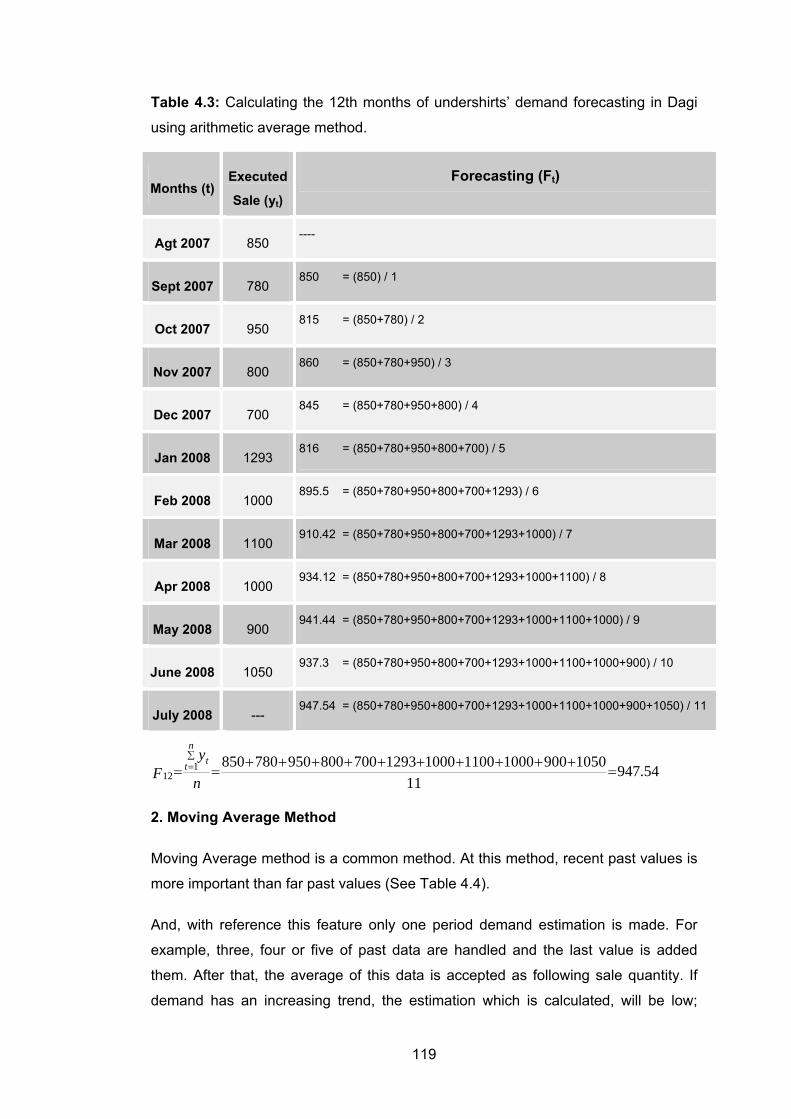
119
Table 4.3: Calculating the 12th months of undershirts’ demand forecasting in Dagi
using arithmetic average method.
Months (t) Executed
Sale (yt)
Forecasting (Ft)
Agt 2007 850 ----
Sept 2007 780 850 = (850) / 1
Oct 2007 950 815 = (850+780) / 2
Nov 2007 800 860 = (850+780+950) / 3
Dec 2007 700 845 = (850+780+950+800) / 4
Jan 2008 1293 816 = (850+780+950+800+700) / 5
Feb 2008 1000 895.5 = (850+780+950+800+700+1293) / 6
Mar 2008 1100 910.42 = (850+780+950+800+700+1293+1000) / 7
Apr 2008 1000 934.12 = (850+780+950+800+700+1293+1000+1100) / 8
May 2008 900 941.44 = (850+780+950+800+700+1293+1000+1100+1000) / 9
June 2008 1050 937.3 = (850+780+950+800+700+1293+1000+1100+1000+900) / 10
July 2008 --- 947.54 = (850+780+950+800+700+1293+1000+1100+1000+900+1050) / 11
54.94711
10509001000110010001293700800950780850112 =
++++++++++==
∑=
n
yF
n
t t
2. Moving Average Method
Moving Average method is a common method. At this method, recent past values is
more important than far past values (See Table 4.4).
And, with reference this feature only one period demand estimation is made. For
example, three, four or five of past data are handled and the last value is added
them. After that, the average of this data is accepted as following sale quantity. If
demand has an increasing trend, the estimation which is calculated, will be low;
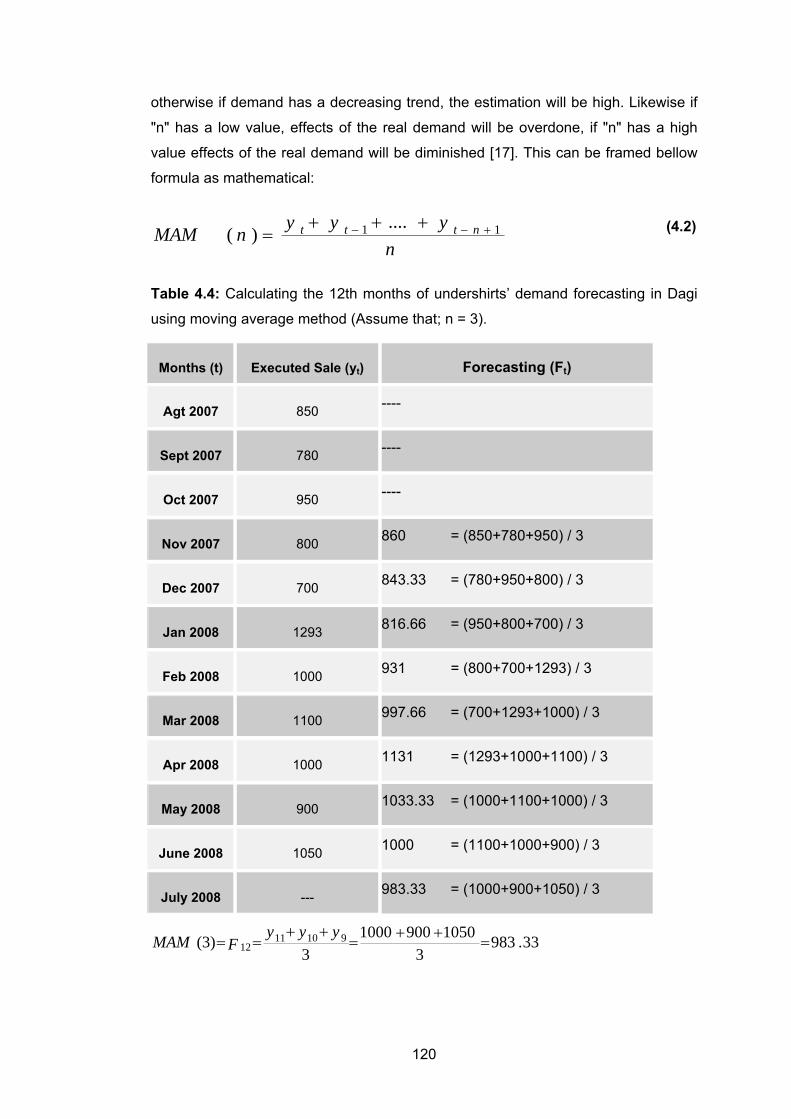
120
otherwise if demand has a decreasing trend, the estimation will be high. Likewise if
"n" has a low value, effects of the real demand will be overdone, if "n" has a high
value effects of the real demand will be diminished [17]. This can be framed bellow
formula as mathematical:
nyyy
nMAM nttt 11 ....)( +−− +++= (4.2)
Table 4.4: Calculating the 12th months of undershirts’ demand forecasting in Dagi
using moving average method (Assume that; n = 3).
Months (t) Executed Sale (yt) Forecasting (Ft)
Agt 2007 850 ----
Sept 2007 780 ----
Oct 2007 950 ----
Nov 2007 800 860 = (850+780+950) / 3
Dec 2007 700 843.33 = (780+950+800) / 3
Jan 2008 1293 816.66 = (950+800+700) / 3
Feb 2008 1000 931 = (800+700+1293) / 3
Mar 2008 1100 997.66 = (700+1293+1000) / 3
Apr 2008 1000 1131 = (1293+1000+1100) / 3
May 2008 900 1033.33 = (1000+1100+1000) / 3
June 2008 1050 1000 = (1100+1000+900) / 3
July 2008 --- 983.33 = (1000+900+1050) / 3
33.9833
105090010003
)3( 9101112 =
++=
++==
yyyFMAM
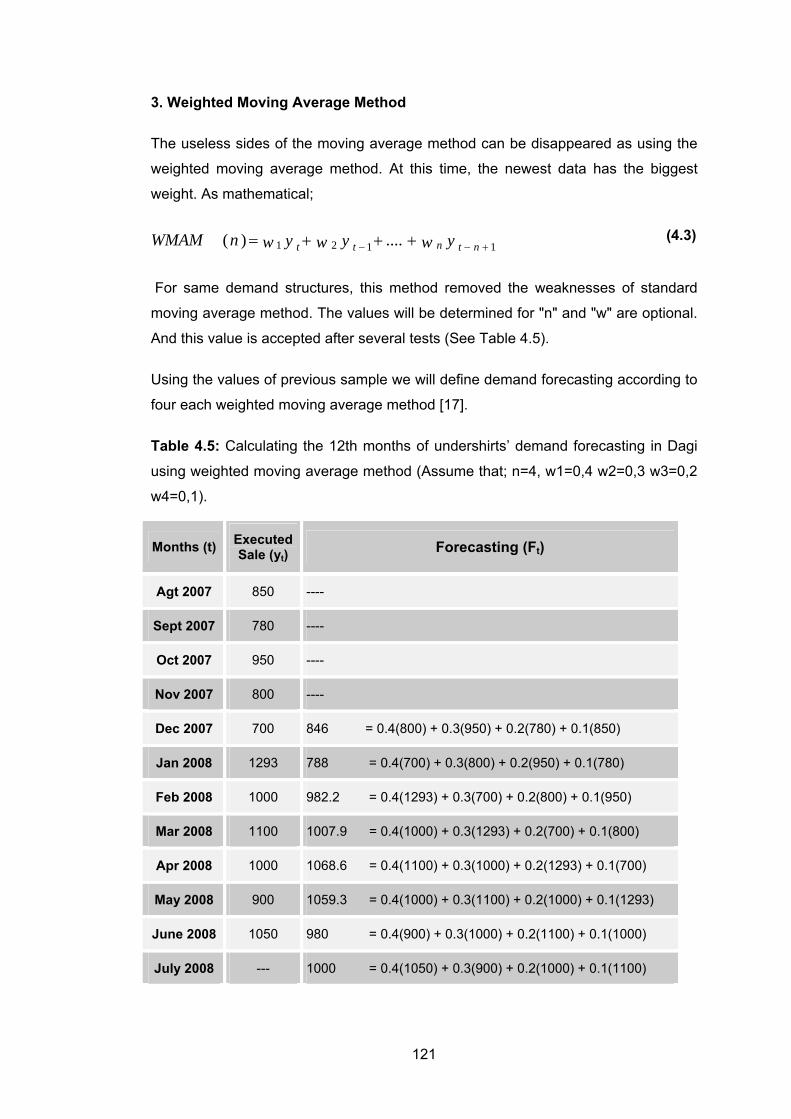
121
3. Weighted Moving Average Method
The useless sides of the moving average method can be disappeared as using the
weighted moving average method. At this time, the newest data has the biggest
weight. As mathematical;
ywywywnWMAM ntntt 1121 ....)( +−− +++= (4.3)
For same demand structures, this method removed the weaknesses of standard
moving average method. The values will be determined for "n" and "w" are optional.
And this value is accepted after several tests (See Table 4.5).
Using the values of previous sample we will define demand forecasting according to
four each weighted moving average method [17].
Table 4.5: Calculating the 12th months of undershirts’ demand forecasting in Dagi
using weighted moving average method (Assume that; n=4, w1=0,4 w2=0,3 w3=0,2
w4=0,1).
Months (t) Executed Sale (yt) Forecasting (Ft)
Agt 2007 850 ----
Sept 2007 780 ----
Oct 2007 950 ----
Nov 2007 800 ----
Dec 2007 700 846 = 0.4(800) + 0.3(950) + 0.2(780) + 0.1(850)
Jan 2008 1293 788 = 0.4(700) + 0.3(800) + 0.2(950) + 0.1(780)
Feb 2008 1000 982.2 = 0.4(1293) + 0.3(700) + 0.2(800) + 0.1(950)
Mar 2008 1100 1007.9 = 0.4(1000) + 0.3(1293) + 0.2(700) + 0.1(800)
Apr 2008 1000 1068.6 = 0.4(1100) + 0.3(1000) + 0.2(1293) + 0.1(700)
May 2008 900 1059.3 = 0.4(1000) + 0.3(1100) + 0.2(1000) + 0.1(1293)
June 2008 1050 980 = 0.4(900) + 0.3(1000) + 0.2(1100) + 0.1(1000)
July 2008 --- 1000 = 0.4(1050) + 0.3(900) + 0.2(1000) + 0.1(1100)
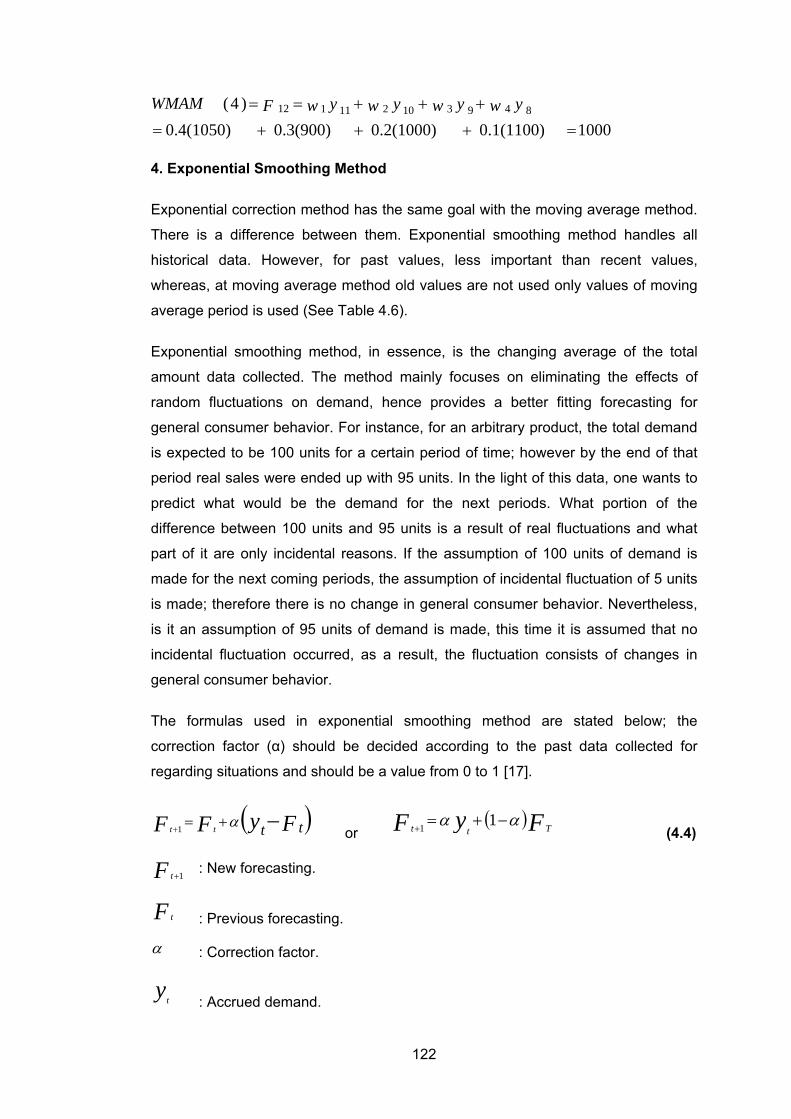
122
10000.1(1100) 0.2(1000) 0.3(900) 0.4(1050))4( 849310211112
=+++=
+++== ywywywywFWMAM
4. Exponential Smoothing Method
Exponential correction method has the same goal with the moving average method.
There is a difference between them. Exponential smoothing method handles all
historical data. However, for past values, less important than recent values,
whereas, at moving average method old values are not used only values of moving
average period is used (See Table 4.6).
Exponential smoothing method, in essence, is the changing average of the total
amount data collected. The method mainly focuses on eliminating the effects of
random fluctuations on demand, hence provides a better fitting forecasting for
general consumer behavior. For instance, for an arbitrary product, the total demand
is expected to be 100 units for a certain period of time; however by the end of that
period real sales were ended up with 95 units. In the light of this data, one wants to
predict what would be the demand for the next periods. What portion of the
difference between 100 units and 95 units is a result of real fluctuations and what
part of it are only incidental reasons. If the assumption of 100 units of demand is
made for the next coming periods, the assumption of incidental fluctuation of 5 units
is made; therefore there is no change in general consumer behavior. Nevertheless,
is it an assumption of 95 units of demand is made, this time it is assumed that no
incidental fluctuation occurred, as a result, the fluctuation consists of changes in
general consumer behavior.
The formulas used in exponential smoothing method are stated below; the
correction factor (α) should be decided according to the past data collected for
regarding situations and should be a value from 0 to 1 [17].
( )FyFF tttt −+=+
α1 or ( )FyF Ttt αα −+=
+11 (4.4)
Ft 1+ : New forecasting.
Ft : Previous forecasting.
α : Correction factor.
yt : Accrued demand.
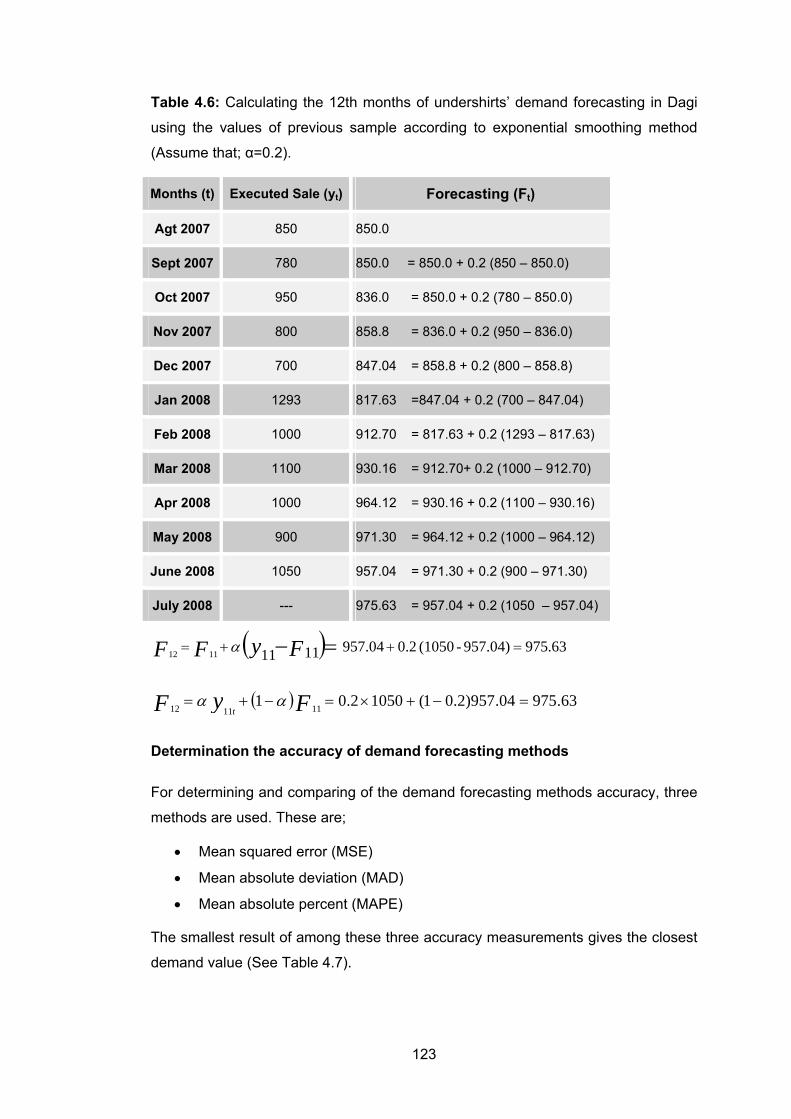
123
Table 4.6: Calculating the 12th months of undershirts’ demand forecasting in Dagi
using the values of previous sample according to exponential smoothing method
(Assume that; α=0.2).
Months (t) Executed Sale (yt) Forecasting (Ft)
Agt 2007 850 850.0
Sept 2007 780 850.0 = 850.0 + 0.2 (850 – 850.0)
Oct 2007 950 836.0 = 850.0 + 0.2 (780 – 850.0)
Nov 2007 800 858.8 = 836.0 + 0.2 (950 – 836.0)
Dec 2007 700 847.04 = 858.8 + 0.2 (800 – 858.8)
Jan 2008 1293 817.63 =847.04 + 0.2 (700 – 847.04)
Feb 2008 1000 912.70 = 817.63 + 0.2 (1293 – 817.63)
Mar 2008 1100 930.16 = 912.70+ 0.2 (1000 – 912.70)
Apr 2008 1000 964.12 = 930.16 + 0.2 (1100 – 930.16)
May 2008 900 971.30 = 964.12 + 0.2 (1000 – 964.12)
June 2008 1050 957.04 = 971.30 + 0.2 (900 – 971.30)
July 2008 --- 975.63 = 957.04 + 0.2 (1050 – 957.04)
( ) 63.975957.04) - (1050 0.2 957.0411111112 =++= =−FyFF α
( ) 63.97504.957)2.01(10502.01 111112 =−+×=−+= FyF tαα
Determination the accuracy of demand forecasting methods
For determining and comparing of the demand forecasting methods accuracy, three
methods are used. These are;
• Mean squared error (MSE)
• Mean absolute deviation (MAD)
• Mean absolute percent (MAPE)
The smallest result of among these three accuracy measurements gives the closest
demand value (See Table 4.7).
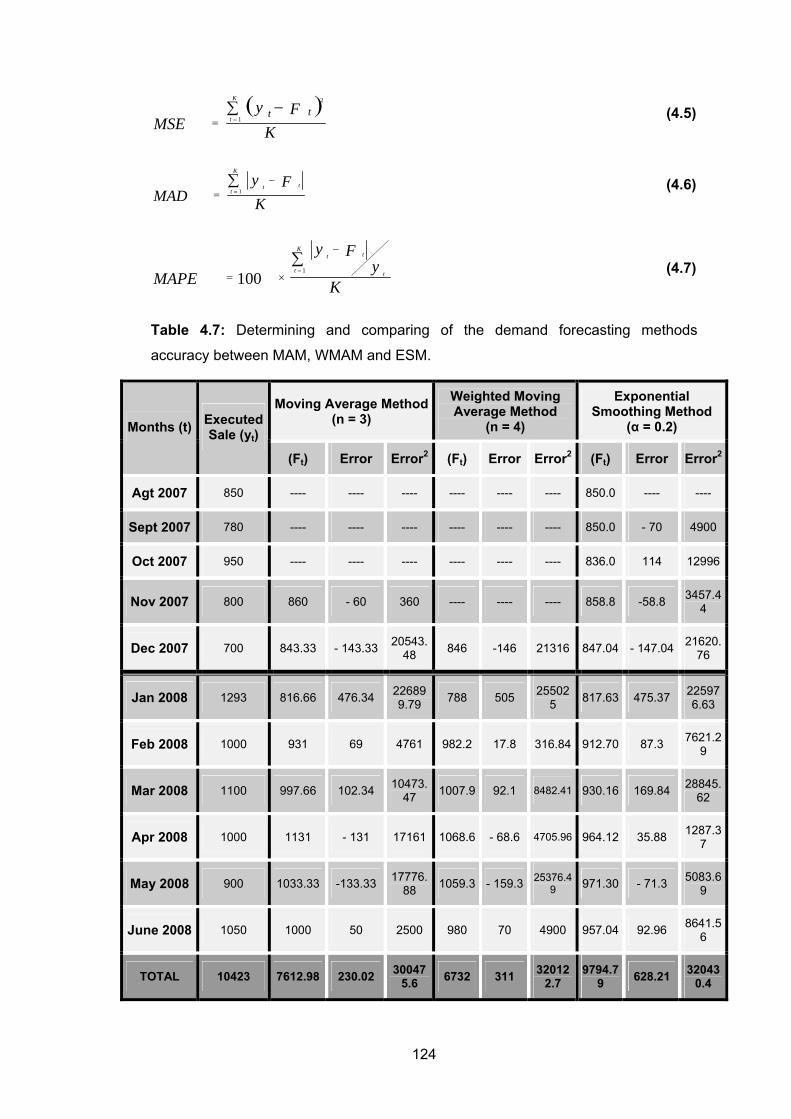
124
( )K
FyMSE
K
ttt∑ −
== 1
2
(4.5)
KFy
MAD
K
ttt∑
=
−= 1 (4.6)
Ky
Fy
MAPE
K
t t
tt∑=
−
×=1
100 (4.7)
Table 4.7: Determining and comparing of the demand forecasting methods
accuracy between MAM, WMAM and ESM.
Moving Average Method(n = 3)
Weighted Moving Average Method
(n = 4)
Exponential Smoothing Method
(α = 0.2) Months (t) Executed Sale (yt)
(Ft) Error Error2 (Ft) Error Error2 (Ft) Error Error2
Agt 2007 850 ---- ---- ---- ---- ---- ---- 850.0 ---- ----
Sept 2007 780 ---- ---- ---- ---- ---- ---- 850.0 - 70 4900
Oct 2007 950 ---- ---- ---- ---- ---- ---- 836.0 114 12996
Nov 2007 800 860 - 60 360 ---- ---- ---- 858.8 -58.8 3457.44
Dec 2007 700 843.33 - 143.33 20543.48 846 -146 21316 847.04 - 147.04 21620.
76
Jan 2008 1293 816.66 476.34 226899.79 788 505 25502
5 817.63 475.37 225976.63
Feb 2008 1000 931 69 4761 982.2 17.8 316.84 912.70 87.3 7621.29
Mar 2008 1100 997.66 102.34 10473.47 1007.9 92.1 8482.41 930.16 169.84 28845.
62
Apr 2008 1000 1131 - 131 17161 1068.6 - 68.6 4705.96 964.12 35.88 1287.37
May 2008 900 1033.33 -133.33 17776.88 1059.3 - 159.3 25376.4
9 971.30 - 71.3 5083.69
June 2008 1050 1000 50 2500 980 70 4900 957.04 92.96 8641.56
TOTAL 10423 7612.98 230.02 300475.6 6732 311 32012
2.7 9794.7
9 628.21 320430.4
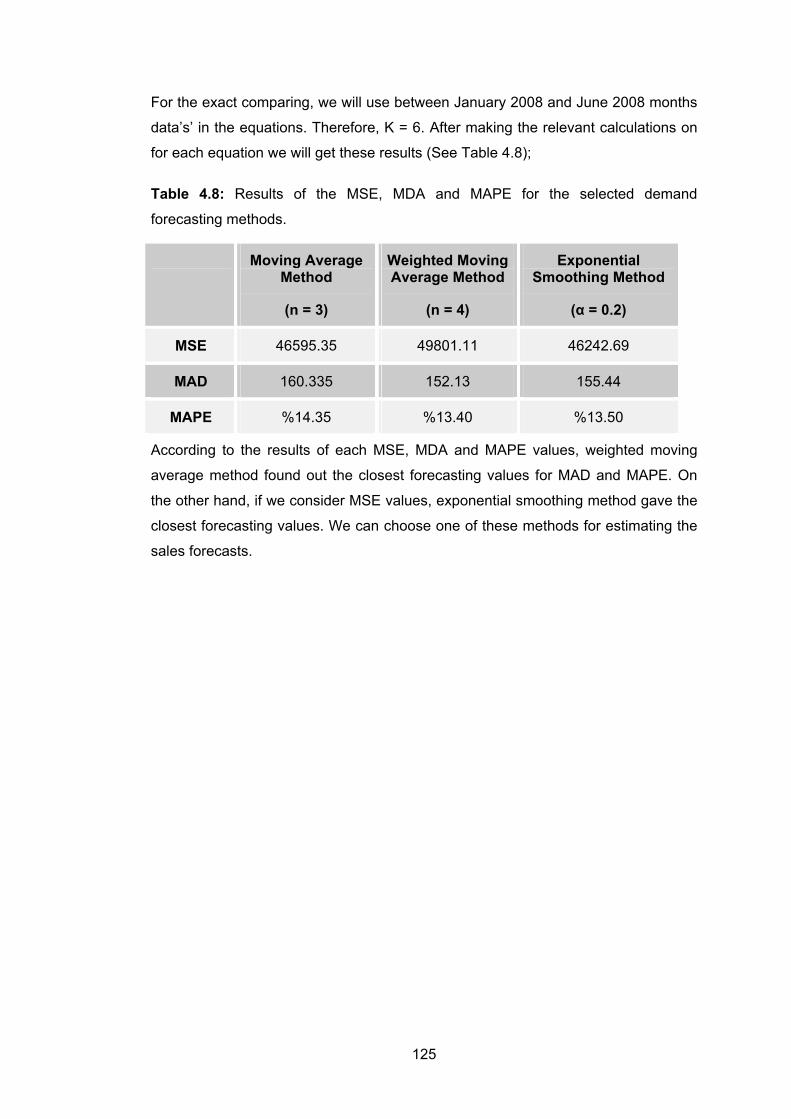
125
For the exact comparing, we will use between January 2008 and June 2008 months
data’s’ in the equations. Therefore, K = 6. After making the relevant calculations on
for each equation we will get these results (See Table 4.8);
Table 4.8: Results of the MSE, MDA and MAPE for the selected demand
forecasting methods.
Moving Average Method
(n = 3)
Weighted Moving Average Method
(n = 4)
Exponential Smoothing Method
(α = 0.2)
MSE 46595.35 49801.11 46242.69
MAD 160.335 152.13 155.44
MAPE %14.35 %13.40 %13.50
According to the results of each MSE, MDA and MAPE values, weighted moving
average method found out the closest forecasting values for MAD and MAPE. On
the other hand, if we consider MSE values, exponential smoothing method gave the
closest forecasting values. We can choose one of these methods for estimating the
sales forecasts.
126
5. CONCLUSION
The companies which design, produce, and deliver a product to market, make up
the supply chain. Supply chain management is the management of the various
phases of production, inventory, location, and transportation among the, companies
involved, in a supply chain to achieve the most efficient and responsive service of
the market. The prime purpose of supply chain management is to boost sales of
goods and services to the end user while at the same time achieving minimal
inventory and operating expenses.
Vertical integration was the business model that resulted from the industrial
economy; this has been replaced by “virtual integration” of the companies in a
supply chain. Companies now focus on their core competencies and seek to form
partnerships with other companies that have complementary aptitude for the design
and delivery of products to market. Companies must strive to streamline their core
competencies to keep ahead of the rest of the market.
Companies must bring into line their supply chains with the demands of the markets
in order to remain competitive in today’s economy. Companies who excel in Supply
chain performance have a competitive advantage in the market. Dagi, located in
Turkey, is one such company which has supply chain management envied by its
competitors, and has achieved steady growth over the last 25 years, which can be
directly attributed to its ever evolving capabilities to continually improve its supply
chain.
According to the 11-months data of sales which is taken from Dagi in terms of
scientific based tools, anticipating 12-months data of sales is a possibility that eases
the managers’ role to take decisions and also improves the quality of management.
The impulsive force of the investments in production necessitates determinism of
demand and investments come into being as a function of demand’s accuracy and
quality. The success of textile firms is very similar to other manufacturing companies
in which very big investments are made regarding how the sources of supply are
aligned to demand conditions. Accredited and accurate demand approximations are
necessary for the effective planning about all the functions in relation to the textile
127
sector, especially production, planning and sales. In our case we have implemented
scientific forecasting approach that enable a textile company to forecast the market
demand with high accuracy. Formerly the company was trying to forecast the
demand almost by intuition and many inaccuracies were occurring. During the thesis
study we have determined the demand pattern and found out the right forecasting
technique. Thanks to our suggested model the company will from now on precisely
forecast the market demand thus will improve its investments and also production
schedules and satisfaction level of their customers.
128
REFERENCES
[1] Chopra, S. and Meindl, P., 2004. Supply Chain Management: Strategy,
Planning, and Operations, Pearson Education, Inc., New Jersey.
[2] Hugos, M., 2003. Essentials of Supply Chain Management, John Wiley & Sons,
Inc., Hoboken, New Jersey.
[3] Smith, J. M., 2002. Manufacturing Engineering Modular Series: Logistics & the
Out-bound Supply Chain, Penton Press, London.
[4] Lambert, D. M., James R. S., and Lisa M. E., 1998. Fundamentals of Logistics
Management, Boston, MA: Irwin/McGraw-Hill, Chapter 14.
[5] Ganeshan, R. and Terry P. H., 1995. An Introduction to Supply Chain
Management, Department of Management Sciences and Information
Systems, 303 Beam Business Building, Penn State University,
University Park, PA.
[6] Url-1 <http://silmaril.smeal.psu.edu/supply_chain_intro.html>, accessed at
01.05.2008.
[7] Mentzer, J. T., DeWitt, W., Deebler, J., Min, S., Nix, N. W., Smith, C. D., and Zacharia, Z. G., 2001. Defining Supply Chain Management, Journal
of Business Logistics, Vol.22, No.2, p.18-35.
[8] Goldratt, E. M., 1984. The Goal, Great Barrington, MA: The North River Press
Publishing Corporation.
[9] Bolstorff, P., and Rosenbaum, R., 2003. Supply Chain Excellence: A
Handbook for Dramatic Improvement Using the SCOR Model, ISBN:
0814407307, AMACOM.
[10] Supply-Chain Council, 2005. Supply-Chain Operations Reference-model,
Supply-Chain Council, SCOR Version 7.0, www.supply-chain.org.
129
[11] ÇAPAR, İ., 2002. A Supply Chain Performance Measurement System: A Case
Study in Automotive Industry, Msc Thesis, Graduate School of
Engineering and Natural Sciences, Sabanci University, Istanbul,
Turkey.
[12] Huang, S. H., Sheoran, S. K., and Keskar, H., 2005. Computer-assisted
supply chain configuration based on supply chain operations
reference (SCOR) model, Computers & Industrial Engineering Vol. 48
p. 377–394.
[13] Persson, F., and Araldi, M., 2007. The development of a dynamic supply
chain analysis tool—Integration of SCOR and discrete event
simulation, International Journal of Production Economics.
[14] Chase P. R., Beyond CRM: The Critical Path to Successful Demand Chain
Management.
[15] Url-2 <www.clarkstongroup.com>, accessed at 01.05.2008.
[16] Karaahmetoğlu, Z., 2004. DAMA Model in Supply Chain Management, Msc
Thesis, ITU, Istanbul.
[17] Bowersox, D.J., and Closs, D.J., 1996. Logistic Management (The Integrated
Supply Chain Process), The Mac Graw-Hill Comp.Inc. New York.
[18] Navaretti, G.B., Falzoni, A., Turrini, A., 2001. The decision to invest in a low-
wage country: Evidence from Italian textiles and clothing
multinationals, Journal of International Trade and Economic
Development, Vol. 10, p. 451-70.
[19] Gereffi, G., 2001. Global sourcing in the US apparel industry, Journal of Textile
and Apparel, Technology and Management, Vol. 2, p.1-5.
[20] Abernathy, F.H., Dunlop, J.T., Hammond, J.H. and Weil, D, 1999. Lean
Retailing and the Transformation of Manufacturing – Lessons from
the Textile and Apparel Industries, Oxford: Oxford University Press.
[21] Kelegama, S. and Foley, F., 1999. Impediments to promoting backward
linkages from the garment industry in Sri Lanka, World Development
27, 8: 1445-1460.
130
[22] Bair, J. and Gereffi, G., 2001. Local clusters in global chains: The causes and
consequences of export dynamism in Torreon's blue jeans industry,
World Development 29, 11: 1885-1903.
[23] Porter, M. E., 1998. Competitive Strategy – Techniques for Analyzing
Industries and Competitors, New York: Simon and Schuster Trade
Division.
[24] Cooper, M. C.; Lambert, Douglas, M.; Pagh, Janus, D., 1997. Supply Chain
Management: More Than a New Name for Logistics, in: The
International Journal of Logistics Management, Vol. 8, No. 1, p. 1-14.
[25] Handfield, Robert B.; Nichols, Ernest L. Jr., 1999. Introduction to Supply
Chain Management, Prentice Hall, Upper Saddle River/New Jersey.
[26] Seuring, S., 2000. A Framework for Green Supply Chain Costing - A Fashion
Industry Example, in: Sarkis, Joseph (ed.): Green Manufacturing and
Operations -From Design to Delivery and Back, Greenleaf Publishing,
Sheffield.
[27] Ebers, M.; Gotsch, W., 1995. Institutionenökonomische Theorien der
Organization, in: Kieser, Alfred (ed.): Organisationstheorien,
Kohlhammer, Stuttgart, Berlin, and Köln.
[28] Richter, R.; Furubotn, E., 1999. Neue Institutionenökonomik, Eine Einführung
und kritische Würdigung, Mohr, Siebeck, Tübingen.
[29] Jensen, M. C.; Meckling, W. H., 1976. Theory of the Firm: Managerial
Behavior, Agency Costs and Ownership Structure, in: Journal of
Financial Economics, Vol. 3, p. 305-360.
[30] Schulz von Thun, Friedemann, 1998a. Miteinander Reden Band 1 Störungen
und Klärungen, einmalige Sonderausgabe, Rowohlt,
Reinbek/Hamburg.
[31] Schulz von Thun, Friedemann, 1998b. Miteinander Reden Band 3 Das
“innere Team” und situationsgerechte Kommunikation, Rowohlt,
Reinbek/Hamburg.
131
[32] Seidenschwarz, W.; Esser, J.; Niemand, S.; Rauch, M., 1997. Target
Costing: Auf dem Weg zum marktorientierten Unternehmen, in:
Franz, K.-P.; Kajüter, P. (ed.): Kostenmanagement -
Wettbewerbsvorteile durch systematische Kostensteuerung,
Schaeffer-Poeschel Verlag, Stuttgart, Berlin, Köln, p. 101-126.
[33] Kucher, E.; Simon, H., 1997. Market Pricing als Basis des Target Costing, in:
Franz, K.-P.; Kajüter, P. (ed.): Kostenmanagement -
Wettbewerbsvorteile durch systematische Kostensteuerung,
Schaeffer-Poeschel Verlag, Stuttgart, Berlin, Köln, p. 141-161.
[34] Myers, D.; Stolton, S., 1999. Organic Cotton - From Field to Final Product,
Intermediate Technology Publications.
[35] Cooper, R.; Slagmulder, R., 1999. Supply Chain Development for the Lean
Enterprise - Interorganizational Cost Management, IMA Foundation
for Applied Research, Montvale.
[36] Goldbach, M., 2000. Organizational Impacts on Supply Chain Costing, Oikos
PhD Summer Academy in St Galen, Institute for Business
Administration, Carl von Ossietzky University of Oldenburg,
Oldenburg, Germany.
[37] Abernathy F. H., Dunlop J. T., Hammond J. H., and Weil D., 1999. A stitch in
time—lean retailing and the transformation of manufacturing—
lessons from the apparel and textile industries. New York: University
Press.
[38] Myers D., Stolton S., 1999. Organic cotton—from field to final product.
London: Intermediate Technology Publications.
[39] Forza C., Pietro R., Vinelli A., 2000. Information technology for managing the
textile apparel chain: current use, shortcomings and development
directions international. Journal of Logistics 3(3):227–43.
[40] Fisher M., Hammond J., Obermeyer W., 1994. Raman A. Managing supply
meet demand in an uncertain world. Harvard Business Review
72(5/6):83–93.
132
[41] Schmidt K., 1999. Zur ökologischen Produktbewertung in der Textilund
Bekleidungs-industrie—theoretische Grundlagen und praktische
Umsetzung. Universitat Witten/Herdecke.
[42] Thier-Grebe R., Rabe M., 2000. Polyester with new titanium dioxide catalyst.
Melliand International 6(4):4–7.
[43] Dönnebring H., 1998. Die Sammlung und Verwertung von Alttextilien—eine
empirische Analyse vor dem Hintergrund des Kreislaufwirtschafts-
und Abfallgesetzes. FATM, Münster.
[44] Seuring S., 2004. Integrated chain management and supply chain
management comparative analysis and illustrative cases, Journal of
Cleaner Production 12 p.1059–1071.
[45] www.bridge-project.eu, Building Radio frequency IDentification for the Global
Environment, Supply Chain Management in the European Textile
industry, Problem analysis and expected EPC/RFID benefits,
Authors: GS1 Germany & WP7 partners, Retrieved July 11, 2007.
[46] Kavaklı, A. I., 2008, Personal interview.
[47] Uygar, T., 2008, Personal interview.
[48] Tahniscioğlu, H., 2008, Personal interview.
[49] Özçoban, G. S., 2008, Personal interview.
[50] Ayanoğlu, F., 2008, Personal interview.
[51] Topçu, K., 2008, Personal interview.
[52] Başlandı, K., 2008, Personal interview.
[53] Sunter, E., 2008, Personal interview.
133
RESUME
Sermet SARIÜNAL was born in 1979 in Balıkesir. After graduating from Balıkesir
High School he received his Bachelor of Science degree in Textile Engineering from
Istanbul Technical University in 2004. Since 2004, he has been attending to the
Master of Science degree in Textile Engineering at Istanbul Technical University.