Investment abroad and adjustment at home: evidence from UK multinational firms
Helen SimpsonCMPO, IFS and Nuffield College, Oxford
This work contains statistical data from ONS, which is Crown copyright and reproduced with the permission of the controller of HMSO and Queen's Printer for Scotland. The use of the ONS statistical data in this work does not imply the endorsement of the ONS in relation to the interpretation or analysis of the statistical data. This work uses research datasets which may not exactly reproduce National Statistics aggregates. All errors are my responsibility.

Research question
• The broad question: “How does investment in low-wage economies affect firms’ home-country operations?”
• My approach: – Focus on changes in within-firm industrial structure driven by plant closures– Is outward investment in relatively low-wage economies associated with plant
closures at home in low-skill, labour-intensive industries?
Outline of talk
• Motivation• Theoretical background and related literature
– On home country effects of investment abroad– On plant exit
• Estimation approach• Data
– On outward FDI– On firm demographics
• Results• Conclusions and discussion

Motivation
• The news headlines: plant closures and re-locations to lower cost locations
• Multinationals account for a significant proportion of employment– US MNEs 26% manufacturing employment in the US– UK MNEs 20% manufacturing employment in UK, foreign-owned MNEs
a further 25%
• Increased FDI into low-wage economies– China’s accession to WTO lifted constraints on inward FDI– EU accession countries become more attractive location for FDI within
Europe
• Contribution to the literature: bring together two strands of the literature on multinational activity– On effects of vertical FDI on skill-intensity of employment– On exit and mobility of plants owned by multinationals

Theoretical background
• Horizontal versus vertical outward FDI
• Horizontal FDI (Markusen, 1984, Brainard,1997))
– FDI a substitute for exports to serve overseas markets– Replication of all stages of production or downstream production abroad in
proximity to consumers– Could lead to increase in the skill-intensity of the firms’ activities at home– But should occur irrespective of characteristics of countries in which
outward investment occurs
• Vertical FDI (Helpman 1984, 1985)
– Locating stages of production, or products, within the firm according to countries’ comparative advantage – skill-intensive industries being located in skill-abundant economies
– Investment in a low-wage economy associated with increase in skill-intensity of activities at home through the relocation of low-skill activities abroad
– For vertical FDI, changes in the skill-intensity of production should vary systematically with the characteristics of the host economy

Examples of existing empirical literature
• On vertical FDI
– Head and Ries (2002) look at effects of investment in low-wage economies using data on Japanese MNEs
– Find it is associated with increased skill-intensity of production in firms’ Japanese operations & increased purchases of imported goods
– But don’t look at how the increase in skill-intensity of home production comes about
– Brainard and Riker (1997) and Riker and Brainard (1997) find evidence consistent with vertical FDI
– Labour in affiliates in high-income countries substitutes, and a complement to labour in low-income countries; labour in low-wage economies competes to carry out activities most sensitive to labour costs
• On plant exit and multinationals
– Bernard and Jensen (2007) show that plants owned by multinationals are more likely to exit than other types
– Exit important adjustment margin for MNEs– But doesn’t link exit to any specific driving factor

Empirical approach
• If investment in low-wage economies is vertical FDI, and if exit is important adjustment margin, expect such investment to be associated with firms closing down plants in low-skill industries
• Use within-firm information on plant closures. Combine data on exits at the plant level and data on overseas investment at the firm level
• Carry out an analysis that compares plant exit propensities– Across different types of firms, and– Across different types of industries
• Akin to a difference-in-differences specification at a particular point in time

Probability of exit: by ownership type, and industry skill intensity
Source: author’s calculations using ARD plant population and AFDI data (source: ONS)

Estimation approach
• Probit model of plant death
• UKmneLit is an indicator for a firm investing in a low-wage economy
• Skillj is a measure of industry skill intensity
• For plants that are part of firms investing in low-wage economies, the propensity to exit is expected to be decreasing in the skill intensity of the industry in which the plant is operating
)
***
()1Pr(
321
321,
rtj
jitjitjit
ititititstit
rtInd
SkillUKmneHSkillUKmneLSkillFO
UKmneHUKmneLFOXD

Estimation approach
• For vertical FDI behaviour:
- For firms investing in low-wage economies should see higher propensity to exit among plants operating in low-skill industries compared to high-skill industries that is not mirrored in other types of firm
- Difference across firm types should be driven by a higher propensity to exit in low skill-intensity industries rather than a lower propensity to exit in high skill-intensity industries where the effects of vertical FDI are not expected to be felt
- Replace interactions with Skillj with interactions with dummy variables for third of skill-intensity distribution in which an industry lies

Data 1: Overseas investment
• Office for National Statistics (ONS) Annual Inquiry into Foreign Direct Investment (AFDI)
• Annual information at the firm level, 1998-2001 on location of overseas subsidiaries, associates and branches
• Identify low-wage economies using information on per capita GDP relative to UK.
• Main indicator: dummy variable equal to one if a firm has an affiliate in any country with per capita GDP < 10% of UK– E.g. Ghana, Angola, Togo, Ivory Coast, China, Vietnam, India,
Indonesia, Philippines, Romania, Bulgaria
• In doing so exclude FDI to tax havens– E.g. Antigua, Bahamas, Barbados, Macao, Belize
Data 2: Plants and organisational structure
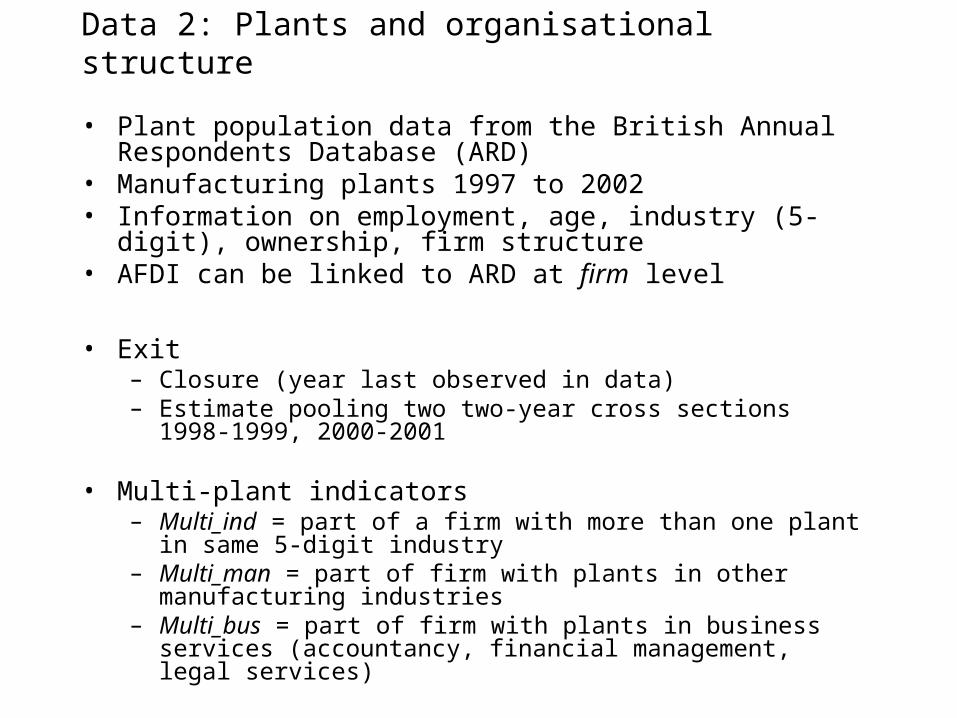
• Plant population data from the British Annual Respondents Database (ARD)
• Manufacturing plants 1997 to 2002• Information on employment, age, industry (5-digit), ownership,
firm structure• AFDI can be linked to ARD at firm level
• Exit– Closure (year last observed in data) – Estimate pooling two two-year cross sections 1998-1999, 2000-
2001
• Multi-plant indicators– Multi_ind = part of a firm with more than one plant in same 5-digit
industry– Multi_man = part of firm with plants in other manufacturing
industries– Multi_bus = part of firm with plants in business services
(accountancy, financial management, legal services)
Data 2: Plants and organisational structure
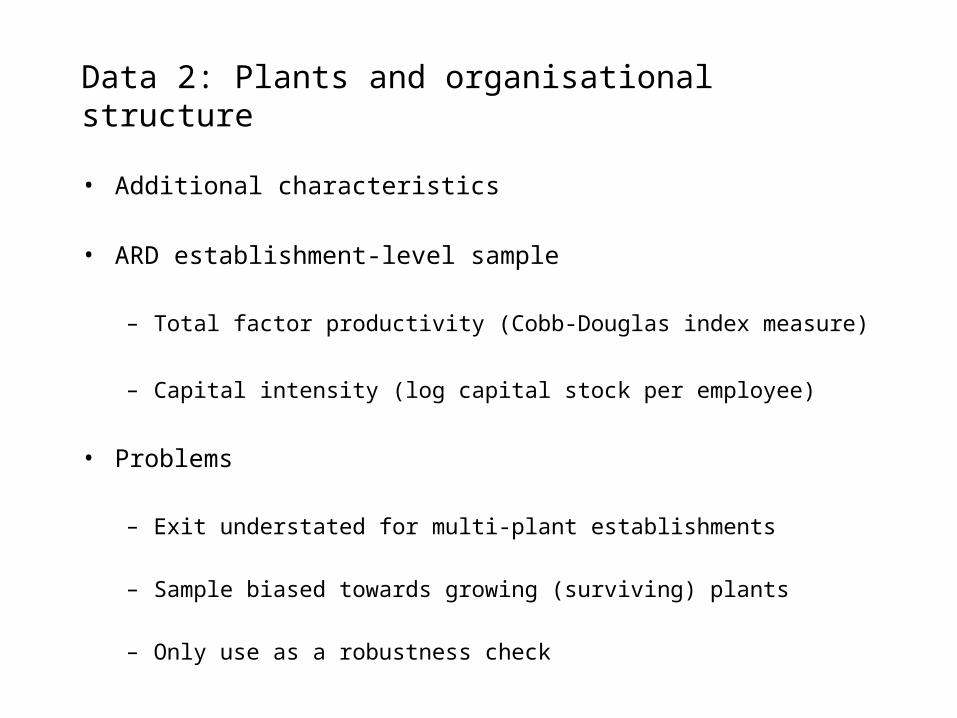
• Additional characteristics
• ARD establishment-level sample
– Total factor productivity (Cobb-Douglas index measure)
– Capital intensity (log capital stock per employee)
• Problems
– Exit understated for multi-plant establishments
– Sample biased towards growing (surviving) plants
– Only use as a robustness check
Data 3: Industry characteristics
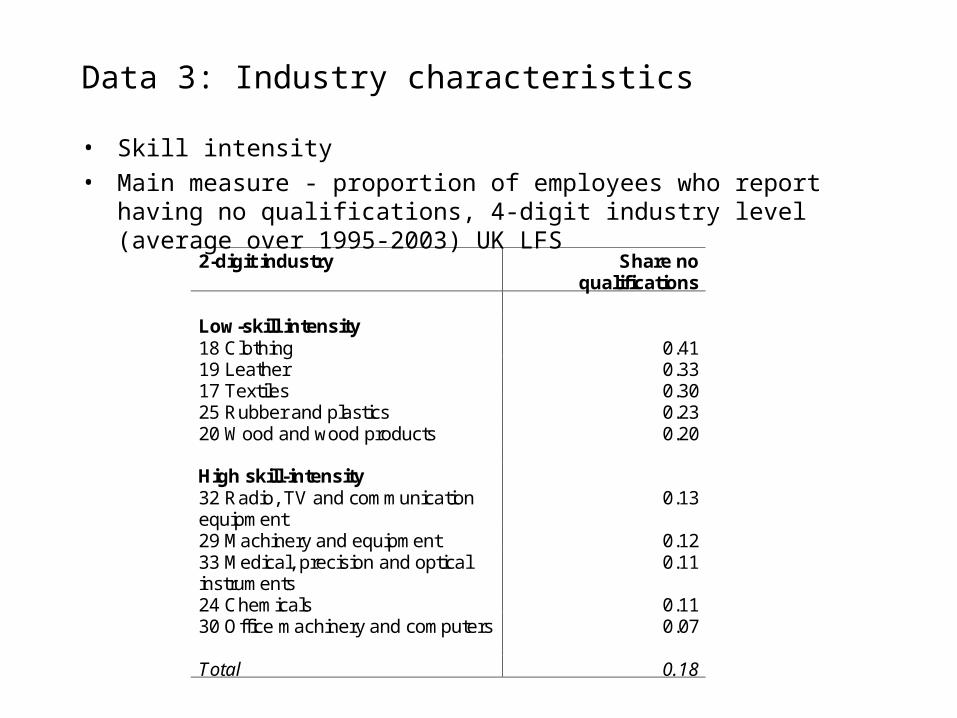
• Skill intensity
• Main measure - proportion of employees who report having no qualifications, 4-digit industry level (average over 1995-2003) UK LFS
2-digit industry Share no qualifications
Low-skill intensity 18 Clothing 0.41 19 Leather 0.33 17 Textiles 0.30 25 Rubber and plastics 0.23 20 Wood and wood products 0.20 High skill-intensity 32 Radio, TV and communication equipment
0.13
29 Machinery and equipment 0.12 33 Medical, precision and optical instruments
0.11
24 Chemicals 0.11 30 Office machinery and computers 0.07 Total 0.18

Descriptive statistics: plant populationmean
Note: cohorts of plants present in 1998 and 2000. Age truncated at 21 years Source: author’s calculations using ARD plant population and AFDI data (source: ONS) and LFS
Domestic
Foreign-MNE
Low wage UK-MNE
Not low wage UK-MNE
Observations
338,977 8,682 4,228 6,687
% exit in t or t+1
23% 23% 24% 24%
Age (years) 5.80
9.13
9.68 9.55
Employment 14.59
159.89
154.70
128.33
Multi_ind 0.11
0.61
0.86
0.72
Multi_man 0.04
0.16
0.14
0.23
Multi_bus 0.05
0.43
0.93
0.78
Mean share no qualifications 0.16
0.14
0.14
0.16
% in low / high skill industries 27% / 35% 23% / 48% 22% / 60% 34% / 40%

Results: exit probits, all plantsDependent variable=1 if exit in
t or t+1 Exit over 2 years, pooled cross sections
Marginal effects (z-statistics) All plants (1)
Ageit -0.010
(-48.15)
Ln(empment)it -0.029
(-33.03)
Multi_indit 0.047
(10.04)
Multi_manit 0.031 (6.46)
Multi_busit 0.076 (7.16)
Foreign-ownedit 0.048 (5.39)
UK-MNEit 0.030 (2.54)
Low wage UK-MNEit
Not low wage UK-MNEit
Foreign-ownedit *
4-digit share employees no qualsj
Low wage UK-MNEit * 4-digit share employees no qualsj
Not low wage UK-MNEit * 4-digit share employees no qualsj
4-digit industry dummies Yes
Region dummies Yes Time dummies Yes
LL -185432.5 Obs 358,573
Source: author’s calculations using ARD plant population and AFDI data (source: ONS) and LFS
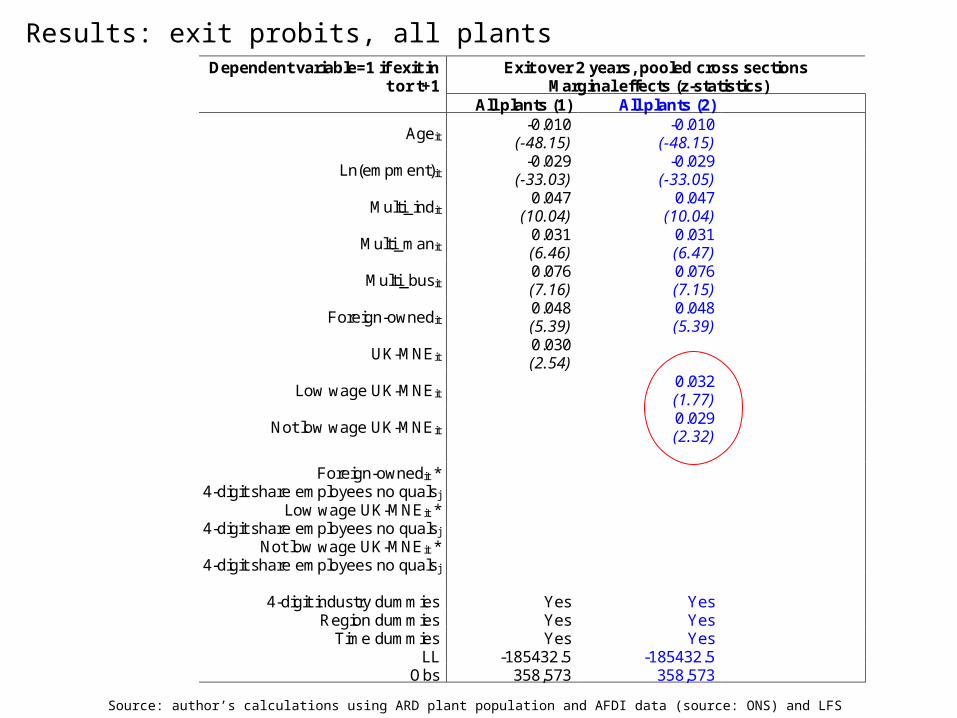
Dependent variable=1 if exit in t or t+1
Exit over 2 years, pooled cross sections Marginal effects (z-statistics)
All plants (1) All plants (2)
Ageit -0.010
(-48.15) -0.010
(-48.15)
Ln(empment)it -0.029
(-33.03) -0.029
(-33.05)
Multi_indit 0.047
(10.04) 0.047
(10.04)
Multi_manit 0.031 (6.46)
0.031 (6.47)
Multi_busit 0.076 (7.16)
0.076 (7.15)
Foreign-ownedit 0.048 (5.39)
0.048 (5.39)
UK-MNEit 0.030 (2.54)
Low wage UK-MNEit 0.032 (1.77)
Not low wage UK-MNEit 0.029 (2.32)
Foreign-ownedit *
4-digit share employees no qualsj
Low wage UK-MNEit * 4-digit share employees no qualsj
Not low wage UK-MNEit * 4-digit share employees no qualsj
4-digit industry dummies Yes Yes
Region dummies Yes Yes Time dummies Yes Yes
LL -185432.5 -185432.5 Obs 358,573 358,573
Results: exit probits, all plants
Source: author’s calculations using ARD plant population and AFDI data (source: ONS) and LFS
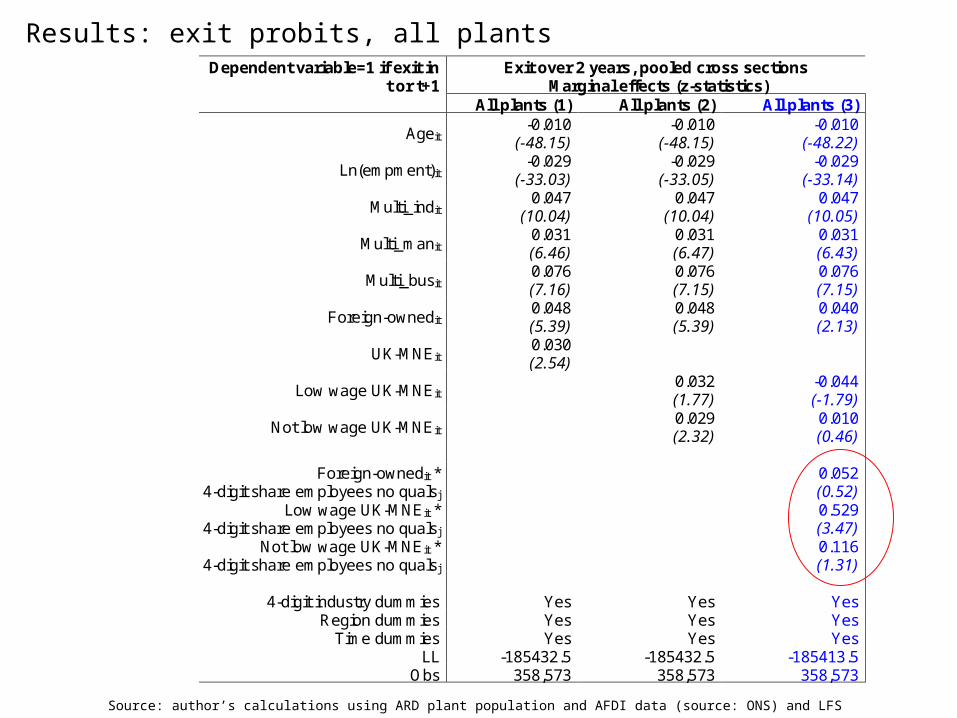
Dependent variable=1 if exit in t or t+1
Exit over 2 years, pooled cross sections Marginal effects (z-statistics)
All plants (1) All plants (2) All plants (3)
Ageit -0.010
(-48.15) -0.010
(-48.15) -0.010
(-48.22)
Ln(empment)it -0.029
(-33.03) -0.029
(-33.05) -0.029
(-33.14)
Multi_indit 0.047
(10.04) 0.047
(10.04) 0.047
(10.05)
Multi_manit 0.031 (6.46)
0.031 (6.47)
0.031 (6.43)
Multi_busit 0.076 (7.16)
0.076 (7.15)
0.076 (7.15)
Foreign-ownedit 0.048 (5.39)
0.048 (5.39)
0.040 (2.13)
UK-MNEit 0.030 (2.54)
Low wage UK-MNEit 0.032 (1.77)
-0.044 (-1.79)
Not low wage UK-MNEit 0.029 (2.32)
0.010 (0.46)
Foreign-ownedit *
4-digit share employees no qualsj
0.052 (0.52)
Low wage UK-MNEit * 4-digit share employees no qualsj
0.529 (3.47)
Not low wage UK-MNEit * 4-digit share employees no qualsj
0.116 (1.31)
4-digit industry dummies Yes Yes Yes
Region dummies Yes Yes Yes Time dummies Yes Yes Yes
LL -185432.5 -185432.5 -185413.5 Obs 358,573 358,573 358,573
Results: exit probits, all plants
Source: author’s calculations using ARD plant population and AFDI data (source: ONS) and LFS

Results: exit probits, UKMNEs
Source: author’s calculations using ARD plant population and AFDI data (source: ONS) and LFS
Dependent variable=1 if exit in t or t+1
Exit over 2 years, pooled cross sections Marginal effects (z-statistics)
UK-MNEs (1)
Ageit -0.008 (-9.80)
Ln(empment)it -0.042 (-7.33)
Multi_indit 0.107 (3.79)
Multi_manit 0.085 (2.56)
Multi_busit 0.010 (0.53)
Low wage UK-MNEit -0.072 (-2.32)
Low wage UK-MNEit * 4-digit share employees no qualsj
0.533 (2.91)
4-digit share employees no qualsj -0.147 (-0.91)
Low wage UK-MNEit * Low skillj
Low wage UK-MNEit * Medium skillj
Low skillj
Medium Skillj
2-digit industry dummies Yes Region dummies Yes
Time dummies Yes LL -5663.3
Obs 10,915

Predicted probability of exit by industry skill-intensity and firm ownership type
Source: author’s calculations using ARD plant population and AFDI data (source: ONS) and LFS
0.1
.2.3
.4.5
.6.7
0 .1 .2 .3 .4 .5 0 .1 .2 .3 .4 .5
Not low wage UK-MNE Low wage UK-MNE
Predicted exit probability Fitted values
Pre
dic
ted
exi
t p
rob
ab
ility
Industry share employees no qualifications
Graphs by ownership type

Results: exit probits, UKMNEs
Source: author’s calculations using ARD plant population and AFDI data (source: ONS) and LFS
Dependent variable=1 if exit in t or t+1
Exit over 2 years, pooled cross sections Marginal effects (z-statistics)
UK-MNEs (1) UK-MNEs (2)
Ageit -0.008 (-9.80)
-0.008 (-9.98)
Ln(empment)it -0.042 (-7.33)
-0.043 (-8.23)
Multi_indit 0.107 (3.79)
0.105 (3.71)
Multi_manit 0.085 (2.56)
0.081 (2.46)
Multi_busit 0.010 (0.53)
0.014 (0.77)
Low wage UK-MNEit -0.072 (-2.32)
-0.014 (-0.60)
Low wage UK-MNEit * 4-digit share employees no qualsj
0.533 (2.91)
4-digit share employees no qualsj -0.147 (-0.91)
Low wage UK-MNEit * Low skillj
0.079 (2.38)
Low wage UK-MNEit * Medium skillj
0.015 (0.38)
Low skillj
0.010 (0.36)
Medium Skillj
0.031 (1.32)
2-digit industry dummies Yes Yes Region dummies Yes Yes
Time dummies Yes Yes LL -5663.3 -5662.3
Obs 10,915 10,915

Results
• Older plants less likely to exit• Larger plants less likely to exit• Plants that are part of multi-plant firms more likely to exit• Plants owned by MNEs more likely to exit
• Plants in low-skill intensity industries owned by UKMNEs investing in low-wage economies are more likely to close down compared to those owned by UKMNEs that are not
• Using specification with interactions with industry skill-intensity dummies– Plants in the lowest skill-intensity sectors owned by UKMNEs investing in low-
wage economies are nearly 8ppts more likely to exit that those owned by other UKMNEs
– This is not the case in other parts of the industry skill intensity distribution

Robustness I: alternative definitions of investment in low-wage economies
Source: author’s calculations using ARD plant population and AFDI data (source: ONS) and LFS
Dependent variable=1 if exit in t or t+1 UK-MNEs
(< 5% UK GDP per
capita)
UK-MNEs
(< 25% UK GDP per
capita)
Low wage UK-MNEit -0.066 (-2.11)
-0.064 (-2.07)
Low wage UK-MNEit * 4-digit industry share employees no qualsj
0.522 (2.88)
0.451 (2.59)
Eastern Europeit
Africait
South and East Asiait
Eastern Europeit * 4-digit industry share employees no quals j
Africait * 4-digit industry share employees no quals j
South and East Asiait * 4-digit industry share employees no quals j
4-digit industry share employees no qualsj -0.127 (-0.76)
-0.160 (-0.96)
Controls: Ageit, Ln(empment)it, Multi_indit,
Multi_manit, Multi_busit Yes Yes
2-digit industry dummies Yes Yes Region dummies Yes Yes
Time dummies Yes Yes LL -5663.5 -5665.8
Obs 10,915 10,915

Robustness I: alternative definitions of investment in low-wage economies
Source: author’s calculations using ARD plant population and AFDI data (source: ONS) and LFS
Dependent variable=1 if exit in t or t+1 UK-MNEs
(< 5% UK GDP per
capita)
UK-MNEs
(< 25% UK GDP per
capita)
UK-MNEs
(Country groups)
Low wage UK-MNEit -0.066 (-2.11)
-0.064 (-2.07)
Low wage UK-MNEit * 4-digit industry share employees no qualsj
0.522 (2.88)
0.451 (2.59)
Eastern Europeit
0.046 (1.16)
Africait
0.012 (0.32)
South and East Asiait
-0.105 (-2.80)
Eastern Europeit * 4-digit industry share employees no quals j
-0.217 (-1.08)
Africait * 4-digit industry share employees no quals j
0.116 (0.54)
South and East Asiait * 4-digit industry share employees no quals j
0.606 (2.65)
4-digit industry share employees no qualsj -0.127 (-0.76)
-0.160 (-0.96)
-0.184 (-1.13)
Controls: Ageit, Ln(empment)it, Multi_indit,
Multi_manit, Multi_busit Yes Yes Yes
2-digit industry dummies Yes Yes Yes Region dummies Yes Yes Yes
Time dummies Yes Yes Yes LL -5663.5 -5665.8 -5656.6
Obs 10,915 10,915 10,915

Robustness II: alternative measures of skill intensity
Source: author’s calculations using ARD plant population, establishment sample and AFDI data (source: ONS), LFS, ASHE
Dependent variable=1 if exit in t or t+1
UK-MNEs
Capital intensity
(ARD)
(1)
UK-MNEs
Skilled workers wagebill
share (ARD)
(2)
UK-MNEs
Mean annual
wage (ARD)
(3)
UK-MNEs
Mean hourly pay
(ASHE)
(4)
UK-MNEs
Share degree
(LFS)
(5) Low wage UK-MNEit 0.066
(2.68)
0.095 (1.89)
0.044 (0.54)
0.037 (0.40)
0.004 (0.16)
Low wage UK-MNEit * Industry characteristic
-0.0007 (-3.65)
-0.175 (-1.78)
-0.002 (-0.49)
-0.003 (-0.33)
0.038 (0.27)
Industry characteristic -0.0001 (-1.24)
-0.205 (-2.86)
0.004 (1.03)
-0.002 (-0.23)
-0.130 (-1.27)
Controls: Ageit,
Ln(empment)it,
Multi_indit,
Multi_manit,
Multi_busit
Yes Yes Yes Yes Yes
2-digit industry dummies
Yes Yes Yes Yes
Yes
Region dummies Yes Yes Yes Yes Yes Time dummies Yes Yes Yes Yes Yes LL -5649.7 -5652.6 -5672.7 -5673.5 -5672.0 Obs 10,915 10,915 10,915 10,915 10,915

Robustness III: controlling for TFP, capital intensity, establishment sample
Source: author’s calculations using ARD establishment sample and AFDI data (source: ONS) and LFS
Dependent variable=1 if exit in t or t+1
All estabs
(1)
Ln (K/L) it -0.005 (-1.53)
Ln (TFP) it -0.009 (-2.00)
Foreign-ownedit 0.025 (2.55)
Low wage UK-MNEit 0.066 (3.31)
Not low wage UK-MNEit 0.023 (1.87)
Foreign-ownedit * 4-digit share employees no qualsj
Low wage UK-MNEit * 4-digit share employees no quals j
Not low wage UK-MNEit * 4-digit share employees no quals j
4-digit share employees no quals j
Controls: Ageit, Ln(empment)it,
Multi_indit, Multi_manit, Multi_busit Yes
2-digit industry dummies Yes Region dummies Yes Time dummies Yes LL -4505.7 Obs 13,387
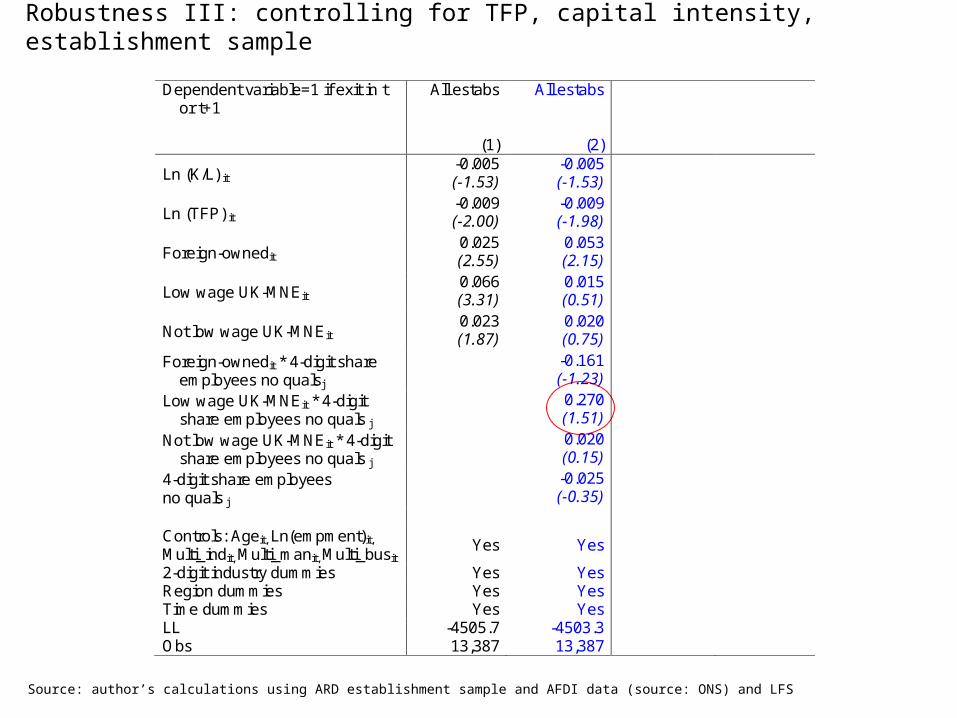
Robustness III: controlling for TFP, capital intensity, establishment sample
Source: author’s calculations using ARD establishment sample and AFDI data (source: ONS) and LFS
Dependent variable=1 if exit in t or t+1
All estabs
(1)
All estabs
(2)
Ln (K/L) it -0.005 (-1.53)
-0.005 (-1.53)
Ln (TFP) it -0.009 (-2.00)
-0.009 (-1.98)
Foreign-ownedit 0.025 (2.55)
0.053 (2.15)
Low wage UK-MNEit 0.066 (3.31)
0.015 (0.51)
Not low wage UK-MNEit 0.023 (1.87)
0.020 (0.75)
Foreign-ownedit * 4-digit share employees no qualsj
-0.161 (-1.23)
Low wage UK-MNEit * 4-digit share employees no quals j
0.270 (1.51)
Not low wage UK-MNEit * 4-digit share employees no quals j
0.020 (0.15)
4-digit share employees no quals j
-0.025 (-0.35)
Controls: Ageit, Ln(empment)it,
Multi_indit, Multi_manit, Multi_busit Yes Yes
2-digit industry dummies Yes Yes Region dummies Yes Yes Time dummies Yes Yes LL -4505.7 -4503.3 Obs 13,387 13,387
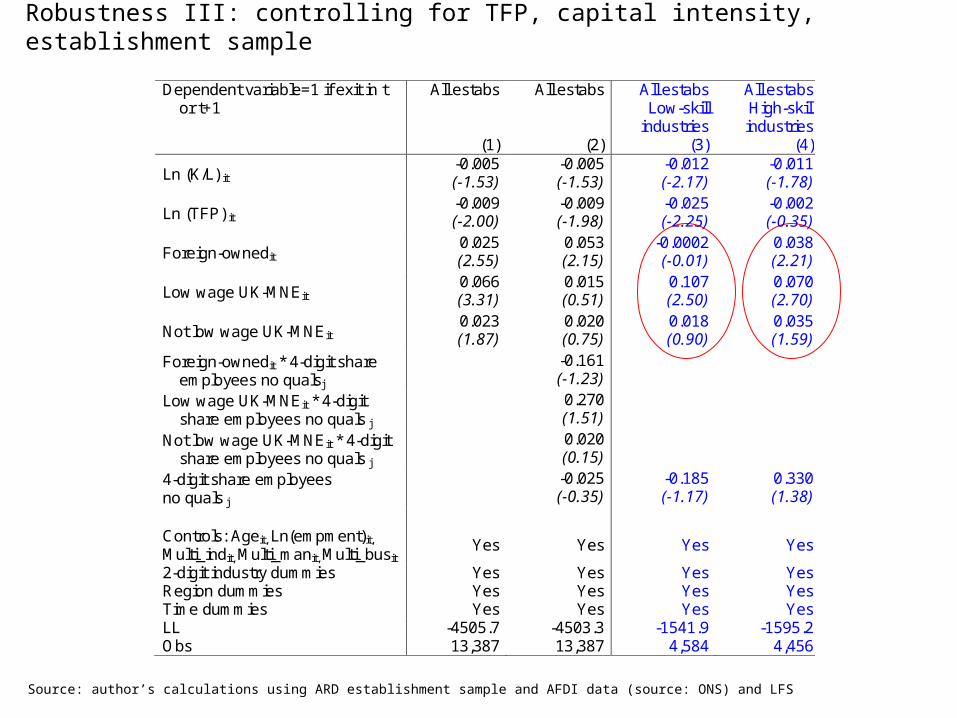
Robustness III: controlling for TFP, capital intensity, establishment sample
Source: author’s calculations using ARD establishment sample and AFDI data (source: ONS) and LFS
Dependent variable=1 if exit in t or t+1
All estabs
(1)
All estabs
(2)
All estabs Low-skill
industries (3)
All estabs High-skill industries
(4)
Ln (K/L) it -0.005 (-1.53)
-0.005 (-1.53)
-0.012 (-2.17)
-0.011 (-1.78)
Ln (TFP) it -0.009 (-2.00)
-0.009 (-1.98)
-0.025 (-2.25)
-0.002 (-0.35)
Foreign-ownedit 0.025 (2.55)
0.053 (2.15)
-0.0002 (-0.01)
0.038 (2.21)
Low wage UK-MNEit 0.066 (3.31)
0.015 (0.51)
0.107 (2.50)
0.070 (2.70)
Not low wage UK-MNEit 0.023 (1.87)
0.020 (0.75)
0.018 (0.90)
0.035 (1.59)
Foreign-ownedit * 4-digit share employees no qualsj
-0.161 (-1.23)
Low wage UK-MNEit * 4-digit share employees no quals j
0.270 (1.51)
Not low wage UK-MNEit * 4-digit share employees no quals j
0.020 (0.15)
4-digit share employees no quals j
-0.025 (-0.35)
-0.185 (-1.17)
0.330 (1.38)
Controls: Ageit, Ln(empment)it,
Multi_indit, Multi_manit, Multi_busit Yes Yes Yes Yes
2-digit industry dummies Yes Yes Yes Yes Region dummies Yes Yes Yes Yes Time dummies Yes Yes Yes Yes LL -4505.7 -4503.3 -1541.9 -1595.2 Obs 13,387 13,387 4,584 4,456

Conclusions and discussion
• Evidence that behaviour accompanying investment in low-wage economies is in line with vertical FDI
• Investment in relatively low-wage economies associated with closure of plants in relatively low-skill industries at home
• Provide some explanation for higher propensity of plants owned by MNEs to exit
• Extensions to wider range of home country outcomes – employment, investment in physical capital, industrial structure of whole firm
• Extension to tradeable services

Additional slides

Data 3: Industry characteristics
• Skill, labour intensity
• Robustness
• 5-digit industry level measures derived from ARD establishment-level sample, 1995
– Capital stock per worker– Share of wage bill accounted for by skilled workers (administrative,
technical and clerical) as opposed to unskilled workers (operatives)– Average annual wage
• 4-digit industry level, average hourly wage, UK Annual Survey of Hours and Earnings (ASHE), 1997
• 4-digit industry level, proportion of employees who are qualified to degree level equivalent and above, LFS

Results: Sample split by industry skill intensity, UKMNEs
Source: author’s calculations using ARD plant population and AFDI data (source: ONS) and LFS
Dependent variable=1 if exit in t or t+1
Low-skill industries
All UK-MNEs (1)
High-skill industries
All UK-MNEs (2)
Low wage UK-MNE it 0.078
(2.80) 0.006 (0.28)
Controls: Ageit, Ln(empment)it,
Multi_indit, Multi_manit, Multi_busit,
Yes Yes
2-digit industry dummies Yes Yes Region dummies Yes Yes Time dummies Yes Yes LL -1648.0 -2614.8 Obs 3,195 5,156

Descriptive statistics at the firm level
• What is happening to the overall skill-intensity of employment in these firms?
• What is happening to net entry?

Distribution of plants and employment across industries by firm type, 1998 cohort
Note: cohorts of firms present in 1998 Source: author’s calculations using ARD plant population and AFDI data (source: ONS) and LFS
Domestic
Foreign-MNE Low wage UK-MNE
Not low wage UK-MNE
1998 2002 1998 2002 1998 2002 1998 2002 Plants
Low skill 28% 27% 23% 25% 23% 14% 35% 32% High skill 35% 35% 47% 46% 60% 65% 37% 45%
Employment
Low skill 37% 37% 21% 22% 23% 14% 39% 32% High skill 32% 31% 38% 40% 55% 62% 33% 41%

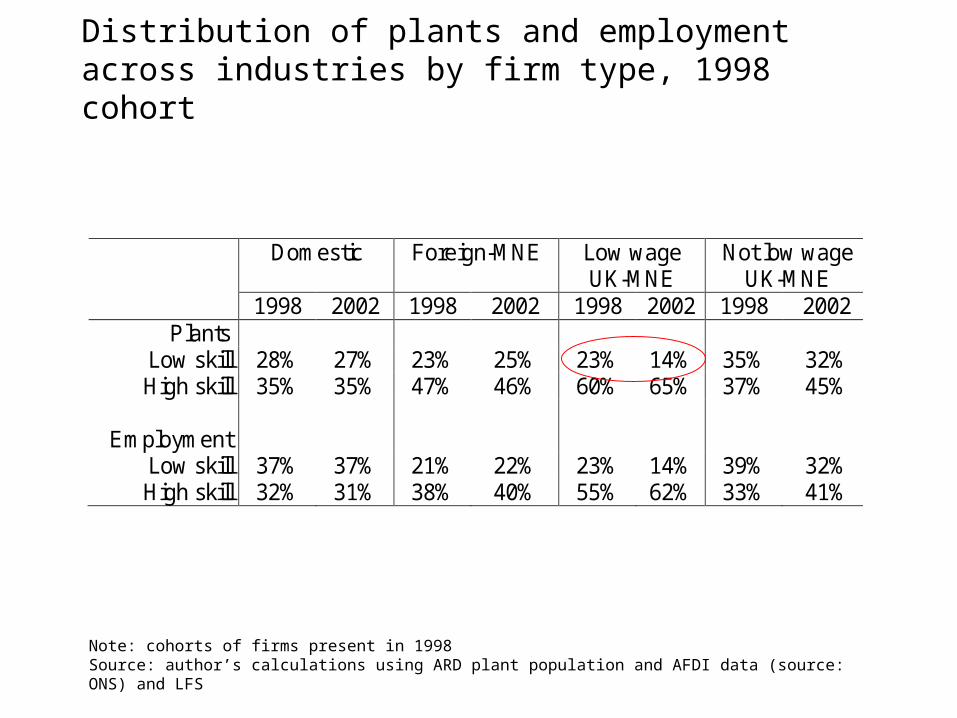
Distribution of plants and employment across industries by firm type, 1998 cohort of firms
Note: cohorts of firms present in 1998 Source: author’s calculations using ARD plant population and AFDI data (source: ONS) and LFS
Domestic
Foreign-MNE Low wage UK-MNE
Not low wage UK-MNE
1998 2002 1998 2002 1998 2002 1998 2002 Plants
Low skill 28% 27% 23% 25% 23% 14% 35% 32% High skill 35% 35% 47% 46% 60% 65% 37% 45%
Employment
Low skill 37% 37% 21% 22% 23% 14% 39% 32% High skill 32% 31% 38% 40% 55% 62% 33% 41%
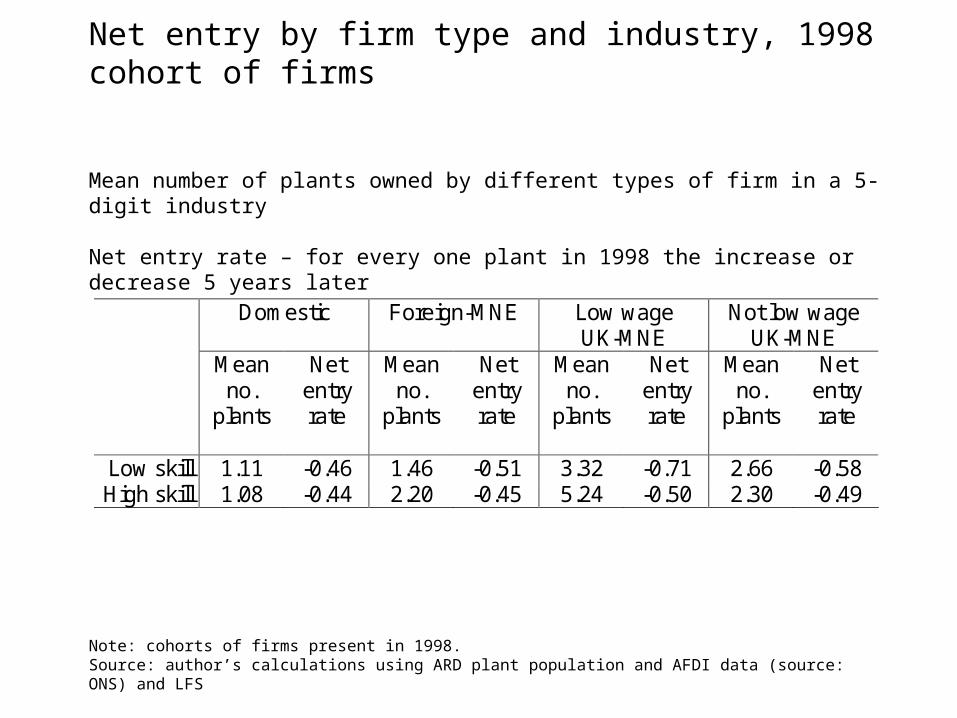
Net entry by firm type and industry, 1998 cohort of firms
Mean number of plants owned by different types of firm in a 5-digit industry
Net entry rate – for every one plant in 1998 the increase or decrease 5 years later
Note: cohorts of firms present in 1998. Source: author’s calculations using ARD plant population and AFDI data (source: ONS) and LFS
Domestic
Foreign-MNE Low wage UK-MNE
Not low wage UK-MNE
Mean no.
plants
Net entry rate
Mean no.
plants
Net entry rate
Mean no.
plants
Net entry rate
Mean no.
plants
Net entry rate
Low skill 1.11 -0.46 1.46 -0.51 3.32 -0.71 2.66 -0.58 High skill 1.08 -0.44 2.20 -0.45 5.24 -0.50 2.30 -0.49
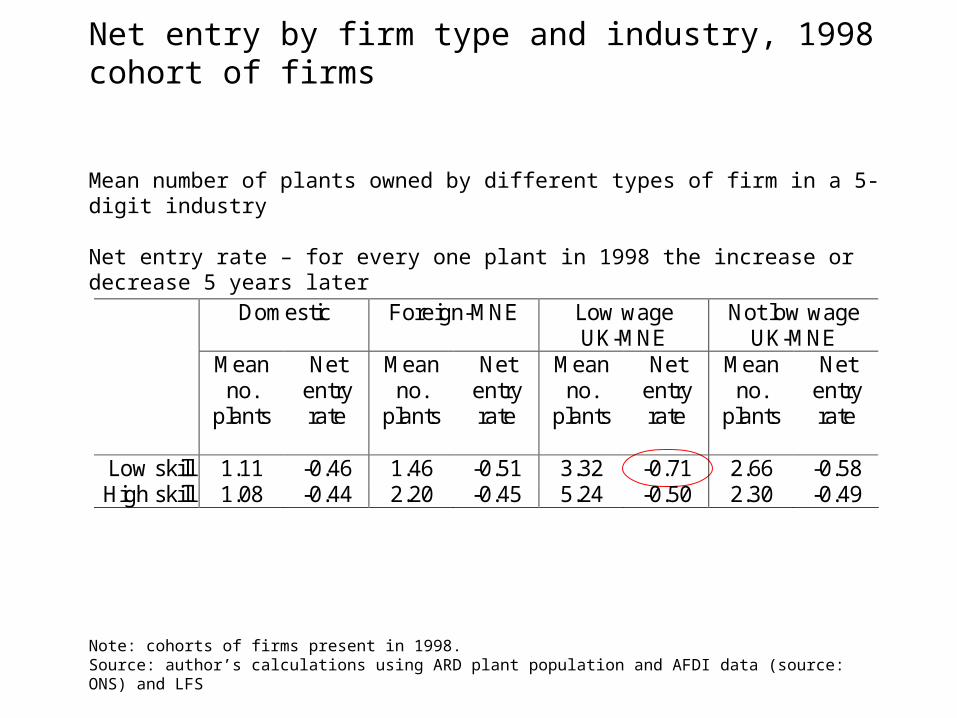