© Nuffield Foundation 2011 Nuffield Mathematics Activity Mean values

Welcome message from author
This document is posted to help you gain knowledge. Please leave a comment to let me know what you think about it! Share it to your friends and learn new things together.
Transcript

© Nuffield Foundation 2011
Nuffield Mathematics Activity
Mean values
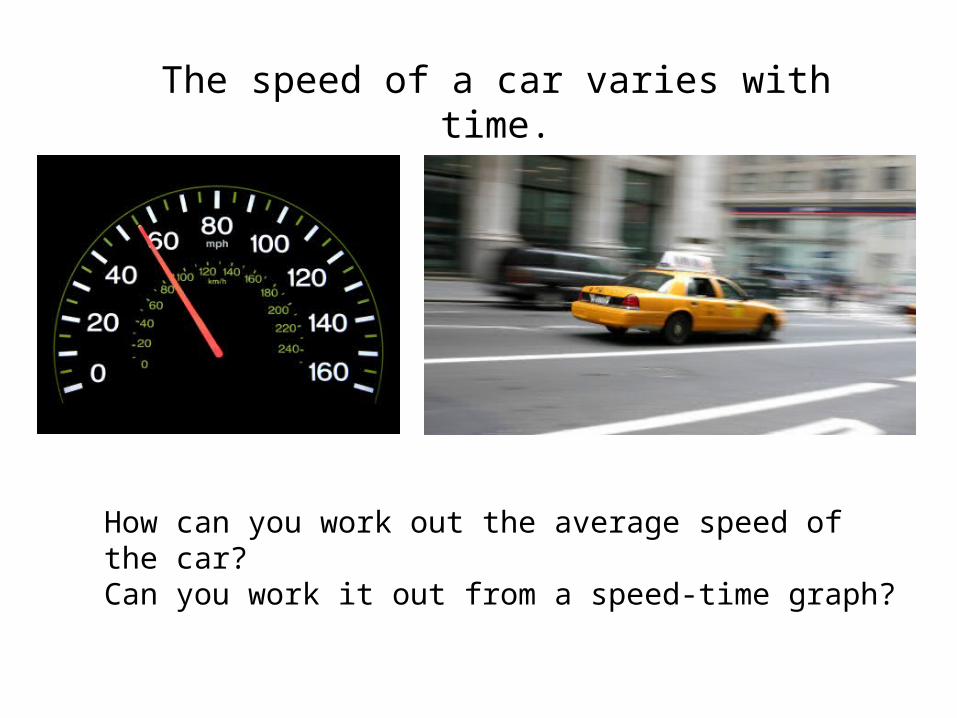
The speed of a car varies with time.
How can you work out the average speed of the car?Can you work it out from a speed-time graph?
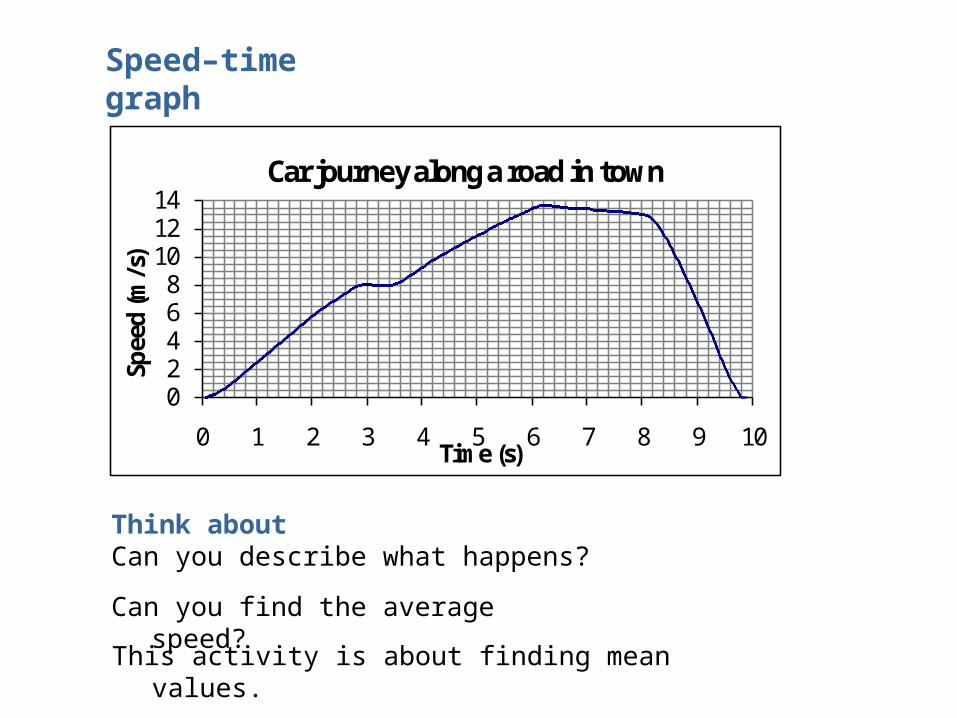
Speed–time graph
Think aboutCan you describe what happens?
Can you find the average speed?
02468
101214
0 1 2 3 4 5 6 7 8 9 10
Spee
d (m
/s)
Time (s)
Car journey along a road in town
This activity is about finding mean values.

Mean speed
Car travelling at 15 m s–1
Area =
The distance travelled in 4 seconds is 60 metres
4 × 15 = 60
v m s–1
t seconds0 4
15
taken time Totaltravelled distance Total
where distance travelled = area under the speed–time graph

t seconds
v m s–1
0 2 4 6 8 10
2
4
6
8
10
12
14
Car travelling along road in town
Think about…The areas under this graph are triangles and trapezia. Can you recall the formulae for these areas?
b
h
Area of a triangle = 2
hb

A B C D E
t seconds
v m s–1
0 2 4 6 8 10
2
4
6
8
10
12
14Area of A = 2
82.8
Area of C =
22.713.78
= 29.295
Area of B = 0.68 = 4.8
= 11.2
Area of E = = 11.135
Area of D = = 26.8
213.11.7
Car travelling along road in town
= 83.23Total area
Mean speed taken time Totaltravelled distance Total
9.883.23 = 8.5 m s–1 (to 1dp)
2
213.113.7

Example
10
040.0130.1 dtttArea =
10
4
40.1
0
t5
50.01t
100 0.025t 4 – 0.002t 5
– 200 = 250
Distance = 50 metres
Mean speed
Integration allows you to find the area under a curve.
The speed of a cyclist along a road can be modelled by the function v = 0.1t 3 – 0.01t 4
1050 = 5 m s–1
v
t0
v = 0.1t 3- 0.01t 4
10
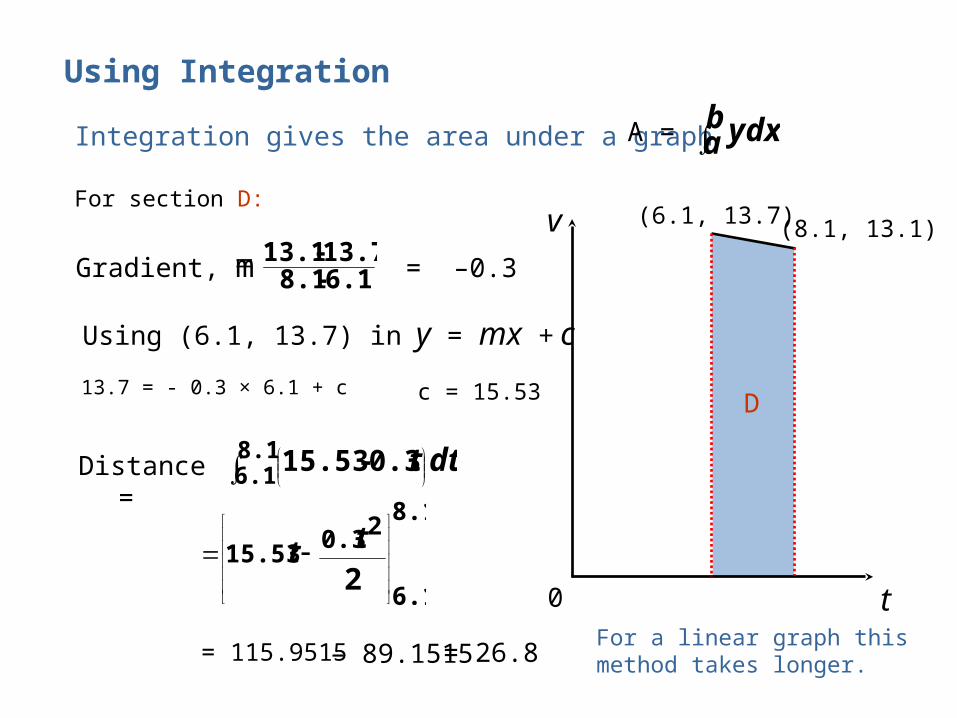
Using Integration
6.1-8.113.7-13.1
Integration gives the area under a graph ba dxyA =
(6.1, 13.7) (8.1, 13.1)v
t0
D
For section D:
Gradient, m = –0.3
Using (6.1, 13.7) in y = mx + c
13.7 = - 0.3 × 6.1 + c c = 15.53
Distance =
8.16.1 0.3-15.53 dtt
8.1
6.1
20.315.53
2
tt
= 115.9515 – 89.1515 = 26.8 For a linear graph this method takes longer.
Reflect on your work
Can you summarise the method for finding the mean value of a quantity from its graph?
In cases where the graph consists of straight lines, you can use either geometrical formulae to find the area or integration.
Which of these methods do you prefer?Why?
Mean values
Related Documents