I
INNOVATION SYSTEMS, INNOVATION POLICY AND
ECONOMIC GROWTH: THEORY AND PRACTICE
Doctoral thesis of
Alexandre Filipe Silveira de Almeida
Supervisors:
Óscar João Atanázio Afonso
Mário Rui Moreira da Silva
Doctoral Programme in Economics
2017

II
BIOGRAPHIC NOTE
Alexandre Almeida was born in Aveiro in 1981 where he lived until coming to Porto to
study. He holds a degree in Economics and a Master in economics. In the latter, he
researched on the impact of the patenting systems on the incentives to pursue R&D,
having published a book, papers and participated in conferences.
After completing his master degree, Alexandre was deputy coordinator of the team in
charge of preparing the Innovation Action Plan for Norte Region, having become, later
on, consultant for the CCDR-N on innovation policy. At the time, Alexandre worked also
on some consulting projects of Augusto Mateus e Associados and Sigma Team
consulting.
From 2009-2013, Alexandre worked for the CCDR-N as main advisor for the
Management Authority of the regional Operational Program and then as head advisor of
the Regional Development Unit, having accumulated significant experience in the design
and evaluation of innovation.
Before joining ANI in 2016 to oversee the National Smart Specialization Coordinating
Council, Alexandre worked for the General Hospital of Gaia as an advisor to the
President of the Board and to the General Hospital of São João as a consultant.

III
ACKOWLEDGEMENTS
This has been a long and harsh journey which was possible only due to the contributions
of many. It would be unfair to forget any of the persons that, in a way or the other, have
touched my life and inspired my path. To you all, my deepest acknowledgement and
please forgive me for the following special acknowledgements.
Firstly, I must acknowledge 3 Professors:
- Professor Aurora Teixeira is my scientific mother. She introduced me to the
world of research and is a model for any young researcher.
- Professor Mário Rui Silva has become a major reference for my work but also
for my life. I have had the privilege of researching, working and learning from
him and he has been inspirational in the last decade.
- Professor Óscar Afonso is not only highly skilled, but one of the most
generous persons I have had the privilege to meet. He continues to be a model
of perseverance and balance. I owe him the stimulus to complete this thesis.
Secondly, I must acknowledge the contribution of the “Fundação para a Ciência e
Tecnologia” (FCT) which on an early stage of this thesis awarded me the scholarship with
the reference SFRH / BD / 39351 / 2007.
Thirdly, I must also acknowledge my family. In memory of my father, I thank him for the
love and care he gave me. My mother was fundamental in this path providing me with
the means and support for me to study and now, taking care of my kids while I work in
the completion of this thesis. I must also thank my brother for always being there for me,
my aunt (my second mother) and my uncle, as well as my in-laws for their support.
More importantly, I must thank Cristina. I owe her the patience to organize my chaos and
the discipline that allowed me to accomplish this goal. Furthermore, she was with me in
all my journey in college and in the last 16 years of my journey in life, including in
parenthood.
Last, but by no means the least, I want to dedicate this thesis to Alexandre and Filipe. My
two boys have changed my world and revolutionized my heart and soul. I owe them the
strength to complete this thesis.
To Alexandre and Filipe

IV
ABSTRACT
This thesis focusses on the development of innovation systems from a practitioner’s
standpoint. The first chapters are dedicated to the concept of regional innovation systems
and smart specialization trying to deepen the conceptual framework that supports strategy
design and policy-making and highlighting the fundamentals for public intervention,
namely, in the context of follower regions. We then address the operational aspects of
smart specialization in terms of priority setting, monitoring and evaluation where we
propose a framework for selecting priorities and implementing adequate monitoring and
evaluation systems. Furthermore, we provide two practical examples of application of
transformative actions within the RIS3 paradigm, one based on a case study of Art on
Chairs and its impact on the Portuguese furniture industry and the other through an
analysis of science and technology parks, a common policy tool used in follower regions
to accelerate the structuring of the regional innovation system.
We conclude the thesis from a different stance. The development of regional innovation
systems and their success brings economic growth and convergence. However, that
comes associated with biased impacts on the labour market and hence on wages. In
concrete, we develop a model of general equilibrium to further contribute to the
discussion of the skill biased technological change hypothesis and its impact in the wage
premium. We complete that analysis with an empirical application to 25 OECD countries
that indicate the greater relative impact of the skill biased technology change hypothesis
on wages in comparison to the alternative international trade effect.
V
RESUMO
O presente trabalho prossegue o ponto de vista operacional quanto ao desenvolvimento
de sistemas de inovação. Os primeiros capítulos dedicam-se ao conceito de sistemas
regionais de inovação e especialização inteligente, tentando aprofundar a estrutura
conceitual que apoia a formulação da estratégica, o desenho dos instrumentos de política
e destaca os fundamentos justificativos da intervenção pública, nomeadamente no
contexto de regiões seguidoras. Em seguida, abordamos os aspetos operacionais da
especialização inteligente em termos de definição de prioridades, monitorização e
avaliação, propondo-se um quadro para selecionar prioridades e implementar sistemas
adequados aos objetivos de monitorização e avaliação subjacentes à especialização
inteligente. Complementarmente, analisamos dois exemplos práticos de aplicação de
ações transformativas associadas ao paradigma da RIS3. Uma primeira ação diz respeito
ao estudo de caso do projeto “Art on Chairs” e ao seu impacto na indústria de mobiliário
portuguesa. Um segundo caso tem por base ao instrumento de política parques científicos
e tecnológicos, uma ferramenta comumente usada em regiões seguidoras para acelerar a
estruturação do sistema regional de inovação. Os capítulos seguintes analisam os
impactos do desenvolvimento dos sistemas de inovação. Esse desenvolvimento e o seu
sucesso traz crescimento económico e convergência. No entanto, isso vem associado a
impactos enviesados sobre o mercado de trabalho e, portanto, nos salários. Em concreto,
desenvolvemos um modelo de equilíbrio geral que visa contribuir para a discussão da
hipótese do enviesamento do progresso tecnológico em favor de capital humano mais
qualificado, tendo um impacto positivo sobre o prémio salarial. Completamos essa análise
com uma aplicação empírica para 25 países da OCDE que indicia que, nesta amostra, se
parece verificar o maior impacto relativo da hipótese do enviesamento do progresso
tecnológico sobre os salários em comparação com o efeito alternativo do comércio
internacional.
1
GENERAL INDEX
CHAPTER 1 - FOLLOWER REGIONS: APPLYING THE RIS PARADIGM ..................... 12
Abstract ................................................................................................................................ 12
1. Introduction ................................................................................................................ 12
2. The Regional Innovation System Concept: Main Research Orientations and
Intermediate Conclusions ............................................................................................... 13
3. The Case of the Follower Regions .......................................................................... 16
4. From Concept to Operational Tool: Building RIS in the Follower Regions 19
4.1 Structural Features and Regional Assets ............................................................... 21
4.2 Potential Innovation Trajectories and Feasibility of Implementing RIS ............... 25
4.3 Innovation Trajectories .......................................................................................... 29
4.4 Drivers of Change .................................................................................................. 30
4.5 Institutional and Organizational Change ............................................................... 33
5. The Importance of European Regional Development Fund (ERDF) in
Overcoming Structural Blockades .................................................................................. 39
6. Smart specialization: the new ERDF condictionality ........................................... 40
7. Conclusions ................................................................................................................. 41
References .......................................................................................................................... 43
CHAPTER 2: OPERATIONALIZING SMART SPECIALIZATION IN A FOLLOWER
REGION ................................................................................................................................... 47
Abstract ................................................................................................................................ 47
1. Introductory notes ......................................................................................................... 47
2. Recent EU Innovation Policy frameworks: RIS vs RIS3 .............................................. 48
2.1. Regional innovation Systems (RIS) ....................................................................... 48
2.2. Research and Innovation Smart Specialization Strategies (RIS3) ......................... 49
3. RIS 3: the case of follower regions ............................................................................... 51
4. RIS 3 in Practice: the case of Norte Region .................................................................. 55
4.1 Health and Life Sciences ............................................................................................ 58
4.2 Symbolic Capital and Tourism ................................................................................... 63
5. Concluding remarks ...................................................................................................... 65
References ............................................................................................................................ 66
CHAPTER 3: SMART SPECIALIZATION: AN APPROACH TO A MONITORING AND
EVALUATION SYSTEM ....................................................................................................... 69
Abstract ................................................................................................................................ 69
1. Introduction ................................................................................................................... 69
2. RIS3 monitoring systems: state-of-the-art .................................................................... 70

2
3. An operational approach to monitoring and evaluation ................................................ 73
3.1. The cornerstones of a monitoring and evaluation system for the NRIS3 ................. 73
3.2. An operational proposal ............................................................................................ 75
4. An empirical application to Portugal ............................................................................ 79
4.1 Implementation of bottom-up continuous processes ............................................. 80
4.2 Selectivity of the selection procedures .................................................................. 82
4.3 Demand distribution ............................................................................................... 83
5. Final remarks ................................................................................................................. 93
References ............................................................................................................................ 93
CHAPTER 4: SMART SPECIALIZATION: A CASE STUDY OF TRANSFORMATIVE
ACTIONS IN THE TRADITIONAL FURNITURE INDUSTRY .......................................... 95
Abstract ................................................................................................................................ 95
1. Introduction ................................................................................................................... 95
2. Smart Specialization: transforming paradigms ............................................................. 96
2.1 RIS3: the concept ................................................................................................... 96
2.2 Norte as a follower region ...................................................................................... 97
2.3 The theoretical challenge for RIS3 in traditional industries .................................. 99
2.4 Some methodological notes ..................................................................................... 101
3. Art on chairs: the conceptual approach ....................................................................... 101
3.1 The objectives ...................................................................................................... 102
3.4 The partnership: a quadruple helix approach ....................................................... 105
3.5 The novelty .......................................................................................................... 106
3.6 The impacts .......................................................................................................... 107
4. Conclusions ................................................................................................................. 110
References .......................................................................................................................... 110
CHAPTER 5: PANACEA OR ILLUSION: AN EMPIRICAL ANALYSIS TO EUROPEAN
SCIENCE PARKS ................................................................................................................. 112
Abstract .............................................................................................................................. 112
1. Introduction .................................................................................................................... 112
2. STP: literature review .................................................................................................... 114
2.1 STP: a concept yet ambiguous ................................................................................. 114
2.2 The doubts on effectiveness ..................................................................................... 116
3. A STP in RIS: a functional definition ............................................................................ 118
4. The case of follower regions ....................................................................................... 122
5. Uncovering patterns across STP: correlating performance, functions and regions ....... 126
5.1 Methodological considerations: cluster analysis ...................................................... 127
6. Conclusions .................................................................................................................... 136
References .......................................................................................................................... 138

3
Annex 1: Determination of optimal number of clusters (AIC’s results) ............................ 143
Annex 2: Some descriptive statistics (partial) .................................................................... 143
Annex 3: Kruskall-wallis Chi-Square Test results ............................................................. 148
CHAPTER 6: SUBSTITUTABILITY BETWEEN TECHNOLOGIES AND THE SKILL
PREMIUM: A SKILL-BIASED TECHNOLOGICAL CHANGE APPROACH ................. 149
Abstract .............................................................................................................................. 149
1. Introduction ................................................................................................................. 149
2. Theoretical Model ....................................................................................................... 151
2.1 Technology and preferences ..................................................................................... 151
2.2. General Equilibrium ................................................................................................ 156
2.3 Transitional Dynamics ............................................................................................. 157
2.4 Steady State .............................................................................................................. 160
3. Calibration and quantitative implications ................................................................... 162
4. Conclusions ................................................................................................................. 163
References .......................................................................................................................... 164
CHAPTER 7: TECHNOLOGY BIAS AND WAGE GAP: A CROSS-COUNTRY
ANALYSIS ............................................................................................................................ 166
Abstract .............................................................................................................................. 166
1. Introduction .................................................................................................................... 166
2. Wage premium: reviewing the empirical literature ........................................................ 168
2.1 Empirical literature review on the skill premia ........................................................ 168
2.2 Empirical literature on the skill premia and gender ................................................. 170
3. Modelling the case for gender wage premium ............................................................... 172
4. Cross country evidence on the explanatory degree of SBTC and International Trade .. 176
5. Conclusions .................................................................................................................... 180
References .......................................................................................................................... 181
CONCLUSIONS .................................................................................................................... 186
4
TABLES’ INDEX
Table 1. Development and technological indicators ................................................................ 20
Table 2. Regional assets and recent dynamics concurring for RIS types ................................ 26
Table 3. Preliminary grid for assessing the feasibility of implementing a RIS framework ..... 35
Table 4. Smart Specialization versus Regional innovation System perspectives .................... 41
Table 5. Dimensions of a Monitor and Evaluation System of the Portuguese NRIS3 ............ 74
Table 6. Indicators to assess implementation ........................................................................... 76
Table 7. Indicators to assess intermediate outputs ................................................................... 77
Table 8. Indicators to assess structural change ........................................................................ 78
Table 9. Indicators to assess long term impacts ....................................................................... 79
Table 10. Relative weight of the set of criteria related to NRIS3. ........................................... 82
Table 11. The Portuguese Furniture industry 2004-2014 (data source: INE.) ......................... 99
Table 12. Distribution of furniture industry firms2 per innovative activity, 2004-2014.
(Source: Eurostat, CIS) .......................................................................................................... 101
Table 13. Summary of the major impacts from the transformative actions within “Art on
Chairs”. ................................................................................................................................... 108
Table 14. The functional interpretation of an STP in the context of a follower region ......... 125
Table 15. Identifying proxies to the functions of an STP and to other location/infra-structural
features ................................................................................................................................... 127
Table 16. Cluster membership ............................................................................................... 129
Table 17. Steady-state skill-premium for different values of with ε = 3.0............................ 163
Table 18. Steady-state skill-premium for different values of HL ε = 0.5. ............................. 163
Table 19: Statistical summary of the variables used in the model’s estimation…………….174
Table 20: Statistical Summary on SBTC - proxied by the annual share of R&D expenditures
on GDP………………………………………………………………………………………175
Table 21: Statistical Summary on International Trade - proxied by the degree of openness.175
Table 22: Statistical Summary on LnGDP………………………………………………….175
Table 23: Composition of each sample group………………………………………………175
Table 24: Panel data estimation results of wage premium on male and female individuals..176
Table 25: Panel Data Estimation on gender based wage differential among college graduates
and among lower secondary graduates……………………………………………………...178
5
FIGURES’ INDEX
Figure 1. Operationalizing Smart Specialization. .................................................................... 56
Figure 2. Matching quality of resources and assets and the economy. .................................... 60
Figure 3. Priority Domain “Health and Life Sciences”: Scheme presented in the workshop
organized by CCDR-N ............................................................................................................. 62
Figure 4. Priority Domain “Symbolic Capital and Tourism”: Scheme adapted from the one
presented in the workshop organized by CCDR-N. ................................................................. 65
Figure 5. Overall distribution of the approved projects per specialization thematic priority .. 84
Figure 6. Distribution of Agrofood approved projects per policy tool .................................... 84
Figure 7. Distribution of Water and environment approved projects per policy tool .............. 85
Figure 8. Distribution of Automotive, Aeronautics and Space approved projects per policy
tool ............................................................................................................................................ 85
Figure 9. Distribution of Economy of the Sea approved projects per policy tool .................... 86
Figure 10. Distribution of Energy approved projects per policy tool ...................................... 87
Figure 11. Distribution of Forest approved projects per policy tool ........................................ 87
Figure 12. Distribution of Habitat approved projects per policy tool ...................................... 88
Figure 13. Distribution of Culture and Creative Industries approved projects per policy tool 88
Figure 14. Distribution of Materials approved projects per policy tool ................................... 89
Figure 15. Distribution of Health approved projects per policy tool ....................................... 89
Figure 16. Distribution of ICT approved projects per policy tool ........................................... 90
Figure 17. Distribution of Production Technologies (Process industries) approved projects per
policy tool ................................................................................................................................. 91
Figure 18. Distribution of Production Technologies (Product industries) approved projects per
policy tool ................................................................................................................................. 91
Figure 19. Distribution of Transportation, Mobility and Logistics approved projects per policy
tool ............................................................................................................................................ 92
Figure 20. Distribution of Tourism approved projects per policy tool .................................... 92
Figure 21. The innovation value-chain of the furniture industry Figure 22. The
impacts of the loss of competiiveness .................................................................................... 100
Figure 23. The intermediate goal of Art on Chairs Figure 24. RIS3: transformative
actions towards related variety innovation ecosystem ........................................................... 100
Figure 25. The smiling curve: value distribution along the global value chain ..................... 102

6
INTRODUCTION
Innovation has become a popular theme and an everyday word of developed countries.
However, the ease with which we speak of innovation is inverse to the actual difficulty in
creating the right political set-up to optimize the innovation system and maximize the
innovation outcome.
This thesis addresses innovation from the standpoint of a practitioner policy-maker,
intending to contribute to the literature through an operational approach on how build and
develop innovation systems, innovation strategies and designing and delivering innovation
policies. Hence, considering these goals, this thesis comprises two main chapters.
Chapters 1 to 5 deal with the concept of building innovation systems, developing and
operationalizing strategies and monitoring systems and analyzes the effectiveness of some
common policy tools (science parks and a case study of the project Art on Chairs) in follower
regions.
European follower regions (such as “convergence regions” but also “competitiveness
regions” that are still far from the technological and development levels that characterize
frontier regions) need to respond in the next programming period of the Structural Funds to a
strong challenge in what concerns competitiveness and innovation. Following the Lisbon
Agenda and Europe’s 2020, these regions must focus on developing increasingly knowledge-
oriented regional development policies, demanding new organizational capabilities. Following
a systemic and regional perception of innovation, building a regional innovation system (RIS)
should be a central policy goal. Based on a published paper discussing this thematic, this article
updates and reviews the aforementioned work, addressing the particular challenges and
difficulties that arise in the “follower regions” when building the basis for a RIS, discussing the
feasibility of innovation policies based on the concept of RIS for four relevant cases of
“follower regions” (Norte and Centro regions in Portugal and Cantabria and Galicia regions in
Spain) and concluding on how to approach some of the systemic deficiencies of a RIS in a
follower region and how to overcome them using innovation policy.
As referred, smart specialization has become the new paradigm for regional innovation
policy in EU, in spite of the increasing gap between the advanced stage of implementation and
the early stages of development of the supporting theory. Consequently, smart specialization
poses significant challenges to researchers and practitioners related to the methodologies
leading to priority setting, to the format of such priorities and also to the establishment of an

7
adequate monitoring system. Thus, in chapter 2, we discuss the concept of smart specialization
and its conceptual and operational novelty in relation to the Regional Innovation System
paradigm, analyzing the case of follower regions and its challenges. We present a methodology
to identify priorities of specialization and provide an operational example of application to the
case of Norte region, Portugal, analyzing the case of an emerging priority based on
technological resources and an emerging priority based on endogenous resources. Chapter 3
addresses the second challenge of smart specialization, that is the development of such
monitoring and evaluation systems. The definition and implementation of a monitoring and
evaluation system for smart specialization is particularly challenging given that RIS3 is about
transformative actions that foster structural changes which are long term (Raimondo, 2016).
Hence, the monitoring system needs to couple short term dimensions which analysis can
indicate how the strategy is being implemented and provide some insights on necessary minor
adjustments, along with long term dimensions that respond to the actual purpose of RIS3
(Angelidou et al., 2017), changing the competitiveness drivers and the playing field though
transformative actions. Considering that literature is, in this dimension, at a seminal stage
(Angelidou et al. 2017), this paper focusses on establishing the objectives underlying a monitor
and evaluation system and proposing the architecture of a system based on 4 levels of
monitoring: implementation, first level results, structural change and long-term impacts.
Following this structure and considering the data restrictions at this date, we provide an
empirical analysis on the implementation of the RIS3 in Portugal, namely, in terms of
dimension 1 of the proposed system. Chapter 4 addresses the case of Art on Chairs which we
consider to be an innovative program of Transformative actions aiming to change the paradigm
of the Portuguese furniture industry and overturn its competitiveness decay. Art on Chairs is an
ambitious program that aims at changing the paradigm of furniture manufacturers. Hence, it
conveys a structural approach that cannot be fully measured yet but which transformative power
is visible in the first results. Furthermore, this novel approach to an “old problem” generated a
powerful demonstration effect that has engaged other firms that are interested in participating
in the coming edition, in a path towards developing and absorbing design capabilities. With the
crucial support from Cohesion Policy, Norte has engaged all actors to lead the economy into a
new paradigm based on the emergence of knowledge intensive traditional industries. Hence, a
strong investment was made in constructing a regional innovation system that could build new
dynamic competitive advantages, exploiting also the enormous potential for cross-sectorial
innovation. Nevertheless, as elsewhere in Europe, we face the challenge of bridging universities
and knowledge intensive activities with SMEs, especially in traditional sectors. Creative
8
industries are an emerging activity that must be fostered because of its capacity to create value,
but also because they function as a general-purpose technology. In traditional sectors, the
relevance of developing design based consumer goods implies a significant capacity to absorb
the symbolic capital produced in creative industries, but this is usually a difficult task. Art on
Chairs responds in an innovative way to this problem.
Chapter 5 addresses one common strategy to foster interactions within the innovation
system and implement a transformative action through a public push. Acknowledging the
contribution of the knowledge production subsystem, the regulatory context and of the
enterprises to a region’s innovative performance, the importance of easing technology transfer
to the productive system arises as a policy priority and for this it is crucial to create platforms
that foster interactions between academic research and the economy. Science and Technology
Parks (STP) emerge as infrastructures designed to co-locate university research centres and
highly innovative firms, creating an innovative milieu (Vasquez-Urriago et al. 2014, Vasquez
et al. 2016, Diez-Vial and Fernandez-Olmos, 2016, Hobbs et al. 2017). This proliferation of
STP has assumed different models with associated very different results that have raised doubts
on the actual value added of these infrastructures. Hobbs et al. (2017) provide an extensive
literature review that highlights the different angles of approach regarding science parks but
also uncovers the need to clearly understand the definition, the underlying goals and key
elements necessary for success (Guadix et al. 2016). Despite this proliferation of infrastructures,
the recipe of STPs and its functions within a RIS remain unclear in literature and also in
practice, as well as how different mixes of functions affect performance. Hence, this paper
contributes to literature on three levels. A first level regards the blurriness of definition and,
specifically, the lack of depth in the literature discussing the key elements to assure STP’s
effectiveness (Guadix et al. 2016) Hence, we attempt to fine tune the concept by proposing a
functional definition that includes infrastructural and location features, as well as the
availability of advanced support services, the involvement and the amount of resources
allocated to the project. A second level of analysis focuses on the contribution of STP to the
RIS, addressing also the case of follower regions. This link is not explored in the literature in
an explicit way. A third level applies the functional definition proposed to a set of 55 STP across
Portugal, Spain and the UK to uncover patterns that can guide on key features related to greater
dynamics. Therefore, we use two-step cluster on a 55 STP dataset we perform cluster analysis
on 55 STP located in Portugal, Spain and the UK. We also analyze the results, providing a brief
characterization of each cluster and analyzing the different patterns across follower and frontier
regions.

9
Chapter 6 and 7 analyze the innovation system and innovation policy from a different
angle. In fostering the development of regional innovation system and the increased
specialization of regions, a strong emphasis is placed on accumulating human capital and
accelerating technological absorption. The fast pace of technology introduction in businesses
came with an increasing disparity in terms of wages between skilled and less skilled workers.
This premium has been discussed in literature for the last 20 years based upon the cases of the
US and more developed countries that, during the 1980s and the 1990s, witnessed a rise in the
relative wage of skilled workers (i.e., in the skill premium). We would expect a decline in the
skill premium due to the relative increase in skilled workers. The skill-biased technological
change literature (e.g., Bound and Johnson, 1992; Katz and Murphy, 1992; Juhn et al., 1993)
attempts to work out the contradiction between the rise in both the skill supply and the skill
premium. The argument is that technological knowledge change induces an increase in the
relative demand of skilled labour that exceeds the increase in the relative supply, thus increasing
the skill premium. Acemoglu (1998, 2002) and Acemoglu and Zilibotti (2001) further enhance
this literature by considering that technological-knowledge change responds to shifts in labour
endowments. When the supply of a type of labour increases (e.g., skilled labour), the market
for technologies that complement it broadens, and this creates additional incentives for R&D
aimed at those technologies. As a result, technological-knowledge change steers towards those
technologies, which, in turn, increases the demand for the complementary type of labour
(skilled labour). Hence, these recent contributions interpret the rise in the skill premium as a
direct consequence of the increase in the relative supply of skilled labour. However, some
empirical evidence seems to contradict the explanation proposed by the skill-biased
technological change literature. Indeed, despite the generic paths for wages and skills, for
developed countries we note that, for example, Acemoglu (2003a) documents a decline in the
skill premium in The Netherlands between the early 1980s and the mid-1990s, in a scenario
with relative increase of skills, and an increase in the skill premium in Canada between the late
1980s and the late 1990s, in a scenario with stable relative supply of skills. We propose a
framework that aims at accounting for the related different paths of the skill premium. Our
endogenous R&D growth model is closely related to the contributions of Acemoglu (1998,
2002), Acemoglu and Zilibotti (2001) and Afonso (2006, 2008). However, by considering
different values for the elasticity of substitution between the two inputs in the production of the
aggregate final good (skilled and unskilled labour), which affect the direction of technological-
knowledge change and thus the relative demand of skilled labour and the skill premium, we
10
intend to accommodate the distinct paths of both the skill premium and the relative supply of
workers.
We observe that when the elasticity of substitution between the two inputs in the
production of the aggregate final good is stronger (higher than 1), then an increase of the skilled
labour biases the technological-knowledge such that the rise in the relative demand of skilled
labour dominates the relative supply. This chapter concludes with an empirical econometric
exercise on the problematic SBTC/Trade in accounting for the skill premium evolution and also
the eventual asymmetric impacts across gender. We use two direct measures of the skill
premium differential between male and female workers, namely, wage ratios per education
level. Our estimation results indicate that SBTC conveys a dominant effect over the wage
premium on technological leaders, suggesting that in countries where technological intensive
production activities are a small part, absorptive capacity may be limited and SBTC is actually
not pervasive. IT (International trade) appears to have a smaller effect for technological leaders;
it is however the dominant for followers and always significant. In what concerns the gender-
related inequality, we conclude that SBTC has also a strong and symmetric impact on the wage
differential (positive on the club of leaders and negative on the club of followers). IT is again
relatively less important in the wage gender-differential evolution.
In sum, this thesis combines a set of independent essays (some of them following a
common matrix and a common theoretical framework, with some minor overlaps in terms of
literature review) regarding the development of innovation systems, especially in the context
of follower regions, addressing issues such as strategy design, policy innovation and modeling
impacts in the transition for a knowledge intensive innovation system.
References
Acemoglu, D. (1998). “Why do new technologies complement skills? Directed technical change and
wage inequality.” Quarterly Journal of Economics, vol. 113(4), 1055-1089.
Acemoglu, D. (2002). "Directed Technical Change." Review of Economic Studies 69(4), 781-
810.
Acemoglu, D. (2003a). "Cross-country Inequality Trends." Economic Journal 113(485), 121-
149.
Acemoglu, D. and Zilibotti, F. (2001). "Productivity Differences." Quarterly Journal of
Economics 116(2), 563-606.

11
Afonso, O. (2006). "Skill-Biased Technological Knowledge Without Scale Effects." Applied
Economics 38(1), 13-21.
Afonso, O. (2008). "The impact of government on wage inequality without scale effects."
Economic Modelling 25(2), 351-362.
Angelidou, M., Komninos, N., Isidoros, P., Artemis, P., Panagiotis, T. (2017). “Monitoring the
Impact of Smart Specialization Strategies Across EU Regions”, ICEIRD,
http://www.urenio.org/komninos/wp-content/uploads/2017/08/2017_ICEIRD-2017-
monitoring_the_Impact_of_RIS3_Across_EU_Regions.pdf.
Bound, J. and Johnson, G. (1992). "Changes in the Structure of Wages in the 1980s: An
Evaluation of Alternative Explanations.", American Economic Review 88(3), 371-
392.Diez-Vial and Fernandez-Olmos, 2016,
Guadix, J., Carrillo-Castrillo, J., Onieva, L. andf Navascues, J (2016) “Success variables in
science and technology parks”, Journal of Business Research, 69 (11), 4870-4875.
Hobbs, K., Link, A. and Scott, J. (2017), “Science and technology parks: an annotated and
analytical literature review”, The Journal of Technology Transfer, 42 (4), 957-976.
Juhn, C., Murphy, K.M. and Pierce, B. (1993). "Wage Inequality and the Rise in Returns to
Skill." Journal of Political Economy 101(3), 410-442.
Katz, L., Murphy, K. (1992). “Changes in relative wages, 1963–1987: supply and demand factors.”
Quarterly Journal of Economics, vol. 107(1), pp. 35-78.
Raimondo E. (2016). What Difference Does Good Monitoring & Evaluation Make to World
Bank Project Performance? Policy Research Working Paper 7726. World Bank.
Vásquez-Urriago, A.R., Barge-Gil, A., Modrego, A. (2014), “The impact of science and
technology parks on firms’ product innovation: empirical evidence from Spain”, Journal
of Evolutionary Economics, 24 (4), 835-873.
Vásquez-Urriago, A.R., Barge-Gil, A., Modrego, A. (2016), “Science and Technology Parks
and cooperation for innovation: Empirical evidence from Spain”, Research Policy, Vol.
45, issue 1, pp 137-147.

12
CHAPTER 1 - FOLLOWER REGIONS: APPLYING THE RIS
PARADIGM
This paper is based on Almeida, A. Figueiredo, A. and Silva, Mário (2011). “From Concept to Policy: Building Regional Innovation Systems
in Follower Regions”, European Planning Studies, Volume 19, issue 7, pp. 1331-1356.
Abstract
The RIS framework stresses the need to combine a systemic and inclusive view of innovation
along with territorially embedded specificities. In this paper, we explore how to operationalize
the concept of RIS in terms of innovation policy, arguing against a “one-size-fits-all” approach.
Concentrating our analysis on follower regions, we bridge the concept of RIS with the structural
deficiencies and challenges posing to this kind of regions, for which innovation policy should
seek an adequate combination between science-push and demand-pull perspectives. We also
address the importance of taking advantage of the catching-up status, building upon the research
and development cost advantages and clustering around external initiatives as well as the
correction of important constraints to the construction of a RIS.
1. Introduction
European follower regions (such as “convergence regions” but also “competitiveness
regions” that are still far from the technological and development levels that characterize
frontier regions) need to respond in the next programming period of the Structural Funds to
a strong challenge in what concerns competitiveness and innovation. Following the Lisbon
Agenda and Europe’s 2020, these regions must focus on developing increasingly
knowledge-oriented regional development policies, demanding new organizational
capabilities. Following a systemic and regional perception of innovation, building a regional
innovation system (RIS) should be a central policy goal. However, the vagueness of the RIS
concept poses the challenge of operationalizing it in terms of innovation policy. Based on a
published paper discussing this thematic, this article updates and reviews the
aforementioned work, including a reference to the new paradigm of European policy: smart
specialization.
Hence, in Section 2, we discuss the concept of RIS and aim to identify the main
difficulties that may arise when we want to move from the concept to policy. In Section 3,
13
we address the particular challenges and difficulties that arise in the “follower regions” when
building the basis for a RIS and devising innovation policies. In the section 4 we discuss on
how to transform the RISD framework into an operational tool for policy design, analyzing
the feasibility of innovation policies based on the concept of RIS in four relevant cases of
the “follower regions” (Norte and Centro regions in Portugal and Cantabria and Galicia
regions in Spain). Section 5 addresses the importance of the European Union Cohesion
Policy, namely, the EU-funded regional development programs, to overcome structural
lock-ins and a ccelerate convergence. Preceding conclusions, section 6 addresses the
novelty of the smart specialization concept in comparison to the original RIS approach.
Finally, a summary of conclusions is elaborated, emphasizing some of the constraints that
the follower regions face and that should be dealt with by more targeted innovation policies
devised within the systemic and integrated approach of RIS.
2. The Regional Innovation System Concept: Main Research Orientations and
Intermediate Conclusions
The regional innovation system (RIS) concept is recent, but it will probably become one of
the most influent in the next few years, namely for the design of regional development
policies. First, there is no doubt that the RIS concept was, in great part, derived from the
former concept of National Innovation System (NIS) (Freeman, 1987, 1995; Lundvall,
1992; Nelson and Rosenberg, 1993). Following Saviotti (1997), an innovation system can
be defined as a set of actors and interactions that have as the main objective the generation
and adoption of innovations. This definition recognizes that innovations are not generated
just by individuals, organizations and institutions but also by complex patterns of inter-
actions between them. So, within an innovation system, we can define the elements, the
interactions, the environment and the frontier.
The idea of RIS results from some convergence between works of regional scientists,
economic geographers and national systems of innovation analysts (Cooke, 2001). The RIS
have their relevance based on the fact that proximity plays a major role in network and
interaction density; this fact is, in general, attributed to the tacit nature of a relevant part of
knowledge. Tacit knowledge “is best shared through face-to-face inter-actions between
partners who already share some basic commonalities: the same language, common ‘codes’
of communication and shared conventions and norms (Asheim and Gertler, 2005, p. 293).
The regional dimension also generates a more “focused” knowledge basis as a cumulative
result of the clustering of economic and innovation-oriented activities. Asheim and Gertler
14
(2005) developed analogous arguments and did not hesitate to stress that “the more
knowledge-intensive the economic activity, the more geographically clustered it tends to
be” (Asheim and Gertler, 2005, p. 291).
Besides the cognitive and normative dimensions of a RIS, which can present different
degrees of intensity, the political dimension should, however, not be excluded. Cooke (2001)
referred “region” as a key component of a RIS, considering it as a meso-level political unit set
between the national or federal and local levels of government that might have some cultural or
historical homogeneity but which at least had some statutory powers to intervene and support
economic development, particularly, innovation. This political dimension has a major
relevance to the perspective, discussed below, of constructing a RIS in the follower regions.
Difficulties associated with the use of the RIS concept as an operational regional
policy tool remain important. First of all, there is still some degree of vagueness of the
concepts of innovation systems and of the limits established between national and regional
systems. This is mainly a consequence of the unstable causality relations identified for the
factors determining innovation at the national and regional levels. As it is stressed by
Edquist (2005), when we do not know yet very well what are the main and decisive drivers
of innovation, it is better to work with very broad and comprehensive concepts of NIS and
RIS. The rationale is simple. As the knowledge on the determinants of innovation is
incomplete and fragmented, it would be dangerous to exclude the potential factors not yet
analyzed in depth. However, from the state of recognizing what are the main factors which
are present in innovation processes to the possibility of having a clear and solid causality
model of innovation in concrete territories and economies, there is a great distance to be
accomplished and a lot of work to do. To accept the diffuseness of the concept is a defensive
way of overcoming the difficulties of the empirical research. But as far as the RIS is
concerned, the relevant question is how to combine the diffuseness with the systemic nature
of the concept. Some crucial and concrete questions should be addressed in order to use the
RIS concept as a policy tool in concrete territories: (i) What are the components of the
system? (ii) What are the relations among them? (iii) What are the activities (the function)
of the system? (iv) Are the boundaries of the system relatively to its environment clearly
defined?
In particular, the emergence of RIS within a national context generates additional
complexity in terms of components, interactions, activities and boundaries. At a conceptual
level, it seems crucial to define some criteria in order to allow a clearer distinction between
NIS and RIS. A misunderstanding about the boundaries of a RIS can generate, at the policy
15
level, very high coordination costs.
Another set of difficulties arise in the application of the RIS concept to different
specific regional contexts. Even within a strict knowledge-based economy perspective,
region differentiation is important, because the knowledge base of the existing productive
sectors is not the same everywhere and this affects the comparative relevance of actors and
interactions. Institutional frameworks can differ. As pointed out by many, cumulativeness
and path dependency are important characteristics of technological capabilities. At this
point, our major concern is to stress the biased orientation of the research literature on RIS to
experiments evolving in regions belonging to nations situated at the technological frontier or
in very fast catching-up countries. The research on NIS and RIS in less-developed countries
and regions is in its childhood (some exceptions are Mudambi and Santangelo, 2015 or
Trippl et al., 2015). The work by Asheim et al. (2006) about the interpretation of
innovation systems as public goods in less-developed countries is a very important indicator
of the new interest in extending the concept to countries usually approached through the
diffusion of technical and technological knowledge. The same could be said about the
efforts taken by Lundvall in extending the innovation approach to emergent economies.
This is the direct consequence of recognizing that institutional and organizational
experiments were the main factors responsible for the high-performing technological
trajectory of some emergent countries, principally the Asian ones.
In sum, we may say that the use of the RIS concept as a regional policy tool needs a
prudent approach.1 The theoretical foundations of the concept and of the determinants of
innovation at the territorial level (the Region—R effect) cannot be ignored. However, the
application of the available theoretical frameworks should be carefully made, taking into
account that research on less-developed region experiments is scarce, with no diversified
evidence of the evaluation results available. So, regional innovation policies built around
the concept of RIS are very promising, but they cannot be shaped following a standardized
format. The implementation of RIS in regions needs theoretical and strategic support to
avoid risks of high transaction costs in public policies. Besides this, in the follower regions,
RIS cannot emerge as simple efforts to increase the rationale of coordinating different
innovation drivers already in place. The RIS should be, on the contrary, a chance of
generating innovation-oriented patterns of behaviour, of mobilizing more institutions to
regional innovation and, principally, of placing firms at the core of the regional system.
16
3. The Case of the Follower Regions
From a descriptive point of view, it is easy to identify the macro-specificities of the
European follower regions in what concerns innovation. In general terms, in these regions,
the research and development (R&D) activities still have a small expression (R&D
expenditure often represents less than 1% of the GDP) and are mainly developed by the
public sector. The extreme weakness of the R&D activities in the business sector is
accompanied by a very low level of patent indicators. Efficiency in the R&D activities is
apparently low (for instance, the ratio of EPO or USPTO patents/R&D expenditure).
However, within this set of regions, we can find different performances in what concerns
productivity growth and what suggests that the nexus between knowledge creation and
growth is, for these regions, a complex one.
As Fagerberg (1987, 1988) has pointed out, productivity growth can be seen as the
result of two impulses: innovation and diffusion. For the follower countries or regions, the
relative contribution of diffusion for productivity growth tends to be greater than in the
more-advanced economies. However, as Fagerberg also refers, based on the experience of
successful catching-up economies, the follower countries or regions cannot rely only on a
combination of physical investment and the use of knowledge created outside. In order to
assure a continuous catching-up, they must also develop their own technological effort.
The idea that diffusion does not occur in an easy way, as a mechanic process of use of
imported knowledge in response to new market opportunities, should also be stressed. For
the follower economies, the capability to use and adapt technology created outside is much
more than a question of buying new equipment or codified product engineering. As stressed
by many, technical knowledge includes tacit knowledge. If the follower countries or regions
aim to promote the adoption of new technologies and to be able to quickly respond to
technological evolution, they must develop permanently capabilities that include tacit
knowledge. So, in a dynamic perspective, the distinction between innovation and diffusion
is a relative one, because the systemic factors that favour an effective diffusion are partly
the same as those that favour innovation.
In a seminal text dedicated to technological accumulation in developing countries,
Bell and Pavitt (1992) have presented the distinction between productive capacity and
technological capability. The first one can be improved with the availability of resources
that are needed to produce goods and services. In addition, technological capability requires
to skills, knowledge and experience held by individuals and organizations, and these
additional resources are largely the result of a learning process. So, not only diffusion is not

17
a mechanical process, but also, as referred by Bell and Pavitt (1992), it would be an error to
consider that, in developing countries, technological accumulation will occur as a simple
“by-product” of production. These arguments are obviously applicable to the European
follower regions.
In summary, the core of the evolutionary contributions to the complex relations of
interdependence between innovation and diffusion must be permanently taken into account.
The NIS and RIS concepts have been largely elaborated from the perspective of the
innovation frontier. In the follower regions, we must, on the contrary, build them from the
perspective of diffusion but also to discuss the feasibility of transforming the RIS into a
policy tool capable of generating a proactive approach of increasing technological
capabilities and fostering innovation. This is a fundamental acquisition of the evolutionary
research programme. The strategic approach to diffusion can no longer be understood just
as an exogenous process of knowledge transfer, a strictly imitative process. The art of
dealing with diffusion in a proactive way, creating innovative trajectories, will be the central
role of the RIS in the follower regions. Another specificity of the follower regions has to do
with the pre-existent weakness of the R&D activities in the business sector and the apparent bias
towards public R&D. However, firms must be at the centre of an innovation system not only
because innovation is by definition a commercial or business action but also because innovation
is not just the result of a “linear process” from formal R&D to production. As said before,
technological accumulation includes a learning process based on the conduction of productive
processes. So, innovation policies that present a bias towards public R&D –– as they do in
the follower regions - –- may have problems of “focus” and a lack of effectiveness. However,
building a RIS in a follower region is not just a challenge of rebalancing resources devoted to
R&D between institutional sectors. This aimed rebalance must be seen more as a result than as
a prerequisite for a successful RIS.
In the follower regions, the weakness of R&D in the business sector and the bias
towards public R&D activities can be interpreted as a signal of a high degree of
disconnection between productive capacity and technological capability, while the
connection between these two dimensions is at the centre of RIS in the frontier regions. So,
building a RIS in the follower regions is, in large part, a matter of identifying technological
trajectories based on links between the two dimensions referred above. In this process, one
set of difficulties can be linked to the technological characteristics of the existing economic
activities. Following the taxonomy of Pavitt (1984), if the regional economic structure is
based on “supplier-dominated” activities, as it is often, technological opportunities created
18
under a demand-pull mechanism will be scarce. On the contrary, regional economies with a
high expression of “specialized supplier” activities, based on what Asheim and Gertler
(2005) classified synthetic knowledge, will be abler to generate more technological
opportunities and links towards the R&D activities and to more technology-intensive
activities.
The other set of difficulties has to do with the “focus” of public efforts in order to reinforce
the regional endowment on technological inputs (formal skills, R&D facilities and so on). Firms
and institutions have a limited cognitive capability and so they cannot simultaneously
accumulate knowledge in many different fields. This is clearly illustrated by the fact that
advanced regions and countries, with the same level of human capital and R&D effort, present
different technological specialization. This need for “focus” clearly applies to the follower
regions, where technological resources are even scarcer.
At the same time, the reinforcement of the regional endowment on technological inputs
in the follower regions must rely, at least during the first phase, on public efforts. So, this
public “technological push” needs a clear strategic orientation in terms of technological
trajectories that are aimed. This aspect places the regional coordination at the centre of a policy
aiming to achieve a RIS. Otherwise, under a “bottom-up” impulse originated in public actors
such as universities and others, it will be risky to have a set of fragmented initiatives and a lack
of “focus” in this process. Nevertheless, this aspect shows that coordination costs associated
with innovation policy in the follower regions can be high. In countries where the structure
of the NIS is balanced and integrates well the centrality of firms and the level of interaction
between players is high, the evidence suggests that the increase in coordination costs
determined by the emergence of RIS is minimized. Or, in the follower countries and regions,
the reform of the NIS and the implementation of RIS will dispute endogenous resources
which are necessarily scarce. An adequate identification of the boundaries between NIS and
RIS should be placed at the core of the strategy of intervention.
In the following section, we will explore the idea that, in the follower regions, the
creation of the RIS should rely on a mix of dynamics, because it can hardly be supported by
a simple model in which endogenous R&D activities are the main drivers of the process or
by a model centered on the existing activities and firms. For doing so, we will apply as the
matrix of analysis a taxonomy built by Asheim and Gertler (2005) that encompasses the
links between the regional production structure, the institutional set-up and the different
patterns of knowledge production evolving in regions: territorially embedded RIS (TERIS),
regional networked innovation systems (RNIS) and regionalized NIS (RENIS). TERIS are

19
systems where firms base their innovation activity mainly on localized learning processes
stimulated by proximity, without much direct interaction with knowledge organizations.
RNIS correspond, as the authors say, to the ideal type of RIS: a regional cluster of firms
surrounded by a regional institutional infrastructure, implying planned policy interventions
that lead to a more developed role of regionally based organizations such as the R&D
institutes. In RENIS, exogenous actors and relationships play a major role, because industry
and support institutions are more integrated in the national or international systems. This
contribution can be particularly useful in order to call for more diversified models of RIS,
especially if we assume that the three above-mentioned types can be seen not only as
different morphologies but also as components of a more composite process. As highlighted
by Todtling and Trippl (2013), challenges are still relevant in the application of the RIs
framework, especially in the context of less developed regions (Martin and Trippl, 2014,
Trippl et al. 2015).
4. From Concept to Operational Tool: Building RIS in the Follower Regions
The European follower regions can be identified through some simple aggregate indicators
concerning development and technological levels. However, they can substantially differ in
what concerns structural features and structural change needs.2
Our analysis considers two Portuguese regions and two Spanish regions: Norte,
Centro, Galicia and Cantabria. Table 1 presents basic indicators for these regions, together
with national values and those concerning Stockholm region (a frontier region that leads the
European Innovation Scoreboard ranking). In accordance with their status as follower
regions, Norte, Centro, Cantabria and Galicia present an income per capita in purchasing
power parities that is generally below EU’s average. However, whereas the Spanish regions
are converging to the EU levels, the Portuguese regions have globally performed worse, not
converging or even slightly diverging from EUs average income in the case of the Norte
region. Furthermore, Norte with a per capita income of about 15,000 euros is the poorest
region of this analysis, whereas Cantabria is on the other extreme with an income per capita
of approximately 23,400 euros.
In what concerns the R&D efforts, all the four regions presented a gross expenditure
on R&D (GERD) in percentage of GDP below the EU15 average of 2,04% in 2015. Norte
with an R&D effort of 1,36%, Centro with a similar figure reaching 1,34%, Cantabria with
an investment of 0.86% and Galicia with a GERD on GDP amounting to 0,89% are even
20
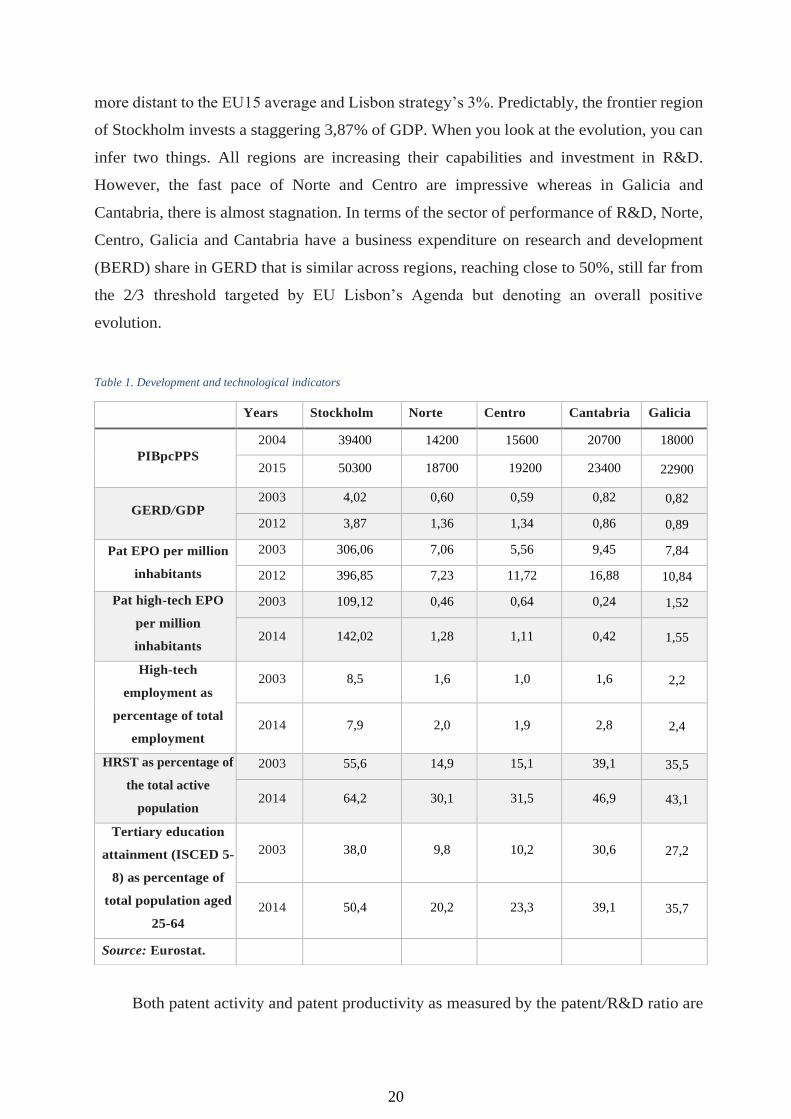
more distant to the EU15 average and Lisbon strategy’s 3%. Predictably, the frontier region
of Stockholm invests a staggering 3,87% of GDP. When you look at the evolution, you can
infer two things. All regions are increasing their capabilities and investment in R&D.
However, the fast pace of Norte and Centro are impressive whereas in Galicia and
Cantabria, there is almost stagnation. In terms of the sector of performance of R&D, Norte,
Centro, Galicia and Cantabria have a business expenditure on research and development
(BERD) share in GERD that is similar across regions, reaching close to 50%, still far from
the 2/3 threshold targeted by EU Lisbon’s Agenda but denoting an overall positive
evolution.
Both patent activity and patent productivity as measured by the patent/R&D ratio are
Table 1. Development and technological indicators
Years Stockholm Norte Centro Cantabria Galicia
PIBpcPPS
2004 39400 14200 15600 20700 18000
2015 50300 18700 19200 23400 22900
GERD/GDP 2003 4,02 0,60 0,59 0,82 0,82
2012 3,87 1,36 1,34 0,86 0,89
Pat EPO per million
inhabitants
2003 306,06 7,06 5,56 9,45 7,84
2012 396,85 7,23 11,72 16,88 10,84
Pat high-tech EPO
per million
inhabitants
2003 109,12 0,46 0,64 0,24 1,52
2014 142,02 1,28 1,11 0,42 1,55
High-tech
employment as
percentage of total
employment
2003 8,5 1,6 1,0 1,6 2,2
2014 7,9 2,0 1,9 2,8 2,4
HRST as percentage of
the total active
population
2003 55,6 14,9 15,1 39,1 35,5
2014 64,2 30,1 31,5 46,9 43,1
Tertiary education
attainment (ISCED 5-
8) as percentage of
total population aged
25-64
2003 38,0 9,8 10,2 30,6 27,2
2014 50,4 20,2 23,3 39,1 35,7
Source: Eurostat.
21
low, but with asymmetries. Cantabria, in spite of its lower R&D effort, applied the most for
patents. Norte showed little evolution, whereas Centro progressed significantly in this
indicator. Some of these differences may be accounted to the different economic structure.
It is, however, worth noting the positive evolution of these indicators, common to all the
four regions. For high-tech patents, Norte leads with 1.28 high-tech patents per million
inhabitants, followed closely by Centro with 1.22. Cantabria and Galicia, despite their
higher patent output, present smaller figures in terms of high tech patenting. As it results
from table 1, Stockholm is clearly n a different league, with a strong innovation system, in
clear association with a significantly greater GDP per capita.
4.1 Structural Features and Regional Assets
The previous paragraphs described the investment in knowledge production and proxied
innovation output. The results show an increasing, though still very low, level of R&D
investment along with a sector performance execution pattern mostly central to the
universities and government laboratories. Both the low participation of firms in R&D and
the regions innovative output are linked to their economic structure. The Norte region is a
well-studied example of a path-dependent trajectory of industrialization, evolving from a
productive structure clearly marked by the predominance of “supplier-dominated” sectors
(using the taxonomy proposed by Bell and Pavitt). Data shows that although the weight of
high and medium high-tech industries is similar to that of the other regions, Norte is still
very industrial (around 30% of GVA) and presents a predominant specialization in low-tech
and medium low-tech industries (textiles, apparel, shoes, furniture and other wood
industries and light mechanical industries). Recently, these sectors have become a good
example of smart specialization with the significant upgrade of production processes, with
greater control over the value chain beyond production, but also stimulating the co-growth
with specialized suppliers.
The Centro region shares some structural characteristics of the Norte region, namely
regarding the presence of supplier-dominated sectors (food industries, textiles and apparel
and shoes, albeit less represented than in the Norte, ceramics and metallic furniture).
Nevertheless, the economy of Centro, as for that of Galicia or Cantabria, does not present
a high share of low-tech activities. The region is usually presented in the literature as a fine
illustration of concentration of clusters, structured as localized learning and
entrepreneurship. Some of these clusters are evolving towards more diversified patterns of
22
specialization (automation and robotics, molds, components for the automobile industry,
software industries and tele- communications). Despite the peripheral geographical location
and debilities of transport infrastructures, Galicia possesses large natural energy resources,
fisheries and a significant tourism potential, much focuses around a natural resource, the
sea. Based on this, shipbuilding remains a very important activity with a strong
entrepreneurial basis (namely Astano and Empresa Nacional Bazan shipyards in Vigo and
Ferrol), and the same can be said about fisheries and fish industries (in which Pescanova is
a European leader). Agriculture still carries a considerable weight, in particular, stock
raising and milk production activities. Galicia also has an important cluster in automotive
industries with the presence of an original equipment manufacturer (OEM) (PSA group
automotive plant in Vigo) and several component producers. Recently, Galicia has
developed a strong cluster centered on fashion design and has been successful in the creation
of fashion global brands and global distribution (where Zara is a well-known case study).
With a strong industrial background, Cantabria has specialized in metal products, food
products, beverages and tobacco, ferrous and non-ferrous minerals and metals and
chemicals. Some of these activities are, nowadays, fragmented industries, due to the severe
change in the competitiveness conditions that occurred in heavy metal and chemical
activities. A different situation occurs in the automotive cluster, which gathers
approximately 130 small–medium enterprises and is structured around some large Tier 1
suppliers such as Nissan, Bosch, Bravo, Daimler-Benz and Bridgestone-Firestone. Like
Galicia, stock raising and agriculture are still important economic activities in Cantabria,
associated with food processing industry where Nestle is one of the biggest player. In what
concerns the regional network of knowledge infrastructure, Norte is served by three
representative universities: two of them are well placed in the national ranking (Porto and
Minho) and the other (UTAD) is mainly regional, integrated in a low-density and inner area
(Tras-os-Montes and Douro Valley). The two main universities have a solid education
capacity in all of the main technological domains (namely health sciences, biology,
mechanical engineering, materials and information and communication technology (ICT)).
In consequence, Norte has today a good supply of qualified technicians and researchers and
faces a light tendency of brain drain. Around the universities, there are a few relevant
technological institutes devoted to applied R&D and to technology transfer and services.
These non-profit interfaces between the universities and public and private firms operate in
areas such as biomedicine, immunology and cancer, human tissue engineering,
biomaterials, automation, energy and information systems. However, their sustainability
23
and dimension are still weak. There is still a group of polytechnic schools mainly
concentrated in the high-density coastal areas. The region also hosts some important
technological centres managed in a highly participated way by the firms (shoes, textiles and
apparel, cork and light mechanical industries). Nevertheless, the links between the
universities and firms are still thin.
The institutional framework in Centro is very similar to that in Norte. A similar
universe of universities dominates the research and high-education activities: two at the
coastal area, Coimbra (the oldest) and Aveiro (a dynamic newer university) and one at the
interior (Beira Interior) and a network of polytechnic schools, some of them articulated with
the universities, which complete the framework. Technological centres are also represented
(textiles and apparel, glass, molds and ceramics), and the dissemination of the university–
industry interface followed the pattern of the Norte experience.
In Galicia, the network of R&D institutions, namely universities, technological centres
and technology transfer infrastructures, is concentrated along the western coast of Galicia.
Based on three universities (Santiago de Compostela, Vigo and A Coruna), R&D
institutions are especially relevant to three domains: biology, with a special focus on marine
and fishing technologies and agriculture, automotive engineering and design. In the field of
biological sciences, technological infrastructures are devoted to research on sea biology,
oceanography, and agriculture and food technologies. Some examples are the technological
centres CETMAR,3 ANFACO-CEGOPESCA4 and CSIC.5 The automotive cluster of
Galicia finds important technological resources in the region, in particular, the technological
centre CTAG.6 In design, the technological centre CIS7 stands out as a major innovation-
support institution. However, a low density of links between industry and universities
characterizes a system where the divorce between firms and universities is still the rule and
not the exception (Faina et al., 2005).
In what accounts the institutional framework, Cantabria has one single university
(University of Cantabria) that constitutes a main building block for knowledge production
in the region. The University of Cantabria is relatively large considering the region’s size.
An academic hospital and some other office for technology transfer are also worth noting.
Cantabria’s research and technological institutions convey a specialization across three
basic scientific domains, namely biomedicine, ICTs and engineering. In the biomedical
field, the IFIMAV8 is the leading research institute. The regional capabilities of this area
are being extended with University of Cantabria’s Institute of Biology and Cellular
Research. In spite of the absence of a relevant ICT business sector, Cantabria possesses

24
research facilities for ICT, from which the School of Industrial Engineering and
Telecommunication (SIET) and the Institute of Physics (IFCA) stand out. IFCA and SIET
also enhance regional technological research offer in the engineering domain, in which the
Institute of Hydraulics (INHAM), the Schools of Civil Engineering and Mining and the
Component Technological Centre are other relevant expertise centres, the latter closely
linked to the automotive cluster.
In summary, all the four regions face a double challenge of fostering innovation in existing
activities but, at the same time, of structural change. Structural change needs are probably more
severe in Norte and Cantabria. In the first case, this is due to the high share that low-tech
industries still have in employment and to the fact that a large part of these industries, although
structured in local/regional clusters, face a “lock-in” problem and have a weak capacity to
generate new technological opportunities. In the second case, structural change needs are
expressed by the large employment destruction that occurred in traditional heavy industries
during the last three decades. In this period, growth and a relative prosperity where ensured
largely by non-tradable activities (construction and real estate) and by tourism, but new and
more technology-intensive activities in the tradable sector are confined to the automotive cluster
(however, without the presence of OEM facilities inside the region). The Centro region presents
a more diversified set of activities, and some of them have experienced a relevant technological
up-grading. For instance, the mold cluster (a typical synthetic knowledge activity) has evolved
from a simple manufacturing activity to an engineering activity. Galicia has the capacity to be
among the world leaders in some specific activities (fishing industries and fashion/distribution)
with a strong position in activities such as automotive that generate good technological
opportunities.
The commitment of all these regions to knowledge is now effective and based on
public initiatives. This “public push” is generating a good regional supply of human capital
and is at the basis of some interesting recent dynamics. Illustrating this strong commitment,
all the four regions are implementing projects of scientific and technological parks: AvePark
and Uptec in Norte; Biocant in Centro; Parque Tecnologico de Vigo and Tecnopolo de
Ourense in Galicia and PCTCAN in Cantabria. In the Norte and Centro regions, clusters of
ICT activities are already relevant, namely in software production. Their formation was
mainly induced by local start-ups co-generated by university institutions, but, more recently,
top world firms are locating facilities around (for instance, R&D centres of Microsoft in
Braga and of Siemens in Aveiro). Also, there are a few examples of external location
decisions concerning the R&D activities pursued by public or non-profit entities. The Norte
25
region, in particular, is showing a strong attractiveness in this field: Fraunhofer Institute is
currently beginning its operation (R&D and technological brokerage in ICT) in the campus
of the University of Porto; the European Centre for Tissues Engineering, an FP project, will
gather in AvePark 300 R&D European technicians; a joint initiative of Spain and Portugal
national governments has located in Braga the Iberian Nanotechnology Laboratory, which
will gather in place around 300 R&D Iberian technicians.
In Table 2, we summarize the information quoted above, considering the main assets
that can concur to a RIS. The mention of these assets is organized following the RIS type
for which each asset mainly operates, and we believe that the table is self-demonstrative.
Then, we will discuss the strategic goals and innovation strategies central to RIS
implementation.
4.2 Potential Innovation Trajectories and Feasibility of Implementing RIS
Following the conclusions of the precedent sections, the implementation of a RIS in the four
regions studied must be associated not only to a more effective innovation dynamics’ but
also to structural change needs. On the other hand, RIS implementation must ensure an
adequate combination between innovation and diffusion. Our assessment on the feasibility
of implementing RIS considers the evaluation of regional assets and is based on additional
questions concerning:
1. the innovation trajectories that can be considered with a certain probability of success;
2. the drivers of change that will support the implementation and
3. the critical paths of institutional and organizational change.

26
Table 2. Regional assets and recent dynamics concurring for RIS types

27

28
29
4.3 Innovation Trajectories
The group of four regions presents a contrasted pattern of productive specialization
generating very different conditions for demand-pull innovation. Norte is a particular case
of a persistent high share of low-tech activities, generating a limited set of opportunities for
knowledge accumulation. However, in all the four regions, there are relevant clusters on
tradable goods that can play a role under a demand-pull perspective: small equipment and
automotive components in Norte, molds in Centro, automotive clusters in Cantabria and
Galicia are good examples of this. These clusters present well-established networks of firms
and they integrate specialized technological agencies. They operate in activities based on
what Asheim calls synthetic knowledge, that is, capabilities partially based on tacit
knowledge and associated with the use and integration of several technologies. An
innovation trajectory based on these activities should now explore more effective links to
the R&D institutions. The “public push” in recent years has significantly increased the R&D
capabilities in scientific domains such as materials, hydraulics, automation and ICT. So,
links to the mastering of some core technologies following a demand-pull perspective are
possible, conducting to new high-tech business opportunities and to a better focus of public
R&D.
The above-mentioned innovation trajectories are in line with the analysis of successful
experiences of acquisition of advanced technological capabilities in developing countries.
Teitel (2006) mentions the existence of quasi-innovation systems in the sense that the
circumstantial convergence of prerequisites may explain the success of the punctual
experiences of acquisition of advanced technological capabilities in selected sectors. In this
case, the implementation of RIS needs the ability of exploiting the so-called circumstantial
convergence of prerequisites, amplifying them in a coherent way through links to the public
R&D sector. However, innovation trajectories based on the precedent are not sufficient in
order to respond to structural change needs and to the economic valorization of
technological inputs that are being created under the “public-push” investments. So, all the
four regions should incorporate more strategic oriented innovation trajectories, induced by
public intervention and following a “science-push” rather than a “demand-pull” perspective.
Again, the Norte region seems to be a particular case, because of the relevance of its
universities and public R&D assets. The recent creation of the “Portuguese Health Cluster”,
based in Porto, and gathering of approximately 100 organizations (universities, hospitals,
pharmaceutical firms, and medical device and material producers) configure a good
30
example. Cantabria also aims to build a health cluster, based on its excellence of research
and assets in scientific domains linked to the health sector. Constructing an innovation
trajectory largely based on public R&D assets implies a great emphasis on technological
entrepreneurship promotion and puts at the centre of the innovation policy the
organizational capabilities to do so in an effective way. Attracting foreign business players
will also be relevant (Mudambi and Santangelo, 2015). An adequate public support (namely
through service and device demand by the public health sector) is also necessary. In
summary, these kinds of innovation trajectories must be quite “public driven” during their
first stages. Apparently, Galicia configures a case where links between the business sector
and the R&D public infrastructure can be easier. Not only do the R&D activities seem to be
more focused in domains such as biotechnology and marine technologies, but also food and
fish industries have a strong economic basis, with the presence of some top world firms.
4.4 Drivers of Change
Our experience on recent dynamics in the four regions suggests that the first driver of
change relies on the efforts to accumulate resources in the general-purpose technologies.
Dynamics generated around ICT in the Norte and Centro regions are quite demonstrative
on this. After a period of sustained investment in higher education and R&D, technological
resources in ICT are generating the following dynamics:
clusters of ICT activities (mainly knowledge-intensive business services) around the
Universities of Minho, Braga and Coimbra, including many fast-growing start-ups;
strong articulation between public sectors (health, education and administration), which
places Portugal as a successful case of e-government;
wide spread of applications in the tradable good sectors;
good attractiveness for foreign direct investment (FDI), illustrated by recent location
decisions of some top world leaders.
So, the focus on general-purpose technologies seems to be an adequate leverage for
innovation trajectories in the follower regions. This is because the process combines the
emergence of new clusters with the incremental innovation processes in a wide range of sectors.
Resources formation in general-purpose technologies illustrates a process where innovation and
diffusion are clearly combined and so this will suit very well to the follower region specificities
and challenges (in the same sense, see Bresnahan and Trajtenberg, 1995). Regional endowments
in the general-purpose technologies are also proving to be powerful attractors for high-tech

31
FDI. The formula, in Cooke’s sense, combines internal and external knowledge: “A strong,
regionalized innovation system is one with systemic linkages between external and internal
sources of knowledge productions (universities, research institutions and other intermediary
organizations and institutions providing government and private innovation services) and firms,
both large and small” (Cooke, 2006).
Besides ICT, nanotechnologies will be at the centre of a new generation of general-
purpose technologies (Youtie et al., 2008). The location in the Norte region of one of the
main European research centres (Iberian Nanotechnology Laboratory) will be a major asset
to this perspective.
Another driver of change has to do with entrepreneurship. Because the follower
regions must face structural change challenges and a relevant part of their entrepreneurial
resources suffer from “lock-in” effects (Portuguese experience shows that financial resources
accumulated in traditional tradable good activities tend to be applied in non- tradable good
sectors such as financial and utilities sectors), innovation trajectories based on “science-push”
mechanisms must incorporate the promotion of technological entrepreneurship. Even in the
frontier regions, technological entrepreneurship was largely induced by public initiatives,
namely university incubators (see, for instance, Lofsten and Lindelof, 2002). So, arguments in
favour of public initiatives in that field will also apply to the follower regions, where the
high-tech business sector is weaker. Still associated with entrepreneurship, the clustering of
external initiatives could be a major scope for RIS implementation in the follower regions.
Frontier regions have built the RIS in an international context in which locations of the
R&D activities largely relied on endogenous initiatives. Since the 1990s, FDI flows in
R&D have increased significantly and changed their scope. This tendency has been
highlighted by several authors (e.g. Gerybadze and Reger, 1999; Hedge and Hicks, 2008;
Kuemmerle, 1999; Meyer-Krahmer and Reger, 1999; Serapio and Dalton, 1999).
Multinationals global R&D investments are still mostly focused on developed countries
(Meyer-Krahmer and Reger, 1999), though the cost advantage and high-quality
competences have attracted the R&D flows to pockets of knowledge such as the Indian
ICT cluster in Bangalore (Kumar, 1996). In spite of the focus of multinational FDI R&D
in the US, EU and Japan (Meyer-Krahmer and Reger, 1999), the acknowledgement of
excellence research centres in the follower regions pose to these regions new relevant
opportunities. Thus, FDI R&D is going from a market-penetration strategy to a technology-
oriented strategy (Florida, 1997). Among the motives for FDI R&D’s current trends, the
literature has put forward two main strategies: home base exploiting and home base
32
augmenting. The first explanation implies that firms seek mostly to explore their own
advantages in other markets. Hence, the R&D activities conducted there are of a supportive
type (Kuemmerle, 1999; Le Bas and Sierra, 2002). The second explanation lays on
multinationals trying to enhance their competitive advantage-building blocks by tapping
into centres of excellence with important competences. This strategy aims to extend the
company’s knowledge base and leads to the establishment of the R&D facilities, following a
model of a global network that only maintains at home a coordination privilege (Kuemmerle,
1999; Le Bas and Sierra, 2002; Meyer-Krahmer and Reger, 1999). So, an increasing
awareness of the systemic and learning features of innovation goes together with a tendency
to effectively gain access to worldwide knowledge reservoirs. Empirical evidence seems to
provide support to this view and the trend of an increased importance of the home-base
augmenting strategy (e.g. Gerybadze and Reger, 1999; Hedge and Hicks, 2008;
Kuemmerle, 1999; Le Bas and Sierra, 2002).
These results provide important insights into the terms of regional innovation policy,
and though the literature is mostly focused on technological frontier or advanced follower
regions, important insights can be derived for the follower regions such as Norte, Centro,
Galicia and Cantabria. On the one hand, this tendency constitutes an opportunity for regions
to develop policies following an outside – inside perspective in attracting and clustering
external R&D initiatives and speeding up capability building and catching-up. On the other
hand, FDI R&D has highlighted the importance of the science-push perspective in policy
terms, though it also indicates that specialization and scale are precursors of excellence and
that multinationals are increasingly selective. The last driver worth mentioning has to do
with brokerage institutions and activities. After a solid expansion of the expenditure on the
R&D public organizations, the four regions considered in the analysis are implementing a
new set of technological infrastructures clearly defined as brokerage institutions. In
particular, science and technological parks such as AvePark and Uptec in Norte, Biocant in
Centro, PCTCan in Cantabria and Tecnopolo de Ourense in Galicia are in their early stages,
but they are showing a good capability to attract firms and other organizations. As noted by
Felsenstein (1994) and Asheim and Coenen (2005), science and technological parks
promote systemic industry– university cooperation and technological transfer. In the
follower regions, science parks can play a major role in the emergence of new technology-
intensive clusters, as analyzed by Bakouros et al. (2002). Druille and Garnsey (2000) also
emphasized the role of science parks in Cambridge and Grenoble as attractors of high-tech
and R&D external investments, even if these investments are located outside the park.
33
4.5 Institutional and Organizational Change
The above considerations make it clear that in less-developed regions, the implementation
of RIS is very sensitive to the policy decision process and to policy environment. So, the
feasibility assessment of the creation of RIS cannot be dissociated, and it is strongly inter-
dependent on institutional and organizational change. For all the regions studied, the
implementation of a RIS can be seen as a radical innovation in the governance model of
regional policies. Financial public support to innovation is a consensual matter. The basic
foundations for innovation policy rely on the idea that innovative activities and specially
R&D activities are a source of technology spillovers. Arrow (1962) argued that a positive
spillover results from any new technological knowledge due to the existence of
indivisibilities, non-appropriabilities and uncertainties. Since then, several authors (Jones,
1995; Romer, 1990, 1993) have discussed the knowledge attributes of non-rivalry and
dynamic feed- back. As a consequence, the social return of innovative actions turns out to
be higher than the private return.
Governments at the national level have traditionally used direct funding of basic and
applied research and indirect methods such as the patent system and research tax credits to
help mitigate market failures and the resulting underinvestment problem. However,
conventional instruments for innovation policy had little to do with the RIS perspective.
Here, the focus is clearly put on network-based support and on strengthening the region’s
institutional infrastructure. In addition to a market failure approach, regional innovation
policies must follow a coordination approach.
Innovation policies in the follower regions often fail short in the promotion of inter-actions
between public and business sectors, but these interactions are at the centre of the systemic
nature of RIS. As analyzed by OECD (2008) in what concerns the Portuguese experience (QCA
III) and Cantabria experience, this lack of articulation reflects both the weakness of internal
R&D skills in the business sector and the model of financing public and non-profit R&D
organizations. In frontier regions, links between science and industry can be seen as a matter of
increasing the “fitness” of a system that has already consolidated elements. Differently, the
promotion of these links in the follower regions must go together with the sustainable expansion
of the public R&D sector and with the development of internal capabilities in firms. However,
policy instruments for both public and business sectors have mainly relied on financial
subventions to business projects and to public organizations.
34
+
A new set of policy instruments is needed. For the business sector, instruments such
as public subventions to wage expenses of young researchers and technicians employed by
firms have proved to be efficient in other experiences. Small teams of R&D personnel will
be effective in internal R&D development, but also –- and in many case we should say
mainly -- they will play a crucial role in creating a demand for technological services and,
hence, to create linkages with science and technological institutions.
Because the RIS perspective emphasizes innovation as a highly localized process
favoured by interactions, policy instruments should be based on the idea of public – private
partnership involving several local actors. For instance, the support to the R&D consortia
projects with mandatory participation of the business sector is of major importance and crucial
to increase the connectivity between firms and other institutions. Not only will this promote
R&D in firms, but it will also be helpful to lead the R&D activities in other institutions to be
more focused on the firms’ needs. This kind of instruments was only recently applied to the
Portuguese experience, but the instruments are proving to be very effective. On the contrary, in
the Cantabria R&D I Plan for 2006 – 2010, we did not find the same kind of instruments, at
least in an explicit way.
Also, programs aiming to promote technological start-ups are almost always based on
institutional networks involving public agencies, universities, technological centres,
research institutes, entrepreneurial associations and other non-profit institutions. Regarding
this, international experience shows that national multi-sectoral programs tend to be less
effective than regional targeted programs. This led us to a final question concerning critical
paths of the organizational and institutional dimensions of RIS: coordination costs can be very
high if the boundaries and articulation between regional and national systems of innovation are
not clearly defined. Norte and Centro are the follower regions within a follower country and,
in fact, they are “planning regions” under the statutory power of the national government.
We find one major weakness for RIS implementation in this. On the one hand, the NIS
framework is itself unachieved. On the other hand, as Cooke (2001) referred, “region” is a key
component of a RIS, considering it as a meso-level political unit set between the national or
federal and local levels of government that must have at least some statutory powers to
intervene and support economic development. On the contrary, Cantabria and Galicia are
political regions with a high degree of autonomy and competences in a large set of fields of
economic and development policies. So, the problem is restricted to the definition of a pattern
of cooperation with the NIS. The following table provides a preliminary grid of analysis for
assessing the feasibility of implementing RIS in the selected regions.

35
Rationale and Catching up with In line with the Lisbon Agenda, all the four regions must pursue a sustained increase in their technological own effort strategic goals more-advanced regions
Fostering innovation
with expression in technological level indicators. In particular, the expansion of business R&D and patenting are critical goals
Innovation promotion in all sectors (tradable and non-tradable activities). However, the low level of average technological indicators reflects, to a great extent, regional economic structures still including low-tech activities
Structural change needs
Norte is an extreme case of a European region with a great prevalence of low- tech activities but, at the same time, a sustained expansion of the public R&D system is creating good conditions for the emergence of knowledge- intensive activities
Centro also needs to pursue structural change objectives, although in a less “dualistic” context than that observed in Norte
Cantabria has observed a process of deindustrialization with the collapse of former activities central to its specialization profile but, with exception of the automotive cluster, Cantabria experiences some difficulties in launching new activities of tradable goods
In comparative terms, Galicia seems to be the region where structural change needs are less sticking. However, strong clusters in fish industry or automotive industry should generate a path towards the mastering of core technologies and the emergence of knowledge-intensive activities
Table 3. Preliminary grid for assessing the feasibility of implementing a RIS framework

36
Implementing RIS Implementation of a regional innovation system will be a radical innovation in order to manage successfully a new cycle of policies oriented towards innovation and competitiveness goals Innovation trajectories
“Demand-pull” trajectories based on existing clusters
In all the four regions, there are relevant clusters with a strong entrepreneurial basis and technological sectoral support infrastructures (technological centres), namely synthetic knowledge activities (Asheim) or specialized suppliers (Pavitt). This allows potential trajectories towards the mastering of core technologies and the emergence of knowledge-intensive activities
Technical and functional textile cluster; small equipment and automotive component cluster
Mold cluster, evolving to engineering activities
Automotive cluster Fish and food industries, with regional world leader firms; automotive cluster with OEM facilities
Public sector “science-push” trajectories
All the four regions are expanding in a relevant way with their human capital endowment and the R&D public activities. New business activities largely based on local start-ups but with an eventual presence of FDI are emerging or foreseen
ICT cluster; health cluster ICT and telecommunications; biotechnologies
Health cluster Biotechnologies (namely marine); ICT
(Continued )
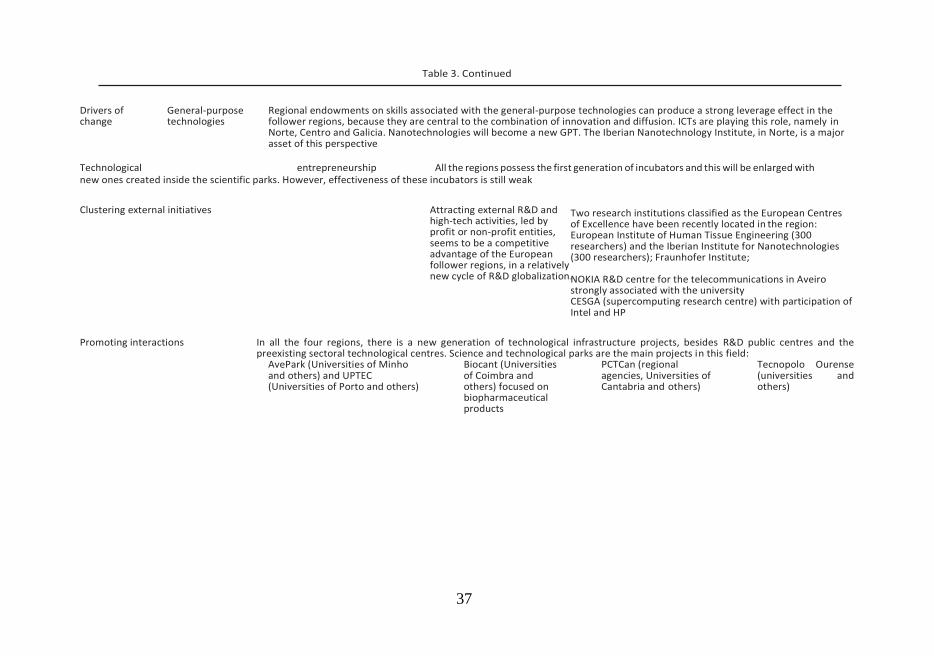
37
Table 3. Continued
Drivers of change
General-purpose technologies
Regional endowments on skills associated with the general-purpose technologies can produce a strong leverage effect in the follower regions, because they are central to the combination of innovation and diffusion. ICTs are playing this role, namely in Norte, Centro and Galicia. Nanotechnologies will become a new GPT. The Iberian Nanotechnology Institute, in Norte, is a major asset of this perspective
Technological entrepreneurship All the regions possess the first generation of incubators and this will be enlarged with new ones created inside the scientific parks. However, effectiveness of these incubators is still weak
Clustering external initiatives
Attracting external R&D and high-tech activities, led by profit or non-profit entities, seems to be a competitive advantage of the European follower regions, in a relatively new cycle of R&D globalization.
Two research institutions classified as the European Centres of Excellence have been recently located in the region: European Institute of Human Tissue Engineering (300 researchers) and the Iberian Institute for Nanotechnologies (300 researchers); Fraunhofer Institute; NOKIA R&D centre for the telecommunications in Aveiro strongly associated with the university CESGA (supercomputing research centre) with participation of Intel and HP
Promoting interactions
In all the four regions, there is a new generation of technological infrastructure projects, besides R&D public centres and the preexisting sectoral technological centres. Science and technological parks are the main projects in this field:
AvePark (Universities of Minho and others) and UPTEC (Universities of Porto and others)
Biocant (Universities of Coimbra and others) focused on biopharmaceutical products
PCTCan (regional agencies, Universities of Cantabria and others)
Tecnopolo Ourense (universities and others)

38
Institutional and organizational
change
Needs of policy instruments reform
The major aspect has to do with the weak level of connectivity between the business sector and public entities. This is observed in all the four regions. To overcome this problem, a new set of policy instruments are needed, under a general concept of private – public partnership. Instruments shaped for the integration of engineers, masters and PhDs in firms should be significantly enhanced. Specific instruments for projects developed in industry – university consortia are also central to RIS implementation
Articulation with NIS
The implementation of a RIS increases coordination costs. The definition of boundaries between national and regional systems is still vague because, in practice, it is not easy to assess a comparison between regional and national social benefits. In the follower regions and follower countries, these problems are amplified because managing innovation systems is also a learning-by-doing process. This is a challenge for governments but also for other organizations. For instance, universities such as those in the four regions studied are national universities that pursue internationalization objectives; the top-ranked scientific teams are strongly attracted by the new opportunities generated by the internationalization of the national scientific system led by the government.
39
5. The Importance of European Regional Development Fund (ERDF) in
Overcoming Structural Blockades
The use of the RIS conceptual framework is abundant in the frontier regions, because all
the basic inputs are already present. Hence, RIS is particularly helpful in understanding how
to boost innovative capacity and build competitive advantages. However, as stated before,
the RIS concept has been used considerably less in the follower regions. The follower
regions present a set of additional challenges to devise and implement innovation policies.
The structural lock-ins, the fragility of the technology market (in many cases, there is a poor
demand-pull effect to support the emergence of more technology-intensive activities) and
the fragilities on the inputs for innovation make innovation policy and the systemic approach to
it harder to implement. Nevertheless, the RIS framework is particularly important to the
understanding of innovation and the identification of weaknesses that should be overcome
through integrated systemic policies. In the follower regions where there is a weak demand pull,
it is even more important that innovation policies combine technology-push and demand-pull
instruments. In the Norte and Centro regions and, nowadays, to a less extent in Galicia, ERDF
support has been crucial to the “break” of structural lock-ins.
In the programming period of 2000–2006, an investment-driven perspective was still
predominant in the allocation of ERDF, though there was a simultaneous significant public push
that had installed capacity to form highly qualified human capital and had raised the R&D
investment levels significantly. The current programming period has witnessed a change in
design, with an increasing focus on entrepreneurial R&D and the on instruments that foster a
close collaboration between universities and enterprises such as “R&DT voucher”, “innovation
voucher” and “company directed co-promotion”. The “vouchers” are attributed to companies
that either want to increase their technological profile or need to address a specific issue. These
vouchers are applied for and attributed to companies competing internationally and can only be
“cash-in” in previously accredited university R&D facilities. The “co-promotion” instrument
involves a much bigger investment and associates an enterprise to a university to the
development of a technology or product. The current programming period embodies a shift of
focus from investment-driven policies to innovation-driven policies. That has been the focus of
the recently completed programming period 2017-2013 which emphasis was on fostering the
evolution of companies along their value chain, namely upstream towards conception and
downstream towards logistics and distribution. The RIS framework has been in the heart of the
forging of regional cohesion policy in what relates to innovation. In the new programming period

40
2014-2020, the RIS framework is still a reference, although in the setting of the new paradigm
of smart specialization, as discussed in the following section.
6. Smart specialization: the new ERDF conditionality
The Smart Specialization concept derives from two strands of the economic literature, one
focused on the transatlantic productivity gap and the other on the sectorial innovation systems
(McCann and Argiles, 2011). According to Foray and van Ark (2007) and Foray et al. (2009),
smart specialization is about the refocus of R&D and Innovation in alignment with regions’
distinctive features. In other words, regions must specialize in order to be able to generate critical
mass.
Having briefly presented the concept of smart specialization, the following table
synthesizes the main differences between RIS and RIS3. We conclude that smart specialization
is not a radical innovation but more a more policy-oriented version of RIS, stressing the
importance of polarization of resources and differentiation of strategies. In other words, it
highlights the importance for regions to devise a successful internationally competitive
positioning strategy that will imply specializing in a limited number of activities, in accordance
to each region’s idiosyncrasies.
Like RIS, RIS3 emphasizes the “knowledge ecology” of regions (McCann and Argiles,
2015), and implicitly, issues like path dependency. SS derives from a focus on Knowledge
Intensive economic activities concentrated in frontier regions. Hence, in its most “pure”
assertion, SS would induce crowding-out of resources towards frontier regions and aggravate
asymmetries. The solution presented in EC literature implies a clear divide (Frontier regions
specialize on GPT and Follower in the co-invention of applications (distribution of value added
potential may be asymmetric) that regional policy must address. Notwithstanding, SS can be
useful as an adapted tool to devise fine-tuned policies and instruments, targeted at each region’s
peculiarities.
In our opinion, as detailed in Table 4, we see RIS and Smart Specialisation perspectives
as different but also complementary. Smart specialisation seems to us as bringing a more
operational focus and can easily be adapted also to non-technological assets; RIS perspective is
useful in remembering us that strategic goals must considerer a dynamic vision and, in doing so,
can avoid “non smart” effects of a mechanical application of the specialisation principle.

41
Table 4. Smart Specialization versus Regional innovation System perspectives
Smart Specialization Regional Innovation Systems
Rationale
• Specialization generates optimal
allocation of resources and full
exploitation of agglomeration and
scale economies
• Innovation as a systemic process,
favoured by proximity
Focus
• Specialisation
• Mostly intra sector spillovers
• Modes of innovation: STI
• Organizations, institutions and
interactions
• Intra and inter sector spillovers
• Modes of innovation: STI and DUI
Dynamic path • Path dependency: Growth,
diversification or substitution along a
specialised domain
• Path dependency: Related diversity
(e.g. Neffke and Henning, 2013)
• Eventually, structural change
Resources / Assets
• Though more focused on STI mode of
innovation, smart specialization
assumes the relevance of
differentiated assets (can include
natural, cultural,...)
• Mainly technological and
institutional
• Lack of attention to non-
technological assets
Policy
• Only bottom-up
• Re-specialization fine tuning
• “Picking winners”
• Top-down and bottom-up
• Correcting system´s structural
deficiencies
• “Public push” is not excluded
Possible “policy
failures”
• Crowding out effects by “picking
winners”
• Overspecialization, reinforcing lock
ins and increased exposure to external
shocks
• Public push bias
• Lack of focus
Territorial level • National, Regional • Regional
Concept application
range
• Concept moulded for frontier regions
or countries
• Concept moulded for different
development level regions
(although with density of
interactions)
7. Conclusions
The central question addressed in this paper is the feasibility of implementation of a RIS in a
follower region. The precise definition of what is a follower region was out of our scope. We
have considered as case studies four European regions (Norte and Centro in Portugal and
Galicia and Cantabria in Spain) that are clearly far from the development and technological
levels of the frontier regions. All the four regions need to not only foster innovation and
increase productivity at the aggregate level, but also ensure a process of structural change.
For these regions, the implementation of a RIS can be seen as a radical innovation in
innovation policy. The systemic nature of a RIS can improve effectiveness of policy
and, in doing so, will accelerate a catching-up process. However, the RIS concept is

42
still vague and is being structured mainly on the framework of developed region
experiences. So, using the RIS concept as a policy tool for fostering innovation and
structural change in the follower regions is a new challenge. We used the taxonomies of the
RIS proposed by authors such as Asheim and Cooke as an instrument for evaluating regional
assets that can support and be enhanced by RIS implementation. The analysis applied to our
four concrete cases confirmed the explanatory power of the taxonomies, namely if we accept
the idea that these taxonomies can also be taken as components of a more composite process
of RIS implementation. For our follower regions, we have considered the relevance of four
drivers of change: the leverage effect induced by the general-purpose technologies, the
need for effective promotion of technological entrepreneurship, the accelerator role played
by a competitive position that follower regions present in order to attract and cluster external
initiatives and, finally, the need for a new set of organizations placed at the centre of
connectivity or interaction promotion.
This methodology must be taken as the first proposal, and we believe that it can be
enriched by a deeper analysis of recent dynamics that are underway on the four studied
regions as well as by its application to a larger set of regions.
Notes
1. In the sense that some social scientists such as Flyvbjerg (2001) used the Aristotelian concept of phronesis
developed in the Nicomachean Ethics rediscovered by authors such as Foucault. In this context, a prudent
approach means that virtues dealing with context, practice, experience, common sense, intuition and practical
wisdom should also be taken into consideration.
2. A more precise typology of regions would be useful, but it corresponds to an exercise that is outside the
scope of our analysis. For instance, Todtling and Trippl (2005), based on the European experiences, considered
three kinds of regions: peripheral, old industrial and fragmented metropolitan regions.
3. Centro Tecnologico del Mar.
4. Centro Tecnologico Nacional de Conservacion de Productos de Pesca.
5. Includes the Instituto de Investigaciones Agrobiologicas, the Instituto de Investigacions Marinas and the
Mision Biologica de Galicia.
6. Centro Tecnologico de la Automocion de Galicia.
7. Galicia Tecnolox ıa e Deseno.
8. Instituto de Formacion e Investigacion Marques de Valdecilla.

43
References
Arrow, K. (1962) The economic implications of learning by doing, Review of Economic
Studies, 29(3), 155-173.
Asheim, B. and Coenen, L. (2005) Knowledge bases and regional innovation systems:
Comparing Nordic clusters, Research Policy, 34(8), 1173–1190.
Asheim, B. and Gertler, M. (2005) The geography of innovation, in: J. Fagerberg, D. C.
Mowery and R. R. Nelson (Eds) The Oxford Handbook of Innovation, Chap. 11, 291–
317 (Oxford: Oxford Uniersity Press).
Asheim, B., Annerstedt, J., Blazek, J., Boschma, R., Brzica, D., Lindholm, D., Del Castillo
Hermosa, J., Laredo, P., Moula, M. and Piccaluga, A. (2006) Constructing Regional
Advantage, Principles, Perspectives, Policies (Brussels Directorate-General for
Research, European Commission).
Bakouros, Y., Mardas, D. and Varsakelis, N. (2002) Science park, a high tech fantasy? An
analysis of the science parks of Greece, Technovation, 22(2), 123-128.
Bell, M. and Pavitt, K. (1992) Accumulating technological capability in developing
countries, in: Proceedings of the World Bank Annual Conference on Development
Economics 1992, Washington, DC, The World Bank, 1993.
Bresnahan, T. F. and Trajtenberg, M. (1995) General purpose technologies: Engines of
growth? Journal Econometrics, 65(1), 83-108.
Cooke, P. (2001) Regional innovation systems, clusters, and the knowledge economy,
Industrial and Corporate Change, 10(4), 945-974.
Cooke, P. (2006) Regional Innovation Systems as Public Goods (Vienna: United Nations
Industrial Development Organisation (UNIDO)).
Druille, C. and Garnsey, E. (2000) Emergence and growth of high-tech in Cambridge and
Grenoble, Entrepreneur- ship and Regional Development, 12(2), 163-177.
Edquist, C. (2005) Systems of innovation: Perspectives and challenges, in: J. Fagerberg, D.
Mowery and R. R. Nelson (Eds) The Oxford Handbook of Innovation, pp. 181–208
(London: Oxford University Press).
Eurostat (2004) Portrait of the regions. Available at:
http://circa.europa.eu/irc/dsis/regportraits/info/data/en/ ser.htm (accessed 8
September 2010).
Fagerberg, J. (1987) A technology gap approach to why growth rates differ, Research Policy,
16; reedited in The Economics of Innovation (C. Freeman), Edward Elgar, 1990.

44
Fagerberg, J. (1988) Why growth rates differ, in: G. Dosi, C. Freeman, R. Nelson, G.
Silverberg and L. Soete (Eds) Technical Change and Economic Theory, 432-457
(London: Pinter Publishers).
Faina, J., Lorenzo, A., Conti, I., Manso, G. and Figueiredo, A. (2005). As cidades do Eixo e
os sistemas de innovacio n, in: X. M. Souto, X. Bouzada and A. Figueiredo (Eds)
Livro III: Competitividade e Inovação, II Estudos Estratexicos do Eixo Atlantic, Chap. 5,
143–302, Santiago de Compostela: Xunta de Galicia, 2005.
Felsenstein, D. (1994) University-related science parks: Seedbeds or enclaves of
innovation? Technovation, 14(2), 93-110.
Florida, R. (1997) The globalization of R&D: Results of a survey of foreign-affiliated R&D
laboratories in the USA, Research Policy, 26(1), 85-103.
Flyvbjerg, B. (2001) Making Social Science Matter: Why Social Inquiry Fails and How It Can
Succeed Again (Cambridge, UK: Cambridge University Press).
Freeman, Ch. (1987) Technology and Economic Performance: Lessons from Japan (London:
Pinter).
Freeman, C. (1995) The national innovation systems in historical perspective, Cambridge
Journal of Economics, 19(1), 5-24.
Gerybadze, A. and Reger, G. (1999) Globalization of R&D: Recent changes in the
management of innovation in transnational corporations, Research Policy, 28(2), 251-
274.
Hedge, D. and Hicks, D. (2008) The maturation of global corporate R&D: Evidence from
the activity of U.S. foreign subsidiaries, Research Policy, 37(3), 390-406.
Jones, C. I. (1995) R&D-based models of economic growth, Journal of Political Economy,
103(4), 759-784.
Kuemmerle, W. (1999) The drivers of foreign direct investment into research and
development: An empirical investigation, Journal of International Business Studies,
30(1), 1-24.
Kumar, N. (1996) Intellectual property protection, market orientation and location of
overseas R&D activities by multinational enterprises, World Development, 24(4),
673-688.
Le Bas, C. and Sierra, C. (2002) Location versus home country advantages’ in R&D
activities: Some further results on multinationals’ locational strategies, Research
Policy, 31(4), 589-609.
45
Lofsten, H. and Lindelof, P. (2002) Science parks and the growth of new technology-based
firms—academic- industry links, innovation and markets, Research Policy, 31(3),
859-876.
Lundvall, B. A. (1992) National Innovation Systems: Towards a Theory of Innovation and
Interactive Learning
(London: Pinter).
Martin, R. and M. Trippl (2014), 'System Failures, Knowledge Bases and Regional
Innovation Policies', disP - The Planning Review 50(1), 24-32.
McCann P. and Ortega-Argilés R. (2015), “Smart Specialization, Regional Growth and
Applications to EU Cohesion Policy”, Regional Studies, 49 (8), pp. 1291-1302.
Meyer-Krahmer, F. and Reger, G. (1999) New perspectives on the innovation strategies of
multinational enterprises: Lessons for technology policy in Europe, Research Policy,
28(7), 751-776.
Mudambi, R. and G.D. Santangelo (2015), 'From Shallow Resource Pools to Emerging
Clusters: The Role of Multinational Enterprise Subsidiaries in Peripheral Areas',
Regional Studies, 1-15.
Neffke, F. and M. Henning (2013), 'Skill relatedness and firm diversification', Strategic
Management Journal 34(3), 297-316.
Nelson, R. and Rosenberg, N. (1993) Technical innovation and national systems, in:
National Innovation Systems, Chap. 1, 2-22 (Oxford: University Press).
OECD (2008) LEED Entrepreneurship and Local Innovation Systems Reviews—The Case of
Cantabria (Paris, France: OECD).
Pavitt, K. (1984) Sectoral patterns of technical change: Towards a taxonomy and a theory,
Research Policy, 13(6), 343-373.
Romer, P. (1990) Endogenous technical change, Journal of Political Economy, 98(5), 71-
102.
Romer, P. (1993) Idea gaps and object gaps in economic development, Journal of Monetary
Economics, 32(3), 543-573.
Sadyrtdinov, R. Korabley, M. and Vladimirova, S. (2015) “Regional Innovation System
development: comparative analysis of the republic of Tatarstan and Volga Federal
Districti Regions, Mediterranean Journal of Social Sciences, 6 (1), pp. 314-317.
Saviotti, P. P. (1997) Innovation systems and evolutionary theories, in: C. Edquist (Ed.) Systems
of Innovation— Technologies, Institutions and Organizations, 180-199 (London: Pinter).
46
Serapio, M. and Dalton, D. (1999) Globalization of industrial R&D: An examination of
foreign direct investments in R&D in the United States, Research Policy, 28(2), 303-
316.
Stiglitz, J. E. and Wallsten, S. J. (1999) Public– private technology partnerships: Promises
and pitfalls, American Behavioral Scientist, 43(1), 52-73.
Stiglitz, J. E. and Wallsten, S. J. (2000) Public– private technology partnerships, in: P.
Rosenau (Ed.) Public– Private Policy Partnerships, 37-58 (Cambridge: The MIT
Press).
Teitel, S. (2006) On semi-industrialised countries and the acquisition of advanced
technological capabilities, Economic Innovation and New Technologies, 15(2), 171-194.
Todtling, F. and Trippl, M. (2005) One size fits all? Towards a differentiated regional
innovation policy approach, Research Policy, 34(8), 1203-1219.
Tödtling, F. and M. Trippl (2013), 'Transformation of regional innovation systems: from old
legacies to new development paths'. in P. Cooke (ed.), Reframing regional development,
London: Routledge, 297-317.
Trippl, M., B.T. Asheim and J. Miorner (2015), Identification of regions with less developed
research and innovation systems. Papers in Innovation Studies.
Youtie, J., Iacopetta, M. and Graham, S. (2008) Assessing the nature of nanotechnology:
Can we uncover an emerging general purpose technology? The Journal of Technology
Transfer, 33(3), 315-329.
47
CHAPTER 2: OPERATIONALIZING SMART SPECIALIZATION IN A
FOLLOWER REGION
Abstract
The incapacity of EU to grow has raised questions regarding the effectiveness of
competitiveness and growth policies. To increase the efficiency and effectiveness, EU has
determined that regions must undergo an exercise and devise a strategy of smart specialization.
However, particularly in follower regions facing severe lock in problems and structural
bottlenecks, the application of smart specialization may require adjustments and a dynamic
vision. Furthermore, many operational issues arise in the programming and policy-devising
stages. In this paper we discuss the novelty of the smart specialization concept, namely relative
to the concept of regional system of innovation, addressing the case of follower regions and
how to translate it into an actual innovation policy tool. Finally, we apply the smart
specialization framework to the Portuguese Norte region.
Keywords: smart specialization, innovation policy, regional innovation systems, follower
regions
1. Introductory notes
The European Union (EU) is a bold construction that aims to create a unified and seamless
economic, financial and political area within Europe. One of the pillars for this process is the
belief that all members stand to gain in this process and that Europe can be a world reference
in competitiveness and, in particular, innovation. In the last decade, EU has set as a goal world
leadership in innovation and devise a trajectory of growth and jobs supported in the knowledge
economy.
The goal of becoming a beacon of innovation has been the focus of the Lisbon Agenda,
defining correspondingly ambitious targets in terms of innovation inputs (e.g., GERD/GDP
reaching 3% in 2010) towards which EU has, overall, failed in progressing to. This
underachievement is closely linked with the lack of competitiveness that many European
industries are facing and which translates into an unimpressive growth performance that
stresses the need for a new model of competitiveness and innovation policies.
48
Although it must be acknowledging that innovation and competitiveness policies are
structural policies that must be consistent and persevered across time in order to produce effects,
EU has dwelled between paradigms. The most recent dwelling has been from the focus on
Regional Innovation System as the framework for Cohesion Policy and the present domination
of the Smart Specialization. Derived from the transatlantic productivity gap literature, smart
specialization highlights the need for EU to concentrate resources on fewer areas in order to
reach an optimal scale on R&D and innovation.
In this paper, we discuss the concept of smart specialization and its conceptual and
operational novelty in relation to the Regional Innovation System paradigm, analyzing, in
particular, the case of follower regions and the corresponding challenges. We present a
methodology to identify possible smart specialization domains and conclude with an empirical
application for Norte region, Portugal.
2. Recent EU Innovation Policy frameworks: RIS vs RIS3
2.1. Regional innovation Systems (RIS)
The regional innovation system (RIS) concept is recent but has become one of the most influent
one, namely for the design of regional development policies. RIS concept was in great part
derived from the former concept of National Innovation System (Freeman, 1987 and 1995;
Lundvall, 1992; Nelson and Rosenberg, 1993). Following Saviotti (1997), an innovation system
can be defined as a set of actors and interactions that have as the main objective the generation
and adoption of innovations. This definition recognizes that innovations are not generated just
by individuals, organizations and institutions, but also by complex patterns of interactions
between them. Therefore, within an innovation system we can define their elements, the
interactions, the environment and the frontier.
The relevance of national innovation systems is related with the fact that the national
dimension captures important aspects for the innovation process (namely, the policy and
regulatory framework, the scientific, educational and training framework, national economic
and geographical environment, legislation, and others). As referred by Cooke (2001), the recent
idea of RIS results from some convergence between works of regional scientists, economic
geographers and national systems of innovation analysts. RIS have its relevance based on the
fact that proximity plays a major role on networks and interactions density; this fact is in general
attributed to the tacit nature of a relevant part of knowledge. Tacit knowledge “is best shared
through face-to-face interactions between partners who already share some basic
49
commonalities: the same language, common “codes” of communication and shared conventions
and norms…” (Asheim and Gertler, 2005: 293) The regional dimension also generates a more
“focused” knowledge basis, as a cumulative result of the clustering of economic and innovation
oriented activities. Asheim and Gertler develop analogous arguments and do not hesitate to
stress that “the more knowledge-intensive the economic activity, the more geographically
clustered it tends to be” (Asheim and Gertler, 2005: 291). Besides the cognitive and normative
dimensions of RIS, that can present different degrees of intensity, the political dimension should
however not be excluded. Cooke (2001) refers “region” as a key component of a RIS,
considering it as a meso-level political unit set between the national or federal and local levels
of government that might have some cultural or historical homogeneity but which at least had
some statutory powers to intervene and support economic development, particularly innovation.
Difficulties associated to the use of RIS concept as an operational regional policy tool
remain important. First of all, there is still some degree of vagueness of the concepts of
innovation systems and of the limits established between national and regional systems.
Another set of difficulties arise by the fact that the RIS should be applied to quite different
specific regional contexts but, in fact, RIS concept is shaped for regions with strong
technological endowments and with well-established institutional and organizational networks.
Even within a strict knowledge-based economy perspective, regions differentiation is important
because the knowledge base of the existing productive sectors is not the same everywhere and
this affects the comparative relevance of actors and interactions.
2.2. Research and Innovation Smart Specialization Strategies (RIS3)
In the most recent years, following the recommendations of the Knowledge for Growth group
of experts, EU has embraced smart specialization as the theoretical reference for the design of
innovation policies. The Barca report (2009) highlighted the apparent inefficiency and
effectiveness of EU competitiveness policies and presented, as one of the underlying reasons,
the scattering of resources and the use of a general approach to target heterogeneous contexts,
namely, regions (Foray and van Ark, 2007, Sandu, 2012, Kroll, 2015, Morgan, 2015).
Departing from the fact that regions cannot excel in everything, smart specialization
emphasizes the need for place-based policies that are tailored in function of each regions’
specific assets and knowledge bases and potential to build sustainable competitive advantages
globally (Foray and van Ark, 2007, Arancegui et al., 2011, McCann and Argiles, 2015).
Following those conclusions, the concept of smart specialization gained importance within EU

50
jargon and became a reference for the definition of a new approach to Cohesion Policy.
However, the concept itself remains blurry (Arancegui et al., 2011, Sandu, 2012) and for once,
the transfer into practice has surpassed the conceptual consolidation of the theory. Foray et al.
(2011) state this clearly when claiming to exist a lag between policy practice and the theoretical
framework of smart specialization. Thus, it is important to present and discuss the concept and
how we can translate it into practice.
The Smart Specialization concept derives from two strands of the economic literature,
one focused on the transatlantic productivity gap and the other on the sectorial innovation
systems (McCann and Argiles, 2011). According to Foray and van Ark (2007) and Foray et al.
(2009), smart specialization is about the refocus of R&D and Innovation in alignment with
regions’ distinctive features. In other words, regions must specialize in order to be able to
generate critical mass. However, although the author has always rejected the hypothesis of
picking winners or of overspecialization, the obvious risks of technological lock-in and of a
wrong choice forced the evolution of the smart specialization paradigm. Authors like Pontiakis
et al., 2009; Kyriakou, 2009; Giannitsis, 2009 acknowledged that specialization enables
economies of scale but without diversity, the economies limit their ability to shift from
technology trajectory and to readjust their economic structure. Following this discussion,
related variety became a cornerstone of SS (or, as the McCann and Argiles (2011) name it
“specialized diversification”). This is also expressed by the European Commission which
stresses the importance of diversification of related activities in order to reduce the risks of lock
in and of a shift in market demand (CEC, 2010). Also Capello (2013) argues in favor of a "smart
diversification and upgrading” and defines in a recent paper smart specialization as a way of
matching knowledge and human capital, with the economic structure of regions and its potential
to build competitive advantages (Camagni and Capello, 2012, Churski et al., 2017). These
authors also uphold the need of embeddedness of innovation policies in the local context as
well as the importance of connectedness in order to ensure maximizing knowledge flows
internally and also linking to external knowledge bases (McCann and Argiles, 2011), but
adapted to the specificities of each region innovation pattern (Camagni and Capello, 2012)
upgrading and diversifying the economic structure along technological and market relatedness
(ESPON, 2012).
This represents a refocus of smart specialization on regions instead of sectors. This
mutation of the original concept incorporates notions of the economic geography and RIS the
literature but has also highlighted the complexity of transferring the smart specialization
concept into the economic geography context and the need to address the systemic nature of

51
innovation, already present in the regional innovation system’s literature (Camagni and
Capello, 2012).
In fact, innovation in a process of closeness and relatedness also between people and this
is why it is mostly a localized process. The regional innovation system framework (Lundvall
and Johnson, 1994; Tödtling and Trippl, 2005) demonstrated that territories’ innovation is
based on local capabilities and cumulative learning processes, embedded in human and
relationship capital. Therefore, knowledge diffusion is not a straightforward process but one
that needs regionally-tailored policies.
In sum, from the literature we observe a set of commonalities that shape the concept of
smart specializations. First of all, smart specialization is about choices and the focus of
resources in domains (multi-sectorial and multi-institutional). The idea of concentration aims
to ensure an adequate scale (critical mass) to base the development of a related variety of
activities. Secondly, smart specialization must focus on the idiosyncrasies of regions. Given
that innovation is a contextual process, smart specialization strategies can only be defined at a
regional level. Thirdly, these strategies must focus on domains upon which regions can
construct competitive advantages internationally. Finally, smart specialization is also about
connectedness since linking to other knowledge bases and being integrated in international
value chains is fundamental to improve a regions ability to innovate and grow.
3. RIS 3: the case of follower regions
From a descriptive point of view, it is easy to identify the macro specificities of European
follower regions in what concerns innovation. In general terms, in these regions R&D activities
still have a small expression (R&D expenditure often represents less than 1% of the GDP) and
are mainly developed by the public sector. The extreme weakness of R&D activities in the
business sector is accompanied by a very low level of patent indicators. Efficiency in R&D
activities is apparently low (for instance, the ratio of EPO or USPTO patents / R&D
expenditure). However, within this set of regions we can find different performances in what
concerns productivity growth, what suggests that the nexus between knowledge creation and
growth is, for these regions, a complex one.
As Fagerberg (1987, 1988) has pointed out, productivity growth can be seen as the result
of two impulses: innovation and diffusion. For follower countries or regions, the relative
contribution of diffusion for productivity growth tends to be greater than in more advanced
economies. However, as Fagerberg also refers, based on the experience of successful catching-
52
up economies, follower countries or regions cannot rely only on a combination of physical
investment and the use of knowledge created outside. In order to assure a continuous catching-
up, they must also develop their own technologic effort.
The idea that diffusion does not occur in an easy way, as a mechanic process of use of
imported knowledge in response to new market opportunities, should also be stressed. For
follower economies, the capability to use and adapt technology created outside is much more
than a question of buying new equipment or codified product engineering. As stressed by many,
technical knowledge includes tacit knowledge. If follower countries or regions aim to promote
the adoption of new technologies and to be able to quickly respond to technologies evolution,
they must develop permanently capabilities that include tacit knowledge. So, in a dynamic
perspective, the distinction between innovation and diffusion it’s a relative one because the
systemic factors that favour an effective diffusion are partly the same that favours innovation.
In a seminal text dedicated to technological accumulation in developing countries, Bell
and Pavitt (1993) have presented the distinction between productive capacity and technological
capability. The first one can be improved with the availability of resources that are needed to
produce goods and services. In addition, technological capability appeals to skills, knowledge
and experience detained by individuals and organizations and these additional resources are
largely the result of a learning process. So, not only diffusion is not a mechanical process but
also, as referred by Bell and Pavitt (1993), it would be an error to consider that, in developing
countries, technological accumulation will occur as a simple “by-product” of production. These
arguments are obviously applicable to European follower regions.
In sum, the core of the evolutionary contributions on the complex relations of
interdependence between innovation and diffusion must be permanently taken into account.
The NIS and RIS concepts have been largely elaborated from the perspective of the innovation
frontier. In follower regions, we must on the contrary build them from the perspective of
diffusion but also and to discuss the feasibility of transforming the RIS into a policy tool capable
of generating a proactive approach of increasing technological capabilities and fostering
innovation. This is a fundamental acquisition of the evolutionary research program. The
strategic approach to diffusion can no longer be understood just as an exogenous process of
knowledge transfer, a strictly imitative process. The art of dealing with diffusion in a proactive
way, creating innovative trajectories, will be the central role of RIS in follower regions.
Another specificity of follower regions has to do with the pre-existent weakness of R&D
activities in the business sector and the apparent bias towards public R&D. However, firms
must be at the centre of an innovation system not only because innovation is by definition a

53
commercial or business action but also because innovation is not just the result of a “linear
process” from formal R&D to production. As said before, technological accumulation includes
a learning process based on the conduction of productive processes. So, innovation policies that
present a bias towards public R&D – as they do in follower regions – may have problems of
“focus” and a lack of effectiveness. However, building a RIS is a follower region is not just a
challenge of re-balancing resources devoted to R&D between institutional sectors. This aimed
re-balance must be seen more as a result than a pre-requisite for a successful RIS.
In follower regions, the weakness of R&D in the business sector and the bias towards
public R&D activities can be interpreted as a signal of a high degree of disconnection between
productive capacity and technological capability, while the connection between these two
dimensions is at the centre of RIS in frontier regions. So building a RIS in follower regions is,
in large part, a matter of to identify technological trajectories based on links between the two
dimensions above referred.
In this process, one set of difficulties can be linked to the technological characteristics of
the existing economic activities. Following the taxonomy of Pavitt (1984), if the regional
economic structure is based on “supplier dominated” activities, as it is often, technological
opportunities created under a demand pull mechanism will be scarce. On the contrary, regional
economies with a high expression of “specialized suppliers” activities, based on what Asheim
and Gertler (2005) classify synthetic knowledge, will be abler to generate more technological
opportunities and links towards R&D activities and to more technology-intensive activities.
The other set of difficulties has to do with the “focus” of public efforts in order to
reinforce the regional endowment on technological inputs (formal skills, R&D facilities and so
on). Firms and institutions have a limited cognitive capability and so they cannot
simultaneously accumulate knowledge in many different fields. This is clearly illustrated by the
fact that advanced regions and countries, with a same level of human capital and of R&D effort,
present different technological vocations. This need for “focus” clearly applies to follower
regions, where technological resources are even scarcer.
At the same time, the reinforcement of the regional endowment on technological inputs
in follower regions must rely, at least during a first phase, on public efforts. So, this public
“technological push” needs a clear strategic orientation in terms of technological trajectories
that are aimed. This aspect puts regional coordination at the centre of a policy aiming to achieve
a RIS. Otherwise, under a “bottom-up” impulse originated in public actors such as universities
and others, we will risk to have a set of fragmented initiatives and a lack of “focus” in this
54
process. Nevertheless, this aspect shows that coordination costs associated to innovation policy
in follower regions can be high.
In follower regions, the creation of the RIS should rely on a mix of dynamics because it
can hardly be supported by a simple model in which endogenous R&D activities are the main
driver of the process or by a model centered on existing activities and firms. Considering the
taxonomy built by Asheim and Gertler (2005) that encompasses the links between the regional
production structure, the institutional set-up and the different patterns of knowledge production
evolving in regions (territorially embedded RIS, regional networked innovation systems and
regionalized NIS, this contribution can be particularly useful in order to call for more diversified
models of RIS, especially if we assume that the three above mentioned types can be seen not
only as different morphologies but also as components of a more composite process.
The concept of smart specialization was brewed for the context of frontier regions but has
tentatively been adapted in alignment with Cohesion policy objectives. Smart Specialization
assumes the need to concentrate resources and distinctively specialized regions in accordance
to their potential. Although the polarization argument makes sense, it also creates mechanisms
for brain drain and economic crowding-out effects from follower regions to frontier regions.
Using Foray et al. (2009) arguments is particularly illustrative. According to these authors,
smart specialization should clusterized in a few regions the invention of key enabling
technologies and other regions should try benefitting from knowledge diffusion and invest in
co-inventions, applied to the existing industry (David et al., 2012 and Sandu, 2012). This raises
the question if follower regions are specializing in domains with less potential for productivity
gains and perpetuating divergence towards frontier regions that would get the lion’s share
(Arancegui et al., 2011).
As we detailed in the previous section, follower regions present structural shortcomings
that need to be specifically targeted by public policy. In fact, besides the imbalance or lack of
density in the regional innovation system, the poor external perception and the prevalence of
market failures (e.g. venture capital) hinder a smooth transition of the smart specialization
concept to this reality (Sandu, 2012). Furthermore, some regions are overspecialized which
hampers the ability of creating a related variety of activities and hence building an appropriate
eco-system to co-invent (e.g., the case of Algarve, an overspecialized region in tourism is
paradigmatic of regions with structural imbalances so severe that without a public push to
recompose regional assets and knowledge bases, smart specialization in its purest assertion
would imply reinforcing this lock-in). Consequently, a smart innovation policy must address
the creation of the preconditions for the consolidation of the regional innovation system for
55
follower regions to be able to specialize in the future. It has also to consider not only the present
potential, but provide a framework to support emerging domains, reducing the risks of lock-in,
with diversification as one vector of policy along with re-composition of the economic and
knowledge bases. Thus, we concentrate our work in operationalizing the concept of smart
specialization, proposing a framework of analysis to support policy making and taking into
consideration the case of follower regions.
4. RIS 3 in Practice: the case of Norte Region
Operationalizing smart specialization and elaborating regional innovation strategies is a
particularly challenging exercise. The blurriness of the concept is the first difficulty faced by
policy makers and although the authors state the importance of the exercise being an
“entrepreneurial discovery process”, in the case of follower regions, it is necessary the
coordination and even a “push” from the regional development agencies.
The second major difficulty is related on the practical way of diagnosing a region’s
potential, how to design policies in accordance with the RIS3 and how we can create a system
of indicators and milestones adequate to monitor the outcomes of a smart innovation policy
which is in essence a structural policy with long term effects not visible in the short term. This
paper aims to contribute to the first two of these issues, focusing on how to evaluate a region’s
potential and identify the smart specialization domains and how to design innovation policy
that can implement the strategy in the context of a follower region.
As stated previously, smart specialization evolved from a sectorial perspective (vertical
perspective) for a domain perspective (combination of vertical and horizontal perspectives). In
the latter, a combination of technologically and market related activities and institutions
explore inter and intra-spillovers, creating the necessary “biodiversity” that mutually reinforces
their competitive advantages. The domains must be identified based on the existence or possible
creation of an adequate scale of technological and non-technological resources and assets, based
on the evaluation of the potential to develop a set of related (in technology and/or market)
economic activities that integrate those resources and assets to produce innovative goods and
services and construct competitive advantages and also based on the alignment with
international demand trends which are determinant of the feasibility of each domain as one of
smart specialization. This allows the matching of a static diagnostic perspective with a
prospective exercise.
The following scheme aims to illustrate this rationale.
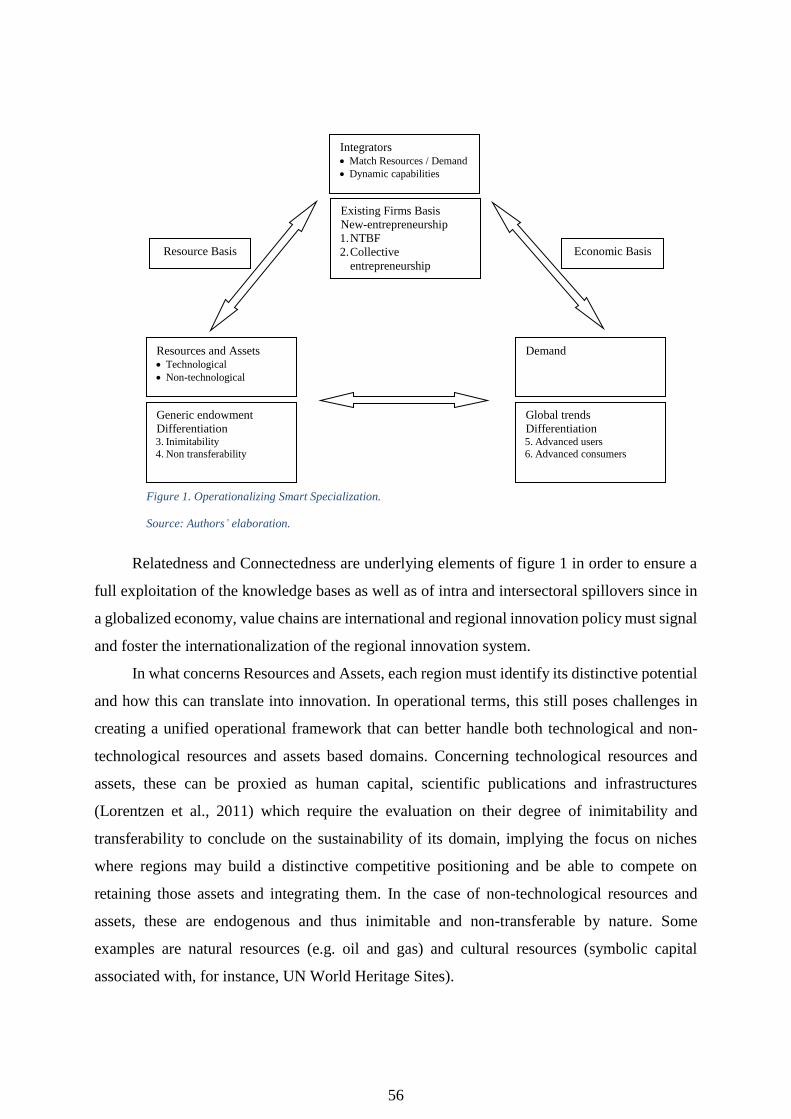
56
Relatedness and Connectedness are underlying elements of figure 1 in order to ensure a
full exploitation of the knowledge bases as well as of intra and intersectoral spillovers since in
a globalized economy, value chains are international and regional innovation policy must signal
and foster the internationalization of the regional innovation system.
In what concerns Resources and Assets, each region must identify its distinctive potential
and how this can translate into innovation. In operational terms, this still poses challenges in
creating a unified operational framework that can better handle both technological and non-
technological resources and assets based domains. Concerning technological resources and
assets, these can be proxied as human capital, scientific publications and infrastructures
(Lorentzen et al., 2011) which require the evaluation on their degree of inimitability and
transferability to conclude on the sustainability of its domain, implying the focus on niches
where regions may build a distinctive competitive positioning and be able to compete on
retaining those assets and integrating them. In the case of non-technological resources and
assets, these are endogenous and thus inimitable and non-transferable by nature. Some
examples are natural resources (e.g. oil and gas) and cultural resources (symbolic capital
associated with, for instance, UN World Heritage Sites).
Integrators • Match Resources / Demand
• Dynamic capabilities
Existing Firms Basis
New-entrepreneurship
1.NTBF
2.Collective
entrepreneurship
Resource Basis Economic Basis
Resources and Assets • Technological
• Non-technological
Generic endowment
Differentiation 3. Inimitability
4. Non transferability
Demand
Global trends
Differentiation 5. Advanced users
6. Advanced consumers
Figure 1. Operationalizing Smart Specialization.
Source: Authors’ elaboration.
57
Regarding Integrators, these combine and convert those resources and assets into
innovative tradable goods and services, aligned with demand and the ability to build
competitive advantages and gain control over the value chain. Integrators are a relevant part of
this framework not only because they are the core of the innovation system, but also because
they provide the matching between resources and assets and demand. In this case we must
account for established sectors but also for the possibility of emerging ones. The appeal to
concentrate funding and further focus innovation policies should also be flexible enough to
assume risks and launch “wildcard” domains.
Finally, demand is relevant to determine if the specialization domain chosen is feasible.
When evaluating each region’s potential, regions may conclude that although there are
resources and assets and possible integrators to innovate on them, these are misaligned with
international demand and hence, the domain is not feasible and public policy must act to
recompose the resources and assets and induce structural change in integrators (e.g. Norte
region had significant low qualified persons that sustained a low wage economy with low levels
of innovation and value chain control. Nowadays, with the lowering of trade barriers to China,
the demand for Portuguese products based only on cost is residual and such a strategy imposed
a structural change process). The way to proxy demand, and hence also a big part of the
prospective purpose inherent to the elaboration of a regional innovation strategy of smart
specialization, also still requires some different approaches when analyzing domains of
specialization based on technological and on territorial assets. In the case of the former, the
presence and connectedness to advanced users is relevant. Advanced users are of utmost
importance since they contribute to the definition of the trends for global demand and translate
it into technological challenges to be addressed. Proximity demand is important to better
understand these new trends and take advantage of possible first mover advantages. In the case
of non-technological domains, some advanced users can be relevant, but other factors are also
determinant to define international demand. In the following section, we present two
applications to Norte region, one based on a technological domain (Health and Life Sciences)
and the other on natural resources (Symbolic Knowledge and Tourism).
The above framework devises the space for innovation policy intervention, both acting
on the three vertices and on fostering the interlinkages among them. For instance, innovation
policy can reinforce or stimulate the re-composition of the knowledge base when it is
misaligned with integrators and demand. On the other hand, innovation policy can promote
structural change and the emergence of new sector when regions have resources and assets on
which is possible to build a related variety of globally competitive economic activities,

58
responding to demand opportunities. In the context of a follower region, public interventions
are more pressing and broader in order to suppress bottlenecks and promote structural
adjustment processes. In some cases, it may need to develop a completely new breed of
entrepreneurs (e.g. deploying entrepreneurship support programs) and attract multinational
companies to speed up this process. In other situations, public policy may only be necessary to
reinforce the matching quality between resources and assets and the economic structure. In
some cases, the advanced user can also be targeted by innovation policy either by attracting a
player that can generate a demand pull on both of the other vertices, or by directing public
procurement when that advanced user is internal (e.g. Health System).
Nevertheless, there are some important issues to be dealt with when designing public
policy. First of all, it is important to avoid the temptation of a radical shift in policy every time
a new planning framework is proposed. Many of the ongoing policies have long term outcomes
and its structural nature implies that results are only visible with a significant time lag.
Persistence and coherence is important to produce results and this is a risk that policy makers
must bear in mind. Secondly, smart specialization implies picking winners. Although regions
can devise a strategy that diversifies its strategic bets and hence the risk of lock-ins, smart
specialization implies establishing preferences and incentives schemes that favor some domains
and not others. This may generate pernicious crowding-out effects and also introduce rigidity
in public policy. Innovation is about novelty and underlying it is uncertainty so, innovation
policy cannot be forged so definitely and the incentives schemes must allow for wildcards
(emerging areas where some support is advisable).
In the next sections we apply our framework to the case of Norte region, presenting the
cases of two possible specialization domains based on technological (Health and Life Sciences)
and non-technological resources and assets (Symbolic Capital and Tourism), which are the
result of the work developed within Comissão de Coordenação e Desenvolvimento Regional
do Norte (CCDR-N).
4.1 Health and Life Sciences
In order to assess Norte’s potential smart specialization domains based on technological
resources and assets, we must evaluate their focus and matching with existing and possible
integrators and how these respond to international demand. Applying the framework of figure
1, we must first have a global view on the potential matching and critical mass between human
59
capital and R&D capabilities and the economic structure. The crossings with highest potential
of connection constitute core elements of possible smart specialization domains.
As a first approach, we started by measuring the human capital created in Norte region in
the last 10 years. Considering the number of graduates of ISCED levels 6, 7 and 8, multiplying
them by 1, 2 and 3 and clustering in accordance to the classification of the Portuguese National
Science Foundation (we, partially, reproduce the results in figure 2’s columns) gives us an
overview of the preconditions to innovate. Human capital is a core ingredient for R&D
capabilities and the ability to connect and absorb knowledge from other innovation systems.
Afterwards we analyzed the economic structure, characterizing the value added generated by
each sector (reproduced in the lines of figure 2).
Finally, we tried to evaluate the degree of matching and the potential articulation of the
resources’ base and integrators, ranking them by intensity (the darker areas are the ones with
higher potential of combination).
Among the set of darker areas, it becomes evident that Health and Life Sciences have a
significant overrepresentation from the resources and assets in relation to the economic activity
(mostly characterized by medical care hospitals and clinique). Hence, Norte may present
opportunities to develop a competitive Health and Life Sciences entrepreneurial system, in spite
of its current shallowness.
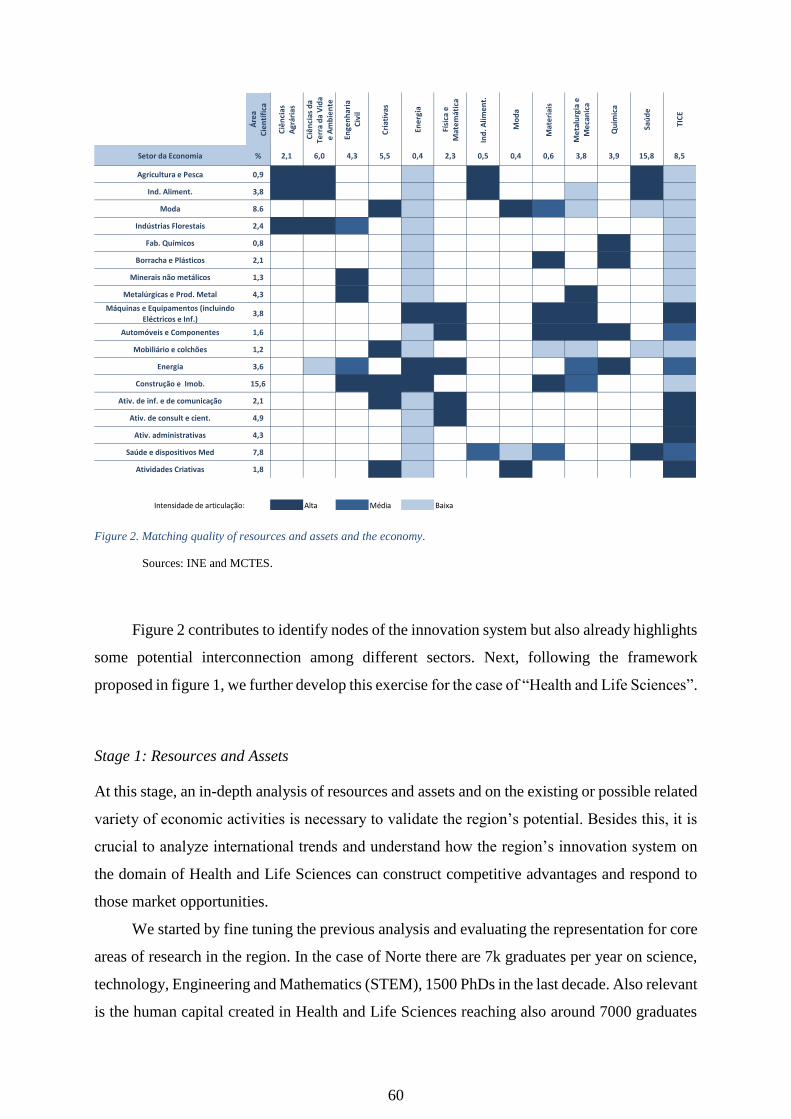
60
Figure 2. Matching quality of resources and assets and the economy.
Sources: INE and MCTES.
Figure 2 contributes to identify nodes of the innovation system but also already highlights
some potential interconnection among different sectors. Next, following the framework
proposed in figure 1, we further develop this exercise for the case of “Health and Life Sciences”.
Stage 1: Resources and Assets
At this stage, an in-depth analysis of resources and assets and on the existing or possible related
variety of economic activities is necessary to validate the region’s potential. Besides this, it is
crucial to analyze international trends and understand how the region’s innovation system on
the domain of Health and Life Sciences can construct competitive advantages and respond to
those market opportunities.
We started by fine tuning the previous analysis and evaluating the representation for core
areas of research in the region. In the case of Norte there are 7k graduates per year on science,
technology, Engineering and Mathematics (STEM), 1500 PhDs in the last decade. Also relevant
is the human capital created in Health and Life Sciences reaching also around 7000 graduates
Áre
a C
ien
tífi
ca
Ciê
nci
as
Agr
ária
s
Ciê
nci
as d
a Te
rra
da
Vid
a e
Am
bie
nte
Enge
nh
aria
C
ivil
Cri
ativ
as
Ene
rgia
Físi
ca e
M
ate
mát
ica
Ind
. Alim
en
t.
Mo
da
Mat
eri
ais
Me
talu
rgia
e
Me
can
ica
Qu
ímic
a
Saú
de
TIC
E
Setor da Economia % 2,1 6,0 4,3 5,5 0,4 2,3 0,5 0,4 0,6 3,8 3,9 15,8 8,5
Agricultura e Pesca 0,9
Ind. Aliment. 3,8
Moda 8.6
Indústrias Florestais 2,4
Fab. Químicos 0,8
Borracha e Plásticos 2,1
Minerais não metálicos 1,3
Metalúrgicas e Prod. Metal 4,3
Máquinas e Equipamentos (incluindo
Eléctricos e Inf.)3,8
Automóveis e Componentes 1,6
Mobiliário e colchões 1,2
Energia 3,6
Construção e Imob. 15,6
Ativ. de inf. e de comunicação 2,1
Ativ. de consult e cient. 4,9
Ativ. administrativas 4,3
Saúde e dispositivos Med 7,8
Atividades Criativas 1,8
Intensidade de articulação: Alta Média Baixa

61
per year and 965 PhDs in the last decade. Hence, there are important flows of human capital
and an increasing stock that can support innovation. However, smart specialization is about
focus, implying the identification of specific areas/niches. We do that by comparing
publications in this domain and we observe that Health and life Sciences registered the highest
annual growth rate, with particular focus on oncology, neurosciences, tissue engineering and
advanced bio-materials and molecular biology.
Stage 2: Integrators: related variety
In this stage it is about evaluating the existence of a related variety of economic activities and/or
trying to identify the potential to reinforce entrepreneurial activity. We focused on assessing
possible inter and intrasectorial linkages that could devise a related variety of activities to
integrate the different knowledge bases in the region and produce innovative goods and
services. The Norte region economy is predominantly characterized by low knowledge
intensive industries and services, with companies presenting a low level of PhDs (6,5% in total
employment – in Holland the same figure reaches 30%). The Health and Life sciences
entrepreneurial sector is quite shallow apart from some reference players and medical care units.
Hence, the region must evaluate if the resources and assets can support the expansion of that
economic basis and be competitive globally.
Stage 3: Demand: advanced users and global trends
Advanced users are active agents in the innovation process and express the international
demand trends that need to be considered when evaluating the formulation of a domain of
specialization and its feasibility. Advanced users are also able to translate into technological
needs, the opportunities for developing knowledge and innovations. In the case of Health and
Life Sciences, advanced users can be the Health Care Systems (public and private) and families,
creating the opportunities for specialization of the entrepreneurial base of the regional economy
and the focus of resources and assets. Among the dominating trends are the need to reduce the
cost of the health system (the estimates for the US point that in 2030 will absorb 25% of the
GDP). Population ageing is also a trend that creates the need for longer health care and the
opportunity for the development of ambient assisted living technologies for remote monitoring
of patients/elderly people. Electronic Health is another trend that can potentiate the link of ICT
companies with the Health System.

62
Finally, regions should try to be aligned with Europe’s 2020 targets and so, smart specialization
must also address the societal challenges that EU has stated in horizon 2020.
In order to better explain the above framework, we provide an actual example of this triangle
and the possible role of innovation policy. Recently, it was formed a consortia of R&D units
specialized in oncology. These consortia gather around 600 researchers with a relevant
publication record and international acknowledgement. This new consortium just signed an
agreement with the Portuguese Oncology Institute to create an Oncologic platform that links
the latter (an advanced user) with the resources and assets towards developing new therapies,
increasing efficiency and providing an adequate institutional playground for cooperation.
However, as stated the entrepreneurial base is shallow.
Figure 3 summarizes the analysis for the Health and Life Sciences domain.
INTEGRATORS / INNOVATION
Figure 3. Priority Domain “Health and Life Sciences”: Scheme presented in the workshop organized
by CCDR-N
Source: Authors’ elaboration.

63
Hence, public policy makers must decide if this is a domain for specialization and if so
target policy tools to either attract multinational companies to explore this innovative milieu
for cancer research, or implement oriented entrepreneurship programs to enlarge economic
activities, also supporting the increase in R&D capabilities along these areas of research and
supporting the intervention of the Portuguese Health System. Electronic Health is another
opportunity. The region has significant resources and assets on ICT and an emerging economy.
Through innovation policy, it is possible to financially support hospitals to generate the public
procurement for a common technological solution, support the growing of ICT companies and
the reinforcement of internal human capital and also support R&D in the resources and assets
to do applied research for the system architecture and operations mode, as well as for the
development of complementary electronic solutions. This can support co-inventions in other
sectors like textiles through intelligent fabrics or equipment manufacturers for creating gadgets.
4.2 Symbolic Capital and Tourism
Smart specialization was geared towards frontier regions, which should develop, in the jargon
of EC, Research and Innovation Strategies of Smart Specialization (original RIS 3). For that,
we consider figure 2 a good departure point in starting to assess a region’s potential to smart
specialize, this analyzes does only captures technological capabilities. However, this is where
smart specialization presents shortcomings in its original formulation. There are regions which
competitiveness is founded on endogenous resources and assets (natural and cultural) and
where overspecialization also hampers any attempt of applying smart specialization (e.g.
Algarve). These resources and assets cannot be replicated elsewhere and have the properties of
inimitability and non-transferability. This evaluation implies a practical adaptation of our
framework and present in the following analysis.
Stage 1: Resources and Assets
As stated, in this case resources and assets are non-technological but natural or cultural. Hence,
geographic position, the existence of inbound-outbound infrastructures, tradition and cultural
richness and diversity create the appeal of a destination and position a region in international
tourism. In order to exemplify some of the most important resources and assets of Norte region,
we present the case of Douro Valley. Douro Valley is a secular human construction that created
a unique landscape of nature and history, associated with the development of wine making. The
64
classification as a UN World Heritage site (Norte region has 4 areas classified like that)
recognizes the uniqueness of Douro Valley and the “glamour/pedigree” of this site. This is not
just about nature or wine making, but the whole symbolic capital that created a unique feature
for Norte Region.
Stage 2: Integrators: related variety
Tourism is by itself a related variety of very different activities. In the case of Norte there has
been a significant increase in airport traffic, services, hotel and restaurants offer. There is still
a fragmentation of the offer and a lack of coordination of agents to potentiate synergies.
The link with less “core activities exists but could be far more explored. It exists in the
case of wine making but can be much further extended towards the development of other agro
industrial products and “cultural” food. Another possibility refers to the promotion of medicinal
waters which can also contribute to the development of cosmetic industry (as in France with
Vichy).
Besides that, it is important to stress the possibilities for the development of other
activities such as, among others, niche shipbuilding, tailor made IT solutions, mobile apps and
architecture and urban planning.
Stage 3: Demand: advanced users and global trends
Alike all domains, also in the case of Symbolic Capital and Tourism demand determines the
feasibility but, unlike more technology based domains, for Symbolic Capital and Tourism,
advanced users may not express the full set of demand trends. In this case, although the
proximity to advanced users is relevant, the analysis must take into account international
players, but the emergence of new touristic trends (for instance, a trend associate with
globalization of medical care arises not from advanced users in the traditional tourism industry,
but from the financial collapse of health systems in western world, the inability to cater to
national population needs as well as the need to obtain revenue to support it).
Hence we reproduce figure 3 to this potential priority domain for Norte Region.

65
The above figure summarizes the application of our framework to devise smart specialization
domains based on non-technological resources and assets.
5. Concluding remarks
The smart specialization concept is a different shade of the RIS concept that highlights the
importance of focus of innovation policies on the areas with larger potential. In spite of its
conceptual blurriness, it is clear that at most, smart specialization is an incremental innovation
and that the concept was forged for the reality of frontier regions. The case of follower regions
Figure 4. Priority Domain “Symbolic Capital and Tourism”: Scheme adapted from the one presented in the
workshop organized by CCDR-N.
Source: Authors’ elaboration.

66
imposes additional difficulties that policy makers must tackle besides the ones resulting from
the lack of a consolidated theoretical and methodological referential that could support
implementation in practice.
In this paper, we tried to look at the case of follower regions and propose a practical
framework to design smart specialization strategies. We further applied it to the case of Norte
region and one of the potential specialization domains.
Nevertheless, there are still many empirical and methodological limitations to this paper
regarding a unified methodology to analyze technology and non-technology based domains.
We will try to minimize these problems as well as increase the theoretical robustness and the
application richness in in the following versions of this paper.
References
Arancegui, M., Querejeta, M. and Montero, E. (2011), “Smart Specialization Strategies: The
Case of the Basque Country”, Orkestra Working Paper Series in Territorial
Competitiveness, 2011-R07.
Asheim, B. e Gertler, M. (2005), “The Geography of Innovation: Regional Innovation
Systems”, in Fagerberg, Jan; Mowery, David and Nelson, Richard R., The Oxford
Handbook of Innovation, London: Oxford University Press.
Barca F. (2009), “An Agenda for the Reformed Cohesion Policy”, Report to the Commissioner
for Regional Policy, Brussels.
Bell, M. e Pavitt, K. (1993), "Accumulating Technological Capability in Developing
Countries", in Proceedings of the World Bank Annual Conference on Development
Economics, The World Bank.
Capello. R. (2013) “Knowledge, Innovation, and Regional Performance: Toward Smart
Innovation Policies Introductory Remarks to the Special Issue, Growth and Change,
44 (2), 185-194.
Capello, R. and Kroll, Henning (2016). “From theory to practice in smart specialization
strategy: emerging limits and possible future trajectories”, European Planning
Studies, 24 (8), pp. 1393-1406.
Camagni, R. and Capello, R., (2012), “Regional Innovation Patterns and the EU Regional
Policy Reform: Towards Smart Innovation Policies”, proceeds of the 52nd ERSA
Conference in Bratislava.

67
CEC - Commission of the European Communities, (2010), “Europe 2020. A strategy for smart,
suitable and inclusive growth”, Communication from the Commission, COM (2010)
2020.
Churski, P., Ochojski, A., Polko, A. and Kopczewska, K. (2017). “Towards Policy – Place-
Based Policy and Smart Specialization”, Measuring Regional Specialization, 267-380.
Cooke, P. (2001), “Regional Innovation Systems, Clusters and the Knowledge Economy”,
Industrial and Corporate Change, 10 (4), 945-974.
David, P., Foray, D., Hall, B., 2012, “Measuring Smart Specialization. The concept and the
need for indicators”, in
http://cemi.epfl.ch/files/content/sites/cemi/files/users/178044/public/
Measuring%20smart%20specialisation.doc.
ESPON (2012), Knowledge, Innovation, Territory (KIT), Final Report available on line
http://www.espon.eu/main/Menu_Projects/Menu_AppliedResearch/kit.html.
Fagerberg, J. (1987), "A Technology Gap Approach to Why Growth Rates Differ", in Research
Policy, 16, pp. 87-99.
Fagerberg, J. (1988), "Why Growth Rates Differ", in Technical Change and Economic Theory,
ed. por DOSI, G. / FREEMAN, C. / NELSON, R. / SILVERBERG, G. / SOETE, L.,
Pinter Publishers, London e New York.
Foray, D. and Van Ark, B. (2007), "Smart specialisation in a truly integrated research area is
the key to attracting more R&D to Europe", European Commission Expert Group
"Knowledge for Growth", Policy Brief No 1, http://ec.europa.eu/invest-
inresearch/pdf/download_en/policy_brief1.pdf.
Foray D., David P. and Hall B. (2009), “Smart Specialization - the Concept”, Knowledge
Economists Policy Brief, n. 9.
Freeman, Ch. (1987), Technology and Economic Performance: Lessons from Japan, London,
Pinter.
Freeman, Ch. (1995), “The National 'National System of Innovation' in Historical Perspective”,
Cambridge Journal of Economics, vol. 19, pp. 5-24.
Giannitsis T. (2009), “Technology and Specialization: Strategies, Options, Risks”, Knowledge
Economists Policy Brief , n. 8.
Kyriakou, D. (2009). Introduction. In Pontikakis, D., Kyriakou, D. and van Bavel, R.. “The
Question of R&D specialisation. Perspectives and policy implications”, Luxembourg:
Office for Official Publications of the European Communities, 11-17.
68
Kroll, Henning (2015). Efforts to Implement Smart Specialization in Practice-Leading Unlike
Horses to the Water, European Planning Studies, 23 (10), pp. 2079-2098.
Lorentzen, J., Muller, L., Manamela, A. and Gastrow, M. (2011), “Smart specialisation and
global competitiveness: Multinational enterprises and location-specific assets in Cape
Town”, African Journal of Business Management 5 (12), 4782-4791.
Niklas Lundström, Antti Mäenpää. (2017) Wicked game of smart specialization: a player’s
handbook. European Planning Studies 25 (8), pp 1357-1374.
Lundvall, B.A. (1992), National Innovation Systems: Towards a Theory of Innovation and
Interactive Learning, London, Pinter.
Lundvall, B.A. and Johnson B. (1994), “The Learning Economy”, Journal of Industry Studies,
1 (1), 23-42.
McCann P. and Ortega-Argilés R. (2015), “Smart Specialization, Regional Growth and
Applications to EU Cohesion Policy”, Regional Studies, 49 (8), pp. 1291-1302.
Morgan, Kevin (2015). Smart Specialization: Opportunities and Challenges for Regional
Innovation Policy, Regional Studies, vol. 49 (3), pp. 480-482.
Nelson, R. and Rosenberg, N. (1993), National Innovation Systems (Ch. 1 - Technical
Innovation and National Systems), Oxford University Press.
Pavitt, K. (1984), "Sectoral patterns of technical change: towards a taxonomy and a theory",
Research Policy, vol. 13, pp. 343-373.
Pontikakis D., Chorafakis G. and Kyriakou D. (2009), “R&D Specialization in Europe: From
Stylized Observations to Evidence-Based Policy”, in Pontikakis D., Kyriakou D. and van
Bavel R. (eds.), The Question of R&D Specialization, JRC, European Commission,
Directoral General for Research, Brussels, 71-84.
Sandu, S. (2012), “Smart specialization concept and the status of its implementation in
Romania”, Procedia Economics and Finance, 3, 236-242.
Saviotti, P. P. (1997), “Innovation Systems and Evolutionary Theories”, in Edquist, C. (ed.),
Systems of Innovation – Technologies, Institutions and Organizations, London, Pinter.
Tödtling F. and Trippl M. (2005), “One Size Fits All? Towards a Differentiated Regional
Innovation Policy Approach”, Research Policy, 34, 1203-1219.

69
CHAPTER 3: SMART SPECIALIZATION: AN APPROACH TO A
MONITORING AND EVALUATION SYSTEM
Abstract
This paper addresses the setting-up of a monitoring and evaluation system for the RIS3. RIS3
introduce a new framework on European regional innovation policy, but also new challenges
in how to monitor and evaluate progresses in its implementation. Considering the significant
gap between the fast-practical implementation and the emerging literature, this paper proposes
an architecture of a monitoring and evaluation system that covers 4 critical dimensions:
implementation, first level results, structural change and long-term impacts.
1. Introduction
The Barca report (2009) highlighted the apparent inefficiency and effectiveness of EU
competitiveness policies and presented, as one of the underlying reasons, the scattering of
resources and the use of a general approach to target heterogeneous contexts, namely, regions
(Foray, 2014, Kroll, 2015, Morgan, 2015, Lundström and Maenpaa, 2017). Since then, smart
specialization has become a key element in regional innovation strategies across Europe,
despite its lack of maturity (Foray et al. 2011). The underlying growing gap between the policy
practice and the theory (Foray et al. 2009, Foray, 2014), increases the challenge of
operationalizing a still blurry concept, namely, in terms of methodological approaches to the
definition of priorities, the design of new governance models and the development of adequate
monitoring and evaluation systems (Angelidou et al., 2017).
The development of such monitoring and evaluation systems is also challenging given
that RIS3 is about transformative actions that foster structural changes which are long term
(Raimondo, 2016). Hence, the monitoring system needs to couple short term dimensions which
analysis can indicate how the strategy is being implemented and provide some insights on
necessary minor adjustments, along with long term dimensions that respond to the actual
purpose of RIS3 (EC, 2014 and Angelidou et al., 2017), changing the competitiveness drivers
and the playing field though transformative actions.

70
Considering that literature is still far behind practice also in terms of monitoring and
evaluation strategies and systems of the RIS3 (Angelidou et al., 2017), this paper focusses on
establishing the objectives underlying a monitor and evaluation system and proposing the
architecture of a system based on 4 levels of monitoring: implementation, first level results,
structural change and long term impacts. Additionally, given that monitoring and evaluation
are considered phase 6 in the implementation smart specialization guide published by the S3
and that regions are overall still trying to set-up and fine tune their system, we develop a first
empirical assessment of the implementation of Portugal.
In sum, section 2 provides a literature state-of-the-art overview upon which we present,
in section 3, a possible conceptual architecture for the Portuguese monitoring and Evaluation
system of RIS3. Finally, before conclusions, section 4 presents an empirical analysis on the
implementation of the RIS3 in Portugal.
2. RIS3 monitoring systems: state-of-the-art
Smart specialization is a new conceptual approach to the design of territorially based innovation
policy which, beyond the perspective of specialization and diversification within the
cornerstone concept of related variety, introduces a new way of conceiving, implementing and
governing innovation strategy and the management of the mobilized policy tools. In a way, the
revolution is not the concept itself, but the inclusive approach that takes quadruple helix
involvement to a different level, almost like in the Ancient Greece. This larger involvement
allows for better strategy design, more accountability and makings co-responsible all the actors
in what concerns the final outcomes of the policy. Hence, monitoring smart specialization is a
major challenge in terms of implementation (Foray, 2014), especially considering that smart
specialization encompasses a new approach to innovation policy where the process of
normative transformation of priorities, the functioning of the governance model and the
monitoring and evaluation of the results of the transformative actions constitutes novelties in
comparison to the traditional way of policy-making.
According to Gianelle and Kleibrink (2015), the monitor and evaluation system of RIS3
must provide an analytical feedback in what concerns the outcomes, the impacts and the effects
of the implemented policies in order to support the revision and decision-making within the
quadruple helix governance model. Hence, according to the same authors and also to Angelidou
et al (2017), the system should perform a set of functions:
• Process: analyze and assess the actual level of implementation which implies verifying that
strategic priorities have been translated into effective normative and operational procedures,
71
assessing that the mechanism to deploy the policy-mix are selective enough to effectively
favor projects aligned with RIS3;
• Monitor and evaluate: provide long term analysis on the actual impacts of public policy,
guiding the adjustments of the priorities selected, the design of new policy instruments and
the fine tuning of the existing ones and clearly assess the outcomes of policy, in terms of
structural change;
• Accountability: clarifying the rationale underlying the selection of priorities, the allocation
of resources and the mobilization of policy tools, along with provide a clear picture on the
actual relevance of each priority;
• Support decision making and the continuous revision of the strategy though the provision of
thematic intelligence, evaluation tools and clear communication that support trust building
and prolongs the engagement of actors.
Thus, a balanced monitor and evaluation system must couple an array of key quantitative
indicators, in complement to a set of qualitative analysis system that can monitor the effective
normative translation of the policy prescriptions into the policy mix. Both dimensions are
crucial to the purposefulness of the monitoring and evaluation system, providing evidence to
the actual efficiency and effectiveness of projects in achieving the foreseen goals as well as to
induce a more result driven approach.
In the case of RIS3, designing an effective monitoring and evaluation system poses a new
set of challenges. Since RIS3 is a continuous collective constructed strategic framework, policy
is not easily translated in highly specified analytical model to support a theory of change that
founds many evaluations and monitor systems (McCann and Ortega-Argiles, 2013). In this
case, implementation proceeds an iterative process, assembling knowledge and evidence as it
arises evolving and adjusting along course within a set of objectives:
• Learning-and-acting: providing just-in-time information to support the adjustment of the
strategy and the policy-mix;
• Trust-building amongst stakeholders: considering that RIS 3 promotes a wide inclusive
process of bottom-up strategy design, it is fundamental to keep actors engaged though a clear
and transparent process;
• Accountability: complete clarity regarding the reaching or not of the intended goals,
allowing to evaluate if outputs and outcomes indicate that structural change and
specialization are on track.
72
In the case of RIS3, the difficulties in implementing such system surpass the issues of
time lag and cause-consequence between the deployment of policies and its effects. Given that
RIS3 proposes a new “philosophy” of strategy design and policy-making, it becomes important
to monitor the process and inputs (e.g. allocated resources, effectiveness of the selection
process) in order to understand how resources are being employed and absorbed, as well as to
ensure the consistency of policy-making with the strategic goals.
McCann and Ortega-Argiles (2013) highlight that RIS3 implies a complex bargaining
process between different stakeholders, different parties, different interest groups and different
constituencies, making it harder to translate the vision and strategy into clear objectives to be
targeted by innovation policy. This is crucial to a good policy design and the sequential
structuring of a monitoring and evaluation system that allow the adequate framework of
assessment McCann and Ortega-Argiles (2013).
As referred by Foray et al. (2009), RIS3 is a prominent example of practice leading theory
and hence, monitoring and evaluation systems are still in an early dawn. Thus, when we review
the literature for practical approaches to monitoring and evaluation systems, only a few
examples arise. One such example is Piatkowski et al (2014) that provides an analysis of the
Polish case. now being set-up. According to these authors, the implementation of smart
specialization in Poland still faces some difficulties, with monitoring and evaluation being
either not implemented at macro-regional level, or weakly implemented at regional level.
Angelidou et al. (2017) analyze implementation in Greece presenting the state-of-the-art of
implementation of the RIS3, pointing to difficulties in operationalizing effective governance
models and monitoring and evaluation systems. A similar conclusion arises form McCann and
Ortega-Argiles. (2016) in a paper addressing the early experience of RIS3 implementation.
Morgan (2015) and Capello et Kroll (2016) demonstrate the lack of papers addressing and
operational perspective on smart specializing and the still shallowness of literature analyzing
the implementation of RIS3 across the EU. Furthermore, most of these authors highlight the
difficulties and delay in implementing RIS3 monitoring and evaluation system.
This paper contributes to this literature, proposing a framework for the operationalization
of the smart specialization monitoring and evaluation system and providing a first level analysis
on the Portuguese case.
73
3. An operational approach to monitoring and evaluation
3.1. The cornerstones of a monitoring and evaluation system for the NRIS3
In this section we present a framework that we have been developing in Portugal to guide the
implementation of the National Research and Innovation Smart Specialization Strategy
(NRIS3) Strategy. In developing this framework, we considered the fact that RIS3 is a
continuous iterative process that deals with structural adjustments. That means that the strategic
framework aims at changing the structural profile of the innovation system which only occurs
several years after policy deployment and is contingent on many factors. Furthermore, RIS3
conceptual approach is also about changing the way strategy is designed and policy
implemented, bringing bottom-up approaches to a new level. But apart from that, RIS3 also
presents challenges in the normative translation of the strategy into policy tools to ensure the
effective operationalization of the strategy. That is to say that the first dimension to be
monitored refers to the understanding on how the implementation of RIS3 is being executed
from a process standpoint.
A second dimension comprises first level results on a core of 5 specific objectives
underlying NRIS3 implementation. Firstly, we aim to assess the individual (the systemic impact
is perceivable in a longer term basis and thus subject to evaluation in dimension 3) efficiency
and effectiveness of policy tools (e.g. multiplier effect of subventions to R&D) though an
incremental analysis. This first level assessment provides important analytics on the actual
impacts of the different policy tools and how effective they are to reach the intermediate goals
of NRIS3. Secondly, considering the fact that up until recently Portugal was a net payer to the
Framework Programmes and that innovation is increasingly an international networking
process, another specific objective of NRIS3 is to increase the participation of Portuguese R&D
units and companies in the Framework Programme which would indicate the capacity of the
innovation system to connect to other players outside the system, as well as indicate the quality
of the capacity building effort. A third specific objective in a follower country relates to the
strengthening of the interconnection university-industry. This link is of utmost importance to
the optimization of the innovation system. A fourth level relates to inter-firm cooperation. In
this case, it is important to assess if the stimulus to inter-firm cooperation has been successful
in creating consortia that can combine productive and technologic capabilities on a variable
geometry. Finally, a fifth level of monitoring comprises an overall perception of the output in
terms of increase in the absorptive capacity of Portuguese firms.
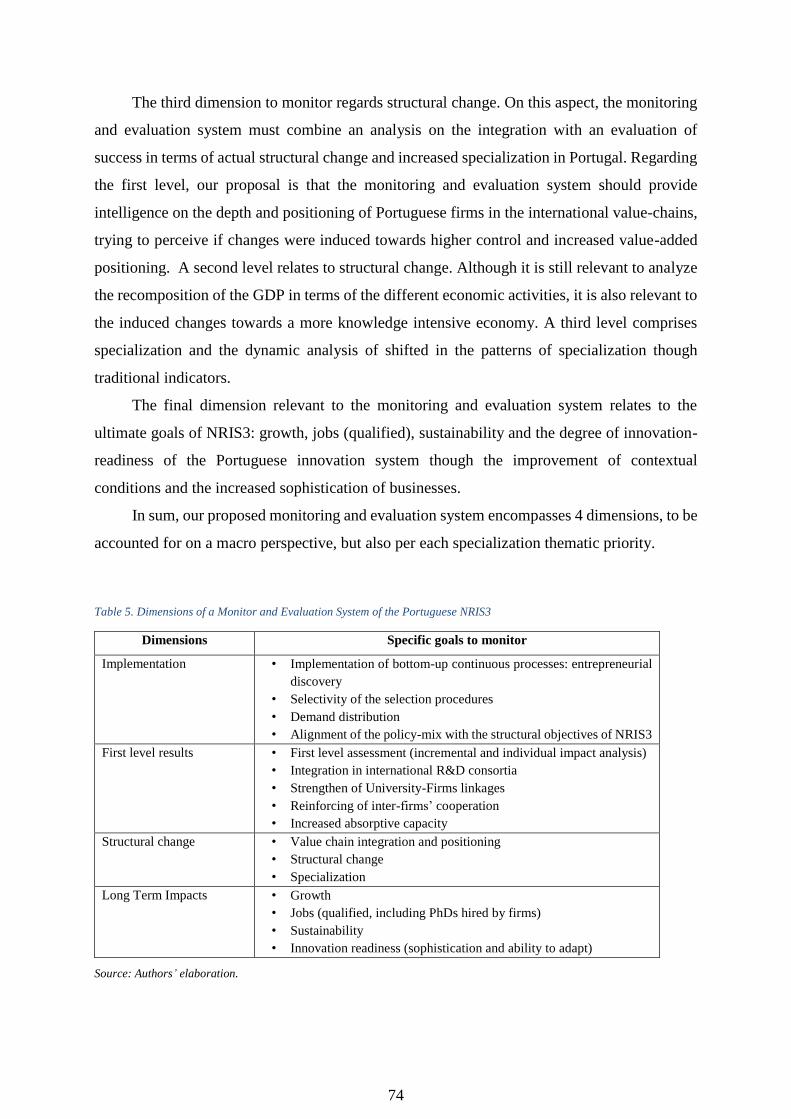
74
The third dimension to monitor regards structural change. On this aspect, the monitoring
and evaluation system must combine an analysis on the integration with an evaluation of
success in terms of actual structural change and increased specialization in Portugal. Regarding
the first level, our proposal is that the monitoring and evaluation system should provide
intelligence on the depth and positioning of Portuguese firms in the international value-chains,
trying to perceive if changes were induced towards higher control and increased value-added
positioning. A second level relates to structural change. Although it is still relevant to analyze
the recomposition of the GDP in terms of the different economic activities, it is also relevant to
the induced changes towards a more knowledge intensive economy. A third level comprises
specialization and the dynamic analysis of shifted in the patterns of specialization though
traditional indicators.
The final dimension relevant to the monitoring and evaluation system relates to the
ultimate goals of NRIS3: growth, jobs (qualified), sustainability and the degree of innovation-
readiness of the Portuguese innovation system though the improvement of contextual
conditions and the increased sophistication of businesses.
In sum, our proposed monitoring and evaluation system encompasses 4 dimensions, to be
accounted for on a macro perspective, but also per each specialization thematic priority.
Table 5. Dimensions of a Monitor and Evaluation System of the Portuguese NRIS3
Dimensions Specific goals to monitor
Implementation • Implementation of bottom-up continuous processes: entrepreneurial
discovery
• Selectivity of the selection procedures
• Demand distribution
• Alignment of the policy-mix with the structural objectives of NRIS3
First level results • First level assessment (incremental and individual impact analysis)
• Integration in international R&D consortia
• Strengthen of University-Firms linkages
• Reinforcing of inter-firms’ cooperation
• Increased absorptive capacity
Structural change • Value chain integration and positioning
• Structural change
• Specialization
Long Term Impacts • Growth
• Jobs (qualified, including PhDs hired by firms)
• Sustainability
• Innovation readiness (sophistication and ability to adapt)
Source: Authors’ elaboration.

75
3.2. An operational proposal
This section structures the operational framework for a monitoring and evaluation system of
the NRIS3. This structure, in line with the previously identified four dimensions, is detailed in
order to allow for the application to the Portuguese case in section 4.
3.2.1 Dimension 1: implementation
In this regard, monitoring an evaluation must assess, on one hand, if RIS3 is actually being
implemented and if so, how effective it has been and, on the other hand, provide a first glimpse
on the distribution of demand for the policy instruments. Thus, the first specific goal relates to
the process of operationalizing RIS3, namely, if the governance model is stabilized and
working, if the bottom-up part of the process is being relevant and if it had impact on policy-
making.
The second specific goal of monitoring intends to assess if projects aligned with the
NRIS3 have, in fact, been prioritized in comparison to others. This requires an analysis on how
relevant is the weight of such criteria in the overall project’s mark, but also a notion on how
many projects have been considered not aligned in order to understand if NRIS3 provides
discrimination.
A third important goal is to provide an overview on demand. NRIS3 is the result of a
bottom-up process where thematic priorities were identified. It is important to assess if those
priorities were adequately defined and if, in fact, there is critical mass or new dynamics in the
emerging sectors. Although this analysis is necessarily limited by the existing data and the
reduced time elapsed, it still provides a first glance on each priority’s performance. This
analysis should combine a quantitative perspective along with a qualitative focus to provide
insights for the stakeholders to adjust priorities and/or the policy-mix.
Finally, in the dimension of implementation, we must also account for the alignment of
the policy-mix with the structural objectives of NRIS3. In this case, we can use the wide list of
input indicators of each relevant Operational Programme.
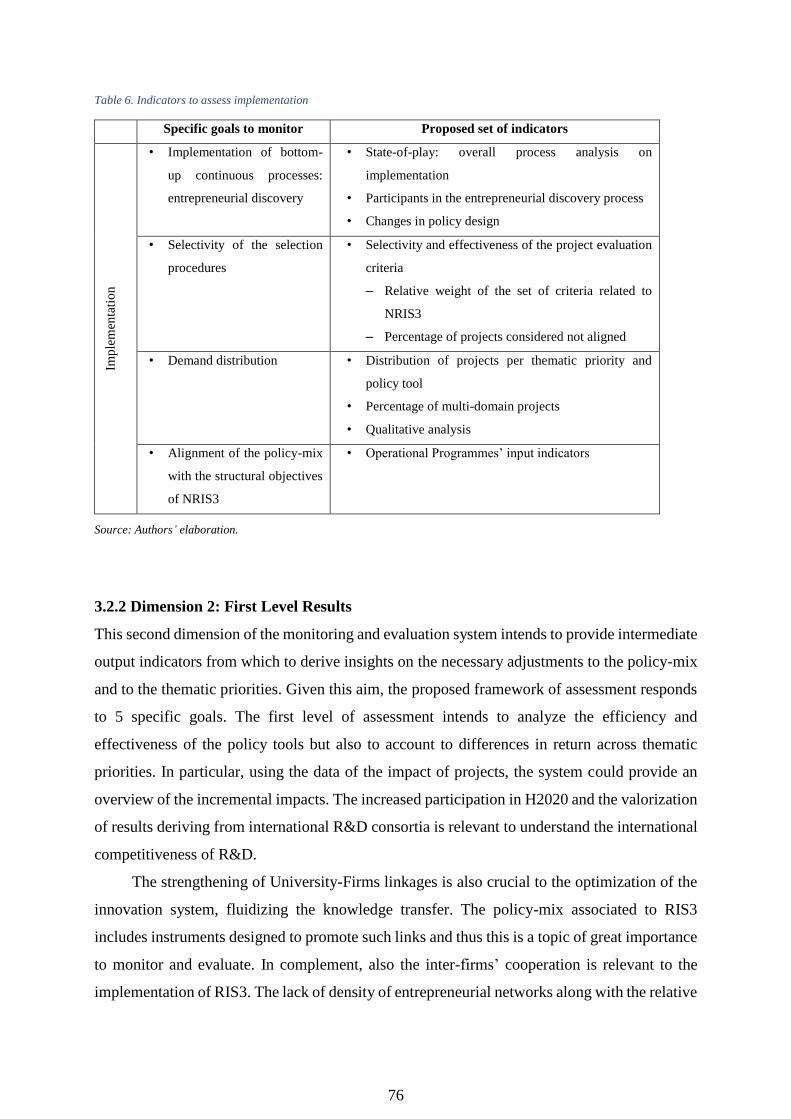
76
Table 6. Indicators to assess implementation
Specific goals to monitor Proposed set of indicators
Imp
lem
enta
tio
n
• Implementation of bottom-
up continuous processes:
entrepreneurial discovery
• State-of-play: overall process analysis on
implementation
• Participants in the entrepreneurial discovery process
• Changes in policy design
• Selectivity of the selection
procedures
• Selectivity and effectiveness of the project evaluation
criteria
– Relative weight of the set of criteria related to
NRIS3
– Percentage of projects considered not aligned
• Demand distribution • Distribution of projects per thematic priority and
policy tool
• Percentage of multi-domain projects
• Qualitative analysis
• Alignment of the policy-mix
with the structural objectives
of NRIS3
• Operational Programmes’ input indicators
Source: Authors’ elaboration.
3.2.2 Dimension 2: First Level Results
This second dimension of the monitoring and evaluation system intends to provide intermediate
output indicators from which to derive insights on the necessary adjustments to the policy-mix
and to the thematic priorities. Given this aim, the proposed framework of assessment responds
to 5 specific goals. The first level of assessment intends to analyze the efficiency and
effectiveness of the policy tools but also to account to differences in return across thematic
priorities. In particular, using the data of the impact of projects, the system could provide an
overview of the incremental impacts. The increased participation in H2020 and the valorization
of results deriving from international R&D consortia is relevant to understand the international
competitiveness of R&D.
The strengthening of University-Firms linkages is also crucial to the optimization of the
innovation system, fluidizing the knowledge transfer. The policy-mix associated to RIS3
includes instruments designed to promote such links and thus this is a topic of great importance
to monitor and evaluate. In complement, also the inter-firms’ cooperation is relevant to the
implementation of RIS3. The lack of density of entrepreneurial networks along with the relative

77
predominance of very small firms, implies that fostering cooperation between firms is
fundamental to the construction of strong clusters and promote an innovation ecosystem.
Finally, within this monitoring dimension, innovation readiness is fundamental and the
result of progressive capacity building, translated into the amplification of the absorptive
capacity.
Table 7. Indicators to assess intermediate outputs
Specific goals to monitor Proposed set of indicators
Fir
st L
evel
Res
ult
s
• First level assessment
(incremental and individual
impact analysis)
• Incremental impact: multiplier effects
• Integration in international
R&D consortia
• Level and success of the participation in H2020
• Exploitation of the results of international R&D
projects
• Strengthen of University-
Firms linkages
• Number of companies that collaborate with
universities
• Number of joint R&D projects (comparison with the
previous programming period)
• Joint PhD programs (University-industry)
• Reinforcing of inter-firms
cooperation
• Number of consortia projects
• Size and diversity of consortia
• Cluster dynamics: collective efficiency actions
• Increased absorptive
capacity
• Ranking of absorptive capacity on the Global
Competitiveness Report
Source: Authors’ elaboration.
3.2.3. Dimension 3: Structural change
RIS3 is about structural change which is its ultimate goal. Either through specialization or
diversification, the aimed change targets competitiveness. Hence, the first level of analysis
relates to the value chain positioning and integration. The profile of the Portuguese industry is
changing towards a higher relative concentration in conception and/or the market, reducing the
relevance of production. Assessing clusters is also complementary to the previous data, namely,
in what concerns measuring the density of networks, the collective efficiency and hence,
collective competitiveness.
The level of structural change aims to evaluate the effective changes in the innovation
system elements, namely in terms of the increased firms’ capabilities, proxied by the percentage

78
of PhDs hired by firms, but also in terms of the relative weight of high technology/knowledge
intensive sectors in the GVA. Other indicators like BERD/GERD also indicate the change in
the innovation readiness and knowledge intensity of businesses. A third level of analysis relates
to specialization and intends to measure concentration of economic activity and scientific
resources in order to uncover the shift of patterns of the Portuguese system. Finally, assessing
innovation readiness, based upon proxies, evaluates the success in changing the construction of
competitive advantages based on innovation.
Table 8. Indicators to assess structural change
Specific goals to monitor Proposed set of indicators
Str
uct
ura
l ch
ang
e
• Value chain integration and
positioning
• Value chain evolution per thematic domain
• Synergies with European projects (sequential projects)
• Networking density (number of links)
• Cluster and networks of firms for R&D (assessed
through mobilizing projects)
• Structural change • % of PhDs hired by firms
• High technology sectors in percentage of GVA
• Return on investment in R&D
• BERD/GERD
• Specialization • Specialization quotient
• Index of scientific specialization (based on
publications and also PhDs)
• Index of patent specialization
• Revealed comparative advantage (Balassa)
• Innovation readiness
(sophistication and ability to
adapt)
• Business sophistication
• Production process sophistication
• Firms with R&D activities
• Human capital on STEM
Source: Authors’ elaboration.
3.2.4. Dimension 4: Long Term Impacts
The ultimate goal of RIS3 is to create the conditions to sustain a steady and continuous increase
in social welfare. For that, the outcomes in terms of growth and jobs are key levels of analysis.
Nevertheless, it is increasingly important to consider sustainability as a competitiveness driver.
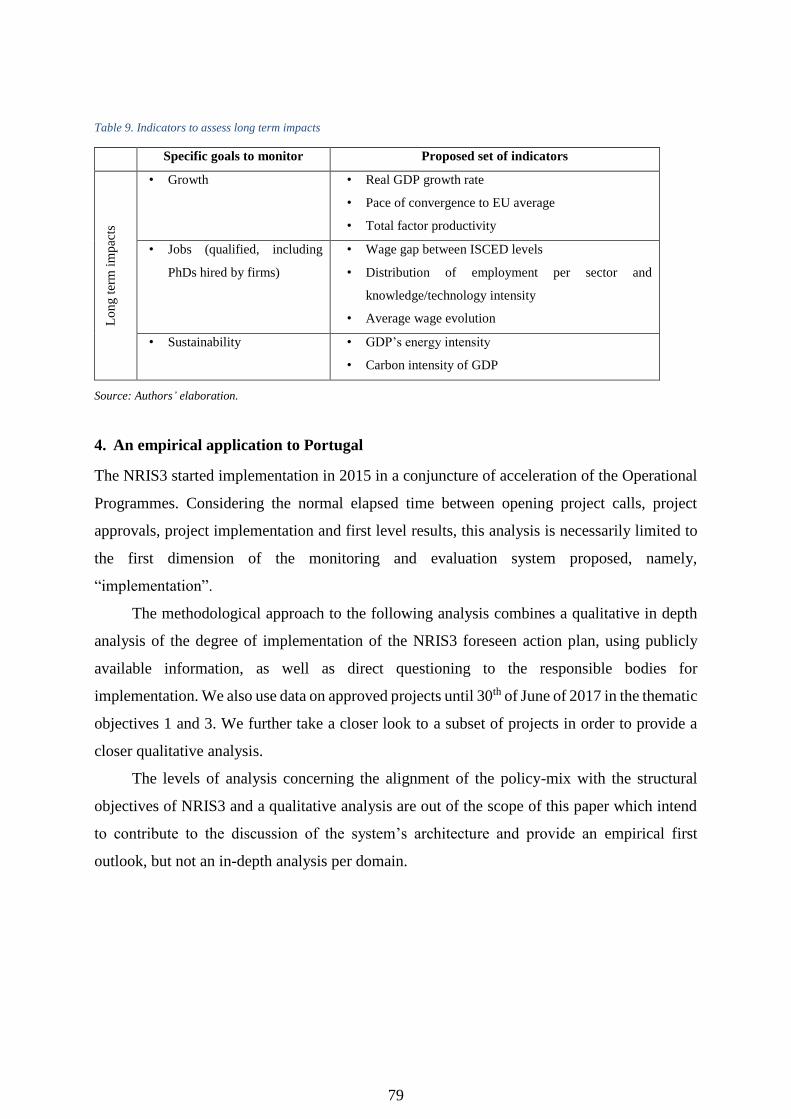
79
Table 9. Indicators to assess long term impacts
Specific goals to monitor Proposed set of indicators
Lo
ng
ter
m i
mp
acts
• Growth • Real GDP growth rate
• Pace of convergence to EU average
• Total factor productivity
• Jobs (qualified, including
PhDs hired by firms)
• Wage gap between ISCED levels
• Distribution of employment per sector and
knowledge/technology intensity
• Average wage evolution
• Sustainability • GDP’s energy intensity
• Carbon intensity of GDP
Source: Authors’ elaboration.
4. An empirical application to Portugal
The NRIS3 started implementation in 2015 in a conjuncture of acceleration of the Operational
Programmes. Considering the normal elapsed time between opening project calls, project
approvals, project implementation and first level results, this analysis is necessarily limited to
the first dimension of the monitoring and evaluation system proposed, namely,
“implementation”.
The methodological approach to the following analysis combines a qualitative in depth
analysis of the degree of implementation of the NRIS3 foreseen action plan, using publicly
available information, as well as direct questioning to the responsible bodies for
implementation. We also use data on approved projects until 30th of June of 2017 in the thematic
objectives 1 and 3. We further take a closer look to a subset of projects in order to provide a
closer qualitative analysis.
The levels of analysis concerning the alignment of the policy-mix with the structural
objectives of NRIS3 and a qualitative analysis are out of the scope of this paper which intend
to contribute to the discussion of the system’s architecture and provide an empirical first
outlook, but not an in-depth analysis per domain.
80
4.1 Implementation of bottom-up continuous processes
4.1.1 State-of-play: overall process analysis on implementation
NRIS3 has been under implementation for the last two years following a very successful stage
of strategy design and priorities identification. In what concerns implementation, the state-of-
play is asymmetric. On one hand, the translation of the priorities of smart specialization into
selection criteria has been successful and stakeholders have had to promote the adjustment of
their projects in order to guarantee alignment with those priorities. Nevertheless, Portugal has
been struggling in the governance model, in the policy-mix and in the monitoring and
evaluation system. In what concerns governance, both the national structures and the regional
structures have not completed the creation of the steering committees, neither of the working
groups that should coordinate and guide the entrepreneurial discovery process. This is a
transversal problem that start at national government coordination among the ministries
involved and spreads out to the regional structures in charge of the operational programs.
There is still significant parallel work that need to converge towards a RIS3 focus. Such
an example is the independent definition of the National Research Agenda for 2030 and Cluster
Policy. Although RIS3 upholds the co-forging of strategies, the research agendas for the next
decade were defined solely by universities, not taking into account the RIS3 nor the business
development strategies and market trends for the next decade. On the other hand, cluster policy
has also been relaunched in a context outside the RIS3 process and in complete detachment
from the research strategies. Hence, it is fundamental to close these gaps and use the NRIS3 to
bridge the knowledge production and the knowledge valorization systems, umbrellaing a
converging strategy.
In what concerns the governance structures, the coordination and steering committees are
still to be created or consolidated both at national and regional levels. This delay appears to be
a result of a change of focus from strategy, towards speedy implementation of the operational
programs. In fact, although small teams have been created to run everyday assignments related
to projects’ evaluation and minor monitoring tasks, we can perceive problems in terms of
coordination and stakeholders’ engagement.
In terms of the policy-mix, there is no perceivable inn ovation or adjustment because of
the NRIS3. A similar recipe is being applied to all priorities and there is no evidence of any
thematic call being launched. The visibility of NRIS3 comes, in Thematic Objective 1, as a pre-
condition to access funding and in Thematic Objective 3 as a preferred condition (discriminated
in the selection criteria based on mere alignment, missing a clear quality/impact dimension).
81
The lack of a thematic approach and of policy innovation present efficiency and effectiveness
constraints to the strategy implementation and represents a major challenge for Portugal in the
coming years.
Again, the very small scale of the teams in charge of RIS3 (1 person at national level, and
between 1 to 3 FTE in each region) along with the vast array of priorities present a severe
constraint on the capacity to continue to engage and dynamize the entrepreneurial discovery
spaces and foster the continuing of bottom-up strategy design and policy-making.
Finally, the monitoring and evaluation system is still in a very early stage of
implementation, being challenging to design a system that goes beyond a simple input and
output static analysis that does not include the study of new and transitional dynamics within
the innovation system.
4.1.2 Participants in the entrepreneurial discovery process
As stated before, the teams in charge of coordinating RIS3 in each region present clear
constraints in terms of size and competencies’ spectre that hampers the coordination and
development of efforts tending to sustain the entrepreneurial discovery process along time.
Considering this to be a new dimension of RIS3 and the fact that this large scale stakeholder
involvement is a novelty, top-down stimulus and coordination is fundamental to the
engagement of actors. As a result, having contacted all the regions and the national authorities,
only the Centro region has implemented some attempts of entrepreneurial discovery with a
positive impact in the design of the calls and in the fine tuning of some evaluation criteria.
4.1.3 Changes in Policy Design
The rationale of NRIS3 implies that, within the implementation, the policy-mix is to be adjusted
to the specificities of each thematic priority. Furthermore, NRIS3 is also about innovating in
the policy but the instruments mobilize in Portugal are the same as in the past. The only change
was in the selection criteria, with no tailoring to each specific priority. This is one of the reasons
that may condition, severely, the success of NRIS3 implementation. Hence, an overview of the
policy-mix identified in the NRIS3 and the corresponding practical implementation in terms of
calls highlights that no changes were introduced in the policy-mix. In fact, apart from the
evaluation, no thematic calls were launched, in the absence of entrepreneurial discovery there
was no fine tune to the existing instruments and there is a lack of evidence supporting any type
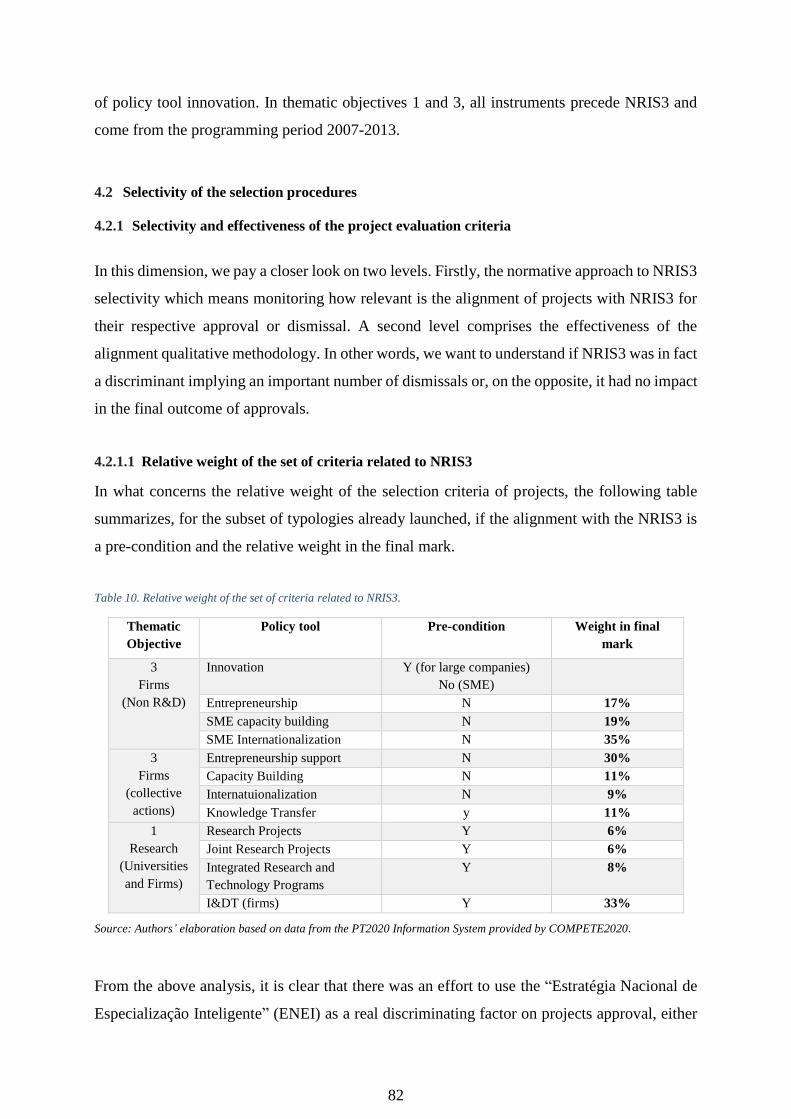
82
of policy tool innovation. In thematic objectives 1 and 3, all instruments precede NRIS3 and
come from the programming period 2007-2013.
4.2 Selectivity of the selection procedures
4.2.1 Selectivity and effectiveness of the project evaluation criteria
In this dimension, we pay a closer look on two levels. Firstly, the normative approach to NRIS3
selectivity which means monitoring how relevant is the alignment of projects with NRIS3 for
their respective approval or dismissal. A second level comprises the effectiveness of the
alignment qualitative methodology. In other words, we want to understand if NRIS3 was in fact
a discriminant implying an important number of dismissals or, on the opposite, it had no impact
in the final outcome of approvals.
4.2.1.1 Relative weight of the set of criteria related to NRIS3
In what concerns the relative weight of the selection criteria of projects, the following table
summarizes, for the subset of typologies already launched, if the alignment with the NRIS3 is
a pre-condition and the relative weight in the final mark.
Table 10. Relative weight of the set of criteria related to NRIS3.
Thematic
Objective
Policy tool Pre-condition Weight in final
mark
3
Firms
(Non R&D)
Innovation Y (for large companies)
No (SME)
Entrepreneurship N 17%
SME capacity building N 19%
SME Internationalization N 35%
3
Firms
(collective
actions)
Entrepreneurship support N 30%
Capacity Building N 11%
Internatuionalization N 9%
Knowledge Transfer y 11%
1
Research
(Universities
and Firms)
Research Projects Y 6%
Joint Research Projects Y 6%
Integrated Research and
Technology Programs
Y 8%
I&DT (firms) Y 33%
Source: Authors’ elaboration based on data from the PT2020 Information System provided by COMPETE2020.
From the above analysis, it is clear that there was an effort to use the “Estratégia Nacional de
Especialização Inteligente” (ENEI) as a real discriminating factor on projects approval, either
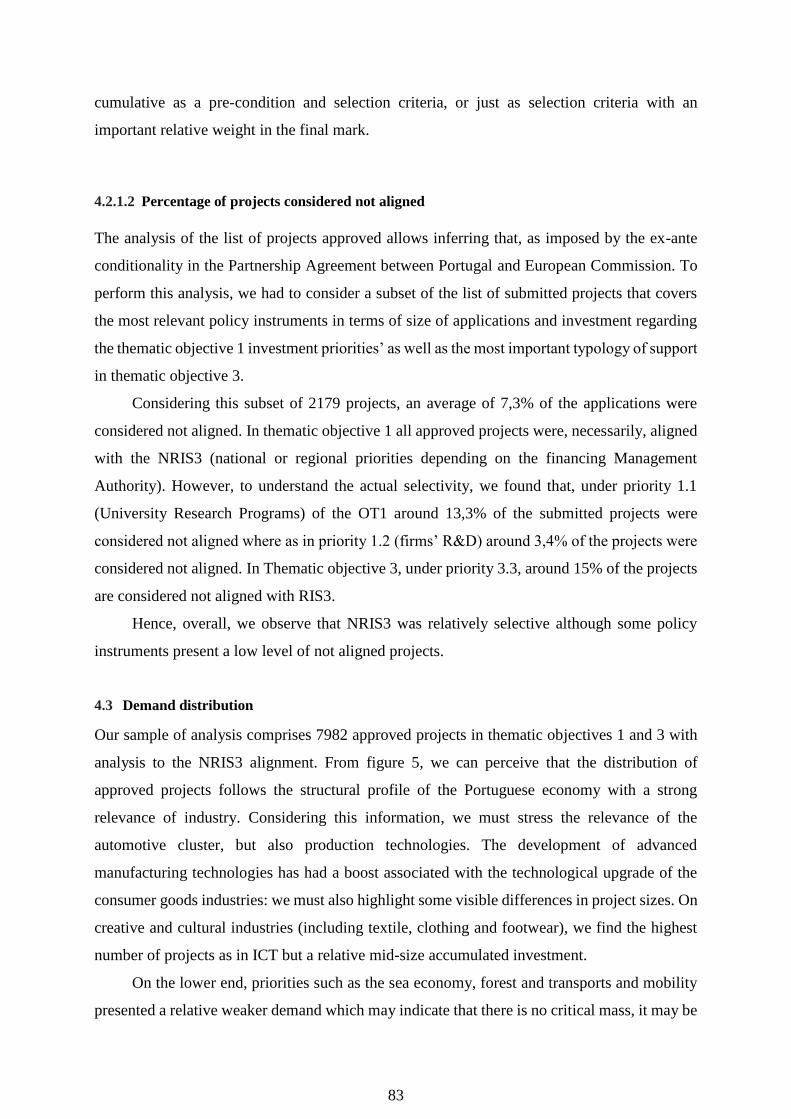
83
cumulative as a pre-condition and selection criteria, or just as selection criteria with an
important relative weight in the final mark.
4.2.1.2 Percentage of projects considered not aligned
The analysis of the list of projects approved allows inferring that, as imposed by the ex-ante
conditionality in the Partnership Agreement between Portugal and European Commission. To
perform this analysis, we had to consider a subset of the list of submitted projects that covers
the most relevant policy instruments in terms of size of applications and investment regarding
the thematic objective 1 investment priorities’ as well as the most important typology of support
in thematic objective 3.
Considering this subset of 2179 projects, an average of 7,3% of the applications were
considered not aligned. In thematic objective 1 all approved projects were, necessarily, aligned
with the NRIS3 (national or regional priorities depending on the financing Management
Authority). However, to understand the actual selectivity, we found that, under priority 1.1
(University Research Programs) of the OT1 around 13,3% of the submitted projects were
considered not aligned where as in priority 1.2 (firms’ R&D) around 3,4% of the projects were
considered not aligned. In Thematic objective 3, under priority 3.3, around 15% of the projects
are considered not aligned with RIS3.
Hence, overall, we observe that NRIS3 was relatively selective although some policy
instruments present a low level of not aligned projects.
4.3 Demand distribution
Our sample of analysis comprises 7982 approved projects in thematic objectives 1 and 3 with
analysis to the NRIS3 alignment. From figure 5, we can perceive that the distribution of
approved projects follows the structural profile of the Portuguese economy with a strong
relevance of industry. Considering this information, we must stress the relevance of the
automotive cluster, but also production technologies. The development of advanced
manufacturing technologies has had a boost associated with the technological upgrade of the
consumer goods industries: we must also highlight some visible differences in project sizes. On
creative and cultural industries (including textile, clothing and footwear), we find the highest
number of projects as in ICT but a relative mid-size accumulated investment.
On the lower end, priorities such as the sea economy, forest and transports and mobility
presented a relative weaker demand which may indicate that there is no critical mass, it may be

84
necessary to reformulate the strategy or even eliminate this priority and or a specific policy-
mix should be design to better suit the peculiarities of these specialization priorities.
Figure 5. Overall distribution of the approved projects per specialization thematic priority
Source: Authors’ elaboration.
We must acknowledge that most projects (around 75%) present alignments with more
than one domain. This analysis selected only the principal priority of alignment. The following
analysis provides a quantitative and qualitative overview per specialization topic.
1. Agrofood
Figure 6. Distribution of Agrofood approved projects per policy tool
Source: Authors’ elaboration.
Agrofood: this domain is present in all the “Estratégias Regionais de Especialização
Inteligente” (EREI) of the country, existing regional specificities of focus taking care of the

85
endogenous resources of the respective territories. This is an area where there is a national
strategic export interest, as well as a national public policy instrument (Programa de
Desenvolvimento Rural 2020 - PDR2020) of major relevance in the "production" dimension of
the value chain. However, according to the management authority of the PDR2020, the ENEI
has not been considered on their analysis.
2. Water and environment
Figure 7. Distribution of Water and environment approved projects per policy tool
Source: Authors’ elaboration.
This priority shows a residual demand resulting from the lack of research dynamics and the
lack of business dynamics in the green economy. Some biorefining and torrefaction projects
emerge which can give a new impetus.
3. Automotive, Aeronautics, Space
Figure 8. Distribution of Automotive, Aeronautics and Space approved projects per policy tool
Source: Authors’ elaboration.
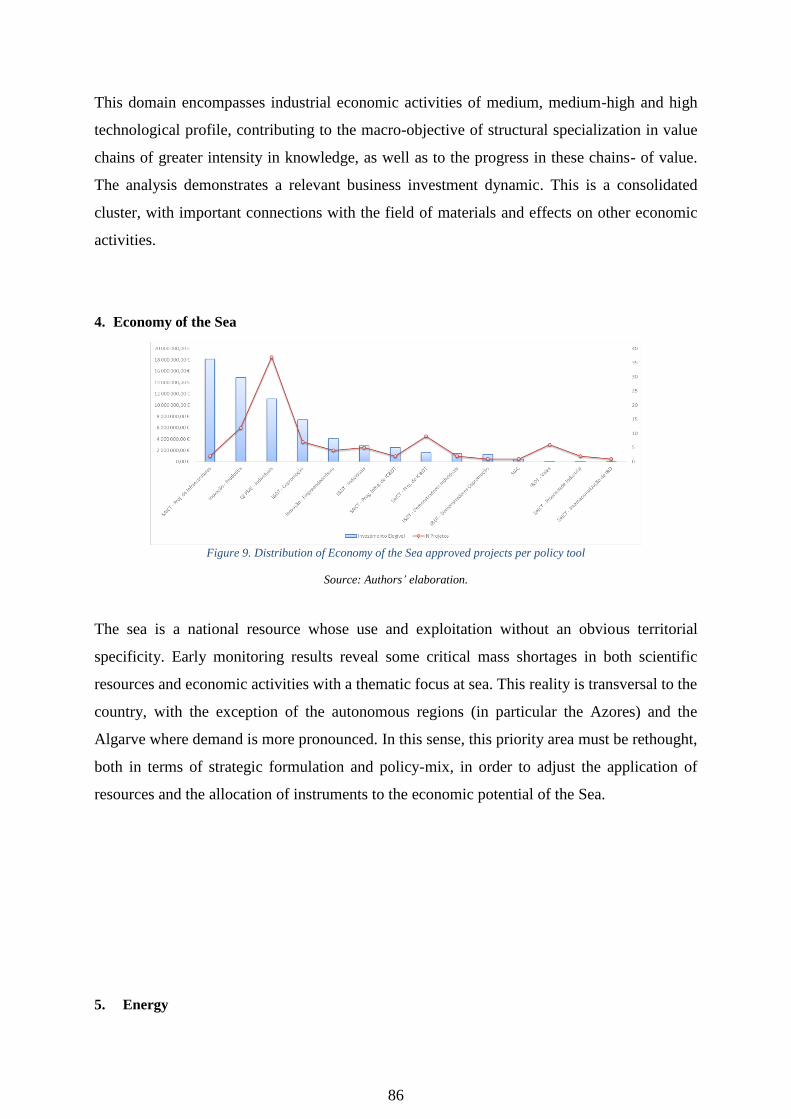
86
This domain encompasses industrial economic activities of medium, medium-high and high
technological profile, contributing to the macro-objective of structural specialization in value
chains of greater intensity in knowledge, as well as to the progress in these chains- of value.
The analysis demonstrates a relevant business investment dynamic. This is a consolidated
cluster, with important connections with the field of materials and effects on other economic
activities.
4. Economy of the Sea
Figure 9. Distribution of Economy of the Sea approved projects per policy tool
Source: Authors’ elaboration.
The sea is a national resource whose use and exploitation without an obvious territorial
specificity. Early monitoring results reveal some critical mass shortages in both scientific
resources and economic activities with a thematic focus at sea. This reality is transversal to the
country, with the exception of the autonomous regions (in particular the Azores) and the
Algarve where demand is more pronounced. In this sense, this priority area must be rethought,
both in terms of strategic formulation and policy-mix, in order to adjust the application of
resources and the allocation of instruments to the economic potential of the Sea.
5. Energy

87
Figure 10. Distribution of Energy approved projects per policy tool
Source: Authors’ elaboration.
Portugal has accumulated knowledge and human capital in the field of energy, whether at the
level of renewable production or at the level of network management. However, in terms of
economic activities, the density is relatively low, especially if we exclude the dimensions of
production. Demand analysis shows a lack of critical mass. Nonetheless, energy is a subject
of great current and prospective relevance and because it has become a priority, equally
transversal to Estratégia Nacional de Especialização Inteligente (ENEI) and EREIs.
6. Forest
Figure 11. Distribution of Forest approved projects per policy tool
Source: Authors’ elaboration.
The constraints imposed by the current market structure, land dispersion and the lack of new
business models castrates the development of new technologies and the potential to develop a
related variety of prosperous economic activities around the forest. The analysis revealed lack
of demand and density, despite the relevance of some associated economic activities (e.g. paper
mills).
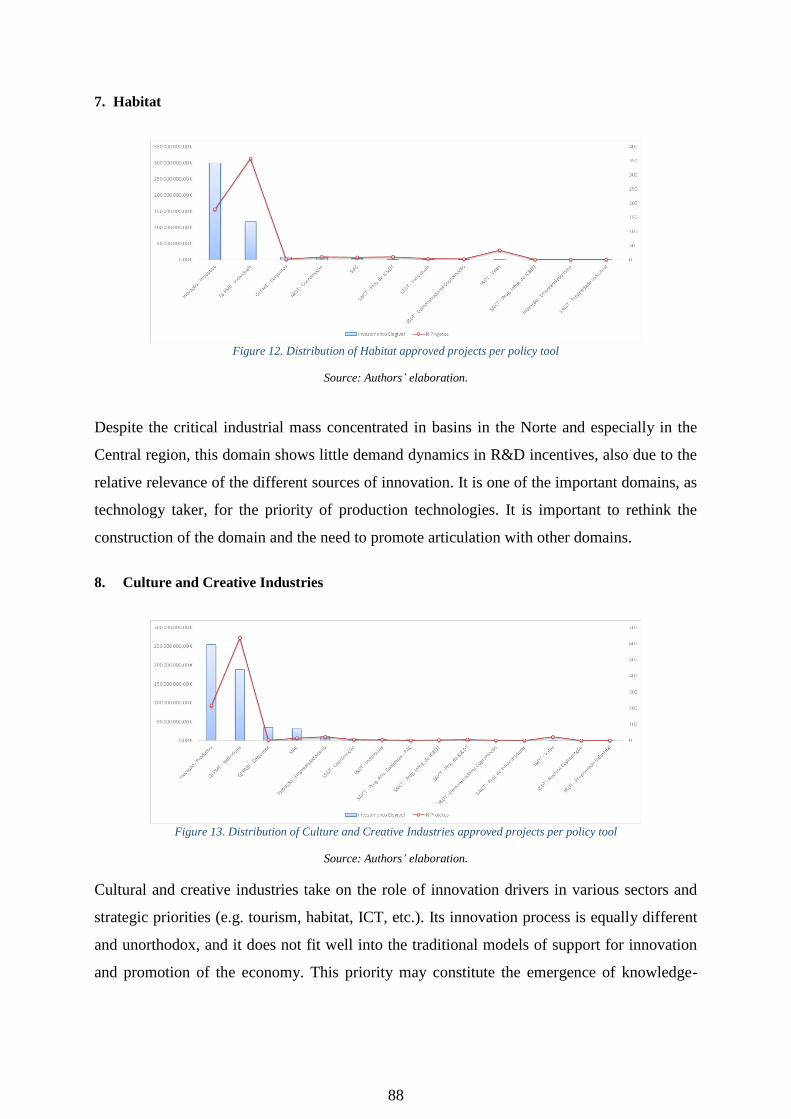
88
7. Habitat
Figure 12. Distribution of Habitat approved projects per policy tool
Source: Authors’ elaboration.
Despite the critical industrial mass concentrated in basins in the Norte and especially in the
Central region, this domain shows little demand dynamics in R&D incentives, also due to the
relative relevance of the different sources of innovation. It is one of the important domains, as
technology taker, for the priority of production technologies. It is important to rethink the
construction of the domain and the need to promote articulation with other domains.
8. Culture and Creative Industries
Figure 13. Distribution of Culture and Creative Industries approved projects per policy tool
Source: Authors’ elaboration.
Cultural and creative industries take on the role of innovation drivers in various sectors and
strategic priorities (e.g. tourism, habitat, ICT, etc.). Its innovation process is equally different
and unorthodox, and it does not fit well into the traditional models of support for innovation
and promotion of the economy. This priority may constitute the emergence of knowledge-

89
producing activities serving as KET in design based consumer goods. The significance of
investment results, exactly, from the still large relevance of the fashion industries.
9. Materials
Figure 14. Distribution of Materials approved projects per policy tool
Source: Authors’ elaboration.
This priority area shows a high demand, both in the size of the companies and in the research
dimension, with transversal applications in manufacturing and consumer goods. It is a
predominantly national domain, being present in some EREIs.
10. Health
Figure 15. Distribution of Health approved projects per policy tool
Source: Authors’ elaboration.
Emerging domain, leader in research and development in terms of economic activity. The
analysis shows that it is important to reinforce the importance of entrepreneurship and the
capture of structuring FDI, as well as the promotion of companies. To this end, it is necessary

90
to adapt incentive systems to long innovation cycles (like the case of health – e.g. the
development of a new drug). Pre-commercial public procurement and innovative public
procurement can be instruments of major relevance to accelerate the process of technological
and economic maturation.
11. ICT
Figure 16. Distribution of ICT approved projects per policy tool
Source: Authors’ elaboration.
This is a domain of the new economy with characteristics of broad spectrum technology, in
which Portugal has consolidated economic activity, especially in the dimension of knowledge
intensive services. Both in ENEI and EREI, ICT (or TICE) is present without there being a
regional specificity associated with their rational ones. In this case, the analysis carried out
indicates that priority lines of ICT cross-referencing could be defined with the desired
specialization value chains, being this definition a national matrix. For example, in the
intersection of ICT with health, the cross-cutting of ICT with tourism, the application of ICTs
in critical contexts or the cross-cutting of ICTs with city policy and the new models of social
economy and sharing economy.

91
12. Production Technologies
Figure 17. Distribution of Production Technologies (Process industries) approved projects per policy tool
Source: Authors’ elaboration.
Figure 18. Distribution of Production Technologies (Product industries) approved projects per policy tool
Source: Authors’ elaboration.
Although technologically it may make sense to distinguish between product and process, there
is a clear "confusion" of the promoters themselves in the classification of projects, with frequent
simultaneous framing of the two priorities. On the other hand, although with greater incidence
in the North and the Center, this domain consists of technologies transverse to the
manufacturing industry, whose territorial specificities are not intrinsic, but contributed by the
relational capital and interconnection of decades with very regionalized clusters sectorial (ex.
fashion).

92
13. Transportation, Mobility and Logistics
Figure 19. Distribution of Transportation, Mobility and Logistics approved projects per policy tool
Source: Authors’ elaboration.
Transportation, mobility and logistics: this is a domain without relevant demand, with a
rationale apparently out of alignment with the reality of the national innovation system and its
technological trajectories.
14. Tourism
Figure 20. Distribution of Tourism approved projects per policy tool
Source: Authors’ elaboration.
The analysis of the selected policy instruments is skewed in the case of tourism. Given the
specificities of the technological trajectories associated with tourism, based mainly on symbolic
knowledge and non-technological endogenous resources, the reference policy mix is
inadequate. Even so, there is a relevant dynamic in the case of SI Innovation, transversal to the
regions. Here too, there is some overlap between ENEI and EREIs. If on the one hand, tourism
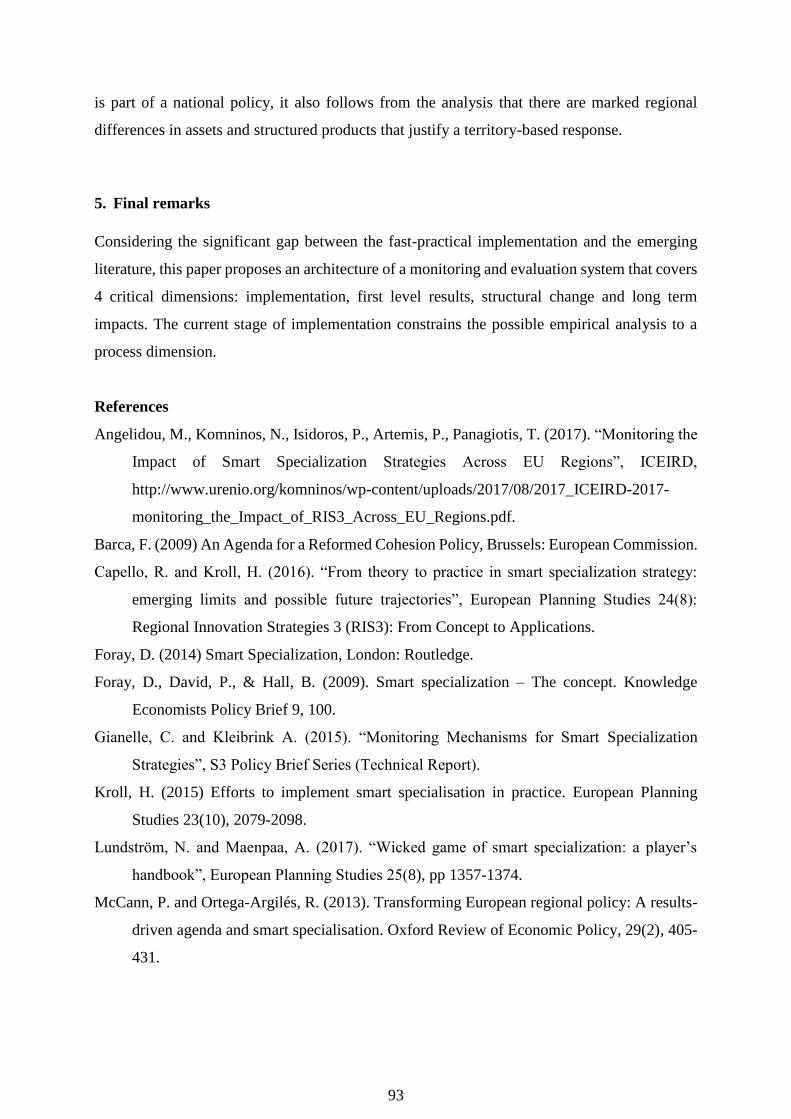
93
is part of a national policy, it also follows from the analysis that there are marked regional
differences in assets and structured products that justify a territory-based response.
5. Final remarks
Considering the significant gap between the fast-practical implementation and the emerging
literature, this paper proposes an architecture of a monitoring and evaluation system that covers
4 critical dimensions: implementation, first level results, structural change and long term
impacts. The current stage of implementation constrains the possible empirical analysis to a
process dimension.
References
Angelidou, M., Komninos, N., Isidoros, P., Artemis, P., Panagiotis, T. (2017). “Monitoring the
Impact of Smart Specialization Strategies Across EU Regions”, ICEIRD,
http://www.urenio.org/komninos/wp-content/uploads/2017/08/2017_ICEIRD-2017-
monitoring_the_Impact_of_RIS3_Across_EU_Regions.pdf.
Barca, F. (2009) An Agenda for a Reformed Cohesion Policy, Brussels: European Commission.
Capello, R. and Kroll, H. (2016). “From theory to practice in smart specialization strategy:
emerging limits and possible future trajectories”, European Planning Studies 24(8):
Regional Innovation Strategies 3 (RIS3): From Concept to Applications.
Foray, D. (2014) Smart Specialization, London: Routledge.
Foray, D., David, P., & Hall, B. (2009). Smart specialization – The concept. Knowledge
Economists Policy Brief 9, 100.
Gianelle, C. and Kleibrink A. (2015). “Monitoring Mechanisms for Smart Specialization
Strategies”, S3 Policy Brief Series (Technical Report).
Kroll, H. (2015) Efforts to implement smart specialisation in practice. European Planning
Studies 23(10), 2079-2098.
Lundström, N. and Maenpaa, A. (2017). “Wicked game of smart specialization: a player’s
handbook”, European Planning Studies 25(8), pp 1357-1374.
McCann, P. and Ortega-Argilés, R. (2013). Transforming European regional policy: A results-
driven agenda and smart specialisation. Oxford Review of Economic Policy, 29(2), 405-
431.

94
McCann, P. and Ortega-Argilés, R. (2016). Smart Specialization: Insights from the EU
Experience and Implications for Other Economies. Investigaciones Regionales – Journal
of Regional Research 36, 279-293.
Morgan, K. (2015). Smart Specialization: Opportunities and Challenges for Regional
Innovation Policy. Regional Studies 49(3): Intermediaries and the Creative Economy.
Piatkowski, M., Szuba, T. and Wolszczak, G. (2014). Review of national and regional research
and innovation strategies for smart specialization (RIS3) in Poland, World Bank 86527.
Raimondo E. (2016). What Difference Does Good Monitoring & Evaluation Make to World
Bank Project Performance? Policy Research Working Paper 7726. World Bank.
95
CHAPTER 4: SMART SPECIALIZATION: A CASE STUDY OF
TRANSFORMATIVE ACTIONS IN THE TRADITIONAL FURNITURE
INDUSTRY
Abstract
Operationalizing smart specialization is quite a challenge. Since theory lags behind practice, all
examples that can assist the operational translation of the concept are of high value. In this
paper, we address the case of Art on Chairs which we consider to be an innovative program of
Transformative actions aiming to change the paradigm of the Portuguese furniture industry and
overturn its competitiveness decay.
1. Introduction
Follower regions present structural shortcomings that need to be specifically targeted by public
policy. In fact, besides the imbalance or lack of density in the regional innovation system, the
poor external perception and the prevalence of market failures (e.g. venture capital) hinder a
smooth transition of the smart specialization concept to this reality (Sandu, 2012). Furthermore,
some regions are overspecialized which hampers the ability of creating a related variety of
activities and hence building an appropriate eco-system to co-invent (e.g. the case of Algarve,
an overspecialized region in tourism is paradigmatic of regions with structural imbalances so
severe that without a public push to recompose regional assets and knowledge bases, smart
specialization in its purest assertion would imply reinforcing this lock-in). Consequently, a
smart innovation policy must address the creation of the preconditions for the consolidation of
the regional innovation system for follower regions to be able to specialize in the future.
Art on Chairs is an ambitious program that aims at changing the paradigm of furniture
manufacturers. Hence, it conveys a structural approach that cannot be fully measured yet but
which transformative power is visible in the changes. Furthermore, it is clear that this novel
approach to an “old problem” generated a powerful demonstration effect that has engaged other
firms that are interested in participating in the coming edition, in a path towards developing and
absorbing design capabilities. With the crucial support from Cohesion Policy, Norte has
96
engaged all actors to lead the economy into a new paradigm based on the emergence of
knowledge intensive traditional industries. Hence, a strong investment was made in
constructing a regional innovation system that could build new dynamic competitive
advantages, exploiting also the enormous potential for cross-sectorial innovation. Nevertheless,
as elsewhere in Europe, we face the challenge of bridging universities and knowledge intensive
activities with SMEs, especially in traditional sectors. Creative industries are an emerging
activity that must be fostered because of its capacity to create value, but also because they
function as a general purpose technology. In traditional sectors, the relevance of developing
design based consumer goods implies a significant capacity to absorb the symbolic capital
produced in creative industries but this is usually a difficult task. Art on Chairs responds in an
innovative way to this problem.
Hence, section 2 presents the transformative purpose of smart specialization in the context
of follower regions and traditional industries, namely the goals underlying such transformative
actions and the expected impacts. Section 3 presents the case study of Art on Chairs and section
4 the conclusions form this real-life application of the smart specialization conceptual
framework.
2. Smart Specialization: transforming paradigms
2.1 RIS3: the concept
The Smart Specialization concept derives from two strands of the economic literature, one
focused on the transatlantic productivity gap and the other on the sectorial innovation systems
(McCann and Argiles, 2013). According to Foray and van Ark (2007) and Foray et al. (2009),
smart specialization is about the refocus of R&D and Innovation in alignment with regions’
distinctive features. In other words, regions must specialize in order to be able to generate
critical mass. However, although the author has always rejected the hypothesis of picking
winners or of overspecialization, the obvious risks of technological lock-in and of a wrong
choice forced the evolution of the smart specialization paradigm. Authors like Pontiakis et al.,
2009; Kyriakou, 2009; Giannitsis, 2009 acknowledged that specialization enables economies
of scale but without diversity, the economies limit their ability to shift from technology
trajectory and to readjust their economic structure. Following this discussion, related variety
became a cornerstone of SS (or, as the McCann and Argiles (2013) name it “specialized
diversification”). This is also expressed by the European Commission which stresses the
importance of diversification of related activities in order to reduce the risks of lock in and of a
97
shift in market demand (CEC, 2010). Also Capello (2013) argues in favor of a "smart
diversification and upgrading” and defines in a recent paper smart specialization as a way of
matching knowledge and human capital, with the economic structure of regions and its potential
to build competitive advantages (Camagni and Capello, 2012, Capello et al. 2016, Churski et
al., 2017). These authors also uphold the need of embeddedness of innovation policies in the
local context as well as the importance of connectedness in order to ensure maximizing
knowledge flows internally and also linking to external knowledge bases (McCann and Argiles,
2013), but adapted to the specificities of each region innovation pattern (Camagni and Capello,
2012) upgrading and diversifying the economic structure along technological and market
relatedness (ESPON, 2012).
This represents a refocus of smart specialization on regions instead of sectors. This
mutation of the original concept incorporates notions of the economic geography and RIS the
literature but has also highlighted the complexity of transferring the smart specialization
concept into the economic geography context and the need to address the systemic nature of
innovation within a process of closeness and relatedness (Camagni and Capello, 2012).
In sum, from the literature we observe a set of commonalities that shape the concept of
smart specializations. First of all, smart specialization is about choices and the focus of
resources in domains (multi-sectorial and multi-institutional). The idea of concentration aims
to ensure an adequate scale (critical mass) to base the development of a related variety of
activities. Secondly, smart specialization must focus on the idiosyncrasies of regions. Given
that innovation is a contextual process, smart specialization strategies can only be defined at a
regional level. Thirdly, these strategies must focus on domains upon which regions can
construct competitive advantages internationally. Finally, smart specialization is also about
connectedness since linking to other knowledge bases and being integrated in international
value chains is fundamental to improve a regions ability to innovate and grow.
2.2 Norte as a follower region
Norte region is an example of a path-dependent trajectory of industrialization, evolving from a
productive structure clearly marked by the predominance of “supplier-dominated” sectors
(using the taxonomy proposed by Pavitt, 1984). Data shows that although the weight of high
and medium high tech industries is similar to the other regions, Norte presents a predominant
specialization on low tech industries. The vast majority of traditional sectors that led the
historical process of industrialization in Portugal (textiles, apparel, shoes, furniture and other

98
wood industries and light mechanical industries) are export-oriented and strongly represented
in the region, representing the most vulnerable part of the specialization profile of the
Portuguese exports considering the threats and the opportunities generated by the last impulse
of globalization. These sectors are moving towards a dual structure, in which an increasing
number of firms are leading a significant number of upgrading processes within the global value
chains. At the same time, punctual examples of “specialized suppliers” are emerging in sectors
such as scientific instruments, equipment, information systems, software and molds.
Despite the astonishing progress (from a GERD of 0.6% on GDP in 2004 to a 1.4% in
2013), R&D activities still present a small expression and are mainly developed by the public
sector. The extreme weakness of R&D activities in the business sector is accompanied by a
very low level of patent indicators. Efficiency in R&D activities is apparently low (for instance,
the ratio of EPO or USPTO patents / R&D expenditure). However, within this set of regions
we can find different performances in what concerns productivity growth, what suggests that
the nexus between knowledge creation and growth is, for these regions, a complex one.
The strategic approach to diffusion can no longer be understood just as an exogenous
process of knowledge transfer, a strictly imitative process. The art of dealing with diffusion in
a proactive way, creating innovative trajectories, will be the central role of RIS in follower
regions. However, firms must be at the center of an innovation system not only because
innovation is by definition a commercial or business action but also because innovation is not
just the result of a “linear process” from formal R&D to production.
The North region Innovation Plan, along with a set of strategic agendas (Creative
Industries, Sea and Marine Activities, Innovation, etc.), was created to support the actions of
the Operational Program. It emphasized the need for regional policy to be devised under a
selective and focused approach, namely considering the region’s specific assets (both in the
economy and in the universities). These agendas’ have set the tone in what concerns a smart
specialization diagnosis and the selection of a small number of priorities: Health. ICT and
Production Technologies, Creative Industries and Marine Technologies and other sea relative
activities are among them.
It is obvious that traditional industries must be one of the cornerstones of our growth
strategy, implying the ability to increase the valued added through knowledge. On these
industries the potential for incorporating synthetic or analytical knowledge is either shallow or
indistinctive in an international competitive setting. We believe that the highest potential for
adding value relies in the linking of the creative industries with traditional industries, through
the addition of symbolic knowledge. Hence, we have supported the development of projects
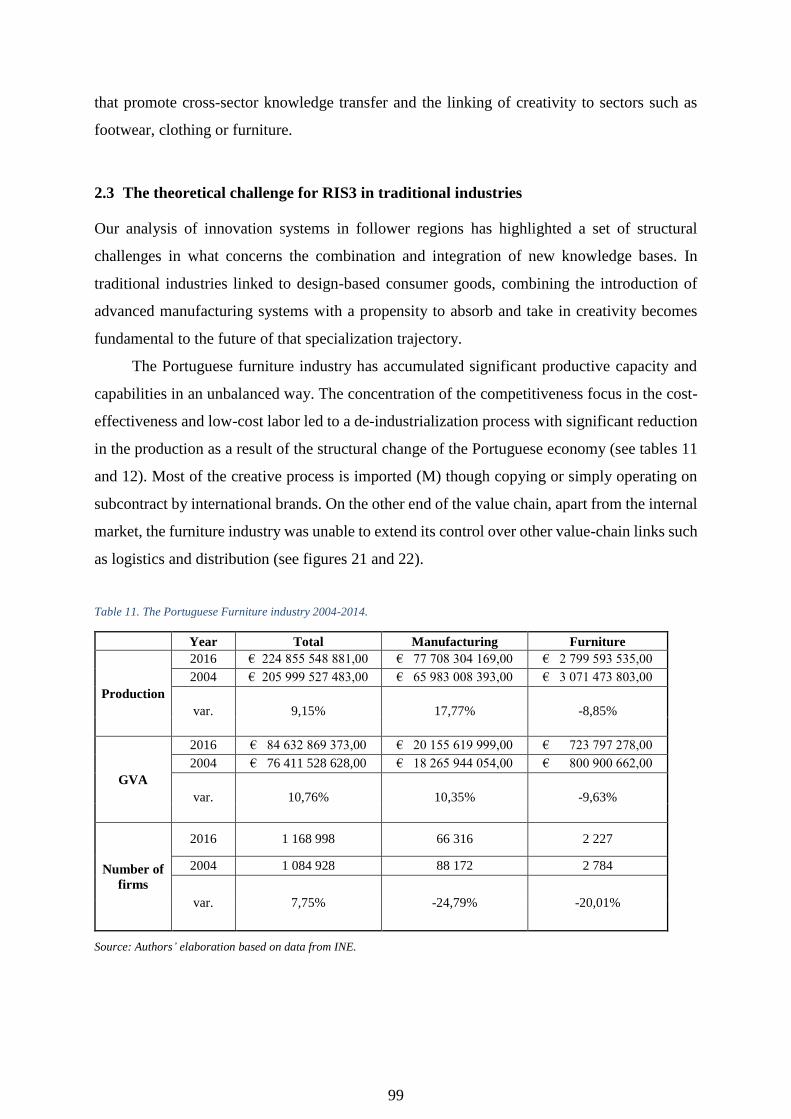
99
that promote cross-sector knowledge transfer and the linking of creativity to sectors such as
footwear, clothing or furniture.
2.3 The theoretical challenge for RIS3 in traditional industries
Our analysis of innovation systems in follower regions has highlighted a set of structural
challenges in what concerns the combination and integration of new knowledge bases. In
traditional industries linked to design-based consumer goods, combining the introduction of
advanced manufacturing systems with a propensity to absorb and take in creativity becomes
fundamental to the future of that specialization trajectory.
The Portuguese furniture industry has accumulated significant productive capacity and
capabilities in an unbalanced way. The concentration of the competitiveness focus in the cost-
effectiveness and low-cost labor led to a de-industrialization process with significant reduction
in the production as a result of the structural change of the Portuguese economy (see tables 11
and 12). Most of the creative process is imported (M) though copying or simply operating on
subcontract by international brands. On the other end of the value chain, apart from the internal
market, the furniture industry was unable to extend its control over other value-chain links such
as logistics and distribution (see figures 21 and 22).
Table 11. The Portuguese Furniture industry 2004-2014.
Year Total Manufacturing Furniture
Production
2016 € 224 855 548 881,00 € 77 708 304 169,00 € 2 799 593 535,00
2004 € 205 999 527 483,00 € 65 983 008 393,00 € 3 071 473 803,00
var. 9,15% 17,77% -8,85%
GVA
2016 € 84 632 869 373,00 € 20 155 619 999,00 € 723 797 278,00
2004 € 76 411 528 628,00 € 18 265 944 054,00 € 800 900 662,00
var. 10,76% 10,35% -9,63%
Number of
firms
2016 1 168 998 66 316 2 227
2004 1 084 928 88 172 2 784
var. 7,75% -24,79% -20,01%
Source: Authors’ elaboration based on data from INE.

100
During this adjustment process, a strong focus was placed on modernization of the industrial
facilities with strong support to machinery investment. Although the investment in R&D
(branding and concept) and in logistics and market innovation have had less attention, we can
perceive a positive evolution.
Figure 21. The innovation value-chain of the furniture industry Figure 22. The impacts of the loss of competiveness
Figure 23. The intermediate goal of Art on Chairs Figure 24. RIS3: transformative actions towards related variety
innovation ecosystem
Source: Authors’ elaboration.
Figures 23 and 24 show the necessary transformative actions that are in the center of the
operationalization of smart specialization. The goal must be to reinforce the investment and the
focus on concept and branding and in logistics and market, extending the potential to create
value and innovate way ahead of simple production. In this regard, we must stress that the
furniture industry is a “supplier dominated industry” form a technological standpoint. That
means that technological innovation is embedded in the machinery and is not a sustainable lever
for constructing new competitive advantages.
In recent years, a strong focus on innovation has spread across the industry as a result of
a program of initiatives targeting entrepreneurs and entrepreneurship in the furniture industry.
As the following table highlights, there is a growing number of firms reporting to develop

101
innovative activities, with a concentration that goes beyond the mere process efficiency (still
dominant) and consistent with figure 23.
Table 12. Distribution of furniture industry firms2 per innovative activity, 2004-2014.
Community Innovation Survey (CIS) - Types of innovation activities
Year R&D Process Market Non-Innovating
2014 13,50% 60,10% 37,00% 10,06%
2004 9,03% 29,97% 10,17% 65,99%
Source: Eurostat, CIS.
As stated, figure 4 is the ultimate goal of smart specialization, that is to boost the linkages
across sectors and across markets (maximize technology relatedness and market relatedness),
creating a related diversity through transformative actions. The case study we address in the
following sections intended to be a transformative action in the context of the furniture industry,
promoting a more balanced value-chain approach and positioning, but also taking advantage of
cross-sectoral partnerships to develop an innovative milieu of related diversity.
2.4 Some methodological notes
This study was conducted based on the close monitoring of this project as the rapporteur for the
Regiostars application using as sources the internal reports produced and the informal
interviews with the managers of the project (Celso Ferreira, Susana Marques, Luciano Gomes,
and some of the companies).
3. Art on chairs: the conceptual approach
Art on Chairs was awarded the Registers in 2014 for its conceptual novelty and outstanding
potential for transformational impact. The project was an ingenious and innovative approach to
the problem of linking creative industries to traditional industries, specifically the furniture
industry where the potential for incorporating synthetic or analytical knowledge is either
shallow or indistinctive in an international competitive setting and the highest potential for
adding value relies in the addition of symbolic knowledge.
Aiming at supporting SMEs to evolve in the value chain and acquire further control of it
through the incorporation of creative knowledge and a focus on innovation, Art on Chairs was
promoted by the Municipality of Paredes in association with local partners and universities:
University of Aveiro, Faculty of Fine Arts of the University of Porto, Matosinhos School of Art

102
and Design and the Institute for Research in Design, Media and Culture (ID+), Art on Chairs
focused on bridging the furniture industry to designers and create a large scale demonstration
effect that could effectively boost a new attitude towards cooperation and the development of
creative capacities within the manufacturing SMEs.
Conceptually, Art on Chairs is an international design event of contemporary creativity
at the intersection of artistic, creative and cultural industries with the traditional furniture
industry of Norte region. The chair was chosen as an icon of this industry but the project
involved many different actions besides the international event, aiming at bridging designers to
SMEs and creating opportunities for the emergence of more creative firms and also for the
furniture manufacturers. There was always a concern for this project to reach the whole
community and hence, from schools, to companies and to international partners, all were
engaged.
3.1 The objectives
The most important feature of Art on Chairs is the recognition that the local mindset needed to
be transformed. Smart specialization is about transformative actions, taking local assets and
finding ways to construct new competitive advantages. But for that to be possible, in a
traditional design based consumer goods industry, it is important to couple the development of
new methods and production technologies with the add-on of these industries key enabling
technology (creativity).
Figure 25. The smiling curve: value distribution along the global value chain
(source: http://oecdobserver.org/news/fullstory.php/aid/4227/Who_92s_smiling_now_.html, OECD)

103
Hence, similar to other industries in Norte region such as footwear, Furniture industry faced the
challenge of moving away from the production trap of the Stan Shih’s smiling curve in order
to gain greater value-chain control and reposition in higher value-added activities. However,
taking into account that most these firms are family-owned SMEs with a long tradition and
established methodologies, breaking inertia and prejudice is hard. Hence, with Art on Chairs it
was intended to restart the competitive approach of the Portuguese furniture industry, with three
main objectives:
1. create a demonstration effect for the value of incorporating creativity, enhancing future
linking of creative industries and the manufacturers of furniture;
2. reconversion of the furniture traditional manufacturers through incorporation of design and
creativity and induction of process innovation in furniture industry;
3. promotion of the development of a design conscience in the school and in community,
targeting the next generation of furniture manufacturers.
3.3 The Action Plan
The project comprised 9 different exhibitions and a continuous programming involving music
concerts, performing, workshops, guided tours, educational services, as well as awards
ceremonies, book presentations, among others. Thus, besides the creation of 136 design chairs,
it included international design competitions, design residences, the introduction of designers
and entrepreneurs, the involvement of the school community in the design of chairs, a chair
hospital, that allowed us to grasp the potential of the demonstration effect and the innovative
character of this creative approach to a common problem of linking creative to manufacturers.
Among the large set of actions that are part of Art on Chairs, we highlight some of the more
illustrative projects that compose it:
(i) Art on Chairs International Design Competition (AOC IDC)
The Art on Chairs IDC was opened to the global community of design students and
professionals, organized in three different categories/narratives:
- Making chairs (projects of chairs for industrial optimization and production);
- Imagining chairs (projects with a prospective nature);
- Sustaining chairs (projects whose main concern was the sustainability).

104
The competition was a tremendous success, receiving 449 valid applications from 37
different countries. That success was built upon the value of the prizes (90k Euros) but also the
possibility of seeing the project prototyped, and possibly commercialized, by the local furniture
industry.
The winning projects were selected by an international jury.
One of the main concerns of the Art on Chairs International Design Exhibition was to
ensure the involvement of the companies in the prototyping of the winning projects.
The exhibition of Art on Chairs International Design Competition materialized in 30
projects of chairs developed in different countries, with 9 prototypes built in Paredes and some
being rolled out for production.
(ii) More Design More Industry
The “More Design More Industry” International Competition attributed 9 grants for residences
of Portuguese and foreign designers in the furniture companies of Paredes sub-region. The
residences lasted eight months and were supervised by senior designers. The 9 designers were
selected by the group of 5 senior designers among 77 applications. Different companies and
different contexts presented challenges and opportunities for designers and entrepreneurs.
During the residences a documentary was produced, which was played during the Art on
Chairs exhibition, and the work/objects produced during the residence were exhibited.
(iii) Meo Chair
“The Design is MEO” was a national design competition organized in the frame of the Art on
Chairs as the result of the association of the Portuguese major telecommunications operator –
Portugal Telecom – with the project. This company felt connected to the idea of promoting
Portuguese design through this initiative.
Organized into two categories, designers were asked to redesign TV equipment (box, router,
remote control) and to develop the project of a chair (Meo Chair).
In the “Meo Chair” category, 3 projects were selected and prototyped by the local furniture
industry. The 3 chairs were part of the global Art on Chairs exhibition. A spin-off of this
competition was also the setting-up of a new design challenge to develop the future remote and
set top boxes for cable tv, highlighting the key enabling technology character of creative
industries.
105
(iv) Duets
“Duets” was based on the constitution of 11 duets between designers and representative
personalities (among which, Luciano Benetton, Cristiano Ronaldo, José Mourinho, Maria
Betânia, etc) of the contemporary society, whose meeting provided the input for the
development of the project of a chair. The slogan was “An idea for the world on a chair”.
The result of this process materialized in 11 chairs, objects that represent the cultural
heritage and life experience of the invited personality and of the designer, in dialogue with the
productive practices of the furniture companies.
One of the most interesting dimensions of “Duets” was the association with UNHCR
(United Nations High Commissioner for Refugees), who recognized the merit of this dimension
of social responsibility associated to design and industry. Thus, the chairs produced in the frame
of this project were auctioned by Christie’s in a ceremony held at the Hotel Ritz, in Lisbon, on
30 November 2012. The auction of the chairs reached the surprising amount of 112k Euros,
which reverted fully to support educational projects in Africa.
A limited edition was produced for each individual project. Five units of each chair were
produced, which were numbered and signed. These eleven chairs were part of the Art on Chairs
international exhibition.
Bringing together companies, designers and universities, Art on Chairs developed a
positive dynamic and brought a different perspective to this territory in a difficult economic
context.
Art on Chairs was also an important marketing instrument, contributing to increasing
awareness of the territory and the levels of self-esteem of its citizens.
3.4 The partnership: a quadruple helix approach
The development of Art on Chairs is based on a set of local, regional and international
partnerships. Locally, Art on Chairs involved the entrepreneur association, universities -
Faculty of Fine Arts of the University of Porto and Matosinhos School of Art and Design,
school boards and local community. The close contact with schools and the co-development of
Art on Chairs was fundamental for a strong commitment and participation in the project, as
well as to increase the levels of appropriation.
In what concerns SMEs, it was crucial to promote their collaboration as the whole project
is founded in SME support. Hence, from a very early stage, the municipality contacted the local
106
entrepreneurs’ association to obtain the support and the involvement of SMEs. Direct contact
was also established and continuous monitoring was implemented. SMEs were kept informed
of the involvement and were able to take advantage in the formatting of the actions (including
the creative residences). The universities were also important to structure the governance model
of the project and to ensure their involvement in the collaboration with firms.
From other Portuguese regions, the partnership involved the University of Aveiro and the
Institute for Research in Design, Media and Culture (ID+), which were key partners for the
construction of Art on Chairs since the beginning. More recently, when the project gained
visibility, strategic partnerships with other municipalities, such as Lisbon, with MUDE
(Portuguese Design Museum) and some major companies such as Portugal Telecom have been
consolidated.
Finally, the visibility of Art on Chairs and the proactive stance of the organization allowed
or the establishment of International Partnerships, among which, with the European Design
Centre (Holland) and the Bilbao Creative Zentrum (Spain). These partnerships enriched the
project but also enlarged its scope and reach. The European Design center even decided to host
the international DME Awards’ Ceremony in Paredes, contributing to increase the international
visibility and the dissemination of Art on Chairs.
3.5 The novelty
Art on Chairs constitutes a novel approach to the problem of interlinking creative industries
with traditional industries. Tackling issues as differences in language between firm owners and
designers, the lack of stimulus and sometimes even capacity to absorb knowledge and to
cooperate and most importantly, the lack of vision to understand the importance of creativity,
presents a daunting challenge that we, as policy makers, have tried to overturn many times with
less success than the one achieved through this projects. The innovative approach of Art on
Chairs comprises different levels. Firstly, Art on Chairs in innovative in concept, basing its
whole focus on a simple everyday object “a chair”. This is quite significant since this is an
object that represents the whole furniture industry and is, many times, underestimated in terms
of its complexity and relevance in the portfolio. Secondly, Art on Chairs was also very cunning
in the way to attract companies. Having been able to obtain the collaboration of international
personalities, Art on Chairs matched those personalities with international designers and
companies in a creative/productive process aiming at demonstrating the potential and breaking
the barriers of collaboration. Not only, the participation of Cristiano Ronaldo, José Mourinho
107
or Luciano Benetton attracted attention, but also created a massive buzz, amplifying the
demonstration effect of Art on Chairs. Thirdly, Art on Chairs is also innovative in terms of its
approach. Art on Chairs lays on the integration of design and industry in a territory that, being
organized on a traditional base, has the basic conditions that allow conceiving new proposals
around design and innovation: a relevant and recognized furniture industry. Hence, the project
developed a set of actions targeted inwards in order to change mentalities of entrepreneurs,
designers and the community. The combination of multilevel actions induced the matching of
designers to companies and the development of ready-to-market projects, as well as possibilities
a road show of the unique capabilities of the Portuguese Furniture industry (because of the
technological backwardness of our industry (overcome with the support of Cohesion Policy),
some techniques have been preserved that create distinctive capacities to the Portuguese
Furniture industry), but also the engagement of the local community and of school children.
Finally, also other sectors were targeted with the involvement of Portugal Telecom in the
development of the meo chair and a design contest. Fourthly, Art on Chairs is also a charity
event. The participation of the personalities was guaranteed because of the intent of the
organization to contribute to a worthy cause. Hence, the chairs from “Duets” were auctioned
and the full proceeds were given to the UN Refugee Agency.
Thus, Art on Chairs innovative character lays on its novel approach to an old problem,
the massive demonstration effect created, the engagement of the whole community and of local
schools and its charitable dimension.
3.6 The impacts
In order to give a clearer perception of the impacts, we highlight some success cases. Using the
designs developed, 3 SMEs are already marketing the new chairs’ concepts. The company
Fenabel presented in Milan the “Polka” Chair (selling price of 300 euros). Another SME, CM
Cadeiras, will be producing and selling the chairs that won the international design contest. The
firm Ducampus signed a contract for the distribution of another winning model in Germany at
an estimated price of 600 Euros per unit.
A set of new furniture lines are being launched as a result of the in-company creative
residences supported by the project. Among these, the firms Jocilma and Margem Ideal are
creating new brands (the first one is denominated “Audiry”). Other outputs worthy of
mentioning are the following:

108
Table 13. Summary of the major impacts from the transformative actions within “Art on Chairs”.
Design awards assigned – 12
Creative residences – 9
Events – 9 exhibitions (2 international and an itinerancy schedule set in place for the forthcoming years)
SMEs actively involved in the project – 38
Increased interested of firms in participating in the upcoming editions – 75 SMEs in the first month
Number of designers involved – 77
New design products/objects – 136 (some being entering production)
Visitors of the exhibition and participants in its activities – 54,000
Students from local schools participating in guided tours and workshops – 3000
New catalogues produced
UN Refugee Agency donation: 112k Euros
Source: Authors’ elaboration based on the application for the Regiostars award.
Also relevant is the international visibility of the Portuguese furniture manufacturers.
Overcoming the poor visibility and demonstrating the excellence, the capacity to innovate and
surprise the most demanding clients were goals of Art on Chairs. For the 2014 edition, 2
additional countries have demonstrated the interest of participating and hosting Art on Chairs’
events (Brasil and China). Hence, Portuguese SMEs will have the chance to address two
important exporting markets and participate in events in São Paulo, Rio de Janeiro, Shangai and
Beijing.
The participation in Art on Chairs involved a strong commitment of the SMEs and also
an investment of time and money in the development and production of the chairs. Surprisingly,
even in the case of “Duets” it was hard to engage the SMEs to participate in this event. However,
the cooperation with international designers, the development of new catalogues and image and
the international unpaid publicity obtained by the participating firms, as well as the public
acknowledgement demonstrated the relevance of having out-of-the-box thinking and matching
products. The success of the communication boosted the impact of Art on Chairs and the
demonstration effect to an unforeseen extent.

109
If at the beginning it was hard to get on board the necessary SMEs to develop the
exhibition (event the 11 SMEs that were matched with an iconic personality), now the list of
interested companies keeps on increasing even though the next edition is to be held only in late
2014.
Most of the companies that accepted to participate in this project understood the
importance of incorporating design in its productive structure and products. They proudly
present their “new” products in international events and have developed. Some companies
created new brands in the frame of design residences, others organized design competitions in
association with universities, and others kept working with the designers, developing new
products. Some companies developed new brands following the presence of designers in the
frame of the design residences “More Design More Industry”. The integration of these designers
allowed the companies to explore opportunities that, in other context and without this program,
wouldn’t have been possible. For other companies, the ones that cooperated with the Art on
Chairs International Design Competition for instance, it was clear that they had to take the
opportunity of working closely to designers, some of them from different cultures and with
unlikely perspective, exploring new methodologies of production, new products and even other
international exporting markets. Of course the results are not homogenous: leadership, strategic
vision, size, customers, productive capacity, management capacity are factors that determine
the future of these companies and its capability of involving in the project but the outcome is
very positive. Furthermore, the demonstration effect will be relevant in the coming years,
generating relevant spillovers to other companies.
In the sub-region of Paredes, the furniture industry has a very strong presence. It would
not be excessive to say that almost every family has got someone that owns a company or works
in the furniture industry. Thus, youngsters and school are very close to this reality. That is why
it is crucial to add design and creativity to this equation. One of the strongest dimensions of Art
on Chairs is its educational program: training courses for students and teachers, multiple
workshops developed considering the widest range of students, and an exhibition composed by
more 80 different chairs inspired in classic and contemporary artists. This will allow to target
the next generation of entrepreneurs, as well as to positively exploit children’s massive
influence over families, closing the cycle and extending the long term impacts of Art on Chairs.
Finally, the creation of an innovation agenda highlighted opportunities to develop a
related variety of economic activities, not only in terms of new advanced manufacturing
systems, but also new related markets. An example is the recent linking of some furniture
110
companies to luxury shipbuilding, conceiving custom-made solutions for interior design in
yachts and cruise ships which go beyond the simple supply of furniture, implying significant
research, design and engineering.
4. Conclusions
Smart specialization in practice is still a highly complex and daunting task. As demonstrated,
practice is, in this case, way ahead of theory and so policy-makers have been dealing with the
issue of trying to implement a new paradigm without it being fully defined. Nevertheless, as a
sequence to our contributions in terms of operationalizing smart specialization, we presented a
case study on Art on Chairs. Art on chairs is an interesting example of a program to transform
a traditional industry and promote the development of a new innovation trajectory, which
foresees a complete involvement of the quadruple helix and a change in the mind-set and the
operating model of firms. The results indicate that some positive transformations are occurring
and that we may witness a re-boost in this industry competitiveness.
References
Capello. R. (2013) “Knowledge, Innovation, and Regional Performance: Toward Smart
Innovation Policies Introductory Remarks to the Special Issue, Growth and Change, 44
(2), 185-194.
Capello, R. and Kroll, Henning (2016). “From theory to practice in smart specialization
strategy: emerging limits and possible future trajectories”, European Planning Studies, 24
(8), pp. 1393-1406.
Camagni, R. and Capello, R., (2012), “Regional Innovation Patterns and the EU Regional
Policy Reform: Towards Smart Innovation Policies”, proceeds of the 52nd ERSA
Conference in Bratislava.
Churski, P., Ochojski, A., Polko, A. and Kopczewska, K. (2017). “Towards Policy – Place-
Based Policy and Smart Specialization”, Measuring Regional Specialization, 267-380.
ESPON (2012), Knowledge, Innovation, Territory (KIT), Final Report available on line
http://www.espon.eu/main/Menu_Projects/Menu_AppliedResearch/kit.html.
Foray, D. and Van Ark, B. (2007), "Smart specialisation in a truly integrated research area is
the key to attracting more R&D to Europe", European Commission Expert Group
111
"Knowledge for Growth", Policy Brief No 1, http://ec.europa.eu/invest-
inresearch/pdf/download_en/policy_brief1.pdf.
Foray D., David P. and Hall B. (2009), “Smart Specialization - the Concept”, Knowledge
Economists Policy Brief, n. 9.
Giannitsis T. (2009), “Technology and Specialization: Strategies, Options, Risks”, Knowledge
Economists Policy Brief, n. 8.
Kyriakou, D. (2009). Introduction. In Pontikakis, D., Kyriakou, D. and van Bavel, R. “The
Question of R&D specialisation. Perspectives and policy implications”, Luxembourg:
Office for Official Publications of the European Communities, 11-17.
Pavitt, K. (1984). “Sectoral patterns of technical change: Towards a taxonomy and a theory”,
Research Policy, Volume 13, Issue 6, 343-373.
Pontikakis D., Chorafakis G. and Kyriakou D. (2009), “R&D Specialization in Europe: From
Stylized Observations to Evidence-Based Policy”, in Pontikakis D., Kyriakou D. and van
Bavel R. (eds.), The Question of R&D Specialization, JRC, European Commission,
Directoral General for Research, Brussels, 71-84.

112
CHAPTER 5: PANACEA OR ILLUSION: AN EMPIRICAL ANALYSIS
TO EUROPEAN SCIENCE PARKS
Abstract
Science and technology Parks (STP) have been a key policy instrument to promote the
clustering of science and high-tech firms in a territory, being perceived as the solution to
accelerate structural change and innovation performance within a region. Hence, this
instrument, despite the variety of conceptual approaches underlying their use, gained high
popularity and was subject to significant investments across European regions and, especially,
follower regions, aiming to catch-up. This paper addresses these issues by discussing the many
interpretations of a science park and attempting to contribute to an unified definition, by
studying the role of these policy instruments within the innovation system framework and
finally by analyzing a set of 55 science parks in UK, Spain and Portugal in order to highlight
key functions commonly associated to better performing parks.
Keywords: Science and Technology Parks, Regional Innovation Systems, Follower Regions
1. Introduction
The concept of Regional Innovation System (RIS) builds upon an integrated perspective of
innovation, acknowledging the contribution of the knowledge production subsystem, the
regulatory context and of the enterprises to a region’s innovative performance. The regional
approach stresses the importance of proximity to maximize synergies and spillovers,
highlighting the need for deepening collaboration and networking to innovation. The
importance of easing technology transfer to the productive system arises as a policy priority
and for this it is crucial to create platforms that foster interactions between academic research
and the economy.

113
Science and Technology Parks (STP) emerge as infrastructures designed to co-locate
university research centres and highly innovative firms, creating an innovative milieu
(Vasquez-Urriago et al. 2014, Vasquez et al. 2016, Diez-Vial and Fernandez-Olmos, 2016,
Hobbs et al. 2017). The appealing conceptual approach along with the demonstration effects of
success cases like Silicon Valley, Cambridge or Grenoble elevated STPs to the status of
“panacea” and led a boom of STPs across Europe promoted by both universities and regional
development agencies. Hence, theses policy tools have become a key element in
operationalizing regional innovation policy (Vasquez-Urriago et al. 2016, Guadix et al. 2016).
This proliferation of STP has assumed different models with associated very different results
that have raised doubts on the actual value added of these infrastructures. Hobbs et al. (2017)
provide an extensive literature review that highlights the different angles of approach regarding
science parks but also uncovers the need to clearly understand the definition, the underlying
goals and key elements necessary for success (Guadix et al. 2016). Hence, despite this
proliferation of infrastructures, the recipe of STPs and its functions within a RIS remain unclear
in literature and also in practice, as well as how different mixes of functions affect performance
(for instance, Albahari et al. (2013), study the difference between Technology Parks and
Science Parks, trying to understand if there are also differences in performance). Furthermore,
from Hobbs et al. (2017) we can also acknowledge that the interest on these types of
infrastructures is geographically biased (Hobbs et al, 2017). A strand of literature uses the UK
and the US examples because of data availability whereas China and Spain have been the focus
for case studies. But there appears to be a second bias related to the stage of development of the
innovation system. Science parks are nowadays more appealing to emerging economies which
use these policy tools to artificially create a more favorable landscape for knowledge transfer
and innovation.
In this paper we aim to contribute to literature on three levels. A first level regards the
blurriness of definition and, specifically, the lack of depth in the literature discussing the key
elements to assure STP’s effectiveness (Guadix et al. 2016) Hence, we attempt to fine tune the
concept by proposing a functional definition that includes infrastructural and location features,
as well as the availability of advanced support services, the involvement and the amount of
resources allocated to the project. A second level of analysis focuses on the contribution of STP
to the RIS, addressing also the case of follower regions. This link is not explored in the literature
in an explicit wat, although the different analysis on the Spanish case provide an interesting
approach. Finally, on a third level we apply our functional definition to a set of 55 STP across
Portugal, Spain and the UK. Usually, empirical literature focuses on UK and Spain or on firms’
114
performance due to data availability. There are some examples targeting Spain but mostly
following a qualitative approach (Hobbs et al. 2017). Thus, a wide comparison between a
leading region and two countries which innovation systems are under consolidation provides a
clear contribution to understand how functions vary across the regional innovation systems
maturity. Thus, in this paper we construct a database and use cluster analysis to uncover patterns
that reveal features that are particularly important in follower regions and also characteristics
correlated with a better performance in terms of attractiveness for innovative firms’ location.
In line with these goals, we structured the paper as follows. In section 2 we review the
literature on STP which highlights the profusion and blurriness of concepts. In section 3 we
discuss the functions of a STP, distinguishing between the role and characteristics of STPs
within a consolidated RIS of a frontier region and a structuring RIS within a follower region.
In section 4, preceding conclusions, we use two-step cluster on a 55 STP dataset we perform
cluster analysis on 55 STP located in Portugal, Spain and the UK. We also analyze the results,
providing a brief characterization of each cluster and analyzing the different patterns across
follower and frontier regions.
2. STP: literature review
2.1 STP: a concept yet ambiguous
The first STP dates back to 1950 and was established in Stanford, United States. Cambridge
STP was the first European example to be established still in the 60s. Nevertheless, it was only
in the 80s that this concept became popular as a policy instrument designed to promote
technological transfer between universities and other research facilities and firms. Storey and
Tether (1998) accounted for 310 STPs in 15 European Union Countries. This boom aimed to
promote reindustrialization, regional development and synergies (Castells and Hall, 1994).
However, even though this policy instrument’s increasing popularity, its concept is still blurred
(Hanson et al., 2005), creating confusion with other concepts like technopole, technology park,
innovation centre or even business park (Stockport, 1989). Today, geographical distribution of
new STP favors emerging economies (Huang et al., 2012) where potential impacts and
innovation policy focus on accelerating structural change favors the promotion of STPs. Hence,
it is important to contribute to a better understanding of STP and to the discussion towards a
clearer definition.
The International Association of STPs define this concept as “an organization managed
by specialized professionals, whose main aim is to increase the wealth of its community by

115
promoting the culture of innovation … a STP stimulates and manages the flow of knowledge
and technology amongst universities, R&D institutions, companies and markets; it facilitates
the creation and growth of innovation based companies through incubation and spin-off
processes; and provides other value-added services together with high quality space and
facilities”. The UK STP Association (UKSPA provides a similar definition defining STP as “a
cluster of knowledge-based businesses … associated with a centre of technology such as a
university or research institute”. According to the UKSPA (1996), STPs’ goals include the
encouragement and promotion of New Technology Based Firms (NTBF), the creation of an
environment that may attract international R&D facilities and linking the STP to the
university’s reservoir of technology.
UNESCO’s definition states that a STP is “an economic and technological development
complex that aims to develop and foster the application of high technology to industry …
formally linked a centre of technological excellence, usually a university”. Thus, STPs would
be a platform to establish a set of links between firms and universities, thus providing access to
knowledge and fostering technology transfer.
According to UNESCO, a STP aims at promoting the cooperation of Universities and industry
in R&D activities, fostering the creation of NBTFs, stimulate technology transfer and constitute
a space of close interaction between firms and with R&D centers. Link and Scott (2006) use
the definition of the National Science Board that acknowledges STPs as a “cluster of
technology-based organizations that locate on or near a university campus in order to benefit
from the university’s knowledge base. The university not only transfers technology but aims to
develop knowledge more effective given the association with tenants…”. Stockport (1989)
highlights the infrastructural aspect of a STP, namely the close geographical proximity to
universities, the low ratio of buildings with high quality design and landscaping. In the
“software” aspect, Stockport (1989) states that a STP must provide a comprehensive range of
services to support NBTFs, as well as accommodate firms with high level of R&D and low
level of in-park manufacturing. The support to NBTFs also lays in the centre Bakouros et al.
(2002) definition which describes STPs an infrastructure in the proximity of universities, which
provides a range of administrative, logistic and technical services and most importantly, convey
a technology transfer function.
Monck et al. (1998) defined a STP as a property based infrastructure with close links to
university, designed to promote knowledge-based firms through the provision of technology
transfer and business support services to firms. The United States Association of University
STPs (AURP) also stress the property dimension, stating that a STP (in this case, university

116
owned) convey a planned land, buildings and a range of support services designed for R&D
activities by public and private organizations and high technology firms. It should have a formal
link to a university or research centre of excellence, promoting its link to industry and the
interactions between firms and the university in terms of R&D cooperation and technology
transfer.
In simpler terms, Link et al. (2003) defined STP as “an infrastructural mechanism for
transferring technologies from universities to firms”. Also focusing the infra-structural
dimension, Phan et al. (2005) define STPs as property-based organizations with an
administrative centre which goal is to promote knowledge production and interactions that
promote NBTFs. Asheim and Coenen (2005) defined STPs as planned innovative milieu
comprising firms with a high level of competences. The role of these infrastructures is to
provide proximity between academic organizations and firms and thus promoting interactions
and formal and informal links (Hanson et al., 2005).
In light of these examples, it is clear that there is no consensual definition on STPs
(Fukugawa, 2005, Hobbs et al. 2017) nor a clear perception of what is in fact the role of a STP
within a RIS and, in particular, in the setting of a follower region and especially, mixed results
lead to doubts on actual effectiveness, namely, regarding the characteristics associated to better
performance (Guadix et al. 2016).
2.2 The doubts on effectiveness
One of the main contributions of a STP is to enable a higher return on academic research
through technology commercialization and transfer and through spin-offs promotion. In a sense
this is a view founded on a linear conception of innovation (MacDonald and Deng, 2004,
Hanson et al., 2005) and leaning towards a science push policy type. However, the presence of
business R&D activities within the park can generate a crucial increase in effectiveness.
Business R&D will generate an impulse for academic research, acting for a more applied
research and for collaborative research.
As said before, co-location of academic and business research facilities could also allow
some resource gathering effect. Following this line of thought, we have witnessed a boom of
STPs during the 80s and the 90s (Bakouros et al., 2002). This boom has slowed down in western
Europe but accelerate in Eastern Europe and especially in the emerging Asian Economies as
literature demonstrates (e.g., Huang et al, 2012, Hu, 2007), appearing to be directly linked with
intense transformational processes of economic structure.
117
To some extent the proliferation of STPs without an appropriate strategy beyond the
simplistic linear perception of innovation and without guaranteeing large scale R&D resources
may explain the flop of several STPs, launching a debate on their actual effectiveness in
enhancing innovation performance and accelerating the emergence of new technology intensive
clusters has been subject to intense criticism and discussion. Massey et al. (1992) characterized
STP as high tech fantasies that actually had a small effect on promoting technology transfer,
linking universities to industry or enhancing the performance and growth of NBTFs.
Westhead’s (1997) survey on NBTFs on and off a STP concluded that there was no significant
differences in terms of R&D intensity.
More recently, Bakouros et al. (2002) in a rare analysis of STP effectiveness in a follower
country concluded that STPs in Greece presented poor results in terms of cooperation and
networking. Hanson et al. (2005) attribute these poor results to the misconception of the
innovation process presiding the STP which lead to the neglecting the support in terms of
managerial skills to University spin-offs. Hence, different studies have challenged the catalytic
role that a STP would supposedly convey on a region. As pointed out by Castells and Hall
(1994) the low performance of STPs can be attributed to the low density of firms.
Nevertheless, though we must acknowledge that there have been poor results, other
studies have confirmed that a STP can be an effective tool of regional development. Fukugawa
(2006) states that NBTFs located on a STP have a higher propensity to participate in joint
research with other institutions. Similarly, Löfsten and Lindelöf (2002) assessed positively the
performance of Swedish STPs, stating that the parks milieu had a positive impact on the growth
of sales and employment. Also Squicciarini (2008 and 2009) acknowledges a superior
performance of firms located in Finish STPs. More recently, Huang et al (2012) analyzed
innovation performance in firms located in Taiwan Science parks concluding that effects are
positive but asymmetric, favouring firms with less in-house R&D capabilities and smaller firms
in relation to bigger firms. Also Barge-Gil et al. (2011), Vasquez-Urriago et al. (2011) and
Albahari et al. (2013) have conducted comparative empirical analysis on Spanish science parks
and firms’ performance.
Overall, papers point to a positive impact of STPs but also with asymmetries among
different types of firms and territories, indicating a relatively higher impact in less developed
regions as Huang et al. (2012) also pointed out. Also Albahari et al. (2013), in their analysis of
849 firms located in 25 Spanish STPs conclude that firms located in very new or longer
established STPs show better innovative performance; (ii) the size of the STP and its
management company positively affects the innovative performance of tenants while services

118
provision has no effect on firms’ achieving better results; and (iii) firms in less technologically
developed regions benefit more from location in an STP.
Hence, the controversy is still ongoing, justified by the coexistence of successful and
unsuccessful cases. In order to precise the definition of a STP and set the foundations for a
comparative analysis that hopes to contribute to identify key success factors, we will
systematize its possible functions within the regional innovation system (RIS).
3. A STP in RIS: a functional definition
Following Saviotti (1997), an innovation system can be defined as a set of actors and
interactions that have as the main objective the generation and adoption of innovations. This
definition recognizes that innovations are not generated just by individuals, organizations and
institutions but also by complex patterns of interactions between them. So, within an innovation
system we can define their elements, the interactions, the environment and the frontier. The
concept of innovation system was born under the analysis of the National Innovation System
(Freeman, 1987 and 1995; Lundvall, 1992; Nelson and Rosenberg, 1993).
The RIS concept is more recent and in great part derived from the former concept of
National Innovation System. As referred by Cooke (2001), the idea of RIS results from some
convergence between works of regional scientists, economic geographers and national systems
of innovation analysts. RIS have its relevance based on the fact that proximity plays a major
role on networks and interactions density; this fact is in general attributed to the tacit nature of
a relevant part of knowledge. Tacit knowledge “is best shared through face-to-face interactions
between partners who already share some basic commonalities: the same language, common
“codes” of communication and shared conventions and norms…” (Asheim and Gertler, 2005,
p. 293). The regional dimension also generates a more “focused” knowledge basis, as a
cumulative result of the clustering of economic and innovation oriented activities. Asheim and
Gertler develop analogous arguments and do not hesitate to stress that “the more knowledge-
intensive the economic activity, the more geographically clustered it tends to be” (Asheim and
Gertler, 2005, p. 291). A STP, by definition, implies a co-location of firms and of firms and
other knowledge organizations.
So, if effective, STP can be at the centre of a RIS building process, playing a major role
on the provision of certain functions that an innovation system must ensure. Edquist (2005), in
his attempt to systematize functions and activities that an innovation system is expected to
ensure, considers a list of 10 functions, covering the fields of knowledge inputs provision,
119
demand side factors, provision of constituent (e.g. organizations and institutions) of SI and
support services for innovating firms. Adapting Edquist’s list, we can consider central to the
scope of functions of a STP those mentioned in following subheadings.
A) Provision of Research and Development (R&D)
Formal R&D activities are the main source of new knowledge creation. In a STP this function
relies both in University R&D and Business R&D.
A1) Knowledge creation: University R&D
The presence of University research centres in STP is an extension of academic research but,
at the same time, is potentially more applied, because co-location of University facilities and
firms generates a closer perception of firms’ technology needs. Universities have seen
recognized the potential to function as a major input for innovation and STPs have become the
policy tool to bridge science to enterprises, strengthening linkages and accelerating knowledge
transfer and diffusion as well as economic exploitation of academic research and competences
(Mowery and Sampat, 2005).
A2) Knowledge creation: Business R&D
Firms are the central organizations of the innovation system. STP stimulates R&D activities
lead by firms, through demonstration and collaborative effects and by facilitating the access to
technological inputs such as researchers and specialized equipment. In the opposite direction,
the presence of firms potentially generates a demand pull rationale for academic research.
B) Networking
Networking is what distinguishes an innovation system from a simple collection of elements.
In a broad sense, networking can include several mechanisms.
B1) Technology transfer
In absence of market failures, technology transfer would be a market transaction and it would
be inappropriate to classify it as networking. STP frequently includes organizations called
technology transfer offices (TTO). These are often seen under a linear conception of the
innovation process. TTO are meant to favour knowledge transfer from universities or other
research centers to firms. Even within this limited perspective, the co-location of academic
research facilities and firms and the existence of brokerage entities such as TTO inside the

120
campus of a STP favor technology transfer by reducing transaction costs. In the long run, TTO
and organizations of that kind contribute to the building of market for knowledge.
B2) Networking (strictus sensus)
In innovation processes, networking correspond to a process by which knowledge is transferred
through collaboration, cooperation and long term arrangements (OECD 2002, quoted by
Edquist, 2005). The relevance of networking for innovation is usually associated to the
reduction of uncertainty and to the transmission of tacit knowledge. In a STP, co-location of
firms and of firms and the university or other research facilities favours interactions such as
knowledge spillovers, informal networking such as interactive learning, formal networking
such as R&D consortia, etc.). This perception of STP as promoters of systemic industry-
university cooperation and NBTFs (Asheim and Coenen, 2005), have put this type of
infrastructure on the political agenda on regional innovation policies, contributing to explain
the proliferation of STPs across developed countries, in spite of increasing doubts regarding
their actual effectiveness and value added.
STP can also enlarge networks by clustering external initiatives. As referred by Asheim
and Coenen (2005), referring to the case of innovative activities based on analytical knowledge,
the clustering of R&D laboratories of large firms and governmental research institutes in
planned STPs normally located in close proximity to the universities can be seen as an example
of a planned innovative milieu.
C) Creating and changing organizations
As pointed out by Edquist (2005), an innovation system must contain procedures for creating
and changing organizations needed for the development of new fields of innovation, enhancing
entrepreneurship and intrapreneurship, creating new research organizations and policy
agencies.
A STP is itself an example of a complex organization devoted to the management of
innovation. At the same time, STP often induces the creation or expansion of other non-profit
organizations such as applied research centres and technology transfer offices. However, what
really distinguishes a STP from University or other public-owned facilities is its role in creating,
attracting and clustering firms.
C1) Creation of new firms
121
STP usually include incubating activities, through structured programs that include facilities,
administrative and legal support and even access to financial instruments such as seed capital.
Incubation of NTBF is favoured by this formal promotion and by demonstration and
collaborative effects. STP is usually perceived as a milieu that favours the perception of new
technological opportunities and its transformation into economic opportunities. Squiciarini’s
(2009) findings support for the existence of spillovers and for the positive role of incubators
over those firms joining SPs very young.
C2) Clustering / attraction of external initiatives
An STP functions as an attractor for consolidated foreign / external firms that seek technologic
inputs for their R&D activities. Also STP can attract external non-profit R&D activities. This
function as “attractor” can have a major impact for the consolidation of a Regional Innovation
System, especially if STP are able to cluster technology related activities.
The reasons why STP can functioning as “attractors” are probably more complex than the
simple availability of technological inputs such as scientists, engineers or specific equipment
and laboratories. One can think that STP will increase the external visibility of the region and
signal the scientific and technological potential. In successful cases, this process is typically
marked by increasing returns and becomes cumulative. According to Druille and Garnsey
(2000) both the Cambridge STP and the Grenoble infrastructure first succeeded in creating an
innovative milieu, providing incentives to entrepreneurs to stay in the region and there develop
their NBTFs. After the success of these NBTFs and of their solid scientific capabilities,
multinationals perceived the excellence of regional research centers and further established high
tech industries’ R&D corporate centers (e.g., Xerox, Oracle, Toshiba, Microsoft, AT&T), in
order to augment their knowledge base and capabilities (Druille and Garnsey, 2000).
Since the 90s, foreign direct investment flows in R&D have increased significantly and
changed their scope (e.g., Serapio and Dalton, 1999, Meyer-Krahmer and Reger, 1999,
Kuemmerle, 1999, Gerybadze and Reger, 1999 and Hedge and Hicks, 2008). Globalization of
R&D activities conducted by the world leading firms is potentially increasing the role of STP
as attractors of foreign initiatives.
In a more moderate way, even public or non-profit R&D institutions are beginning to
exploit the advantages of outward locations, following the same principle of home base
augmenting and exploiting opportunities generated by high skilled human capital reservoirs in
other countries and regions.

122
D) Provision of consultancy services
The provision of business support services within a STP fosters business sophistication,
especially for newly created firms. Business consultants that act inside an organization like a
STP will be more aware about technological dimensions and will develop capabilities oriented
to specific universes of firms such as those in their early stages.
4. The case of follower regions
The literature on STP that addresses the case of follower regions is quite scarce as results from
our literature review. This fact stands in sharp contrast with the increasing popularity of this
instrument among policy makers and the proliferation of STPs across Europe.
Follower regions are regions where the lower level of per capita GDP translates the
structural deficiencies in systemic value creation through innovation. Follower regions have
low levels of technological activities and need to increase their technological own effort. But,
at the same time, these regions have a relative bias towards public R&D, mainly due to the
weakness of business R&D and the low technological intensity of existing economic activities.
This structural situation creates in some way a paradox: follower regions need a public push in
order to increase technological levels and to break with “lock in” barriers generated by the fact
that many of the economic activities do not induce the development of technological
capabilities; but, at the same time, the risk of a low effectiveness of public efforts and academic
research is higher than in frontier regions. Hence, the implementation of STP in follower
regions will have, at this level, some additional difficulties/specificity.1
In follower regions, a STP is a part of a necessary “public push” (Huang et al, 2012,
Albaharo et al. 2013) for R&D activities in order to break the inertia of the “lock-ins”. However,
this “public push” must not follow a university-driven perspective but instead a systemic
approach that aims to catalyze and the different territorial dynamics, namely, in terms of
regional demand for technological inputs. A STP following a systemic approach will also
contribute to focus resources on a reduced number of scientific domains / economic sectors.
This need is more pressing in follower regions where resources (financial, economic and
scientific) are far more limited than in a frontier region (e.g., Madeira spends 0,3% of GDP in
R&D whereas Cambridge spend 4,25%). The scarcity of scientific resources, human capital
and other technology intensive activities leads to a lower attractiveness, which has implications
1 For a discussion on the specificities of follower regions in what concerns the implementation of a Regional
Innovation System see Almeida, Figueiredo and Silva (2008).

123
on the importance of the instrument STP being capable of effectively promoting startups in new
activities.
Follower regions have not only a challenge of fostering innovation but also have more
severe structural change needs. In frontier regions, STP can expect to attract external firms
(both national and foreign firms) and, at the same time, stimulate start-ups and spin-offs.
Follower regions have a more scarce presence of high-tech firms and entrepreneurial resources
can be concentrated in sectors that generate a low demand for technological services and for
knowledge. So, in what concerns entrepreneurial resources, follower regions have a severe
challenge: they need to ensure structural change and the emergence of new and more
technology-intensive sectors; but, at the same time, proximity demand for new activities and
other impulses to new entrepreneurship (like, for instance, intrapreneurship) are weaker than in
frontier regions. This means that new entrepreneurship, through the creation of NBTF, must be
a central target to STP in follower regions and will be crucial to the STP effectiveness.
Low managerial skills (Albaharo et al., 2013) of universities regarding technology
transfer and NBTF’s support (Bakouros et al., 2002) together with flawed and linear conception
of the innovation process (Quintas et al., 1992) may account for a lack of effectiveness in
creating NBTFs. So, STP in follower regions must be aware of the need to establish structured
programs to support NBTF, following successful international methodologies.
Secondly, follower regions structural deficiencies imply that the success of STPs in
creating NBTFs is dependent upon demand pull policies creating the technological market for
them. Proximity demand for new activities must include opportunities generated by public
demand, implying a good coordination with the public sector;2 this is also valid to frontier
regions but is even more relevant for regions where a private demand for new products and
services is weaker. Finally, the effort to aid the development of emerging sectors should lead
to a concentration of resources rather than a profusion of initiatives of a wide sectoral spectrum.
So, a well-defined focus on a knowledge basis is needed, due to the scarcity of technological
inputs.
As said in section 2.2, STP may also carry an important role in the clustering of external
initiatives which can be a major scope for RIS implementation in follower regions. Frontier
regions have built RIS in an international context in which locations of R&D activities largely
relied on endogenous initiatives. Even though multinationals global R&D investments are still
2 For instance, e-government and both the health and the educational sectors make a strong demand for ICT.
124
mostly focused on developed countries (Meyer-Krahmer and Reger, 1999), these flows are now
being extended to less developed regions (e.g. Indian ICT cluster in Bangalore - Kumar, 1996).
Follower regions, due to the lower level of income and the lower technology level, face
a problem of lack of visibility and attractiveness, even though public driven R&D and the
investment in higher education have allowed some follower regions to develop important
human capital stocks and excellence in some scientific domains. In a global context in which
often follower regions have a poor external visibility, a STP can signal the scientific potential
of a follower region, hence contributing to the increase in external visibility of a region’s
potential and also to the attraction of multinationals’ R&D and technology development centres.
The assessment on the effectiveness of STP as instruments for fostering innovation and
structural change is far from being done. Besides the fact that many STP, namely in European
countries, are of recent creation, two main set of considerations must be taken into account. The
first one has to do with the vagueness of the STP concept. The second one relies on the different
economic and social contexts in which the STP is implemented and, namely, on different
challenges that the innovation system presents in frontier or follower regions.
We have attempted to precise the concept of STP by discussing its functions and its
potential effectiveness in assuring these functions. In its minimal definition, a STP follows a
science push perspective, assuming that knowledge production access will lead to innovation
and its economic exploitation. In other words, and in line with the underlying linear conception
of innovation, a STP would be a platform where the knowledge and basic research outputs of
Universities would be tapped by firms that would undertake applied and experimental research
and ultimately, innovate (Quintas et al., 2002). But even when considering the importance of
networking, STPs are still implemented following a science push approach. Löfsten and
Lindelöf (2005) state that it is assumed that providing the STP infrastructure and the knowledge
base will be enough to enable firms to establish the necessary networks and develop. Westhead
(1997) synthesized this perspective claiming that STPs were based on the assumption that
innovation is a result of scientific research and that parks are the perfect “habitat” to catalyze
the transformation of pure research into innovation and production.
The poor results of different STPs, even though literature is focused in frontier and fast
catching-up regions, have highlighted the need to balance the science push perspective with
demand pull considerations (Watkins-Mathys and Foster, 2006). If the return on R&D,
especially, public R&D must be maximized, Watkins-Mathys and Foster (2006) state that
policy makers and STP managers need to pay more attention to entrepreneurship in the process

125
of innovation and technology transfer. So, facilities oriented for the creation of NBTF and the
ability to attract external firms must be underlined.
Many European follower regions are making strong advances in their endowments of
technological inputs but they still have a lack of real innovation systems because interactions
between higher education and academic research outputs, on one hand, and technological
activities of existing firms, on the other hand, are weak. However, STP in follower regions can
be seen as a major contribution to the consolidation of a RIS and, in doing so, as a major impulse
to structural change. In order to be successful in that perspective, STP should integrate in its
conception the functions of promoting university technological spin-offs, and attracting and
clustering external R&D initiatives (from multinationals but also from public and nonprofit
institutions). In follower regions, demand pull mechanisms are weaker since the regional
economies specialization is usually characterized by industries locked in trajectories with
limited absorptive capacity. So STP activities should include some public support in order to
create and attract new economic activities.
Furthermore, STPs may in follower regions convey a larger role in interlinking and
articulating regional infrastructures. Quintas et al. (1992) had already pointed out the flaws on
the conception of such parks not only in terms of the linear conception of innovation, but also
in terms of the closed perspective on this infrastructure. This “enclave” perspective neglected
the importance of articulating STPs with other infrastructures and firms off park and the RIS in
general.
Table 14. The functional interpretation of an STP in the context of a follower region
Functions /
Caracteristics
Contribution for the (Regional)
Innovation System
Specificities for “follower” regions
Knowledge
creation:
University
R&D
Presence of University research
centres in STP is an extension of
academic research but, at the same
time, is potentially more applied;
creation of technologic opportunities
following a technology push
rationale; closer perception of firms’
technology needs.
Follower regions must increase substantially their own
technological effort. However, there is a clear bias towards
public and academic R&D. Because of the weakness of
demand pull rationale, academic R&D is often made under
scientists’ bottom up agendas, neglecting strategic goals and
valorisation opportunities. So, STP contributes to the need of
a “push” for R&D activities but, at the same time, can
contribute to a more strategic oriented and more applied
effort for academic R&D.
Knowledge
creation:
Business R&D
STP stimulates R&D activities lead
by firms, through demonstration and
collaborative effects and by
facilitating the access to technological
inputs such as researchers and
specialized equipments.
In follower regions, firms’ access to technological inputs is
often limited by an information and assessment gap. The
STP offers information and access to scarce technological
inputs as well as an innovative milieu that stimulates firms
to develop their internal R&D capabilities.
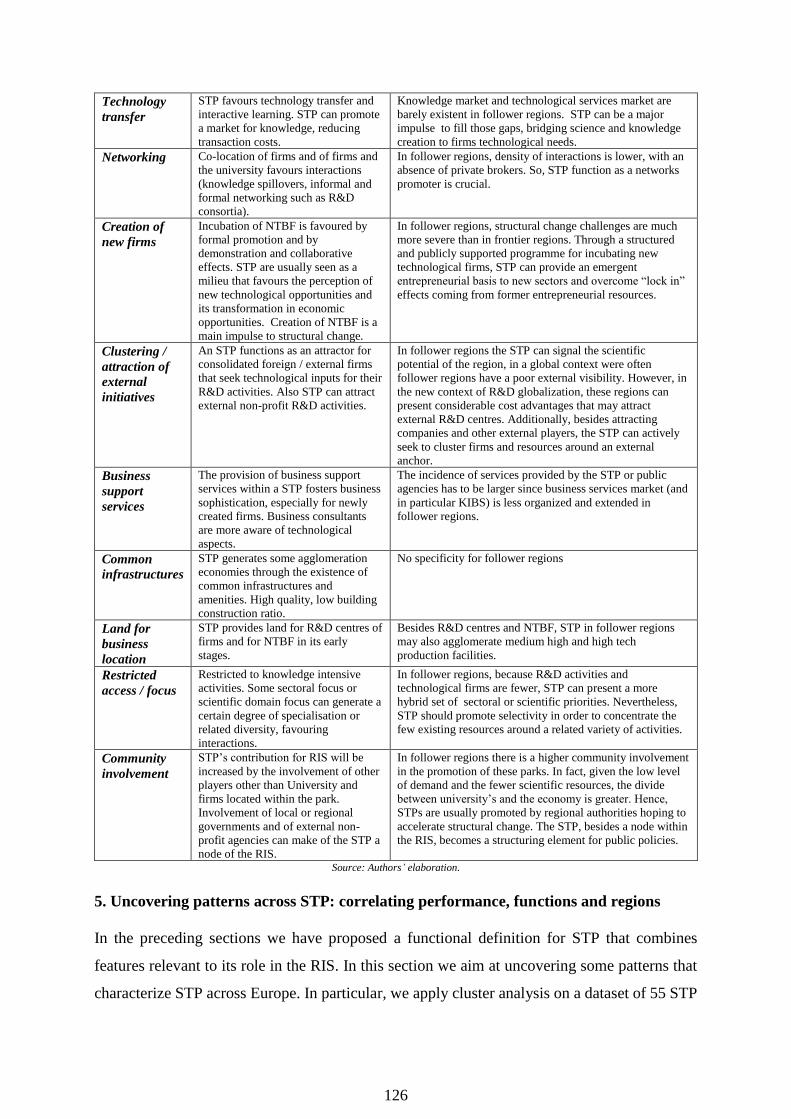
126
Technology
transfer
STP favours technology transfer and
interactive learning. STP can promote
a market for knowledge, reducing
transaction costs.
Knowledge market and technological services market are
barely existent in follower regions. STP can be a major
impulse to fill those gaps, bridging science and knowledge
creation to firms technological needs.
Networking Co-location of firms and of firms and
the university favours interactions
(knowledge spillovers, informal and
formal networking such as R&D
consortia).
In follower regions, density of interactions is lower, with an
absence of private brokers. So, STP function as a networks
promoter is crucial.
Creation of
new firms
Incubation of NTBF is favoured by
formal promotion and by
demonstration and collaborative
effects. STP are usually seen as a
milieu that favours the perception of
new technological opportunities and
its transformation in economic
opportunities. Creation of NTBF is a
main impulse to structural change.
In follower regions, structural change challenges are much
more severe than in frontier regions. Through a structured
and publicly supported programme for incubating new
technological firms, STP can provide an emergent
entrepreneurial basis to new sectors and overcome “lock in”
effects coming from former entrepreneurial resources.
Clustering /
attraction of
external
initiatives
An STP functions as an attractor for
consolidated foreign / external firms
that seek technological inputs for their
R&D activities. Also STP can attract
external non-profit R&D activities.
In follower regions the STP can signal the scientific
potential of the region, in a global context were often
follower regions have a poor external visibility. However, in
the new context of R&D globalization, these regions can
present considerable cost advantages that may attract
external R&D centres. Additionally, besides attracting
companies and other external players, the STP can actively
seek to cluster firms and resources around an external
anchor.
Business
support
services
The provision of business support
services within a STP fosters business
sophistication, especially for newly
created firms. Business consultants
are more aware of technological
aspects.
The incidence of services provided by the STP or public
agencies has to be larger since business services market (and
in particular KIBS) is less organized and extended in
follower regions.
Common
infrastructures
STP generates some agglomeration
economies through the existence of
common infrastructures and
amenities. High quality, low building
construction ratio.
No specificity for follower regions
Land for
business
location
STP provides land for R&D centres of
firms and for NTBF in its early
stages.
Besides R&D centres and NTBF, STP in follower regions
may also agglomerate medium high and high tech
production facilities.
Restricted
access / focus
Restricted to knowledge intensive
activities. Some sectoral focus or
scientific domain focus can generate a
certain degree of specialisation or
related diversity, favouring
interactions.
In follower regions, because R&D activities and
technological firms are fewer, STP can present a more
hybrid set of sectoral or scientific priorities. Nevertheless,
STP should promote selectivity in order to concentrate the
few existing resources around a related variety of activities.
Community
involvement
STP’s contribution for RIS will be
increased by the involvement of other
players other than University and
firms located within the park.
Involvement of local or regional
governments and of external non-
profit agencies can make of the STP a
node of the RIS.
In follower regions there is a higher community involvement
in the promotion of these parks. In fact, given the low level
of demand and the fewer scientific resources, the divide
between university’s and the economy is greater. Hence,
STPs are usually promoted by regional authorities hoping to
accelerate structural change. The STP, besides a node within
the RIS, becomes a structuring element for public policies.
Source: Authors’ elaboration.
5. Uncovering patterns across STP: correlating performance, functions and regions
In the preceding sections we have proposed a functional definition for STP that combines
features relevant to its role in the RIS. In this section we aim at uncovering some patterns that
characterize STP across Europe. In particular, we apply cluster analysis on a dataset of 55 STP

127
located in Portugal, Spain and the United Kingdom. Our sample was built based on the
information published by STP’s national associations regarding its affiliated (TECParques,
APTE and UKSPA). We retrieved information on a set of proxies for each of the functional
characteristics as well as locational and performance proxies that we match in the next table.
Table 15. Identifying proxies to the functions of an STP and to other location/infra-structural features
Functions / Caracteristics Variable for cluster analysis Comments
Knowledge creation:
University R&D
Number of academic R&D units located
in the park
Number of researchers not available
in many cases
Knowledge creation:
Business R&D
Presence of R&D centres of private
companies
Number of researchers and of firms
not available in many cases
Technology transfer
Co-location of TTO and/or formal
program for transferring technology
Commercialization of Universitarian
R&D
Networking Scientific/sectoral domain focus
Number of sectors with 20 or more firms
Focus on specific scientific or
sectoral domain favours interactions
Creation of new firms Existence of incubators with
technological entrepreneurship support
programs
Clustering / attraction of
external initiatives
Number of well-known FDI / Foreign
agencies
A well-established STP functions as
an attractor for other companies
wishing to tap that
knowledge/innovation reservoir.
Business support services Patent offices
Venture capital Advanced services
Land for business location Total area Area Park
Micro location Proximity to the University
Urban location
Community involvement Main promoter
Number of co-promoters
Different kind of promoters
Universities, Local governments,
Public Agencies, others
Period of operation Time period (years) since creation STP have long maturation periods for
what concerns firm’s presence
Region Type of Region
% R&D Expenditures on GDP
We consider three categories based
on the development level:
convergence, phasing out / phasing
in, competitiveness.
Country Country
Characteristic “Country” will be
relevant for clusters composition if
the National Innovation System
effect is strong.
Effectiveness Occupancy rate
Total number of firms
No standardized and widely available
measure of innovative output is
available. Nevertheless, the quality of
tenants can be inferred from their
economic activity.
Source: Authors’ elaboration.
5.1 Methodological considerations: cluster analysis
Cluster analysis, also called segmentation analysis aims to pinpoint homogeneous subgroups of
cases in a population. Cluster analysis seeks to identify a set of groups which both minimize
within-group variation and maximize between-group variation.
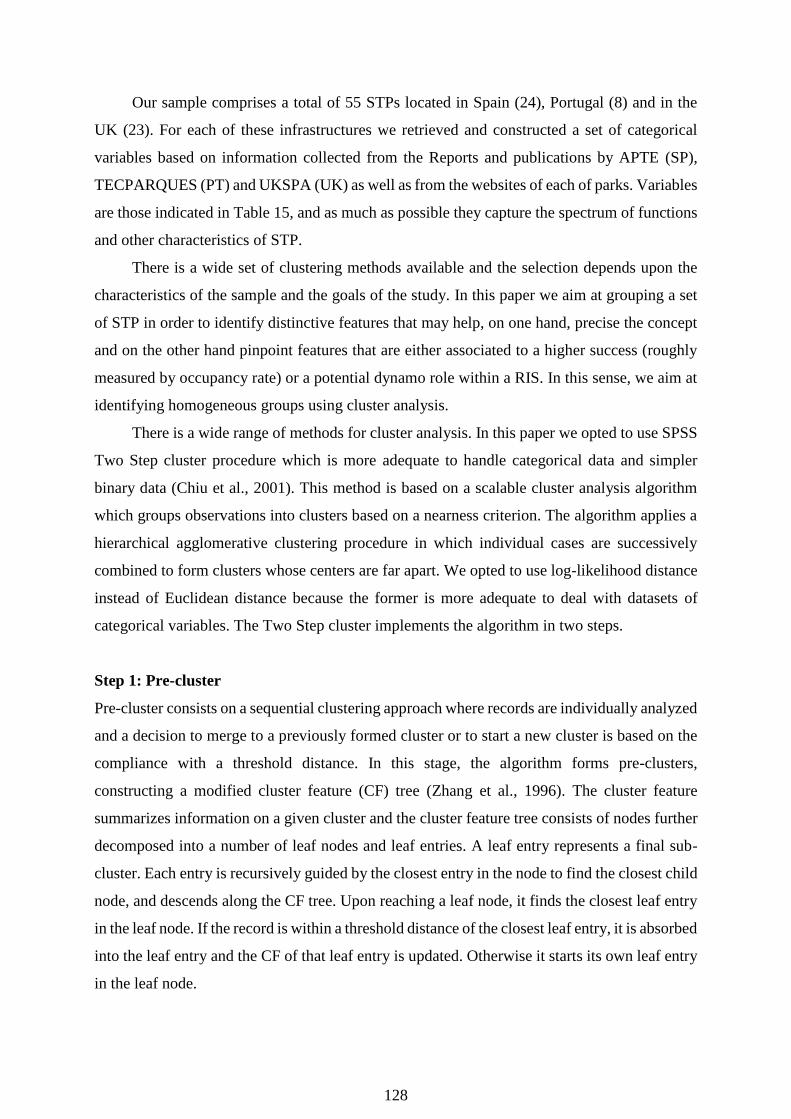
128
Our sample comprises a total of 55 STPs located in Spain (24), Portugal (8) and in the
UK (23). For each of these infrastructures we retrieved and constructed a set of categorical
variables based on information collected from the Reports and publications by APTE (SP),
TECPARQUES (PT) and UKSPA (UK) as well as from the websites of each of parks. Variables
are those indicated in Table 15, and as much as possible they capture the spectrum of functions
and other characteristics of STP.
There is a wide set of clustering methods available and the selection depends upon the
characteristics of the sample and the goals of the study. In this paper we aim at grouping a set
of STP in order to identify distinctive features that may help, on one hand, precise the concept
and on the other hand pinpoint features that are either associated to a higher success (roughly
measured by occupancy rate) or a potential dynamo role within a RIS. In this sense, we aim at
identifying homogeneous groups using cluster analysis.
There is a wide range of methods for cluster analysis. In this paper we opted to use SPSS
Two Step cluster procedure which is more adequate to handle categorical data and simpler
binary data (Chiu et al., 2001). This method is based on a scalable cluster analysis algorithm
which groups observations into clusters based on a nearness criterion. The algorithm applies a
hierarchical agglomerative clustering procedure in which individual cases are successively
combined to form clusters whose centers are far apart. We opted to use log-likelihood distance
instead of Euclidean distance because the former is more adequate to deal with datasets of
categorical variables. The Two Step cluster implements the algorithm in two steps.
Step 1: Pre-cluster
Pre-cluster consists on a sequential clustering approach where records are individually analyzed
and a decision to merge to a previously formed cluster or to start a new cluster is based on the
compliance with a threshold distance. In this stage, the algorithm forms pre-clusters,
constructing a modified cluster feature (CF) tree (Zhang et al., 1996). The cluster feature
summarizes information on a given cluster and the cluster feature tree consists of nodes further
decomposed into a number of leaf nodes and leaf entries. A leaf entry represents a final sub-
cluster. Each entry is recursively guided by the closest entry in the node to find the closest child
node, and descends along the CF tree. Upon reaching a leaf node, it finds the closest leaf entry
in the leaf node. If the record is within a threshold distance of the closest leaf entry, it is absorbed
into the leaf entry and the CF of that leaf entry is updated. Otherwise it starts its own leaf entry
in the leaf node.

129
Step 2: Cluster
In this step, the algorithm used the pre-clustering information resulting from step 1 and groups
the set of pre-clusters using an agglomerative hierarchical clustering method into a number of
clusters compatible with the information of Akaike Information Criterion (AIC).
Finally, we validated our analysis following three basic criteria:
• Cluster size: accordingly, the clusters retrieved should include enough cases to be
meaningful; otherwise it would indicate that the researcher had predefined too many
clusters. Also a cluster very large may indicate that too few clusters have been requested;
• Meaningfulness. As in factor analysis, ideally the meaning of each cluster should be readily
intuited from the constituent variables used to create the clusters.
• Criterion validity: we used cross tabulation of the cluster id numbers by other variables
known from theory or prior research to correlate with the concept which clustering is
supposed to reflect should in fact reveal the expected level of association.
And to increase certainty regarding the robustness of our results we applied Kruskall-Wallis
Chi-square test to assess the significance of the differences between the clusters retrieved (see
appendix).
4.2 Cluster membership results: descriptive analysis
The Akaike Information Criterion reaches its lowest level for a set of 6 clusters indicating this
to be the best solution in statistical terms for our cluster analysis (see annex 1). Hence, our
cluster analysis retrieves the following 6 clusters (see table 16).
Table 16. Cluster membership
Cluster 1 Cluster 2 - Aston STP (UK)
- Ciudad Politecnica de la Innovacion (ES)
- Liverpool STP (UK)
- Madan Park (PT)
- Parc Cientific Barcelona (ES)
- Parc d'innovació La Salle (ES)
- Parque Cientifico de Madrid (ES)
- TecMaia (PT)
- UPTEC (PT)
- Begbroke STP (UK)
- Cambridge STP (UK)
- Oxford STP (UK)
- Parc Cientifico Alicante (ES)
- Parque Cientifico y Tecnologico de Leganes (ES)
- Parque Tecnologico de Ciencias de la Salud de
Granada (ES)
- TagusPark (PT)
- University of Cambridge - West Cambridge Site (UK)
Cluster 3 Cluster 4 - Avepark (PT)
- Biocant (PT)
- Coventry University Technology Park (UK)
- Longhboroughs’s Science and Entreprise Park (UK)
- Parque tecnologico de Asturias (ES)
- Parque Tecnologico y Logistico de Vigo (ES)
- Southampton STP (UK)
- Tecnoalcalá (ES)
- University of Warwick STP (UK)
- Wolverhampton STP (UK)
- Cambridge Research Park (UK)
- Kent STP (UK)
- Liverpool Innovation Park (UK)
- Longbridge Technology Park (UK)
- Madeira Tecnopolo (PT)
- Parc Cientifico-tecnologico de Gijon (ES)
- Parc Tecnologic del Vallés (ES)
- Parkurbis (PT)
- Parque Balear de Innovacion e Tecnologia (ES)
- Parque Cientifico e Tecnologico Albacete (ES)

130
- York STP (UK) - Parque Tecnologico Castilla y Leon (ES)
- Parque Tecnologico Walqa (ES)
- Parque Tecnoloxico Galicia (ES)
Cluster 5 Cluster 6 - Aberdeen Science and Energy Park (UK)
- Aberdeen Science and Technology Park (UK)
- Manchester STP (UK)
- Cartuja 93 (ES)
- Chesterford Research Park Cambridge (UK)
- Colworth STP (UK)
- Cranfield Technology Park (UK)
- Edinburgh Technopole (UK)
- Parque Tecnologico de San Sebastian (ES)
- 22@barcelona (ES)
- Parque Tecnologico de Álava (ES)
- Parque Tecnologico de Andalucia (ES)
- Parque Tecnologico de Bizkaia (ES)
- Valencia Parc Tecnologic (ES)
Source: Authors’ elaboration.
Using this segmentation of our sample, we apply descriptive statistics in order to identify the
main distinctive features between clusters and derive insights. In annex we present the cross
tabulation results of our analysis, presenting here only a short summary and our analysis.
• Cluster 1:
In general, the parks assigned to this cluster comprise relatively small infrastructures (8 out of
9 cases are below a 10 ha area) and all located in proximity to the university in urban perimeter.
With the university as the main promoter in 6 out of 9 cases and as a co-promoter on the
remaining 3, these parks are a small scale operation, mostly restricted to NBTF. A stronger
focus is placed on a model that functions as an extension to the University and where the
presence of companies is overall restricted to start-up companies in incubation. 7 out of 9 of
these parks have no area for enterprise location, apart from start-up companies. The proximity
to University and the actual model underlying most of these parks provides a reasonable
deployment of University R&D units or shared access to R&D laboratories. The underlying
model of these parks focusing more on the university perspective than on technology transfer
has repercussions on the functional features provided. Technology Transfer offices are
available in less than half of these 9 parks and commercialization of R&D is absent on 7 of
them, a number identical to the absence of patent offices. Venture capital is not available on
site on any of these 9 parks which constitutes, mainly in laggard regions, an important constraint
on start-up development.
In terms of performance and also the potential impact on the RIS we observe that the fact
that these facilities are restricted to small NBTF, mostly university spin-offs limits its impact.
In most cases, occupancy rate is relatively high and the type of tenants is, in the vast majority,
operating in medium-high or high technology sectors.

131
This conception follows a University-centric perspective which puts a lower emphasis on
technology transfer and on the linkages to private companies hence diminishing the technology
pivoting role of the STP. Though the scale may be adequate across regions on different stages
with a good university, the economic valorization of scientific inputs and consequently the
actual impact of these parks within the RIS seem to be limited. These parks follow mostly a
university-driven perspective lacking the systemic approach that is of utmost importance to a
significant contribution to the consolidation of a RIS in a follower region setting. Nevertheless,
this can be a good starting point for follower regions, namely when compared to the more
extensive approach of the parks of cluster 3 since the pressure to occupy land has led, in some
cases, to a loss of focus and to a degradation of standards in follower regions where high tech
clusters of firms are inexistent.
• Cluster 2
Within our second cluster of parks we have a set of parks which constitute a reference in terms
of Science and Technology Parks (e.g. Cambridge STP, Oxford STP). In terms of
infrastructures the majority of these 8 parks are located in proximity to the University but
outside the urban perimeter, comprising an area bigger than 40 ha in 6 out of 8 cases. The
infrastructural characteristics along with the functional features make of these facilities a
distinct model in relation to the other clusters which we find to be closer to the STP concept.
With the university as main promoter (in most cases actually the only promoter), these parks
combine an area of University R&D units with a large space for companies installation capable
to accommodate both incubating companies as well as large companies R&D centers or high
tech small production units.
We observe in these parks a higher degree of specialization in terms of scientific domain
and the highest occupancy rates and the highest concentration of both University R&D
resources and private companies R&D resources. All of the 8 STPs have technology transfer
programs and offices and some have instituted patent offices. Most importantly, 6 out of 8 cases
provide direct commercialization of R&D which means that the university sells its expertise to
private companies in line with one of the characteristics of the successful models of Stanford
and MIT in the US.
Nevertheless, unlike these two examples, the overwhelming majority of parks in our
sample have no on site operating venture capital provider which severely constrains
technological entrepreneurship and start-ups growth. We also observe that these parks are
located in regions with strong R&D investment level (the NUT2 average is 2.4% of the GDP,

132
with Cambridge reaching 4.25%). These capabilities and the awareness that, for instance,
Cambridge University’s STP gathered led to the attraction of several multinationals R&D
centres that created a cumulative effect on the consolidation of the RIS. In our analysis, it is
clear that this cluster of parks is the one which has attracted more and more significant FDI.
These are also parks located in frontier regions or fast catching-up followers that have opted
for concentrating resources around a narrow set of scientific fields and in a close association
with private companies. Hence, the STP of cluster 2 gather the best examples of STP across
Europe both in functional terms but also in terms of effectiveness.
• Cluster 3
The parks grouped under cluster 3, in relation to the previous 2 clusters, constitute a group more
heterogeneous. In terms of infrastructures and facilities these parks tend to be outside the urban
perimeter and in 7 out of 11 cases also distant to the university. Again the university is one of
the main promoters but now municipalities are also a major player in supporting and creating
these places. With different sizes ranging from the less than 10 ha to above the 40 ha thresholds,
the occupancy rate is generally high (above 75%). These parks have a large accommodation
area for enterprises and an onsite incubator in more than 60% of the 11 parks. However, there
are clearly distinct features that distinguish these parks from the ones in the previous cluster.
The smaller scale of university R&D resources deployed combined with the higher
distance to university indicates a smaller flow of scientific inputs to the parks activities. This is
also associated with a smaller relative presence of private R&D units. Most of these parks have
neither explicit technology transfer program nor patent office and R&D services are available
only in a more technological rather than scientific sense (e.g. quality control instead of direct
participation of university in private R&D projects). But, in what concerns risk capital 3 of
these parks have on site providers. These characteristics are closer to a model of a technological
park with some science but which the focus is on accommodating high tech and medium high
tech companies in an excellence infrastructure rather than on promoting the articulation of
university’s resources with private companies, fostering technology transfer and stimulating a
knowledge market. The maximization of synergies among tenants has led to a higher degree of
scientific specialization of these parks.
Hence, these facilities are closer to the concept of technological park, though in some
cases aiming to evolve into a STP. The role of these parks within a RIS may be enhanced
through a closer articulation with universities and a stronger emphasis on technology transfer.
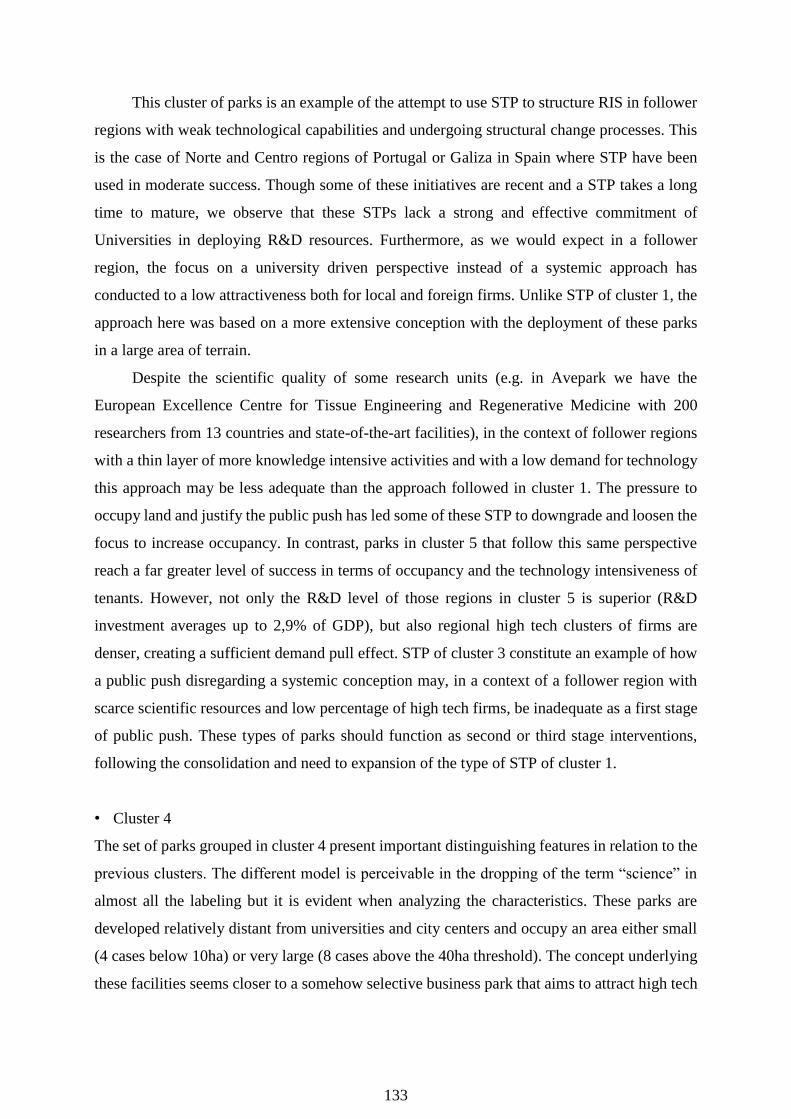
133
This cluster of parks is an example of the attempt to use STP to structure RIS in follower
regions with weak technological capabilities and undergoing structural change processes. This
is the case of Norte and Centro regions of Portugal or Galiza in Spain where STP have been
used in moderate success. Though some of these initiatives are recent and a STP takes a long
time to mature, we observe that these STPs lack a strong and effective commitment of
Universities in deploying R&D resources. Furthermore, as we would expect in a follower
region, the focus on a university driven perspective instead of a systemic approach has
conducted to a low attractiveness both for local and foreign firms. Unlike STP of cluster 1, the
approach here was based on a more extensive conception with the deployment of these parks
in a large area of terrain.
Despite the scientific quality of some research units (e.g. in Avepark we have the
European Excellence Centre for Tissue Engineering and Regenerative Medicine with 200
researchers from 13 countries and state-of-the-art facilities), in the context of follower regions
with a thin layer of more knowledge intensive activities and with a low demand for technology
this approach may be less adequate than the approach followed in cluster 1. The pressure to
occupy land and justify the public push has led some of these STP to downgrade and loosen the
focus to increase occupancy. In contrast, parks in cluster 5 that follow this same perspective
reach a far greater level of success in terms of occupancy and the technology intensiveness of
tenants. However, not only the R&D level of those regions in cluster 5 is superior (R&D
investment averages up to 2,9% of GDP), but also regional high tech clusters of firms are
denser, creating a sufficient demand pull effect. STP of cluster 3 constitute an example of how
a public push disregarding a systemic conception may, in a context of a follower region with
scarce scientific resources and low percentage of high tech firms, be inadequate as a first stage
of public push. These types of parks should function as second or third stage interventions,
following the consolidation and need to expansion of the type of STP of cluster 1.
• Cluster 4
The set of parks grouped in cluster 4 present important distinguishing features in relation to the
previous clusters. The different model is perceivable in the dropping of the term “science” in
almost all the labeling but it is evident when analyzing the characteristics. These parks are
developed relatively distant from universities and city centers and occupy an area either small
(4 cases below 10ha) or very large (8 cases above the 40ha threshold). The concept underlying
these facilities seems closer to a somehow selective business park that aims to attract high tech
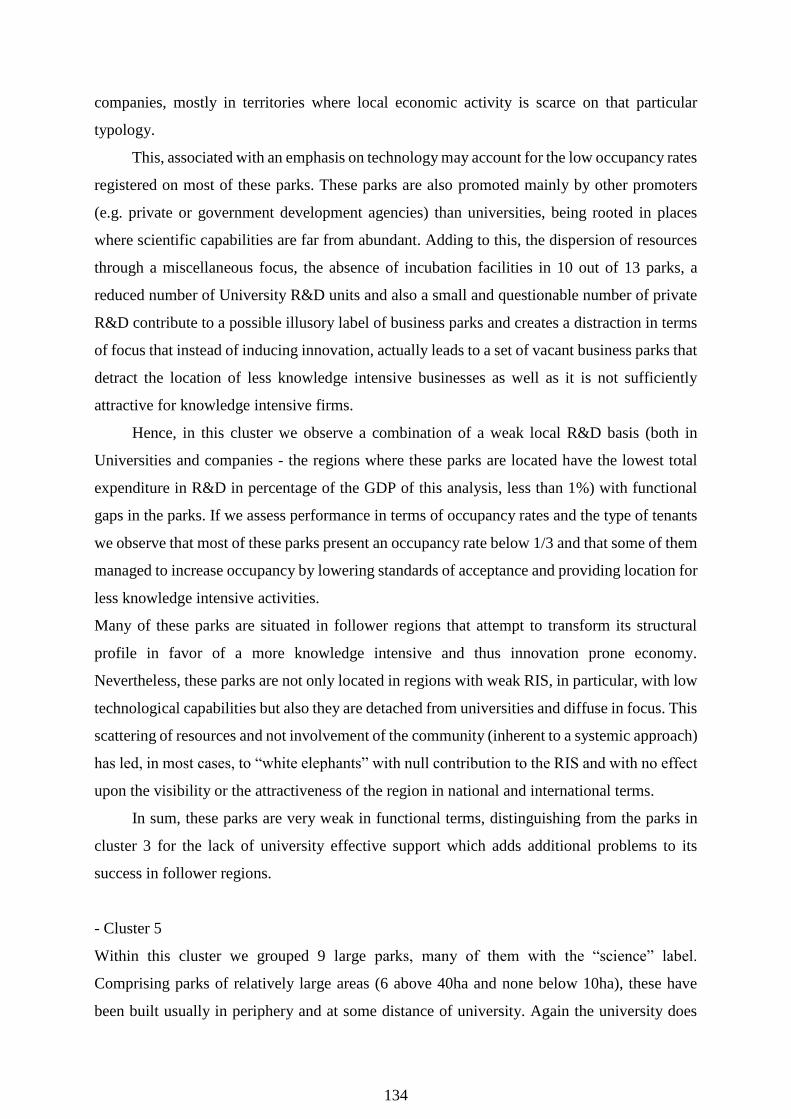
134
companies, mostly in territories where local economic activity is scarce on that particular
typology.
This, associated with an emphasis on technology may account for the low occupancy rates
registered on most of these parks. These parks are also promoted mainly by other promoters
(e.g. private or government development agencies) than universities, being rooted in places
where scientific capabilities are far from abundant. Adding to this, the dispersion of resources
through a miscellaneous focus, the absence of incubation facilities in 10 out of 13 parks, a
reduced number of University R&D units and also a small and questionable number of private
R&D contribute to a possible illusory label of business parks and creates a distraction in terms
of focus that instead of inducing innovation, actually leads to a set of vacant business parks that
detract the location of less knowledge intensive businesses as well as it is not sufficiently
attractive for knowledge intensive firms.
Hence, in this cluster we observe a combination of a weak local R&D basis (both in
Universities and companies - the regions where these parks are located have the lowest total
expenditure in R&D in percentage of the GDP of this analysis, less than 1%) with functional
gaps in the parks. If we assess performance in terms of occupancy rates and the type of tenants
we observe that most of these parks present an occupancy rate below 1/3 and that some of them
managed to increase occupancy by lowering standards of acceptance and providing location for
less knowledge intensive activities.
Many of these parks are situated in follower regions that attempt to transform its structural
profile in favor of a more knowledge intensive and thus innovation prone economy.
Nevertheless, these parks are not only located in regions with weak RIS, in particular, with low
technological capabilities but also they are detached from universities and diffuse in focus. This
scattering of resources and not involvement of the community (inherent to a systemic approach)
has led, in most cases, to “white elephants” with null contribution to the RIS and with no effect
upon the visibility or the attractiveness of the region in national and international terms.
In sum, these parks are very weak in functional terms, distinguishing from the parks in
cluster 3 for the lack of university effective support which adds additional problems to its
success in follower regions.
- Cluster 5
Within this cluster we grouped 9 large parks, many of them with the “science” label.
Comprising parks of relatively large areas (6 above 40ha and none below 10ha), these have
been built usually in periphery and at some distance of university. Again the university does
135
not appear as the main promoter but unlike in cluster 4, the university now is a co-promoter in
many of the cases. In comparison to previous clusters, these parks have been created earlier in
time, having in general no particular scientific/economic activity focus but registering a high
occupancy level. In terms of R&D capabilities on site we observe an intermediate level of
University R&D resources being deployed as well as some private R&D performed by tenant
companies.
Nevertheless, these infrastructures appear not to perform technology transfer (observed
in 8 out of the 9 parks), not stimulate the commercial linking of university’s R&D resources to
private companies (8 out of 9 have no explicit program for R&D services commercialization)
and none of the parks has a patent office or a privileged access to risk capital. Thus, despite the
upgrade in relation to the parks in cluster 4 these parks’ current model still lags behind the one
in cluster 2. In relation to cluster 3, there are some similarities in model with these parks
differing in terms of area (usually bigger), proximity to university (these parks are close to the
university) and promoter (university is not the main promoter) and also in terms of R&D
resources. Cluster 5 parks have a higher concentration level of R&D resources (also in regional
terms, the average is the second highest, 1.9%), being composed of mostly technology parks
with more knowledge intensive activities, partially also justified by the context of being inserted
in a region with an economic structural profile richer in knowledge-intensive activities. This
minimizes the weaknesses (still present) typical of a follower region RIS though the need for a
systemic approach is still very important in order to elevate the STP to a status of an actual
beacon of excellence.
• Cluster 6
If we reduce the number of cluster to 5, this cluster would be merged with cluster 5. The
members of this cluster are parks that have a higher rate of R&D transfer programs and an
intermediate level of R&D resources but have a considerably lower occupancy area and are
inserted in convergence regions. Nevertheless, the functional similarities to the previous cluster
are significant. However, the distance to university, the high importance of municipalities as
main promoter, the lower specialization level (miscellaneous approach) and the urban location
of 40% of the parks were sufficient for Akaike’s information criterion to indicate the presence
of 6 clusters.
The lower performance in terms of occupancy may be related to, on one hand, the
deployment of only an intermediate level of R&D resources and not in all parks and to the more
urban location that heightens accommodation costs to companies. The concentration of
136
resources in scientific fields has allowed to create critical mass and obtain visibility potentiated
by the use STP as an attractor to R&D FDI and as a clustering driver for knowledge intensive
activities (for instance, the Parque Tecnologico de Bizkaia has several pharmaceutical
companies onsite – e.g. BIAL).
6. Conclusions
STPs have been presented as the panacea for follower regions seeking to catch-up and
accelerate costly structural change processes. The demonstration effect from Cambridge’s
success has led many policymakers to invest in STPs. However, in territories with deficient
R&D capabilities these investments have proven highly controversial. The strong focus on
science in follower regions where the link of companies to universities is weak and where the
technological market is shallow has led to poor results. There are many potential reasons but
we focus our discussion on 3 topics.
Firstly, the concept of STP remains blurry and narrow in the sense that the focus is on the
infrastructure and not on the functions. From a systemic perception of innovation, we try to
contribute by adapting Edquist’s function of a RIS in order to devise the functions of a STP in
a RIS. We argue that a STP can be a privileged tool to structure and rationalize a RIS,
contributing to the concentration and accumulation of resources as well as function as a beacon
that, on one hand signals technological capabilities and on the other hand attract multinationals’
R&D centres.
Secondly, we address the particular case of follower regions. Follower regions face the
challenge of conducing structural change processes that break technological “lock-ins” and
build new competitive advantages around knowledge and innovation. Additionally, many
follower regions, not only endure harsh processes of structural change, as also depart from low
regional level of scientific resources and technological demand. The weak technology push and
the limited and many times diffuse scientific push translate into an unstructured and ineffective
RIS. We believe that a STP can be an effective tool within in the implementation of the
necessary public push, working as a focal point in the RIS and hence contributing to overcome
the scattering of resources. A STP can function as a structuring and rationalizing element of the
RIS, focusing resources but also signaling capabilities and hence directly contribute to
overcome the poor visibility of follower regions. This function is of utmost importance,
transforming the STP in an attractor for technology-intensive FDI, which may lever the
structural change and the construction of the RIS.
137
Finally, we used cluster analysis on a set of 55 STP in order to try to identify patterns that
could shed some light on more suitable approaches to STP in the context of follower regions.
Our results seem to indicate that in follower regions with thin or inexistent high tech clusters of
firms and limited scientific inputs, starting from a more moderate approach, in close association
with universities as the parks of cluster 1 maybe a better solution on a first stage. It is clear that
STP, I order to have a significant role in the RIS, must enlarge its density and evolve to a layout
similar to STP in clusters 3 and 5. However, as observed in STP of cluster 3, if the regional
economic profile is scarce in terms of technology intensive activities (as it happens in most
follower regions), the approach that consists on a vast area being reserved for technology firms
creates pressure to increase visible results (e.g. occupancy rate) which leads to the loss of focus
and the downgrade of tenant requirements. STP of cluster 5, located in regions with a
considerable more technology intensive profile, present good occupancy rates and a higher
proportion of medium and high technology firms, also attracting some R&D FDI. It is also
important to highlight cluster 4. The popularity of STP concept as also led to the proliferation
of functionally poor parks labeled as STPs. These parks, mostly in cluster 4, are basically
“premium or good land sites”, lacking critical mass in terms of technology inputs as well as
local demand of more technology intensive firms, failing to attract activities and presenting low
levels of effectiveness (occupancy rate and technologic profile of tenants).
Thus, in light of our results, we conclude that a STP is a valid and useful policy tool in a
public push attempt to build a RIS in follower regions. The STP may have significant impacts
in concentrating and focusing resources, hence creating critical mass and cumulative processes
of clustering that can potentiate the effects of the public science push with also a demand pull
(possibly created through the orientation of public demand for technology, for instance e-
government). It is also clear that in follower regions where the RIS is too thin, the over-
ambitious extensive conception present in STP of cluster 3 may be inadequate since it develops
a large area, creating political pressure to large scale results which has led to the loss of focus
of those STP, which will limit their role and effectiveness as a structuring element of a follower
region’s RIS.
The success and structural change impact of STP requires a systemic approach that also
creates the setting for the STP to function as an attractor of R&D FDI, exploring significant
cost-advantages and the increased tendency of R&D globalization. This may be an important
catching-up opportunity for follower regions, also interested in increasing the return on public-
led R&D but that have tended to disperse resources and to pursue dreams unmatched by internal
capabilities. Hence, STPs can be important tools in developing RIS in follower regions but a

138
lot more is needed, being crucial to increase scientific resources and networking and also define
the functional characteristics in accordance to the local context and RIS limitations.
References
Albahari, A., Barge-Gil, A., Perez-Canto, S. and Modrego-Rico, A. (2013), “The Influence of
Science and Technology Park Characteristics on Firms’ Innovation Results”, MPRA
Paper No. 48829.
Asheim, B. and Coenen, L. (2005), “Knowledge bases and regional innovation systems:
Comparing Nordic clusters”, Research Policy, 34, 1173-1190.
Albahari, A., Pérez-Canto, S., Barge-Gil, A., and Modrego, A. (2013b). Technology Parks
versus Science Parks: Does the university make the difference? MPRA paper 49227.
Barge-Gil, A. and Modrego, A. (2011): “The impact of research and technology organizations
on firm competitiveness. Measurement and determinants”. Journal of Technology
Transfer, 36 (1), 61-83.
Bakouros, Y.L., Mardas, D. C. and Varsakelis, N. C. (2002), “STP, a high tech fantasy?: an
analysis of the STPs of Greece”, Technovation, 22, 123-128.
Castells, P., Hall, P. (1994), Technopoles of the World: The Making of the 21th Century
Industrial Complexes. Routhedge, London.
Chan, K.F. and Lau, T. (2005), “Assessing technology incubator programs in the STP: the good,
the bad and the ugly”, Technovation, 25, 1215-1228.
Chiu, T., D. Fang, J. Chen, Y. Wang, and C. Jeris. (2001), “A Robust and Scalable Clustering
Algorithm for Mixed Type Attributes in Large Database Environment”, In: Proceedings
of the seventh ACM SIGKDD international conference on knowledge discovery and data
mining. San Francisco, CA: ACM.
Chou, T. L. and Lin, Y. C. (2007), “Industrial Park Development across the Taiwan Strait”,
Urban Studies, 44 (8), 1405-1425.
Chyi, Y.-L. (2008), “Cluster Development and Global Competitiveness: Prospects of the Nano
Sector in Hsinchu STP”, The Journal of Interdisciplinar Economics, 19, 101-126.
Díez-Vial, I. and Fernández-Olmos, M. J Technol Transf (2015) 40: 70.
https://doi.org/10.1007/s10961-013-9329-4
Druilhe, C. and Garnsey, E. (2000), “Emergence and growth of high-tech in Cambridge and
Grenoble”, Entrepreneurship and Regional Development, 12, 163-177.
139
Felsenstein, D., (1994), “University-related STPs-“seedbeds” or “enclaves” of innovation?”,
Technovation, 14 (2), 93-110.
Ferguson, R. and Olofsson, C (2004). “STPs and the Development of NTBFs-Location,
Survival and Growth”. Journal of Technology Transfer, 29, 5-17.
Fukugawa, N. (2006), “STPs in Japan and their value-added contributions to new technology-
based firms”, International Journal of Industrial Organization, 24, 381-400.
Gerybadze, A. and Reger, G., (1999), “Globalization of R&D: recent changes in the
management of innovation in transnational corporations”, Research Policy, 28, 251-
274.
Guadix, J., Carrillo-Castrillo, J., Onieva, L. andf Navascues, J (2016) “Success variables in
science and technology parks”, Journal of Business Research, 69 (11), 4870-4875.
Hansson,F., Husted,K. and Vestergaard, J. (2005), “Second generation STPs: from structural
holes jockeys to social capital catalysts of the knowledge society”, Technovation, 25,
1039-1049.
Harper, J. C. and Georghiou, L. (2005), “Foresight in Innovation Policy: Shared Visions for a
STP and Business–University Links in a City Region”, Technology Analysis &
Strategic Management, 17 (2), 147-160, June.
Hegde, D. and Hicks, D.(2008), “The maturation of global corporate R&D: Evidence from the
activity of U.S. foreign subsidiaries”, Research Policy, 37, 390–406.
Hobbs, K., Link, A. and Scott, J. (2017), “Science and technology parks: an annotated and
analytical literature review”, The Journal of Technology Transfer, 42 (4), 957-976.
Huang, K., Yu, C. and Seetoo, D. (2012), “Firm innovation in policy-driven parks and
spontaneous clusters: the smaller firm the better? Journal of Technology Transfer, 37,
715-731.
Koh, F. C. C., Winston T.H. Koh, W. T. H., and Tschang, F. T. (2005), “An analytical
framework for STPs and technology districts with an application to Singapore”, Journal
of Business Venturing, 20, 217-239.
Kuemmerle, Walter (1999), “Foreign direct investment in industrial research in the
pharmaceutical and electronics industries-results from a survey of multinational firms”,
Research Policy, 28, 179-193.
Kumar, N. (1996),“Intellectual property protection, market orientation and location of overseas
R&D activities by multinational enterprises”, World Development, 24, 673-688.
Lee, Wen-Hsiung and Yang,Wei-Tzen (2000), “The cradle of Taiwan high technology industry
development - Hsinchu STP (HSP)”, Technovation, 20, 55-59.
140
Link, A. N, John T. Scott, J. T. and Donald S. Siegel, D. S. (2003), “The economics of
intellectual property at universities: an overview of the special issue”, International
Journal of Industrial Organization, 21, 1217-1225.
Link, A. N. and Scott, J. T. (2006), “University research parks”, Journal of Productivity
Analysis, 25, 43-55.
Löfsten, H and Lindelöf, P. (2002), “STPs and the growth of new technology-based firms -
academic-industry links, innovation and markets”, Research Policy, 31, 859-876.
Löfsten, H and Lindelöf, P. (2003), “Determinants for an entrepreneurial milieu: STPs and
business policy in growing firms”, Technovation, 23, 51-64.
Löfsten, H and Lindelöf, P. (2005), “R&D networks and product innovation patterns - academic
and non-academic new technology-based firms on STPs”, Technovation, 25, 1025-
1037.
Macdonald, S. and Deng, Y. (2004), “STPs in China: a cautionary exploration”, International
Journal Technology, Intelligence and Planning, 1 (1), 1-14.
Massey, D., Quintas, P. and Wield, D. (1992), High-tech Fantasies. STPs in Society, Science
and Space, London: Routledge.
Maura McAdam, M. and McAdam, R. (2008), “High tech start-ups in University STP
incubators: The relationship between the start-up’s lifecycle progression and use of the
incubator’s resources”, Technovation, 28, 277-290.
Meyer-Krahmer, F. and Reger, G. (1999), “New perspectives on the innovation strategies of
multinational enterprises: lessons for technology policy in Europe”, Research Policy,
28,751-776.
Monck, C.S.P., Porter, R.B., Quintas, P., Storey, D.J., Wynarczyk, P., (1988), STPs and the
Growth of High Technology Firms, Croom Helm, London.
Motohashi, K. (2005), “University–industry collaborations in Japan: The role of new
technology-based firms in transforming the National Innovation System”, Research
Policy, 34, 583-594.
Oh, Deog-Seong (2005), “High-Technology and Regional Development Policy: An Evaluation
of Korea's Technopolis Programme”, High-Technology and Regional Development
Policy, 19, 3, 253-267.
Phillips, Su-Ann, S and Yeung, H. (2003),“A Place for R&D? The Singapore STP, Urban
Studies”, 40 ( 4), 707-732.
Phan, P. H., Siegel, D. S. and Wright, M. (2005), “STPs and incubators: observations, synthesis
and future research”, Journal of Business Venturing, 20, 165-182.

141
Quintas, P., Wield, D., and Massey, D., (1992), “Academic-industry links and innovation:
questioning the STP model”, Technovation, 12 (3), 161-175.
Serapio, Jr. and Dalton, D. H. (1999), Globalization of industrial R&D: an examination of
foreign direct investments in R&D in the United States, Research Policy, 28, 303-316.
Squicciarini, M. (2008), “STPs` Tenants versus Out-of-Parks: Who Innovates More? A
Duration Model”, Journal of Technology Transfer, 33 (1), 45-71.
Squicciarini, M. (2009): “Science parks: seedbeds of innovation? A duration analysis of firms'
patenting activity”. Small Business Economics, 32 (2), 169-190.
Shin, Dong-Ho (2001), “An alternative approach to developing STPs: a case study from Korea,
Papers Regional Science, 80, 103-11.
Siegel, D.S., Paul Westhead, P. and Wright, M. (2003), “Assessing the impact of university
STPs on research productivity: exploratory firm-level evidence from the United
Kingdom”, International Journal of Industrial Organization, 21, 1357-1369.
Stockport, G. (1989), “Defining a STP”, SWP 11/ 89, Cranfield School of Management.
Storey, D. J., Tether, B.S., (1998), “Public policy measures to support new technology based
firms in the European Union”, Research Policy, 26, 1037-1057.
UKSPA, 1996, UKSPA 96: The United Kingdom STP Association Annual Report 1996,
Birmingham: The United Kingdom STP Association
Vásquez-Urriago, A.R., Barge-Gil, A., Modrego, A. and Paraskevopoulou, E. (2011): “The
impact of science and technology parks on firms´ product innovation: empirical
evidence from Spain”. MPRA.
Vásquez-Urriago, A.R., Barge-Gil, A., Modrego, A. (2014), “The impact of science and
technology parks on firms’ product innovation: empirical evidence from Spain”, Journal
of Evolutionary Economics, 24 (4), 835-873.
Vásquez-Urriago, A.R., Barge-Gil, A., Modrego, A. (2016), “Science and Technology Parks
and cooperation for innovation: Empirical evidence from Spain”, Research Policy, Vol.
45, issue 1, pp 137-147.
Vedovello, C. (1997), “STPs and university industry interaction: geographical proximity
between the agents as a driving force”, Technovation, 17(9), 491-502.
Westhead, P. (1997), “R&D `inputs’ and `outputs’ of technology-based firms located on and
off STPs”, R&D Management, 27, 45-61.
Westhead, P. and Batstone, S. (1998), “Independent technology-based firms: the perceived
benefits of a STP location”, Urban Studies, 35(12), 2197-2219.

142
Watkins-Mathys, L. and Foster, J. M. (2006), “Entrepreneurship: the missing ingredient in
China’s STIPs?”, Entrepreneurship & Regional Development, 18, 249-274.
Zhang, T., R. Ramakrishnon, and M. Livny. (1996), “BIRCH: An efficient data clustering
method for very large databases”, In: Proceedings of the ACM SIGMOD Conference on
Management of Data. Montreal, Canada: ACM.
Zhu, D. and Tann, J. (2005), “A Regional Innovation System in a Small-sized Region: A
Clustering Model in Zhongguancun STP”, Technology Analysis & Strategic
Management, 17 (3), 375-390.
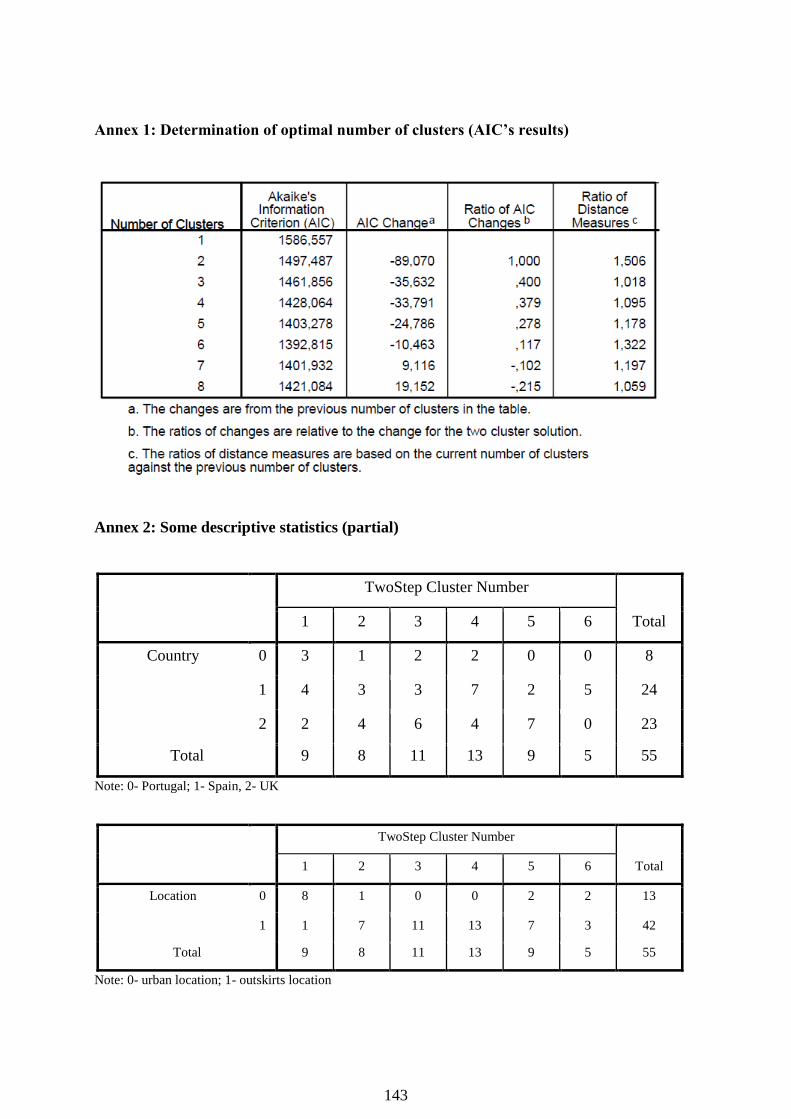
143
Annex 1: Determination of optimal number of clusters (AIC’s results)
Annex 2: Some descriptive statistics (partial)
TwoStep Cluster Number
Total 1 2 3 4 5 6
Country 0 3 1 2 2 0 0 8
1 4 3 3 7 2 5 24
2 2 4 6 4 7 0 23
Total 9 8 11 13 9 5 55
Note: 0- Portugal; 1- Spain, 2- UK
TwoStep Cluster Number
Total 1 2 3 4 5 6
Location 0 8 1 0 0 2 2 13
1 1 7 11 13 7 3 42
Total 9 8 11 13 9 5 55
Note: 0- urban location; 1- outskirts location
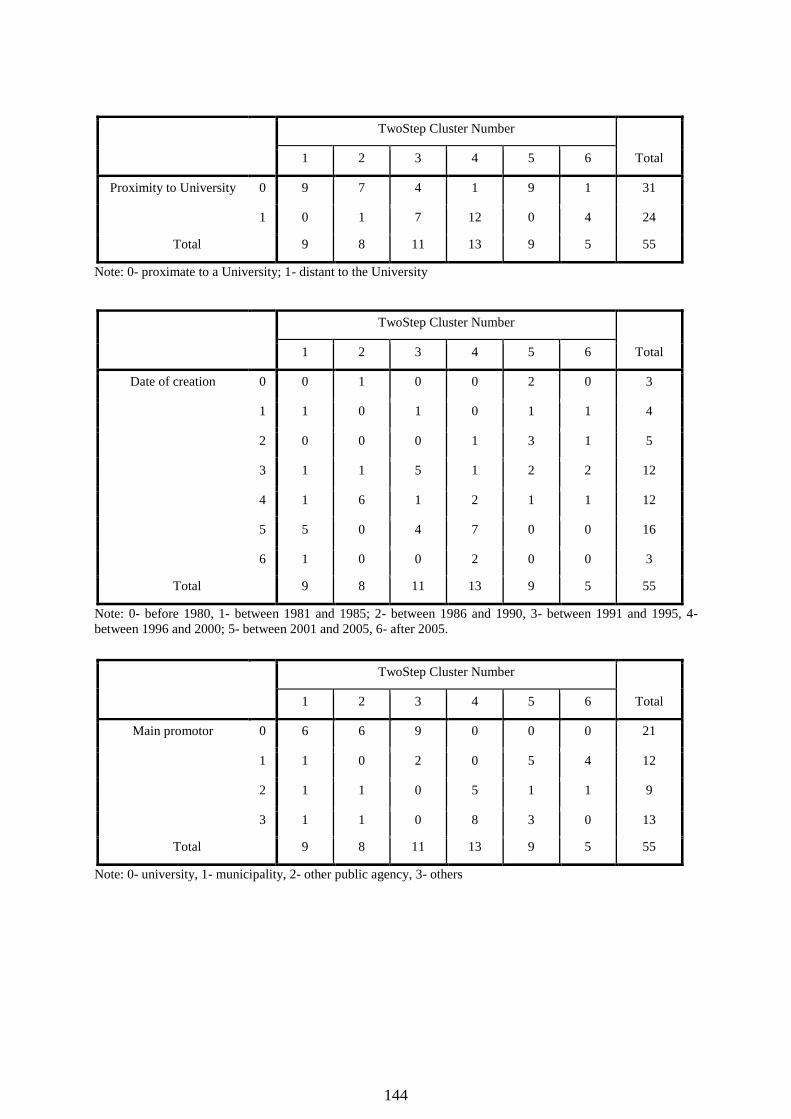
144
TwoStep Cluster Number
Total 1 2 3 4 5 6
Proximity to University 0 9 7 4 1 9 1 31
1 0 1 7 12 0 4 24
Total 9 8 11 13 9 5 55
Note: 0- proximate to a University; 1- distant to the University
TwoStep Cluster Number
Total 1 2 3 4 5 6
Date of creation 0 0 1 0 0 2 0 3
1 1 0 1 0 1 1 4
2 0 0 0 1 3 1 5
3 1 1 5 1 2 2 12
4 1 6 1 2 1 1 12
5 5 0 4 7 0 0 16
6 1 0 0 2 0 0 3
Total 9 8 11 13 9 5 55
Note: 0- before 1980, 1- between 1981 and 1985; 2- between 1986 and 1990, 3- between 1991 and 1995, 4-
between 1996 and 2000; 5- between 2001 and 2005, 6- after 2005.
TwoStep Cluster Number
Total 1 2 3 4 5 6
Main promotor 0 6 6 9 0 0 0 21
1 1 0 2 0 5 4 12
2 1 1 0 5 1 1 9
3 1 1 0 8 3 0 13
Total 9 8 11 13 9 5 55
Note: 0- university, 1- municipality, 2- other public agency, 3- others
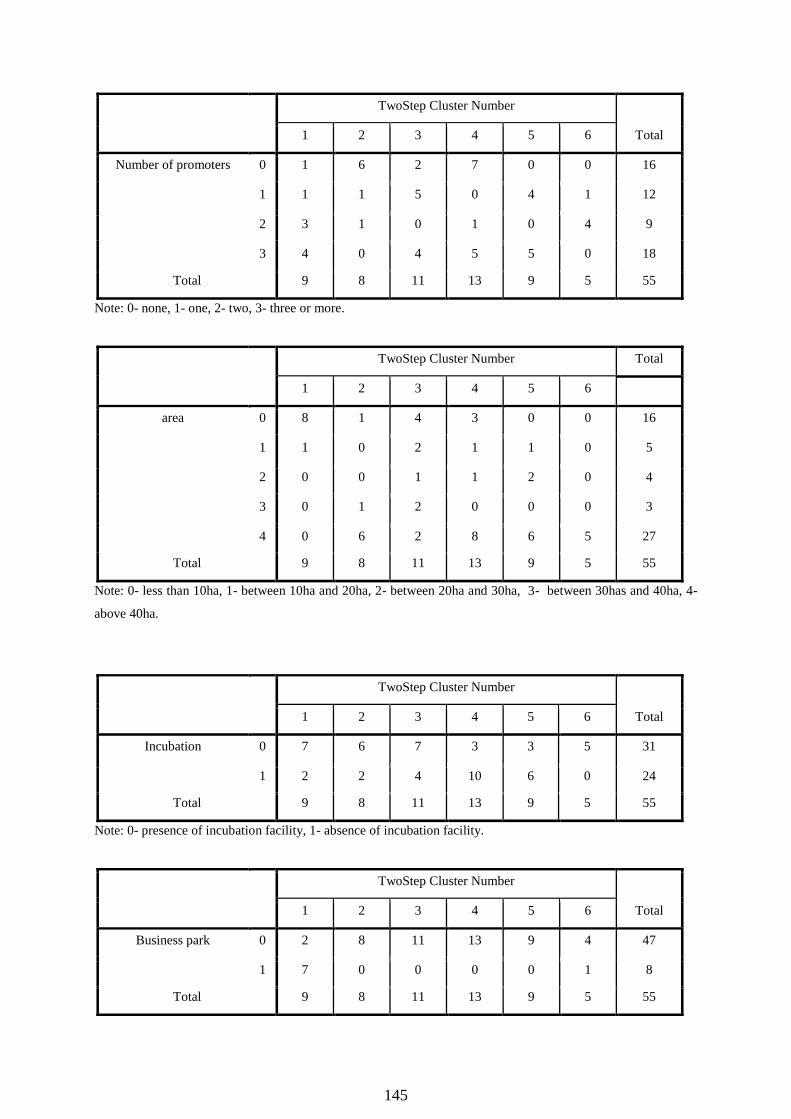
145
TwoStep Cluster Number
Total 1 2 3 4 5 6
Number of promoters 0 1 6 2 7 0 0 16
1 1 1 5 0 4 1 12
2 3 1 0 1 0 4 9
3 4 0 4 5 5 0 18
Total 9 8 11 13 9 5 55
Note: 0- none, 1- one, 2- two, 3- three or more.
TwoStep Cluster Number Total
1 2 3 4 5 6
area 0 8 1 4 3 0 0 16
1 1 0 2 1 1 0 5
2 0 0 1 1 2 0 4
3 0 1 2 0 0 0 3
4 0 6 2 8 6 5 27
Total 9 8 11 13 9 5 55
Note: 0- less than 10ha, 1- between 10ha and 20ha, 2- between 20ha and 30ha, 3- between 30has and 40ha, 4-
above 40ha.
TwoStep Cluster Number
Total 1 2 3 4 5 6
Incubation 0 7 6 7 3 3 5 31
1 2 2 4 10 6 0 24
Total 9 8 11 13 9 5 55
Note: 0- presence of incubation facility, 1- absence of incubation facility.
TwoStep Cluster Number
Total 1 2 3 4 5 6
Business park 0 2 8 11 13 9 4 47
1 7 0 0 0 0 1 8
Total 9 8 11 13 9 5 55
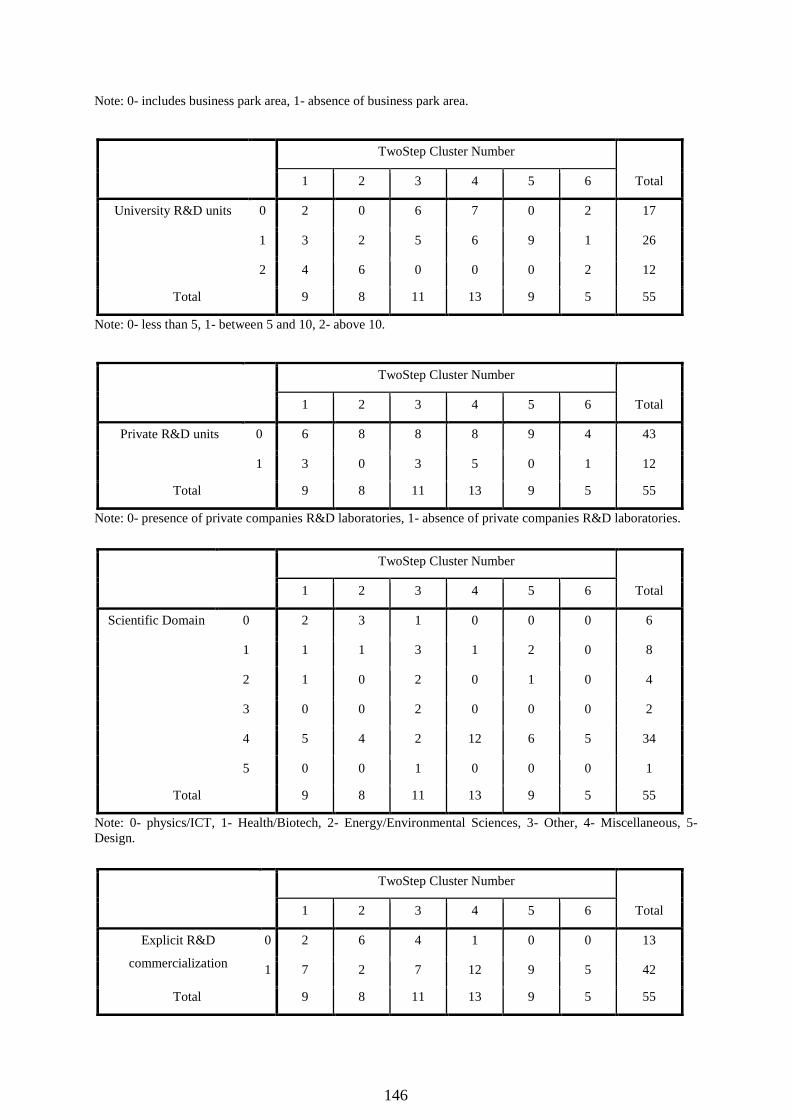
146
Note: 0- includes business park area, 1- absence of business park area.
TwoStep Cluster Number
Total 1 2 3 4 5 6
University R&D units 0 2 0 6 7 0 2 17
1 3 2 5 6 9 1 26
2 4 6 0 0 0 2 12
Total 9 8 11 13 9 5 55
Note: 0- less than 5, 1- between 5 and 10, 2- above 10.
TwoStep Cluster Number
Total 1 2 3 4 5 6
Private R&D units 0 6 8 8 8 9 4 43
1 3 0 3 5 0 1 12
Total 9 8 11 13 9 5 55
Note: 0- presence of private companies R&D laboratories, 1- absence of private companies R&D laboratories.
TwoStep Cluster Number
Total 1 2 3 4 5 6
Scientific Domain 0 2 3 1 0 0 0 6
1 1 1 3 1 2 0 8
2 1 0 2 0 1 0 4
3 0 0 2 0 0 0 2
4 5 4 2 12 6 5 34
5 0 0 1 0 0 0 1
Total 9 8 11 13 9 5 55
Note: 0- physics/ICT, 1- Health/Biotech, 2- Energy/Environmental Sciences, 3- Other, 4- Miscellaneous, 5-
Design.
TwoStep Cluster Number
Total 1 2 3 4 5 6
Explicit R&D
commercialization
0 2 6 4 1 0 0 13
1 7 2 7 12 9 5 42
Total 9 8 11 13 9 5 55

147
Note: 0- explicit sale of R&D services by the university, 1- absence of indications regarding explicit sale of R&D
services by the university.
TwoStep Cluster Number Total
1 2 3 4 5 6
TTO 0 4 8 3 1 1 2 19
1 5 0 8 12 8 3 36
Total 9 8 11 13 9 5 55
Note: 0- presence of a technology transfer office or a similar program/office, 1- absence of technology transfer
function.
TwoStep Cluster Number
Total 1 2 3 4 5 6
Pat Office 0 2 2 1 0 0 0 5
1 7 6 10 13 9 5 50
Total 9 8 11 13 9 5 55
Note: 0- presence of a patent office or a similar program/office to manage IPR, 1- absence of a patent office.
TwoStep Cluster Number
Total 1 2 3 4 5 6
Venture Capital 0 0 0 3 0 0 1 4
1 9 8 8 13 9 4 51
Total 9 8 11 13 9 5 55
Note: 0- presence of a risk capital office or a similar program/office, 1- absence of risk capital institution.

148
Annex 3: Kruskall-wallis Chi-Square Test results

149
CHAPTER 6: SUBSTITUTABILITY BETWEEN TECHNOLOGIES
AND THE SKILL PREMIUM: A SKILL-BIASED TECHNOLOGICAL
CHANGE APPROACH
Abstract
We develop an endogenous skill-biased technological change growth model with two
technologies in which a specific quality of labour, skilled and unskilled, is combined with a
specific set of quality-adjusted intermediate goods. By solving numerically, the model, we show
that changes in labour supply affect the technological-knowledge bias and thus the skill
premium, being the impact dependent on the elasticity of substitution between both types of
labour. The proposed mechanisms can accommodate facts not explained by the previous
literature.
Keywords: Elasticity of substitution; Technological-knowledge bias; Skill premium; Numerical
simulations.
1. Introduction
The rise in the relative wage of skilled workers (i.e., in the skill premium) in many developed
and developing countries during the 1980s and the 1990s seem a little puzzling. We would
expect a decline in the skill premium due to the relative increase in skilled workers. By paying
special attention to the skill-biased technological change literature, which is the dominant
explanation to accommodate these trends, we build a new framework to address some new
mechanisms.
The skill-biased technological change literature (e.g., Bound and Johnson, 1992; Katz and
Murphy, 1992; Juhn et al., 1993) attempts to work out the contradiction between the rise in both
the skill supply and the skill premium. The argument is that technological knowledge change
induces an increase in the relative demand of skilled labour that exceeds the increase in the
relative supply, thus increasing the skill premium.
Acemoglu (1998, 2002) and Acemoglu and Zilibotti (2001) further enhance this literature
by considering that technological-knowledge change responds to shifts in labour endowments.
150
When the supply of a type of labour increases (e.g., skilled labour), the market for technologies
that complement it broadens, and this creates additional incentives for R&D aimed at those
technologies. As a result, technological-knowledge change steers towards those technologies,
which, in turn, increases the demand for the complementary type of labour (skilled labour).
Hence, these recent contributions interpret the rise in the skill premium as a direct consequence
of the increase in the relative supply of skilled labour.
However, some empirical evidence seems to contradict the explanation proposed by the
skill-biased technological change literature. Indeed, despite the generic paths for wages and
skills, for developed countries we note that, for example, Acemoglu (2003a) documents a
decline in the skill premium in The Netherlands between the early 1980s and the mid-1990s, in
a scenario with relative increase of skills, and an increase in the skill premium in Canada
between the late 1980s and the late 1990s, in a scenario with stable relative supply of skills.
Some data from developing countries reveals additional problematic evidence: (i) Crino (2005)
shows that Hungary and the Czech Republic experienced an increase in the skill premium
between 1993 and 2004, while at the same time the relative employment of skilled workers
declined; (ii) Robertson (2004) detects that wage differential between the 90th and 10th wage
percentiles decreased in Mexico between 1994 and 2002, even with the relative increase of
skilled workers; (iii) Zhu and Trefler (2005) show that the same situation occurred in Bolivia,
South Korea and the Philippines.
We propose a framework that aims at accounting for the related different paths of the skill
premium. Our endogenous R&D growth model is closely related to the contributions of
Acemoglu (1998, 2002), Acemoglu and Zilibotti (2001) and Afonso (2006, 2008). However,
by considering different values for the elasticity of substitution between the two inputs in the
production of the aggregate final good (skilled and unskilled labour), which affect the direction
of technological-knowledge change and thus the relative demand of skilled labour and the skill
premium, we intend to accommodate the distinct paths of both the skill premium and the relative
supply of workers.
We observe that when the elasticity of substitution between the two inputs in the
production of the aggregate final good is stronger (higher than 1), then an increase of the skilled
labour biases the technological-knowledge such that the rise in the relative demand of skilled
labour dominates the relative supply.
The paper is organized as follows. Section 2 presents the model. Section 3 presents a
calibration exercise that shows the quantitative skill premium. Section 4 concludes.
151
2. Theoretical Model
This section describes the economic model, emphasizing the interactions among economic
agents, and the dynamic general equilibrium in which (i) households and firms are rational and
solve their problems, (ii) free-entry R&D conditions are met, and (iii) markets clear. We start
by considering the optimizing behaviour of the infinitely-lived households that inelastically
supply labour, unskilled (L) or skilled (H), maximize utility of consumption and invest in the
firm’s equity. Then, we describe the productive side, stressing the maximization problem faced
by final-good firms, intermediate-good firms and R&D firms.
The inputs of the aggregate final good (or numeraire) are two intermediate final goods, each
one supplied by a large number of competitive firms: one is produced in the unskilled sector
(L-sector) and the other is produced in the skilled sector (H-sector), and each one uses specific
labour, L or H, and a continuum of specific non-durable intermediate goods. Each intermediate-
goods sector consists of a continuum of industries, j ∈ [0,Nj(t)], j = L,H, and there is
monopolistic competition: the monopolist in industry j uses a design, sold by the R&D sector
(domestically protected by a perpetual patent), and aggregate final good to produce a non-
durable intermediate good at a price chosen to maximize profits. That is, imperfectly
competitive firms buy designs (technological knowledge) in the R&D sector to produce
intermediate goods, which can complement the inputs used by perfectly competitive final-goods
firms in either the L-sector or the H-sector. Therefore, the relative productivity of the
technological knowledge depends on the sector in which it is employed. In the R&D sector
there is free entry and each potential entrant devotes aggregate final good to produce/invent
successful horizontal designs, which are then supplied to a monopolist firm in a new
intermediate-goods industry; i.e., the R&D sector allows to increase the number of
intermediate-goods industries N(t) and thus the technological knowledge.
2.1 Technology and preferences
The economy is populated by a fixed number of infinitely-lived households who consume and
collect income from investments in financial assets (equity) and from labor. Households
inelastically supply labor to two final-goods sectors: the unskilled
(L-sector), L, and the skilled (H-sector), H. Thus, total labor supply, L + H, is exogenous
and constant. We assume consumers have perfect foresight concerning the technological-
knowledge change over time, , and choose the path of final-good aggregate
consumption [C(t)]t≥0 to maximize the discounted lifetime utility
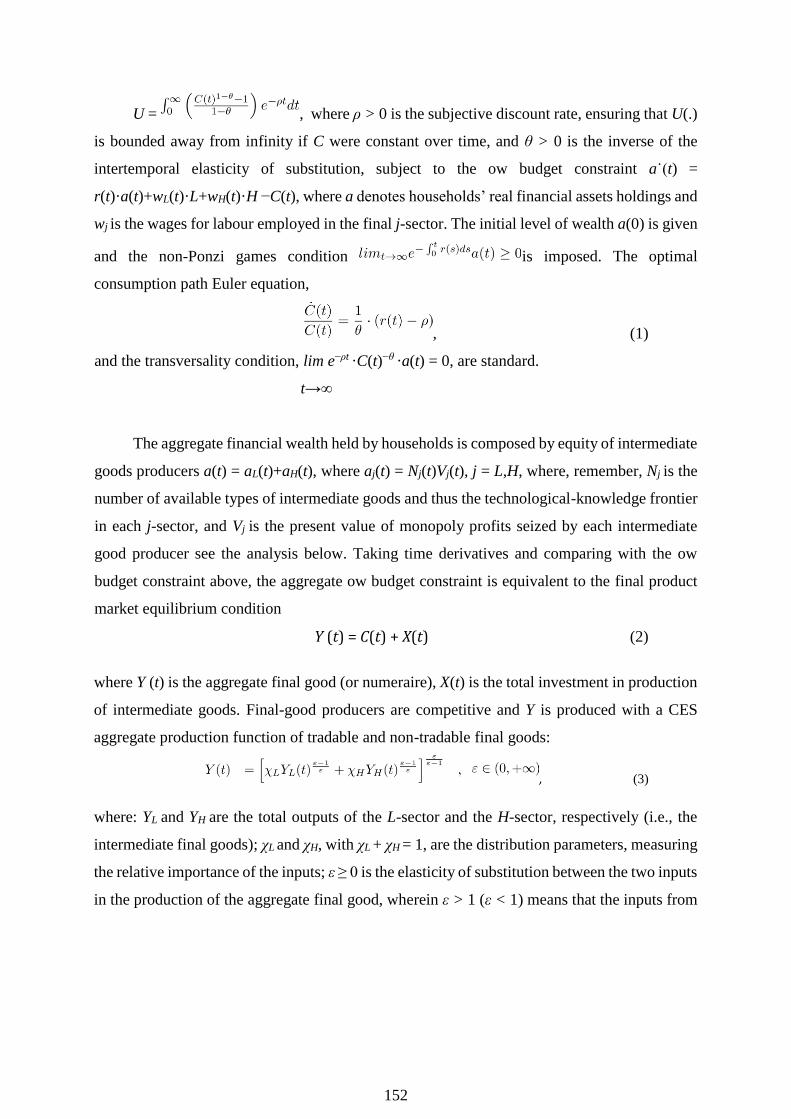
152
U = , where ρ > 0 is the subjective discount rate, ensuring that U(.)
is bounded away from infinity if C were constant over time, and θ > 0 is the inverse of the
intertemporal elasticity of substitution, subject to the ow budget constraint a˙(t) =
r(t)·a(t)+wL(t)·L+wH(t)·H −C(t), where a denotes households’ real financial assets holdings and
wj is the wages for labour employed in the final j-sector. The initial level of wealth a(0) is given
and the non-Ponzi games condition is imposed. The optimal
consumption path Euler equation,
, (1)
and the transversality condition, lim e−ρt ·C(t)−θ ·a(t) = 0, are standard.
t→∞
The aggregate financial wealth held by households is composed by equity of intermediate
goods producers a(t) = aL(t)+aH(t), where aj(t) = Nj(t)Vj(t), j = L,H, where, remember, Nj is the
number of available types of intermediate goods and thus the technological-knowledge frontier
in each j-sector, and Vj is the present value of monopoly profits seized by each intermediate
good producer see the analysis below. Taking time derivatives and comparing with the ow
budget constraint above, the aggregate ow budget constraint is equivalent to the final product
market equilibrium condition
Y (t) = C(t) + X(t) (2)
where Y (t) is the aggregate final good (or numeraire), X(t) is the total investment in production
of intermediate goods. Final-good producers are competitive and Y is produced with a CES
aggregate production function of tradable and non-tradable final goods:
, (3)
where: YL and YH are the total outputs of the L-sector and the H-sector, respectively (i.e., the
intermediate final goods); χL and χH, with χL + χH = 1, are the distribution parameters, measuring
the relative importance of the inputs; ε ≥ 0 is the elasticity of substitution between the two inputs
in the production of the aggregate final good, wherein ε > 1 (ε < 1) means that the inputs from
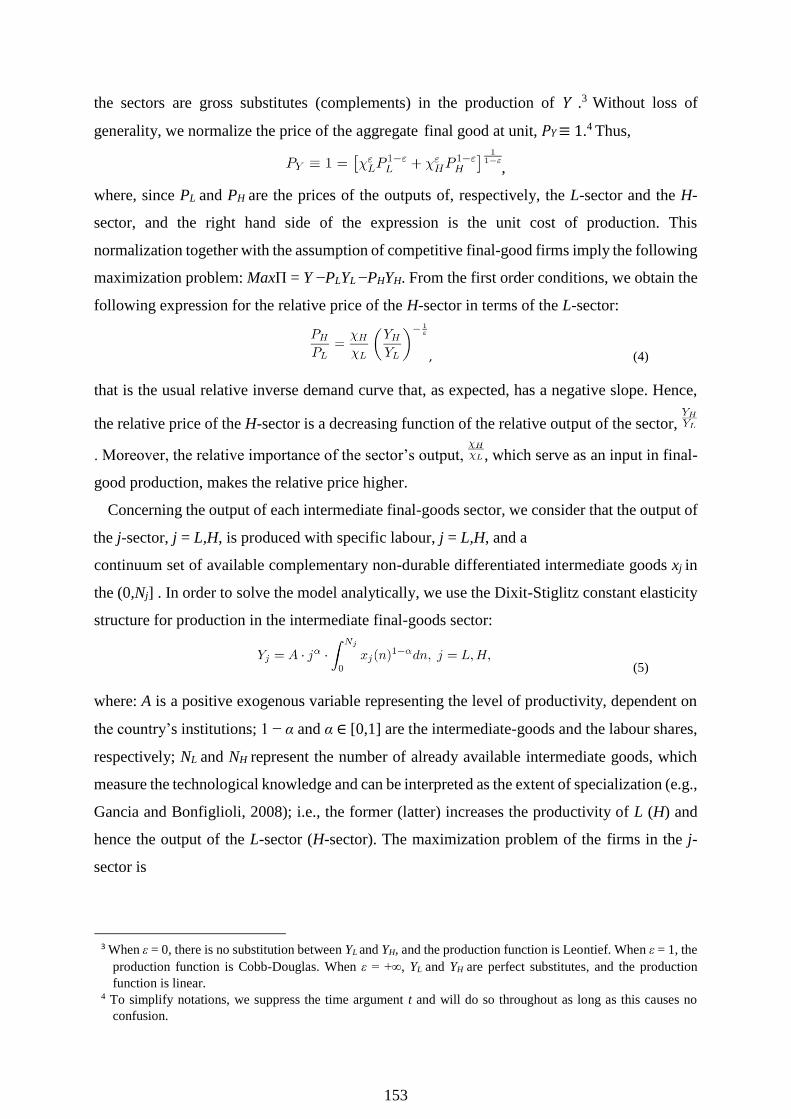
153
the sectors are gross substitutes (complements) in the production of Y .3 Without loss of
generality, we normalize the price of the aggregate final good at unit, PY ≡ 1.4 Thus,
,
where, since PL and PH are the prices of the outputs of, respectively, the L-sector and the H-
sector, and the right hand side of the expression is the unit cost of production. This
normalization together with the assumption of competitive final-good firms imply the following
maximization problem: MaxΠ = Y −PLYL −PHYH. From the first order conditions, we obtain the
following expression for the relative price of the H-sector in terms of the L-sector:
, (4)
that is the usual relative inverse demand curve that, as expected, has a negative slope. Hence,
the relative price of the H-sector is a decreasing function of the relative output of the sector,
. Moreover, the relative importance of the sector’s output, , which serve as an input in final-
good production, makes the relative price higher.
Concerning the output of each intermediate final-goods sector, we consider that the output of
the j-sector, j = L,H, is produced with specific labour, j = L,H, and a
continuum set of available complementary non-durable differentiated intermediate goods xj in
the (0,Nj] . In order to solve the model analytically, we use the Dixit-Stiglitz constant elasticity
structure for production in the intermediate final-goods sector:
(5)
where: A is a positive exogenous variable representing the level of productivity, dependent on
the country’s institutions; 1 − α and α ∈ [0,1] are the intermediate-goods and the labour shares,
respectively; NL and NH represent the number of already available intermediate goods, which
measure the technological knowledge and can be interpreted as the extent of specialization (e.g.,
Gancia and Bonfiglioli, 2008); i.e., the former (latter) increases the productivity of L (H) and
hence the output of the L-sector (H-sector). The maximization problem of the firms in the j-
sector is
3 When ε = 0, there is no substitution between YL and YH, and the production function is Leontief. When ε = 1, the
production function is Cobb-Douglas. When ε = +∞, YL and YH are perfect substitutes, and the production
function is linear. 4 To simplify notations, we suppress the time argument t and will do so throughout as long as this causes no
confusion.
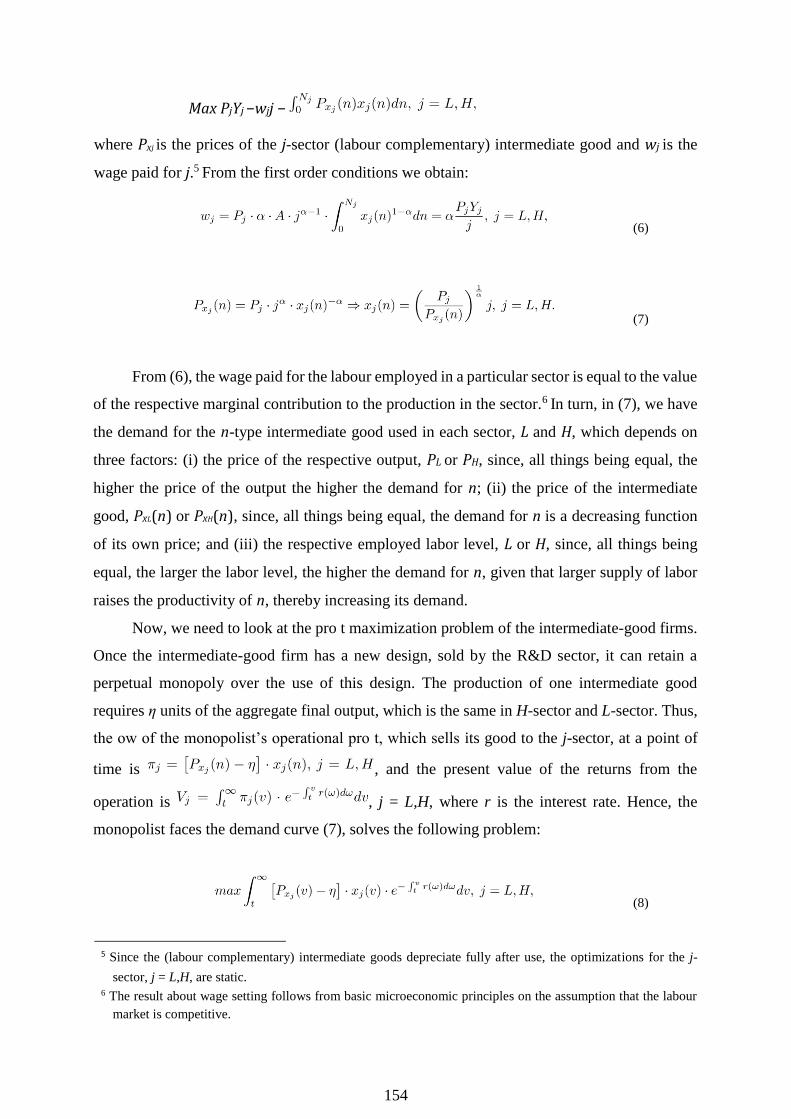
154
Max PjYj −wjj −
where Pxj is the prices of the j-sector (labour complementary) intermediate good and wj is the
wage paid for j.5 From the first order conditions we obtain:
(6)
(7)
From (6), the wage paid for the labour employed in a particular sector is equal to the value
of the respective marginal contribution to the production in the sector.6 In turn, in (7), we have
the demand for the n-type intermediate good used in each sector, L and H, which depends on
three factors: (i) the price of the respective output, PL or PH, since, all things being equal, the
higher the price of the output the higher the demand for n; (ii) the price of the intermediate
good, PxL(n) or PxH(n), since, all things being equal, the demand for n is a decreasing function
of its own price; and (iii) the respective employed labor level, L or H, since, all things being
equal, the larger the labor level, the higher the demand for n, given that larger supply of labor
raises the productivity of n, thereby increasing its demand.
Now, we need to look at the pro t maximization problem of the intermediate-good firms.
Once the intermediate-good firm has a new design, sold by the R&D sector, it can retain a
perpetual monopoly over the use of this design. The production of one intermediate good
requires η units of the aggregate final output, which is the same in H-sector and L-sector. Thus,
the ow of the monopolist’s operational pro t, which sells its good to the j-sector, at a point of
time is , and the present value of the returns from the
operation is , j = L,H, where r is the interest rate. Hence, the
monopolist faces the demand curve (7), solves the following problem:
(8)
5 Since the (labour complementary) intermediate goods depreciate fully after use, the optimizations for the j-
sector, j = L,H, are static. 6 The result about wage setting follows from basic microeconomic principles on the assumption that the labour
market is competitive.

155
and reaches:
, (9)
by considering, as Acemoglu (2002), that η = 1−α, which simplifies the notation without any
loss of generality. Hence, the pro t maximizing price of intermediate goods is equal to one unit
of the aggregate final good, implying that one unit of intermediate good employed by either
sector is exchanged one for one with the aggregate final good. Indeed, the isoelastic nature of
the demand for n implies that each monopolist sets a constant markup over the marginal cost:
1 > η since α ∈ [0,1]. Thus, regardless of the sector, each monopolist charges the same price,
produces the same amount and has the same pro t at every period, and thus the present value of
the monopoly operational profit is the same for each firm.
Before the introduction of the R&D sector to consider endogenous technological
knowledge, we analyze the productive equilibrium under constant technological knowledge.
We begin by substituting the equilibrium price of intermediate goods in (9) into the
intermediate-goods demand functions in (7), resulting:
(10)
As expected, the equilibrium intermediate-goods demand functions in (10) imply that the
demanded quantities in equilibrium do not depend on the identity of the intermediate good.
What matters is the sector’s output price and labor level in which the intermediate good is used.
Whereby substituting (10) into the ow of the monopolist’s operational pro t implies:
(11)
Bearing also in mind (10), the equation (5) can be re-written as:
(12)
which indicates that the equilibrium quantity produced in each intermediate final-goods sector
depends positively on the sector’s (i) output price, PL or PH, (ii) labor level, L or H, (iii)
technological-knowledge level, NL or NH, as well as on (iv) the exogenous productivity, A. Now,
from (12) and (4), the relative price of the H-sector can be rewritten as:
, (13)

156
where 1 + Ω, with Ω ≡ (ε − 1)α, is the elasticity of substitution between the two intermediate
final goods in the aggregate final good production; in fact, 1 + Ω > 1 only occurs when ε > 1.
From (13), the relative price of the H-sector intermediate input depends: (i) positively on the
relative importance of the H-sector intermediate input in the production of the aggregate final
good, ; (ii) negatively on the relative supply of H, HL , and on the technological-knowledge
bias between sectors, .
To reach the relative wage; i.e., the intra-country wage inequality measure, , with
constant technological knowledge, equations (12) and (13) should be substituted into (6),
obtaining then the following expression:
, (14)
and thus the intra-country wage inequality depends: (i) positively on and on if
ε > 1; (ii) negatively on and on .
By combining (11) and (13), the equilibrium expression for the relative profitability
between the two intermediate final goods is:
, (15)
and thus it depends: (i) positively on and on HL if ε > 1; (ii) negatively on and on HL if ε < 1.
2.2. General Equilibrium
Now, we analyze the dynamic general equilibrium, such that consumers and firms solve their
problems, such that the economy has an unique and stable steady state. Thus, the dynamic of
the economy can be analyze through the dynamic of consumption, Cj(t), the dynamic of
technological-knowledge, Nj(t), and the dynamic of R&D intensity on H-sector, b(t).
Denoting s as the share of skilled labour in the total population, as the share of
R&D labour in skilled labour population, , and b as the share of R&D labour of H-
sector in R&D labour population, , and assuming s and u constants and
exogenously given, we define:
L(t) = (1 − s) · L(t) (16)

157
H(t) = s · L(t) (17)
HY (t) = (1 − u) · s · L(t) (18)
HR&D(t) = u · s · L(t) (19)
HR&D,H(t) = b(t) · u · s · L(t) (20)
HR&D,L(t) = [1 − b(t)] · u · s · L(t) (21)
where L(t) is the total population that grows at a constant rate L(t)= n · L(t).
2.3 Transitional Dynamics
In the R&D sector there is free entry and each potential entrant devotes aggregate final good to
produce a successful design, which is protected by a system of patents and allows the
introduction of a new intermediate good, i.e., a new firm in a new industry n. This new variety
complements either H or L, but not both; i.e., we adopt an horizontal lab-equipment R&D
specification (e.g., Acemoglu, 2002). Assuming that R&D needs a number of skilled labour and
that requires , with 0 < φ < 1, units of skilled labour to invent a new design,5 the cost of
invention is given by:
(22)
These assumptions imply that: (i) designs are non-rival goods, existing stocks of design
spillovers, and (ii) the higher stocks of design spillovers, the lower the quantity of skilled labour
affects to invention. Substituting 6 and 10 in 22, the cost of invention can be rewritten as:
(23)

158
Differentiating both sides of the equation with respect to t yields:
(24)
with , where Nj is the growth rate of available types of intermediate goods, and
. Since it is required units of skilled labour to invent a new design,7 the number
of skilled labour affected to R&D in each sector is given by:
(25)
We assume that there is free entry into R&D and that exists a patents system for all
designs, the firms pay Zj to assure the present value of monopoly profits, Vj, i.e., Zj(t) =
Differentiating both sides of the equation with respect to t and solve in order rj(t), j = L,H yield
In equilibrium, the cost of discovering a new variety is also its price which corresponds
to the present value of monopoly profits, so:
(26)
The first differential is given by the Euler equation jointly with the expression for the rate of
return, rj(t), j = L,H. Substituting 26 into 1 yields:
(27)
Substituting 11, 23 and 24 into 27 we obtain:
7 0 < φ < 1 is the size of spillovers; i.e., the technological-knowledge frontier expands faster if scientist are more
productive or technological spillovers are higher. If φ = 1, spillovers are strong enough and developing new designs
does not become ever more difficult as the technological-knowledge frontier expands. If, φ < 1, the spillovers are
low and developing new designs becomes more and more difficult when the technological-knowledge frontier
advances.

159
Thereby, the dynamics of C(t) in the H-sector and L-sector is describe, respectively, as
follows:
(29)
(30)
The second differential shows the dynamic of Nj and its analysis is based on 25 that allows to
determinate the growth rate of Nj:
. (31)
Thus, the growth rate of gNH(t) and gNL(t) is describe, respectively, as:
The third and last differential exhibits the dynamic of b(t), the R&D intensity on H-sector,
and its analysis is based on equality of 32 and 30:
(34)
Therefore, and describe the dynamic of Cj(t), Nj(t) and b(t), the dynamic of the
economy can be analyzed by 32, 33 and 34 that can be rewritten as follows:
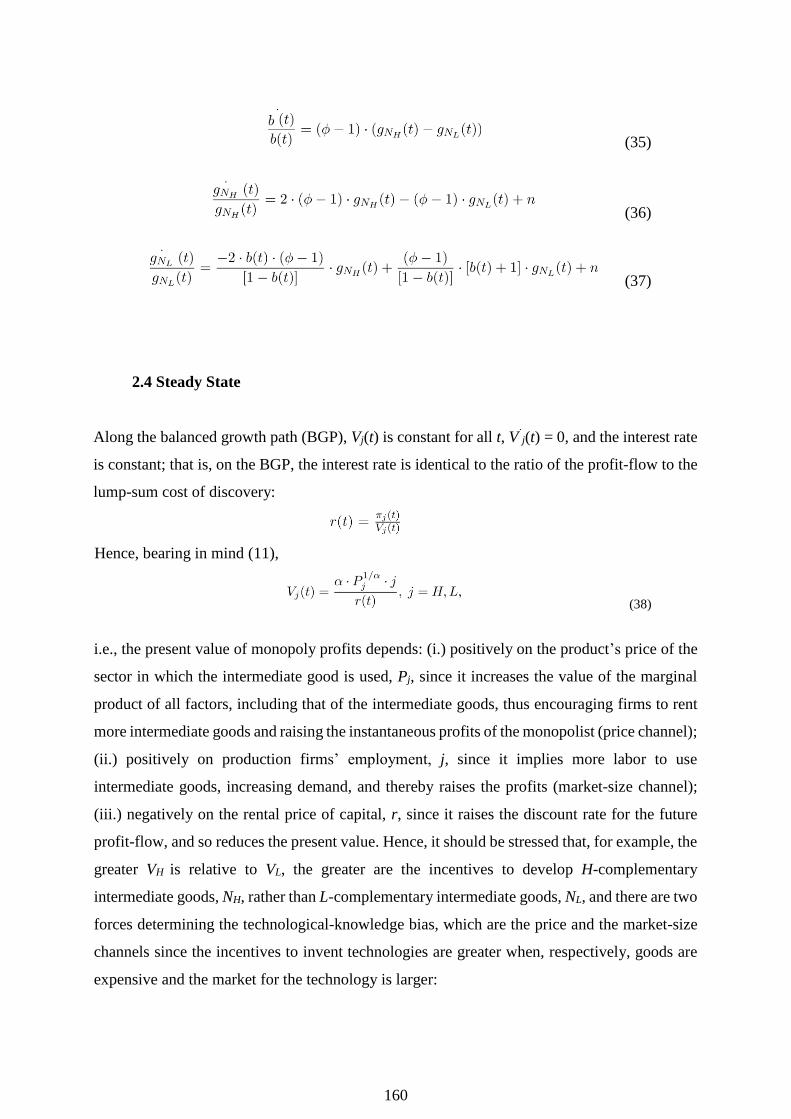
160
(35)
(36)
(37)
2.4 Steady State
Along the balanced growth path (BGP), Vj(t) is constant for all t, V˙j(t) = 0, and the interest rate
is constant; that is, on the BGP, the interest rate is identical to the ratio of the profit-flow to the
lump-sum cost of discovery:
Hence, bearing in mind (11),
(38)
i.e., the present value of monopoly profits depends: (i.) positively on the product’s price of the
sector in which the intermediate good is used, Pj, since it increases the value of the marginal
product of all factors, including that of the intermediate goods, thus encouraging firms to rent
more intermediate goods and raising the instantaneous profits of the monopolist (price channel);
(ii.) positively on production firms’ employment, j, since it implies more labor to use
intermediate goods, increasing demand, and thereby raises the profits (market-size channel);
(iii.) negatively on the rental price of capital, r, since it raises the discount rate for the future
profit-flow, and so reduces the present value. Hence, it should be stressed that, for example, the
greater VH is relative to VL, the greater are the incentives to develop H-complementary
intermediate goods, NH, rather than L-complementary intermediate goods, NL, and there are two
forces determining the technological-knowledge bias, which are the price and the market-size
channels since the incentives to invent technologies are greater when, respectively, goods are
expensive and the market for the technology is larger:
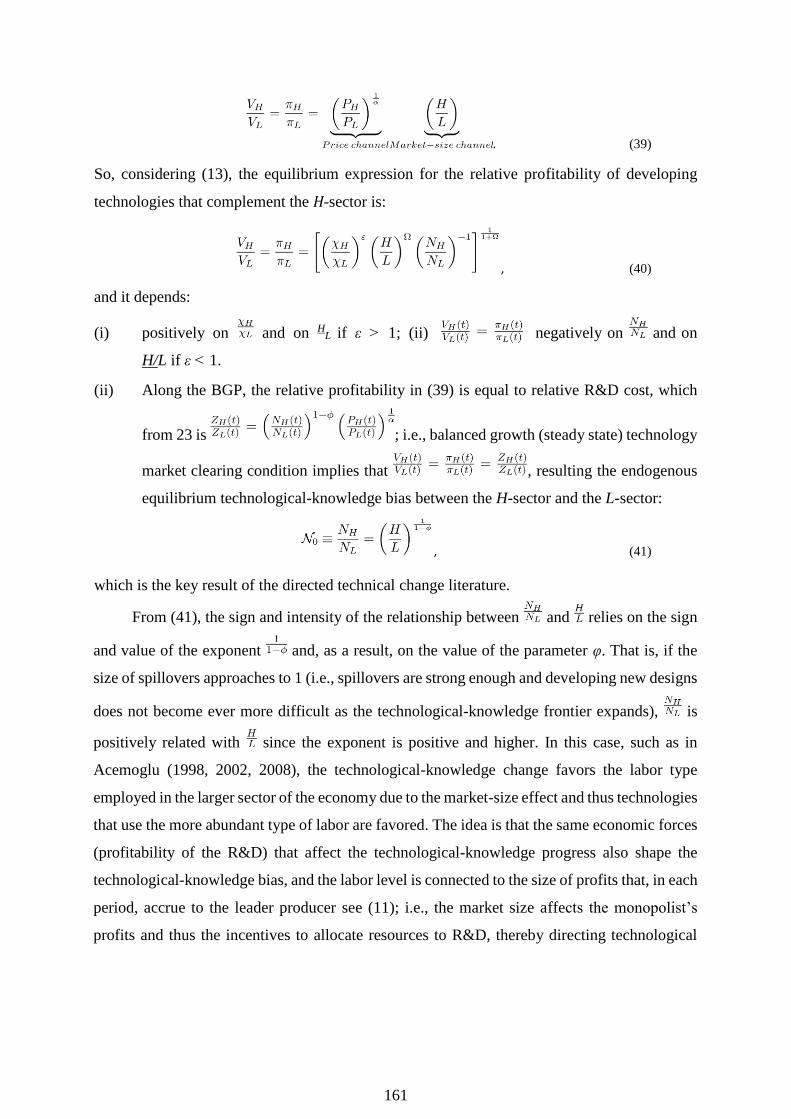
161
. (39)
So, considering (13), the equilibrium expression for the relative profitability of developing
technologies that complement the H-sector is:
, (40)
and it depends:
negatively on and on (i) positively on and on HL if ε > 1; (ii)
H/L if ε < 1.
(ii) Along the BGP, the relative profitability in (39) is equal to relative R&D cost, which
from 23 is ; i.e., balanced growth (steady state) technology
market clearing condition implies that , resulting the endogenous
equilibrium technological-knowledge bias between the H-sector and the L-sector:
, (41)
which is the key result of the directed technical change literature.
From (41), the sign and intensity of the relationship between and relies on the sign
and value of the exponent and, as a result, on the value of the parameter φ. That is, if the
size of spillovers approaches to 1 (i.e., spillovers are strong enough and developing new designs
does not become ever more difficult as the technological-knowledge frontier expands), is
positively related with since the exponent is positive and higher. In this case, such as in
Acemoglu (1998, 2002, 2008), the technological-knowledge change favors the labor type
employed in the larger sector of the economy due to the market-size effect and thus technologies
that use the more abundant type of labor are favored. The idea is that the same economic forces
(profitability of the R&D) that affect the technological-knowledge progress also shape the
technological-knowledge bias, and the labor level is connected to the size of profits that, in each
period, accrue to the leader producer see (11); i.e., the market size affects the monopolist’s
profits and thus the incentives to allocate resources to R&D, thereby directing technological
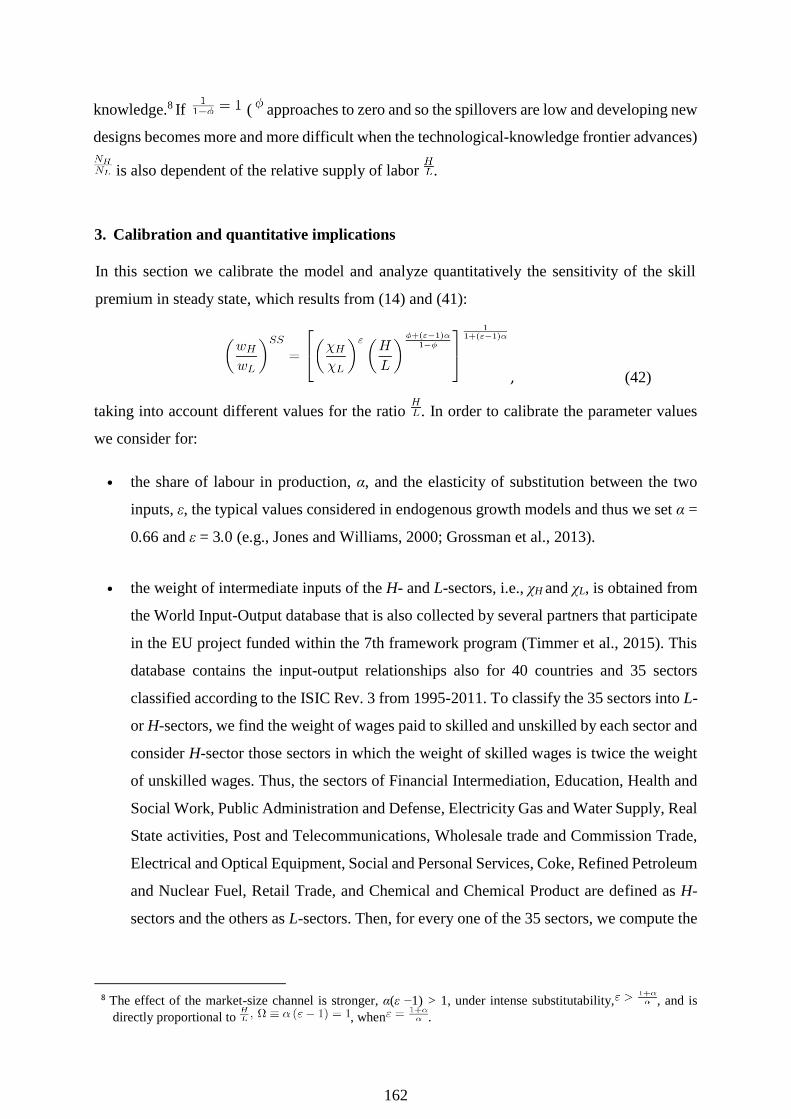
162
knowledge.8 If ( approaches to zero and so the spillovers are low and developing new
designs becomes more and more difficult when the technological-knowledge frontier advances)
is also dependent of the relative supply of labor .
3. Calibration and quantitative implications
In this section we calibrate the model and analyze quantitatively the sensitivity of the skill
premium in steady state, which results from (14) and (41):
, (42)
taking into account different values for the ratio . In order to calibrate the parameter values
we consider for:
• the share of labour in production, α, and the elasticity of substitution between the two
inputs, ε, the typical values considered in endogenous growth models and thus we set α =
0.66 and ε = 3.0 (e.g., Jones and Williams, 2000; Grossman et al., 2013).
• the weight of intermediate inputs of the H- and L-sectors, i.e., χH and χL, is obtained from
the World Input-Output database that is also collected by several partners that participate
in the EU project funded within the 7th framework program (Timmer et al., 2015). This
database contains the input-output relationships also for 40 countries and 35 sectors
classified according to the ISIC Rev. 3 from 1995-2011. To classify the 35 sectors into L-
or H-sectors, we find the weight of wages paid to skilled and unskilled by each sector and
consider H-sector those sectors in which the weight of skilled wages is twice the weight
of unskilled wages. Thus, the sectors of Financial Intermediation, Education, Health and
Social Work, Public Administration and Defense, Electricity Gas and Water Supply, Real
State activities, Post and Telecommunications, Wholesale trade and Commission Trade,
Electrical and Optical Equipment, Social and Personal Services, Coke, Refined Petroleum
and Nuclear Fuel, Retail Trade, and Chemical and Chemical Product are defined as H-
sectors and the others as L-sectors. Then, for every one of the 35 sectors, we compute the
8 The effect of the market-size channel is stronger, α(ε −1) > 1, under intense substitutability, , and is
directly proportional to , when .

163
weight of inputs bought from H- and L-sectors to find χH and χL for each sector. Finally,
we find the average value from 1995-2011, resulting:
Table 17. Steady-state skill-premium for different values of with ε = 3.0.
H L 0.7 0.8 0.9 1.0 1.1 1.2 1.3 1.4 1.5
0.3 0.4 0.5 0.6 0.8 1.0 1.2 1.4 1.7
Table 18. Steady-state skill-premium for different values of HL ε = 0.5.
H L 0.7 0.8 0.9 1.0 1.1 1.2 1.3 1.4 1.5
3.1 1.9 1.2 0.8 0.5 0.4 0.3 0.2 0.2
χH = 0.41 and χL = 0.59; i.e., .
• for the parameter φ, between 0 and 1, measures the size of spillovers, i.e., the
technological frontier expands faster if technological spillovers are higher. If φ = 1, spillovers
are strong enough and developing new designs does not become ever more difficult as the
technological frontier expands. If in contrast φ < 1, the spillovers are insufficiently low and
developing new designs becomes more and more difficult with an expanding technological
frontier. We consider φ = 0.8 in line with Afonso (2016).
Since ε = 3.0 > 1 we observe that indeed the steady-state skill-premium increases with , as is
proposed by the skill-biased technological change literature: whereas from ε = 0.5 < 1 the
steady-state skill-premium decreases with .
4. Conclusions
In this paper we have proposed an endogenous growth model where individuals decide between
consumption and savings on income allocation, where the share of R&D labour of H-sector in
R&D labour population is dynamic, and where two productive technologies of perfectly
competitive final goods are used. One combines skilled labour with a specific set of
(complementary) quality-adjusted intermediate goods and the other uses skilled labour
complemented with a continuum of high-specific quality-adjusted intermediate goods.
Intermediate goods, which are improved in the R&D sector, are produced in monopolistic
competition.

164
Our simulated results can be interpreted in comparison with the previous literature about
skill-biased technological change. In that literature, the bias that causes wage inequality is
mainly induced through the market-size channel. In our case, the path of the skill premium is
similarly influenced by the direction of technological-knowledge progress, but this direction,
however, is strongly induced by the elasticity of substitution between technologies/inputs
(skilled and unskilled).
In particular, we find that if the elasticity of substitution between the two inputs in the
production of the aggregate final good is stronger, an increase of the skilled labour biases the
technological-knowledge such that the rise in the relative demand of skilled labour dominates
the relative supply. As a result, the skill premium increases.
In this context, we leave for future research an analysis of the transition dynamics.
References
Acemoglu, D. (1998). "Why do New Technologies Complement Skills? Directed Technical
Change and Wage Inequality." Quarterly Journal of Economics 113(4), 1055-1089.
Acemoglu, D. (2002). "Directed Technical Change." Review of Economic Studies 69(4), 781-
810.
Acemoglu, D. (2003a). "Cross-country Inequality Trends." Economic Journal 113(485),
121-149.
Acemoglu, D. (2003b). "Patterns of Skill Premia." Review of Economic Studies 70(2), 199-
230.
Acemoglu, D. (2008). Introduction to modern economic growth. Princeton University Press.
Acemoglu, D. and Zilibotti, F. (2001). "Productivity Differences." Quarterly Journal of
Economics 116(2), 563-606.
Afonso, O. (2006). "Skill-Biased Technological Knowledge Without Scale Effects." Applied
Economics 38(1), 13-21.
Afonso, O. (2008). "The impact of government on wage inequality without scale effects."
Economic Modelling 25(2), 351-362.
Afonso, O. (2016). R&D intensity, economic growth and firm-size growth: theory and practice.
Applied Economics 48(32), 2973-2993.
Bound, J. and Johnson, G. (1992). "Changes in the Structure of Wages in the 1980s: An
Evaluation of Alternative Explanations.", American Economic Review 88(3), 371-392.

165
Crino, R. (2005). "Wages, skills and Integration in Poland, Hungary and Czech Republic: an
Industry-level Analysis.", Transition Studies Review 12(3), 432-459.
Gancia, G. and Bonglioli, A. (2008). North-South trade and directed technical change.
Journal of International Economics 76(2), 276-295.
Gomez, M.A., and Sequeira, T.N. (2013). Should the US increase subsidies to r&d? Lessons
from an endogenous growth theory. Oxford Economic Papers 66(1), 254-282.
Grossmann, V., Steger, T., and Trimborn, T. (2013). Dynamically optimal r&d subsidization.
Journal of Economic Dynamics and Control 37(3), 516-534.
Jones, C.I (1995a). "Time Series Tests of Endogenous Growth Models." Quarterly Journal of
Economics 110(2), 495-525.
Jones, C.I (1995b). "R&D Based Models of Economic Growth." Journal of Political Economy
103(4), 759-784.
Jones, C.I., and Williams, J.C. (2000). Too much of a good thing? The economics of
investment in R&D. Journal of Economic Growth 5(1), 65-85.
Juhn, C., Murphy, K.M. and Pierce, B. (1993). "Wage Inequality and the Rise in Returns to
Skill." Journal of Political Economy 101(3), 410-442.
Katz, L. and Murphy, K. (1992). "Changes in Relative Wages, 1963-1987: Supply and Demand
Factors." Quarterly Journal of Economics 107(1), 35-78.
Robertson, R. (2004). "Relative Prices and Wage Inequality: Evidence From Mexico." Journal
of International Economics 64, 387-409.
Timmer, M. P., E. Dietzenbacher, B. Los, R. Stehrer, and G. J. de Vries (2015). An Illustrated
User Guide to the World Input? Output Database: the Case of Global Automotive
Production. Review of International Economics 23(3), 575-605.
Zhu, S.C. and Trefler, D. (2005). "Trade and Inequality in Developing Countries: A General
Equilibrium Analysis." Journal of International Economics 65, 21-48.

166
CHAPTER 7: TECHNOLOGY BIAS AND WAGE GAP: A CROSS-
COUNTRY ANALYSIS
This paper is based on Almeida, A. And Afonso, O. (2010). “SBTC versus trade: testing skill-premium evidence across 25 OECD countries”,
Applied Economics Letters, Volume 17, 2010 - Issue 15.
Abstract
The recent widening of intra-country wage inequality in favour of high-skilled labour has been
attributed by some authors to Skill-Biased Technological Change (SBTC) and by others to
International Trade (IT) liberalization. As few empirical studies have tried to assess both
explanations across a comprehensive sample of countries, we analyze the impact of both
explanations within a unified framework and across 25 Organization for Economic Co-
operation and Development countries. Results suggest that the SBTC (IT) explanation
dominates in developed (developing) countries and when intra-country wage inequality is
measured by the wage ratio of college-to-lower (upper)-secondary graduates.
1. Introduction
The fast pace of technology introduction in businesses came with an increasing disparity in
terms of wages between skilled and less skilled workers. This premium has been discussed in
literature for the last 20 years based upon the cases of the US and more developed countries.
More recently, the effects on emerging economies such as Mexico or China have attracted a
relative higher interest (e.g. Caselli (2014), Benita (2016), Campos-Vasquez et al. (2016),
German-Soto et al. (2016)).
These studies explain the evolution of the wage gap by the biased nature of the technological
progress or the skewing effect of trade and the underlying asymmetric specialization. One such
study by Autor et al. (2008) has pointed out that the skill premium has risen in the US since the
60s. Several other authors have highlighted these trends across different OECD countries (e.g.,
Katz and Murphy, 1992; Machin, 1996; Goldin and Katz, 1999; Chay and Lee, 2000, Conte
and Vivarelli, 2007). A common consensus points to the on-going growth of the demand for
high-skilled workers, of which the Skill-Biased Technical Change (SBTC) and International
Trade (IT) are the often cited sources. Today, this is a question mostly debated in emerging
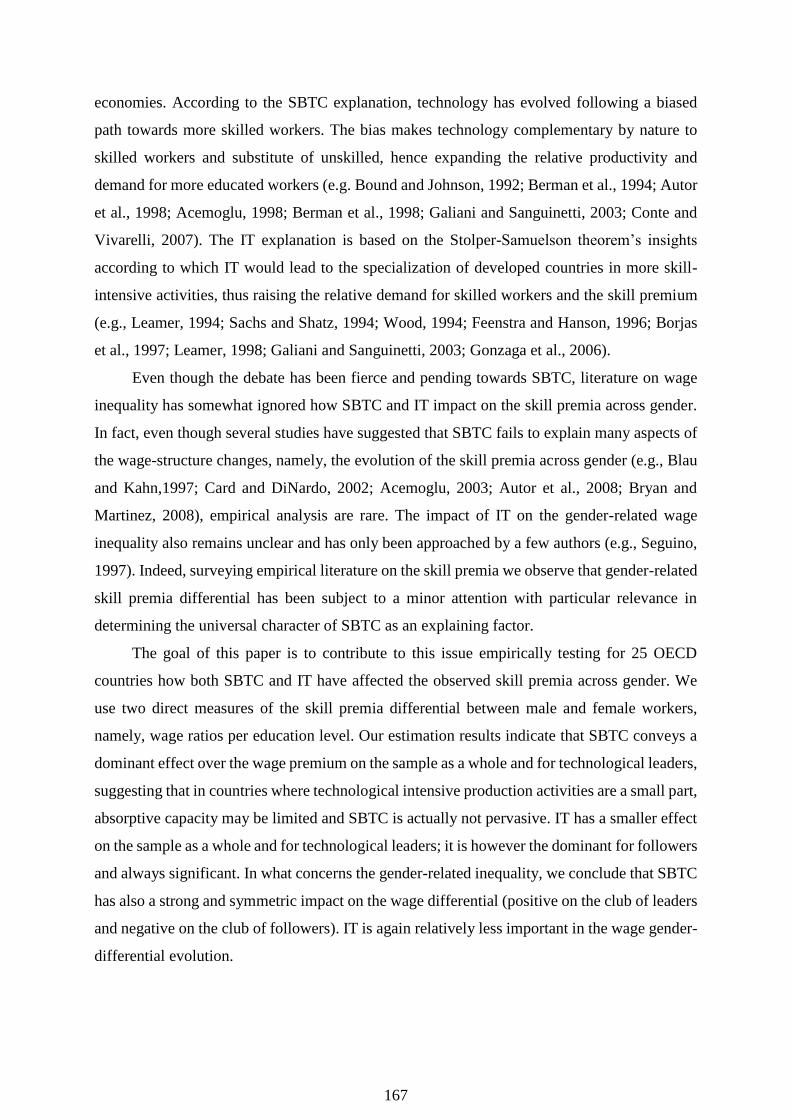
167
economies. According to the SBTC explanation, technology has evolved following a biased
path towards more skilled workers. The bias makes technology complementary by nature to
skilled workers and substitute of unskilled, hence expanding the relative productivity and
demand for more educated workers (e.g. Bound and Johnson, 1992; Berman et al., 1994; Autor
et al., 1998; Acemoglu, 1998; Berman et al., 1998; Galiani and Sanguinetti, 2003; Conte and
Vivarelli, 2007). The IT explanation is based on the Stolper-Samuelson theorem’s insights
according to which IT would lead to the specialization of developed countries in more skill-
intensive activities, thus raising the relative demand for skilled workers and the skill premium
(e.g., Leamer, 1994; Sachs and Shatz, 1994; Wood, 1994; Feenstra and Hanson, 1996; Borjas
et al., 1997; Leamer, 1998; Galiani and Sanguinetti, 2003; Gonzaga et al., 2006).
Even though the debate has been fierce and pending towards SBTC, literature on wage
inequality has somewhat ignored how SBTC and IT impact on the skill premia across gender.
In fact, even though several studies have suggested that SBTC fails to explain many aspects of
the wage-structure changes, namely, the evolution of the skill premia across gender (e.g., Blau
and Kahn,1997; Card and DiNardo, 2002; Acemoglu, 2003; Autor et al., 2008; Bryan and
Martinez, 2008), empirical analysis are rare. The impact of IT on the gender-related wage
inequality also remains unclear and has only been approached by a few authors (e.g., Seguino,
1997). Indeed, surveying empirical literature on the skill premia we observe that gender-related
skill premia differential has been subject to a minor attention with particular relevance in
determining the universal character of SBTC as an explaining factor.
The goal of this paper is to contribute to this issue empirically testing for 25 OECD
countries how both SBTC and IT have affected the observed skill premia across gender. We
use two direct measures of the skill premia differential between male and female workers,
namely, wage ratios per education level. Our estimation results indicate that SBTC conveys a
dominant effect over the wage premium on the sample as a whole and for technological leaders,
suggesting that in countries where technological intensive production activities are a small part,
absorptive capacity may be limited and SBTC is actually not pervasive. IT has a smaller effect
on the sample as a whole and for technological leaders; it is however the dominant for followers
and always significant. In what concerns the gender-related inequality, we conclude that SBTC
has also a strong and symmetric impact on the wage differential (positive on the club of leaders
and negative on the club of followers). IT is again relatively less important in the wage gender-
differential evolution.
168
We organized this paper as follows: in section 2 we conduct our literature review,
followed by the model’s specification and methodological issues in section 3. Section 4 presents
an analysis the estimated results. Section 5 concludes with some concluding remarks.
2. Wage premium: reviewing the empirical literature
In this section we provide an overview on the empirical literature on the skill premia, focusing
on empirical literature that has addressed the issue of gender inequality.
2.1 Empirical literature review on the skill premium
Empirical literature on the skill premium has usually debated which approach, SBTC or IT, was
more appropriate in explaining the widening of the wage gap between skilled and unskilled
workers. Our survey shows that few studies have considered both explanations together. Indeed,
the majority of the empirical studies look only at one side of the debate, SBTC or IT.
In line with the Stolper-Samuelson theorem predictions, Wood (1994) concludes that IT
contributes to an increase in the skill premium in the developed world and a decrease in the
developing world. In a subsequent study, Sachs and Shatz (1996) concluded in the same
direction of Wood (1994), finding a link between the increase in IT flows and the skill premium.
Using aggregate data for the US manufacturing between 1972 and 1990, Feenstra and Hanson
(1996) conclude that outsourcing, proxied by the imports of intermediate inputs contributed
significantly to the relative increase in the demand for skilled labour. Leamer’s (2001) results
on the evolution of wages of productive and non-productive workers in the 70s and the 80s in
the US indicated that IT had a significant impact in the decline in the relative demand of
unskilled labour and thus in the rise of the wage premium.
In an update study, Feenstra and Hanson (2003) estimate IT to be responsible for 15% to
24% of the wage-premium change and SBTC for 8% to 13%. Also Green et al. (2001) identified
a positive shift in the demand for skilled labour and in wage inequality in Brazil. However,
Gonzaga et al. (2006) contradict the findings of Green et al. (2001). Recently there is a vibrant
revived literature on IT and wage inequality, which reveals the increase in interest to the topic:
e.g., Amiti and Konings, 2007; Goldberg and Pavcnik, 2007; Amity and Davis, 2008; Broda
and Romalis, 2008; Helpman et al., 2008; Krugman, 2008; Verhoogen, 2008; Burstein and
Vogel, 2009; Egger and Kreickemeier, 2009; Goldberg et al. 2008. In particular, the last two
empirical studies provide strong evidence showing that imports of intermediates improve
technological progress and thus productivity and wages in developing countries.

169
The largest set of studies in the 90s has focussed on testing SBTC. One such example is
Machin and Van Reenen (1998), who studied SBTC on 7 OECD countries finding evidence of
a crucial association of R&D intensity and the share in employment of skilled workers. Based
on a sample of 12 OECD countries, Berman et al. (1998) concluded that there was a rise in the
share of skilled workers across all countries, reinforcing the argument for SBTC’s pervasive
nature. The study by Katz and Autor (1999) also suggested that SBTC played a major role in
explaining the wage-premium trend. Using a sample of 37 countries of different income levels,
Berman and Machin (2000) obtained similar results. Studies like Goldin and Katz (1996), Bartel
and Sicherman (1999), Kahn and Lim (1998) and Autor et al. (1998) study the US case and
concluded in favour of the positive effect of SBTC on the skill premium.
Autor et al. (2003) estimated a within industry shift in favour of cognitive tasks linked to
the increase in computer usage. This shift indicated that SBTC (proxied by computer usage)
accounted for 60% of the wage inequality increase in the 70s and the 80s.
More recently, literature dealing with more advanced economies concentrate on the
collateral effects. For instance, Açikgöz and Kaymak (2014) analyze the impact of the biased
nature of technological progress and the wage premium effect in the deunization of the US.
Ben-Halima et al. (2014) analyze the relationship between the skill premia and intergenerational
education mobility in France, presenting interesting findings on increasing skill premia between
highly qualified and less qualified but a decline in between qualified (Baccalaureat) and less
qualified.
In parallel, literature focusing on emerging economies has been developing. Caselli
(2014) analyzes to what extent Trade and SBTC explain the growing wage gap in Mexican
manufacturing. German-Soto et al. (2016) provide an analysis of the wage premium evolution
within different scientific areas based also on the case of Mexico. Benita (2016) also deals with
the Mexican case addressing the specific case of college premium. Li et al. (2016) focus on the
impact of imports of technology in Chinese growing skill premia wage gap.
The previous literature has provided evidence supporting SBTC’s hypothesis. However,
other authors have opposed these results, namely Card and DiNardo (2002). Arguing against
the SBTC’s holistic explanatory power, Card and DiNardo (2002) assessed the wage premium
evolution across the US in the 80s and 90s.They found that simultaneously to the expansion of
computer usage, the wage skill differential remained stable which contradicts SBTC. Moreover,
the authors highlight that SBTC provides no insights on a set of related issues such as the
gender-wage gap. Also a recent study by Berman et al. (2005) on India’s manufacturing sector
devised for the period of 1983 to 1998 revealed inconclusive results regarding SBTC.
170
Furthermore, a small amount of studies analyze together how IT and SBTC account for
the skill-premium evolution. One such study is Esquivel and Rodríguez-López (2003) who
study how IT and SBTC impacted over the skill premium between 1988 and 2000; their results
point to IT as the most relevant factor, but gender is nowhere mentioned. Manasse et al. (2004)
in a study of the evolution of the skill premium in the Italian metal-mechanical industry suggest
that IT and SBTC offset each other with SBTC stimulating an increase in wage inequality and
IT a reduction. Again, how IT and SBTC impact on gender-based inequality is neglected and
also occurs in Melka and Nayman (2004). In this last study, the authors make a comparative
analysis of the skill premia in the US and France, concluding that ICT capital deepening and
the R&D stock promoted an increase in the demand of college graduates whereas IT seems to
be not statistically relevant.
Using a multi-sector version of the Ricardo-Viner model of IT, Blum’s (2008) results
suggest that the sector bias rather than the skill bias nature of technological change is more
relevant. Analysing the US skill premium trend from 1970 until 1996, Blum (2008) concludes
that technology has been biased to more technology-intensive sectors.
The above mentioned studies have focussed on the skill-premium analysis disregarding
issues of gender-based inequality apart from a reduced number of exceptions, namely Katz and
Autor (1999), Card and DiNardo (2002) and Melka and Nayman (2004). Even among these
studies, only Card and DiNardo (2002) analyse gender as more than a side question. Chusseau
et al. (2008) extensive literature survey supports this conclusion, highlighting the poor attention
devoted to how SBTC and/or IT impacted over gender-based wage inequality. Nevertheless,
there is a small amount of studies combining skill premium and gender in the analysis. The next
sub-section is devoted to a closer analysis of these.
2.2 Empirical literature on the skill premium and gender
Although Acemoglu (1998) stressed the importance of analysing the skill premium also in terms
of gender inequality, not many studies have dealt with this issue, which is pointed as one of the
possible flaws to the explaining power of the SBTC hypothesis. Nevertheless, even before
Acemoglu (1998), Bound and Johnson (1992) analysed the path of wage differentials in the US,
considering education levels and gender. Using data from CPS surveys reporting from 1973 to
1988, the authors’ results indicate that the skill premia increased and gender inequality
decreased during the 80s.

171
Presenting similar results, Card and DiNardo’s (2002) study focuses on the path of wages
and the wage structure in the US. In particular, they analyze how wage inequality and the skill
premium has evolved across gender, race and age. Analysing the trends observed in the 80s and
the 90s, the authors highlight many inconsistencies or at least shortcomings of SBTC
explanation. Card and DiNardo’s (2002) empirical evidence point to a closing of the gender
gap contradicting SBTC theory insights. According to the authors, the education gradient in
computer use is higher for men than women and differences in computer use across gender are
narrower for higher levels of education attainment. Finally, Card and DiNardo’s (2002)
evidence also point to a higher use of computers by male college graduates in relation to female
ones. Hence, given SBTC’s perspective based on computer use/skill complementarily, wage
inequality should have widened in high levels of education and closed for the least educated.
The SBTC’s “rising skill price” perspective would suggest an expansion of inequality across
all educational levels. Nevertheless, evidence is clear and the wage gap has overall narrowed
by 15 percental points (pp) between 1980 and 1992.
Arguing that computers replace workers performing routine cognitive tasks and manual
tasks and that are complementary to workers performing non-routine tasks, Autor et al. (1998)
tried to assess the pervasiveness of SBTC across different groups of analysis, including gender.
For both men and women, the authors observe significant shifts of the relative demand for
skilled workers, though considerably larger for women. However, Autor et al. (1998) do not
analyze the impact on the wage premia, but the bigger shift of demand for skilled women may
suggest that the gap should diminish at least for highly educated workers.
In general, there are not many empirical studies assessing how IT impacts on wage
inequality (e.g., Anderson, 2005). There are even less that deal with gender-related issues.
Among the exceptions we find Seguino (1997) who concludes that the export-led growth of
Korea had a small contribution to the narrowing of the gender wage gap. In the same line,
Tzannatos (1999) analysis for 12 developing countries covering the 80s and the 90s go in the
same direction of Seguino (1997) but estimating a bigger impact. Rama (2001) concludes that
in Vietnam there was a significant reduction of the wage gap across gender in all educational
levels during Vietnam’s IT liberalization.
Galiani and Sanguinneti (2003) have analyzed Argentina’s case. Focusing more clearly
on the skill premia, they observe that the evolution across gender is actually similar, not
addressing this issue from a pure gender gap perspective but providing results that indicate that
the skill premia gender gap has increased with Argentina’s liberalization.
172
Oostendorp’s (2004) findings suggest that IT and Foreign Direct Investment (FDI) net
inflows reduced the gender gap among unskilled workers of developing countries.
In a recent study, Autor et al. (2008) focus on four inequality concepts: changes in overall
wage inequality, changes in inequality in the upper and lower halves of the wage distribution,
between-group wage differentials and within-group wage inequality. There results point to a
narrowing of the gender-wage gaps since 1980.
Bryan and Martinez (2008) show that in the US the trends in male and female income
inequality have been similar over the past few decades with interesting aspects, highlighting
that the level of inequality seems to be lower among women than men, though increasing in
both cases. Across gender, they conclude that inequality has been decreasing, with women’s
wages catching up with those of men, confirming Autor et al. (2008) results.
To sum up, there is a small number of studies combining the skill premia with gender.
Most of them dealt do not focus in explaining asymmetries across gender, nor deal with it as a
primary research issue. The surveys of Chusseau et al. (2008) on the gender-gap literature and
of Brown and Campbell (2002) on the skill-premia literature highlight the scarce amount of
analysis combining both approaches and which Acemoglu (1998) stated, may be an important
contribution to the skill premia debate. Hence, we will focus our contribution on this matter,
trying to assess how the skill premium evolved across gender, analysing how IT and SBTC
impacted on gender-based inequality.
3. Modelling the case for gender wage premium
In the previous section, we showed that empirical studies on the IT versus SBTC debate have
neglected gender inequality. Our goal is to test if IT and/or SBTC explain a fall in gender
asymmetries per level of education. On follower (developing) countries, IT may result in higher
demand for less educated labour and this expansion lead to more equality. Moreover, since
women are now the majority of college graduates, SBTC may have contributed to women
fulfilling skilled-labour positions, thus reducing wage gaps towards men. On developed
countries, wage-premium path across gender may also be explained SBTC, but IT, at least in
Stolper-Samuelson theorem’s sense, is probably an irrelevant explaining variable.
Based on a sample of 25 OECD countries and for a 10 year period (1997-2006), we
estimate the effects of both IT and SBTC on wage-gender inequality. Although the database
appears to be dated, you can see that even the most recent papers use data no sooner than 2010
(e.g. Li et. Al, 2016 use data up until 2009, Açikgöz and Kaymak (2014) use data for the US

173
until 2007). The reasoning to use this data set has to do with stability and consistency of the
estimation since the financial crisis that spread in late 2008 would have had a distorting impact
that could hamper our analysis of the “normal” evolutionary trend of the skill premia in
developed countries.
Hence, to test our hypothesis, we estimate the following model specification not only for
the sample as a whole, but also for a sub-samples of countries defined for an R&D threshold
thus trying to stress the mentioned potential differences of kings for different kingdoms:
ititit vITSBTCWP ++++= φX21,
where i and t stands for, respectively the country and year indexes. Moreover, according to our
goal and model specification, our sample comprises proxies for the following variables: wage
premium across gender, WP, skill-biased technical change, SBTC, International Trade, IT, and
income level, GDP. To have statistical data coherence we used only OECD databases.
WP stands for wage premium and is our dependent variable. Since we are interested in
capturing gender asymmetries and the effects of IT and SBTC, using the data retrieved from
OECD’s 2008 Education at Glance Report on the average wages earned by workers with
superior, upper secondary and lower secondary education attainments and on wage inequality
between men and women, we build skill-premium measures comparing earnings of colleges
graduates with the ones of lower secondary graduates for male, WPMs/l, female, WPFs/l, and we
will also use as a third dependent variable wage differential between man and woman per
education levels superior, WPMFs, and lower secondary, WPMFl. This set of dependent
variables present an advantage over the proxies mostly used in the literature that, usually due
to data unavailability, use indirect measures of the skill premia to assess these relationships.
To evaluate the SBTC, several indicators have been used in the literature. For instance,
Bartel and Sicherma (1999) used the proportion of scientists and engineers, Autor et al. (1998)
used computer usage and Machin and Van Reenen (1998) use the share of R&D expenditures
on GDP. We will use this latter option for a set of reasons. It is available at OECD database for
the entire period of our analysis and for all the 25 countries, it measures technology, being
intimately associated to innovation performance and finally, it is highly correlated to computer
usage thus capturing the majority of effects from ICT spread.
To proxy IT openness we follow Thoenig and Verdier (2002). Having retrieved data on
imports, exports and GDP, we computed the degree of openness for each country and across
time. The higher exposure to IT, should lead to an overall increase in the wage premium for
OECD countries since they are relatively high-income countries but may have differentiated
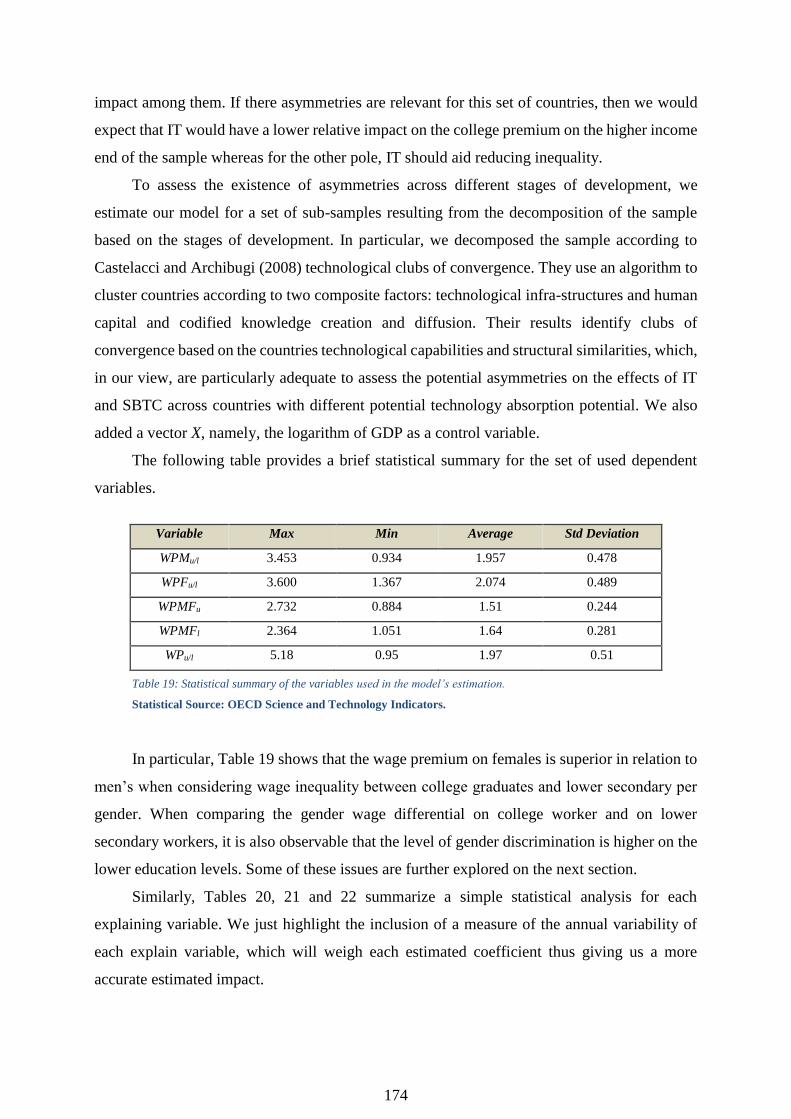
174
impact among them. If there asymmetries are relevant for this set of countries, then we would
expect that IT would have a lower relative impact on the college premium on the higher income
end of the sample whereas for the other pole, IT should aid reducing inequality.
To assess the existence of asymmetries across different stages of development, we
estimate our model for a set of sub-samples resulting from the decomposition of the sample
based on the stages of development. In particular, we decomposed the sample according to
Castelacci and Archibugi (2008) technological clubs of convergence. They use an algorithm to
cluster countries according to two composite factors: technological infra-structures and human
capital and codified knowledge creation and diffusion. Their results identify clubs of
convergence based on the countries technological capabilities and structural similarities, which,
in our view, are particularly adequate to assess the potential asymmetries on the effects of IT
and SBTC across countries with different potential technology absorption potential. We also
added a vector X, namely, the logarithm of GDP as a control variable.
The following table provides a brief statistical summary for the set of used dependent
variables.
Variable Max Min Average Std Deviation
WPMu/l 3.453 0.934 1.957 0.478
WPFu/l 3.600 1.367 2.074 0.489
WPMFu 2.732 0.884 1.51 0.244
WPMFl 2.364 1.051 1.64 0.281
WPu/l 5.18 0.95 1.97 0.51
Table 19: Statistical summary of the variables used in the model’s estimation.
Statistical Source: OECD Science and Technology Indicators.
In particular, Table 19 shows that the wage premium on females is superior in relation to
men’s when considering wage inequality between college graduates and lower secondary per
gender. When comparing the gender wage differential on college worker and on lower
secondary workers, it is also observable that the level of gender discrimination is higher on the
lower education levels. Some of these issues are further explored on the next section.
Similarly, Tables 20, 21 and 22 summarize a simple statistical analysis for each
explaining variable. We just highlight the inclusion of a measure of the annual variability of
each explain variable, which will weigh each estimated coefficient thus giving us a more
accurate estimated impact.
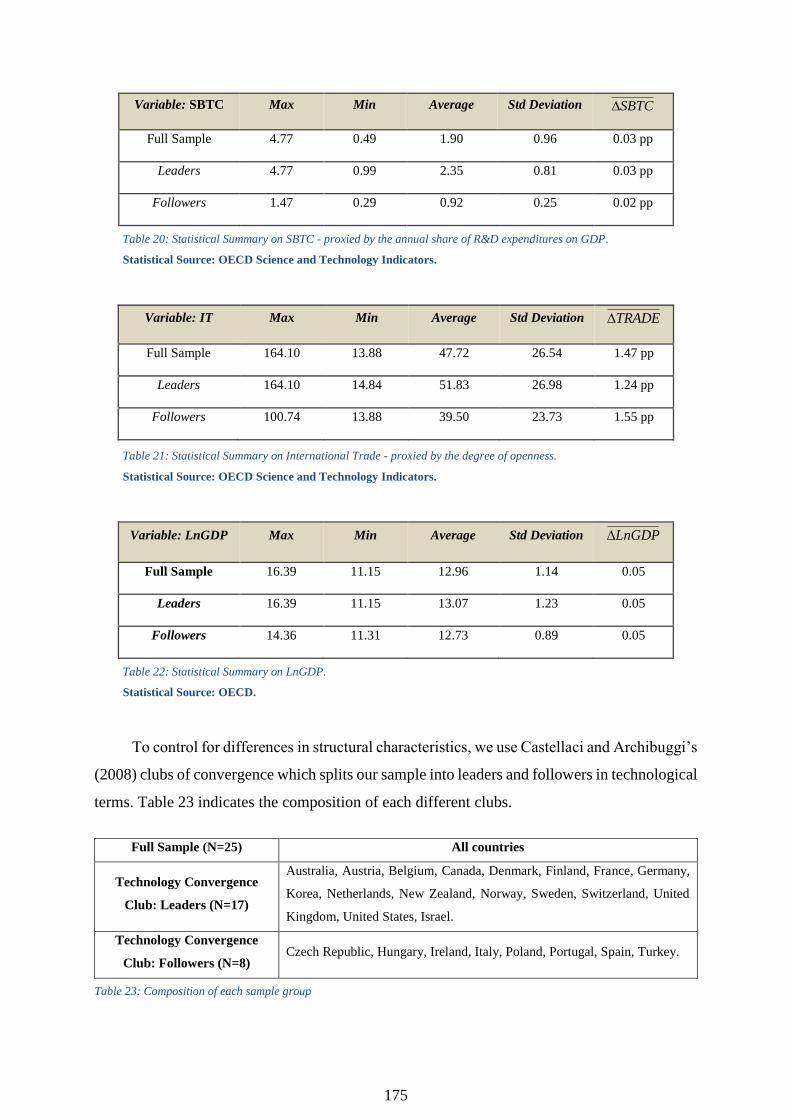
175
Variable: SBTC Max Min Average Std Deviation SBTC
Full Sample 4.77 0.49 1.90 0.96 0.03 pp
Leaders 4.77 0.99 2.35 0.81 0.03 pp
Followers 1.47 0.29 0.92 0.25 0.02 pp
Table 20: Statistical Summary on SBTC - proxied by the annual share of R&D expenditures on GDP.
Statistical Source: OECD Science and Technology Indicators.
Variable: IT Max Min Average Std Deviation TRADE
Full Sample 164.10 13.88 47.72 26.54 1.47 pp
Leaders 164.10 14.84 51.83 26.98 1.24 pp
Followers 100.74 13.88 39.50 23.73 1.55 pp
Table 21: Statistical Summary on International Trade - proxied by the degree of openness.
Statistical Source: OECD Science and Technology Indicators.
Variable: LnGDP Max Min Average Std Deviation LnGDP
Full Sample 16.39 11.15 12.96 1.14 0.05
Leaders 16.39 11.15 13.07 1.23 0.05
Followers 14.36 11.31 12.73 0.89 0.05
Table 22: Statistical Summary on LnGDP.
Statistical Source: OECD.
To control for differences in structural characteristics, we use Castellaci and Archibuggi’s
(2008) clubs of convergence which splits our sample into leaders and followers in technological
terms. Table 23 indicates the composition of each different clubs.
Full Sample (N=25) All countries
Technology Convergence
Club: Leaders (N=17)
Australia, Austria, Belgium, Canada, Denmark, Finland, France, Germany,
Korea, Netherlands, New Zealand, Norway, Sweden, Switzerland, United
Kingdom, United States, Israel.
Technology Convergence
Club: Followers (N=8) Czech Republic, Hungary, Ireland, Italy, Poland, Portugal, Spain, Turkey.
Table 23: Composition of each sample group

176
4. Cross country evidence on the explanatory degree of SBTC and International Trade
In this section we present and analyse the estimation results. In particular, we analyse in what
way the two main explanations for the increase in wage inequality per education attainment,
SBTC and IT, have in fact promoted the skill premium across gender and how they have
impacted in gender-based inequality in both high and low level of education attainment. Next
we analyze the estimates derived per each dependent variable and Table 24 presents our model
estimation results assessing the evolution of the skill premia on male and female workers.
Variables
WPMu/l WPFu/l
all leaders followers all leaders followers
SBTC 0.26200*** 0.30194*** -0.11271 0.29136*** 0.29516*** -0.15598
Weighed effect 0.00786*** 0.00906*** -0.00236 0.00874*** 0.00885*** -0.00312
IT 0,00283** 0.00382*** -0.00989*** 0.00330*** 0.00312*** 0.00411***
Weighed effect 0.00416** 0.00474*** -0.01533*** 0.00485*** 0.00387*** 0.00637***
LnGDP -0.00911 0.05793 -0.35607*** -0.14123*** 0.03627 -0.25405***
Constant --- --- 7.28898*** --- --- 5.63096***
NT 250 170 80 250 170 80
Adjusted R2 0.934 0.879 0.328 0.95633 0.934 0.960
Method FEM FEM Pool OLS FEM FEM REM
Table 24: Panel data estimation results of wage premium on male and female individuals
Notes: ***Significant at 1%, ** significant at 5%, * significant at 10%; Effects: Group only (G) or Group and Time (G&T). Following
Wooldridge (2002), we use the global significance F-test,. the Lagrange-Multiplier (LM) test and the Hausman test to choose which model
(pool OLS, FEM or REM) is more suitable for our estimation in each case.
When using the full sample and the club of convergence of more technology advanced
countries, both the marginal and weighted effect of SBTC is dominant and positive, hence
promoting an increase in the wage premium for both men and women. Nevertheless, it is
statistically not significant for follower countries. For the full sample, SBTC has an estimated
177
marginal effect of 26.2 pp over the wage premium of men and of 29.1 pp over the women’s.
Since the SBTC proxy scale of annual variability, the computed weighted effect amounts to 0.8
pp and 0.9 pp for men and women, respectively. For technologically advanced countries
(“leaders”), the results are slightly higher on both male and female workers.
IT is also estimated to increase the wage premium for the full sample and the leaders
group. However, the marginal effect is quite small and the weighted effect is about half the one
estimated for SBTC. For the overall sample, the weighted effect is estimated to be 0.4 pp on
men and 0.5 pp on women, slightly increasing for men in the leaders group and decreasing for
women. However, despite SBTC dominance in the full sample and the leaders’ group, for the
set of countries classified as technological followers, SBTC is estimated to be not significant
both for men and women. Here IT impact, both in marginal and weighted terms is dominant
and higher than the registered for the other two samples. IT accounts for a marginal decrease in
inequality estimated in about -9.9 pp for men but a positive of 4.1 pp for women. In weighted
terms, these values would reach -15.3 pp and 6.4 pp, respectively.
LnGDP is significant on followers and for both genders, accounting for a decrease in
inequality estimated, in marginal terms, in -0.36 pp for men and -0.25 pp for women. The
evidence supporting the impact of income in decreasing inequality is also present for the full
sample, but only for women.
Thus, SBTC is dominant on the sample as a whole and for leaders, suggesting that in
countries where technological intensive production activities are a small part, absorptive
capacity may be limited and SBTC is actually not pervasive. Though IT has a smaller effect on
the first two sets of countries, it is dominant for followers and always significant, in spite of
symmetrical. In follower countries, IT contributes to a reduction of the wage premium of males
but for an increase in inequality on females. LnGDP is only relevant and inequality reducing
on follower countries. In terms of impact, GDP leaps seem to promote a higher inequality which
we believe may be explained by the predominance of low-tech industries which, in line with
Stolper-Samuelson, suffering an expansion from increased openness and low tech
specialization, pushes outwards the demand for less skilled workers and hence contributes to
the diminishing of the wage premium, in line with the estimations.
Literature has also questioned how SBTC and IT impacted on gender-based inequality
(e.g. Acemoglu, 1998). The skill premia between male and female workers is quite significant
(see Table 19), with men earning on average more from 51% to 64% more than women with
the same education attainment. In here, we attempt to understand if for workers with the same
competences (college or lower secondary), the observed gender related wage inequality
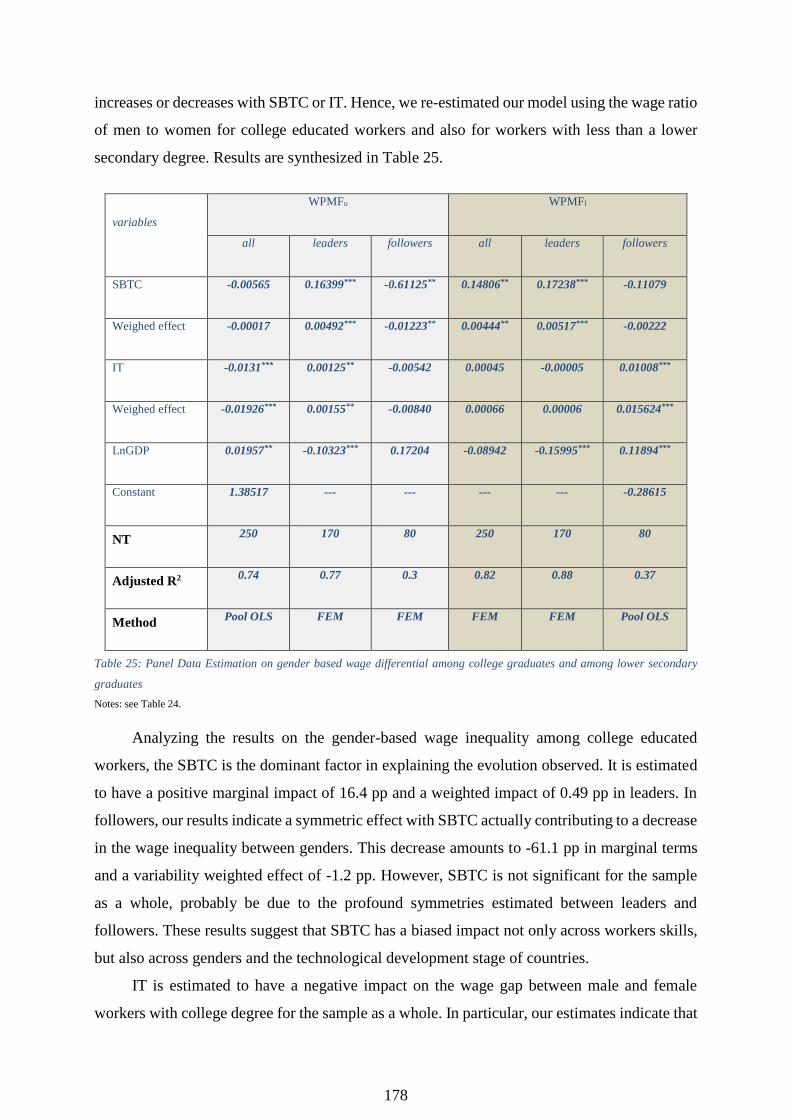
178
increases or decreases with SBTC or IT. Hence, we re-estimated our model using the wage ratio
of men to women for college educated workers and also for workers with less than a lower
secondary degree. Results are synthesized in Table 25.
variables
WPMFu WPMFl
all leaders followers all leaders followers
SBTC -0.00565 0.16399*** -0.61125** 0.14806** 0.17238*** -0.11079
Weighed effect -0.00017 0.00492*** -0.01223** 0.00444** 0.00517*** -0.00222
IT -0.0131*** 0.00125** -0.00542 0.00045 -0.00005 0.01008***
Weighed effect -0.01926*** 0.00155** -0.00840 0.00066 0.00006 0.015624***
LnGDP 0.01957** -0.10323*** 0.17204 -0.08942 -0.15995*** 0.11894***
Constant 1.38517 --- --- --- --- -0.28615
NT 250 170 80 250 170 80
Adjusted R2 0.74 0.77 0.3 0.82 0.88 0.37
Method Pool OLS FEM FEM FEM FEM Pool OLS
Table 25: Panel Data Estimation on gender based wage differential among college graduates and among lower secondary
graduates
Notes: see Table 24.
Analyzing the results on the gender-based wage inequality among college educated
workers, the SBTC is the dominant factor in explaining the evolution observed. It is estimated
to have a positive marginal impact of 16.4 pp and a weighted impact of 0.49 pp in leaders. In
followers, our results indicate a symmetric effect with SBTC actually contributing to a decrease
in the wage inequality between genders. This decrease amounts to -61.1 pp in marginal terms
and a variability weighted effect of -1.2 pp. However, SBTC is not significant for the sample
as a whole, probably be due to the profound symmetries estimated between leaders and
followers. These results suggest that SBTC has a biased impact not only across workers skills,
but also across genders and the technological development stage of countries.
IT is estimated to have a negative impact on the wage gap between male and female
workers with college degree for the sample as a whole. In particular, our estimates indicate that

179
IT has a marginal effect of -1.3 pp and a weighted effect of -2.0 pp. IT is also a relevant
explaining factor for the set of leaders. For these countries, however, the impact of IT is
estimated to widen inequality, with a positive, though small, effect of 0.1 pp and a weighted
effect of 1.6 pp. In the club of convergence grouping the less technologically advanced
countries, IT is estimated to have a negative impact but not statistically significant.
An interesting result arises from our control variable, LnGDP. LnGDP is not significant
for follower countries. However, it is estimated to have a positive impact for the sample as a
whole and a negative one in leaders. Not only this result seems to indicate that among the most
advanced countries, the most gender egalitarian societies have a relatively lower GDP, but it
may also become a dominant factor in a context of strong economic growth.
In sum, SBTC is also a predominant explanation for wage inequality widening across
genders within college educated workers, conveying a symmetric effect (positive on leaders
and negative on followers). IT is a less important determinant of wage inequality however, for
college graduates and the sample as a whole, being not statistically significant for followers
whereas GDP may become a dominant factor in a context of strong economic growth,
contributing to the diminishing of inequalities between gender.
The second set of estimates on Table 25 redoes the above analysis for a set of workers
with an educational attainment equal or below lower secondary degrees. Similarly to the results
for the set of workers with college degrees, SBTC arises as the dominant explanation except
for followers. For the full sample, SBTC accounts for an estimated marginal effect of 14.8 pp
and a weighted effect of 0.44 pp. These estimates are slightly higher when we re-estimated the
model for the set of leaders. However, despite SBTC’s dominance for these groups of countries,
in followers our results indicate no statistical significance in spite of indicating also a negative
effect upon gender inequality.
Unlike the estimates for workers with a college degree, now IT is only significant for the
set of followers where in fact it contributes to an increase in inequality. Here, an increase in the
openness level of the economy in 1 pp would result in an increase in the wage differential
between men and women of approximately 1 pp in marginal terms.
The symmetric effect of the GDP level on gender-inequality is again present and
following the already noticed path in the first set of estimates of Table 25. In particular, the
GDP level has an inequality reducing impact on leaders and a widening impact on followers.
In sum, there seems to be a very relevant association of the pervasiveness of SBTC and a
country technological development, having SBTC a dominant impact on these countries.
Nevertheless, SBTC’s effect is apparently symmetrical, contributing to the widening of the

180
wage gap both within gender and across genders on technologically more advanced countries
but to a an inequality reduction on less technologically advanced countries.
In what concerns IT, among college graduate workers, the overall effect is small but
inequality reducing, signal that is common to the followers’ sub-sample. For leaders, IT widens
the gender wage gap. When assessing the impact of IT and SBTC hypothesis on the gender
wage discrimination among lower skilled workers, SBTC seems to convey a positive impact
both on the sample as a whole and on leaders, thus increasing wage inequality not education
based. On followers, despite of being statistically insignificant, the sign is negative, as it was
observed for college graduate workers. In terms of the fecundity of IT in explaining wage
inequality between men and women, IT is only relevant for followers where it contributes
positively to the wage differential between genders.
GDP has an inequality reducing effect on the wage premium and also on the wage
differential per gender apart from the case of the full sample in college educated workers and
followers for the group of less educated workers.
5. Conclusions
Literature has long been debating the reasons for the observed increase in the college wage
premium focusing on theoretical arguments centered on two explanations, SBTC and IT. Our
literature review highlighted the need to further empirical studies, namely assessing the SBTC
and IT explanations impact on wages in a different perspective. Hence, we use SBTC and IT to
assess based on a 25 OECD countries sample, possible asymmetries and the actual effects on
the reduction or widening of gender inequality.
Using the traditional measure of wage premium and comparing differences between
males and females, results show that SBTC is overall dominant, with IT, despite its smaller
impact, being always significant and in a sense universal in explaining the skill premia.
SBTC’s effect is symmetric across clubs of convergence and asymmetric in impact. In
terms of signal, SBTC widens the wage premium and the gender differential for the full sample
and leaders, apparently promoting a wage inequality decrease common to genders on followers
(though, the latter effect is not statistically significant in all estimates). But the effects are also
asymmetric in magnitude with SBTC accounting for a stronger impact on technologically more
advanced countries, suggesting that the pervasiveness of technology is equal across distinct
technological/economic country structural profile. SBTC is also a major explanation for wage
inequality widening across genders within the same levels of education skill. Thus, SBTC has
a biased impact not only across workers skills, but also across genders.

181
IT is overall almost always statistically significant, conveying a higher impact over the
set of technologically followers. IT estimated impact is lower than SBTC’s however there is an
interesting symmetric result that points to IT reducing the skill premia among men and widening
it among women.
In sum, SBTC arises as the dominant explanation for the evolution of the wage premium
within gender and the wage differential between genders, though the effects depend on the stage
of development of a country. IT is estimated to convey a less powerful impact on wages
although IT is more sample-universal.
References
Acemoglu, D. (1998). “Why do new technologies complement skills? Directed technical change and
wage inequality.” Quarterly Journal of Economics, vol. 113(4), pp. 1055-1089.
Acemoglu, D. (2003). “Patterns of skill premium.” Review of Economic Studies, vol. 70(2), pp. 199-
230.
Açikgöz, Ö. T. and Kaymak, B. (2014). “The Rising Skill Premium and Deunionization”. Journal of
Monetary Economics, 63, pp. 37-50.
Amiti, M. and Konings, J. (2007). “Trade liberalization, intermediate inputs and productivity: evidence
from indonesia.” American Economic Review, vol. 97(5), pp. 1611-1638.
Amiti, M. and Davis, D. (2008). “Trade, firms and wages: theory and evidence.” NBER Working Papers
No. 14106.
Anderson, E. (2005). “Openness and inequality in developing countries: a review of theory and recent
evidence.” World Development, vol. 33(7), pp. 1045-1063.
Autor, D., Katz, L. and Kearney, M. (2008). “Trends in U.S. wage inequality: revising the revisionists.”
Review of Economics and Statistics, vol. 90(2), pp. 300-323.
Autor, D., Katz, L. and Krueger, A. (1998). “Computing inequality: have computers changed the labour
market?” Quarterly Journal of Economics, vol. 113(4), pp. 1169-1213.
Autor, D., Levy, F. and Murnane, R. (2003). “The skill content of recent technological change: an
empirical exploration.” Quarterly Journal of Economics, vol. 118(4), pp. 1279-1333.
Bartel, A. P. and Sicherman, N. (1999). “Technology change and wages: an inter-industry analysis.”
Journal of Political Economy, vol. 107(2), pp. 285-325.
Ben-Halima, B.; Chusseau, N. and Hellier, J. (2014). “Skill Premia and Intergenerational Education
Mobility: The French Case”. Economics of Education Review, 39, pp. 50-64.
Benita, F. (2014). “A Cohort Analysis of the College Premium in Mexico”. Latin American Journal of
Economics, 51(1), pp. 147-178
182
Berman, E. and Machin, S. (2000). “Skill-biased technology transfer around the world.” Oxford Review
of Economic Policy, vol. 16(3), pp. 12-22.
Berman, E., Bound, J. and Griliches, Z. (1994). “Changes in the demand for skilled labour within U.S.
manufacturing industries: evidence from the annual survey of manufacturing.” Quarterly Journal
of Economics, vol. 109(2), pp. 367-397.
Berman, E., Bound, J. and Machin, S. (1998). “Implications of skill-biased technological change:
international evidence.” Quarterly Journal of Economics, vol. 113(4), pp. 1245-1279.
Berman, E., Somanathan, R. and Hong, T. (2005). “Is skill-biased technological change here yet?
Evidence from Indian manufacturing in the 1990.” World Bank Policy Research Working Paper
Nº 3761.
Blau, F. and Kahn, L. (1997). “Swimming upstream: Trends in the gender wage differential in the
1980s.” Journal of Labor Economics, vol. 15(1), pp. 1-42.
Blum, B. (2008). “Trade, technology, and the rise of the service sector: the effects on US wage
inequality.” Journal of International Economics, vol. 74, pp. 441-458.
Borjas, G., Freeman, R., Katz, L., DiNardo, J. and Abowd, J. (1997). “How much do immigration and
trade affect labor market out-comes?” Brookings Papers on Economic Activity, pp. 1-90.
Bound, J. and Johnson, G. (1992). “Changes in the structure of wages in the 1980’s: an evaluation of
alternative explanations.” American Economic Review, vol. 82(3), pp. 371-392.
Broda, C. and Romalis, J. (2008). “Inequality and prices: does China benefit the poor in America?”
Working Paper, University of Chicago.
Brown, C. and Campbell, B. (2002). “The impact of technological change on work and wages.”
Industrial Relations, vol. 41(1), pp. 1-33.
Bryan, K. and Martinez, L. (2008). “On the evolution of income inequality in the United States.”
Economic Quarterly, vol. 94(2), pp. 97-120.
Burstein, A. and Vogel, J. (2009). “Globalization, technology, and the skill premium.” working paper,
UCLA.
Campos-Vazquez, R. M.; Lopez-Calva, L. F. and Lustig, N. (2016). “Declining Wages for
College-Educated Workers in Mexico”. Policy Research Working Paper, 7546.
Card, D. and DiNardo, J. (2002). “Skill-biased technological change and rising wage inequality: some
problems and puzzles.” Journal of labour Economics, vol. 20(4), pp. 733-783.
Caselli, M. (2014). “Trade, Skill-Biased Technical Change and Wages in Mexican Manufacturing”.
Applied Economics, 46(3), pp. 336-348.
Castellacci, F. and Archibugi, D. (2008). “The technology clubs: The distribution of knowledge across
nations.” Research Policy, vol. 37(10), pp. 1659-1673.
Chay, K. and Lee, D. (2000). “Changes in relative wages in the 1980s: returns to observed and
unobserved skills and black-white wage differentials.” Journal of Econometrics, vol. 99(1), pp.
1-38.
183
Chusseau, N., Dumont, M. and Hellier, J. (2008). “Explaining rising inequality: skill-biased technical
change and North-South trade.” Journal of Economic Surveys, vol. 22(3), pp. 409-457.
Conte, A. and Vivarelli, M. (2007). “Globalization and employment: imported skill-biased technological
change in developing countries.” JENA Economic Research Papers, nº 9.
Egger, H. and Kreickemeier, U. (2009). “Firm heterogeneity and the labor market effects of trade
liberalization.” International Economic Review, vol. 50, pp. 187-216.
Esquivel, G. and Rodríguez-Lopes, J. (2003). “Technology, trade, and wage inequality in Mexico before
and after NAFTA.” Journal of Development Economics, vol. 72, pp. 543- 565.
Feenstra, R. and Hanson, G. (1996). “Globalization, outsourcing, and wage inequality.” American
Economic Review, vol. 86(2), pp. 240-245.
Feenstra, R. and Hanson, G. (2003). “Global production sharing and rising inequality: a survey of trade
and wages.”, in Handbook of International Trade, vol. 1, edited by E. Kwan Choi and James
Harrigan, Malden, Mass.: Blackwell Publishing.
Galiani, S. and Sanguinetti, P. (2003). “The impact of trade liberalization on wage inequality: evidence
from Argentina.” Journal of Development Economics, vol. 72, pp. 497-513.
German-Soto, V., Carrera, E. and Martinez, L. (2016). “On the Skill Premium Hypothesis in Mexico:
An Analysis by Scientific Area”. Estudos de Economia Aplicada, 34-2, pp. 353-378.
Goldberg, P. and Pavcnik, N. (2007). “Distributional effects of globalization in developing countries.”
Journal of Economic Literature, vol. 45, pp. 39-82.
Goldberg, P., Khandelwal, A., Pavcnik, N. and Topalova, P. (2008). “Imported intermediate inputs and
domestic product growth: evidence from India.” NBER Working Paper No. 14416.
Goldin, C. and Katz, L. (1996). “Technology, skill and the wage structure: insights from the past.”
American Economic Review, vol. 86(2), pp. 252-257.
Goldin, C. and Katz, L. (1999). “The returns to skill in the United States across the twentieth century.”
NBER Working Papers No. 7126.
Gonzaga, G., Filho, N. and Terra, C. (2006). “Trade liberalization and the evolution of skill earnings
differentials in Brazil.” Journal of International Economics, vol. 68(2), pp. 345-367.
Green, F., Dickerson, A. and Arbache, J. (2001). “A picture of wage inequality and the allocation of
labor through a period of trade liberalization: the case of Brazil.” World Development, vol. 29(11),
pp. 1923-1939.
Greiner, A., Rubart, J. and Semmler, W. (2004). “Economic growth, skill-biased technical change and
wage inequality: a model and estimations for the US and Europe.” Journal of Macroeconomics,
vol. 26(4), pp. 597-621.
Helpman, E., Itskhoki, O. and Redding, S. (2008). “Wages, unemployment and inequality with
heterogeneous firms and workers.” NBER Working Papers No.14122.
Kahn, J. and Lim, J. (1998). “Skilled labor-augmenting technical progress in U.S. manufacturing.”
Quarterly Journal of Economics, vol. 113(4), pp. 1281-1308.
184
Katz, L. and Autor, D. (1999). “Changes in the wage structure and earnings inequality”, in O.
Ashenfelter and D. Card (eds.), Handbook of Labor Economics, vol. 3. Amsterdam: Elsevier-
North Holland.
Katz, L., Murphy, K. (1992). “Changes in relative wages, 1963–1987: supply and demand factors.”
Quarterly Journal of Economics, vol. 107(1), pp. 35-78.
Krugman, P. (2008). “Trade and wages, reconsidered.” Brookings Papers on Economic Activity, pp.
103-154.
Leamer, E. (1998). “In search of Stolper-Samuelson linkages between international trade and lower
wages”, in Collins, S. (Ed.), Imports, Exports and the American Worker, Brookings Institution,
pp. 141-202.
Leamer, E. (2001). “In search of Stolper-Samuelson effects on U.S. wages.” NBER Working Papers No
5427.
Leamer, Edward E. (1994). “Trade, wages and revolving door ideas.” NBER Working Papers No 4716.
Li, H., Li, L. Hong, M. (2016). “Skill-biased Imports in China”, in http://www.sole-jole.org/17245.pdf.
Machin, S. and Van Reenen, J. (1998). “Technology and changes in skill structure: evidence from seven
OECD countries.” Quarterly Journal of Economics, vol. 113(4), pp. 1215-1244.
Machin, S. (1996). “Wage inequality in the UK.” Oxford Review of Economic Policy, vol. 12(1), pp. 47-
64.
Manasse, P., Stanca, L. and Turrini, A. (2004). “Wage premium and skill upgrading in Italy: why didn’t
the hound bark?” Labour Economics, vol. 11(1), pp. 59-83.
Melka, J. and Nayman, L. (2004). “Labour quality and skill biased technological change in France.”
Centre d’Études Prospectives e d’Informations Internationales.
Oostendorp, R. (2004). “Globalisation and the gender wage gap”, World Bank Working Paper No 3256.
Rama, M. (2001). “The gender implications of public sector downsizing: The reform program of
Vietnam.” World Bank Working Paper No 2573.
Sachs, J. and Shatz, H. (1996). “US trade with developing countries and wage inequality.” American
Economic Review, vol. 86(2), pp. 234-239.
Seguino, S. (1997). “Gender wage inequality and export-led growth in South Korea.” Journal of
Development Studies, vol. 34(2), pp. 102-132.
Thoenig, M. and Verdier, T. (2003). “A theory of defensive skill biased innovation and globalization.”
American Economic Review, vol. 93(3), pp. 709-728.
Tzannatos, Z. (1999). “Women and labour market changes in the global economy: Growth helps,
inequalities hurt and public policy matters.” World Development, vol. 27(3), pp. 551-570.
Verhoogen, E. (2008). “Trade, quality upgrading and wage inequality in the Mexican manufacturing
sector.” Quarterly Journal of Economics, vol. 123, pp. 489-530.
Wood, A. (1994). North-South trade, employment and inequality. Oxford University Press.

185
Wooldridge, J. (2002). Econometric Analysis of Cross Section and Panel Data, Cambridge, MA: MIT
Press.

186
CONCLUSIONS
This thesis aimed at contributing to the discussion of innovation policy and innovation systems,
developing theoretical frameworks and models to support an operational take on key aspects
for the construction of regional innovation systems in follower regions and to the impacts of
the biased nature of technology on the labour market. In a first section we develop the
conceptual approach to the implementation of regional innovation system’s framework in a
follower region, studying also on how to implement smart specialization. A second section is
dedicated to the side effects of a knowledge-driven system, namely, in terms of the biased
effects on the labour market.
Firstly, we developed contribution to the theoretical frameworks of regional innovation
systems in the context of a follower region, trying to contribute to the definition of development
paths more suited to their structural characteristics. We considered as case studies four
European regions (Norte and Centro in Portugal and Galicia and Cantabria in Spain) and used
the taxonomies of the RIS proposed by authors such as Asheim and Cooke to account for the
relevance of four drivers of change: the leverage effect induced by the general-purpose
technologies, the need for effective promotion of technological entrepreneurship, the
accelerator role of external initiatives and, finally, the need for a new set of organizations placed
at the centre of connectivity or interaction promotion. Considering the new paradigm for
Cohesion Policy, we research on the concept of smart specialization, proposing a theoretical
framework to help clarify the objectives of smart specialization, namely its transformative
character, and a methodological approach to identify and select the thematic priorities. In
complement, we further propose an architecture of a monitoring and evaluation system that
covers 4 critical dimensions: implementation, first level results, structural change and long-
term impacts, before presenting an example of an initiative of transformative nature. We refer
to the case study of Art on Chair which we perceive as enlightening in what concerns the change
in paradigm underlying a path of smart specialization. Finally, within this first section we
analyze a specific policy tool for the development of innovation systems in follower regions:
Science and Technology Parks (STP). Our contributions on this matter are three fold: we
propose a functional definition of STPs based upon the structuring role these infrastructures
may have in the development of the innovation system, we address the specific case of follower
regions and the added functions of STPs in a context with less scientific density and asymmetric
development of the knowledge production system and the knowledge valorization system and

187
we conclude with an cluster analysis on 55 STPs located in Portugal, Spain and UK that
uncovers a set of common characteristics that have statistical links to a STPs performance. In
light of our results, we conclude that a STP is a valid and useful policy tool in a public push
attempt to build a RIS in follower regions though its impacts in concentrating and focusing
resources that can potentiate the effects of the public science push with also a demand pull. The
success and structural change impact of STP requires a systemic approach that also creates the
setting for the STP to function as an attractor of R&D FDI, exploring significant cost-
advantages and the increased tendency of R&D globalization.
The second section of this thesis uses modelling and econometrics to study the impacts
of the increases structure of innovation systems, especially, resulting in an augmented effect on
technology permeability. This facilitation of absorption and diffusion is associated with biased
effects on the labour market and wages. In the first paper of this section we proposed an
endogenous growth model where individuals decide between consumption and savings on
income allocation, where the share of R&D labour of H-sector in R&D labour population is
dynamic, and where two productive technologies of perfectly competitive final goods are used.
One combines skilled labour with a specific set of (complementary) quality-adjusted
intermediate goods and the other uses skilled labour complemented with a continuum of high-
specific quality-adjusted intermediate goods. Intermediate goods, which are improved in the
R&D sector, are produced in monopolistic competition.
Our simulated results point that the bias that causes wage inequality is mainly induced
through the market-size channel. In our case, the path of the skill premium is similarly
influenced by the direction of technological-knowledge progress, but this direction, however,
is strongly induced by the elasticity of substitution between technologies/inputs (skilled and
unskilled).
In particular, we find that if the elasticity of substitution between the two inputs in the
production of the aggregate final good is stronger, an increase of the skilled labour biases the
technological-knowledge such that the rise in the relative demand of skilled labour dominates
the relative supply. As a result the skill premium increases. Finally, we assess the SBTC and IT
explanations impact on wages through an econometric study of 25 OECD countries sample.
Using the traditional measure of wage premium and comparing differences between males and
females, results show that SBTC is overall dominant, with IT, despite its smaller impact, being
always significant in explaining the skill premia.
For the future, further research is necessary to improve the definition of a follower region,
as well as for the concept of region itself. In what concerns smart specialization, the conceptual

188
approaches are quite diverse, being necessary to further refine our proposition and elaborate on
how to measure linkages, how to combine static analysis with prospective market trends and
how to uncover patterns of market relatedness and technology relatedness. Further empirical
and methodological limitations related to the absence of a unified methodology to analyze
technology and non-technology based domains. Last, the theoretical model of general
equilibrium can be further extended and developed, on a first stage, by studying in-depth
transition dynamics and on a later stage by enlarging and updating the analysis on the evolution
of the wage premium.
In sum, we consider that the overall goal of this thesis was to contribute to bridge the gap
between practice and theory on innovation policy, proposing theoretical operational
frameworks and demonstrating their usability.