Inductive Power System for
Autonomous Underwater VehiclesTim McGinnis
University of Washington, Applied Physics Lab
Inductive Power System for
Autonomous Underwater VehiclesTim McGinnis
University of Washington, Applied Physics Lab

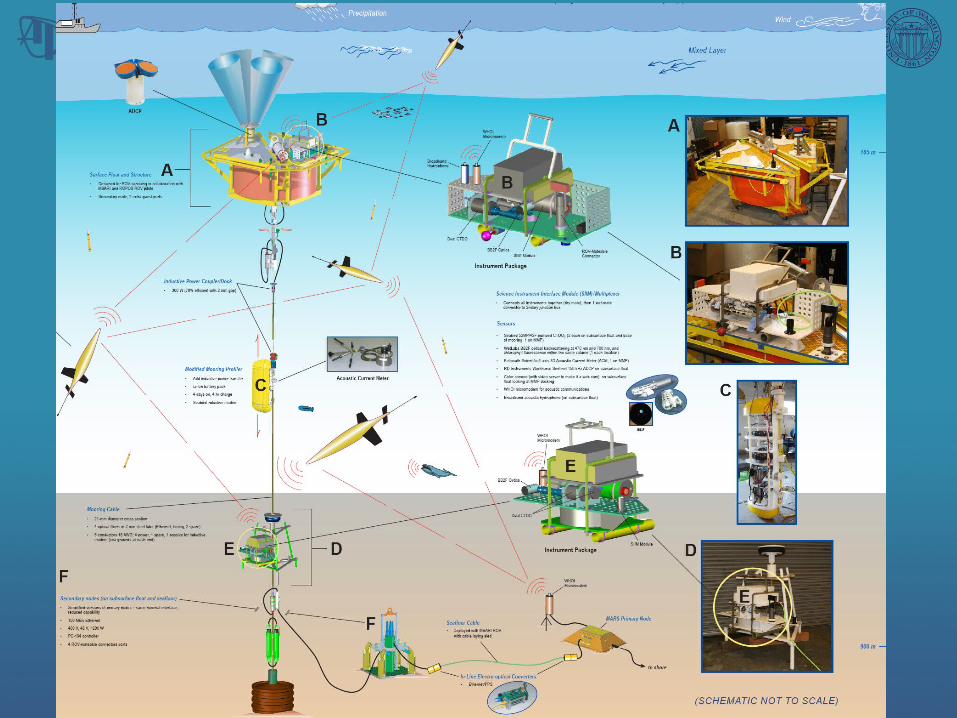
• Major Components– Seafloor Secondary Node with Sensors– Subsurface float at 200m depth with Secondary Node and Sensor Suite – Mooring profiler with sensor suite that can “dock” for inductive battery
charging– 1700m electro-optical seafloor extension cable with E-O Converters– 800m electro-optical mooring cable with E-O Converters
• Features– Cable connection provides high power and real-time communications– Mooring profiler uses inductive modem for continuous comms– MARS compatible ROV-mateable Science Connectors on Float & Seafloor
Nodes– ROV servicing and installation of sensors
• Deployments– 2007 in Puget Sound at Seahurst Observatory in 30m water depth– 2008 on MARS in 950m water depth
ALOHA-MARS Mooring Sensor Network

Inductive Power System Requirements
• Needed to transfer several hundred watts to profiler
• Could not generate enough mate/unmate force for connectors
• Preferred non-conductive technique due to conductive medium
• Decided to use inductive transfer

S&K Engineering
• Principals had worked in the Electric Vehicle (EV) industry
• Working with US Navy on underwater inductive power transfer technology

DC-HFAC Driver (in Float Pressure Housing)
HFAC-DC Rectifier (in Vehicle Pressure
Housing)
Vehicle Battery Housing
EMI Filter/Transient Protection
Input150-400Vdc
Primary SideUnderwater
Coupler
Resonant Converter
BoostRegulator
In-Rush Current
Limit
Secondary Side
UnderwaterCoupler
400Vac50kHz
Driver Side Controller
Active Rectifier
Secondary Side
Controller/Li-Ion
Battery Charger
16.4VdcLithium Battery
Pack
Loads
Voltage Regulator
12V
Block Diagram
• Powered from 375VDC from MARS Node
• Driver chops input at 50kHz
• AC signal transferred across couplers
• AC signal rectified & regulated to 16.4VDC
• Microcontroller manages Lithium-Ion charging profile

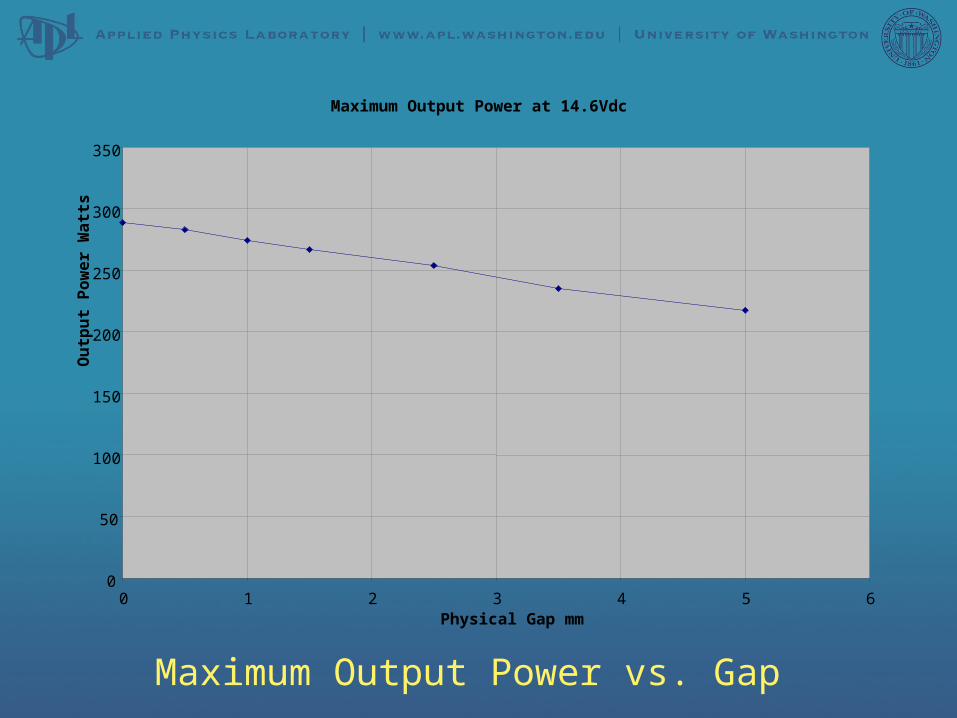
Maximum Output Power vs. Gap
Maximum Output Power at 14.6Vdc
0
50
100
150
200
250
300
350
0 1 2 3 4 5 6Physical Gap mm
Ou
tpu
t P
ow
er
Wa
tts
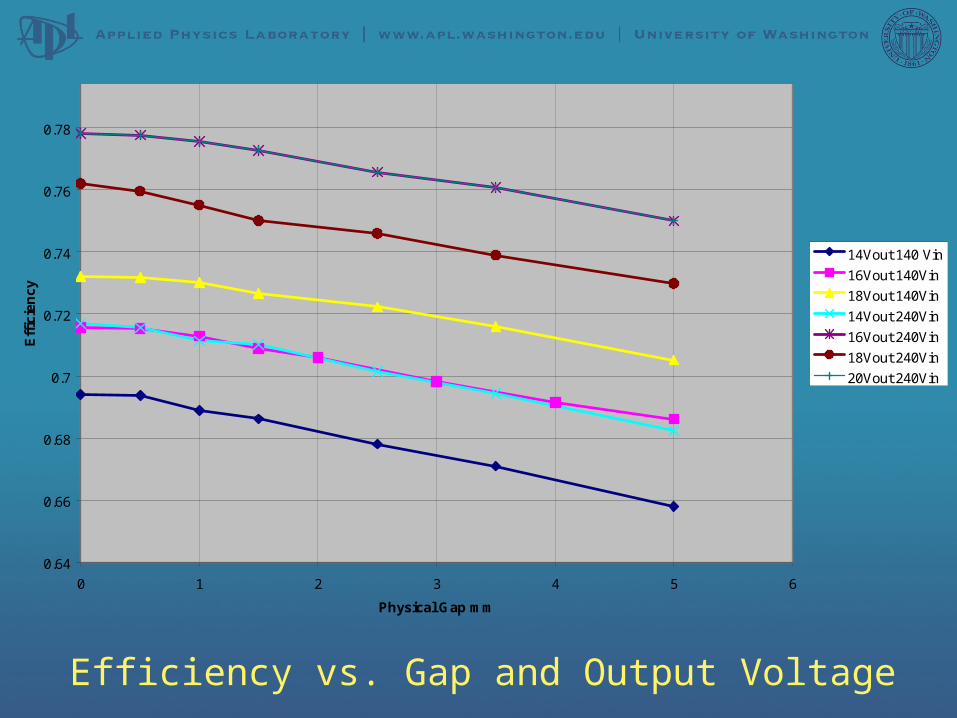
0.64
0.66
0.68
0.7
0.72
0.74
0.76
0.78
0.8
0 1 2 3 4 5 6
Physical Gap mm
Eff
icie
nc
y
14Vout 140 Vin
16Vout 140Vin
18Vout 140Vin
14Vout 240Vin
16Vout 240Vin
18Vout 240Vin
20Vout 240Vin
Efficiency vs. Gap and Output Voltage
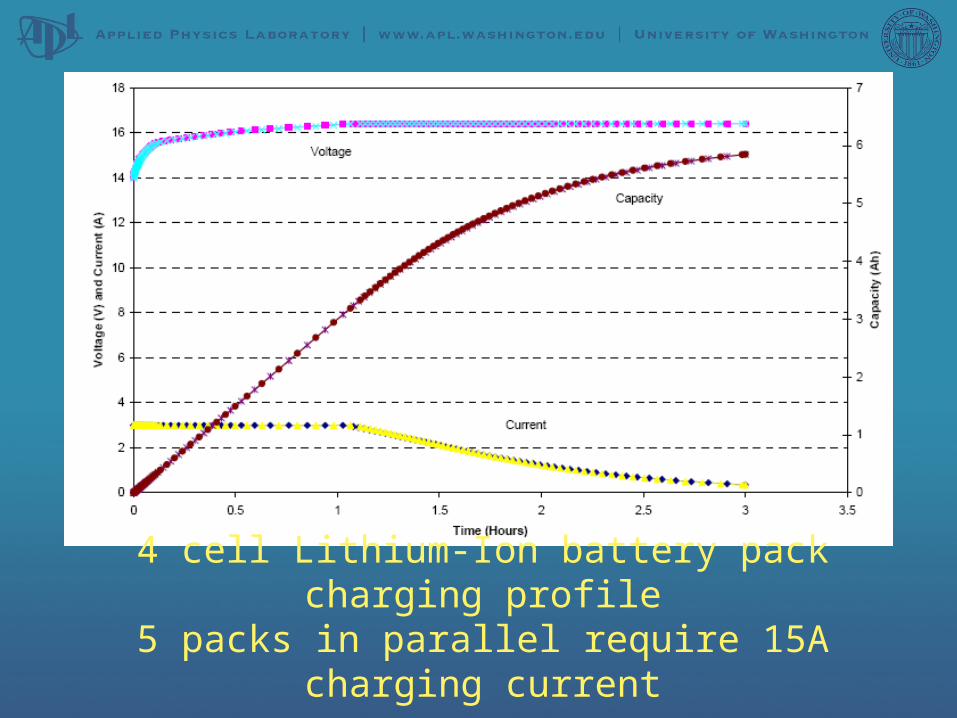
4 cell Lithium-Ion battery pack charging profile5 packs in parallel require 15A charging current

0
2
4
6
8
10
12
14
16
18
0:00
0:05
0:32
1:20
1:54
3:20
5:30
5:44
6:03
Elapsed Time
Vo
lts/
Am
ps Voltage
Current
Li-Ion Battery Charging Profile - constant current to 16.4V then constant voltage
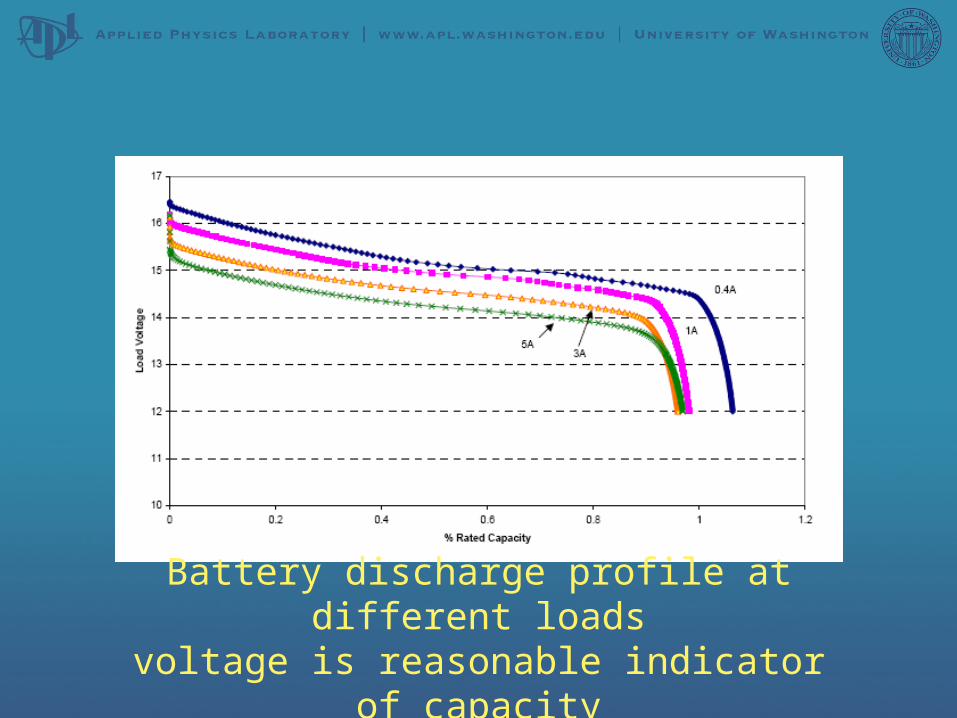
Battery discharge profile at different loadsvoltage is reasonable indicator of capacity

Vout(t)
VISEC(t)
Gate Drive
Active Rectifier
V1
ISEC
PICMicrocontrollerIout(t)
PWMLowPass Filter
+
Vout(t)
-
Iout(t)
+
--
+
Synchronous Ramp
Reference
Vout(t)
VISEC(t)
Gate Drive
Active Rectifier
V1
ISEC
PICMicrocontrollerIout(t)
PWMLowPass Filter
+
Vout(t)
-
Iout(t)
+
--
+
Synchronous Ramp
Reference

Limit switch to indicate profiler in dockSpring shock absorber

Preparing for deployment in Puget Sound

Profiler with inductive couplers (docked)
in the water

Operation
• Profiler is programmed with minimum voltage (15V) – allowing 25-30% battery capacity remaining
• When profiler detects voltage below minimum, it returns to charging dock
• IPS driver turns on every minute – if current is flowing it continues to operate, if no current it turns off
• Profiler is programmed with minimum current (3A)• When minimum current is reached, profiler
resumes profiling• IPS turns off at 1.5A to prevent over-charging if
profiler present

Results of 2 month Deployment
• Deployed June 26, 2007
• Driver FET Failure on Aug 27, 2007
• Completed 4984 profiles
• Charge interval was approximately 7-8 days
• Currently investigating reason for FET failure

Current Status
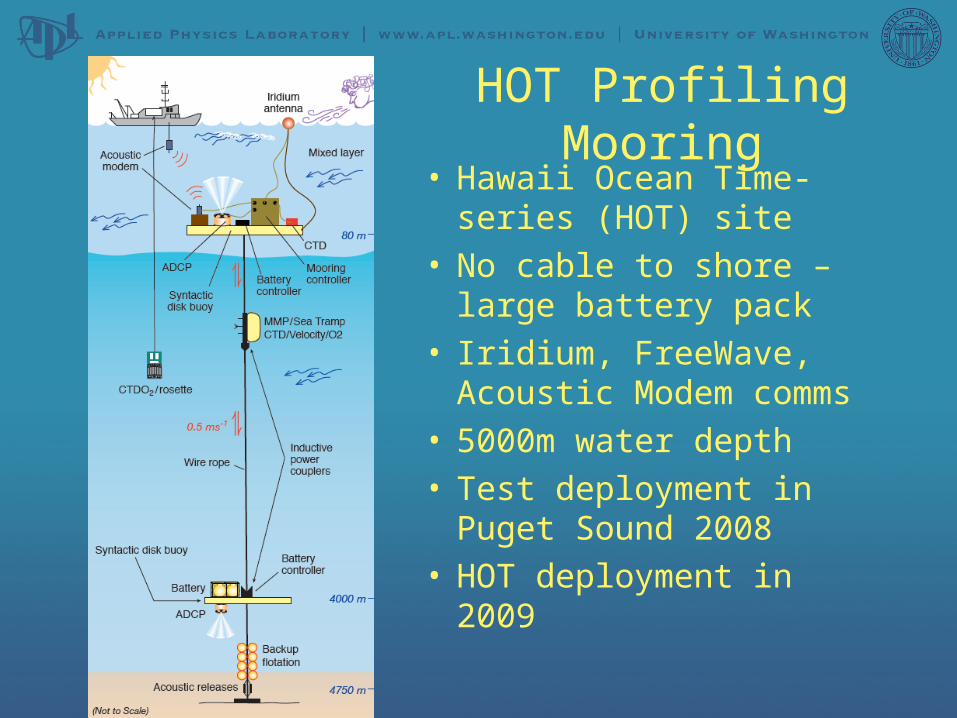
HOT Profiling Mooring• Hawaii Ocean Time-
series (HOT) site• No cable to shore –
large battery pack• Iridium, FreeWave,
Acoustic Modem comms• 5000m water depth• Test deployment in
Puget Sound 2008• HOT deployment in 2009
Future Plans
• Implement “fuel gauge” – challenging to do with multiple charge/discharge cycles
• Utilize Smart Battery Data (SBD) available over System Management Bus (SMB)
• Improve efficiency by:– Modulate switching frequency with current– Optimize gap
• Make profiler & coupler ROV removeable

Questions?