India’s External Trade during the India’s External Trade during the ‘Nineties: Some Aspects‘Nineties: Some Aspects An Analysis of Customs House and Company DataAn Analysis of Customs House and Company Data
A Project Report for theA Project Report for the Planning CommissionPlanning Commission
Institute for Studies in Industrial Development Narendra Niketan, I P Estate, New Delhi – 110 002
November 2002
iii
Contents
Page Preface (i)
Summary and Main Points (vii)
Introduction 1
Part – I
Analysis of the Customs House Data 6 o Introduction 6 o Problems of the DTR Data 11 o Changes in DTR Format 14 o Ownership Classification of Importers & Exporters 19
Section I: Analysis of the Export DTRs 22
Section II: Analysis of the Import DTRs 33
Section III: Transfer Pricing in Trade Transactions 43
Part – II
Export Performance of Non-Government Companies 70
o Exports & Imports of Sample Companies in Relation to National Aggregates 74
o Exports & Other Earnings in Foreign Currencies 76 o Ownership Category & Activity-wise Trends in
Number of Exporters 80 o Export Orientation 82 o Pattern of Expenditure in Foreign Currencies 84 o Import Intensity 92 o Ownership Category-wise Net Earnings in
Foreign Currencies 99

iv
List of Tables
Table-1 India’s External Trade 1
Table-2 Composition of India’s Exports 4
Table-3 Composition of India’s Manufactured Exports 4
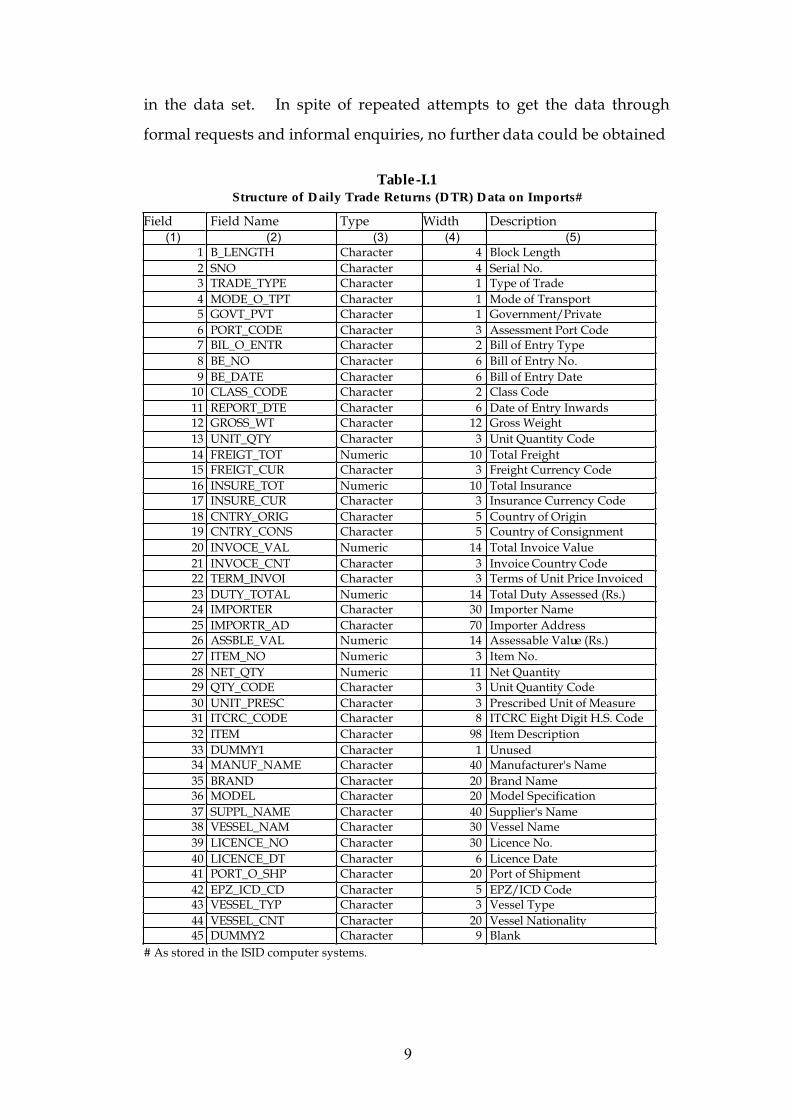
Table-I.1 Structure of Daily Trade Returns (DTR) Data on Imports 9
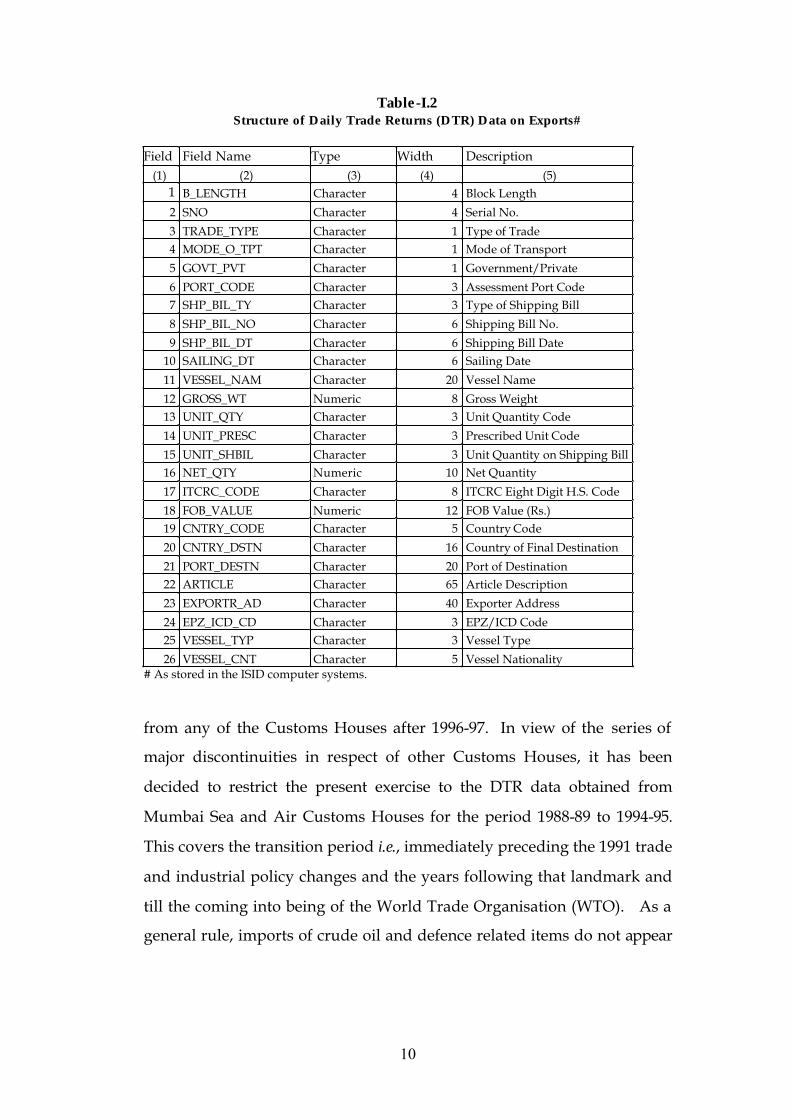
Table-I.2 Structure of Daily Trade Returns (DTR) Data on Exports 10
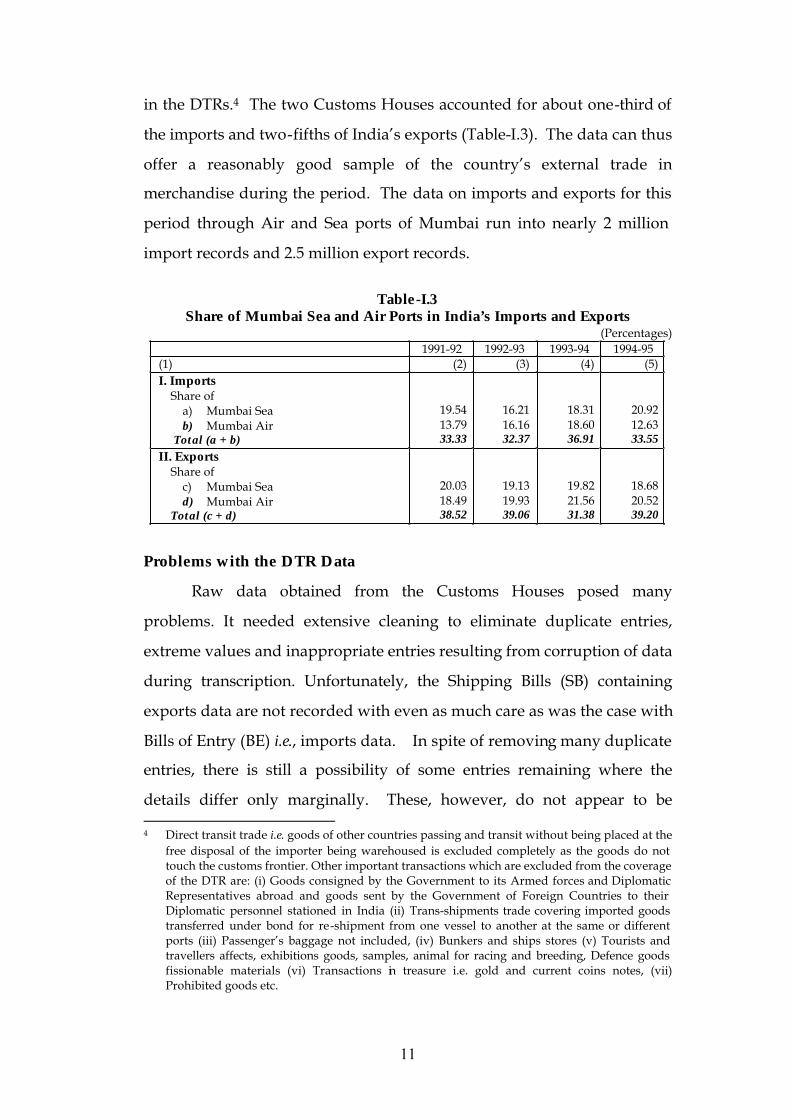
Table-I.3 Share of Mumbai Sea and Air Ports in India’s Imports and Exports 11
Table-I.4 Structure of the Revised DTRs 16
Table-I.5 Daily Trade Returns Report -- Imports : Sample Records (01-Oct-02 to 07-Oct-02) New Customs House, Mangalore 17
Table-I.6 Daily Trade Returns Report – Exports: Sample Records
(01-OCT-02 to 07-OCT-02) 18
Table-I.7 Some Basic Particulars of Export DTRs 23
Table-I.8 Distribution of Export Consignments according to their Value 24
Table-I.9 Distribution of Exporters according to Total Exports in a Year 25
Table-I.10 Ownership Category-wise Distribution of Exporters and Exports 26
Table-I.11 Distribution of Non-Government Exporters according Total Exports in a Year 27
Table-I.12 Share of Various Categories in Total Non-Government Exports according to Different Criteria 27
Table-I.13 Changes in Concentration of Export Markets in the Post-liberalisation 30
Table-I.14 Distribution of Exporters according to Number of Importing Countries and Size of the Exporter 31
Table-I.15 Distribution of Exporters according to their Initial Exports and Change in the Number of Countries Exported to 31
Table-I.16 Composition of Exports of Top 50 Houses 32
Table-1.17 Some Basic Particulars of Import DTRs 34
Table-I.18 Distribution of Import Consignments according to their Value 35
Table-I.19 Multiple Forms of Godrej & Boyce Mfg. Co. Pvt Ltd, Remaining in the Data File after Standardisation of Importer Names 37
Table-I.20 Distribution of Importers according Total Imports in a Year 39
Table-I.21 Importer Category-wise Distribution of Importers and Imports 40
Table-I.22 Size-wise Distribution of Non-Government Importers and their Imports 40
v
Table-I.23 Share of Various Categories in Total Non-Government Imports according to Different Criteria 41
Table-I.24 Indian Direct Investments Abroad 44
Table-I.25 Illustrative List of Foreign Subsidiaries and Affiliates of Indian Companies 45
Table-I.26 Shares of Different Types of Suppliers in Imports: 1994-95 49
Table I.27 Illustrative List of Foreign-Controlled Companies Importing from their Parents and Affiliates 50
Table-I.28 Top 25 Suppliers to Large House Companies and Foreign-Controlled Companies 56
Table-I.29 Showing the Relative Importance of Imports from Japan by the Affiliates of Honda, Japan 58
Table - I.30 Showing Variations in the Import Price of Mono Ethylene Glycol During Apl-Dec. 1990 (Chronological Order) 59
Table – I.31 Illustrative List of Machinery Imports with Vague Product Description 62
Table-II.1 Share of Sample Companies in National Exports and Imports 74
Table-II.2 Growth in Exports and Imports of Sample Companies 75
Table-II.3 Export Orientation and Import Intensity of Sample Companies 76
Table-II.4 Industry/Activity-wise Exports of Sample Companies 77
Table-II.5 Share of Exports in Gross Earnings in Foreign Currencies 79
Table-II.6 Sector-wise Relative Importance of Other Earnings in Foreign Currencies 80
Table-II.7 Distribution of Companies according to Export-Sales Ratio 81
Table-II.8 Company Category-wise Export Earnings of Sample Companies 83
Table-II.9 Changes in the Export Orientation of Sample Companies 83
Table-II.10 Composition of Expenditure in Foreign Currencies by different Categories of Companies 85
Table-II.11 Sector-wise Relative Importance of Expenditure other than Imports in Foreign Currencies 87
Table-II .12 Composition of Imports: Category-wise 88
Table-II.13 Exports and Imports of Adani Exports Ltd. (A Golden Super Star Trading House) 90
Table-II.14 Exports, Imports and Net Earnings in Foreign Currencies by Hind Lever Chemicals Ltd and Hindustan Lever Ltd 91
Table - II.15 Selected List of Consumer Items Marketed by MNCs and Indian Large Companies 93
Table-II.16 Changes in the Import Intensity of Sample Companies 96
vi
Table-II.17 Relative Share of Technical Collaborations in Foreign Collaboration Approvals 98
Table-II.18 Earnings and Expenditure in Foreign Currencies by different Categories of Companies 101
Table-II.19 Product Group/Activity-wise and Ownership Category-wise Ratio of Exports to Import: 2000-01 102
Table-II.20 Sector-wise Earnings, Expenditure and Net Earnings in Foreign Currencies 103
Graphs Graph-II.1 Annual Growth Rates of Exports and Imports 75
Graph-II.2 Export Orientation of Sample Companies 84
Graph-II.3A Broad Composition of Imports: 1995-96 89
Graph-II.3B Broad Composition of Imports: 2000-01 89
Graph-II.4 Share of Finished Goods in Imports 97
Graph-II.5 Approval of Technical Collaborations since 1991 99

i
Preface
External trade statistics, as are generally available, have limited use
in examining many a theoretical and policy assumption as they do not take note of the exporters and importers, the real actors. Due to the trading house activity and the extensive diversification, company level data too can be less revealing with regard to the role of different types of trading parties. In this respect the Customs House data which relates the enterprise with the products imported and exported provides an effective alternative. Very few attempts, if any, have been made, especially by non-official agencies, to tap this vast reservoir of data to understand the country's external trade. Apart from the massive size of the data which runs into millions of data records (as it includes every transaction conducted through the ports, with some exceptions), lack of appropriate computing facilities, extensive additional information required on the trading parties to make the analysis meaningful and above all confidentiality sought to be maintained by the authorities have been probably responsible for this situation.
Way back in 1990-91, the Institute took the initiative and mobilised support from official sources to get the Customs House data captured in Daily Trade Returns (DTR). The Institute analysed the DTR data in the context of the serious foreign exchange crisis faced by the country and submitted a report to the Ministry of Finance. The study made a number of policy relevant observations and offered suggestions for improving the database. Having noticed the shoddy manner in which the data, especially about the trading parties, was being entered in the DTRs, it was suggested that an Importer-Exporter Code (IEC) should be made part of the DTRs so that the data could be analysed quickly and accurately. Another important recommendation was about having some minimum details on the trading parties. It is heartening to find that these suggestions have been incorporated into the data system, even if belatedly and partially.
The present project was proposed with a view to bring out the changes at the trading party level during the 'nineties, using both DTRs and Company data, in the context of the drastic changes made in the country's trade and investment policy regime. The Institute had earlier obtained DTR data on payment from various Customs Houses for the period 1988-89 to 1994-95. The project was taken up with the clear understanding that the Planning Commission would facilitate obtaining of the more recent data as also help fill the gaps free of charge. The Customs Houses, however, expressed their inability to share the data in full DTR form and that too without charge as also to supply data for the prior years. In view of this, the exercise had to be restricted to the data already available with the Institute. It was, therefore, unavoidable to limit the exercise both in terms of the period covered and the lines of inquiry. To
ii
make the study contemporary, more emphasis was, therefore, placed on an analysis of the trends and patterns in exports, imports and net earnings in foreign currencies of more than 2,000 non-government public limited companies.
Given the massive amount of data and its poor state, especially with respect to the names of exporters and importers, the very focus of the study, considerable time and efforts had been put in first to standardise the data and then to identify the trading parties according to their affiliation to Large Industrial Houses and transnational corporations. The extensive information system and other research infrastructure developed and maintained by the Institute with emphasis on corporate sector in general and the individual company as the unit of observation in particular, provided the necessary conditions for undertaking a study of this magnitude.
It should be underlined that by the very nature of the study, names of a few industrial houses, companies and individuals had to be mentioned in the study without which it would be difficult to fully comprehend the various phenomena. It is neither the intention of the researchers or the policy of the Institute to impute any motives to or adoption of unjustifiable practices by any company or individual.
We wish to place on record our deep appreciation of the support extended by Dr. S.P. Gupta, Member, Planning Commission; Dr. O.P. Sharma, Economic Advisor; and Shri P.N. Nigam, Deputy Advisor, Planning Commission for their constant encouragement and support. New Delhi S.K. Goyal November 15, 2002 Director

vii
Summary and Main Points
Part I : Analysis of Customs House Data
1. The study presents an account of India's imports and exports through Mumbai Air and Sea ports during the seven years 1988-89 to 1994-95. The primary source of data is the Daily Trade Returns (DTRs) compiled by the Custom Houses. Basic units of the compilations are the 'importer' and the 'exporter'. DTR data is uniquely suitable for understanding the behaviour of individual importers and exporters.
2. Though there are a large number of exporters, only a few account for a substantial portion of the exports. Existence of exporter-wise concentration can be seen from that fact that in each of the years, about 3 per cent of the exporters, numbering less than one thousand, accounted for two-thirds of the exports. (Table-I.9)
3. Top 100 Indian houses and foreign-controlled companies (FCCs) had a share of a little more than one-fourth of the total exports in 1988-89 While the share of top Indian houses in total exports improved somewhat during the latter years. The share of FCCs continued to decline. As a result, the combined share of top houses and FCCs fell to less than 15 per cent by 1994-95. (Table-I.12)
4. An examination of the export markets and their shares in individual exporter’s exports revealed that larger exporters diversified more compared to the smaller ones as in nearly two-thirds of the cases the concentration index declined. Thus, while there was two-way movement in the concentration indices, larger exporters tended to either find new markets or their exports tended to become more evenly distributed among the importing countries. Comparatively, more of the top 50 house companies diversified their export markets. (Table-I.13)
5. The group of smallest exporters (measured in terms of their exports) has the largest proportion of cases where there was no change in the concentration index. Additionally, concentration increased in a comparatively larger proportion of smaller exporters. Proportion of such companies is the highest in case of non-large house, non-FCC categories. Comparatively more Large House companies and FCCs diversified their export markets. (Table-I.13)
6. Except in the highest bracket of companies exporting to 20 countries or more, there has been an overall decline in the number of companies exporting to 3 or more countries. This shows that it was only those who were already well diversified might have diversified their export markets further while the remaining tried to focus on fewer markets. While at the aggregate level there were fewer companies which
viii
increased the number of countries they were exporting to, proportion of such cases is the highest in case of the largest exporters. (Table-I.14)
7. Overall, in the new regime, the largest exporters seem to have diversified their markets more as also sought to spread the exports more evenly among the countries. The smaller ones in general seem to have tried to focus on fewer markets. (Table-I.15)
8. In case of the largest 50 Indian Houses, the top product groups remained the same during the pre- and post-liberalisation periods. There were, however, substantial changes in the inter se ranking of the product groups. While textiles continued to be the topmost export earner, its share declined substantially. Share of the machinery group also declined. On the other hand, considerable gains have been made by the metals group. (Table-I.16)
9. A distribution of the import consignments shows high degree of skewness. Thus even if the consignments worth US$ 10,000 or less are ignored which account for more than half of the total number of consignments, one would be covering over 90 per cent of the value of imports. This has significance from the point of monitoring import trade.
(Table-I.18)
10. Unlike the distribution pattern of exports, small-sized consignments held a relatively smaller share in the overall imports. The pattern of exports is noticeably different when compared to the pattern of imports.
11. The number of Indian public sector organisations engaged in imports was quite small but their share in imports value was substantial. In 1988-89 their share in imports was a little above 30 per cent. Over the years, however, share of the sector declined and towards the end fell to almost half of the initial value. Correspondingly, the private sector’s share increased and reached about 84 per cent by the end of the period.
(Table-I.21)
12. During 1988-89, the top 2,000 importers with at least US$0.25 million or more of imports each accounted for 83 per cent of the Indian imports by the private sector through the two major Customs Houses. In the subsequent years, though the numbers varied, their share continued to be high and ranged between 82 and 86 per cent. (Table-I.22)
13. Within the non-government importers, Indian importers have a substantial and growing share. On the whole, all the three sub-categories of non-government Indian importers increased their shares. That of foreign controlled companies, however, increased in the initial years, but declined towards the end. (Table-I.23)
14. One factor that seems to be responsible for the changes in relative shares in imports of Indian companies and FCCs is that the national industrial policy was liberalised making many private sector enterprises to enter

ix
and expand in areas that were hitherto reserved for the public sector. A second relevant factor is that the booming stock market enabled many non-house entities and non-FCCs to take up large projects. This happened especially in the metals industry requiring heavy investments. Thus among the top 50 importers in 1993-94 and 1994-95, as many as 12 belonged to basic metal industries.
15. While the problem of transfer pricing has been known for a long time, India started developing a proper system to monitor transfer pricing transactions only recently. In the context of growing investments by Indian companies abroad and the increased role of FDI in the domestic economy, the avenues for transfer pricing are increasing substantially.
16. International trade is known to be dominated by inter-branch transactions and supplies being routed through close business associates. The DTR data provides evidence to show the existence of a large area where transfer pricing is in operation. (Table-I.27)
17. It is pertinent to note that the share of parents and affiliates is the highest for foreign-controlled companies as they procured at least one-third of their total imports from such entities. In case of the Indian top houses too, the share of their foreign subsidiaries and affiliates as also technology suppliers was substantial at about 10 per cent. Interestingly, supplies by trading companies formed a major portion (nearly one-fourth) of imports of Indian large houses. (Table-I.26)
18. The importance of trading companies in imports can be seen from the fact that out of the top 25 suppliers for the large house companies and FCCs, the top five are trading companies. Out of the remaining 20 another 10 can be termed as trading companies. Since trading companies could be tools for masking related party transactions, their role should be monitored closely. (Table-I.28)
19. More direct and recent evidence confirms the extensive practice of inter-branch transactions by TNCs. For instance, Asea Brown Boveri Ltd reported that it transacted, in addition to the holding company, with as many as 136 fellow subsidiaries during 2001. It does appear that the fellow subsidiaries accounted for as much as 83 per cent of imports of raw materials and components. Similarly, in case of Ingersoll Rand (I) Ltd and Gillette India too transactions with such companies accounted for bulk of their imports and exports.
20. Detailed product specification, model, brand name, and availability of manufacturer's name in the DTR would go a long way in facilitating such exercises. Unfortunately, products are reported in vague terms and in varying and unlikely units of measurements. For instance, Reliance group is reported to have imported 'Machinery being capital goods' which was of certain KGs in weight. These are not small consignments but are valued at crores of rupees. Given the vague product description, and the tendency on part of TNCs to exploit transfer pricing mechanism,

x
it would be extremely difficult to detect abnormal pricing in such transactions. (Table-I.29)
21. For corporates there are a number of avenues for taking advantage of transfer pricing. Out of the total foreign exchange expended by a company a large proportion is spent on import of materials, capital goods, spare parts, etc. Leaving aside dividend payouts, payments for technology, interest paid on loans received, interest charged on loans advanced, issue of shares, etc. too can carry an element of transfer pricing.
22. Exports and imports together accounted for about four-fifth’s of the total transactions in foreign currencies in 2000-01 of the sample companies. This indicates the important role Customs Houses can play in detecting transfer pricing and ensuring that transactions are made at arms-length prices thus ensuring on one hand no loss of revenue for the exchequer and on the other no undue loss of foreign exchange for the economy.
23. For detecting transfer pricing, the checking at customs houses should be thorough. Customs Houses are better placed because these can make immediate and direct comparisons with similar other transactions. It would prove useful to have international market intelligence and a good sample of large shipments, which could be used to regularly enquire into transactions between closely associated companies.
24. In curbing transfer pricing abuses DTRs could be an indispensable means. The heavy concentration observed both in exports and imports in terms of the trading parties underlines the relevance of focussing on the large companies to begin with for a meaningful monitoring of the transfer pricing phenomenon.
25. Presently, at the Customs, the emphasis is on imports. While the Commissioner of Customs can make a reference to the Special Valuation Branch (SVB) regarding the valuation on account of special relationship, even if the same is not disclosed by the importer, the procedure appears to be essentially of a voluntary disclosure nature. Further, with the emphasis being on collection of customs duties, the possibility of over-invoicing of imports could attract little attention. In fact, the cases reported by the Chennai SVB contain cases of additional loading to the invoice value and not any subtraction from it.
26. The emphasis on imports could be due to their implications for collection of customs duties. In case of exports, the maximum the Customs authorities might be concerned with are over-invoicing for its implications for drawback payment and possibly for meeting export obligations. On the other hand, there is considerable scope for under-invoicing in exports especially in case of TNCs’ dealing with their parents and affiliates. This aspect needs a careful consideration.
xi
27. Given the trends in globalisation of the Indian economy, many Indian parties qualify to be termed as TNCs and many others would have related parties in other countries. Being the first entry/final exit points for goods it is important that transfer pricing should be dealt with at the level of customs which could make the task of the other agencies involved lighter.
28. Introduction of Importer-Exporter Code (IE Code) is a welcome improvement. While a few other improvements have been also made, some useful information has been taken away from the purview of the Import DTR. The most significant fields that have been left out are the duty levied and the names of suppliers and manufacturers. In the interest of transparency, the scope of DTR should be expanded to include names of the manufacturer/supplier in case of imports and names of the final consignee in case of exports.
PART – II : Export Performance of Non-Government Companies
1. This part of the study sought to examine the export-orientation, import-intensity and the ability to earn foreign exchange by 2,147 non-government non-financial public limited companies during 1995-96 to 2000-01. The sample companies accounted for nearly 42 per cent of the paid-up capital of corresponding non-government companies. Their share in national exports was about one-fourth and in imports the share was from about 29 per cent in the first year which fell to 23 per cent by the end of the period. (Table-II.1)
2. In a period of overall slow down in the growth of national exports, the sample private sector companies comprising many large companies could not reverse the trend in any significant manner. In fact, year-to-year increases indicate that exports of sample companies grew slower than the national exports in the last three years. (Table-II.2)
3. The exports-sales ratio of the sample companies fluctuated more than the imports-sales ratio, and since the exports-sales ratio was only about 10 per cent, it does appear that imports are related more with production meant for domestic sales rather than for export purposes. (Table-II.3)
4. Companies’ ability to earn net foreign exchange is not limited to exports only and can extend to receipt of dividends, interest, consultancy and know-how fee, commissions, insurance claims, etc. At the aggregate, such other earnings in foreign currencies are gaining importance. One-third of total earnings in foreign currencies of companies belonging to smaller houses and one-fourth that of other Indian companies is accounted by the other earnings. On the other hand, share of exports in total earnings in

xii
foreign currencies declined for the largest houses and FCCs. In case of FCCs the decline was, however, less marked. (Table-II.5)
5. Other earnings are, however, more related to sectoral characteristics rather than ownership groupings. Their share in total earnings of Service sector companies increased substantially during the period from 38 to 63 per cent of the gross earnings. For the manufacturing companies the increase was only marginal. In case of Primary sector, the ratio indeed declined. (Table-II.6)
6. There are more companies in the higher ranges of the exports-sales ratio in 2000-01 compared to 1995-96. However, the number of exporters remained static during the period. Nearly 40 per cent of the companies are not in export trade or the exports of these companies are negligible compared to their sales. In all only 946 companies, or about 45 per cent of the total, exported in all the six years. These, however, accounted for 90 per cent of the total exports in 2000-01. (Table-II.7)
7. Increase in overall exports during the period was due to the largest Houses and other Indian companies (OICs). In terms of export orientation, OICs fared the best. Interestingly, exports of FCCs increased the slowest and their exports-sales ratio indeed declined at the aggregate level. (Tables II.8 & II.9)
8. Share of imports of goods in total expenditure in foreign currencies declined. Share of payments for technology also declined giving credence to the view that Indian companies may be finding it difficult to gain arms-length access to technology or they are more into commodities which generally do not require imported technology. In the new regime, after an initial spurt, approvals for technical collaborations declined both in absolute and relative terms. An increasing proportion of technical collaborations are approved through the automatic route. (Tables-II.10 & Table-14)
9. Interest payments in case of large Indian companies and dividend payments together with royalty payments in case of FCCs constituted other important identifiable items of expenditure in foreign currencies. (Table-II.10)
10. Once again, such shares are high for Service sector companies. While for companies belonging to the Manufacturing sector the increase was marginal, in case of Primary sector, the share declined considerably. There is a possibility of other expenditure being related to other earnings in foreign currencies. (Table-II.11)
11. The composition of imports too is undergoing substantial changes. An increasing proportion of imports are related to raw materials, stores and spares. On the other hand, share of capital goods fell quite steeply. While falling share imports of capital goods may be
xiii
a reflection of the slowing down of the economy, the fast increasing imports especially of raw materials may be reflecting the long term dependence on imported intermediate inputs by Indian large House companies. (Table-II.12)
12. There has been a marginal decline in the import intensity of the sample companies when seen in terms of the ratio of total imports to net sales. Given the fact that finished goods have become an important component of imports and companies are also trading in locally manufactured products and commodities, it would be more appropriate to compare imports with sales of own manufactures. Seen in this manner, the largest group of Indian companies (T1) shows an increasing dependence on imported raw materials. There are, however, no clear patterns in case of other Indian companies. In case of FCCs too, the ratio did not show any clear pattern. (Table-II.13)
13. Import of finished goods, possibly for re-sale in the domestic market is gaining prominence. Share of imported finished goods in total imports was high in case of foreign-controlled companies. In their case, share of finished goods in total imports increased from 5 per cent in 1995-96 to 13 per cent in 2000-01. In case of other Indian companies too, finished goods in general claimed an increasing share. In view of the high shares of traded sales to manufacturing sales and of finished goods in total imports, it does appear that FCCs are increasingly resorting to imports of finished goods and traded items rather than increasing imports for local production purposes. (Table-II.16)
14. At the aggregate level, net outgo in foreign currencies declined substantially. Companies belonging to the largest Indian Business Houses, however, account for a major portion of the net outgo of foreign exchange. Total expenditure in their case exceeded the earnings in all the years. Net earnings improved substantially in case of companies of smaller houses and remained stable in case of FCCs. Other Indian companies even turned net earners of foreign exchange. But for the fact that the other Indian companies improved their foreign-exchange earning capacity, the overall deficit would have been substantially higher. (Table-II.18)
15. Slightly more than nine-tenths of the sample companies’ imports are met by their exports. The coverage was, however, the lowest for FCCs at about three-fourths. Non-large house Indian companies performed the best among all the categories of companies. In most industry groups, domestic companies, especially the non-large house companies, displayed better exports-imports ratio. In some product groups, where FCCs displayed above average ratios, it appears that such better performance could be due to large trading houses dealing diversified products including commodities. (Table-II.19)

xiv
16. A substantial part of the net earnings is contributed by the Services sector comprising essentially of trading companies, hotels & restaurants and computer software companies. Net earnings of the Manufacturing sector also improved as the imports remained stable while exports increased. The Primary sector did record increasing deficits mainly because of companies in the petroleum refining and lubricants. (Table-II.20)
17. While the results seem to suggest the importance of industry attributes compared to ownership characteristics, even the industry classification of companies could become irrelevant when the Trading House phenomenon of companies is taken into consideration. About 100 Trading Houses accounted for more than half of the total exports of the sample companies in 2000-01. While at the aggregate level net deficit was about R. 2,100 crores, these Trading Houses reported a surplus of Rs. 7,600 crores. Since Trading Houses cut across industry and ownership groups, it emphasises the need for more caution in interpreting company level export performance and net foreign exchange earnings.
18. The cases of Adani Exports and the HLL group, however, raise serious questions about the apparent benefits in terms of net foreign exchange earnings through Export and Trading Houses.
19. Overall, Indian private sector companies do not seem to have become more export-oriented during the second half of the ‘nineties. The relative improvement in net earnings is possibly due to the Trading House activity, improved earnings from Service enterprises, and lower import intensity.
20. The fact that import of finished goods are gaining importance, especially for FCCs, needs to be underlined. On the face of it, import liberalisation could be responsible for this development.
21. Also, exports of FCCs grew the slowest and there was no appreciable improvement in their export-orientation. Indeed, except for a few branches of industry, where exports exceeded imports considerably, in all the industries, especially many chemical and engineering industries, FCCs were not meeting their imports through exports in spite of the presence of a few large Trading Houses among them. This phenomenon needs to be looked at carefully in view of the envisaged enhanced role of FDI in the Indian economy.
1
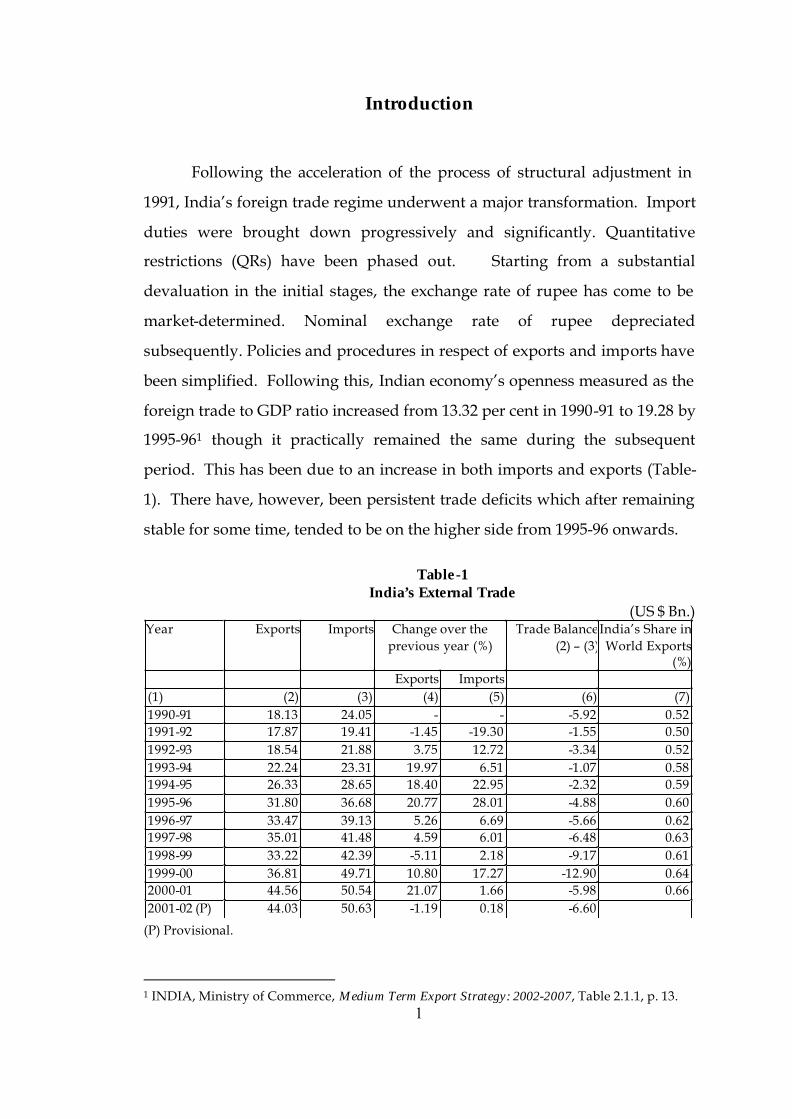
Introduction
Following the acceleration of the process of structural adjustment in
1991, India’s foreign trade regime underwent a major transformation. Import
duties were brought down progressively and significantly. Quantitative
restrictions (QRs) have been phased out. Starting from a substantial
devaluation in the initial stages, the exchange rate of rupee has come to be
market-determined. Nominal exchange rate of rupee depreciated
subsequently. Policies and procedures in respect of exports and imports have
been simplified. Following this, Indian economy’s openness measured as the
foreign trade to GDP ratio increased from 13.32 per cent in 1990-91 to 19.28 by
1995-961 though it practically remained the same during the subsequent
period. This has been due to an increase in both imports and exports (Table-
1). There have, however, been persistent trade deficits which after remaining
stable for some time, tended to be on the higher side from 1995-96 onwards.
Table-1
India’s External Trade (US $ Bn.)
(P) Provisional.
1 INDIA, Ministry of Commerce, Medium Term Export Strategy: 2002-2007, Table 2.1.1, p. 13.
Year Exports Imports Change over the previous year (%)
Trade Balance(2) – (3)
India’s Share in World Exports
(%) Exports Imports (1) (2) (3) (4) (5) (6) (7) 1990-91 18.13 24.05 - - -5.92 0.52 1991-92 17.87 19.41 -1.45 -19.30 -1.55 0.50 1992-93 18.54 21.88 3.75 12.72 -3.34 0.52 1993-94 22.24 23.31 19.97 6.51 -1.07 0.58 1994-95 26.33 28.65 18.40 22.95 -2.32 0.59 1995-96 31.80 36.68 20.77 28.01 -4.88 0.60 1996-97 33.47 39.13 5.26 6.69 -5.66 0.62 1997-98 35.01 41.48 4.59 6.01 -6.48 0.63 1998-99 33.22 42.39 -5.11 2.18 -9.17 0.61 1999-00 36.81 49.71 10.80 17.27 -12.90 0.64 2000-01 44.56 50.54 21.07 1.66 -5.98 0.66 2001-02 (P) 44.03 50.63 -1.19 0.18 -6.60
2
The demand for imports is bound to increase due to the envisaged
growth of the economy – raw materials, capital goods, components and
energy. The opening up of import of a variety of consumer goods is also
likely to add to the import basket. India has been also periodically required
to depend on external sources for certain mass consumption items like edible
oils. Since the increase in imports noted above could have been due to
relaxation of the import regime, and thus has been on the expected lines, and
also because the commitments under WTO make the import policies virtually
irreversible, the trade gap could only be dealt with by increasing India’s
exports. Thus to sustain a higher rate of growth while keeping the current
account deficits under control and to make Indian industry competitive, it is
imperative to increase the country’s exports at a fast pace. The emphasis on
increasing India’s exports could be seen from the fact that The Medium Term
Export Strategy 2002-2007 envisages a near doubling of India’s exports to
US$ 80 bn. by the end of the period which implies a compound annual
growth rate of nearly 12 per cent.2
During the ‘nineties, global capital flows have been dominated by
private sector sources and are characterised by increasing share of non-debt
creating flows. India has been no exception. Coincidentally, sources of direct
and indirect external funding for the corporate sector got diversified. This in
turn implies the shifting of repayment and service obligation from
government to the enterprises. Consequently, it should be expected that
foreign exchange outgo on account of dividend outgo, capital appreciation,
interest payment, etc. would increase. Due to persistent current account
deficits, borrowings and portfolio capital flows contributed significantly to
India’s foreign exchange reserves. Thus, even from this point, faster increase
in exports is unavoidable.
India’s exports grew substantially during the ‘nineties whether seen in
terms of absolute values or relative to the GDP or seen in the world’s context
(Table-2). Since the introduction of new economic policies, India’s exports 2 INDIA, Ministry of Commerce & Industry, Medium Term Export Strategy: 2002-2007,
January 2002, p. 11.
3
have risen from US$ 18 billion in 1991-92 to US$ 44 billion in 2000-02. The
export growth, however, has been quite uneven. While during 1993-94, 1994-
95 and 1995-96 it recorded impressive gains, the annual growth rates fell
sharply in 1996-97 and turned negative in 1998-99. Once again, exports staged
substantial recovery in 1999-00 and 2000-01.
The process has been accompanied by a change in the composition of
India’s exports with an increase in the share of manufactured items and a
diversification of exports. The share of manufactured goods in the total
exports of India increased from 75 per cent in 1991-92 to 79 per cent in 2000-
01. Share of agricultural and allied products declined from 18 per cent in
1991-92 to 13 per cent in 2000-01. Similar is the case with ores and minerals.
Within the manufactured products too significant changes took place (Table-3).
Liberalisation of the foreign trade regime has been accompanied by a
transformation of industrial policies. While industrial licensing has been
abolished practically, the obligation to seek permission under the MRTP Act
has been dispensed with. The climate for restructuring of industrial
enterprises is now more favourable as mergers and acquisitions are decided
by the enterprises themselves instead of being influenced by official
approvals. Another major related development has been the relaxation on
import of technology. Enterprises have thus the freedom to decide on the
scale, technology as also the composition of their production basket. On the
other hand, Indian enterprises are now more exposed to competition both
from within and outside. This is likely to have driven them to improve
quality, productivity and service. These developments should therefore have
forced them to seek external markets on the one hand and make them better
equipped to engage in export trade on the other. While export-orientation is
important by itself, a more relevant measure of a company’s contribution in
the context of a country like India with persistent balance of payments
deficits, is the net earnings of foreign exchange by the enterprises. In the past,
large Indian companies are known to be net spenders of foreign exchange. It
is of importance to know how this position has changed in the new regime.

4
Table-2 Composition of India’s Exports
(Amount in US $ Million) Average Exports Share in Total (%) Increase
(4) – (2) 1988-89
to 1990-91
1993-94 to 1995-96
1998-99 to 2000-01
Col. (2) Col. (3) Col.(4) (4) – (2)
Share increase
(%)
(1) (2) (3) (4) (5) (6) (7) (8) (9) I. Primary Products 3816.57 5795.67 6870.93 23.50 21.64 17.99 3054.37 13.91 A. Agriculture and Allied Products 2874.80 4778.50 5881.77 17.70 17.84 15.40 3006.97 13.69 B. Ores and Minerals 941.80 1017.13 989.17 5.80 3.80 2.59 47.37 0.22II. Manufactured Goods 11692.77 20269.37 30005.67 71.99 75.67 78.55 18312.90 83.40III. Petroleum Products 429.93 422.80 666.00 2.65 1.58 1.74 236.07 1.08IV. Others 303.43 382.10 657.87 1.87 1.43 1.72 354.43 1.61
Total Exports 16242.70 26787.90 38200.47 100.00 100.00 100.00 21957.77 100.00Based on data provided in RBI, Handbook of Statistics on Indian Economy - 2001.
Table-3 Composition of India’s Manufactured Exports
(Amount in US $ Million) Average Exports Share in Total (%) 1988-89
to 1990-91
1993-94 to 1995-96
1998-99 to 2000-01
Col. (2) Col. (3) Col.(4) Increase (4) – (2)
Share increase (%)
(1) (2) (3) (4) (5) (6) (7) (8) (9) Manufactured Goods
1 Leather and Manufactures 1223.90 1554.10 1734.13 10.47 7.67 5.78 510.23 2.79
2 Chemicals and Allied Products 1103.63 1930.77 3450.27 9.44 9.53 11.50 2346.63 12.81
a) Drugs, Pharmaceutical & Fine Chemicals 467.53 819.93 1688.80 4.00 4.05 5.63 1221.27 6.67
b) Others 636.10 1110.83 1761.47 5.44 5.48 5.87 1125.37 6.15
3 Plastic and Linoleum Products 94.47 466.53 661.50 0.81 2.30 2.20 567.03 3.10
4 Rubber, Glass, Paints, Enamels and Products
255.00 594.90 739.67 2.18 2.93 2.47 484.67 2.65
5 Engineering Goods 1949.80 3645.70 5492.60 16.68 17.99 18.31 3542.80 19.35
6 Readymade Garments 1875.13 3181.23 4901.80 16.04 15.69 16.34 3026.67 16.53
7 Textile Yarn, Fabrics, Made-ups, etc., 1275.77 2902.60 4281.47 10.91 14.32 14.27 3005.70 16.41
a) Cotton Yarn, Fabrics, Made-ups, etc., 957.67 2115.83 3120.37 8.19 10.44 10.40 2162.70 11.81
b) Natural Silk Yarn, Fabrics, Made-ups, etc.,
127.37 132.20 241.67 1.09 0.65 0.81 114.30 0.62
c) Others 190.73 654.57 919.40 1.63 3.23 3.06 728.67 3.98
8 Jute Manufactures 168.33 153.43 155.90 1.44 0.76 0.52 -12.43 -0.07
9 Coir and Manufactures 24.50 53.10 56.53 0.21 0.26 0.19 32.03 0.17
10 Handicrafts 3555.37 5408.50 8048.80 30.41 26.68 26.82 4493.43 24.54
a) Gems and Jewellery 3045.87 4590.33 6940.53 26.05 22.65 23.13 3894.67 21.27
b) Carpets ( Handmade excl. Silk ) 291.97 438.57 451.57 2.50 2.16 1.50 159.60 0.87
c) Works of Art ( excl. Floor Coverings ) 217.57 379.57 656.67 1.86 1.87 2.19 439.10 2.40
11 Sports Goods 49.47 61.33 69.70 0.42 0.30 0.23 20.23 0.11
12 Others 117.40 317.20 413.27 1.00 1.56 1.38 295.87 1.62
Total 11692.77 20269.37 30005.67 100.00 100.00 100.00 18312.90 100.00
Based on data provided in RBI, Handbook of Statistics on Indian Economy - 2001.

5
The present study attempts to examine some of the issues relating to
India’s external trade emanating from the brief description of the changes in
the policy regime presented above. With the growing importance of the
`firm' in understanding trade performance of countries, the proposed study,
with its emphasis on individual importers and exporters, would help in a
better understanding of the role and place of different categories of traders in
India's external trade.
The study comprises of two main parts. An analysis of Customs
House data for the period 1988-89 to 1994-95 which seeks to bring out the
changes in concentration in imports and exports, contribution of different
categories of exporters to India’s exports and their corresponding share in
imports with emphasis on the role of large companies and transnational
corporations forms the first part. The opening up of the economy has
necessitated introduction of measures to minimise the negative impact of the
phenomenon of transfer pricing. In this context, Part One of the study also
seeks to offer relevant empirical evidence and useful suggestions based on an
analysis of the DTR data. Part Two consists of a study of the transactions in
foreign currencies of more than 2,000 non-government companies during
1995-96 to 2000-01. Thus while the first part ends in 1994-95, the second starts
with 1995-96. Though this was necessitated for reasons of data availability,
the dividing line has its own significance because of the coming into effect of
the WTO agreement from 1995.

6
Part – I
Analysis of Customs House Data
Introduction
A number of studies sought to examine the role and place of
different types of entities in India’s external trade using company level
data1 because studies based on industry and product level data do not
explicitly incorporate information about the units, i.e., the real operational
entities. On the other hand, due to diversification and export house
activities of the companies, company-level studies may not always offer a
clear-cut industry dimension.2 Daily Trade Returns data (DTR), captured
by the Customs Houses through which the actual export and import
transactions take place, help add an important dimension to the study of
external trade as it provides data at unit and transaction levels. An
attempt, possibly the first of its kind in India, was made by the Institute
for Studies in Industrial Development (ISID) in 1990-91 to analyse DTR
data in the context of the serious foreign exchange crisis faced by the
country.3
Little direct evidence is available about the extent of participation
by Large Houses and foreign-controlled companies in India’s external
trade. Similar is the case with the role of governmental departments,
1 See for instance, S.K. Goyal, Impact of Foreign Subsidiaries on India’s Balance of Payments, a report
submitted to the UNCTC-ESCAP Unit, Bangkok, Indian Institute of Public Administration, 1979; K.K. Subrahmanian and P Mohanan Pillai, Multinationals and Indian Export: A Study of Foreign Collaboration and Indian Exports, Sardar Patel Institute of Economic & Social Research, 1978; K.S. Chalapati Rao, “An Evaluation of Export Policies and the Export Performance of Large Private Companies”, in Pitou van Dijck and K.S. Chalapati Rao, India’s Trade Policy and Export Performance of Industry, Indo-Dutch Programme on Alternatives in Development, Sage Publications, 1994, Nagesh Kumar , Multinational Enterprises in India, Routledge, 1990, etc.
2 Chalapati Rao, op. cit. 3 Studies which emanated from the study of DTR data at ISID are: (i) S.K. Goyal, et. al., India’s
Imports and Exports: Some Insights (An Analysis of Daily Trade Return Data), Institute for Studies in Industrial Development, 1991; (ii) S.K. Goyal, “Exchange Rates, Trade Policy and Tariff Structure”, Institute for Studies in Industrial Development, 1991; (iii) K.S. Chalapati Rao, “Ownership Characteristics and Export Destinations: A Study of Custom House data”, 1992; and (iv) Nitasha Devasar, “TNCs and Transfer Pricing in India, Regulatory Strategies and Corporate Structure”, August 1991. The reports (i) and (ii) were submitted to the Ministry of Finance.
7
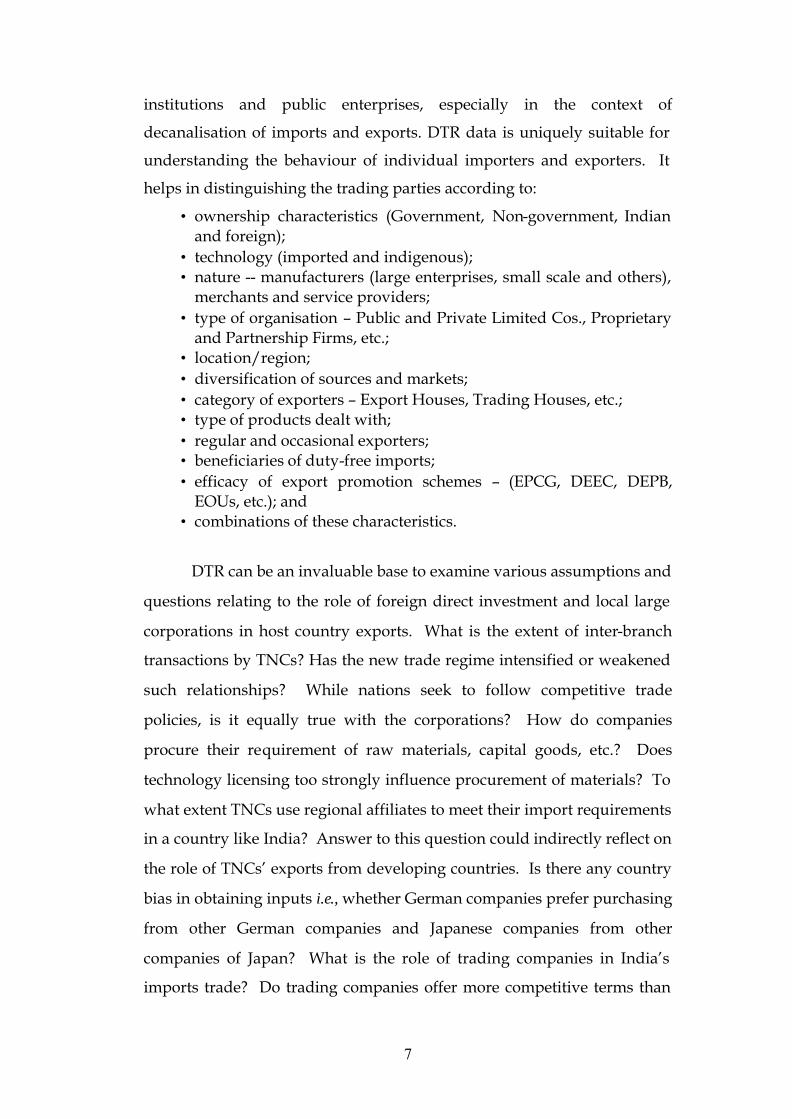
institutions and public enterprises, especially in the context of
decanalisation of imports and exports. DTR data is uniquely suitable for
understanding the behaviour of individual importers and exporters. It
helps in distinguishing the trading parties according to:
• ownership characteristics (Government, Non-government, Indian and foreign);
• technology (imported and indigenous); • nature -- manufacturers (large enterprises, small scale and others),
merchants and service providers; • type of organisation – Public and Private Limited Cos., Proprietary
and Partnership Firms, etc.; • location/region; • diversification of sources and markets; • category of exporters – Export Houses, Trading Houses, etc.; • type of products dealt with; • regular and occasional exporters; • beneficiaries of duty-free imports; • efficacy of export promotion schemes – (EPCG, DEEC, DEPB,
EOUs, etc.); and • combinations of these characteristics.
DTR can be an invaluable base to examine various assumptions and
questions relating to the role of foreign direct investment and local large
corporations in host country exports. What is the extent of inter-branch
transactions by TNCs? Has the new trade regime intensified or weakened
such relationships? While nations seek to follow competitive trade
policies, is it equally true with the corporations? How do companies
procure their requirement of raw materials, capital goods, etc.? Does
technology licensing too strongly influence procurement of materials? To
what extent TNCs use regional affiliates to meet their import requirements
in a country like India? Answer to this question could indirectly reflect on
the role of TNCs’ exports from developing countries. Is there any country
bias in obtaining inputs i.e., whether German companies prefer purchasing
from other German companies and Japanese companies from other
companies of Japan? What is the role of trading companies in India’s
imports trade? Do trading companies offer more competitive terms than

8
the original manufacturers? Do Indian companies differ from TNCs in
utilising their services? DTR data can help examine theoretical issues as
also help fine-tune external trade policies.
For making good use of the DTR data, one, however, needs detailed
information on the ownership and operational characteristics of individual
importers and exporters and wider coverage of the ports. Given the
scanty information base of the Indian corporate sector -- especially the
unlisted ones, near non-existent public information on partnership firms
and proprietary concerns and the involvement of large number of trading
parties, analysis of DTR data turns out to be a difficult, time-consuming
and often frustrating exercise. In the absence of unique identifying codes
for the trading parties, the problem gets further compounded.
The DTRs have a number of important data fields. Besides the
general identification fields, the import DTR contains: names of the
importer (and the address), manufacturer and the supplier;
product/article imported (coded according to the harmonised system);
quantity and units; invoice value, insurance and freight; final assessed
value and duty thereof; invoice currency code; license number; countries
of origin and consignment; and port of shipment. Each record has 45
fields and is of 604 characters length. Compared to this, the Export DTR
has only 25 fields and it consists of 268 characters. Important fields in the
Export DTR are: name and city of the exporter; article exported (and its
code according to the harmonised system); units and quantity; fob value;
and port of destination. The structures of Import and Export DTRs are
given in Tables I.1 and I.2 respectively.
The ISID initially obtained DTR data for the years 1988-89 to 1990-
91 from the Customs Houses of Bombay Air & Sea, Delhi, Calcutta,
Chennai and Cochin. Though efforts were made to get the data regularly
for the subsequent years, over a period the Customs Houses turned less
forthcoming to share the data. Consequently, a number of gaps remained
9
in the data set. In spite of repeated attempts to get the data through
formal requests and informal enquiries, no further data could be obtained
Table-I.1
Structure of Daily Trade Returns (DTR) Data on Imports#
Field Field Name Type Width Description (1) (2) (3) (4) (5)
1 B_LENGTH Character 4 Block Length 2 SNO Character 4 Serial No. 3 TRADE_TYPE Character 1 Type of Trade 4 MODE_O_TPT Character 1 Mode of Transport 5 GOVT_PVT Character 1 Government/Private 6 PORT_CODE Character 3 Assessment Port Code 7 BIL_O_ENTR Character 2 Bill of Entry Type 8 BE_NO Character 6 Bill of Entry No. 9 BE_DATE Character 6 Bill of Entry Date
10 CLASS_CODE Character 2 Class Code 11 REPORT_DTE Character 6 Date of Entry Inwards 12 GROSS_WT Character 12 Gross Weight 13 UNIT_QTY Character 3 Unit Quantity Code 14 FREIGT_TOT Numeric 10 Total Freight 15 FREIGT_CUR Character 3 Freight Currency Code 16 INSURE_TOT Numeric 10 Total Insurance 17 INSURE_CUR Character 3 Insurance Currency Code 18 CNTRY_ORIG Character 5 Country of Origin 19 CNTRY_CONS Character 5 Country of Consignment 20 INVOCE_VAL Numeric 14 Total Invoice Value 21 INVOCE_CNT Character 3 Invoice Country Code 22 TERM_INVOI Character 3 Terms of Unit Price Invoiced 23 DUTY_TOTAL Numeric 14 Total Duty Assessed (Rs.) 24 IMPORTER Character 30 Importer Name 25 IMPORTR_AD Character 70 Importer Address 26 ASSBLE_VAL Numeric 14 Assessable Value (Rs.) 27 ITEM_NO Numeric 3 Item No. 28 NET_QTY Numeric 11 Net Quantity 29 QTY_CODE Character 3 Unit Quantity Code 30 UNIT_PRESC Character 3 Prescribed Unit of Measure 31 ITCRC_CODE Character 8 ITCRC Eight Digit H.S. Code 32 ITEM Character 98 Item Description 33 DUMMY1 Character 1 Unused 34 MANUF_NAME Character 40 Manufacturer's Name 35 BRAND Character 20 Brand Name 36 MODEL Character 20 Model Specification 37 SUPPL_NAME Character 40 Supplier's Name 38 VESSEL_NAM Character 30 Vessel Name 39 LICENCE_NO Character 30 Licence No. 40 LICENCE_DT Character 6 Licence Date 41 PORT_O_SHP Character 20 Port of Shipment 42 EPZ_ICD_CD Character 5 EPZ/ICD Code 43 VESSEL_TYP Character 3 Vessel Type 44 VESSEL_CNT Character 20 Vessel Nationality 45 DUMMY2 Character 9 Blank
# As stored in the ISID computer systems.
10
Table-I.2 Structure of Daily Trade Returns (DTR) Data on Exports#
Field Field Name Type Width Description
(1) (2) (3) (4) (5) 1 B_LENGTH Character 4 Block Length
2 SNO Character 4 Serial No.
3 TRADE_TYPE Character 1 Type of Trade 4 MODE_O_TPT Character 1 Mode of Transport
5 GOVT_PVT Character 1 Government/Private
6 PORT_CODE Character 3 Assessment Port Code 7 SHP_BIL_TY Character 3 Type of Shipping Bill
8 SHP_BIL_NO Character 6 Shipping Bill No.
9 SHP_BIL_DT Character 6 Shipping Bill Date 10 SAILING_DT Character 6 Sailing Date
11 VESSEL_NAM Character 20 Vessel Name
12 GROSS_WT Numeric 8 Gross Weight 13 UNIT_QTY Character 3 Unit Quantity Code
14 UNIT_PRESC Character 3 Prescribed Unit Code
15 UNIT_SHBIL Character 3 Unit Quantity on Shipping Bill 16 NET_QTY Numeric 10 Net Quantity
17 ITCRC_CODE Character 8 ITCRC Eight Digit H.S. Code
18 FOB_VALUE Numeric 12 FOB Value (Rs.) 19 CNTRY_CODE Character 5 Country Code
20 CNTRY_DSTN Character 16 Country of Final Destination
21 PORT_DESTN Character 20 Port of Destination 22 ARTICLE Character 65 Article Description
23 EXPORTR_AD Character 40 Exporter Address
24 EPZ_ICD_CD Character 3 EPZ/ICD Code 25 VESSEL_TYP Character 3 Vessel Type
26 VESSEL_CNT Character 5 Vessel Nationality # As stored in the ISID computer systems.
from any of the Customs Houses after 1996-97. In view of the series of
major discontinuities in respect of other Customs Houses, it has been
decided to restrict the present exercise to the DTR data obtained from
Mumbai Sea and Air Customs Houses for the period 1988-89 to 1994-95.
This covers the transition period i.e., immediately preceding the 1991 trade
and industrial policy changes and the years following that landmark and
till the coming into being of the World Trade Organisation (WTO). As a
general rule, imports of crude oil and defence related items do not appear
11
in the DTRs.4 The two Customs Houses accounted for about one-third of
the imports and two-fifths of India’s exports (Table-I.3). The data can thus
offer a reasonably good sample of the country’s external trade in
merchandise during the period. The data on imports and exports for this
period through Air and Sea ports of Mumbai run into nearly 2 million
import records and 2.5 million export records.
Table-I.3
Share of Mumbai Sea and Air Ports in India’s Imports and Exports (Percentages)
1991-92 1992-93 1993-94 1994-95 (1) (2) (3) (4) (5) I. Imports
Share of a) Mumbai Sea b) Mumbai Air
Total (a + b)
19.54 13.79 33.33
16.21 16.16 32.37
18.31 18.60 36.91
20.92 12.63 33.55
II. Exports Share of
c) Mumbai Sea d) Mumbai Air
Total (c + d)
20.03 18.49 38.52
19.13 19.93 39.06
19.82 21.56 31.38
18.68 20.52 39.20
Problems with the DTR Data
Raw data obtained from the Customs Houses posed many
problems. It needed extensive cleaning to eliminate duplicate entries,
extreme values and inappropriate entries resulting from corruption of data
during transcription. Unfortunately, the Shipping Bills (SB) containing
exports data are not recorded with even as much care as was the case with
Bills of Entry (BE) i.e., imports data. In spite of removing many duplicate
entries, there is still a possibility of some entries remaining where the
details differ only marginally. These, however, do not appear to be 4 Direct transit trade i.e. goods of other countries passing and transit without being placed at the
free disposal of the importer being warehoused is excluded completely as the goods do not touch the customs frontier. Other important transactions which are excluded from the coverage of the DTR are: (i) Goods consigned by the Government to its Armed forces and Diplomatic Representatives abroad and goods sent by the Government of Foreign Countries to their Diplomatic personnel stationed in India (ii) Trans-shipments trade covering imported goods transferred under bond for re-shipment from one vessel to another at the same or different ports (iii) Passenger’s baggage not included, (iv) Bunkers and ships stores (v) Tourists and travellers affects, exhibitions goods, samples, animal for racing and breeding, Defence goods fissionable materials (vi) Transactions in treasure i.e. gold and current coins notes, (vii) Prohibited goods etc.

12
material as these constitute only an insignificant proportion of the total
value of imports and exports. There are obvious mistakes at the data
entry stage, which can only be corrected at the source.5 Only in some
extreme cases, we attempted to adjust the import values by taking note of
the duty paid. There were also major gaps in the data which do not allow
meaningful comparison of values and the number of importers/exporters
across different years.
The most significant shortcoming noticed is that adequate care was
not taken in entering the names of importers, exporters and suppliers,
description of products, product classification and the nature of import
licences. For the analysis to be meaningful, it was, therefore, essential to
standardize the importer/exporter names. In spite of ignoring the
relatively smaller consignments, the exercise proved to be extremely time-
consuming. To begin with, importer/exporter names were sought to be
standardised by replacing certain strings with standard ones (e.g.
‘Company’ with ‘Co’; ‘Private’ with ‘Pvt’; ‘Trading’ with ‘Tdg’; etc.) to
achieve first level uniformity in company names. In the absence of prior
information on the names of the trading parties, the process of
standardisation had to be carried out in an iterative manner. After the
initial standardisation, import/export values were totalled at the level of
individual party over the entire period. From this set, all those parties
with a minimum amount of imports and/or exports were separated and
their names were standardised physically. Given the skewed distribution
of imports and exports, which we shall present a little later, the selection
process thus ensured both manageability as also representative character
in terms of value.
Given the manner in which company names were entered in the
DTRs, and the poor state of information on enterprises in India, many a
5 . These can be corrected only after looking at the Bill of Entry or the Shipping Bill as the case may be
i.e., writing back to the Customs Houses. The DGCI&S which processes the DTRs to generate the country’s foreign trade statistics does indeed approaches the Custom Houses in case of problems. Given the lack of enthusiasm on part of the Customs Houses even to provide the data, it was unreasonable to expect positive response to such queries from us.

13
time it was difficult for us to identify firmly whether an importer/exporter
was an individual, firm or a company. This was more so when the names
resembled closely. It is well known that business groups often operate in
various forms as multiple public/private limited companies, partnership
firms and sole proprietary undertakings.6 In case of smaller parties, one
possibility, even if inconsequential, was that our name standardisation
exercise might have combined different entities with closely resembling
names – or even exactly the same name – into a single importer/exporter.
On the other hand, due to non-standardisation of names, lack of
information on name changes, inability to identify branches/units with
the main enterprise, the same party could have been counted multiple
times. Given the nature of DTR data and the large number of entries
under study, these problems were unavoidable. Had a unique Importer -
Exporter Code been a part of the DTR, one would not have been required
to undertake such a laborious exercise.
Another major problem is in respect of product codes filled in by
the importers and exporters. The general problem is that, often proper
codes are not provided by the parties. We did notice a number of
problems in this regard. Indeed, in the ISID study of 1991 presented to the
Ministry of Finance, it was pointed out that :
While eight digits are provided for the code one finds that effectively only six digits are used. Checks are needed to assess the accuracy of the codes used. We noticed that at six-digit level a number of codes were used for a single item. The occurrence of ‘99999999’s, ‘00000000’s or invalid codes is not infrequent. Remedying this situation is a pre-requisite for bringing out better industry-wise trade statistics.7
6 For instance, Adani Exports Ltd. reported the following as parties related to it:: Adani
Properties Pvt Ltd., Adani Agro Pvt Ltd., Adani Port Ltd., B2C India Ltd., I Call India Ltd., I-Gate India Pvt Ltd., Adani Impex Pvt Ltd., Gujarat Adani Infrastructure Pvt Ltd., Shahi Property Developers Pvt Ltd., Adani Port Infrastructure Ltd., Gujarat Adani Port Ltd., Gujarat Adani Energy Ltd., Intercontinental (India), Shantivan, Advance Exports, Crown International, Adani Container (Mundra) Terminals Ltd., Gudami International; and Adani Wilmar Ltd. See: Annual Report of the Company for the year 2001-2002, p. 51.
7 S.K. Goyal, op. cit., Appendix C, p. 8.
14
That the situation has not improved very much since then is evident from
the observations of the National Statistical Commission. The Commission
noted:
It has been experienced that the exporters or importers or their agents do not report the codes properly. To improve the situation the Directorate General of Foreign Trade (DGFT) has introduced a notification on 11 September, 2000 making it mandatory to mention 8-digit ITC(HS) Codes prepared by the DGCI&S against each export product that figures in the Shipping Bill. … The DGCI&S has reported that after the issue of the above notification, though the exporters are reporting valid codes in the Shipping Bills, but it has noticed that the problem of mismatching, i.e. codes vis-à-vis the description of items, still persists. As regards imports, no such notification has been issued. (emphasis added)8
The first study of ISID also brought to the notice of the Ministry of
Finance with regard to problems in other data fields. For instance, even
the field provided for mentioning the nature of the party as ‘Government’
or ‘Private’ was not free from ambiguities. The same party was defined as
Government at some places and private at other times. These problems
highlight the limitations of the data source and underline the fact that
mere provision for reporting certain information does not ensure its
automatic compliance.
Changes in the DTR Format
At this point it may be relevant to describe the present status of the
DTRs to put the future uses of the data in a practical perspective. The first
ISID study of 1991 made certain categorical recommendations that the
DTRs should be modified to make them amenable for better monitoring
India’s foreign trade and for quick and easy analysis of many a policy
measure and theoretical assumption. It was specifically suggested that:
• A unique importer code need to be assigned to all the importers and exporters. No Bill of Entry or Shipping Bill
8 See: INDIA, National Statistical Commission, Report of the National Statistical Commission,
Volume II, August 2001, p. 177. (Chairman: C. Rangarajan)

15
should be accepted without the same being printed in bold on all import and export documents.
• It is necessary to have a system under which it becomes obligatory on all importers to give exhaustive information on their identity. Such information should have relevant personal details and associations of business and other relationships of the importers.9
Over the past few years, certain improvements have taken place in
the DTR format. It is a matter of satisfaction for the ISID that the structure
of DTR has been modified with the Importer-Exporter Code (IEC) being a
part of it. While it appears that the IEC was introduced in the DTRs some
time after 1996, further amendments were announced by the DGFT in May
2001 and were to be implemented from July 1, 2001.10 According to the
official circular, the following additional fields were to be incorporated in
the DTRs:
(i) whether the exporter/importer is a private entity (P) or a Government entity (G);
(ii) port code for port of shipment/unloading; (iii) country of destination/origin code; (iv) Business Identification Number (BIN); (v) EXIM Scheme Code of each item; (vi) quantity of export/import in terms of Standard Units (to be
implemented after 2-3 years); and (vii) state of origin of the goods for export.
The revised formats are given in Table I.4. While it is difficult to
understand how the information on Government/Private ownership and
port of shipment/unloading can be considered as additional fields since
they had already formed part of the DTRs obtained by us and used in the
present analysis, the introduction of Business Identification Number (BIN)
and State of origin of the export goods are certainly welcome additions.
9 S.K. Goyal, op. cit., p. 96. Indeed, as far back as 1969, use of company codes was suggested for
implementation and monitoring of industrial regulations. See S.K. Goyal, “Maintenance and Processing of Data”, a note prepared for the Industrial Licensing Policy Inquiry Committee, Ministry of Industrial Development, Internal Trade and Company Affairs, July 1969 (mimeo).
10 Daily Trade Returns – Revised format see: Circular No.32/2001-CUS.dated the 31st May, 2001.

16
The BIN incorporates the Permanent Account Number (PAN) issued by
the Income Tax Department.
From a comparison of Tables I.1, I.2 and I.4 it can be also seen that
while a few improvements have been made, some useful information has
also been taken away from the purview of the Import DTR. The most
significant fields that have been left out are the duty levied and names of
supplier and manufacturer. A perusal of the DTRs given online by the
Mangalore Customs suggest that while IEC and BIN have already become
part of the import DTR, the same are yet to find a place in the Export DTR.
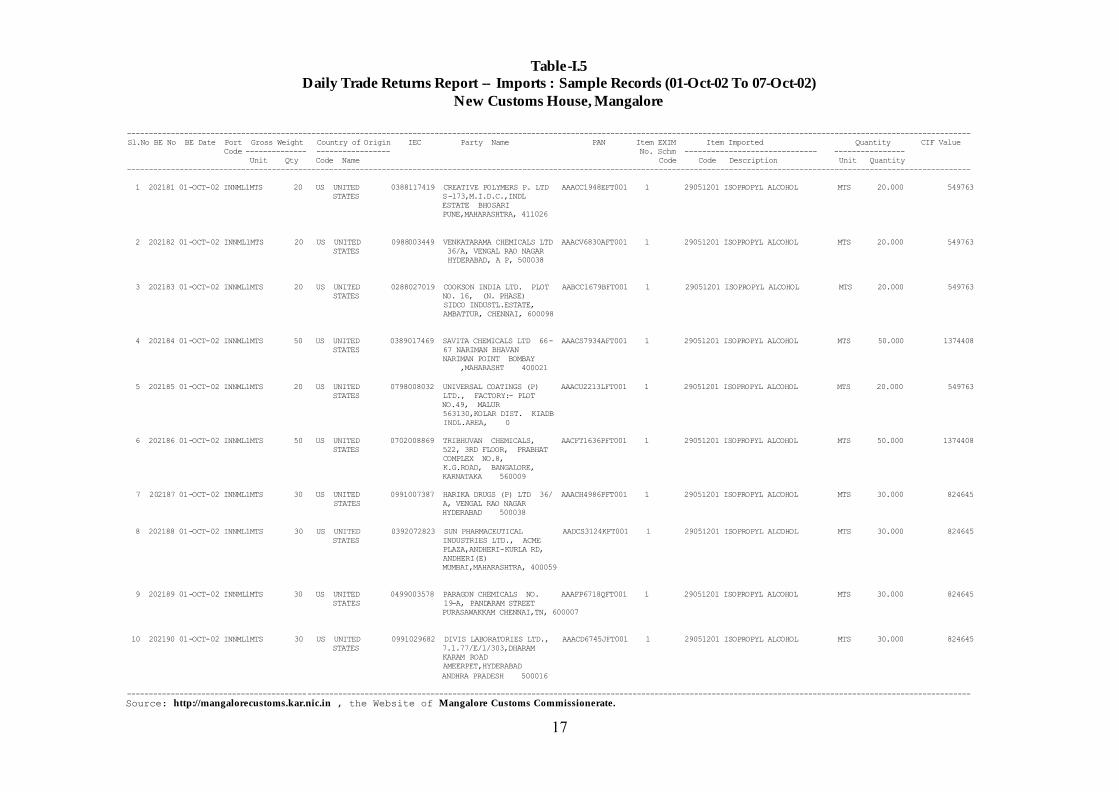
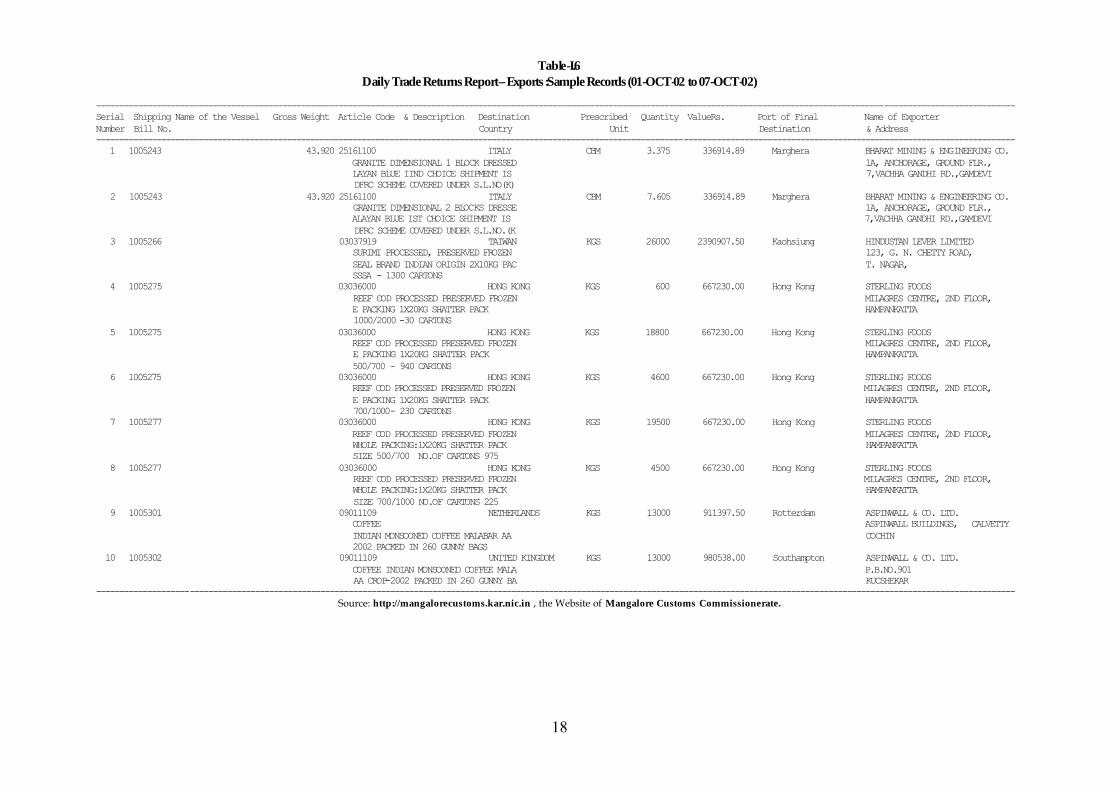
Sample records from the October 2002 DTRs from Mangalore Customs are
given Tables I.5 and I.6.
Table-I.4
Structure of the Revised DTRs
Column
No. Import DTR Export DTR
(1) (2) (3) 1. Serial No. 1. Serial No. 2. Government/Private 2. Government/Private 3. Bill of Entry No. & Date 3. Shipping Bill No. & Date 4. Port Code 4. Port Code 5. Gross Weight Unit Measure 5. Gross Weight Unit Measure
6. Gross Weight Quantity 6. Gross Weight Quantity 7. Country of Origin: Code 7. Country of Destination: Code 8. Country of Origin: Name 8. Country of Destination: Name 9. State of Origin
9. IEC Code 10. IEC Code 10. Party Name 11. Party Name
11. Business Identification
Number (BIN) 12. Business Identification Number (BIN)
12. Item Serial No. 13. Item Serial No. 13. Exim Scheme Code 14. Exim Scheme Code 14. 8 Digit ITC(HS) of Item
Imported: Code 15. 8 Digit ITC(HS) of Item Exported: Code
15. Description of Imported Item 16. Description of Exported Item
16. Quantity Declared: Unit 17. Quantity Declared: Unit 17. Quantity Declared: Quantity 18. Quantity Declared: Quantity 18. Standard Unit Measure 19. Standard Unit Measure 19. Standard Quantity 20. Standard Quantity 20. CIF Value (Rs.) 21 FOB Value (Rs.)
17
Table-I.5
Daily Trade Returns Report -- Imports : Sample Records (01-Oct-02 To 07-Oct-02) New Customs House, Mangalore
------------------------------------------------------------------------------------------------------------------------------------------------------------------------------------------------ Sl.No BE No BE Date Port Gross Weight Country of Origin IEC Party Name PAN Item EXIM Item Imported Quantity CIF Value Code -------------- ----------------- No. Schm ------------------------------ ---------------- Unit Qty Code Name Code Code Description Unit Quantity ------------------------------------------------------------------------------------------------------------------------------------------------------------------------------------------------ 1 202181 01-OCT-02 INNML1MTS 20 US UNITED 0388117419 CREATIVE POLYMERS P. LTD AAACC1948EFT001 1 29051201 ISOPROPYL ALCOHOL MTS 20.000 549763 STATES S-173,M.I.D.C.,INDL ESTATE BHOSARI PUNE,MAHARASHTRA, 411026 2 202182 01-OCT-02 INNML1MTS 20 US UNITED 0988003449 VENKATARAMA CHEMICALS LTD AAACV6830AFT001 1 29051201 ISOPROPYL ALCOHOL MTS 20.000 549763 STATES 36/A, VENGAL RAO NAGAR HYDERABAD, A P, 500038 3 202183 01-OCT-02 INNML1MTS 20 US UNITED 0288027019 COOKSON INDIA LTD. PLOT AABCC1679BFT001 1 29051201 ISOPROPYL ALCOHOL MTS 20.000 549763 STATES NO. 16, (N. PHASE) SIDCO INDUSTL.ESTATE, AMBATTUR, CHENNAI, 600098 4 202184 01-OCT-02 INNML1MTS 50 US UNITED 0389017469 SAVITA CHEMICALS LTD 66- AAACS7934AFT001 1 29051201 ISOPROPYL ALCOHOL MTS 50.000 1374408 STATES 67 NARIMAN BHAVAN NARIMAN POINT BOMBAY ,MAHARASHT 400021 5 202185 01-OCT-02 INNML1MTS 20 US UNITED 0798008032 UNIVERSAL COATINGS (P) AAACU2213LFT001 1 29051201 ISOPROPYL ALCOHOL MTS 20.000 549763 STATES LTD., FACTORY:- PLOT NO.49, MALUR 563130,KOLAR DIST. KIADB INDL.AREA, 0 6 202186 01-OCT-02 INNML1MTS 50 US UNITED 0702008869 TRIBHUVAN CHEMICALS, AACFT1636PFT001 1 29051201 ISOPROPYL ALCOHOL MTS 50.000 1374408 STATES 522, 3RD FLOOR, PRABHAT COMPLEX NO.8, K.G.ROAD, BANGALORE, KARNATAKA 560009 7 202187 01-OCT-02 INNML1MTS 30 US UNITED 0991007387 HARIKA DRUGS (P) LTD 36/ AAACH4986PFT001 1 29051201 ISOPROPYL ALCOHOL MTS 30.000 824645 STATES A, VENGAL RAO NAGAR HYDERABAD 500038 8 202188 01-OCT-02 INNML1MTS 30 US UNITED 0392072823 SUN PHARMACEUTICAL AADCS3124KFT001 1 29051201 ISOPROPYL ALCOHOL MTS 30.000 824645 STATES INDUSTRIES LTD., ACME PLAZA,ANDHERI-KURLA RD, ANDHERI(E) MUMBAI,MAHARASHTRA, 400059 9 202189 01-OCT-02 INNML1MTS 30 US UNITED 0499003578 PARAGON CHEMICALS NO. AAAFP6718QFT001 1 29051201 ISOPROPYL ALCOHOL MTS 30.000 824645 STATES 19-A, PANDARAM STREET PURASAWAKKAM CHENNAI,TN, 600007 10 202190 01-OCT-02 INNML1MTS 30 US UNITED 0991029682 DIVIS LABORATORIES LTD., AAACD6745JFT001 1 29051201 ISOPROPYL ALCOHOL MTS 30.000 824645 STATES 7.1.77/E/1/303,DHARAM KARAM ROAD AMEERPET,HYDERABAD ANDHRA PRADESH 500016 ------------------------------------------------------------------------------------------------------------------------------------------------------------------------------------------------ Source: http://mangalorecustoms.kar.nic.in , the Website of Mangalore Customs Commissionerate.
18
Table-I.6 Daily Trade Returns Report – Exports :Sample Records (01-OCT-02 to 07-OCT-02)
----------------------------------------------------------------------------------------------------------------------------------------------------------------------------------------------------- Serial Shipping Name of the Vessel Gross Weight Article Code & Description Destination Prescribed Quantity ValueRs. Port of Final Name of Exporter Number Bill No. Country Unit Destination & Address ----------------------------------------------------------------------------------------------------------------------------------------------------------------------------------------------------- 1 1005243 43.920 25161100 ITALY CBM 3.375 336914.89 Marghera BHARAT MINING & ENGINEERING CO. GRANITE DIMENSIONAL 1 BLOCK DRESSED 1A, ANCHORAGE, GROUND FLR., LAYAN BLUE IIND CHOICE SHIPMENT IS 7,VACHHA GANDHI RD.,GAMDEVI DFRC SCHEME COVERED UNDER S.L.NO(K) 2 1005243 43.920 25161100 ITALY CBM 7.605 336914.89 Marghera BHARAT MINING & ENGINEERING CO. GRANITE DIMENSIONAL 2 BLOCKS DRESSE 1A, ANCHORAGE, GROUND FLR., ALAYAN BLUE IST CHOICE SHIPMENT IS 7,VACHHA GANDHI RD.,GAMDEVI DFRC SCHEME COVERED UNDER S.L.NO.(K 3 1005266 03037919 TAIWAN KGS 26000 2390907.50 Kaohsiung HINDUSTAN LEVER LIMITED SURIMI PROCESSED, PRESERVED FROZEN 123, G. N. CHETTY ROAD, SEAL BRAND INDIAN ORIGIN 2X10KG PAC T. NAGAR, SSSA - 1300 CARTONS 4 1005275 03036000 HONG KONG KGS 600 667230.00 Hong Kong STERLING FOODS REEF COD PROCESSED PRESERVED FROZEN MILAGRES CENTRE, 2ND FLOOR, E PACKING 1X20KG SHATTER PACK HAMPANKATTA 1000/2000 -30 CARTONS 5 1005275 03036000 HONG KONG KGS 18800 667230.00 Hong Kong STERLING FOODS REEF COD PROCESSED PRESERVED FROZEN MILAGRES CENTRE, 2ND FLOOR, E PACKING 1X20KG SHATTER PACK HAMPANKATTA 500/700 - 940 CARTONS 6 1005275 03036000 HONG KONG KGS 4600 667230.00 Hong Kong STERLING FOODS REEF COD PROCESSED PRESERVED FROZEN MILAGRES CENTRE, 2ND FLOOR, E PACKING 1X20KG SHATTER PACK HAMPANKATTA 700/1000- 230 CARTONS 7 1005277 03036000 HONG KONG KGS 19500 667230.00 Hong Kong STERLING FOODS REEF COD PROCESSED PRESERVED FROZEN MILAGRES CENTRE, 2ND FLOOR, WHOLE PACKING:1X20KG SHATTER PACK HAMPANKATTA SIZE 500/700 NO.OF CARTONS 975 8 1005277 03036000 HONG KONG KGS 4500 667230.00 Hong Kong STERLING FOODS REEF COD PROCESSED PRESERVED FROZEN MILAGRES CENTRE, 2ND FLOOR, WHOLE PACKING:1X20KG SHATTER PACK HAMPANKATTA SIZE 700/1000 NO.OF CARTONS 225 9 1005301 09011109 NETHERLANDS KGS 13000 911397.50 Rotterdam ASPINWALL & CO. LTD. COFFEE ASPINWALL BUILDINGS, CALVETTY INDIAN MONSOONED COFFEE MALABAR AA COCHIN 2002 PACKED IN 260 GUNNY BAGS 10 1005302 09011109 UNITED KINGDOM KGS 13000 980538.00 Southampton ASPINWALL & CO. LTD. COFFEE INDIAN MONSOONED COFFEE MALA P.B.NO.901 AA CROP-2002 PACKED IN 260 GUNNY BA KUCSHEKAR -----------------------------------------------------------------------------------------------------------------------------------------------------------------------------------------------------
Source: http://mangalorecustoms.kar.nic.in , the Website of Mangalore Customs Commissionerate.

19
Introduction of IEC in the DTRs is going to help in the analysis
many ways. First, it obviates the need to standardise the party names
which we had to undertake for the present exercise in an extensive
manner. Second, one can relate direct imports of an entity with its exports
easily through a simple matching of the IECs. An additional advantage
available now is the facility to obtain various details of the entities from
the DGFT website by feeding in the IEC codes.11 Third, this information
helps in the classification of the parties into public limited companies,
partnership firms, proprietary concerns, government and private
importers/exporters, small scale units, etc. Since different units and
branches of an entity are given the same IEC, the difficulties faced in
classifying the parties will be reduced to a large extent and pave way for a
reliable analysis at the level of organisational form/party.
Ownership Classification of Importers and Exporters
After the name standardisation exercise was completed, an attempt
was made to identify the importers and exporters as constituents of the
public sector, international organisations and the non-government ones.
A number of databases created and maintained at the Institute were
consulted for this purpose. Some of the important ones are: Directory of
Indian Companies; Directory of Foreign Collaborations; Registrations
under the MRTP Act; Shareholding Distribution of Stock Exchange Listed
Companies; Compilation of Inter-corporate Investments; Name Changes;
Mergers; Registered Export Houses; etc. In addition, extensive use of the
Internet has been made to get some minimum details on the ownership
characteristics and group affiliation of importers and exporters about
whom otherwise no information was available. The non-government
importers and exporters were further distinguished as per the level of
foreign equity and affiliation to Large Industrial Houses. Classification of
companies posed a number of problems due to non-availability of relevant
11 Available at http://dgft.delhi.nic.in:8100/dgft/IecPrint.
20
shareholding data for a good number of entities. Even when the
shareholding data were available, it was difficult to decide the nature of
foreign investment in smaller and unlisted companies. In many cases it
was not possible to ascertain whether the shares were held by non-
resident Indians and Overseas Corporate Bodies (OCBs) predominantly
owned by them, foreign institutional investors, foreign collaborators or
foreign promotional agencies. The problem was less severe in case of
well-known subsidiaries of foreign companies. For the present exercise,
apart from such subsidiaries, companies in which a minimum of 25 per
cent foreign investment is held by identifiable foreign investors have been
classified as foreign-controlled companies (FCCs). Also included under
the FCC category are subsidiaries of and other companies promoted in
turn by such FCCs in India. In case of joint ventures with foreign
companies, the ventures have been classified as FCCs if the foreign
partner’s equity was 25 per cent or more. A few companies whose
products are marketed by large FCCs under the latter’s brand names have
also been treated as FCCs for the present exercise. NRI-controlled
companies, to the extent possible, have been kept out of the foreign-
controlled category. Since only those whose shareholding and
promotional details are available have been classified as FCCs, there could
still be a few lesser-known FCCs among the left out ones.
Since registration of inter-connected undertakings under the MRTP
Act is no longer mandatory, official estimates of lists of Large Industrial
Houses and their assets are not available beyond the ‘eighties. Sporadic
estimates are, however, made by private agencies.12 In view of the non-
availability of official estimates for the ‘nineties, it was decided to use the
estimates made by the Centre for Monitoring Indian Economy (CMIE) for
the mid-‘nineties.13 Two main advantages of these estimates are larger
coverage and inclusion of some unlisted companies as well. Out of the top
12 These cover mainly the listed companies and do not have any official sanction in terms of
classification into a particular family or its sub-group. 13 CMIE, The Indian Corporate Sector , April 1996. The reference year is 1994-95.

21
100 Houses listed by CMIE, those with Rs. 1,000 crores or more of sales in
1994-95 and numbering 50, have been termed as Top 50 Houses (T1). The
next 50 Houses incidentally had assets ranging between Rs. 500 to Rs.
1,000 crores. These form the second set of Top 50 Houses (T2). Individual
companies with Rs. 1,000 crores or more sales in 1994-95 were added to
the 1st set. Similarly, the second group was enlarged to include companies
with Rs.500 - 1,000 crores sales. A company could thus be classified either
belonging to T1, T2 or ‘Others’ in combination with their foreign
affiliation. To avoid problems of comparison, a uniform classification of
companies was maintained for all the years. To facilitate comparability
over the period, all the import/export values were converted into US
dollar terms using the ratios obtained from the national aggregate imports
and exports for the respective years.
In view of the shortcomings described above, the limited objective
of the present exercise is to provide broad indications of the trends and to
demonstrate the possible applications the DTR data can be put to. We
begin the presentation of the results with the summary tables obtained from
the export DTRs.

22
Section I
Analysis of the Export DTRs
Before proceeding with the analysis, it would be helpful to
understand the industry composition of Export DTRs and other details to place the results in a proper perspective. What distinguishes the sample
Export DTRs is the extremely high share of Gems and Jewellery related
exports; the highest being in 1994-95 when it was 46 per cent (Table I.7). This
may be understandable because of the proximity of SEEPZ whose exports
constitute to a large extent gems and jewellery. Next in importance are
textiles and textile related articles which accounted for a maximum of 29.44
per cent, achieved in the first year. Though the share was relatively lower in 1994-95, it was still substantial at 20 per cent. Together, the two accounted
for, in some years, as much as two-thirds of the total exports under study.
Chemicals & Allied Industries and Engineering industries comprising of
Metals & Metal Products, Machinery & Components and Transport
Equipment come next. Shares of both the groups fell initially but
continued to maintain at the lower levels in the subsequent years. The coverage by the sample DTRs of the national exports which was
reasonably high at nearly 40 per cent in 1990-91 fell drastically to reach 22
per cent in the final year.
Under a single Shipping Bill (SB) more than one item can be exported
with each item assigned a separate value. For purpose of the present
exercise each SB is treated as one consignment. The total number of export
consignments, their value and their sectoral distribution varied during the seven years. As can be seen from the last row of Table I.7, the number of
days for which the data was available varied widely. In view of this, the
study would focus on the distribution of consignments instead of the
absolute level of exports.
The value of export consignments, in different value ranges, suggests
a high degree of concentration (Table I.8). The two ranges US$ 10,000 – US$
100,000 and US$ 100,000 – US$ 500,000 account for more than 80 per cent in
terms of value with the former accounting for more than half of the total in
almost all the years. Since an exporter can undertake exports at different
points of time, the exports have been aggregated at the level of individual
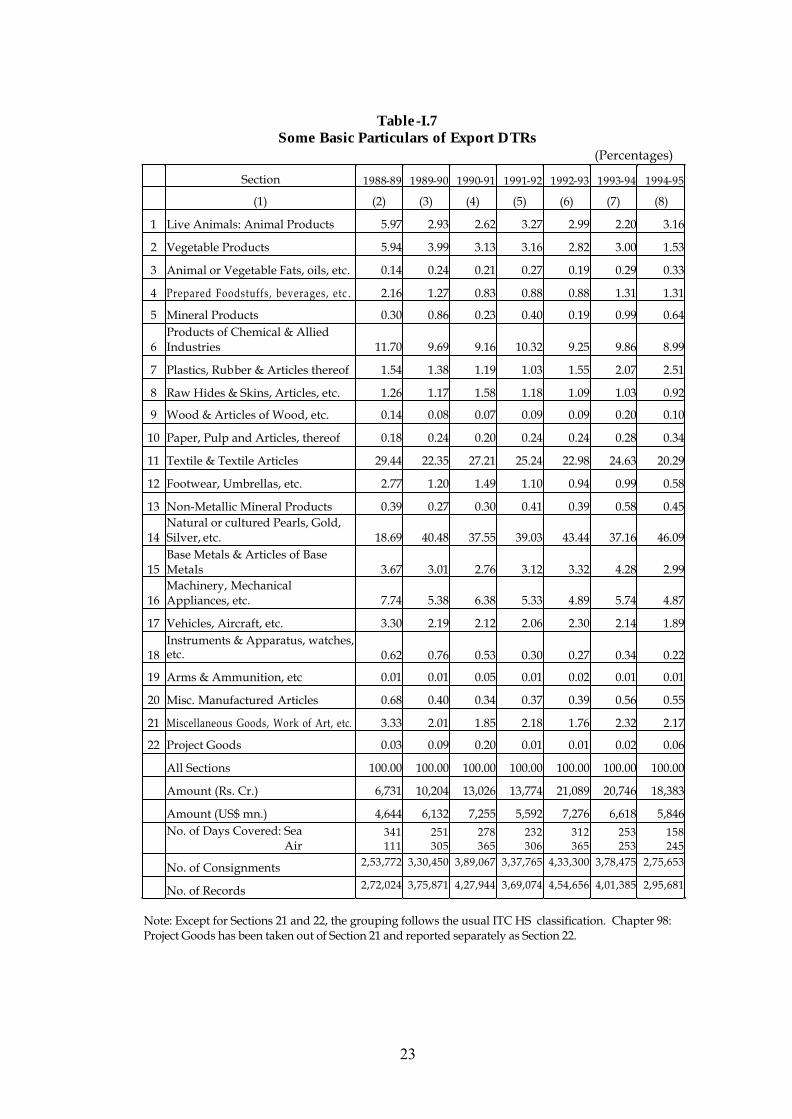
23
Table-I.7
Some Basic Particulars of Export DTRs (Percentages)
Section 1988-89 1989-90 1990-91 1991-92 1992-93 1993-94 1994-95
(1) (2) (3) (4) (5) (6) (7) (8)
1 Live Animals: Animal Products 5.97 2.93 2.62 3.27 2.99 2.20 3.16
2 Vegetable Products 5.94 3.99 3.13 3.16 2.82 3.00 1.53
3 Animal or Vegetable Fats, oils, etc. 0.14 0.24 0.21 0.27 0.19 0.29 0.33
4 Prepared Foodstuffs, beverages, etc . 2.16 1.27 0.83 0.88 0.88 1.31 1.31
5 Mineral Products 0.30 0.86 0.23 0.40 0.19 0.99 0.64
6 Products of Chemical & Allied Industries 11.70 9.69 9.16 10.32 9.25 9.86 8.99
7 Plastics, Rubber & Articles thereof 1.54 1.38 1.19 1.03 1.55 2.07 2.51
8 Raw Hides & Skins, Articles, etc. 1.26 1.17 1.58 1.18 1.09 1.03 0.92
9 Wood & Articles of Wood, etc. 0.14 0.08 0.07 0.09 0.09 0.20 0.10
10 Paper, Pulp and Articles, thereof 0.18 0.24 0.20 0.24 0.24 0.28 0.34
11 Textile & Textile Articles 29.44 22.35 27.21 25.24 22.98 24.63 20.29
12 Footwear, Umbrellas, etc. 2.77 1.20 1.49 1.10 0.94 0.99 0.58
13 Non-Metallic Mineral Products 0.39 0.27 0.30 0.41 0.39 0.58 0.45
14 Natural or cultured Pearls, Gold, Silver, etc. 18.69 40.48 37.55 39.03 43.44 37.16 46.09
15 Base Metals & Articles of Base Metals 3.67 3.01 2.76 3.12 3.32 4.28 2.99
16 Machinery, Mechanical Appliances, etc. 7.74 5.38 6.38 5.33 4.89 5.74 4.87
17 Vehicles, Aircraft, etc. 3.30 2.19 2.12 2.06 2.30 2.14 1.89
18 Instruments & Apparatus, watches, etc. 0.62 0.76 0.53 0.30 0.27 0.34 0.22
19 Arms & Ammunition, etc 0.01 0.01 0.05 0.01 0.02 0.01 0.01
20 Misc. Manufactured Articles 0.68 0.40 0.34 0.37 0.39 0.56 0.55
21 Miscellaneous Goods, Work of Art, etc. 3.33 2.01 1.85 2.18 1.76 2.32 2.17
22 Project Goods 0.03 0.09 0.20 0.01 0.01 0.02 0.06
All Sections 100.00 100.00 100.00 100.00 100.00 100.00 100.00
Amount (Rs. Cr.) 6,731 10,204 13,026 13,774 21,089 20,746 18,383
Amount (US$ mn.) 4,644 6,132 7,255 5,592 7,276 6,618 5,846
No. of Days Covered: Sea
Air 341111
251305
278365
232306
312365
253253
158245
No. of Consignments 2,53,772 3,30,450 3,89,067 3,37,765 4,33,300 3,78,475 2,75,653
No. of Records 2,72,024 3,75,871 4,27,944 3,69,074 4,54,656 4,01,385 2,95,681
Note: Except for Sections 21 and 22, the grouping follows the usual ITC HS classification. Chapter 98: Project Goods has been taken out of Section 21 and reported separately as Section 22.
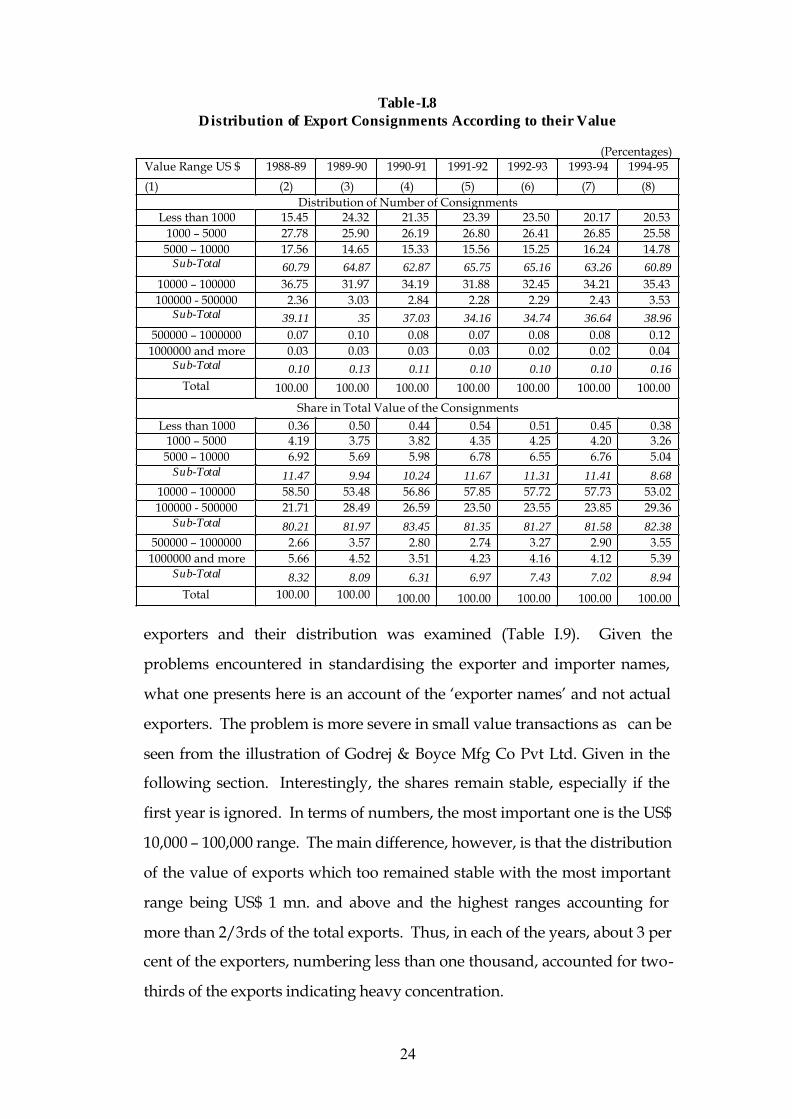
24
Table-I.8 Distribution of Export Consignments According to their Value
(Percentages) Value Range US $ 1988-89 1989-90 1990-91 1991-92 1992-93 1993-94 1994-95
(1) (2) (3) (4) (5) (6) (7) (8) Distribution of Number of Consignments
Less than 1000 15.45 24.32 21.35 23.39 23.50 20.17 20.53 1000 – 5000 27.78 25.90 26.19 26.80 26.41 26.85 25.58 5000 – 10000 17.56 14.65 15.33 15.56 15.25 16.24 14.78
Sub-Total 60.79 64.87 62.87 65.75 65.16 63.26 60.89 10000 – 100000 36.75 31.97 34.19 31.88 32.45 34.21 35.43 100000 - 500000 2.36 3.03 2.84 2.28 2.29 2.43 3.53
Sub-Total 39.11 35 37.03 34.16 34.74 36.64 38.96 500000 – 1000000 0.07 0.10 0.08 0.07 0.08 0.08 0.12 1000000 and more 0.03 0.03 0.03 0.03 0.02 0.02 0.04
Sub-Total 0.10 0.13 0.11 0.10 0.10 0.10 0.16 Total 100.00 100.00 100.00 100.00 100.00 100.00 100.00
Share in Total Value of the Consignments Less than 1000 0.36 0.50 0.44 0.54 0.51 0.45 0.38
1000 – 5000 4.19 3.75 3.82 4.35 4.25 4.20 3.26 5000 – 10000 6.92 5.69 5.98 6.78 6.55 6.76 5.04
Sub-Total 11.47 9.94 10.24 11.67 11.31 11.41 8.68 10000 – 100000 58.50 53.48 56.86 57.85 57.72 57.73 53.02 100000 - 500000 21.71 28.49 26.59 23.50 23.55 23.85 29.36
Sub-Total 80.21 81.97 83.45 81.35 81.27 81.58 82.38 500000 – 1000000 2.66 3.57 2.80 2.74 3.27 2.90 3.55 1000000 and more 5.66 4.52 3.51 4.23 4.16 4.12 5.39
Sub-Total 8.32 8.09 6.31 6.97 7.43 7.02 8.94 Total 100.00 100.00 100.00 100.00 100.00 100.00 100.00
exporters and their distribution was examined (Table I.9). Given the
problems encountered in standardising the exporter and importer names,
what one presents here is an account of the ‘exporter names’ and not actual
exporters. The problem is more severe in small value transactions as can be
seen from the illustration of Godrej & Boyce Mfg Co Pvt Ltd. Given in the
following section. Interestingly, the shares remain stable, especially if the
first year is ignored. In terms of numbers, the most important one is the US$
10,000 – 100,000 range. The main difference, however, is that the distribution
of the value of exports which too remained stable with the most important
range being US$ 1 mn. and above and the highest ranges accounting for
more than 2/3rds of the total exports. Thus, in each of the years, about 3 per
cent of the exporters, numbering less than one thousand, accounted for two-
thirds of the exports indicating heavy concentration.

25
Table -I.9 Distribution of Exporters According to Total Exports in a Year
(Percentage) Exports Range
(US$) 1988-89 1989-90 1990-91 1991-92 1992-93 1993-94 1994-95(1) (2) (3) (4) (5) (6) (7) (8)
Distribution of Number of Exporters
Less than 1000 9.02 12.96 12.35 13.73 15.37 13.12 13.921000 – 5000 22.77 22.91 22.45 23.55 23.75 22.31 21.27
5000 – 10000 14.20 12.91 12.31 13.18 12.98 13.16 11.58
Sub-Total 45.99 48.78 47.11 50.46 52.10 48.59 46.7710000 – 100000 36.66 34.36 35.42 34.70 33.77 35.73 36.44
100000 – 250000 7.36 7.17 7.06 6.22 5.91 6.78 7.46250000 – 500000 4.07 3.63 3.95 3.60 3.20 3.52 3.91500000 – 1000000 2.66 2.63 2.87 2.25 2.33 2.53 2.53
Sub-Total 50.75 47.79 49.3 46.77 45.21 48.56 50.341000000 – 5000000 2.69 2.78 2.85 2.37 2.21 2.37 2.335000000 and more 0.57 0.67 0.74 0.41 0.48 0.48 0.55
Sub-Total 3.26 3.45 3.59 2.78 2.69 2.85 2.88
Total 100.00 100.00 100.00 100.00 100.00 100.00 100.00
Distribution of Exports Less than 1000 0.02 0.03 0.02 0.04 0.04 0.03 0.03
1000 – 5000 0.36 0.32 0.28 0.41 0.39 0.36 0.325000 – 10000 0.58 0.46 0.41 0.63 0.58 0.58 0.47
10000 – 100000 6.86 5.85 5.51 7.56 6.84 7.16 7.22
Sub-Total 7.82 6.66 6.22 8.64 7.85 8.13 8.04100000 - 250000 6.67 5.68 5.15 6.54 5.82 6.55 6.68250000 - 500000 8.19 6.48 6.42 8.35 6.95 7.52 7.81
500000 – 1000000 10.62 9.28 9.25 10.38 10.11 10.89 9.99
Sub-Total 25.48 21.44 20.82 25.27 22.88 24.96 24.481000000 – 5000000 31.11 29.32 27.23 32.08 28.25 29.12 26.585000000 and more 35.58 42.59 45.72 34.01 41.02 37.79 40.89
Sub-Total 66.69 71.91 72.95 66.09 69.27 66.91 67.47
Total 100.00 100.00 100.00 100.00 100.00 100.00 100.00
Table-I.10 provides the distribution of exporters according to broad
ownership characteristics. Practically all the exporters are non-government
ones and these accounted for 95 per cent or more of the exports in all the
years. With such a high share of non-government exporters, not
surprisingly, the distribution of non-government exports turns out to be
quite similar to the aggregate level distribution (Table-I.11). Within the non-
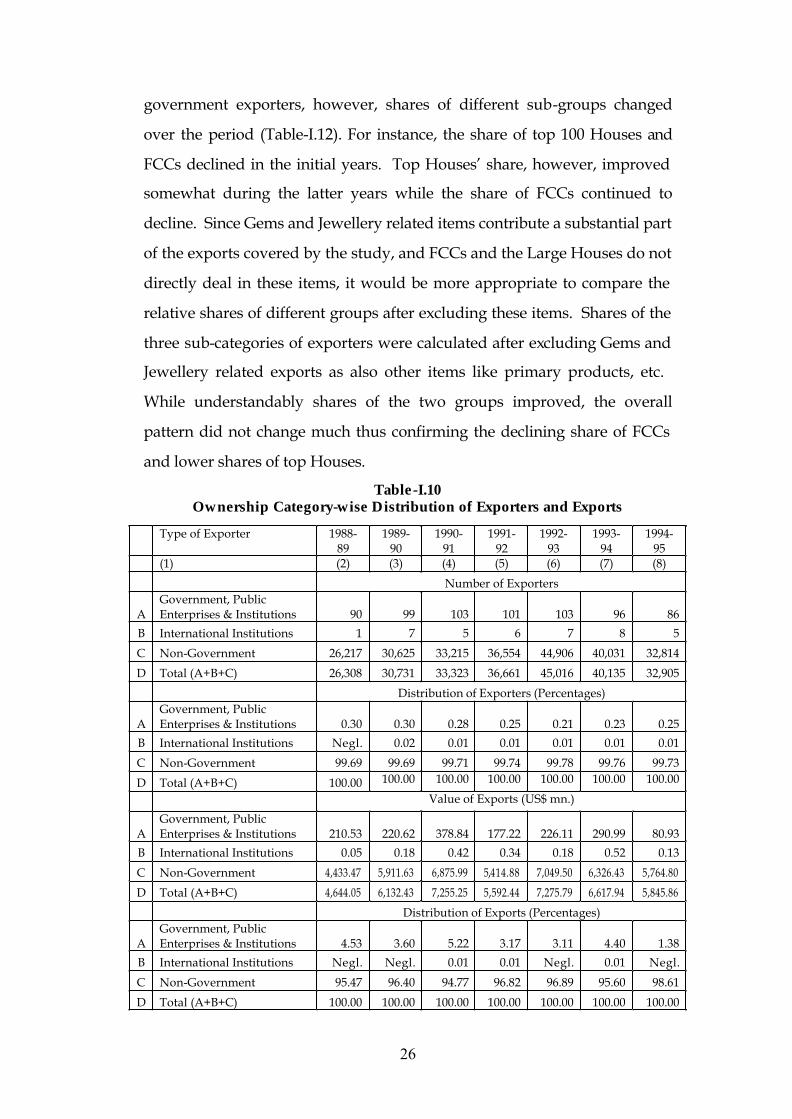
26
government exporters, however, shares of different sub-groups changed
over the period (Table-I.12). For instance, the share of top 100 Houses and
FCCs declined in the initial years. Top Houses’ share, however, improved
somewhat during the latter years while the share of FCCs continued to
decline. Since Gems and Jewellery related items contribute a substantial part
of the exports covered by the study, and FCCs and the Large Houses do not
directly deal in these items, it would be more appropriate to compare the
relative shares of different groups after excluding these items. Shares of the
three sub-categories of exporters were calculated after excluding Gems and
Jewellery related exports as also other items like primary products, etc.
While understandably shares of the two groups improved, the overall
pattern did not change much thus confirming the declining share of FCCs
and lower shares of top Houses.
Table-I.10 Ownership Category-wise Distribution of Exporters and Exports
Type of Exporter 1988-
89 1989-
90 1990-
91 1991-
92 1992-
93 1993-
94 1994-
95 (1) (2) (3) (4) (5) (6) (7) (8)
Number of Exporters
A Government, Public Enterprises & Institutions 90 99 103 101 103 96 86
B International Institutions 1 7 5 6 7 8 5
C Non-Government 26,217 30,625 33,215 36,554 44,906 40,031 32,814
D Total (A+B+C) 26,308 30,731 33,323 36,661 45,016 40,135 32,905
Distribution of Exporters (Percentages)
A Government, Public Enterprises & Institutions 0.30 0.30 0.28 0.25 0.21 0.23 0.25
B International Institutions Negl. 0.02 0.01 0.01 0.01 0.01 0.01
C Non-Government 99.69 99.69 99.71 99.74 99.78 99.76 99.73
D Total (A+B+C) 100.00 100.00 100.00 100.00 100.00 100.00 100.00
Value of Exports (US$ mn.)
A Government, Public Enterprises & Institutions 210.53 220.62 378.84 177.22 226.11 290.99 80.93
B International Institutions 0.05 0.18 0.42 0.34 0.18 0.52 0.13
C Non-Government 4,433.47 5,911.63 6,875.99 5,414.88 7,049.50 6,326.43 5,764.80
D Total (A+B+C) 4,644.05 6,132.43 7,255.25 5,592.44 7,275.79 6,617.94 5,845.86
Distribution of Exports (Percentages)
A Government, Public Enterprises & Institutions 4.53 3.60 5.22 3.17 3.11 4.40 1.38
B International Institutions Negl. Negl. 0.01 0.01 Negl. 0.01 Negl.
C Non-Government 95.47 96.40 94.77 96.82 96.89 95.60 98.61
D Total (A+B+C) 100.00 100.00 100.00 100.00 100.00 100.00 100.00

27
Table-I.11 Distribution of Non-Government Exporters According Total Exports in a Year
Value Range US $ 1988-89 1989-90 1990-91 1991-92 1992-93 1993-94 1994-95
(1) (2) (3) (4) (5) (6) (7) (8)
Distribution of Number of Exporters Less than 1000 9.04 12.99 12.38 13.75 15.40 13.15 13.95
1000 – 5000 22.82 22.96 22.50 23.58 23.79 22.36 21.30 5000 – 10000 14.24 12.94 12.33 13.21 13.00 13.18 11.60
10000 – 100000 36.67 34.37 35.47 34.72 33.79 35.75 36.45 100000 - 250000 7.34 7.12 7.03 6.19 5.89 6.76 7.44 250000 - 500000 4.05 3.62 3.93 3.58 3.18 3.50 3.88
500000 – 1000000 2.64 2.61 2.84 2.24 2.31 2.52 2.51 1000000 – 5000000 2.66 2.75 2.82 2.34 2.18 2.33 2.31 5000000 and more 0.54 0.64 0.71 0.39 0.45 0.46 0.54
Total 100.00 100.00 100.00 100.00 100.00 100.00 100.00 Total No. Exporters 26,217 30,625 33,215 36,554 44,906 40,031 32,814
Share in Total Value of Exports (Percentages)
Less than 1000 0.03 0.03 0.02 0.04 0.04 0.04 0.03 1000 – 5000 0.38 0.33 0.29 0.43 0.40 0.38 0.32 5000 – 10000 0.61 0.48 0.43 0.65 0.60 0.61 0.48
10000 – 100000 7.15 6.04 5.80 7.78 7.04 7.47 7.30 100000 - 250000 6.94 5.83 5.38 6.71 5.97 6.81 6.74 250000 - 500000 8.50 6.68 6.73 8.55 7.12 7.81 7.85
500000 – 1000000 11.00 9.51 9.63 10.64 10.32 11.29 10.00 1000000 – 5000000 31.87 29.84 28.35 32.68 28.72 29.86 26.68 5000000 and more 33.52 41.26 43.35 32.53 39.79 35.73 40.60
Total 100.00 100.00 100.00 100.00 100.00 100.00 100.00 Total Value of the Consignments US $ mn. 4,433 5,912 6,876 5,415 7,050 6,326 5,765
Table-I.12 Share of Various Categories in Total Non-Government Exports
According to Different Criteria (Percentages)
Year All Exports
After Excluding Chapters 01- 08, 10, 12-14,27 and 71#
After excluding Chapter 71 (Gems & Jewellery Related
Imports)
Top 100 Houses FCCs Others
Top 100 Houses FCCs Others
Top 100 Houses FCCs Others
(1) (2) (3) (4) (5) (6) (7) (8) (9) (10)
1988-89 14.77 6.61 78.62 19.35 8.71 71.95 17.58 8.15 74.28
1989-90 10.64 5.59 83.77 17.12 9.24 73.64 15.70 8.78 75.52
1990-91 10.91 5.36 83.73 16.60 8.39 75.01 15.36 7.97 76.67
1991-92 9.54 4.66 85.80 15.00 7.12 77.89 13.84 6.79 79.37
1992-93 9.41 4.36 86.23 15.31 6.85 77.84 14.55 6.67 78.78
1993-94 10.39 4.38 85.24 15.46 6.39 78.15 14.72 6.29 78.99
1994-95 10.11 4.26 85.64 16.10 5.62 78.28 14.89 5.71 79.40
# 01: Live Animals; 02: Meat & Edible Meat Ofal; 03: Fish, Moluscs, etc; 04: Dairy Products, etc.; 05: Products of Animal Origin, nes.; 06: Live Trees, Bulbs, et.; 07: Edible Vegetables, Roots & Tubers; 08: Edible Fruit & Nuts, etc. 10: Cereals; 12: Oil Seeds, Oleaginous Fruits, etc.; 13: Lac, Gums, etc.; 14: Vegetable Plaiting Materials; 27: Mineral Fuel, Oil, etc.; and 71: Natural Pearls, Precious Stones, etc.
28
Among the uses the DTR data can be put to is an analysis of the
changes in the export markets and the export basket. Diversification of
export markets is desirable because it not only reduces the risk but may also
suggest penetration into new markets. On the other hand, product
diversification may be related to export house activity and/or growing
diversification of activities by companies. The present exercise is limited to
an examination of market diversification in the pre-and-post-liberalisation
periods. To facilitate such an examination, Export DTRs were pooled for the
two years 1988-89 and 1989-90 representing the pre-liberalisation period
and 1993-94 and 1994-95 to compare the changes in the post-liberalisation
period. Non-government exporters common to both the periods were
identified. These numbered 12,035. The exporters were classified according
to the total exports in the initial period. By excluding exporters whose
aggregate exports in 19988-89 and 1989-90 were less than US$1 lakh – who
might have been counted as ‘exporters’ more due to lack of standardisation
of exporter names -- we were left with 5,246 exporters. These accounted for
85 per cent of total exports in the initial two years. The independent states
which emerged from the erstwhile USSR were treated as one country for
purposes of the present exercise since they did not exist separately in the
initial period. Herfindahl indices of concentration were calculated for each
exporter for the two two-year periods namely, 1989-90 and 1993-95 as the
sum of squared shares of individual countries in the exports of that party.
In the extreme situation of exports to only one country, the index takes the
value of one. Higher the dispersion, lower would be the index. The
number of companies in different ranges of the change in the Herfindahl
index and their percentage shares are presented in Table-I.13.
At the aggregate level, there are relatively more exporters whose
concentration ratios increased than the number of cases whose ratios
declined. However, larger exporters diversified more compared to the
smaller ones as in nearly two-thirds of the cases the index declined. The
index increased in only one-third of the cases. There are very few cases
29
where the concentration remained the same. Generally, the ratio remained
the same for relatively smaller exporters. Thus, while there was two-way
movement, larger exporters tended to either find new markets or their
exports were more evenly distributed among the importing countries.
Comparatively more of the top 50 House companies diversified their export
markets.
The smallest group has the largest proportion of cases where the
index remained the same. Also, concentration increased in a comparatively
larger proportion of smaller exporters. That there was no change in
concentration in case of smaller companies in a relatively larger number of
cases is valid in almost all sub-groups. Proportion of such companies is the
highest in case of non-large house, non-FCC categories. Comparatively
more Large House companies and FCCs diversified their export markets.
Table-I.14 shows that generally, the number of companies exporting
to only a single country or two countries increased substantially. This
happened particularly in case of the smaller exporters. Except in the highest
bracket of companies exporting to 20 countries or more, there has been an
over all decline in the number of companies exporting to 3 or more
countries. This shows that only those who were already well diversified
might have diversified their export markets further while the remaining
tried to focus on fewer markets. While at the aggregate level there are
fewer companies which increased the number of countries they were
exporting to, proportion of such cases is the highest in case of the largest
exporters (Table-I.15).
Overall, the largest exporters seem to have diversified their markets
more as also sought to spread the exports more evenly among the countries,
the smaller ones in general seem to have tried to focus on fewer markets.

30
Table-I.13 Changes in Concentration of Export Markets
in the Post-Liberalisation Period Size of Exports in the initial period
Distribution of Exporters according to the Extent of Change (%) in the Herfindahl Index (Percentages)
No. of Exporters
US $ mn. Less than -10
0 to -10 No Change 0 to 10 10 & above Total
(1) (2) (3) (4) (5) (6) (7) (8) Top 50 Houses
0.1 to 0.5 38.89 0.00 5.56 11.11 44.44 100.00 18
0.5 to 1 44.44 0.00 11.11 0.00 44.44 100.00 91 to 5 68.18 9.09 0.00 0.00 22.73 100.00 22
5 to 10 72.73 9.09 0.00 0.00 18.18 100.00 11
10 & above 69.23 3.85 0.00 0.00 26.92 100.00 26Sub-Total 60.47 4.65 2.33 2.33 30.23 100.00 86Second 50 Houses
0.1 to 0.5 53.33 6.67 0.00 13.33 26.67 100.00 150.5 to 1 44.44 0.00 11.11 0.00 44.44 100.00 9
1 to 5 60.00 0.00 0.00 0.00 40.00 100.00 20
5 to 10 57.14 14.29 0.00 0.00 28.57 100.00 710 & above 62.50 12.50 0.00 0.00 25.00 100.00 8
Sub-Total 55.93 5.08 1.69 3.39 33.90 100.00 59Other Indian Companies 0.1 to 0.5 34.59 6.71 7.93 6.97 43.81 100.00 2712
0.5 to 1 35.76 7.41 3.18 7.29 46.35 100.00 850
1 to 5 37.13 8.04 1.26 9.21 44.35 100.00 11075 to 10 46.67 9.70 1.21 9.70 32.73 100.00 165
10 & above 47.27 15.45 0.00 8.18 29.09 100.00 110
Sub-Total 36.04 7.42 5.22 7.65 43.67 100.00 4944Foreign-Controlled Cos.
0.1 to 0.5 60.00 2.00 2.00 4.00 32.00 100.00 50
0.5 to 1 39.39 6.06 0.00 6.06 48.48 100.00 331 to 5 54.55 13.64 0.00 9.09 22.73 100.00 44
5 to 10 70.00 0.00 0.00 20.00 10.00 100.00 10
10 & above 70.00 5.00 0.00 5.00 20.00 100.00 20Sub-Total 56.05 6.37 0.64 7.01 29.94 100.00 157All Exporters
0.1 to 0.5 35.17 6.58 7.76 6.98 43.51 100.00 27950.5 to 1 36.07 7.21 3.22 7.10 46.39 100.00 901
1 to 5 38.73 8.13 1.17 8.89 43.08 100.00 1193
5 to 10 49.74 9.33 1.04 9.33 30.57 100.00 19310 & above 54.27 12.20 0.00 6.10 27.44 100.00 164
Sub-Total 37.27 7.32 4.99 7.49 42.93 100.00 5246
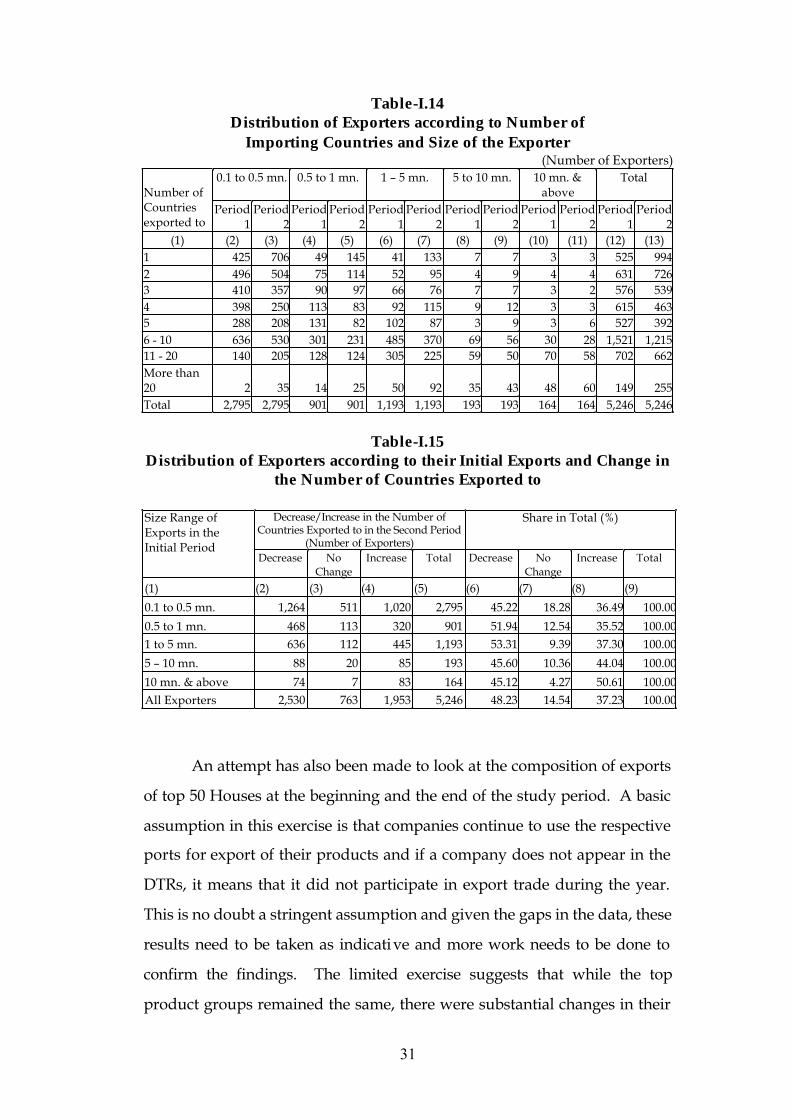
31
Table-I.14 Distribution of Exporters according to Number of
Importing Countries and Size of the Exporter (Number of Exporters)
0.1 to 0.5 mn. 0.5 to 1 mn. 1 – 5 mn. 5 to 10 mn. 10 mn. & above
Total Number of Countries exported to
Period 1
Period 2
Period 1
Period 2
Period 1
Period 2
Period 1
Period 2
Period 1
Period 2
Period 1
Period 2
(1) (2) (3) (4) (5) (6) (7) (8) (9) (10) (11) (12) (13) 1 425 706 49 145 41 133 7 7 3 3 525 9942 496 504 75 114 52 95 4 9 4 4 631 7263 410 357 90 97 66 76 7 7 3 2 576 5394 398 250 113 83 92 115 9 12 3 3 615 4635 288 208 131 82 102 87 3 9 3 6 527 3926 - 10 636 530 301 231 485 370 69 56 30 28 1,521 1,21511 - 20 140 205 128 124 305 225 59 50 70 58 702 662More than 20 2 35 14 25 50 92 35 43 48 60 149 255Total 2,795 2,795 901 901 1,193 1,193 193 193 164 164 5,246 5,246
Table-I.15
Distribution of Exporters according to their Initial Exports and Change in the Number of Countries Exported to
Decrease/Increase in the Number of
Countries Exported to in the Second Period (Number of Exporters)
Share in Total (%) Size Range of Exports in the Initial Period
Decrease
No Change
Increase Total Decrease No Change
Increase Total
(1) (2) (3) (4) (5) (6) (7) (8) (9)
0.1 to 0.5 mn. 1,264 511 1,020 2,795 45.22 18.28 36.49 100.00
0.5 to 1 mn. 468 113 320 901 51.94 12.54 35.52 100.001 to 5 mn. 636 112 445 1,193 53.31 9.39 37.30 100.00
5 – 10 mn. 88 20 85 193 45.60 10.36 44.04 100.00
10 mn. & above 74 7 83 164 45.12 4.27 50.61 100.00All Exporters 2,530 763 1,953 5,246 48.23 14.54 37.23 100.00
An attempt has also been made to look at the composition of exports
of top 50 Houses at the beginning and the end of the study period. A basic
assumption in this exercise is that companies continue to use the respective
ports for export of their products and if a company does not appear in the
DTRs, it means that it did not participate in export trade during the year.
This is no doubt a stringent assumption and given the gaps in the data, these
results need to be taken as indicative and more work needs to be done to
confirm the findings. The limited exercise suggests that while the top
product groups remained the same, there were substantial changes in their
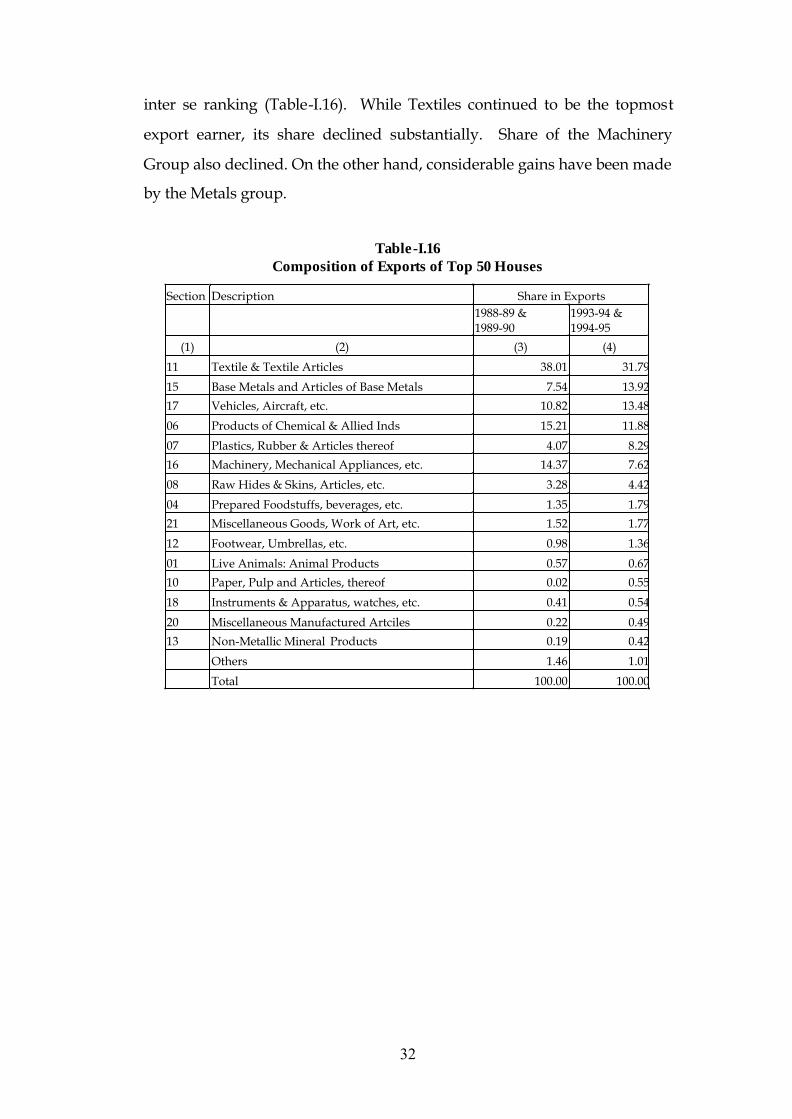
32
inter se ranking (Table-I.16). While Textiles continued to be the topmost
export earner, its share declined substantially. Share of the Machinery
Group also declined. On the other hand, considerable gains have been made
by the Metals group.
Table-I.16 Composition of Exports of Top 50 Houses
Section Description Share in Exports
1988-89 & 1989-90
1993-94 & 1994-95
(1) (2) (3) (4)
11 Textile & Textile Articles 38.01 31.79
15 Base Metals and Articles of Base Metals 7.54 13.92
17 Vehicles, Aircraft, etc. 10.82 13.48
06 Products of Chemical & Allied Inds 15.21 11.88
07 Plastics, Rubber & Articles thereof 4.07 8.29
16 Machinery, Mechanical Appliances, etc. 14.37 7.62
08 Raw Hides & Skins, Articles, etc. 3.28 4.42
04 Prepared Foodstuffs, beverages, etc. 1.35 1.79
21 Miscellaneous Goods, Work of Art, etc. 1.52 1.77
12 Footwear, Umbrellas, etc. 0.98 1.36
01 Live Animals: Animal Products 0.57 0.67
10 Paper, Pulp and Articles, thereof 0.02 0.55
18 Instruments & Apparatus, watches, etc. 0.41 0.54
20 Miscellaneous Manufactured Artciles 0.22 0.49
13 Non-Metallic Mineral Products 0.19 0.42
Others 1.46 1.01
Total 100.00 100.00
33
Section II Analysis of the Import DTRs
Under a single Bill of Entry (BE) more than one item can be imported.
As in the case of Shipping Bill, for purpose of the present exercise each BE is
treated as one consignment. While each item is assigned a value and
assessed separately for duty, only the total duty levied on the entire
consignment is reported in the DTR. The total number of import
consignments, their value and their sectoral distribution varied during the
seven years (Table-I.17). As can be seen from the last row of the Table, the
number of days for which the data was available varied widely. In view of
this, the study would focus on the distribution of consignments instead of
the absolute level of imports.
A distinguishing feature of the import data is the sharp jump in the
share of Gems and Jewellery related product group namely, ‘Natural or
Cultured Pearls, Gold, etc.’, in the last two years. This appears to be
mainly because of the relatively better coverage of Air Customs in 1994-95.
Otherwise the sections which continued to have an important place are: (i)
Machinery, Mechanical Appliances, etc.; (ii) Base Metals and their Articles;
(iii) Chemicals & Allied Products; (iv) Project Goods; (v) Mineral Products;
(vi) Plastics, Rubber Products, etc.; and (vii) Textiles & Textile Articles.
The value of import consignments, in different value ranges, suggests
a high degree of skewness (Table-I.18). The number of consignments, each
with value of less than US$10,000, constituted more than 60 per cent of the
consignments but generally accounted for about 6 per cent in terms of value.
Though the percentages varied over the years, the number of consignments
in the lower ranges accounted for at least half of the consignments but their
share in imports remained quite low; the maximum ever reached being 7 per
cent. On the other hand, the number of large consignments each with US$
100,000 and above, while accounting for about 5 per cent of the total
consignments accounted between half to two-thirds of the exports value.
The range of US$ 10,000 – 100,000 has turned out to be an important one as
its share in the number of consignments and in value was substantial.

34
Table-1.17
Some Basic Particulars of Import DTRs (Percentages)
Section 1988-89 1989-90 1990-91 1991-92 1992-93 1993-94 1994-95
(1) (2) (3) (4) (5) (6) (7) (8) 1 Live Animals: Animal Products 1.35 1.08 0.19 0.30 0.26 0.12 0.322 Vegetable Products 3.70 1.87 3.50 2.99 3.43 2.98 2.563 Animal or vegetable Fats, oils, etc. 2.91 1.09 1.05 1.10 0.72 0.80 1.084 Prepared Foodstuffs, beverages, etc . 0.27 0.29 0.18 0.31 0.34 0.21 1.335 Mineral Products 4.44 3.50 8.42 4.07 3.59 3.18 7.746 Products of Chemical & Allied
Industries 12.59 14.95 13.99 14.59 16.37 11.93 10.557 Plastics, Rubber & Articles thereof 6.99 7.46 6.37 9.24 6.07 4.64 5.458 Raw Hides & Skins, Articles, etc. 0.11 0.14 0.12 0.21 0.1 0.07 0.079 Wood & Articles of Wood, etc. 0.27 0.30 0.33 0.29 0.45 0.22 0.37
10 Paper, Pulp and Articles, thereof 4.11 4.32 5.03 4.32 4.67 4.05 3.3611 Textile & Textile Articles 4.60 4.78 4.02 4.04 5.15 4.32 5.4612 Footwear, Umbrellas, etc. 0.06 0.11 0.07 0.08 0.07 0.08 0.0313 Non-Metallic Mineral Products 0.62 0.68 0.68 0.73 0.65 0.44 0.4314 Natural or Cultured Pearls, Gold,
Silver, etc. 0.83 1.69 1.51 0.85 2.62 18.52 18.0415 Base Metals and Articles of Base
Metals 18.95 23.69 19.15 18.97 20.42 14.08 15.1316 Machinery, Mechanical
Appliances, etc. 17.88 21.41 19.40 21.93 21.32 20.03 16.0317 Vehicles, Aircraft, etc. 2.37 2.66 5.17 2.61 2.42 4.14 2.1218 Instruments & Apparatus,
watches, etc. 2.18 3.04 2.82 2.57 2.94 2.43 1.6319 Arms & Ammunition, etc 0.02 0..06 0.01 0.10 0.03 0.01 0.0120 Miscellaneous Manufactured
Articles 0.17 0.16 0.13 0.23 0.1 0.09 0.1821 Miscellaneous Goods, Work of
Art, etc. 8.50 1.68 2.01 0.13 0.03 0.02 0.0122 Project Goods 7.08 5.04 5.85 10.34 8.25 7.64 8.10
All Sections 100.00 100.00 100.00 100.00 100.00 100.00 100.00 Amount (Rs. Cr.) 8,722 9,095 11,072 11,312 14,169 20,656 18,430 Amount (US$ mn.) 6,018 5,466 6,167 4,593 4,888 6,589 5,835 No. of Days Covered: Sea
Air 197227
206167
227180
241227
203214
227217
59146
No. of Consignments 1,96,778 1,78,387 2,00,420 1,78,337 1,75,849 2,10,116 1,21,931
No. of Records 2,95,805 2,91,062 3,35,817 2,83,190 2,75,824 3,11,798 1,83,165
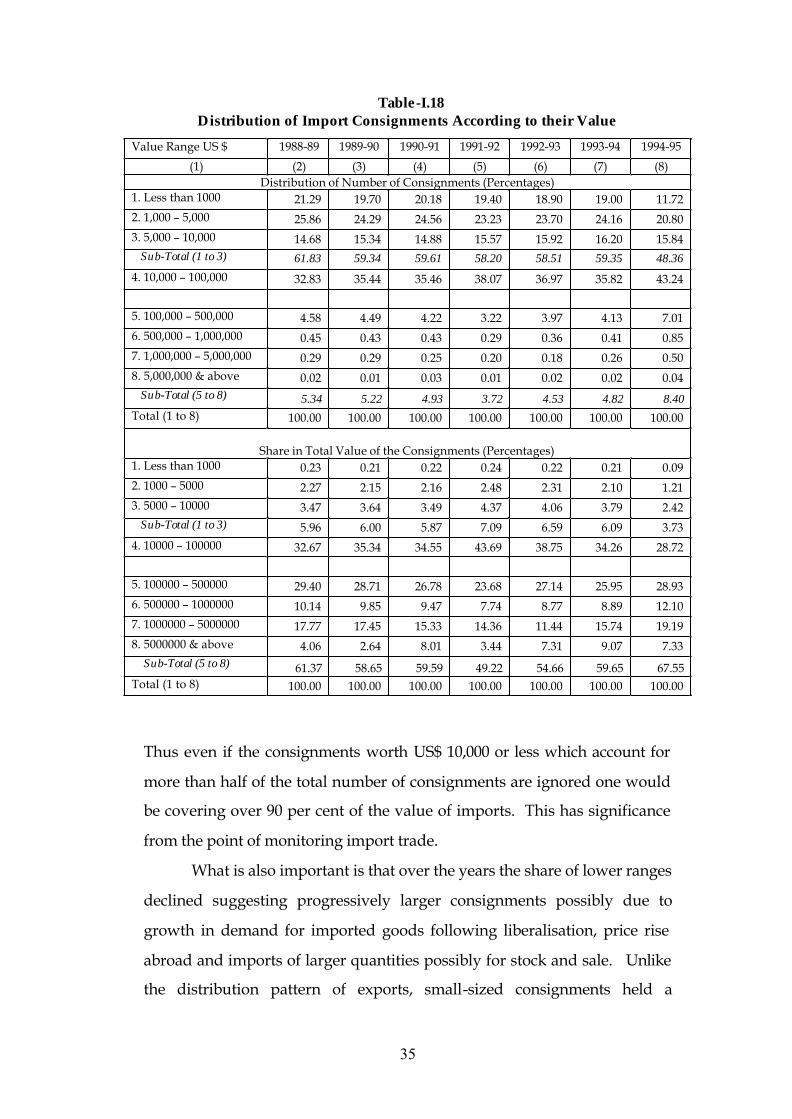
35
Table-I.18 Distribution of Import Consignments According to their Value
Value Range US $ 1988-89 1989-90 1990-91 1991-92 1992-93 1993-94 1994-95
(1) (2) (3) (4) (5) (6) (7) (8) Distribution of Number of Consignments (Percentages)
1. Less than 1000 21.29 19.70 20.18 19.40 18.90 19.00 11.72 2. 1,000 – 5,000 25.86 24.29 24.56 23.23 23.70 24.16 20.80 3. 5,000 – 10,000 14.68 15.34 14.88 15.57 15.92 16.20 15.84 Sub-Total (1 to 3) 61.83 59.34 59.61 58.20 58.51 59.35 48.36 4. 10,000 – 100,000 32.83 35.44 35.46 38.07 36.97 35.82 43.24 5. 100,000 – 500,000 4.58 4.49 4.22 3.22 3.97 4.13 7.01 6. 500,000 – 1,000,000 0.45 0.43 0.43 0.29 0.36 0.41 0.85 7. 1,000,000 – 5,000,000 0.29 0.29 0.25 0.20 0.18 0.26 0.50 8. 5,000,000 & above 0.02 0.01 0.03 0.01 0.02 0.02 0.04 Sub-Total (5 to 8) 5.34 5.22 4.93 3.72 4.53 4.82 8.40 Total (1 to 8) 100.00 100.00 100.00 100.00 100.00 100.00 100.00
Share in Total Value of the Consignments (Percentages)
1. Less than 1000 0.23 0.21 0.22 0.24 0.22 0.21 0.09 2. 1000 – 5000 2.27 2.15 2.16 2.48 2.31 2.10 1.21 3. 5000 – 10000 3.47 3.64 3.49 4.37 4.06 3.79 2.42 Sub-Total (1 to 3) 5.96 6.00 5.87 7.09 6.59 6.09 3.73 4. 10000 – 100000 32.67 35.34 34.55 43.69 38.75 34.26 28.72 5. 100000 – 500000 29.40 28.71 26.78 23.68 27.14 25.95 28.93 6. 500000 – 1000000 10.14 9.85 9.47 7.74 8.77 8.89 12.10 7. 1000000 – 5000000 17.77 17.45 15.33 14.36 11.44 15.74 19.19 8. 5000000 & above 4.06 2.64 8.01 3.44 7.31 9.07 7.33 Sub-Total (5 to 8) 61.37 58.65 59.59 49.22 54.66 59.65 67.55 Total (1 to 8) 100.00 100.00 100.00 100.00 100.00 100.00 100.00
Thus even if the consignments worth US$ 10,000 or less which account for
more than half of the total number of consignments are ignored one would
be covering over 90 per cent of the value of imports. This has significance
from the point of monitoring import trade.
What is also important is that over the years the share of lower ranges
declined suggesting progressively larger consignments possibly due to
growth in demand for imported goods following liberalisation, price rise
abroad and imports of larger quantities possibly for stock and sale. Unlike
the distribution pattern of exports, small-sized consignments held a

36
relatively smaller share in the overall imports. The pattern of exports is
noticeably different when compared to the pattern of imports.
Importers do not obtain their supplies in a single consignment or
from the same source. There could be multiple import consignments
depending upon the items imported, the suppliers, and the time of import.
Along with an analysis of the consignments it is, therefore, necessary to view
imports in terms of the identity of the importers. As explained above, an
extensive exercise to standardise the importing and exporting parties was
undertaken. Given the large number of consignments, the exercise
obviously suffered from certain limitations. After the initial level of
standardisation, special attention was placed on the importers with
relatively large imports. In any case, in each of the years, those importing at
least US$0.25 million worth of goods were paid special attention. Thus in
the lower ranges what appears as number of importers can be more
realistically referred to as importer names instead of importers as such. For
instance, Godrej & Boyce Mfg Co Pvt Ltd appeared in 587 different ways in
the original DTRs and even a simpler name like Mazagon Dock Ltd was
entered in 168 ways. After the series of standardisations we noticed that the
two have been reduced to 44 and 36 different forms respectively. In the
computations, this case will be treated as 44 different ‘importers’. Table-I.19
shows the frequency distribution of ‘importer names’ after the series of name
standardisations. In case of ‘Godrej & Boyce’ the main name which has been
used for classification purposes, accounts for nearly 97 per cent of the total
imports of ‘Godrej & Boyce’. In the standardised data file what appears as
importers should, therefore strictly be considered as ‘importer names’ and
not importers as such. For the sake of convenience, however, these would be
referred to as importers only.
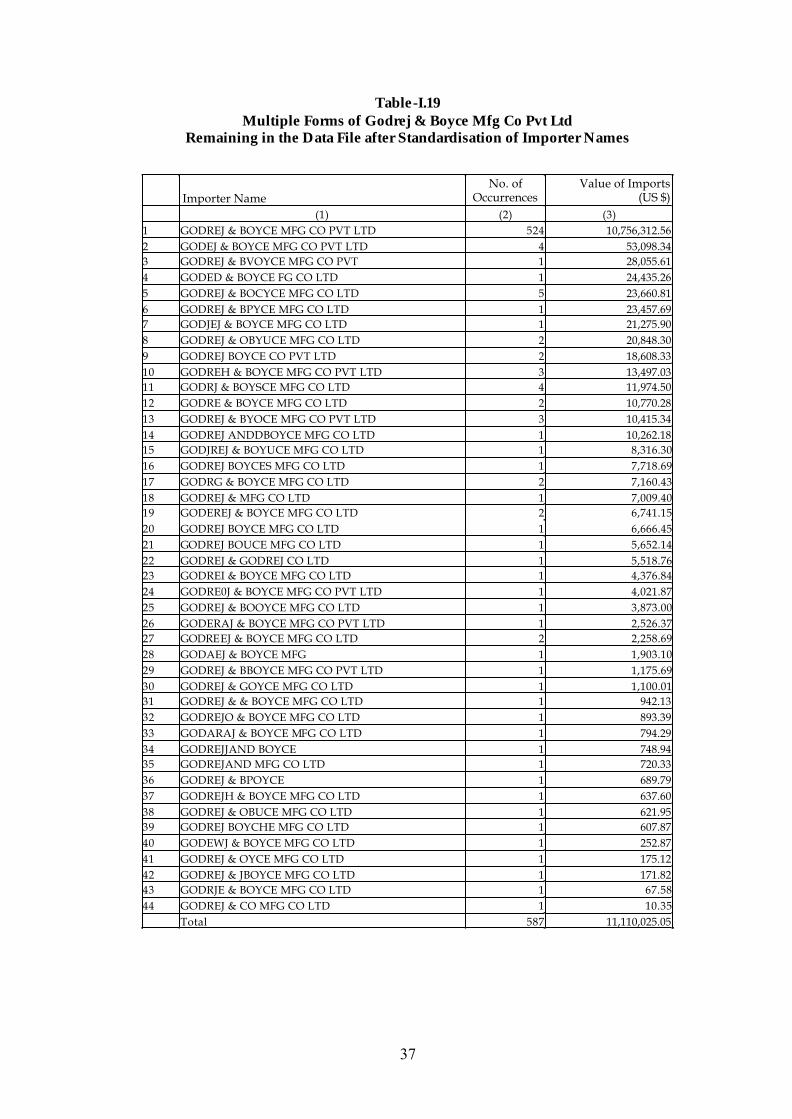
37
Table-I.19 Multiple Forms of Godrej & Boyce Mfg Co Pvt Ltd
Remaining in the Data File after Standardisation of Importer Names
Importer Name
No. of Occurrences
Value of Imports (US $)
(1) (2) (3) 1 GODREJ & BOYCE MFG CO PVT LTD 524 10,756,312.562 GODEJ & BOYCE MFG CO PVT LTD 4 53,098.343 GODREJ & BVOYCE MFG CO PVT 1 28,055.614 GODED & BOYCE FG CO LTD 1 24,435.265 GODREJ & BOCYCE MFG CO LTD 5 23,660.816 GODREJ & BPYCE MFG CO LTD 1 23,457.697 GODJEJ & BOYCE MFG CO LTD 1 21,275.908 GODREJ & OBYUCE MFG CO LTD 2 20,848.309 GODREJ BOYCE CO PVT LTD 2 18,608.3310 GODREH & BOYCE MFG CO PVT LTD 3 13,497.0311 GODRJ & BOYSCE MFG CO LTD 4 11,974.5012 GODRE & BOYCE MFG CO LTD 2 10,770.2813 GODREJ & BYOCE MFG CO PVT LTD 3 10,415.3414 GODREJ ANDDBOYCE MFG CO LTD 1 10,262.1815 GODJREJ & BOYUCE MFG CO LTD 1 8,316.3016 GODREJ BOYCES MFG CO LTD 1 7,718.6917 GODRG & BOYCE MFG CO LTD 2 7,160.4318 GODREJ & MFG CO LTD 1 7,009.4019 GODEREJ & BOYCE MFG CO LTD 2 6,741.1520 GODREJ BOYCE MFG CO LTD 1 6,666.4521 GODREJ BOUCE MFG CO LTD 1 5,652.1422 GODREJ & GODREJ CO LTD 1 5,518.7623 GODREI & BOYCE MFG CO LTD 1 4,376.8424 GODRE0J & BOYCE MFG CO PVT LTD 1 4,021.8725 GODREJ & BOOYCE MFG CO LTD 1 3,873.0026 GODERAJ & BOYCE MFG CO PVT LTD 1 2,526.3727 GODREEJ & BOYCE MFG CO LTD 2 2,258.6928 GODAEJ & BOYCE MFG 1 1,903.1029 GODREJ & BBOYCE MFG CO PVT LTD 1 1,175.6930 GODREJ & GOYCE MFG CO LTD 1 1,100.0131 GODREJ & & BOYCE MFG CO LTD 1 942.1332 GODREJO & BOYCE MFG CO LTD 1 893.3933 GODARAJ & BOYCE MFG CO LTD 1 794.2934 GODREJJAND BOYCE 1 748.9435 GODREJAND MFG CO LTD 1 720.3336 GODREJ & BPOYCE 1 689.7937 GODREJH & BOYCE MFG CO LTD 1 637.6038 GODREJ & OBUCE MFG CO LTD 1 621.9539 GODREJ BOYCHE MFG CO LTD 1 607.8740 GODEWJ & BOYCE MFG CO LTD 1 252.8741 GODREJ & OYCE MFG CO LTD 1 175.1242 GODREJ & JBOYCE MFG CO LTD 1 171.8243 GODRJE & BOYCE MFG CO LTD 1 67.5844 GODREJ & CO MFG CO LTD 1 10.35 Total 587 11,110,025.05

38
Understandably, the skewness in distribution becomes more
pronounced when the distribution of importers was examined than what
was observed in the case of the consignment distribution (Table-I.20). The
overall number of importers varied and ranged between 23,000 to about
30,000. The value of imports by nearly half the number of importers was less
than 1 per cent. On the other hand, the number of importers, each importing
more than US$0.25 million worth of goods in a year ranged between 2,000
and 2,700 thus constituting a maximum of 10.60 per cent of the total number
of importers in any year. Incidentally, these are also the ones on which
special attention was placed while standardising the importer names. Their
share in imports value was far higher at about 88 per cent. At the higher end
of this range were less than 200 importers in each of the years (except in
1993-94 when it was slightly higher at 210) who accounted for about half of
the total imports.14
There is thus a high degree of concentration at the top. This is not
surprising since the DTR includes major public sector importing
enterprises also. Table-I.21 shows broad ownership group-wise
distribution of importers and the corresponding share in imports. The
number of Indian public sector organisations engaged in imports was
quite small but their share in imports value was substantial. In 1988-89
their share in imports was a little above 30 per cent. Over the years,
however, share of the sector declined and towards the end fell to almost
half of the initial value. Correspondingly, the private sector’s share
increased and reached about 84 per cent by the end of the period. The
share of international organisations was only marginal. As the next step
we, therefore, look at the imports of private sector importers. Table-I.22
shows the distribution after excluding importers that fall under
Government companies, departments, hospitals, universities and colleges,
embassies and other supra-national bodies like U.N. There is a change in
14 . There is still considerable scope for standardisation of names which may result in the share of
higher ranges increasing further and a corresponding reduction in the number of importing parties.
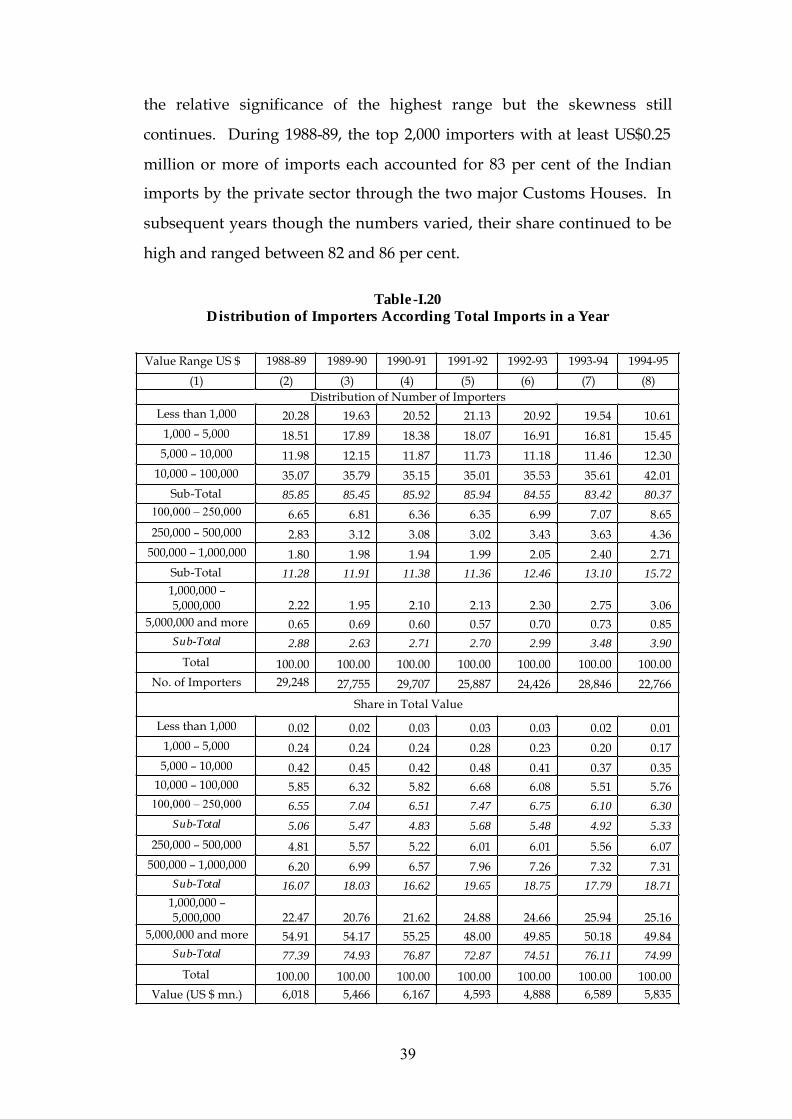
39
the relative significance of the highest range but the skewness still
continues. During 1988-89, the top 2,000 importers with at least US$0.25
million or more of imports each accounted for 83 per cent of the Indian
imports by the private sector through the two major Customs Houses. In
subsequent years though the numbers varied, their share continued to be
high and ranged between 82 and 86 per cent.
Table-I.20
Distribution of Importers According Total Imports in a Year
Value Range US $ 1988-89 1989-90 1990-91 1991-92 1992-93 1993-94 1994-95
(1) (2) (3) (4) (5) (6) (7) (8) Distribution of Number of Importers
Less than 1,000 20.28 19.63 20.52 21.13 20.92 19.54 10.61 1,000 – 5,000 18.51 17.89 18.38 18.07 16.91 16.81 15.45 5,000 – 10,000 11.98 12.15 11.87 11.73 11.18 11.46 12.30
10,000 – 100,000 35.07 35.79 35.15 35.01 35.53 35.61 42.01 Sub-Total 85.85 85.45 85.92 85.94 84.55 83.42 80.37
100,000 – 250,000 6.65 6.81 6.36 6.35 6.99 7.07 8.65 250,000 – 500,000 2.83 3.12 3.08 3.02 3.43 3.63 4.36
500,000 – 1,000,000 1.80 1.98 1.94 1.99 2.05 2.40 2.71 Sub-Total 11.28 11.91 11.38 11.36 12.46 13.10 15.72 1,000,000 – 5,000,000 2.22 1.95 2.10 2.13 2.30 2.75 3.06
5,000,000 and more 0.65 0.69 0.60 0.57 0.70 0.73 0.85 Sub-Total 2.88 2.63 2.71 2.70 2.99 3.48 3.90
Total 100.00 100.00 100.00 100.00 100.00 100.00 100.00 No. of Importers 29,248 27,755 29,707 25,887 24,426 28,846 22,766
Share in Total Value
Less than 1,000 0.02 0.02 0.03 0.03 0.03 0.02 0.01 1,000 – 5,000 0.24 0.24 0.24 0.28 0.23 0.20 0.17 5,000 – 10,000 0.42 0.45 0.42 0.48 0.41 0.37 0.35
10,000 – 100,000 5.85 6.32 5.82 6.68 6.08 5.51 5.76 100,000 – 250,000 6.55 7.04 6.51 7.47 6.75 6.10 6.30
Sub-Total 5.06 5.47 4.83 5.68 5.48 4.92 5.33 250,000 – 500,000 4.81 5.57 5.22 6.01 6.01 5.56 6.07
500,000 – 1,000,000 6.20 6.99 6.57 7.96 7.26 7.32 7.31 Sub-Total 16.07 18.03 16.62 19.65 18.75 17.79 18.71
1,000,000 – 5,000,000 22.47 20.76 21.62 24.88 24.66 25.94 25.16
5,000,000 and more 54.91 54.17 55.25 48.00 49.85 50.18 49.84 Sub-Total 77.39 74.93 76.87 72.87 74.51 76.11 74.99
Total 100.00 100.00 100.00 100.00 100.00 100.00 100.00 Value (US $ mn.) 6,018 5,466 6,167 4,593 4,888 6,589 5,835
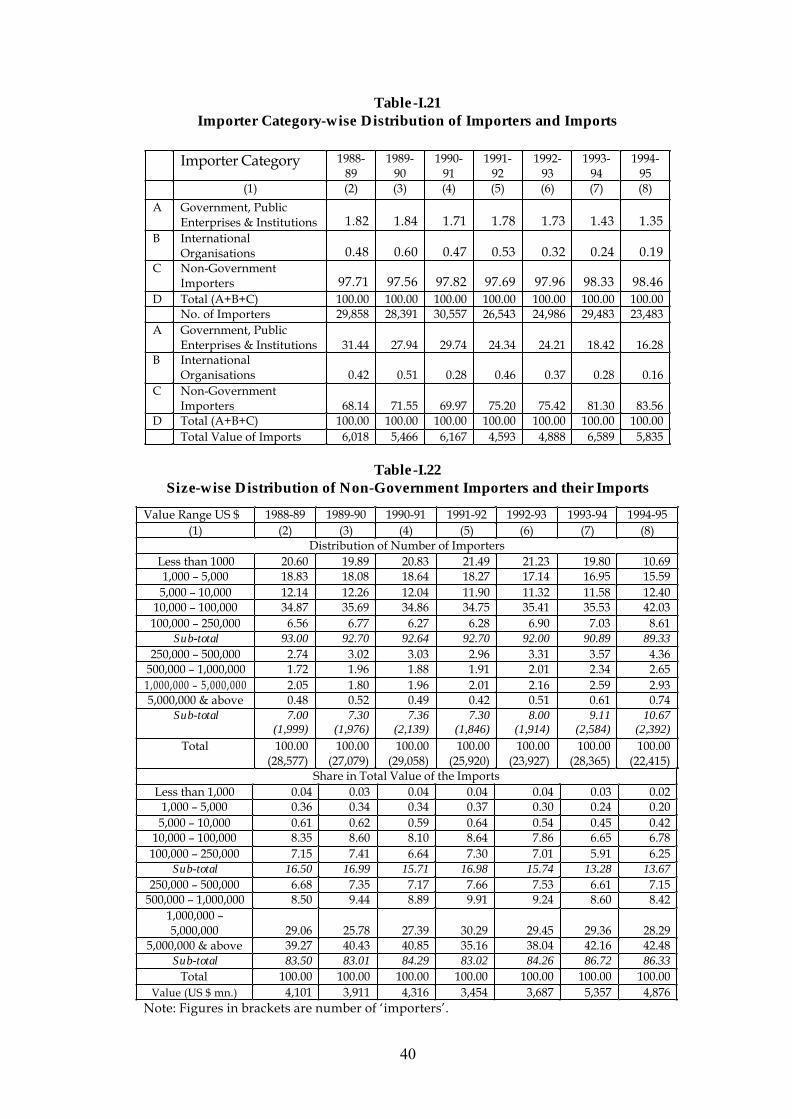
40
Table-I.21 Importer Category-wise Distribution of Importers and Imports
Importer Category 1988-89
1989-90
1990-91
1991-92
1992-93
1993-94
1994-95
(1) (2) (3) (4) (5) (6) (7) (8)
A Government, Public Enterprises & Institutions 1.82 1.84 1.71 1.78 1.73 1.43 1.35
B International Organisations 0.48 0.60 0.47 0.53 0.32 0.24 0.19
C Non-Government Importers 97.71 97.56 97.82 97.69 97.96 98.33 98.46
D Total (A+B+C) 100.00 100.00 100.00 100.00 100.00 100.00 100.00 No. of Importers 29,858 28,391 30,557 26,543 24,986 29,483 23,483 A Government, Public
Enterprises & Institutions 31.44 27.94 29.74 24.34 24.21 18.42 16.28 B International
Organisations 0.42 0.51 0.28 0.46 0.37 0.28 0.16 C Non-Government
Importers 68.14 71.55 69.97 75.20 75.42 81.30 83.56 D Total (A+B+C) 100.00 100.00 100.00 100.00 100.00 100.00 100.00 Total Value of Imports 6,018 5,466 6,167 4,593 4,888 6,589 5,835
Table-I.22 Size-wise Distribution of Non-Government Importers and their Imports
Value Range US $ 1988-89 1989-90 1990-91 1991-92 1992-93 1993-94 1994-95 (1) (2) (3) (4) (5) (6) (7) (8)
Distribution of Number of Importers Less than 1000 20.60 19.89 20.83 21.49 21.23 19.80 10.69 1,000 – 5,000 18.83 18.08 18.64 18.27 17.14 16.95 15.59 5,000 – 10,000 12.14 12.26 12.04 11.90 11.32 11.58 12.40
10,000 – 100,000 34.87 35.69 34.86 34.75 35.41 35.53 42.03 100,000 – 250,000 6.56 6.77 6.27 6.28 6.90 7.03 8.61
Sub-total 93.00 92.70 92.64 92.70 92.00 90.89 89.33 250,000 – 500,000 2.74 3.02 3.03 2.96 3.31 3.57 4.36
500,000 – 1,000,000 1.72 1.96 1.88 1.91 2.01 2.34 2.65 1,000,000 – 5,000,000 2.05 1.80 1.96 2.01 2.16 2.59 2.93 5,000,000 & above 0.48 0.52 0.49 0.42 0.51 0.61 0.74
Sub-total 7.00 (1,999)
7.30 (1,976)
7.36 (2,139)
7.30 (1,846)
8.00 (1,914)
9.11 (2,584)
10.67 (2,392)
Total 100.00 (28,577)
100.00 (27,079)
100.00 (29,058)
100.00 (25,920)
100.00 (23,927)
100.00 (28,365)
100.00 (22,415)
Share in Total Value of the Imports Less than 1,000 0.04 0.03 0.04 0.04 0.04 0.03 0.02
1,000 – 5,000 0.36 0.34 0.34 0.37 0.30 0.24 0.20 5,000 – 10,000 0.61 0.62 0.59 0.64 0.54 0.45 0.42
10,000 – 100,000 8.35 8.60 8.10 8.64 7.86 6.65 6.78 100,000 – 250,000 7.15 7.41 6.64 7.30 7.01 5.91 6.25
Sub-total 16.50 16.99 15.71 16.98 15.74 13.28 13.67 250,000 – 500,000 6.68 7.35 7.17 7.66 7.53 6.61 7.15
500,000 – 1,000,000 8.50 9.44 8.89 9.91 9.24 8.60 8.42 1,000,000 – 5,000,000 29.06 25.78 27.39 30.29 29.45 29.36 28.29
5,000,000 & above 39.27 40.43 40.85 35.16 38.04 42.16 42.48 Sub-total 83.50 83.01 84.29 83.02 84.26 86.72 86.33
Total 100.00 100.00 100.00 100.00 100.00 100.00 100.00 Value (US $ mn.) 4,101 3,911 4,316 3,454 3,687 5,357 4,876
Note: Figures in brackets are number of ‘importers’.
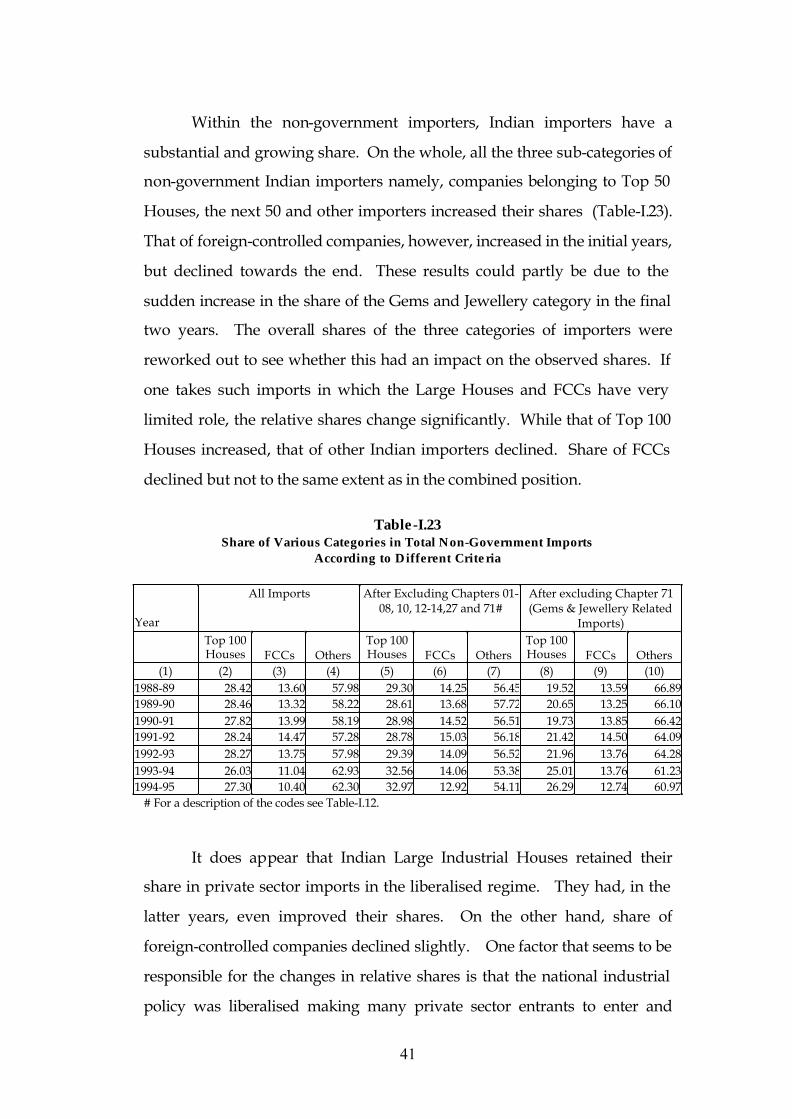
41
Within the non-government importers, Indian importers have a
substantial and growing share. On the whole, all the three sub-categories of
non-government Indian importers namely, companies belonging to Top 50
Houses, the next 50 and other importers increased their shares (Table-I.23).
That of foreign-controlled companies, however, increased in the initial years,
but declined towards the end. These results could partly be due to the
sudden increase in the share of the Gems and Jewellery category in the final
two years. The overall shares of the three categories of importers were
reworked out to see whether this had an impact on the observed shares. If
one takes such imports in which the Large Houses and FCCs have very
limited role, the relative shares change significantly. While that of Top 100
Houses increased, that of other Indian importers declined. Share of FCCs
declined but not to the same extent as in the combined position.
Table-I.23
Share of Various Categories in Total Non-Government Imports According to Different Criteria
Year
All Imports After Excluding Chapters 01- 08, 10, 12-14,27 and 71#
After excluding Chapter 71 (Gems & Jewellery Related
Imports)
Top 100 Houses FCCs Others
Top 100 Houses FCCs Others
Top 100 Houses FCCs Others
(1) (2) (3) (4) (5) (6) (7) (8) (9) (10) 1988-89 28.42 13.60 57.98 29.30 14.25 56.45 19.52 13.59 66.891989-90 28.46 13.32 58.22 28.61 13.68 57.72 20.65 13.25 66.101990-91 27.82 13.99 58.19 28.98 14.52 56.51 19.73 13.85 66.421991-92 28.24 14.47 57.28 28.78 15.03 56.18 21.42 14.50 64.091992-93 28.27 13.75 57.98 29.39 14.09 56.52 21.96 13.76 64.281993-94 26.03 11.04 62.93 32.56 14.06 53.38 25.01 13.76 61.231994-95 27.30 10.40 62.30 32.97 12.92 54.11 26.29 12.74 60.97
# For a description of the codes see Table-I.12.
It does appear that Indian Large Industrial Houses retained their
share in private sector imports in the liberalised regime. They had, in the
latter years, even improved their shares. On the other hand, share of
foreign-controlled companies declined slightly. One factor that seems to be
responsible for the changes in relative shares is that the national industrial
policy was liberalised making many private sector entrants to enter and
42
expand in areas that were hitherto reserved for the public sector. Many of
such entrants being new they might not have been taken note of while
generating the list of top Houses by CMIE. A second relevant factor is that
the booming stock market enabled many non-house entities and non-FCCs
to take up large projects. This happened especially in the metals industry
requiring heavy investments. Out of the top 50 non-government importers
in 1994-95, there were 12 companies who were in basic metal industries. The
other important categories were Textiles and Gems & Jewellery.

43
Section III
Transfer Pricing in Trade Transactions In this part of the study an attempt has been made to view at the
'grey' area where there is potential for 'transfer pricing'. Transfer pricing
refers to prices at which goods and services are exchanged between business
associates. This practice is often associated with transnational corporations
in situations when prices could be consciously fixed to benefit one of the
transacting party. Prices fixed under this practice could be quite different
from market transactions between unrelated parties (i.e. arm’s length prices).
Operationally, transfer pricing takes the form of over and under invoicing
and is motivated by a desire to negate government regulations may it be in
the field of corporate tax, excise or custom duties, currency regulations,
norms on business profits, or in licensing of production and guidelines for
other business payments. It could even be related to the extent of ownership
as between wholly-owned subsidiaries, joint ventures and various other
degrees of outside ownership. For instance, in case of part-owned
enterprises (e.g., listing on host country stock exchanges), the foreign
company would only get a share in profits proportionate to its share in the
enterprise’s equity unlike in a wholly-owned subsidiary. The capacity to
indulge in transfer pricing is a direct function of the international network of
business associations while the need for it is dictated by taxes, duties and
ownership levels. In this sense, TNCs are more conveniently placed to
effectively practice transfer pricing as also have the need to practice the
same.
Transfer pricing is, therefore, often discussed with reference to
intra-firm trade across national borders. However, there are instances of
transfer pricing between companies which are neither subsidiaries nor a
part of the same corporate group and the two may even be residents of the
same country. Tie-in clauses in licensing agreements or technical or

44
financial collaborations may make it obligatory on one party to purchase
goods from the licenser or parties designated by the licenser. The supplier
and buyer need not be TNCs; the two could be personally related or have
close business association. The phenomenon of buy-back agreements and
selling agencies involving NRIs and OCBs is a case in point.
Over the past few years, Indian investments abroad are growing fast
(Table-I.24). In addition to the officially established joint ventures, there are
a number of foreign subsidiaries of Indian companies and other foreign
companies in which Indian companies own share capital. Table-I.25 shows
an illustrative list of overseas companies in which a few leading Indian
companies/houses hold shares and/or Indians are directors. The growth in
Indian direct investments abroad underline the need to broaden the scope
for detection of transfer pricing to focus on the Indian enterprises as well. 1
Table-I.24 Indian Direct Investment Abroad
Year (End-March)
Amount (US$ mn.)
(1) (2) 1987 97 1992 247 1996 481 1997 618 1998 706 1999 1,707 2000 1,859 2001 2,373 2002 3,012
Source: Reserve Bank of India.
1 The policy with regard to investments abroad by Indian enterprises has been relaxed over time.
From earlier investments abroad were allowed mainly through export of capital goods. Now companies can acquire enterprises in other countries through direct purchases. Budget 2001-02, for instance, doubled the outward limit investment from US $ 50 million to up to US $ 100 million on an annual basis through the automatic route. Similarly, Indian companies making overseas investment in joint ventures abroad by market purchases were allowed to do so without prior approval up to 50 per cent of their net worth. The earlier limit was 25 per cent.
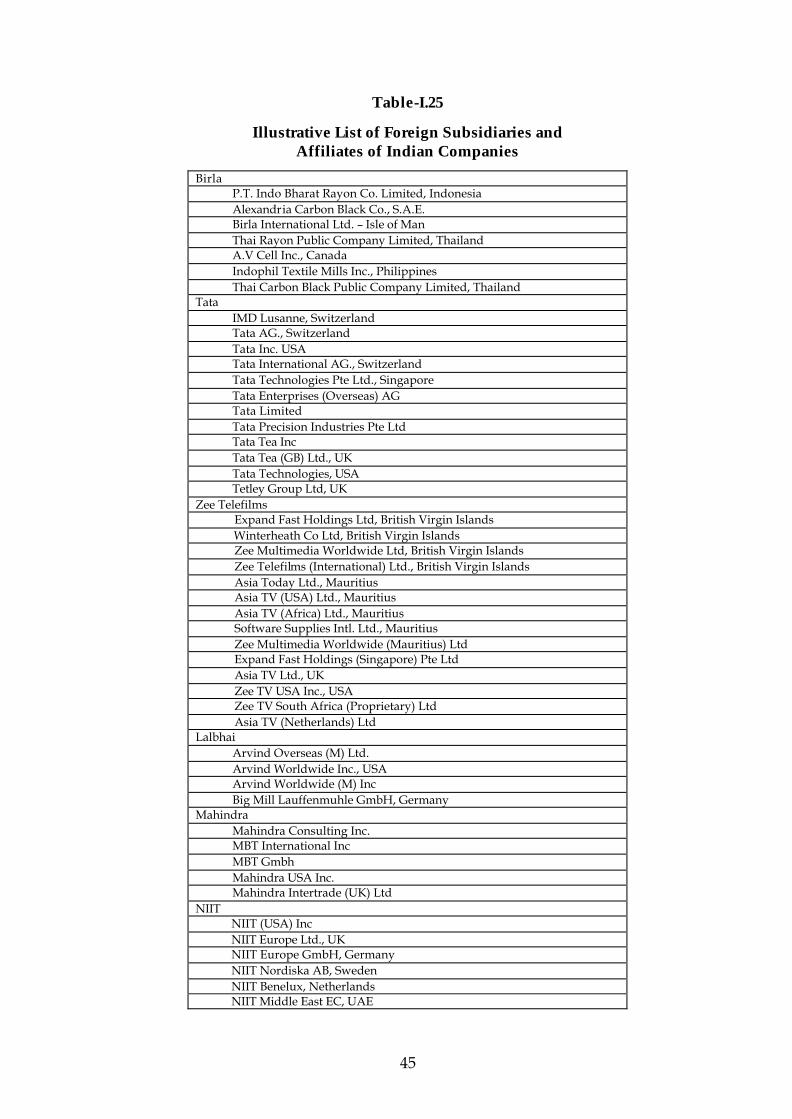
45
Table-I.25
Illustrative List of Foreign Subsidiaries and Affiliates of Indian Companies
Birla P.T. Indo Bharat Rayon Co. Limited, Indonesia Alexandria Carbon Black Co., S.A.E. Birla International Ltd. – Isle of Man Thai Rayon Public Company Limited, Thailand A.V Cell Inc., Canada Indophil Textile Mills Inc., Philippines Thai Carbon Black Public Company Limited, Thailand
Tata IMD Lusanne, Switzerland Tata AG., Switzerland Tata Inc. USA Tata International AG., Switzerland Tata Technologies Pte Ltd., Singapore Tata Enterprises (Overseas) AG Tata Limited Tata Precision Industries Pte Ltd Tata Tea Inc Tata Tea (GB) Ltd., UK Tata Technologies, USA Tetley Group Ltd, UK
Zee Telefilms Expand Fast Holdings Ltd, British Virgin Islands Winterheath Co Ltd, British Virgin Islands Zee Multimedia Worldwide Ltd, British Virgin Islands Zee Telefilms (International) Ltd., British Virgin Islands Asia Today Ltd., Mauritius Asia TV (USA) Ltd., Mauritius Asia TV (Africa) Ltd., Mauritius Software Supplies Intl. Ltd., Mauritius Zee Multimedia Worldwide (Mauritius) Ltd Expand Fast Holdings (Singapore) Pte Ltd Asia TV Ltd., UK Zee TV USA Inc., USA Zee TV South Africa (Proprietary) Ltd Asia TV (Netherlands) Ltd Lalbhai
Arvind Overseas (M) Ltd. Arvind Worldwide Inc., USA Arvind Worldwide (M) Inc Big Mill Lauffenmuhle GmbH, Germany
Mahindra Mahindra Consulting Inc. MBT International Inc MBT Gmbh Mahindra USA Inc. Mahindra Intertrade (UK) Ltd
NIIT NIIT (USA) Inc NIIT Europe Ltd., UK NIIT Europe GmbH, Germany NIIT Nordiska AB, Sweden NIIT Benelux, Netherlands NIIT Middle East EC, UAE
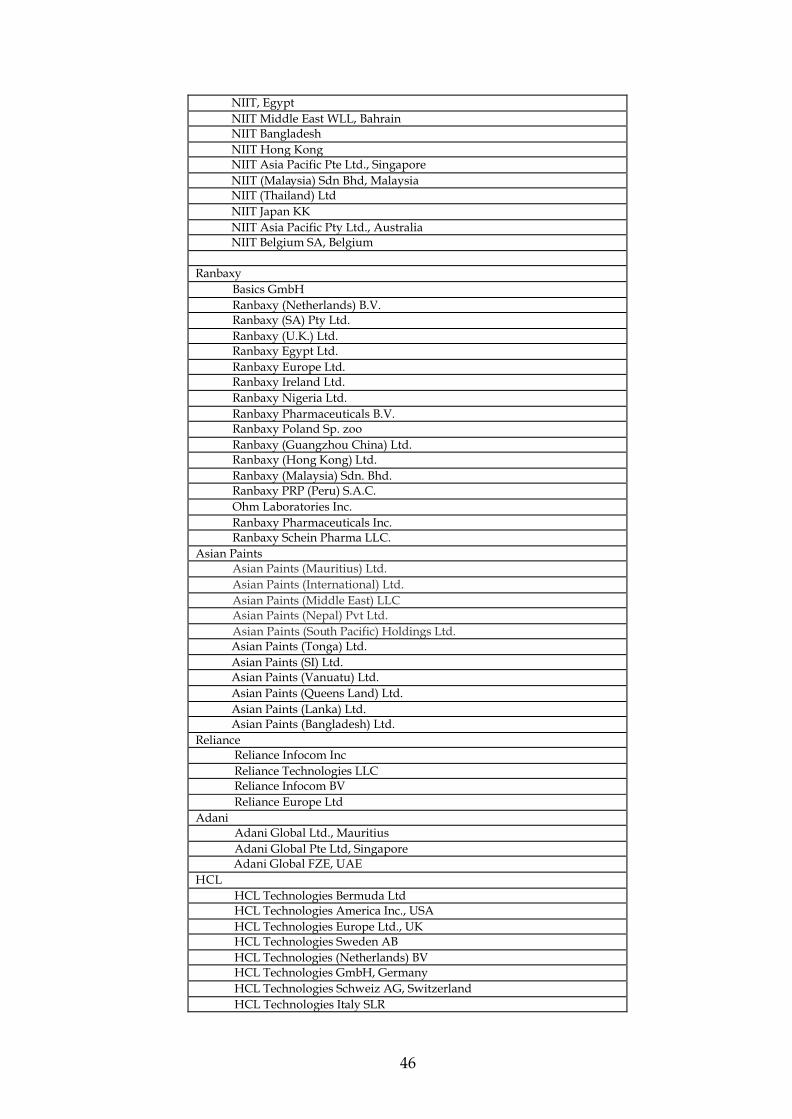
46
NIIT, Egypt NIIT Middle East WLL, Bahrain NIIT Bangladesh NIIT Hong Kong NIIT Asia Pacific Pte Ltd., Singapore NIIT (Malaysia) Sdn Bhd, Malaysia NIIT (Thailand) Ltd NIIT Japan KK NIIT Asia Pacific Pty Ltd., Australia NIIT Belgium SA, Belgium
Ranbaxy Basics GmbH Ranbaxy (Netherlands) B.V. Ranbaxy (SA) Pty Ltd. Ranbaxy (U.K.) Ltd. Ranbaxy Egypt Ltd. Ranbaxy Europe Ltd. Ranbaxy Ireland Ltd. Ranbaxy Nigeria Ltd. Ranbaxy Pharmaceuticals B.V. Ranbaxy Poland Sp. zoo Ranbaxy (Guangzhou China) Ltd. Ranbaxy (Hong Kong) Ltd. Ranbaxy (Malaysia) Sdn. Bhd. Ranbaxy PRP (Peru) S.A.C. Ohm Laboratories Inc. Ranbaxy Pharmaceuticals Inc. Ranbaxy Schein Pharma LLC.
Asian Paints Asian Paints (Mauritius) Ltd. Asian Paints (International) Ltd. Asian Paints (Middle East) LLC Asian Paints (Nepal) Pvt Ltd. Asian Paints (South Pacific) Holdings Ltd.
Asian Paints (Tonga) Ltd. Asian Paints (SI) Ltd. Asian Paints (Vanuatu) Ltd. Asian Paints (Queens Land) Ltd. Asian Paints (Lanka) Ltd. Asian Paints (Bangladesh) Ltd. Reliance Reliance Infocom Inc Reliance Technologies LLC Reliance Infocom BV Reliance Europe Ltd Adani Adani Global Ltd., Mauritius Adani Global Pte Ltd, Singapore Adani Global FZE, UAE HCL HCL Technologies Bermuda Ltd HCL Technologies America Inc., USA HCL Technologies Europe Ltd., UK HCL Technologies Sweden AB HCL Technologies (Netherlands) BV HCL Technologies GmbH, Germany HCL Technologies Schweiz AG, Switzerland HCL Technologies Italy SLR

47
HCL Technologies Belgium NV HCL Technologies Australia Pty Ltd HCL Technologies (New Zealand) Ltd HCL Technologies (Hong Kong) Ltd HCL Technologies Japan Ltd HCL Technologies South Africa (Proprietary) Ltd HCL Holdings GmbH, Austria HCL Capital Pvt. Ltd., Bermuda Intellcent Inc., USA Infosys Yantra Corp., USA EC Cubed Inc., USA Alpha Thinx Mobile Phone Services AG, Austria Asia Net Media (BVI) Ltd., the British Virgin Islands CiDRA Corporation, USA JASDIC Park Company, Japan M-Commerce Ventures Pte Ltd, Singapore On Mobile Systems Inc., (formerly Onscan Inc.) USA Stratify Inc., (formerly PurpleYogi Inc.), USA Workadia Inc., USA Satyam Vision Compass Inc. Satyam Manufacturing Technologies Inc. Satyam (Europe) Ltd Satyam Asia Pte Ltd Satyam Japan Ltd Wipro Wipro Inc. USA Enthink Inc. USA Wipro Japan KK
Apart from the spread of overseas investments by Indian companies
which could increase the scope for transfer pricing, a point that needs careful
consideration is with regard to imports from trading companies. In case of
imports from trading companies, the manufacturer remains in the
background. Use of the intermediary could help avoid scrutiny under
transfer pricing regulations. The possibility of an understanding between
the two is high if the manufacturer and supplier belong to the same country.
To gain an idea of the role of trading companies on the one hand and related
party transactions on the other, the import DTRs for the year 1994-95 were
examined. DTRs of importers belonging to the top 100 houses and foreign-
controlled companies were separated from the main file and names of the
suppliers were standardised. For each importer, individual suppliers were
examined from the point of whether the latter had any direct or indirect
equity participation or technical collaboration agreements with the importer.

48
Apart from the general trading companies of Japan2 other trading companies
were identified from among the suppliers. The shares of different categories
of suppliers according to the type of importer are shown in Table-I.26. It is
pertinent to note that the share of parents and affiliates is the highest for
foreign-controlled companies as they procured at least one-third of their
total imports from such entities. Illustrative cases of FCCs importing from
their parents and affiliates are shown in Table-I.27. In the case of Indian top
houses too, the share is substantial at about 10 per cent. Interestingly,
supplies by trading companies formed a major portion (nearly one-fourth) of
imports of Indian large houses.
More direct and recent evidence confirms the extensive inter-branch
transactions by TNCs. For instance, Asea Brown Boveri Ltd reported that it
transacted, in addition to the holding company, with as many as 136 fellow
subsidiaries during 2001. Interestingly, there was no mention of any single
foreign affiliate while the names of Indian affiliates were given. The
company imported raw materials and components worth Rs. 164 crores. It
has been stated that the total purchases of raw materials and components
from fellow subsidiaries during the year was of the order of Rs. 136 crores
thereby implying that the fellow subsidiaries accounted for 83 per cent of
such imports. 3 Similarly, Ingersoll Rand (I) Ltd also reported only the names of
the foreign holding company and fellow subsidiaries. In its case too, transactions
with such companies accounted for bulk of the imports and exports. While total
exports during 2001-02 amounted to Rs. 80 crores, sales to the holding company
and fellow subsidiaries were of the order of Rs. 79 crores. Similarly, against the
Rs. 68 crores worth of import of raw materials and components, imports from
these related parties amounted to Rs. 51 crores.4 An examination of the Annual
Report of Gillette India for the year 2001 also brings out a similar phenomenon.
2 These are called Sogo Shosha. The seventeen General Trading companies belonging to the
Japan Foreign Trade Council are: Hitachi High-Technologies Corp, Itochu Corp, Iwatani International Corp, Kanematsu Corp, Kawasho Corp, Kowa Co Ltd., Marubeni Corp, Mitsubishi Corp, Mitsui & Co., Ltd., Nagase & Co. Ltd., Nichimen Corp, Nissho Iwai Corp, Sumikin Bussan Corp, Sumitomo Corp, Tomen Corp and Toyota Tsusho Corp. See: http://www.jftc.or.jp/english/sogoshosha_e/outline_e.htm
3 Asea Brown Boveri Ltd., Annual Report, 2001. 4 Ingersoll Rand (I) Ltd., 80th Annual Report, 2001-2002.
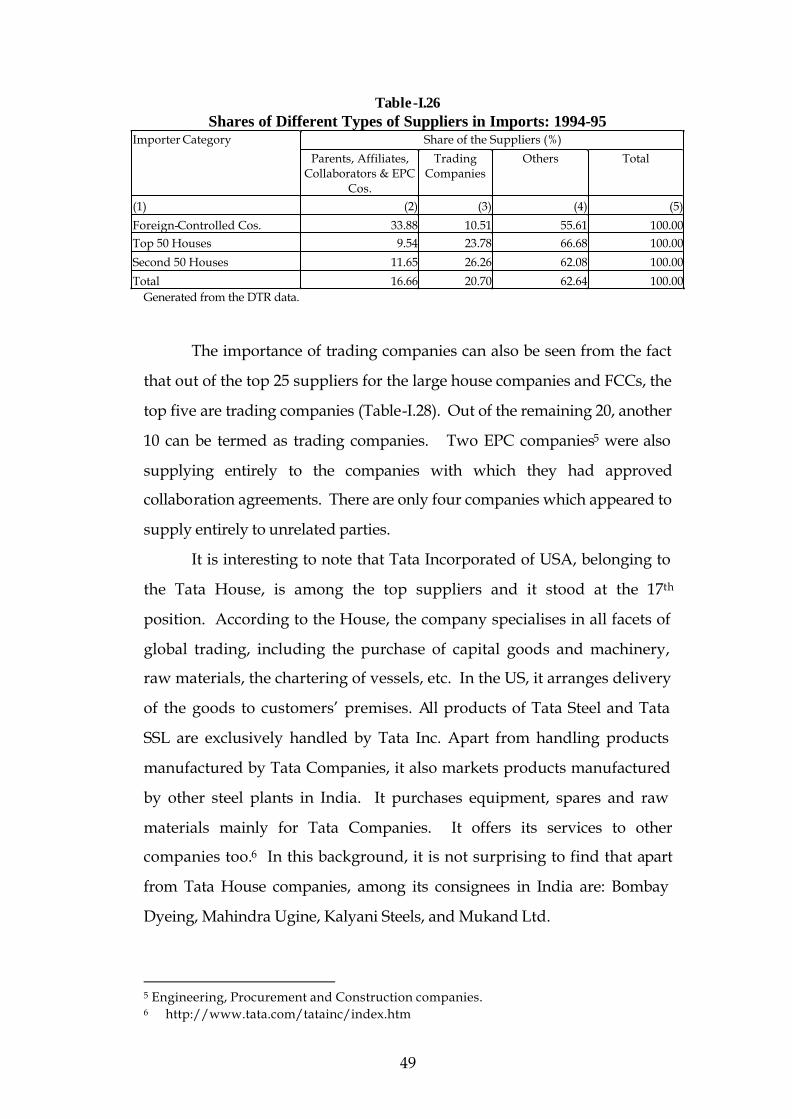
49
Table-I.26 Shares of Different Types of Suppliers in Imports: 1994-95
Share of the Suppliers (%) Importer Category
Parents, Affiliates, Collaborators & EPC
Cos.
Trading Companies
Others Total
(1) (2) (3) (4) (5)
Foreign-Controlled Cos. 33.88 10.51 55.61 100.00Top 50 Houses 9.54 23.78 66.68 100.00
Second 50 Houses 11.65 26.26 62.08 100.00
Total 16.66 20.70 62.64 100.00Generated from the DTR data.
The importance of trading companies can also be seen from the fact
that out of the top 25 suppliers for the large house companies and FCCs, the
top five are trading companies (Table-I.28). Out of the remaining 20, another
10 can be termed as trading companies. Two EPC companies5 were also
supplying entirely to the companies with which they had approved
collaboration agreements. There are only four companies which appeared to
supply entirely to unrelated parties.
It is interesting to note that Tata Incorporated of USA, belonging to
the Tata House, is among the top suppliers and it stood at the 17th
position. According to the House, the company specialises in all facets of
global trading, including the purchase of capital goods and machinery,
raw materials, the chartering of vessels, etc. In the US, it arranges delivery
of the goods to customers’ premises. All products of Tata Steel and Tata
SSL are exclusively handled by Tata Inc. Apart from handling products
manufactured by Tata Companies, it also markets products manufactured
by other steel plants in India. It purchases equipment, spares and raw
materials mainly for Tata Companies. It offers its services to other
companies too.6 In this background, it is not surprising to find that apart
from Tata House companies, among its consignees in India are: Bombay
Dyeing, Mahindra Ugine, Kalyani Steels, and Mukand Ltd.
5 Engineering, Procurement and Construction companies. 6 http://www.tata.com/tatainc/index.htm
50
Table I.27 Illustrative List of Foreign-Controlled Companies
Importing from their Parents and Affiliates Importer Supplier Share in
Total Imports (%)
Abbott Labs Ltd Abbott Chemicals Inc 38.36 Abbott Labs. 33.78Total 72.14Alfa Laval India Ltd Alfa Laval International SA 13.92 Alfa Laval Separation A S 10.76 Alfa Laval Thermal Ab 17.51 Tetra Laval Fats and Oils Ab 3.38Total * 58.88Ashok Leyland Ltd Iveco Fiat Spa 100.00Total 100.00Atlas Copco (India) Ltd Atlas Copco Airpower N V Belgium 45.87 Atlas Copco Comptec Inc 9.63 Atlas Copco Energas Gmbh 3.89Total * 63.08BASF India Ltd BASF Ag 64.96Total * 65.51Bayer India Ltd Bayer Ag 59.61 Bayer Antwerpen N V 6.72 Bayer India Ltd 4.27Total * 70.85Bharat Shell Pvt Ltd Shell Gas Trading (Asia Pacific) Inc 78.32 Shell International Chemical Co Ltd 4.91 Shell International Trading Co 13.95Total * 100.00Birla 3M Pvt Ltd Birla 3M Ltd 100.00Total 100.00Black & Decker Bajaj Pvt Ltd Black & Decker Corpn 34.54
Black & Decker Global Purchasing Asia 9.64
Black & Decker Industriale S.P.A. 21.93 Black & Decker Overseas A.G. 15.10Total * 83.87Cee Kay Daikin Ltd Daikin Mfg Co Ltd 90.88Total 90.88Colour Chem Ltd Hoechst Ag 46.25
Hoechst Celanese Chemical Group Inc 6.11
Hoechst International Tokyo K.K. 1.85Total 54.21Daewoo Motors Ltd Toyota Motor Corp 74.75 Toyota Tsusho Corp 25.25Total 100.00DCM Toyota Ltd Toyota Tsusho Corp 100.00
51
Total 100.00Du Pont South Asia Ltd Du Pont De Nemours (Nederland) Bv 43.72
Du Pont De Nemours Luxembourgh Sa 10.24
Du Pont Kabushiki Kaisha 10.56
Du Pont Mitsui Flurochemicals Co Ltd 35.47
Total 99.99Escorts Claas Ltd Claas Ohg 66.48Total 66.48Escorts Herion Ltd Herion Werke Kg 77.50Total 77.50Escorts Tractors Ltd New Holland Ford Ltd 78.74Total 78.74Eureka Forbes Ltd Electrolux Major & Floor 100.00Total 100.00Fisher Rosemount India Ltd Fisher Rosemount Inc USA 35.68 Rosemount 3.93 Rosemount Analytical Inc 5.58 Rosemount Inc 33.43Total * 84.70Fleetguard Filtration Systems I Pvt Ltd Fleetguard Inc 93.41 Fleetguard International Corp 4.48Total * 99.99Fujitsu ICIM Ltd Fujitsu (Singapore) Pte Ltd 8.84 Fujitsu Hong Kong Ltd 3.31 Fujitsu Ltd 3.26 ICI Ltd 37.40Total * 58.34Fuller KCP Ltd Fuller International Inc 64.14Total 64.14GE Apar Lighting Pvt Ltd GE 16.04 GE Lighting 23.63 General Electric Co 2.98 General Electric Do Brasil SA 33.32 GE Glass Lighting Ltd 0.44Total * 78.21German Remedies Ltd Schering Ag 47.43 Asta Medica Ag. 12.96Total * 64.95Gl Rexroth Inds Ltd Mannesmann Exports 0.62 Mannesmann Rexroth 55.48 Rexroth 5.42
Rexroth Brueninghaus Hydromank Gmbh 9.84
Rexroth Sigma S A 9.36Total 80.72Godrej Kis Ltd Kis Sarl-France 47.98
52
Total 47.98Gotco India Pvt Ltd Gotco USA Inc 100.00Total 100.00Graphite Vicarb India Ltd Vicarb 70.10Total 70.10Hero Honda Motors Ltd Honda Motor Co Ltd 47.42 Honda Trading Corp 3.22Total 50.64Hindustan Ciba Geigy Ltd Ciba 3.01 Ciba Geigy 19.98 Ciba Geigy Ltd 43.77 Hindustan Ciba Geigy Ltd 0.48Total 67.24Hoechst India Ltd Hoechst Ag 67.83 Hoechst India Ltd 2.30 Hoechst International Tokyo K.K. 3.33Total 73.46Hoerbiger India Ltd Hoebiger Ventilwerke Ag. 61.51 Hoerbiger Ventilwerke Ag 38.49Total 100.00Hoganas India Ltd Hoganas A.B. 89.94 Hoganas India Ltd 1.73Total 91.67Hyundai Heavy Inds Co Ltd Hyundai Heavy Industries Co Ltd 59.19Total 59.19India Photographic Co Ltd Eastman Kodak Co. 2.05 Kodak (Aus) Pty Ltd 2.10 Kodak (Near East) Inc 61.61 Kodak Inc 24.99Total * 92.19Indian Additives Ltd Chevron Chem Inds Sales 32.42 Chevron Chemical International Inc. 38.82 Chevron Chemical Pte Ltd 27.25 Oronite Chevron Chemical SA 1.51Total 100.00Indian Shaving Products Ltd Gillette Co 47.79 Gillette UK Ltd 2.21Total 50.00Ingersoll Rand India Ltd Ingersoll Rand International Sales Inc 16.99 Dresser Rand Co 8.06 Ingersoll Rand 11.77 IRAbg Allgemeine Hameln 3.89Total 41.29 Kalyani Brakes India Ltd Nabco Ltd 44.90 Allied Signal Aftermarket Europe 10.99 Allied Signal Automotive 13.87 Allied Signal Systems 3.27
53
Allied Signal 5.29 Nabco Ltd 4.17 Nabco Ltd 5.30Total 87.79Kanthal Bimetals India Ltd Kanthal Ab 95.75 Kanthal Bimetals India Ltd. 4.25Total 100.00Kelloggs India Ltd Kellogg Co Of Gb Ltd 1.84 Kellogg USA 76.11Total 77.95Kirloskar Cummins Ltd Cumins Engine Co USA 2.17 Cummins Diesel Sales Corporation 11.21 Cummins Engine Co 58.76Total * 72.79Kirloskar Ebaraa Pumps Ltd Ebara Corpn 96.23Total 96.23Total 15.81Kvaerner Boving Construction Kvaerner Boving Construction Ltd 100.00Total 100.00L&T Niro Ltd Niro A/S 99.33Total * 100.00Lipton India Exports Ltd Lipton Ltd 74.91Total 74.91Mafatlal Lubricants Ltd Motul Motor Oil 27.94 Motul Oil S A France 66.85Total 94.79Mattel Toys India Ltd Mattel Tools Sdn Bhd 66.88 Mattel Toys Singapore Pte Ltd 4.41 Mattel Toys Vendor Operation Ltd 7.39Total * 80.16Mercedes Benz India Pvt Ltd Mercedes Benz Ag 100.00Total 100.00Modi Federal Ltd Federal Paper Board Inc 80.09Total 80.09Modi Gbc Ltd General Binding Corpn 57.83Total 57.83Modi Hoover Ltd Hoover Ltd 75.95 Modi Hoover Ltd 18.87Total 94.82Modi Mirrless Blackstone Ltd Mirrlees Blackstone Ltd 93.57Total 93.57Modi Xerox Ltd Rank Xerox Ltd 83.81 Xerox Ltd 11.30Total 95.11Monsanto Chem Of India Monsanto Chemical Co Ltd 18.24 Monsanto Co 81.67Total * 100.00Munjal Showa Ltd Showa Corp 89.93

54
Showa Manufacturing Co 10.07Total 100.00Nestle India Ltd Nestle UK Ltd 8.26 Nestle S A 85.15Total 93.41Philips India Ltd Philips 20.39 Philips Hongkong Ltd 2.49 Philips Japan Ltd 7.13 Philips Lighting Bv 9.77 Philips Singapore Pte Ltd 4.06Total * 52.02Rhone Poulenc India Ltd Rhone Poulenc 35.81 Rhone Poulenc Agrochimie 13.13 Rhone Poulenc Rorer SA 40.12Total 89.06Roche Products Ltd F Hoffmann La Roche Ag 42.07 F Hoffmann La Roche Ltd 14.69Total * 57.60Roussel India Ltd Roussel Uclaf 97.42Total * 98.34SAB Nife Power Systems Ltd Saft Nife AB 100.00Total 100.00Sandoz India Ltd S&G Seeds BV Export 14.60 Sandoz 11.03 Sandoz Pharma AG 36.20Total * 65.87Sandvik Asia Ltd AB Sandvik Central Service 4.38 AB Sandvik Coromant 16.95 AB Sandvik Rock Tools 2.35 Sandvik 34.80 Sandvik Asia Ltd 4.65Total * 66.22Siemens Information Systems Ltd Siemens Nixdorf 100.00Total 100.00Siemens Ltd Siemens 61.14 Siemens Elema Ab 2.84 Siemens Showa Solar Pte Ltd 1.64Total* 66.81SKF Bearings India Ltd SKF 6.68 SKF Industries S.P.A. 20.24 SKF Osterreich Ag 3.46 SKF South East Asia & Pacific Pte Ltd 3.61 SKF Sverige Ab 2.14Total* 44.21Sulzer India Ltd Ferrum 4.47 Sulzer Burckhardt 35.56 Sulzer Chemtech Ag, 13.65 Sulzer Ruti Ltd 7.65
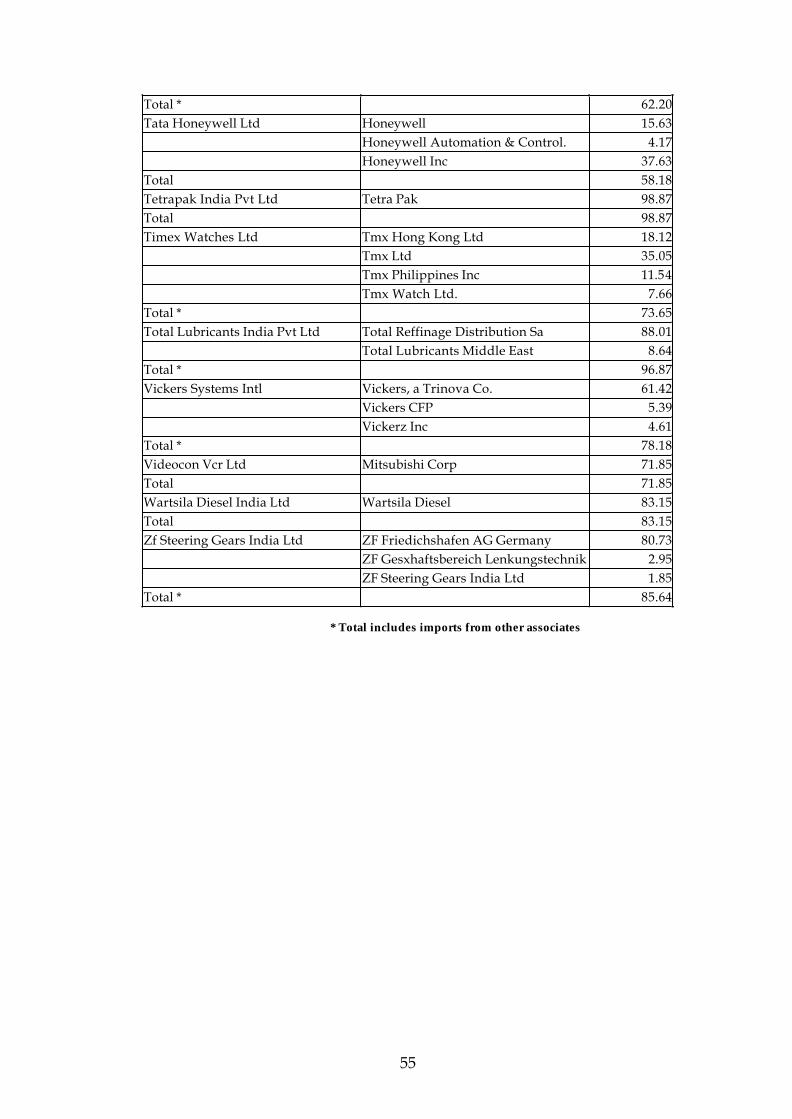
55
Total * 62.20Tata Honeywell Ltd Honeywell 15.63 Honeywell Automation & Control. 4.17 Honeywell Inc 37.63Total 58.18Tetrapak India Pvt Ltd Tetra Pak 98.87Total 98.87Timex Watches Ltd Tmx Hong Kong Ltd 18.12 Tmx Ltd 35.05 Tmx Philippines Inc 11.54 Tmx Watch Ltd. 7.66Total * 73.65Total Lubricants India Pvt Ltd Total Reffinage Distribution Sa 88.01 Total Lubricants Middle East 8.64Total * 96.87Vickers Systems Intl Vickers, a Trinova Co. 61.42 Vickers CFP 5.39 Vickerz Inc 4.61Total * 78.18Videocon Vcr Ltd Mitsubishi Corp 71.85Total 71.85Wartsila Diesel India Ltd Wartsila Diesel 83.15Total 83.15Zf Steering Gears India Ltd ZF Friedichshafen AG Germany 80.73 ZF Gesxhaftsbereich Lenkungstechnik 2.95 ZF Steering Gears India Ltd 1.85Total * 85.64
* Total includes imports from other associates

56
Table-I.28 Top 25 Suppliers to Large House Companies and
Foreign-Controlled Companies
Share in Supplies (%) Name of the Supplier
Collaborators/Fellow Group Companies
Other Importers
(1) (2) (3)1 Mitsubishi Corp* 19.79 80.212 Richmond Trading & Invest Co Ltd # 100.003 Hing Wah Trading # 100.004 Nissho Iwai Corp* 100.005 Marc Rich & Co Ltd # 100.006 Fuji Photo Film Co Ltd 99.93 0.077 Itochu Corp* 100.008 Phibro Gmbh # 100.009 Kanematsu Corpn* 100.00
10 Samsung Corp 7.34 92.6611 Barmag Ag Germany 12 DTC London # 100.0013 John Brown Engineers & Constructions @ 100.00 14 Steel Co-Ordinating Services # 100.0015 Toyo Engg Corpn @ 100.00 16 FLS Automation A/S 100.00 17 Tata Incorporated # 22.92 77.0818 Scandia Essar Me Ltd 100.00 19 Mobil Petrochemicals International Ltd 20 Evergrow Trading # 100.0021 Marubeni Corp* 17.76 82.2422 Chemtex International Inc @ 100.00 23 Romaga AG 24 Wartsila Diesel 25 Wilmar Trading Pte Ltd # 100.00* General Trading Companies of Japan. # Other trading companies. @ Engineering, Procurement and Construction Companies.
The Videocon House offers another relevant example regarding the
role of trading companies. A company by name Amersonic International
Ltd, Hong Kong (Amersonic) figures prominently among the suppliers to
the group. Amersonic is a trading company which deals with a variety of
products ranging from silk to electronics. During 1994-95, 28.15 per cent of
Videocon VCR Ltd’s imports were accounted by Amersonic. Amersonic
also supplied 19.95 per cent of imports of Videocon Appliances and 12.54
per cent of the imports of Videocon International Ltd. Amersonic is the
largest supplier for Videocon Appliances and the third largest supplier for
Videocon International. Amersonic supplied essentially to the Videocon

57
group since 1992.7 What is even more interesting is the fact that the
company is represented by Mr. Manu Dugar, obviously a person of Indian
origin. We are unable to express any opinion regarding Romaga AG,
Switzerland, which has supplied almost exclusively to Mafatlal group
companies.
Another case of interest is that of Floatglass India Ltd., a company
promoted by Asahi Glass Co of Japan. Incidentally, Asahi’s supplies
accounted for only 0.15 per cent of the total imports of the company in 1994-
95 for which we have the DTR data. While the share of Mitsubishi
Warehouse & Transportation Co of Japan was 52.62 per cent another
company of the Mitsubishi group namely, Mitsubishi Corp accounted for
47.02 per cent of the total. The items of import relate to plant and machinery.
Thus practically all the imports of the company (99.64 per cent) are from the
Mitsubishi group. Incidentally, Mitsubishi Corp met 13.6 per cent of
imports of Asahi India Safety Glass, another group company of Asahi in
India. Both Asahi and Mitsubishi belonging to Japan, the phenomenon
needs closer examination if such transactions could contain an element of
transfer pricing. Goodlass Nerolac Paints, a subsidiary of Kansai Paints of
Japan, received 46.78 per cent of its imports from Nissho Iwai, a general
trading company of Japan. An equally interesting case in this respect is that
of Honda presented in Table-I.29. While in case of the two joint ventures of
Honda in India, the share of the parent and its affiliates is quite high when
imports from other Japanese companies are taken into account the share of
Japan turns even higher. In the third one, Japan Intermodal Transport Co.
(JIT) accounted for as much as 80 per cent of the total imports. JIT obviously,
is not a manufacturing company.
7 The other companies to whom Amersonic was the supplier and about which we do not have
any information are : Malani Aquatemp Pvt Ltd of Secunderabad and Bombay Coolers Pvt Ltd of Thane. Since both the companies imported parts which go into the making of Desert Coolers and Videocon group deals also in such coolers, there is a possibility of these companies also being either constituents of the group or being support manufacturers.

58
Table-I.29
Showing the Relative Importance of Imports from Japan by the Affiliates of Honda, Japan
Importer/ Supplier
Share in Total Imports (%)
Share of the Japanese Collaborator & affiliates
Share of Japanese Suppliers
Kinetic Honda Motors Ltd Honda Motor Co Ltd, Japan 62.41 69.98 88.48Okura & Co Ltd, Japan 10.38 Takao Aluminium Alloy Co Ltd, Taiwan 9.79 Kinetic Honda Motor Ltd, Japan 7.57 Mitsubishi Corporation, Japan 7.52 Thai Stanley Electric Public Co Ltd, Thailand 0.98 Sidmar N.V., Belgium 0.74 Not Available 0.60 Q-Panel Co., USA 0.01 Nikon Corpn, Japan Negligible Total 100.00 Hero Honda Motors Ltd Honda Motor Co Ltd, Japan 47.49 50.75 90.67Okura & Co Ltd, Japan 30.99 Marubeni Corpn, Japan 8.93 Metal Distributors (UK) Ltd, Canada 6.80 Honda Trading Corpn, Japan 3.26 Aloverzee Handelsgesellschaft Mbh, Germany 2.53 Total 100.00 Shriram Honda Power Eqp Ltd Japan Intermodal Transport Co Ltd, Japan 80.31 0.00 88.88Mitsubishi Corporation, Japan 8.57 Asian Autoparts Co Ltd, China 7.39 Hyundai Corporation, Korea 2.27 Alugral, Germany 1.45 C M Supply, Thailand 0.01 Total 100.00 Based on the Import DTRs for 1994-95.
The extent of variation in import prices can be substantial. For
instance, in the case of Mono Ethyl Glycol (MEG) the unit value of imports
during 1990-91 varied very widely. It can be seen from Table-I.30 that there
is no trend in the prices to explain the differences.8 On the same day, two
Bills of Entry were filed, one each by ICI India Ltd and Reliance Industries
Ltd., both importing from Sabic Marketing Ltd., Saudi Arabia. While the
8 . In the absence of manufacturer's name in the Import DTR one is not able to ascertain the precise
business associations of the transacting partners.

59
Table - I.30 Showing Variations in the Import Price of Mono Ethylene Glycol During Apl-Dec. 1990 (Chronological Order)
Importer Product BENO* BEDate# Supplier Country Net Qty Unit
Value (Rs.Lakhs)
Price per Tonne
(1) (2) (3) (4) (5) (6) (7) (8) (9) (10)
Indian Organic Chemicals Ltd
Monethylene Glycol In Blk In Fibre Grade
17451
260490
Sabic Marketing Inc.
Arab Emts
2039
Mts
137.38
6737.45
Indian Organic Chemicals Ltd Monoethylene Glycol 29542 190790 Sabic Marketing Ltd Saudi Arabia 2033 Mts 135.34 6657.02
Orissa Synthetics Ltd
Mono-ethylene Glycol (meg) Fibre Grade
1247
210890
Mobil Polymers Int. Saudi Arabia
Saudi Arabia
1049.52
Mts
72.99
6954.55
Standard Organics Ltd Monoethylene Glycol 37466 100990 Bayer German F Rep 18 Mts 1.84 10233.94 Standard Organics Ltd Monoethylene Glycol 37763 110990 Bayer German F Rep 18 Kgs 1.84 10233.94
Indian Organic Chemicals Ltd Monoethylene Glycol 39820 260990 Sabic Marketing Ltd Saudi Arabia 1978 Mts 132.82 6714.86 Indian Organic Chemicals Ltd Monoethylene Glycol 39821 260990 Sabic Marketing Ltd Saudi Arabia 1978 Mts 132.82 6714.87
ICI India Limited
Mono Ethylene Glycol (meg)
677
11190
Sabic Marketing Ltd.
Saudi Arabia
206.28
Mts
18.8
9116.17
ICI India Limited Mono Ethylene Glycol 678 11190 Sabic Marketing Ltd. Saudi Arabia 618.84 Mts 56.41 9116.11
Reliance Industries Ltd
Meg (mono Ethylene Glycol)
289
11190
Sabic Marketing Ltd
Saudi Arabia
1289.26
Mts
87.51
6787.96
Reliance Industries Ltd
Meg (mono Ethylene Glycol)
290
11190
Sabic Marketing Ltd
Saudi Arabia
618.84
Mts
42.01
6788.01
Orissa Synthetics Ltd
Monoethylene Glycol(meg)fibre Grade
152
51190
Mobil P Sales & Supply Corpn.
Saudi Arabia
1038825
Kgs
78.84
7590
Beck & Co Ltd Monoethylene Glycol 3185 71190 Mitsui & Co.Ltd. Singapore 37600 Kgs 4.89 13000
Beck & Co Pvt Ltd Monoethylene Glycol 3186 71190 Mitsui & Co Ltd Singapore 18800 Kgs 2.44 13000
Schenectady Chemicals India Ltd
Monoethylene Glycol
13104
281190
Nederlandsohe Benzol Naatschappij B.V.
Netherlands
7200
Kgs
1.5
20840
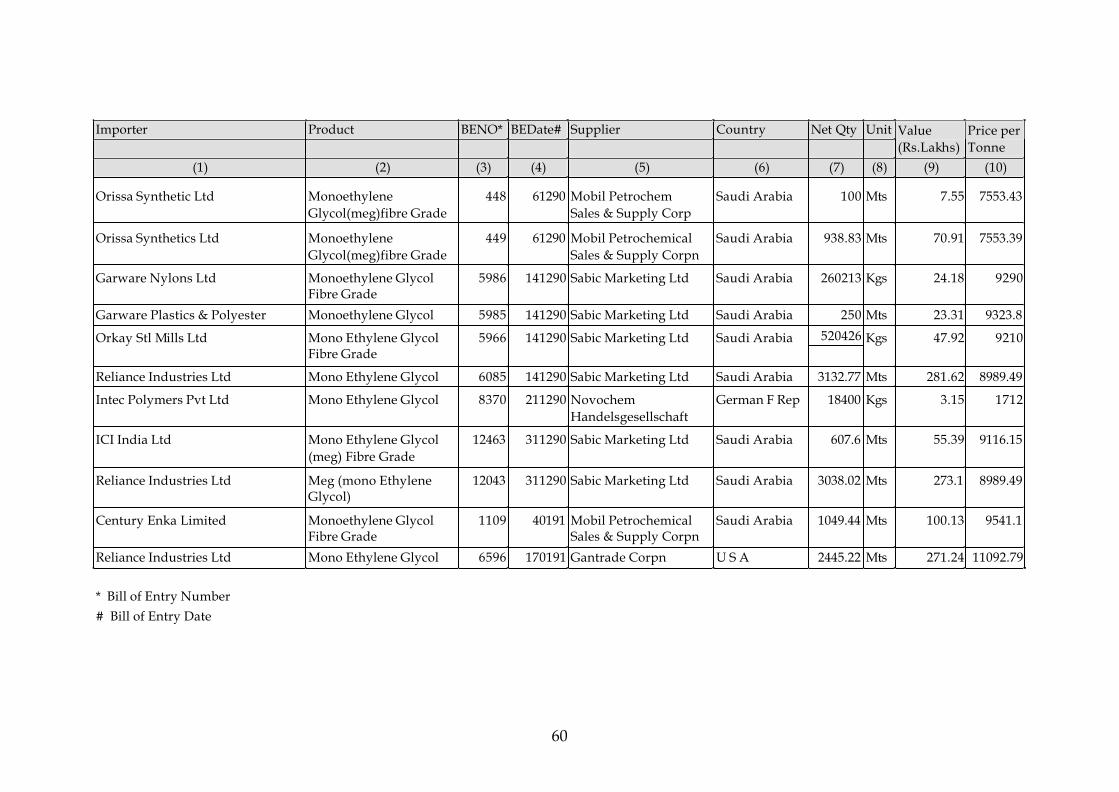
60
Importer Product BENO* BEDate# Supplier Country Net Qty Unit
Value (Rs.Lakhs)
Price per Tonne
(1) (2) (3) (4) (5) (6) (7) (8) (9) (10)
Orissa Synthetic Ltd
Monoethylene Glycol(meg)fibre Grade
448
61290
Mobil Petrochem Sales & Supply Corp
Saudi Arabia
100
Mts
7.55
7553.43
Orissa Synthetics Ltd
Monoethylene Glycol(meg)fibre Grade
449
61290
Mobil Petrochemical Sales & Supply Corpn
Saudi Arabia
938.83
Mts
70.91
7553.39
Garware Nylons Ltd
Monoethylene Glycol Fibre Grade
5986
141290
Sabic Marketing Ltd
Saudi Arabia
260213
Kgs
24.18
9290
Garware Plastics & Polyester Monoethylene Glycol 5985 141290 Sabic Marketing Ltd Saudi Arabia 250 Mts 23.31 9323.8
520426 Orkay Stl Mills Ltd
Mono Ethylene Glycol Fibre Grade
5966
141290
Sabic Marketing Ltd
Saudi Arabia
Kgs
47.92
9210
Reliance Industries Ltd Mono Ethylene Glycol 6085 141290 Sabic Marketing Ltd Saudi Arabia 3132.77 Mts 281.62 8989.49
Intec Polymers Pvt Ltd
Mono Ethylene Glycol
8370
211290
Novochem Handelsgesellschaft
German F Rep
18400
Kgs
3.15
1712
ICI India Ltd
Mono Ethylene Glycol (meg) Fibre Grade
12463
311290
Sabic Marketing Ltd
Saudi Arabia
607.6
Mts
55.39
9116.15
Reliance Industries Ltd
Meg (mono Ethylene Glycol)
12043
311290
Sabic Marketing Ltd
Saudi Arabia
3038.02
Mts
273.1
8989.49
Century Enka Limited
Monoethylene Glycol Fibre Grade
1109
40191
Mobil Petrochemical Sales & Supply Corpn
Saudi Arabia
1049.44
Mts
100.13
9541.1
Reliance Industries Ltd Mono Ethylene Glycol 6596 170191 Gantrade Corpn U S A 2445.22 Mts 271.24 11092.79
* Bill of Entry Number # Bill of Entry Date

61
value declared by ICI works out to Rs. 9,116.11 per tonne, the corresponding
value for Reliance was Rs. 6,787.96 per tonne only. A basic question
requiring answer is: whose price is the right one? Is it that the ICI indulged
in over-invoicing or the Reliance was under-invoicing? Or, there had been
long term contractual obligations for one of the importers? Only a detailed
inquiry could indicate the precise magnitude of the losses to the exchequer
in such cases.
Detailed product specification, model, brand name, and availability
of manufacturer's name in the DTR would go a long way in facilitating such
exercises. Unfortunately, products are reported in vague terms and in
varying and unlikely units of measurements. For instance, Reliance group is
reported to have imported 'Machinery being capital goods' which was of
certain KGS in weight. These are not small consignments but are valued at
crores of rupees. A list of machinery imports each valued at least Rs. 1 crore
is provided in Table-I.31 to illustrate this phenomenon. It does appear that
TNCs mainly import plant and machinery from their respective parent
companies and affiliates. Given the vague product description, and the
tendency on part of TNCs to exploit transfer pricing mechanism, it would be
extremely difficult to detect abnormal pricing in such transactions.
A number of consumer goods companies are getting their products
made by local units, often small scale ones, and market these under their
own brand names. For a few units which manufacture tooth paste for
Colgate Palmolive India Ltd. (CPIL), an earlier study of ISID noticed that
the support manufacturers of Colgate sought and received approval for
technology licensing from the US parent company of Colgate.9
Interestingly, it was found from the DTRs that two such companies
namely, Coral Cosmetics Ltd., and Sunshine Cosmetics Ltd were
importing from the same sources from which CPIL was importing. Such
instances could be seen in case of suppliers to Hindustan Lever also
9 See: S.K. Goyal, et. al., Foreign Investment Approvals: An Analysis (August 1991 – July 1993),
Institute for Studies in Industrial Development (ISID), a Report submitted to the Ministry of Finance, 1994.
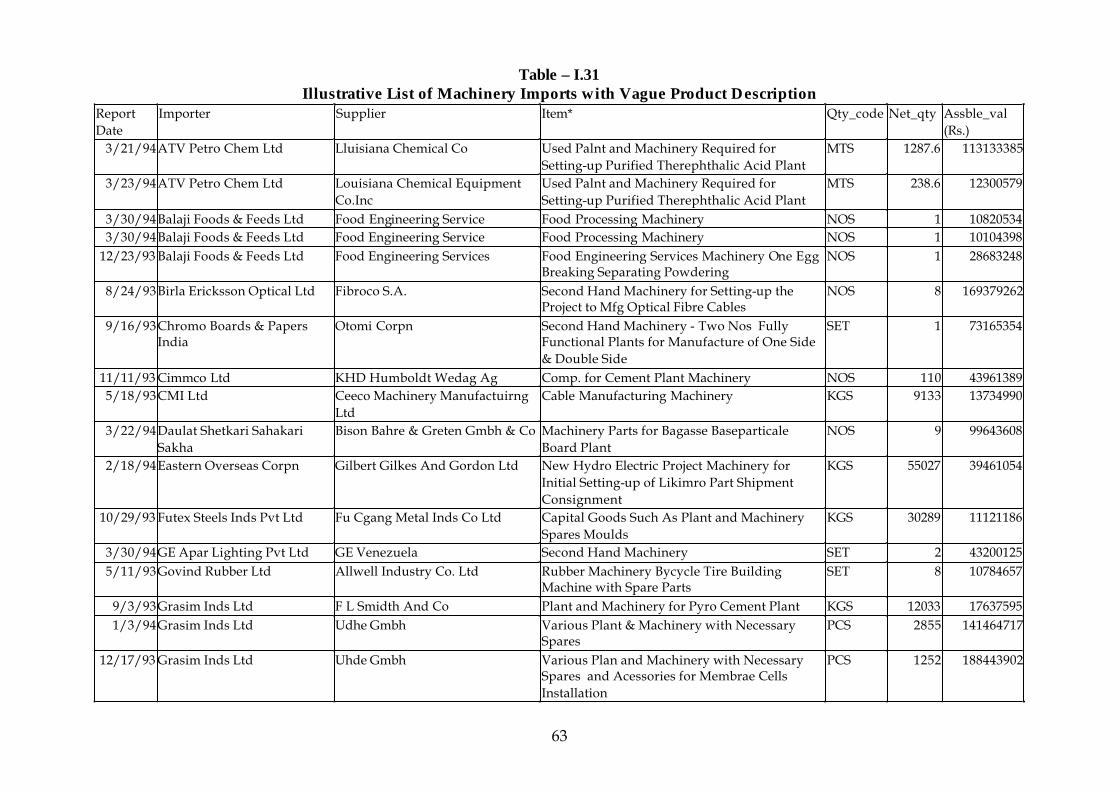
63
Table – I.31 Illustrative List of Machinery Imports with Vague Product Description
Report Date
Importer Supplier Item* Qty_code Net_qty Assble_val (Rs.)
3/21/94ATV Petro Chem Ltd Lluisiana Chemical Co Used Palnt and Machinery Required for Setting-up Purified Therephthalic Acid Plant
MTS 1287.6 113133385
3/23/94ATV Petro Chem Ltd Louisiana Chemical Equipment Co.Inc
Used Palnt and Machinery Required for Setting-up Purified Therephthalic Acid Plant
MTS 238.6 12300579
3/30/94Balaji Foods & Feeds Ltd Food Engineering Service Food Processing Machinery NOS 1 108205343/30/94Balaji Foods & Feeds Ltd Food Engineering Service Food Processing Machinery NOS 1 10104398
12/23/93 Balaji Foods & Feeds Ltd Food Engineering Services Food Engineering Services Machinery One Egg Breaking Separating Powdering
NOS 1 28683248
8/24/93Birla Ericksson Optical Ltd Fibroco S.A. Second Hand Machinery for Setting-up the Project to Mfg Optical Fibre Cables
NOS 8 169379262
9/16/93Chromo Boards & Papers India
Otomi Corpn Second Hand Machinery - Two Nos Fully Functional Plants for Manufacture of One Side & Double Side
SET 1 73165354
11/11/93 Cimmco Ltd KHD Humboldt Wedag Ag Comp. for Cement Plant Machinery NOS 110 439613895/18/93CMI Ltd Ceeco Machinery Manufactuirng
Ltd Cable Manufacturing Machinery KGS 9133 13734990
3/22/94Daulat Shetkari Sahakari Sakha
Bison Bahre & Greten Gmbh & Co Machinery Parts for Bagasse Baseparticale Board Plant
NOS 9 99643608
2/18/94Eastern Overseas Corpn Gilbert Gilkes And Gordon Ltd New Hydro Electric Project Machinery for Initial Setting-up of Likimro Part Shipment Consignment
KGS 55027 39461054
10/29/93 Futex Steels Inds Pvt Ltd Fu Cgang Metal Inds Co Ltd Capital Goods Such As Plant and Machinery Spares Moulds
KGS 30289 11121186
3/30/94GE Apar Lighting Pvt Ltd GE Venezuela Second Hand Machinery SET 2 432001255/11/93Govind Rubber Ltd Allwell Industry Co. Ltd Rubber Machinery Bycycle Tire Building
Machine with Spare Parts SET 8 10784657
9/3/93Grasim Inds Ltd F L Smidth And Co Plant and Machinery for Pyro Cement Plant KGS 12033 176375951/3/94Grasim Inds Ltd Udhe Gmbh Various Plant & Machinery with Necessary
Spares PCS 2855 141464717
12/17/93 Grasim Inds Ltd Uhde Gmbh Various Plan and Machinery with Necessary Spares and Acessories for Membrae Cells Installation
PCS 1252 188443902

64
1/18/94Gujarat Alkalies & Chem Ltd Geawiegand Kestner Critical Equipment and Machinery for Implementation of A Phosphoric Acid Plant
KGS 36087 114917356
Report Date
Importer Supplier Item Qty_code Net_qty Assble_val
10/19/93 Hanil Era Textiles Ltd Trutzschler Spinning Textile Capital Goods NOS 163 7910248110/19/93 Hanil Era Textiles Ltd Trutzschler Spinning Textiles Capital Goods NOS 63 36280695
6/7/93Hindustan Construction Co Ltd
Boretec Inc Tunnel Boring/Mining Machinery Boretec Model Sth 5Ls Raise
NOS 1 10412570
6/21/93Indian Petrochem Corp Ltd Uhde Gmbh Capital Goods for Chloro Alkali Plant. MTS 32.901 794234941/3/94Indian Petrochem Corp Ltd Uhde Gmbh Capital Goods for Chloro Alkali Plant NOS 2169 163505360
3/22/94Indian Petrochem Corp Ltd Uhde Gmbh Capital Goods for Chloro Alkali Plant MTS 130.805 1338748499/16/93Jain Irrigation Systems Ltd Texchemie., Second Hand Machinery Equipment
Accessories. NOS 75 33101854
10/13/93 JK Corp Ltd Fuller International, Inc. Components and Mandatory Spares for Cement Mackingmachinery.
NOS 3 14281197
2/16/94Kelloggs India Ltd Nis Ltd Food Processing Machinery KGS 17820 169190306/28/93Larsen & Toubro Ltd F.L.Smidth And Co Components for Cement Making Machinery SET 13 3251927211/2/93Larsen & Toubro Ltd F.L.Smidth And Co Components Fo Cement Making Machinery SET 1 24125084
9/1/93Larsen & Toubro Ltd Fls Automation Components for Cement Making Machinery SET 1 113156095/21/93Larsen & Toubro Ltd F.L.Smidth And Co Components for Cement Making Machinery NOS 5 17103081
1/4/94Lloyds Steels Inds Ltd United Engg Inc., Machinery for Steel Palnt NOS 5 1345320512/29/93 Lloyds Steels Inds Ltd United Engineering Inc. Machinery for Steel Plant Entry Pinch Roll Unit NOS 3 15014935
7/9/93Maharashtra State Electricity Board
Siemens Aktiengesellschaft Uran Combined Cylce Power Station Stage III Project- Import of Capital Goods Power Project Above5
KGS 11736 10746007
9/7/93Maharashtra State Electricity Board
Siemens Aktiengesellschaft Uran Combined Cycle Power Station Stage III Projecpower Project Above 50Mm Import of Capital Goods
KGS 1460 15083622
6/10/93Maharashtra State Electricity Board
Siemens Aktiengesellschaft. Uran Combined Cycle Power Station,Stage III-Proj.Import of Capital Goods.
KGS 2253 31140822
3/4/94Mcdowell & Co Ltd Krones Air Rinser/ Filling and Capping Machinekrones Super Nblock Machinery
NOS 3 10054426
3/9/94Murudeshwar Ceramics Ltd Breton Second & Last Partial Shipment of Machinery & Equipment
MTS 11.2 27806763
1/10/94Nathpa Jhakri Joint Ventures Atlas Copco Italia Atlas Capco Make Tunnelling Machinery MTS 138.922 77884522
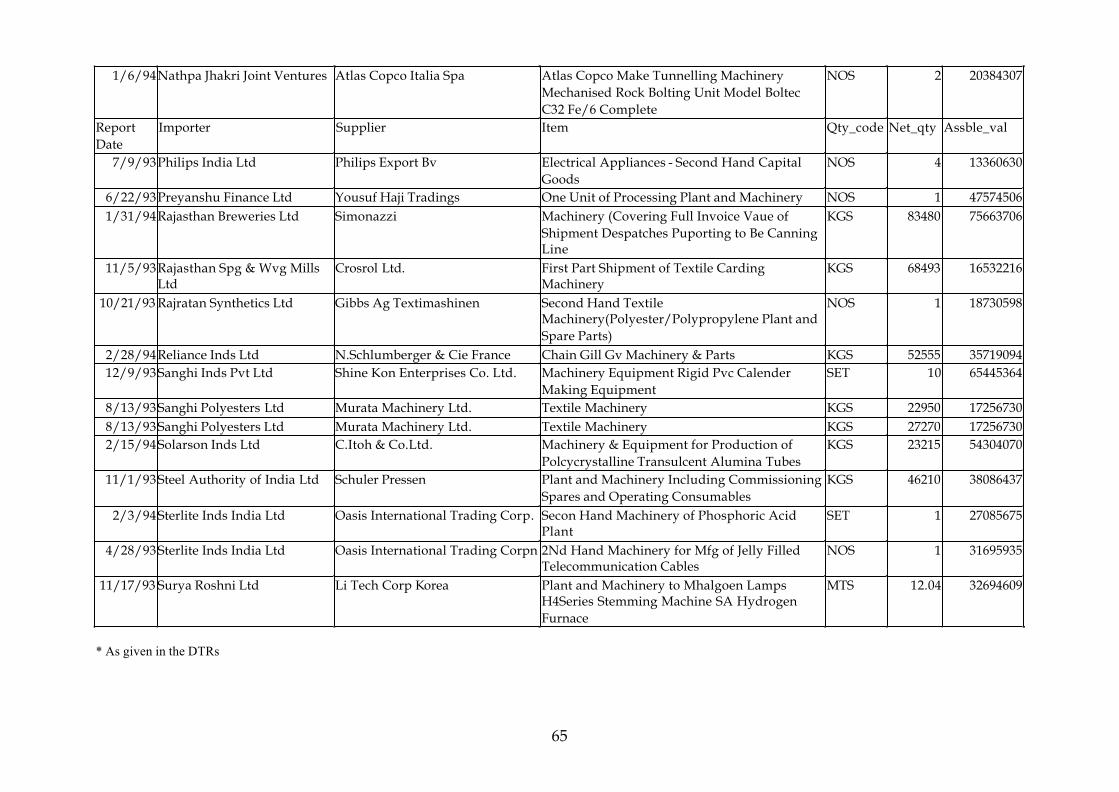
65
1/6/94Nathpa Jhakri Joint Ventures Atlas Copco Italia Spa Atlas Copco Make Tunnelling Machinery Mechanised Rock Bolting Unit Model Boltec C32 Fe/6 Complete
NOS 2 20384307
Report Date
Importer Supplier Item Qty_code Net_qty Assble_val
7/9/93Philips India Ltd Philips Export Bv Electrical Appliances - Second Hand Capital Goods
NOS 4 13360630
6/22/93Preyanshu Finance Ltd Yousuf Haji Tradings One Unit of Processing Plant and Machinery NOS 1 475745061/31/94Rajasthan Breweries Ltd Simonazzi Machinery (Covering Full Invoice Vaue of
Shipment Despatches Puporting to Be Canning Line
KGS 83480 75663706
11/5/93Rajasthan Spg & Wvg Mills Ltd
Crosrol Ltd. First Part Shipment of Textile Carding Machinery
KGS 68493 16532216
10/21/93 Rajratan Synthetics Ltd Gibbs Ag Textimashinen Second Hand Textile Machinery(Polyester/Polypropylene Plant and Spare Parts)
NOS 1 18730598
2/28/94Reliance Inds Ltd N.Schlumberger & Cie France Chain Gill Gv Machinery & Parts KGS 52555 3571909412/9/93Sanghi Inds Pvt Ltd Shine Kon Enterprises Co. Ltd. Machinery Equipment Rigid Pvc Calender
Making Equipment SET 10 65445364
8/13/93Sanghi Polyesters Ltd Murata Machinery Ltd. Textile Machinery KGS 22950 172567308/13/93Sanghi Polyesters Ltd Murata Machinery Ltd. Textile Machinery KGS 27270 172567302/15/94Solarson Inds Ltd C.Itoh & Co.Ltd. Machinery & Equipment for Production of
Polcycrystalline Transulcent Alumina Tubes KGS 23215 54304070
11/1/93Steel Authority of India Ltd Schuler Pressen Plant and Machinery Including Commissioning Spares and Operating Consumables
KGS 46210 38086437
2/3/94Sterlite Inds India Ltd Oasis International Trading Corp. Secon Hand Machinery of Phosphoric Acid Plant
SET 1 27085675
4/28/93Sterlite Inds India Ltd Oasis International Trading Corpn 2Nd Hand Machinery for Mfg of Jelly Filled Telecommunication Cables
NOS 1 31695935
11/17/93 Surya Roshni Ltd Li Tech Corp Korea Plant and Machinery to Mhalgoen Lamps H4Series Stemming Machine SA Hydrogen Furnace
MTS 12.04 32694609
* As given in the DTRs
65
Could such transactions also offer transfer pricing opportunities for the
TNCs? Would this practice increase in a regime of stricter transfer pricing
regulations? These questions need detailed examination.
While the problem of transfer pricing has been known for a long
time,10 India started developing a proper system to monitor transfer
pricing transactions only recently. Evolution of the system is continuing.
Following the Finance Act, 2001, the Income Tax Act, 1961 has been
amended to substitute the ineffective Section 92 and insert new sections
92A to 92F to provide statutory backing to the transfer pricing law.
Section 92C lays down the methods for the determination of arm’s length
prices. These are the same as the transaction methods prescribed in the
OECD Guidelines. Rule 10D of the Income Tax Rules prescribe the
various types of information to be maintained in respect of an
international transaction, the associated enterprise and the transfer pricing
method used.11 The first compliance date in respect of the new transfer
pricing regulation is July 31, 2002 for non-corporate and October 31, 2002
for corporate tax payers in respect of international transactions.
Similarly, Auditors of companies have been required to comment
on the reasonableness of the prices at which goods and materials are
purchased from or sold to entities in which the directors are interested.
Similar observations of the auditors are required on loans taken or
provided by the companies. The examination has generally been only at a
broad level. The new accounting standard AS(18) introduced in 2001 by
the Institute of Chartered Accountants of India, enhanced the disclosure
about transfer pricing related transactions. The Expert Group on Transfer
Pricing Guidelines constituted by the Department of Company Affairs is,
however, of the view that under AS(18) there is no obligation on part of
10 For instance, the MRTP Commission found Philips to be grossly undervaluing its exports in
1971, 1972 and 1973. Similarly, the Public Accounts Committee of Parliament found IBM and ICL to be indulging in transfer pricing in their imports to and exports from India. See: S.K. Goyal, Impact of Foreign Subsidiaries on India’s Balance of Payments, 1979.
11 Dinesh Verma, “Documentation Requirements under the Indian Transfer Pricing Law”, available at http://www.transferpricing.com/COUNTRY/india%20Dinesh%20Verma.htm.
66
the company to use an arm’s length price nor is there an adequate
mechanism whether transfer prices are fair or not.12 Towards this end, the
Group suggested adoption of Transfer Pricing Guidelines formulated by it
and enhanced disclosure in the company Annual Report inter alia
compliance with Transfer Pricing Guidelines. Companies have to report
about the related parties and the nature of transactions with them. Apart
from the disclosures, reliance would be placed on maintaining information
on related parties, examination by the Board’s Audit Committee and
auditor’s certificate. Interestingly, while transfer pricing has broader
scope and can be taken advantage by enterprises irrespective of their size,
and earlier adoption of AS(18) was prescribed uniformly, the Institute of
Chartered Accountants of India (ICAI) decided early this year to make the
standard mandatory only to enterprises whose equity or debt securities
are listed on a recognised stock exchange in India, and other enterprises,
whose turnover for the accounting period exceeds Rs. 50 crores.
As can be seen from the next part of the study, for corporates there
are a number of avenues for taking advantage of transfer pricing. Out of
the total foreign exchange expended by a company a large proportion is
spent on import of materials, capital goods, spare parts, etc. While there
can be no scope for transfer pricing in case of dividend payouts, payments
for technology, interest on loans received, issue of shares, etc. too can carry
an element of transfer pricing. On the other hand, earnings in foreign
exchange are largely dependent on exports. Together, exports and
imports accounted for 79 per cent of total transactions in foreign exchange
in 2000-01 of the sample companies – of which 41 per cent relates to
imports and 38 per cent relates to exports. This shows the important role
Customs Houses can play in detecting transfer pricing and ensuring that
transactions are made at arms-length prices thus ensuring on one hand no
12 See INDIA, Ministry of Industry and Company Affairs, Department of Company Affairs,
Report of the Expert Group on Transfer Pricing Guidelines, August 2002 available at: http://dca.nic.in/expert_group_report.htm .
67
loss of revenue for the exchequer and on the other no undue loss of
foreign exchange for the economy.
For detecting transfer pricing, the checking at Customs Houses
should, therefore, be thorough. Customs Houses are better placed because
these can make immediate and direct comparisons with similar other
transactions. It would prove useful to have international market intelligence
and a good sample of large shipments, which could be used to regularly
enquire into transactions between closely associated companies. The point
is whether a centralised system could be developed so that decision-
making at customs houses is fast to avoid undue delays and inconvenience
to the trading parties on the one hand and on the other there is
transparency in transactions so that malpractices by the Customs Houses
are minimised. With each of the major TNCs having thousands of
affiliates it is going to be a gigantic task to maintain such an information
system on a realtime basis.13 Also, the question of how much information
needs to be made public is something one needs to give more thought to.
In this respect, the DTR could be an indispensable means. As was brought
out in the previous sections, there is heavy concentration both in exports
and imports in terms of the trading parties. This suggests the relevance of
focussing on the large companies to begin with for a meaningful
monitoring of the transfer pricing phenomenon.
Presently, at the Customs, the emphasis has been on imports. As the
title “Customs Valuation (Determination of Price of Imported Goods)
Rules, 1988’ itself suggests, the valuation rules are addressed to import
valuation. Similarly, the Special Valuation Branches (SVB) located at the
four major Customs Houses namely, Mumbai, Chennai, Kolkata and Delhi
examine the influence of relationship on the invoice value of the imported
goods in respect of transactions between related parties. In respect of
13 For instance, Sesa Goa Ltd reported that the number of affiliates and fellow subsidiaries with
whom the company had no transactions during 2001-02 was 1,086. The company said it could provide the details of such companies to the concerned authorities as it would be unwieldy to provide the same in the Annual Report. See Sesa Goa Ltd., 37th Annual Report, 2001-2002.
68
Technical Collaboration Agreements and Joint Venture Agreements, the
terms and conditions of these agreements are examined to arrive at the
conclusion, whether the existence of such agreement has influenced the
invoice value of the imports. Even here, the onus is mainly on the
importer to declare at the time of filing the Bill of Entry in case the imports
are made from related parties as defined under the Customs Valuation
Rules, 1988 or they were having special relationship like technical
collaboration agreement. Understandably, all the finalised cases reported
by the SVB Chennai relate to imports only. While the Commissioner of
Customs can make a reference to the SVB regarding the valuation on
account of a special relationship, even if the same is not disclosed by the
importer, the procedure appears to be essentially of a voluntary disclosure
nature. Further, with the emphasis being on collection of customs duties,
the possibility of over-invoicing of imports could attract little attention. In
fact, the cases reported by the Chennai SVB contain cases of additional
loading to the invoice value and not any subtraction from it.
The emphasis on imports could be due to their implications for
collection of customs duties. In case of exports, the maximum the Customs
authorities might be concerned with is over-invoicing for its implications
for drawback payment and possibly for meeting export obligations. On
the other hand, there is considerable scope for under-invoicing in exports
especially in case of TNCs’ dealing with their parents and affiliates. It is
important to note that even earlier, the names of manufacturer and
supplier were part of only the import DTR and in case of exporter even the
address of the exporter was missing. The emphasis on revenue leakages is
further evident from the fact that providing appropriate HS codes was
emphasised in case of exports but not for imports even though improper
coding takes place in both types of transactions. As mentioned above,
export transactions are equally important when it comes to plugging of
leakages due to transfer pricing and hence need to be looked at more
carefully than what has been the case so far.

69
Given the trends in globalisation of Indian industry, many Indian
parties qualify to be termed as TNCs and many others would have related
parties in other countries. Being the first entry/final exit points for goods
it is important that transfer pricing should be dealt with at the level of
Customs which could make the task of the other agencies involved lighter.
70
Part – II Export Performance of Non-Government Companies
Introduction
During the ‘nineties the Indian economic policy regime underwent
major transformation and the regulations that made India a partially
closed economy have been given up. The rationale was that restrictions on
Foreign Direct Investment (FDI) and imports and strict internal
regulations like the Monopolies and Restrictive Trade Practices Act (MRTPA)
and Industries (Development and Regulation) Act, 1951, (IDRA), enabled local
manufactures to exploit monopoly rent, produce poor quality goods and
services, gave high profits with no obligation or concern for the average
consumer. There was no pressure on the producers to export. Neither
from quality point of view nor from the point of efficiency they were in a
position to compete in external markets. The low export performance of
large Indian companies and subsidiaries and affiliates of foreign
companies was well documented.1
Beginning with July 1991, a number of changes have been made in
the country's regulatory policies. The important departure from the past
was in the form of opening up of public sector reserved areas; drastic
revision of IDRA with the objective of removing a major entry point
hurdle, doing away with the registration requirements under MRTPA;
removal of the general ceiling of 40 per cent on foreign-held equity under
1 See for instance: S.K. Goyal, Monopoly Capital and Public Policy: Business and Economic
Power, Allied Publishers, 1979; S.K. Goyal, The Impact of Foreign Subsidiaries on India’s Balance of Payments, a report submitted to the CTC-ESCAP Joint Unit, Bangkok, 1979; K.K. Subrahmanian and P. Mohanan Pillai, Multinationals and Indian Exports, Sardar Patel Institute of Economic and Social Research, Ahmedabad, 1978, (Memeo); Nagesh Kumar, Multinational Enterprises and Industrial Organisation , Sage, Delhi, 1994; and K.S. Chalapati Rao, “An Evaluation of Export Policies and the Export Performance of Large Private Companies, in Pitou van Dijck and K.S. Chalapati Rao, India’s Trade Policy and the Export Performance of Industry, Sage, Delhi,.1994. A study for the early ‘nineties too underlined the low export performance of TNC affiliates in India. See: S.K. Goyal, et. al. “Economic Policies and Indian Development”, Institute for Studies in Industrial Development, Discussion Paper, April 1997.

71
Foreign Exchange Regulation Act, 1973 (FERA); lifting of the restrictions on
use of foreign brand names in the local market; removal of the restrictions
on FDI entry into low technology consumer goods; abandonment of the
phased manufacturing programme (PMP); dilution of the dividend
balancing condition and export obligations; liberalisation of the terms for
import of technology and royalty payments; etc. In the new policy regime,
proposals for foreign investment need not necessarily be accompanied by
foreign technology agreements. Import duties have been lowered
substantially and quantitative restrictions have been withdrawn and the
exchange rates have come to be determined by the market.
Part-I of the study presented an analysis of the DTR data for the
years 1988-89 to 1994-95. To provide an additional dimension to the study
and to bring out the trends in export-orientation, import intensity and
ability to earn net foreign exchange of the private corporate sector in the
post-WTO period and in response to the process of deregulation and trade
liberalisation, it was decided to analyse the reported earnings and
expenditures in foreign currencies by private sector companies.
While data on transactions in foreign currencies was initially compiled
for over 2,500 companies for the period 1995-96 to 2000-01, to avoid problems
of comparability of results across different years, to keep out certain
categories of companies engaged in activities like electricity generation and
distribution, which are unlikely to engage in export trade,2 and companies
which did not commence their commercial operations at the beginning of the
period, a common set of 2,147 non-government, non-financial public limited
companies from out of this data set were identified. The sample is selected
from the Prowess corporate database of the Centre for Monitoring Indian
Economy (CMIE).
2 Though there is a case for including such companies in a study of the net foreign exchange
earning capacity of the private corporate sector in general, for the present exercise such companies are being kept out.

72
Total paid-up capital (PUC) of the sample companies in 1995-96
was Rs. 25,081 crores and it formed nearly 42 per cent of the estimated
PUC of non-government non-financial pubic limited companies at the end
of the year. Each company has been classified on the basis of the main
activity that contributed more than half of its sales. Companies that could
not be classified in this manner are placed under the ‘Diversified’
category. Out of the 2,147 companies, 1,714 are manufacturing companies
and the remaining fall under the categories of agriculture and allied
activities, mining and quarrying, construction and services such as
computer software, trade, hotels and restaurants, etc. The 1,714
companies include 39 diversified ones. Ownership classification of
companies is similar to the one followed in Part I of the study. Companies
with at least 25 per cent direct foreign equity and subsidiaries and other
companies promoted in turn by such companies are classified as foreign–
controlled companies (FCCs). The remaining are classified into three
categories: (i) companies belonging to Business Houses and companies with
more than Rs. 1,000 crore sales in 1994-95 and other independent
companies with similar amount of sales are placed in the top most group
(hereinafter T1); (ii) the second largest group consists of Houses/companies
with sales between Rs. 500 crores and Rs. 1,000 crores (T2); and (iii) the
remaining are classified as Other Indian Companies (OIC).3
The data set is consistent over the period in respect of its
composition and company classification. It does not, however, take note
of the merger of companies and de-merger of units, which could affect the
relative changes in exports and imports of specific companies. While at
the aggregate level, this may not pose a serious problem, at individual
company and sectoral levels this phenomenon may give rise to some
distortions. Company-level data in general suffers from a few other
shortcomings. One, it does not take note of imported capital goods and
3 T1, T2 and OIC comprise non-FCCs only.

73
raw materials procured locally from other importers.4 Second, there could
be an element of double counting when both actual exporter and the
manufacturer claim the exports. Third, in case of Trading Houses and sub-
contracting, while the main exporters show only the exports, the imported
inputs would be on account of the supporting manufacturing unit. Also,
foreign exchange earnings reported by the hotel industry could be equated
better with earnings from tourism rather than being treated as earnings of
individual companies. Given the nature of company financial data, it is not
possible to segregate the distortions caused by such practices. What we
will be analysing here are direct imports and possibly both direct and
indirect exports. It is thus likely that import dependence would be
underestimated and earnings in foreign currencies could be overstated.
Another limitation is that the sample consists essentially of stock exchange
listed companies and their subsidiaries. Since most companies with
substantial FDI participation are keeping themselves out of the stock
market5, the behaviour of foreign-controlled companies (FCCs) as emerging
from the present study would only be reflective of the behaviour of the
older FCCs. Since the attempt is to study a consistent set of companies to
bring out the trends in a more appropriate manner, the sample fails to take
note of the newer companies, which came into production towards the end
of the period. While interpreting the results of this exercise, these factors
should be kept in mind.
4 For instance, Hindustan Lever Ltd., reported in its Annual Report for the year 2001
that the imports exclude “purchases from canalising agencies and imported items purchased locally”. See: Hindustan Lever Ltd., Report and Accounts 2001, p. 22. and Hind Lever Chemicals Ltd., Report and Accounts, 2000, p.19.
5 Indeed, some of the listed FCCs are getting themselves delisted by buying out the shareholding of local investors. See for instance, S.K. Goyal, et. al., Foreign Investment Approvals: An Analysis (August 1991 – July 1993), Institute for Studies in Industrial Development (ISID), a Report submitted to the Ministry of Finance, 1994; and K.S. Chalapati Rao, M.R. Murthy & K.V.K. Ranganathan, “Foreign Direct Investments in the Post-Liberalisation Period: An Overview”, Journal of Indian School of Political Economy , Vol. XI, No-3, July-September, 1999.
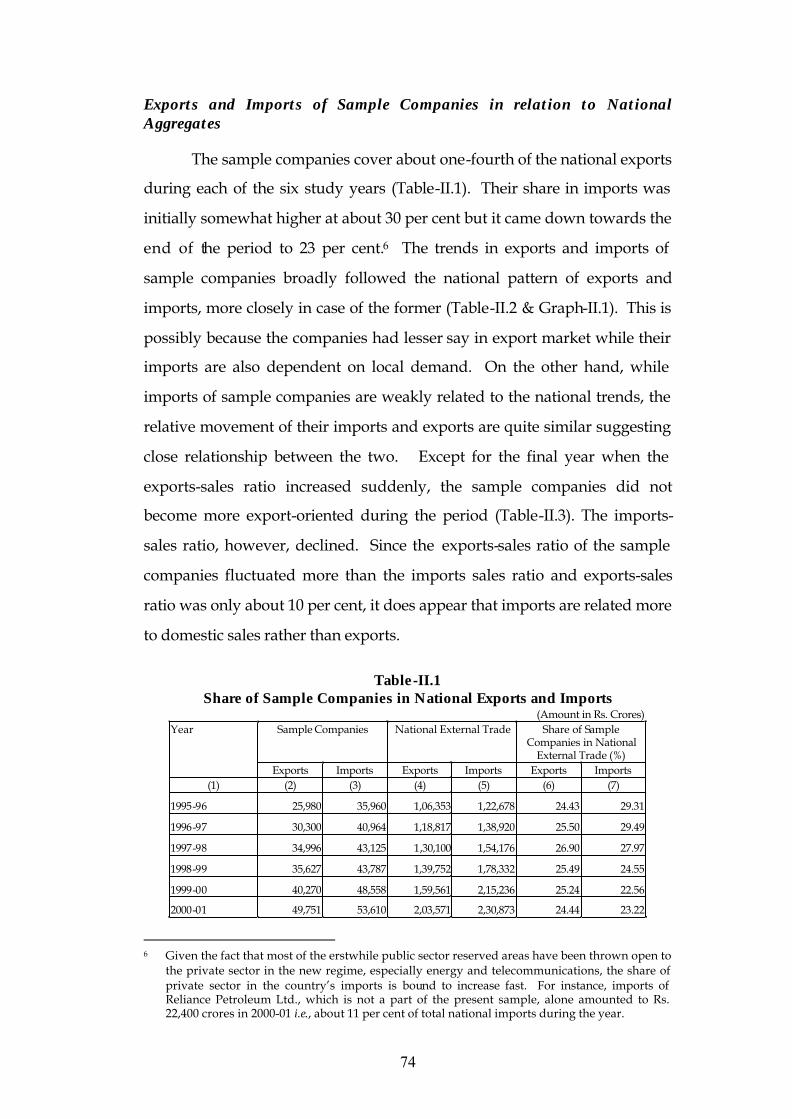
74
Exports and Imports of Sample Companies in relation to National Aggregates
The sample companies cover about one-fourth of the national exports
during each of the six study years (Table-II.1). Their share in imports was
initially somewhat higher at about 30 per cent but it came down towards the
end of the period to 23 per cent.6 The trends in exports and imports of
sample companies broadly followed the national pattern of exports and
imports, more closely in case of the former (Table-II.2 & Graph-II.1). This is
possibly because the companies had lesser say in export market while their
imports are also dependent on local demand. On the other hand, while
imports of sample companies are weakly related to the national trends, the
relative movement of their imports and exports are quite similar suggesting
close relationship between the two. Except for the final year when the
exports-sales ratio increased suddenly, the sample companies did not
become more export-oriented during the period (Table-II.3). The imports-
sales ratio, however, declined. Since the exports-sales ratio of the sample
companies fluctuated more than the imports sales ratio and exports-sales
ratio was only about 10 per cent, it does appear that imports are related more
to domestic sales rather than exports.
Table-II.1
Share of Sample Companies in National Exports and Imports (Amount in Rs. Crores)
Sample Companies National External Trade Share of Sample Companies in National
External Trade (%)
Year
Exports Imports Exports Imports Exports Imports (1) (2) (3) (4) (5) (6) (7)
1995-96 25,980 35,960 1,06,353 1,22,678 24.43 29.31
1996-97 30,300 40,964 1,18,817 1,38,920 25.50 29.49
1997-98 34,996 43,125 1,30,100 1,54,176 26.90 27.97
1998-99 35,627 43,787 1,39,752 1,78,332 25.49 24.55
1999-00 40,270 48,558 1,59,561 2,15,236 25.24 22.56
2000-01 49,751 53,610 2,03,571 2,30,873 24.44 23.22
6 Given the fact that most of the erstwhile public sector reserved areas have been thrown open to
the private sector in the new regime, especially energy and telecommunications, the share of private sector in the country’s imports is bound to increase fast. For instance, imports of Reliance Petroleum Ltd., which is not a part of the present sample, alone amounted to Rs. 22,400 crores in 2000-01 i.e., about 11 per cent of total national imports during the year.

75
Table-II.2 Growth in Exports and Imports of Sample Companies
(Percentages)
In Terms of Rupees Annual Growth Rate (%)
Year
Sample National
(1) (2) (3) Exports 1995-96 - - 1996-97 16.63 11.72 1997-98 15.50 9.50 1998-99 1.80 7.42 1999-00 13.03 14.17 2000-01 23.55 27.58
Imports 1995-96 - - 1996-97 13.92 13.24 1997-98 5.28 10.98 1998-99 1.53 15.67 1999-00 10.90 20.69 2000-01 10.41 7.27
Graph-II.1
0
5
10
15
20
25
30
1996-97 1997-98 1998-99 1999-00 2000-01
Gro
wth
Rat
e (%
)
Exports:Sample Exports:NationalImports:Sample Imports:National
Annual Growth Rates of Exports and Imports (at current prices)
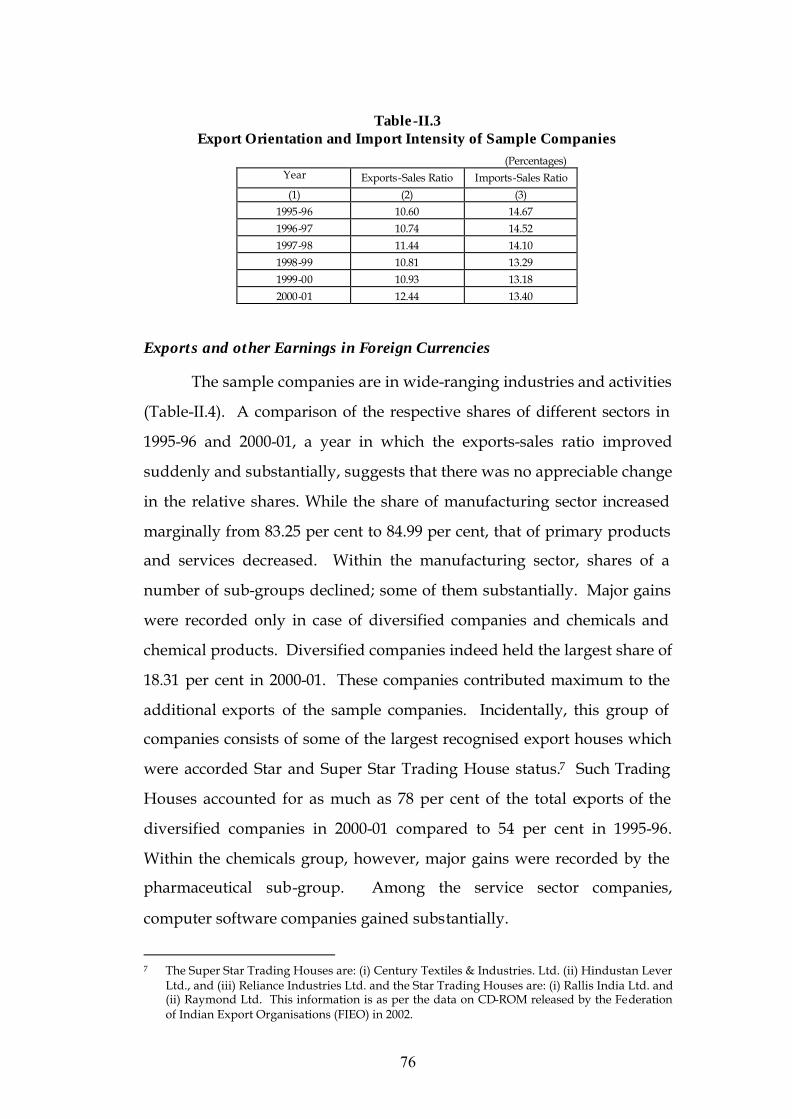
76
Table-II.3
Export Orientation and Import Intensity of Sample Companies
(Percentages) Year Exports-Sales Ratio Imports-Sales Ratio (1) (2) (3)
1995-96 10.60 14.67 1996-97 10.74 14.52 1997-98 11.44 14.10 1998-99 10.81 13.29 1999-00 10.93 13.18 2000-01 12.44 13.40
Exports and other Earnings in Foreign Currencies
The sample companies are in wide-ranging industries and activities
(Table-II.4). A comparison of the respective shares of different sectors in
1995-96 and 2000-01, a year in which the exports-sales ratio improved
suddenly and substantially, suggests that there was no appreciable change
in the relative shares. While the share of manufacturing sector increased
marginally from 83.25 per cent to 84.99 per cent, that of primary products
and services decreased. Within the manufacturing sector, shares of a
number of sub-groups declined; some of them substantially. Major gains
were recorded only in case of diversified companies and chemicals and
chemical products. Diversified companies indeed held the largest share of
18.31 per cent in 2000-01. These companies contributed maximum to the
additional exports of the sample companies. Incidentally, this group of
companies consists of some of the largest recognised export houses which
were accorded Star and Super Star Trading House status.7 Such Trading
Houses accounted for as much as 78 per cent of the total exports of the
diversified companies in 2000-01 compared to 54 per cent in 1995-96.
Within the chemicals group, however, major gains were recorded by the
pharmaceutical sub-group. Among the service sector companies,
computer software companies gained substantially.
7 The Super Star Trading Houses are: (i) Century Textiles & Industries. Ltd. (ii) Hindustan Lever
Ltd., and (iii) Reliance Industries Ltd. and the Star Trading Houses are: (i) Rallis India Ltd. and (ii) Raymond Ltd. This information is as per the data on CD-ROM released by the Federation of Indian Export Organisations (FIEO) in 2002.

77
Table-II.4 Industry/Activity-wise Exports of Sample Companies
Increase Exports
(US $ mn.) Share in Total
(%) Sector/Activity No.
of Cos.
1995-96 2000-01 1995-96 2000-01Amount (US $ mn.)
Per cent Share in Increase (%)
(1) (2) (3) (4) (5) (6) (7) (8) (9) I. Primary Products 104 351.56 449.97 4.53 4.13 98.41 27.99 3.15
1 Animal Products 4 13.05 18.07 0.17 0.17 5.02 38.43 0.16 2 Plantations & Agricultural Products 57 248.16 229.79 3.19 2.11 -18.37 -7.40 -0.59 3 Mineral Products 43 90.35 202.12 1.16 1.86 111.77 123.71 3.58
II. Manufactured Goods 1,714 6,466.87 9,255.08 83.25 84.99 2,788.21 43.12 89.30 4 Fats, Oils & Derived Products 41 163.09 171.56 2.10 1.58 8.47 5.19 0.27
5 Food Products, Beverages & Tobacco Products 97 287.88 260.33 3.71 2.39 -27.55 -9.57 -0.88
- Beverages & Tobacco Products 30 178.25 148.25 2.29 1.36 -30.00 -16.83 -0.96 - Marine Foods 8 14.71 15.32 0.19 0.14 0.61 4.16 0.02 - Sugar 28 4.87 12.27 0.06 0.11 7.41 152.15 0.24 6 Textiles 273 1,254.14 1,411.22 16.15 12.96 157.08 12.53 5.03 - Cotton Yarn, Textiles, etc. 149 818.92 959.90 10.54 8.81 140.99 17.22 4.52 - Manmade Fibre Textiles 63 170.70 247.10 2.20 2.27 76.40 44.75 2.45 - Jute Products 6 61.61 47.45 0.79 0.44 -14.16 -22.98 -0.45 - Readymade Garments 23 48.08 42.39 0.62 0.39 -5.70 -11.85 -0.18 7 Leather & Leather Products 12 79.60 56.56 1.02 0.52 -23.04 -28.94 -0.74 8 Wood & Wood Products 8 8.39 4.51 0.11 0.04 -3.89 -46.30 -0.12 9 Paper & Paper Products 65 52.90 59.26 0.68 0.54 6.36 12.03 0.20 10 Chemicals & Chemical Products 298 921.56 1,571.86 11.86 14.43 650.31 70.57 20.83 - Drugs & Pharmaceuticals 105 402.24 909.24 5.18 8.35 507.01 126.05 16.24 - Dyes & Pigments 21 133.23 172.22 1.72 1.58 38.98 29.26 1.25 - Pesticides 15 70.81 102.48 0.91 0.94 31.67 44.72 1.01 - Cosmetics & Toiletries 21 75.49 90.91 0.97 0.83 15.42 20.43 0.49 - Fertilisers 21 28.85 49.72 0.37 0.46 20.87 72.34 0.67 - Paints & Varnishes 12 7.51 29.12 0.10 0.27 21.60 287.53 0.69 11 Plastic & Rubber Products 156 395.21 415.41 5.09 3.81 20.20 5.11 0.65 - Plastic Products 122 196.57 250.08 2.53 2.30 53.51 27.22 1.71 - Rubber & Rubber Products 34 198.64 165.33 2.56 1.52 -33.31 -16.77 -1.07 12 Non-Metallic Mineral Products 79 148.62 104.28 1.91 0.96 -44.34 -29.83 -1.42 - Cement, Asbestos & Products 37 107.42 60.17 1.38 0.55 -47.26 -43.99 -1.51 - Glass & Glass Products 36 37.76 34.11 0.49 0.31 -3.65 -9.68 -0.12 - Abrasives 6 3.44 10.01 0.04 0.09 6.57 191.26 0.21 13 Metals & Metal Products 190 944.74 1,373.57 12.16 12.61 428.83 45.39 13.73 - Ferrous Metals & Products 155 809.92 1,109.03 10.43 10.18 299.11 36.93 9.58 - Non-Ferrous Metals & Products 35 134.82 264.55 1.74 2.43 129.73 96.22 4.15 14 Non-Electrical Machinery 114 213.72 310.15 2.75 2.85 96.43 45.12 3.09 15 Electrical Machinery, Appliances, etc 105 244.99 265.57 3.15 2.44 20.59 8.40 0.66 - Domestic Electrical Appliances 26 44.47 25.73 0.57 0.24 -18.74 -42.14 -0.60 - Wires & Cables 23 22.70 14.73 0.29 0.14 -7.97 -35.13 -0.26 16 Electronic Items & Components 89 129.56 221.94 1.67 2.04 92.38 71.30 2.96 - Computer Hardware 15 39.78 53.26 0.51 0.49 13.49 33.91 0.43 - Consumer Electronics 15 46.97 48.84 0.60 0.45 1.87 3.99 0.06 17 Transport Equipment 112 662.99 555.12 8.54 5.10 -107.86 -16.27 -3.45 - Automobiles & Ancillaries 104 633.98 538.34 8.16 4.94 -95.63 -15.08 -3.06 18 Gems & Jewellery 19 298.30 452.80 3.84 4.16 154.50 51.79 4.95 19 Misc. Manufactured Articles 17 23.13 27.19 0.30 0.25 4.06 17.56 0.13 20 Diversified Companies 39 638.04 1,993.71 8.21 18.31 1,355.67 212.47 43.42 III. Services 329 949.20 1,185.05 12.22 10.88 235.85 24.85 7.55 24 Trading 159 885.57 824.06 11.40 7.57 -61.52 -6.95 -1.97 21 Computer Software 47 19.73 326.93 0.25 3.00 307.20 1,556.82 9.84 25 Hotels & Restaurants 37 8.86 25.07 0.11 0.23 16.21 183.06 0.52 22 Construction 71 34.96 8.96 0.45 0.08 -26.00 -74.37 -0.83 23 Other Services 15 0.07 0.03 0.00 0.00 -0.04 -59.00 0.00 All Companies (I+II+III) 2,147 7,767.63 10,890.10 100.00 100.00 3,122.47 40.20 100.00
78
Over the last many years, as a matter of policy, Indian companies
have been encouraged to set up joint ventures and wholly-owned
subsidiaries abroad. One of the expectations was that these ventures
would help promote the investing companies’ exports through supply of
capital goods and raw materials. The ventures can also be service
ventures to provide after-sales service/organise sales network and
procure materials for the parent Indian company. Besides improving
export prospects, there is an additional advantage of earning interest,
royalties, dividends and consultancy fees as also procure imports at
competitive prices.8 Thus, it is likely that sources of earnings in foreign
currencies would get diversified. Table-II.5 does suggest such a possibility
as the share of exports in total earnings varied widely. At the aggregate
level, share of exports in total earnings declined from 88.63 per cent to
77.51 per cent. While this happened for all the categories of companies,
the decline was more pronounced in case of T2 and OICs. Share of
exports in total earnings, however, declined for T1 and for FCCs. But the
decline was less marked. Indian companies’ earnings in foreign exchange
can now be potentially influenced by earnings other than through exports
– a little less than one-fourth of the total. Indeed, one-third of total
earnings of T2 and one-fourth that of OICs is accounted by the other
earnings.
Detailed data on the other earnings is not directly available in the
database. It does, however, appear that a substantial part of the other
earnings are for the services rendered including development of
computer software and provision of IT services, and transactions in
8 FICCI, Workshop on Indian Joint Ventures Abroad and Project Exports, 1982; Sanjay Lall,
Developing Countries as Exporters of Technology: A First look at the Indian Experience, Macmillan, London, 1982; K.V.K. Ranganathan, Indian Joint Ventures abroad: with Special Reference to Islamic Countries, Economic and Political weekly, Vol. XIX, Nos. 20 & 21, 1984; J.P. Agarwal, Pros and Cons of Third World Multinationals : A Case Study of India, ` JCB Mohr (Paul Sieback) Tubigen, 1985; and Rajiv B. Lall, Multinationals from the Third World : Indian Firms Investing Abroad, Oxford University Press, Delhi, 1986.

79
Table-II.5 Share of Exports in Gross Earnings in Foreign Currencies
(Amount in Rs. Crores)
Year Exports Other Earnings Total Earnings in Foreign Currencies
Share of Exports in Total Earnings (%)
(1) (2) (3) (4) (5)
T1: Top 50 Houses (277)
1995-96 9,491 1,342 10,832 87.61
1996-97 10,767 2,926 13,693 78.63
1997-98 12,595 3,340 15,936 79.04
1998-99 11,997 4,246 16,243 73.86
1999-00 14,667 3,963 18,630 78.73
2000-01 19,441 4,869 24,310 79.97
T2: Next 50 Houses (150)
1995-96 2,725 327 3,052 89.28
1996-97 3,211 544 3,755 85.51
1997-98 3,713 666 4,379 84.79
1998-99 3,812 958 4,770 79.91
1999-00 4,108 1,425 5,530 74.23
2000-01 4,690 2,264 6,954 67.45
OICs: Other Indian Cos. (1,431)
1995-96 9,098 1,061 10,159 89.56
1996-97 10,727 1,397 12,124 88.48
1997-98 12,250 1,821 14,071 87.06
1998-99 12,985 2,819 15,804 82.16
1999-00 14,416 3,306 17,722 81.35
2000-01 17,740 5,529 23,269 76.24
FCCs: Foreign-Controlled Cos. (289)
1995-96 4,666 603 5,269 88.56
1996-97 5,596 745 6,341 88.25
1997-98 6,438 1,375 7,812 82.40
1998-99 6,833 1,184 8,017 85.23
1999-00 7,081 1,397 8,478 83.52
2000-01 7,880 1,774 9,654 81.63
All Companies (2,147)
1995-96 25,980 3,333 29,313 88.63
1996-97 30,300 5,612 35,912 84.37
1997-98 34,996 7,202 42,198 82.93
1998-99 35,627 9,208 44,835 79.46
1999-00 40,270 10,090 50,360 79.96
2000-01 49,751 14,435 64,187 77.51Figures in brackets are number of companies in the respective category.
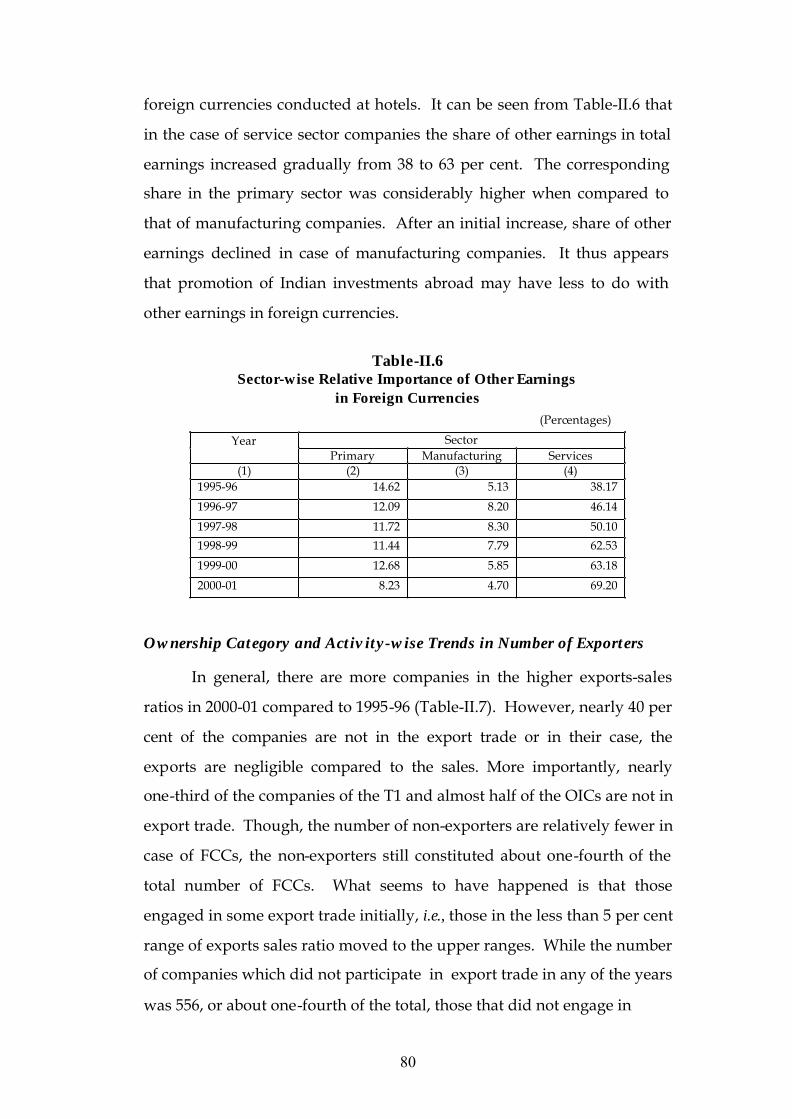
80
foreign currencies conducted at hotels. It can be seen from Table-II.6 that
in the case of service sector companies the share of other earnings in total
earnings increased gradually from 38 to 63 per cent. The corresponding
share in the primary sector was considerably higher when compared to
that of manufacturing companies. After an initial increase, share of other
earnings declined in case of manufacturing companies. It thus appears
that promotion of Indian investments abroad may have less to do with
other earnings in foreign currencies.
Table-II.6
Sector-wise Relative Importance of Other Earnings in Foreign Currencies
(Percentages)
Sector Year Primary Manufacturing Services
(1) (2) (3) (4) 1995-96 14.62 5.13 38.17
1996-97 12.09 8.20 46.14
1997-98 11.72 8.30 50.10
1998-99 11.44 7.79 62.53
1999-00 12.68 5.85 63.18
2000-01 8.23 4.70 69.20
Ownership Category and Activity-wise Trends in Number of Exporters
In general, there are more companies in the higher exports-sales
ratios in 2000-01 compared to 1995-96 (Table-II.7). However, nearly 40 per
cent of the companies are not in the export trade or in their case, the
exports are negligible compared to the sales. More importantly, nearly
one-third of the companies of the T1 and almost half of the OICs are not in
export trade. Though, the number of non-exporters are relatively fewer in
case of FCCs, the non-exporters still constituted about one-fourth of the
total number of FCCs. What seems to have happened is that those
engaged in some export trade initially, i.e., those in the less than 5 per cent
range of exports sales ratio moved to the upper ranges. While the number
of companies which did not participate in export trade in any of the years
was 556, or about one-fourth of the total, those that did not engage in
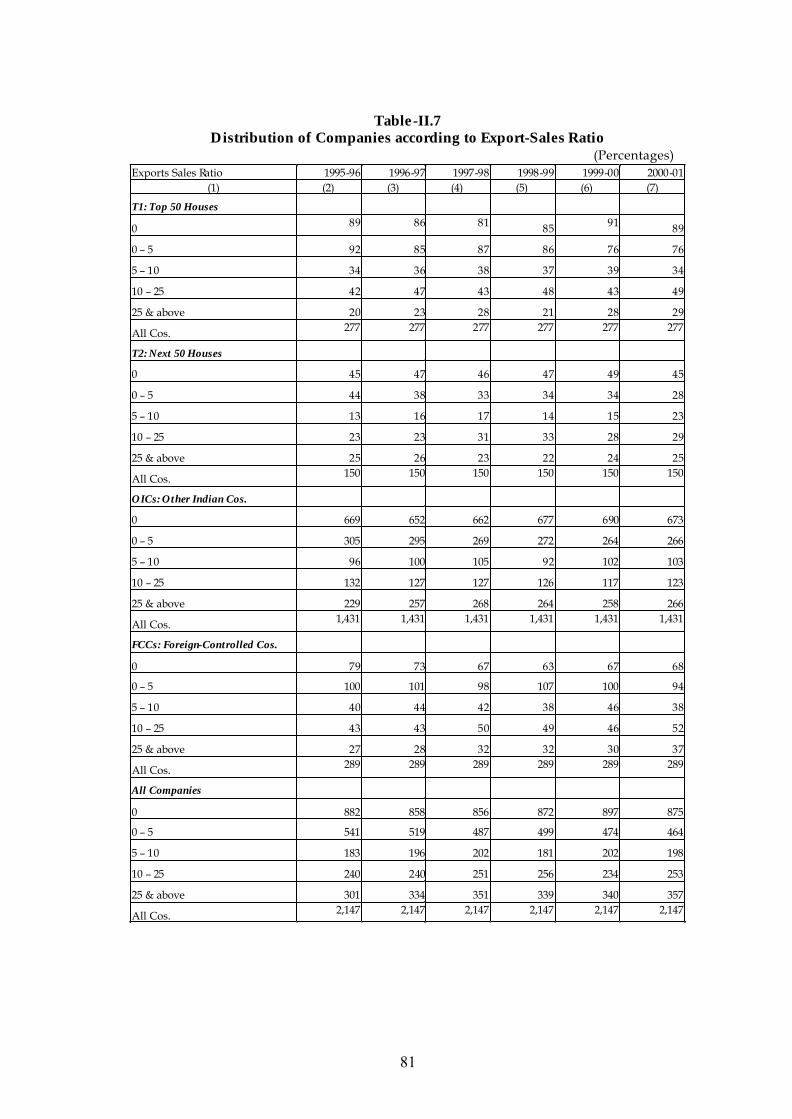
81
Table-II.7
Distribution of Companies according to Export-Sales Ratio (Percentages)
Exports Sales Ratio 1995-96 1996-97 1997-98 1998-99 1999-00 2000-01(1) (2) (3) (4) (5) (6) (7)
T1: Top 50 Houses
0 89 86 81 85 91 89
0 – 5 92 85 87 86 76 76
5 – 10 34 36 38 37 39 34
10 – 25 42 47 43 48 43 49
25 & above 20 23 28 21 28 29
All Cos. 277 277 277 277 277 277
T2: Next 50 Houses
0 45 47 46 47 49 45
0 – 5 44 38 33 34 34 28
5 – 10 13 16 17 14 15 23
10 – 25 23 23 31 33 28 29
25 & above 25 26 23 22 24 25
All Cos. 150 150 150 150 150 150
OICs: Other Indian Cos.
0 669 652 662 677 690 673
0 – 5 305 295 269 272 264 266
5 – 10 96 100 105 92 102 103
10 – 25 132 127 127 126 117 123
25 & above 229 257 268 264 258 266
All Cos. 1,431 1,431 1,431 1,431 1,431 1,431
FCCs: Foreign-Controlled Cos.
0 79 73 67 63 67 68
0 – 5 100 101 98 107 100 94
5 – 10 40 44 42 38 46 38
10 – 25 43 43 50 49 46 52
25 & above 27 28 32 32 30 37
All Cos. 289 289 289 289 289 289
All Companies
0 882 858 856 872 897 875
0 – 5 541 519 487 499 474 464
5 – 10 183 196 202 181 202 198
10 – 25 240 240 251 256 234 253
25 & above 301 334 351 339 340 357
All Cos. 2,147 2,147 2,147 2,147 2,147 2,147
82
exports in at least one of the years was quite high at 1,201, i.e., 56 per cent
of the total. If one considers exporting without any break to be an
indication of regular exporter, the number of regular exporters i.e., those
who exported in all the initial three years was 1,107. The corresponding
number in the final three years is practically the same at 1,111. In all, only
946 companies, or about 45 per cent of the total, exported in all the six
years. These, however, accounted for 90 per cent of the total exports in
2000-01. Thus, while there is an increase in the number of companies with
higher export-sales ratios, the number of exporters remained static during
the period.
Export Orientation
Maximum increase in exports was recorded by the T1 companies
followed by OICs (Table-II.8). Exports of FCCs, however, increased the
slowest. Their exports-sales ratio indeed declined at the aggregate level.9
From the Table-II.9 it can be seen that irrespective of the group affiliation,
export-orientation experienced two spurts first in 1997-98 and next in
2000-01, the latter coinciding with the national level experience. Within
the sample, various categories of companies behaved differently in terms
of export-orientation. This latter group was also better placed in terms of
export- orientation (Table-II.9 & Graph-II.2). Thus, the increase in overall
exports was due to T1 and OICs. In terms of export orientation, as
reflected in the export-sales ratios, non-large house Indian companies
fared the best followed by the large house companies. In terms of export-
orientation too, FCCs lagged behind. FCCs with their established brand
names, superior technology and product acceptance, close association with the
consumers through world- wide subsidiaries and affiliates were expected to be
9 A number of studies in India focused this aspect of TNCs exports. The general
findings of these studies reveals that either the FCCs were not significantly better export-oriented than the Indian companies and /or that their operations have had a negative impact on the over all balance of payments position. In certain cases, the apparent better position was mainly due to export of traded products, often unrelated to the main operations of the exporting company. For details see K.S. Chalapati Rao, op. cit.

83
Table-II.8 Company Category-wise Export Earnings of Sample Companies
(Amount in US $ mn.) Company Category No. of
Companies 1995-96 2000-01 Increase (%)
(1) (2) (3) (4) (5) T1: Top 50 Houses/ Largest Companies 277 2,838 4,255 49.97T2: Second 50 Houses/ Large Cos. 150 815 1,026 25.99OICs: Other Indian Cos. 1431 2,720 3,883 42.76Indian Cos. (T1+T2+OICs) 1858 6,372 9,165 43.83FCCs: Foreign Controlled Cos. 289 1,395 1,725 23.63All Sample Companies 2147 7,768 10,890 40.20
Table-II.9
Changes in the Export Orientation of Sample Companies
(Rs. Crores) Company Affiliation/ Year
Net Sales Exports Exports-Sales Ratio (%)
(1) (2) (3) (4)
T1: Top 50 Houses (277) 1995-96 99,989 9,491 9.491996-97 113,563 10,767 9.481997-98 122,699 12,595 10.271998-99 129,525 11,997 9.261999-00 146,857 14,667 9.992000-01 160,840 19,441 12.09T2: Next 50 Houses (150) 1995-96 31,035 2,725 8.781996-97 36,088 3,211 8.901997-98 38,533 3,713 9.641998-99 41,104 3,812 9.271999-00 44,223 4,108 9.282000-01 49,029 4,690 9.57
OICs: Other Indian Cos. (1,431) 1995-96 64,184 9,098 14.171996-97 71,221 10,727 15.061997-98 78,640 12,250 15.581998-99 87,106 12,985 14.911999-00 96,827 14,417 14.892000-01 105,406 17,740 16.83FCCs: Foreign-Controlled Cos. (289) 1995-96 49,960 4,666 9.341996-97 61,252 5,596 9.141997-98 66,083 6,438 9.741998-99 71,721 6,833 9.531999-00 80,625 7,081 8.782000-01 84,786 7,880 9.29All Companies (2,147) 1995-96 245,169 25,980 10.601996-97 282,123 30,300 10.741997-98 305,955 34,996 11.441998-99 329,456 35,627 10.811999-00 368,533 40,270 10.932000-01 400,061 49,751 12.44

84
Graph-II.2
in a better position to promote host country exports. This does not seem to have
happened in India even in the ‘nineties.
Pattern of Expenditure in Foreign Currencies
Just as companies earn foreign exchange through means other than
exports, they also spend foreign exchange in a similar manner. Table-II.10
provides the pattern of foreign exchange spending by the sample
companies. Unlike in the case of earnings, somewhat more detailed
information on other forms of expenditure is available. As in the case of
earnings where the share of exports declined, the overall share of imports
in total expenditure in foreign currencies also declined. Differences
between various categories of companies also exist. For example, in case
of the T1 companies, the decline was only marginal. On the other hand,
the decline was more prominent in case of other companies especially,
OICs.
Interest payments in case of T1 companies and dividend payments
together with royalty payments in case of FCCs constituted other
important identifiable items of expenditure in foreign currencies. Interest-
Export Orientation of Sample Companies
8
9101112
13141516
1718
1995-96 1996-97 1997-98 1998-99 1999-00 2000-01
(Exp
orts
-Sal
es R
atio
-- %
)OICs
T1
T2
FCCs
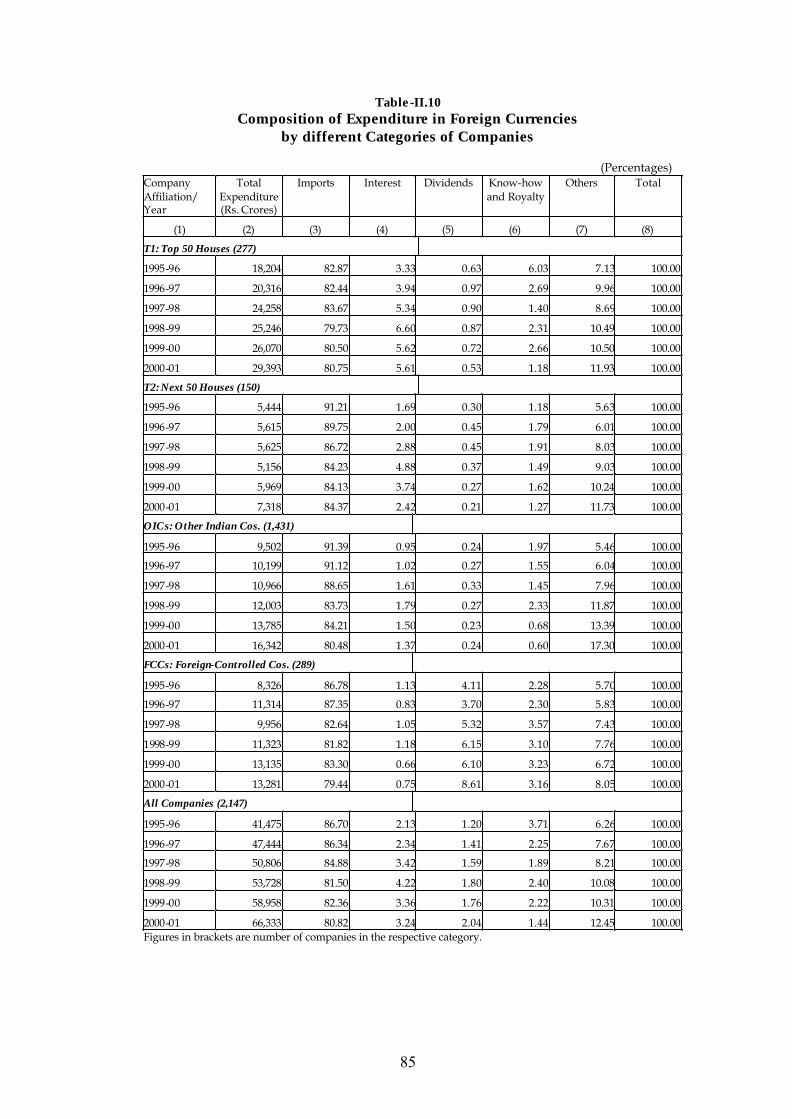
85
Table-II.10 Composition of Expenditure in Foreign Currencies
by different Categories of Companies
(Percentages) Company Affiliation/ Year
Total Expenditure (Rs. Crores)
Imports Interest Dividends Know-how and Royalty
Others Total
(1) (2) (3) (4) (5) (6) (7) (8)
T1: Top 50 Houses (277)
1995-96 18,204 82.87 3.33 0.63 6.03 7.13 100.00
1996-97 20,316 82.44 3.94 0.97 2.69 9.96 100.00
1997-98 24,258 83.67 5.34 0.90 1.40 8.69 100.00
1998-99 25,246 79.73 6.60 0.87 2.31 10.49 100.00
1999-00 26,070 80.50 5.62 0.72 2.66 10.50 100.00
2000-01 29,393 80.75 5.61 0.53 1.18 11.93 100.00
T2: Next 50 Houses (150)
1995-96 5,444 91.21 1.69 0.30 1.18 5.63 100.00
1996-97 5,615 89.75 2.00 0.45 1.79 6.01 100.00
1997-98 5,625 86.72 2.88 0.45 1.91 8.03 100.00
1998-99 5,156 84.23 4.88 0.37 1.49 9.03 100.00
1999-00 5,969 84.13 3.74 0.27 1.62 10.24 100.00
2000-01 7,318 84.37 2.42 0.21 1.27 11.73 100.00
OICs: Other Indian Cos. (1,431)
1995-96 9,502 91.39 0.95 0.24 1.97 5.46 100.00
1996-97 10,199 91.12 1.02 0.27 1.55 6.04 100.00
1997-98 10,966 88.65 1.61 0.33 1.45 7.96 100.00
1998-99 12,003 83.73 1.79 0.27 2.33 11.87 100.00
1999-00 13,785 84.21 1.50 0.23 0.68 13.39 100.00
2000-01 16,342 80.48 1.37 0.24 0.60 17.30 100.00
FCCs: Foreign-Controlled Cos. (289)
1995-96 8,326 86.78 1.13 4.11 2.28 5.70 100.00
1996-97 11,314 87.35 0.83 3.70 2.30 5.83 100.00
1997-98 9,956 82.64 1.05 5.32 3.57 7.43 100.00
1998-99 11,323 81.82 1.18 6.15 3.10 7.76 100.00
1999-00 13,135 83.30 0.66 6.10 3.23 6.72 100.00
2000-01 13,281 79.44 0.75 8.61 3.16 8.05 100.00
All Companies (2,147)
1995-96 41,475 86.70 2.13 1.20 3.71 6.26 100.00
1996-97 47,444 86.34 2.34 1.41 2.25 7.67 100.00
1997-98 50,806 84.88 3.42 1.59 1.89 8.21 100.00
1998-99 53,728 81.50 4.22 1.80 2.40 10.08 100.00
1999-00 58,958 82.36 3.36 1.76 2.22 10.31 100.00
2000-01 66,333 80.82 3.24 2.04 1.44 12.45 100.00Figures in brackets are number of companies in the respective category.
86
ingly, the share of royalty payments declined significantly in case of T1
companies. This could be interpreted in two ways. One, large Indian
companies are depending less and less on technology imports and two,
they are focussing more on commodities which are not associated with
technology imports. An equally important possibility is that foreign
companies are less inclined to provide technology to un-associated Indian
companies in the post-liberalisation period.10 In the new regime, not only
the relative share of technical collaborations in the total foreign
collaboration approvals but also the importance of arms-length transfer of
technology declined.11 An interesting major development in case of the T2
companies, and to some extent T1 companies as well, is the increasing
share of other forms of expenditure in foreign currencies. The
corresponding share was somewhat stable in case of FCCs. While foreign
travel is one component of such other expenditure, it should be seen
whether commissions, insurance, etc. explain a substantial portion of the
other expenditure.
From Table-II.11 it can be seen that Service sector companies once
again behaved differently with very high share of other items of
expenditure. Such items accounted for close two-thirds of the total
expenditure. In case of manufacturing companies too the corresponding
share increased while for primary sector companies, the share declined
steeply. A comparison with Table-II.6 suggests that the other items could
be closely related to earnings in foreign currencies other than through
exports.
10 See: Goyal, S.K., op. cit. (1994); and M.R. Murthy and K.V.K. Ranganathan, ‘Foreign Private
Capital: Penetration through Collaboration’ Young Indian , Vol. 8, Issue No. 10, October 11, 1997.
11 See: S.K. Goyal, et. al., Foreign Investment Approvals & Implementation Status: A Review (August 1991 – December 1994), Institute for Studies in Industrial Development, 1995, a report submitted to the Ministry of Finance.

87
Table-II.11
Sector-wise Relative Importance of Expenditure other than Imports in Foreign Currencies
(Percentages) Sector Year
Primary Manufacturing Services
(1) (2) (3) (4) 1995-96 25.19 11.64 37.33
1996-97 16.23 11.90 40.43
1997-98 16.76 12.75 45.55
1998-99 17.90 15.44 53.31
1999-00 13.40 13.92 54.08
2000-01 8.81 14.17 66.36
Within imports too substantial changes are taking place. Imports of
raw materials, stores and spares are becoming more significant (Table-
II.12, Graphs-II.3A&B ). On the other hand, share of capital goods fell
quite steeply. While falling imports of capital goods may be a reflection
of the slowing down of the economy, the fast increasing imports especially
of raw materials suggest the long term dependence on imported
intermediate inputs by large Indian companies. Interestingly, non-large
house Indian companies did not experience a similar decline in the share
of imported capital goods. Another factor which emerged of late is the
import of finished goods possibly for re-sale in the domestic market. The
share of imported finished goods in total imports was not only high in
case of foreign-controlled companies, unlike in case of Indian companies,
the share did not record a decline in 2000-01. In case of OICs too, finished
goods in general claimed an increasing share, if one ignores the final year.
Over all, the number of companies importing finished goods increased
gradually from 188 in 1995-96 to 249 in 2000-01. Out of the 61 companies
which imported Rs. 10 crores or more worth of finished goods in 2000-01
29, or about half, are FCCs.

88
Table-II .12 Composition of Imports: Category-wise
(Percentages) Company Affiliation/ Year
Total Imports(Rs. Crores)
Raw Materials Capital Goods Finished Goods Total
(1) (2) (3) (4) (5) (6)
T1: Top 50 Houses (277)
1995-96 15,086 70.02 25.60 4.39 100.00
1996-97 16,748 74.82 20.15 5.03 100.00
1997-98 20,298 72.97 19.53 7.49 100.00
1998-99 20,129 69.40 21.48 9.12 100.00
1999-00 20,987 80.50 8.03 11.47 100.00
2000-01 23,735 89.63 5.06 5.31 100.00
T2: Next 50 Houses (150)
1995-96 4,965 66.54 32.54 0.92 100.00
1996-97 5,039 74.21 21.53 4.26 100.00
1997-98 4,878 80.73 15.09 4.18 100.00
1998-99 4,342 80.19 14.60 5.21 100.00
1999-00 5,022 80.77 14.28 4.95 100.00
2000-01 6,174 89.49 6.71 3.80 100.00
OICs: Other Indian Cos. (1,431)
1995-96 8,684 76.50 21.55 1.95 100.00
1996-97 9,294 74.28 21.97 3.75 100.00
1997-98 9,722 78.89 16.01 5.10 100.00
1998-99 10,051 78.03 12.42 9.55 100.00
1999-00 11,608 77.79 9.71 12.50 100.00
2000-01 13,152 81.37 11.80 6.83 100.00
FCCs: Foreign-Controlled Cos. (289)
1995-96 7,226 82.29 12.61 5.10 100.00
1996-97 9,882 65.95 28.01 6.04 100.00
1997-98 8,228 76.98 14.63 8.39 100.00
1998-99 9,264 74.00 12.50 13.51 100.00
1999-00 10,941 74.58 13.40 12.02 100.00
2000-01 10,550 78.63 8.13 13.23 100.00
All Companies (2,147)
1995-96 35,960 73.57 22.97 3.46 100.00
1996-97 40,964 72.48 22.63 4.89 100.00
1997-98 43,125 75.95 17.30 6.75 100.00
1998-99 43,787 73.42 16.82 9.76 100.00
1999-00 48,558 78.55 10.29 11.16 100.00
2000-01 53,610 85.42 7.51 7.07 100.00
Figures in brackets are number of companies in the respective category.

89
Graphs-II.3A&B
Size of Pies not to scale.
Notable among the FCCs are: Aventis Pharma, BASF (India), Birla
3M, Burroughs Wellcome, Carrier Aircon, Clariant (India), Gestetner,
Glaxo, Hind Lever Chemicals, Hindustan Lever, Infar (India), Kalyani
Sharp, Kodak (India), Krone Communications, Lederle, Novarts, Pfizer,
Ricoh (India), Sandvik Asia, Smithkline Beecham Pharmaceuticals (India)
Ltd., and Wyeth Lederle. Prominent among the Indian companies are:
Adani Exports, Deepak Fertilisers & Petrochemicals, HCL Infosystems,
IVP Ltd., Grasim Industries, and Priya Ltd. Adani Export presents an
interesting case. The company is a recognised Super Star Trading House
which has also been conferred the Golden trader status.12 It can be seen
from Table-II.13 that while the company’s exports declined after 1997-98,
imports increased substantially. What is even more important is the fact
that practically all the imports were of finished goods. This offers a clear
case of imports not being related to exports and the net balance on trade
account falling substantially due to the import of finished goods.
12 Exporters who have attained Export House, Trading House, Star Trading Houses and Super
Star Trading Houses status for three terms and more and continue to export were eligible for Golden status certificate.
Capital Goods
Finished Goods Broad Composition of Imports: 1995-96
Raw materials & components
Capital Goods
Finished Goods
Raw materials & components
Capital Goods
Finished Goods
Broad Composition of Imports: 2000-01

90
Table-II.13
Exports and Imports of Adani Exports Ltd. (A Golden Super Star Trading House)
Exports Imports Import of
Finished Goods Trade Balance
(1) (2) (3) (4) (5) 1995-96 775.69 200.29 173.92 572.86
1996-97 1,089.35 282.68 282.68 805.80
1997-98 1,634.81 409.67 409.51 1,218.931998-99 1,108.85 418.96 418.79 681.26
1999-00 1,169.99 857.23 857.23 306.31
2000-01 985.86 642.72 641.75 336.91
Another interesting case is that of Hind Lever Chemicals Ltd.
(HLCL), 50 per cent of whose shares are held by Hindustan Lever Ltd
(HLL). While HLL does not show any significant amount of import of
finished goods, HLCL reported increasing amounts of finished goods
since 1998-99. Incidentally, HLCL ceased to be a subsidiary of HLL in
1999 and, as stated earlier, both the companies clarify that the reported
import figures do not include imported items purchased locally and those
obtained from canalising agencies. Given the possible coordination
between the two group companies it should be seen to what extent the
imports of HLCL are used for own purposes and for use by HLL or other
companies of the group. By itself, HLL is able to show a highly favourable
surplus on account of net foreign exchange earnings. If the imports of
HLCL are also combined, it is easy to see that the position changes
drastically (Table-II.14). Had HLL’s share been just a little higher, HLCL
would have been a subsidiary of HLL and HLCL’s accounts would have
been consolidated with HLL’s. The consolidated accounts would have
reflected HLCL’s imports too and the group’s net earning position would
have been not so favourable. While the trade balance on account of HLL
appears to have risen fast from Rs. 118.20 crores in 1995-96 to Rs. 1,182.23
crores in 2000-01, when seen in combination with HLCL’s trade balance,
the rise, however, does not appear to be so impressive. Indeed, net
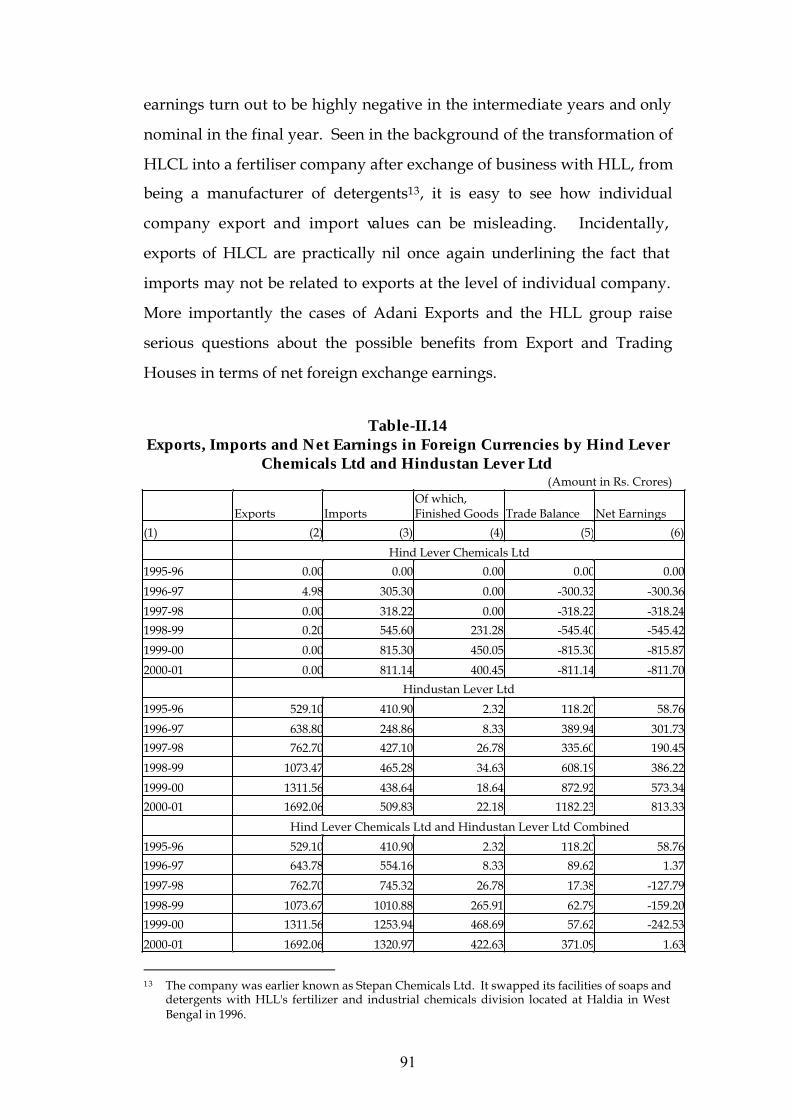
91
earnings turn out to be highly negative in the intermediate years and only
nominal in the final year. Seen in the background of the transformation of
HLCL into a fertiliser company after exchange of business with HLL, from
being a manufacturer of detergents13, it is easy to see how individual
company export and import values can be misleading. Incidentally,
exports of HLCL are practically nil once again underlining the fact that
imports may not be related to exports at the level of individual company.
More importantly the cases of Adani Exports and the HLL group raise
serious questions about the possible benefits from Export and Trading
Houses in terms of net foreign exchange earnings.
Table-II.14
Exports, Imports and Net Earnings in Foreign Currencies by Hind Lever Chemicals Ltd and Hindustan Lever Ltd
(Amount in Rs. Crores)
Exports Imports Of which, Finished Goods Trade Balance Net Earnings
(1) (2) (3) (4) (5) (6)
Hind Lever Chemicals Ltd
1995-96 0.00 0.00 0.00 0.00 0.00
1996-97 4.98 305.30 0.00 -300.32 -300.36
1997-98 0.00 318.22 0.00 -318.22 -318.24
1998-99 0.20 545.60 231.28 -545.40 -545.42
1999-00 0.00 815.30 450.05 -815.30 -815.87
2000-01 0.00 811.14 400.45 -811.14 -811.70
Hindustan Lever Ltd
1995-96 529.10 410.90 2.32 118.20 58.76
1996-97 638.80 248.86 8.33 389.94 301.73
1997-98 762.70 427.10 26.78 335.60 190.45
1998-99 1073.47 465.28 34.63 608.19 386.22
1999-00 1311.56 438.64 18.64 872.92 573.34
2000-01 1692.06 509.83 22.18 1182.23 813.33
Hind Lever Chemicals Ltd and Hindustan Lever Ltd Combined
1995-96 529.10 410.90 2.32 118.20 58.76
1996-97 643.78 554.16 8.33 89.62 1.37
1997-98 762.70 745.32 26.78 17.38 -127.79
1998-99 1073.67 1010.88 265.91 62.79 -159.20
1999-00 1311.56 1253.94 468.69 57.62 -242.53
2000-01 1692.06 1320.97 422.63 371.09 1.63
13 The company was earlier known as Stepan Chemicals Ltd. It swapped its facilities of soaps and
detergents with HLL's fertilizer and industrial chemicals division located at Haldia in West Bengal in 1996.
92
Import Intensity
Import dependence too varied (Table-II.15). It does appear that the
overall import dependence declined for all categories of companies. It has,
however, to be noted that the observed import-sales ratios could be
misleading because companies while on the one hand are not only importing
substantial amount of finished goods, but they are also buying finished goods
from the local manufacturers. To that extent, one should compare imports
with sales emerging out of own production only. Also, there could be a
hidden amount of indirect imports whether purchased from local traders
who brought the items for stock and sale or because the local supporting
manufacturers themselves are using imported raw materials and
components. One may refer to the case of Colgate’s production associates
described in the previous section. Column (5) of Table-II.15 shows the ratio
of sales of traded items to own manufactures. Though the ratio declined
suddenly in the final year, it was above 10 per cent in all the other years. It
can be seen that the ratio is the highest for FCCs (Graph-II.4). On the other
hand, finished goods too occupied an important position in the imports of
FCCs. Such trading is prominent in many consumer non-durables (See
Table-II.16 for illustrative cases). Assuming that imported raw materials and
capital goods would be used in own manufacture and are not passed on to
units with which the companies have production arrangements, it would be
more appropriate to compare import of raw materials (and capital goods)
with sale of own manufactures. The relevant ratios are shown in columns (7)
and (8) of Table-II.15. Once again, the results are mixed.
While the top 50 house companies show an increasing dependence
on imported raw materials, there are no clear patterns in case of the
second 50 group and other Indian companies. In case of FCCs too the ratio
did not show any clear trend. It was, however, lower than that in the
initial two years. It does appear that FCCs are increasingly depending on
imports for finished goods and traded items instead of for local
production purposes.
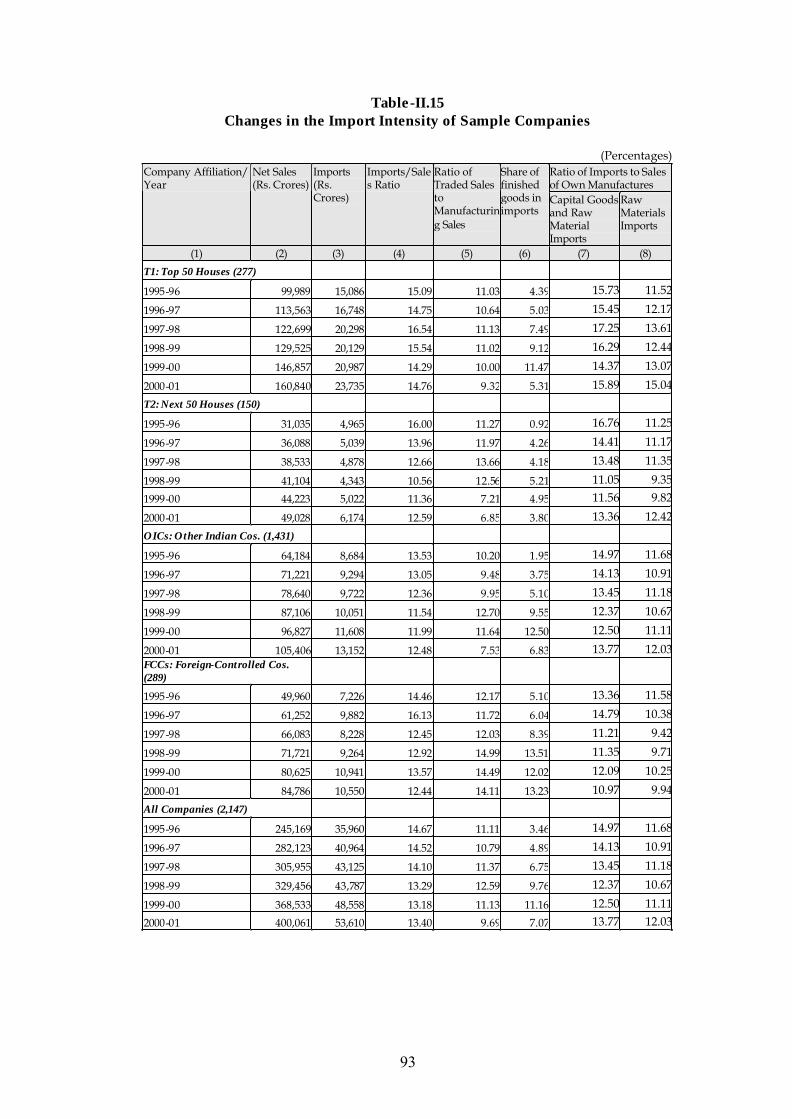
93
Table-II.15 Changes in the Import Intensity of Sample Companies
(Percentages)
Ratio of Imports to Sales of Own Manufactures
Company Affiliation/ Year
Net Sales (Rs. Crores)
Imports (Rs. Crores)
Imports/Sales Ratio
Ratio of Traded Sales to Manufacturing Sales
Share of finished goods in imports
Capital Goods and Raw Material Imports
Raw Materials Imports
(1) (2) (3) (4) (5) (6) (7) (8)
T1: Top 50 Houses (277)
1995-96 99,989 15,086 15.09 11.03 4.39 15.73 11.52
1996-97 113,563 16,748 14.75 10.64 5.03 15.45 12.17
1997-98 122,699 20,298 16.54 11.13 7.49 17.25 13.61
1998-99 129,525 20,129 15.54 11.02 9.12 16.29 12.44
1999-00 146,857 20,987 14.29 10.00 11.47 14.37 13.07
2000-01 160,840 23,735 14.76 9.32 5.31 15.89 15.04
T2: Next 50 Houses (150)
1995-96 31,035 4,965 16.00 11.27 0.92 16.76 11.25
1996-97 36,088 5,039 13.96 11.97 4.26 14.41 11.17
1997-98 38,533 4,878 12.66 13.66 4.18 13.48 11.35
1998-99 41,104 4,343 10.56 12.56 5.21 11.05 9.35
1999-00 44,223 5,022 11.36 7.21 4.95 11.56 9.82
2000-01 49,028 6,174 12.59 6.85 3.80 13.36 12.42
OICs: Other Indian Cos. (1,431)
1995-96 64,184 8,684 13.53 10.20 1.95 14.97 11.68
1996-97 71,221 9,294 13.05 9.48 3.75 14.13 10.91
1997-98 78,640 9,722 12.36 9.95 5.10 13.45 11.18
1998-99 87,106 10,051 11.54 12.70 9.55 12.37 10.67
1999-00 96,827 11,608 11.99 11.64 12.50 12.50 11.11
2000-01 105,406 13,152 12.48 7.53 6.83 13.77 12.03FCCs: Foreign-Controlled Cos. (289)
1995-96 49,960 7,226 14.46 12.17 5.10 13.36 11.58
1996-97 61,252 9,882 16.13 11.72 6.04 14.79 10.38
1997-98 66,083 8,228 12.45 12.03 8.39 11.21 9.42
1998-99 71,721 9,264 12.92 14.99 13.51 11.35 9.71
1999-00 80,625 10,941 13.57 14.49 12.02 12.09 10.25
2000-01 84,786 10,550 12.44 14.11 13.23 10.97 9.94
All Companies (2,147)
1995-96 245,169 35,960 14.67 11.11 3.46 14.97 11.68
1996-97 282,123 40,964 14.52 10.79 4.89 14.13 10.91
1997-98 305,955 43,125 14.10 11.37 6.75 13.45 11.18
1998-99 329,456 43,787 13.29 12.59 9.76 12.37 10.67
1999-00 368,533 48,558 13.18 11.13 11.16 12.50 11.11
2000-01 400,061 53,610 13.40 9.69 7.07 13.77 12.03
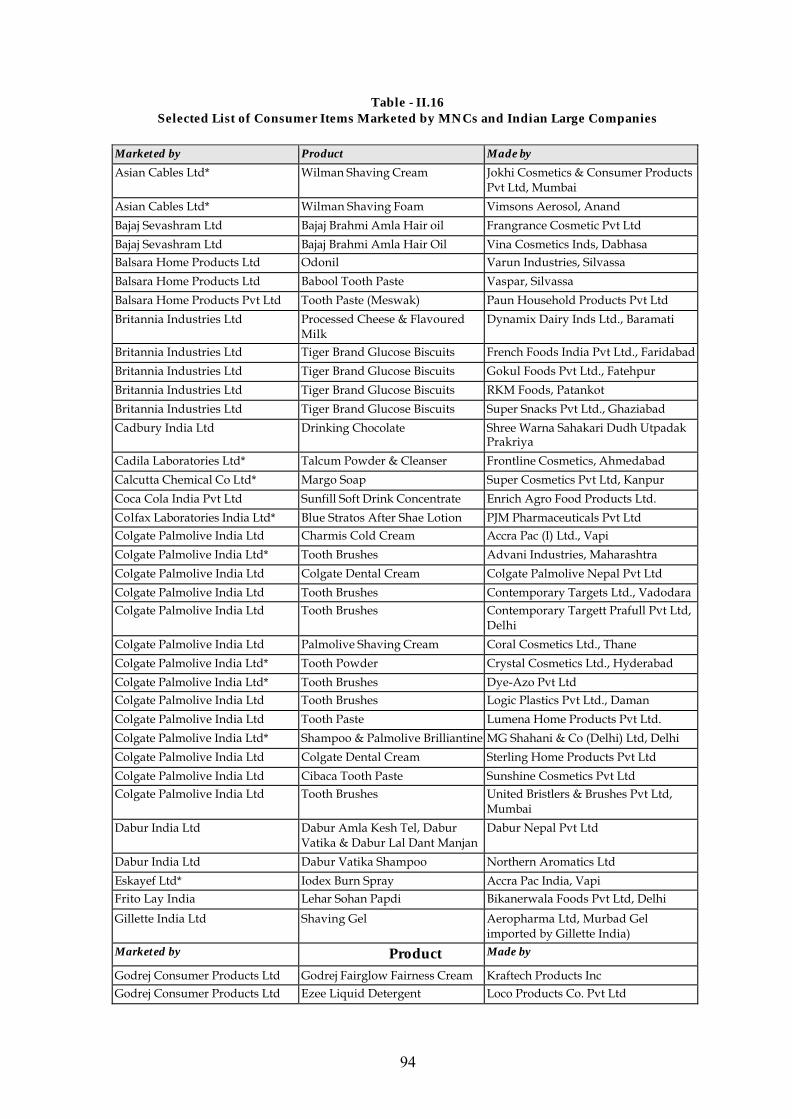
94
Table - II.16 Selected List of Consumer Items Marketed by MNCs and Indian Large Companies
Marketed by Product Made by
Asian Cables Ltd* Wilman Shaving Cream Jokhi Cosmetics & Consumer Products Pvt Ltd, Mumbai
Asian Cables Ltd* Wilman Shaving Foam Vimsons Aerosol, Anand
Bajaj Sevashram Ltd Bajaj Brahmi Amla Hair oil Frangrance Cosmetic Pvt Ltd
Bajaj Sevashram Ltd Bajaj Brahmi Amla Hair Oil Vina Cosmetics Inds, Dabhasa Balsara Home Products Ltd Odonil Varun Industries, Silvassa
Balsara Home Products Ltd Babool Tooth Paste Vaspar, Silvassa
Balsara Home Products Pvt Ltd Tooth Paste (Meswak) Paun Household Products Pvt Ltd
Britannia Industries Ltd Processed Cheese & Flavoured Milk
Dynamix Dairy Inds Ltd., Baramati
Britannia Industries Ltd Tiger Brand Glucose Biscuits French Foods India Pvt Ltd., Faridabad
Britannia Industries Ltd Tiger Brand Glucose Biscuits Gokul Foods Pvt Ltd., Fatehpur
Britannia Industries Ltd Tiger Brand Glucose Biscuits RKM Foods, Patankot
Britannia Industries Ltd Tiger Brand Glucose Biscuits Super Snacks Pvt Ltd., Ghaziabad
Cadbury India Ltd Drinking Chocolate Shree Warna Sahakari Dudh Utpadak Prakriya
Cadila Laboratories Ltd* Talcum Powder & Cleanser Frontline Cosmetics, Ahmedabad
Calcutta Chemical Co Ltd* Margo Soap Super Cosmetics Pvt Ltd, Kanpur
Coca Cola India Pvt Ltd Sunfill Soft Drink Concentrate Enrich Agro Food Products Ltd.
Colfax Laboratories India Ltd* Blue Stratos After Shae Lotion PJM Pharmaceuticals Pvt Ltd Colgate Palmolive India Ltd Charmis Cold Cream Accra Pac (I) Ltd., Vapi
Colgate Palmolive India Ltd* Tooth Brushes Advani Industries, Maharashtra
Colgate Palmolive India Ltd Colgate Dental Cream Colgate Palmolive Nepal Pvt Ltd
Colgate Palmolive India Ltd Tooth Brushes Contemporary Targets Ltd., Vadodara Colgate Palmolive India Ltd Tooth Brushes Contemporary Targett Prafull Pvt Ltd,
Delhi
Colgate Palmolive India Ltd Palmolive Shaving Cream Coral Cosmetics Ltd., Thane
Colgate Palmolive India Ltd* Tooth Powder Crystal Cosmetics Ltd., Hyderabad
Colgate Palmolive India Ltd* Tooth Brushes Dye-Azo Pvt Ltd Colgate Palmolive India Ltd Tooth Brushes Logic Plastics Pvt Ltd., Daman
Colgate Palmolive India Ltd Tooth Paste Lumena Home Products Pvt Ltd.
Colgate Palmolive India Ltd* Shampoo & Palmolive Brilliantine MG Shahani & Co (Delhi) Ltd, Delhi
Colgate Palmolive India Ltd Colgate Dental Cream Sterling Home Products Pvt Ltd
Colgate Palmolive India Ltd Cibaca Tooth Paste Sunshine Cosmetics Pvt Ltd Colgate Palmolive India Ltd Tooth Brushes United Bristlers & Brushes Pvt Ltd,
Mumbai
Dabur India Ltd Dabur Amla Kesh Tel, Dabur Vatika & Dabur Lal Dant Manjan
Dabur Nepal Pvt Ltd
Dabur India Ltd Dabur Vatika Shampoo Northern Aromatics Ltd
Eskayef Ltd* Iodex Burn Spray Accra Pac India, Vapi Frito Lay India Lehar Sohan Papdi Bikanerwala Foods Pvt Ltd, Delhi
Gillette India Ltd Shaving Gel Aeropharma Ltd, Murbad Gel imported by Gillette India)
Marketed by Product Made by
Godrej Consumer Products Ltd Godrej Fairglow Fairness Cream Kraftech Products Inc Godrej Consumer Products Ltd Ezee Liquid Detergent Loco Products Co. Pvt Ltd
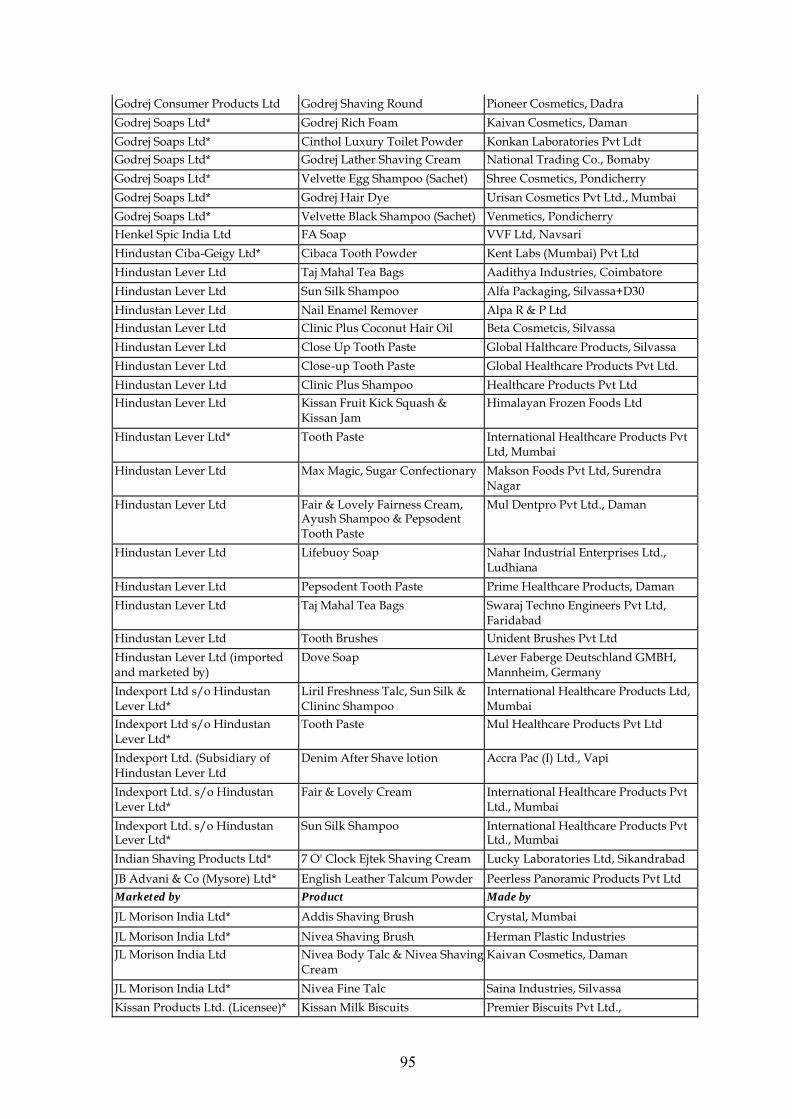
95
Godrej Consumer Products Ltd Godrej Shaving Round Pioneer Cosmetics, Dadra
Godrej Soaps Ltd* Godrej Rich Foam Kaivan Cosmetics, Daman
Godrej Soaps Ltd* Cinthol Luxury Toilet Powder Konkan Laboratories Pvt Ldt Godrej Soaps Ltd* Godrej Lather Shaving Cream National Trading Co., Bomaby
Godrej Soaps Ltd* Velvette Egg Shampoo (Sachet) Shree Cosmetics, Pondicherry
Godrej Soaps Ltd* Godrej Hair Dye Urisan Cosmetics Pvt Ltd., Mumbai
Godrej Soaps Ltd* Velvette Black Shampoo (Sachet) Venmetics, Pondicherry Henkel Spic India Ltd FA Soap VVF Ltd, Navsari
Hindustan Ciba-Geigy Ltd* Cibaca Tooth Powder Kent Labs (Mumbai) Pvt Ltd
Hindustan Lever Ltd Taj Mahal Tea Bags Aadithya Industries, Coimbatore
Hindustan Lever Ltd Sun Silk Shampoo Alfa Packaging, Silvassa+D30
Hindustan Lever Ltd Nail Enamel Remover Alpa R & P Ltd Hindustan Lever Ltd Clinic Plus Coconut Hair Oil Beta Cosmetcis, Silvassa
Hindustan Lever Ltd Close Up Tooth Paste Global Halthcare Products, Silvassa
Hindustan Lever Ltd Close-up Tooth Paste Global Healthcare Products Pvt Ltd.
Hindustan Lever Ltd Clinic Plus Shampoo Healthcare Products Pvt Ltd Hindustan Lever Ltd Kissan Fruit Kick Squash &
Kissan Jam Himalayan Frozen Foods Ltd
Hindustan Lever Ltd* Tooth Paste International Healthcare Products Pvt Ltd, Mumbai
Hindustan Lever Ltd Max Magic, Sugar Confectionary Makson Foods Pvt Ltd, Surendra Nagar
Hindustan Lever Ltd Fair & Lovely Fairness Cream, Ayush Shampoo & Pepsodent Tooth Paste
Mul Dentpro Pvt Ltd., Daman
Hindustan Lever Ltd Lifebuoy Soap Nahar Industrial Enterprises Ltd., Ludhiana
Hindustan Lever Ltd Pepsodent Tooth Paste Prime Healthcare Products, Daman
Hindustan Lever Ltd Taj Mahal Tea Bags Swaraj Techno Engineers Pvt Ltd, Faridabad
Hindustan Lever Ltd Tooth Brushes Unident Brushes Pvt Ltd
Hindustan Lever Ltd (imported and marketed by)
Dove Soap Lever Faberge Deutschland GMBH, Mannheim, Germany
Indexport Ltd s/o Hindustan Lever Ltd*
Liril Freshness Talc, Sun Silk & Clininc Shampoo
International Healthcare Products Ltd, Mumbai
Indexport Ltd s/o Hindustan Lever Ltd*
Tooth Paste Mul Healthcare Products Pvt Ltd
Indexport Ltd. (Subsidiary of Hindustan Lever Ltd
Denim After Shave lotion Accra Pac (I) Ltd., Vapi
Indexport Ltd. s/o Hindustan Lever Ltd*
Fair & Lovely Cream International Healthcare Products Pvt Ltd., Mumbai
Indexport Ltd. s/o Hindustan Lever Ltd*
Sun Silk Shampoo International Healthcare Products Pvt Ltd., Mumbai
Indian Shaving Products Ltd* 7 O' Clock Ejtek Shaving Cream Lucky Laboratories Ltd, Sikandrabad
JB Advani & Co (Mysore) Ltd* English Leather Talcum Powder Peerless Panoramic Products Pvt Ltd Marketed by Product Made by
JL Morison India Ltd* Addis Shaving Brush Crystal, Mumbai
JL Morison India Ltd* Nivea Shaving Brush Herman Plastic Industries JL Morison India Ltd Nivea Body Talc & Nivea Shaving
Cream Kaivan Cosmetics, Daman
JL Morison India Ltd* Nivea Fine Talc Saina Industries, Silvassa
Kissan Products Ltd. (Licensee)* Kissan Milk Biscuits Premier Biscuits Pvt Ltd.,

96
Kores India Ltd Glue Stick Vapson Chemical Products Pvt Ltd, Mumbai
Leo Mattel (India) Pvt Ltd Barbie Pretty & Cool Dolls Fancy Fittings Ltd, Mumbai Muller & Phipps India Ltd* Cuticura Lavender Mist (Large) Alpha Cosmetics
Muller & Phipps India Ltd* Cuticura International Classic Anand Cosmetics, Bangalore
Muller & Phipps India Ltd* Cavisan Chemicure Laboratories Pvtt. Ltd., Udaipur
Muller & Phipps India Ltd* Cuticura Prickly Heat Powder Lakshmi Cosmetics, Pondicherry Muller & Phipps India Ltd* Cuticura Lavender Mist Pavitra Cosmetics, Madras
Muller & Phipps India Ltd* Cuticura International Classic Venus Products
Muller & Phipps India Ltd* Flush Up Walsons Laboratories, Calicut
Nature Cosmetic Enterprises Pvt Ltd*
Lure Shampoo Modern Cosmetics, Virar
Nestle India Ltd Maggie Tomato Ketchup Nijjer Agro Foods Ltd Parle Prodcuts Ltd Hide & Seek Biscuits BBL Foods Pvt Ltd
Parle Products Ltd* Prudent Tooth Paste Flash Laboratories Ltd
Pepsi Foods Ltd Diet Pepsi Soft Drink Jai Drinks Pvt Ltd, Jaipur
Pond's India Ltd* Pond's Conditioning Shampoo Care Treat, Bharuch Pond's India Ltd* Pond's Soap Godrej Soaps Ltd
Pond's India Ltd* Pond's Sandal Talc International Healthcare Products Ltd, Mumbai
Pond's India Ltd* Pomade (Vaseline) JB Advani & Co (Mysore) Ltd
Procter & Gamble Home Products Ltd
Old Spice Shaving Cream Colfax Laboratories Pvt Ltd, Panda
Procter & Gamble Home Products Ltd
Head & Shoulders Shapoo Sachet Procter & Gamble Mfg (Thailand) Ltd
Rallis India Ltd* Rallicoil (Mosquito Coil) Senio Chemicals Pvt Ltd, Hyderabad
Reckitt Benckiser (I) Ltd Mortein Mosquito Coil Hindustan Seals Ltd
Reckitt Benckiser (I) Ltd* Dettol Universal Generics Pvt Ltd., Mumbai Reckitt Benckiser (I) Ltd Dettol Shaving Cream VVF Ltd, Navsari
Sara Lee TTK Ltd Brylcream Stylus Cream Padmam Herbal Care Pvt Ltd
Smithkline Beecham ENO Fruit Salt Southern Drugs & Pharmaceuticals
Tropicana Beverages Co. Tropicana Fruit Juice Dynamix Dairy Inds Ltd., Baramati Wipro Ltd* Santoor Beauty Talc Saina Industries, Silvassa
* From S.K. Goyal, et. al., India's Imports & Exports: Some Insights, ISID, 1991.
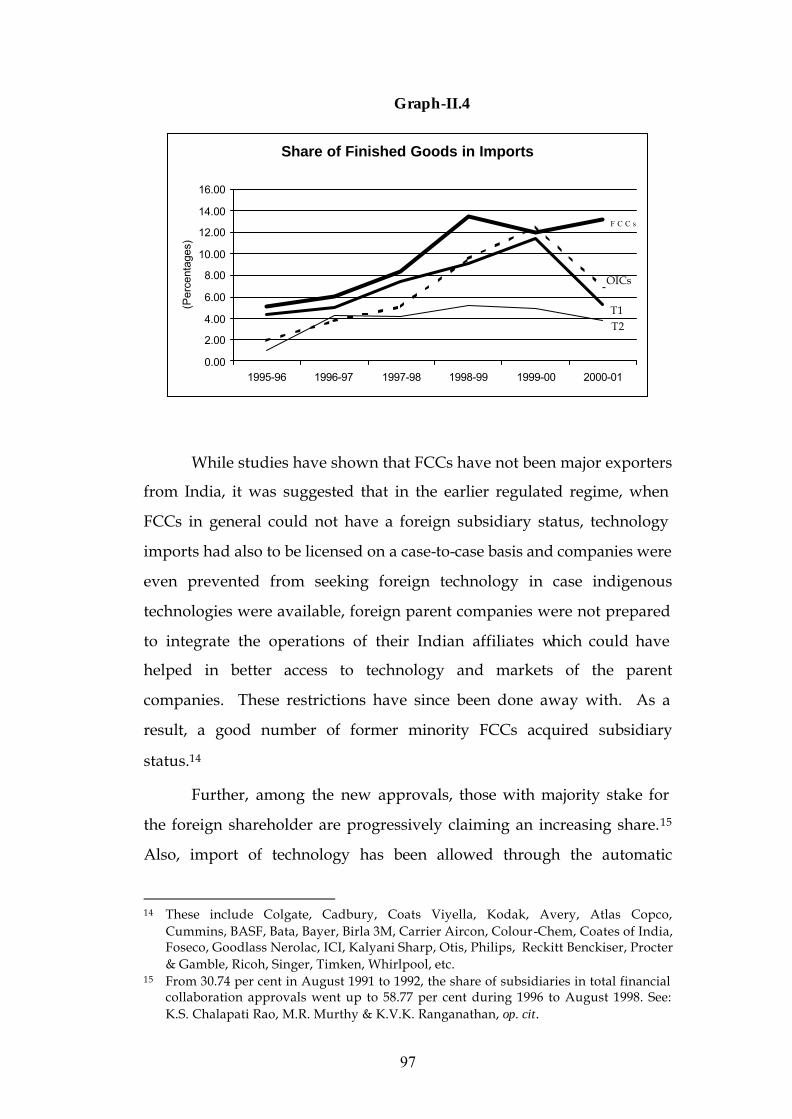
97
Graph-II.4
Share of Finished Goods in Imports
0.00
2.00
4.00
6.00
8.00
10.00
12.00
14.00
16.00
1995-96 1996-97 1997-98 1998-99 1999-00 2000-01
(Per
cent
ages
)
OICs
F C C s
T2T1
While studies have shown that FCCs have not been major exporters
from India, it was suggested that in the earlier regulated regime, when
FCCs in general could not have a foreign subsidiary status, technology
imports had also to be licensed on a case-to-case basis and companies were
even prevented from seeking foreign technology in case indigenous
technologies were available, foreign parent companies were not prepared
to integrate the operations of their Indian affiliates which could have
helped in better access to technology and markets of the parent
companies. These restrictions have since been done away with. As a
result, a good number of former minority FCCs acquired subsidiary
status.14
Further, among the new approvals, those with majority stake for
the foreign shareholder are progressively claiming an increasing share.15
Also, import of technology has been allowed through the automatic
14 These include Colgate, Cadbury, Coats Viyella, Kodak, Avery, Atlas Copco,
Cummins, BASF, Bata, Bayer, Birla 3M, Carrier Aircon, Colour-Chem, Coates of India, Foseco, Goodlass Nerolac, ICI, Kalyani Sharp, Otis, Philips, Reckitt Benckiser, Procter & Gamble, Ricoh, Singer, Timken, Whirlpool, etc.
15 From 30.74 per cent in August 1991 to 1992, the share of subsidiaries in total financial collaboration approvals went up to 58.77 per cent during 1996 to August 1998. See: K.S. Chalapati Rao, M.R. Murthy & K.V.K. Ranganathan, op. cit.

98
approval route in most cases (Table-II.17 & Graph-II.5). In spite of these
changes, the fact that FCCs did not turn out to be more export-oriented,
therefore, needs a closer examination. Is it because FCCs are under lesser
pressure now than earlier to export or the industrial composition of FCCs
is such that there was little scope for improvement? It is also a fact that
some of the major FCCs grew through mergers which add to the export
volumes of FCCs covered in the sample. Had it not been so, exports of
sample FCCs would have grown even slower. For example, exports of
Brooke Bond (India) Ltd and Ponds (India) Ltd., which were merged with
Hindustan Lever Ltd. (HLL), a Golden Super Star Trading House, in 1996
and 1998 respectively, are reflected in HLL’s exports for the first time in
1996-97 and 1998-99 respectively. But for a sharp jump in the final year,
the export-sales ratio of FCCs did not improve at the aggregate level.
Table-II.17 Relative Share of Technical Collaborations in Foreign Collaboration Approvals
Number of Foreign Collaborations Approved
Of which, Technical
Year
Approved by RBI under the Automatic Route
Share of Technical Collaborations in Total Approvals (3)/(2) x 100
Share of Automatic Approvals in Total Technical Collaborations (4)/(3) x 100
(1) (2) (3) (4) (5) (6) 1991 950 661 147 69.58 22.24 1992 1,520 828 485 54.47 58.57 1993 1,470 691 441 47.01 63.82 1994 1,854 792 501 42.72 63.26 1995 2,337 982 552 42.02 56.21 1996 2,303 744 424 32.31 56.99 1997 2,325 660 416 28.39 63.03 1998 1,786 595 401 33.31 67.39 1999 2,224 498 324 22.39 65.06 2000 2,144 418 286 19.50 68.42 2001 2,270 288 212 12.69 73.61 Source: Ministry of Commerce & Industry, SIA Newsletter , April 2002 and September 2001.
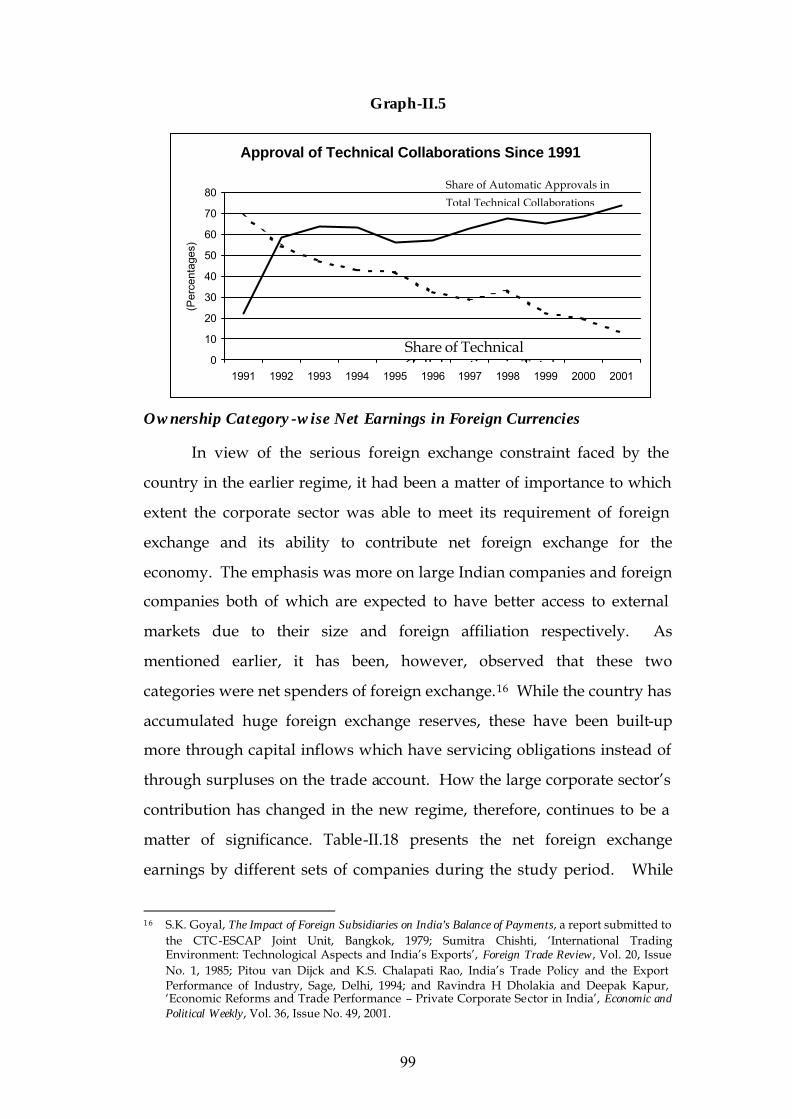
99
Approval of Technical Collaborations Since 1991
0
10
20
30
40
50
60
70
80
1991 1992 1993 1994 1995 1996 1997 1998 1999 2000 2001
(Per
cent
ages
)Share of Automatic Approvals in
Total Technical Collaborations
Share of Technical Collaborations in Total
Graph-II.5
Ownership Category-wise Net Earnings in Foreign Currencies
In view of the serious foreign exchange constraint faced by the
country in the earlier regime, it had been a matter of importance to which
extent the corporate sector was able to meet its requirement of foreign
exchange and its ability to contribute net foreign exchange for the
economy. The emphasis was more on large Indian companies and foreign
companies both of which are expected to have better access to external
markets due to their size and foreign affiliation respectively. As
mentioned earlier, it has been, however, observed that these two
categories were net spenders of foreign exchange.16 While the country has
accumulated huge foreign exchange reserves, these have been built-up
more through capital inflows which have servicing obligations instead of
through surpluses on the trade account. How the large corporate sector’s
contribution has changed in the new regime, therefore, continues to be a
matter of significance. Table-II.18 presents the net foreign exchange
earnings by different sets of companies during the study period. While
16 S.K. Goyal, The Impact of Foreign Subsidiaries on India’s Balance of Payments, a report submitted to
the CTC-ESCAP Joint Unit, Bangkok, 1979; Sumitra Chishti, ‘International Trading Environment: Technological Aspects and India’s Exports’, Foreign Trade Review, Vol. 20, Issue No. 1, 1985; Pitou van Dijck and K.S. Chalapati Rao, India’s Trade Policy and the Export Performance of Industry, Sage, Delhi, 1994; and Ravindra H Dholakia and Deepak Kapur, ‘Economic Reforms and Trade Performance – Private Corporate Sector in India’, Economic and Political Weekly, Vol. 36, Issue No. 49, 2001.

100
net outgo of foreign exchange on account of the operations of the sample
companies declined at current prices, from Rs. 12,000 crores to nearly Rs.
2,000 crores, the T1 companies and FCCs continue to be net spenders of
foreign exchange and a major portion of the deficit is accounted for by T1
companies. Total expenditure in their case exceeded the earnings in all the
years. Interestingly, net earnings improved substantially in case of T2
companies. OICs even turned net earners of foreign exchange. But for the
fact that OICs improved their foreign exchange earning capacity, the
overall deficit would have been substantially higher.
It should be seen to what extent industry characteristics are
responsible for the export earnings and observed net earnings capacity of
different groups. This is particularly so in the context of differing behaviour
of companies in particular sectors in terms of relative share of other earnings
in total earnings in foreign currencies. It is possible that an analysis at
industry group level may throw better light on exports and provide answers
to questions such as: (i) are a good number of non-house companies, which
turned out to be better export-oriented, engaged in textiles, pharmaceutical
products and software; and (ii) do FCCs, irrespective of the industry in which
they operate, focus on the domestic market, etc.
One way of looking at the export performance of companies is
through the extent of imports covered by their exports. While at the
aggregate level, 92.8 per cent of the imports are covered by the sample
companies’ exports, the ratio was the lowest for FCCs at slightly less than
three-fourths. Other Indian companies performed the best among all the
categories of companies (Table-II.19). In most product groups, domestic
companies, especially the non-large house companies displayed better
exports-imports ratio. While due importance has been given to
composition of sales while classifying companies, the same classification
might have only a limited relevance when it comes to individual
company’s exports especially in case of Export and Trading Houses. For
instance, ITC, a Golden Star Trading House, has been classified under the

101
Table-II.18 Earnings and Expenditure in Foreign Currencies
by different Categories of Companies
(Amount in Rs. Crores) Company Affiliation/ Year
Total Earnings Total Expenditure Net Earnings (2) – (3)
Earnings/Expenditure Ratio (2)/(3) x 100
(1) (2) (3) (4) (5)
T1: Top 50 Houses (277)
1995-96 10,832 18,204 -7,372 59.50
1996-97 13,698 20,316 -6,618 67.42
1997-98 15,936 24,258 -8,322 65.69
1998-99 16,243 25,246 -9,003 64.34
1999-00 18,630 26,070 -7,440 71.46
2000-01 24,310 29,393 -5,083 82.71
T2: Next 50 Houses (150)
1995-96 3,052 5,444 -2,392 56.06
1996-97 3,755 5,615 -1,860 66.87
1997-98 4,379 5,625 -1,246 77.85
1998-99 4,770 5,156 -386 92.51
1999-00 5,530 5,969 -439 92.65
2000-01 6,954 7,318 -364 95.03OICs: Other Indian Cos. (1,431
1995-96 10,159 9,502 657 106.91
1996-97 12,124 10,199 1,925 118.87
1997-98 14,071 10,966 3,105 128.31
1998-99 15,804 12,003 3,801 131.67
1999-00 17,722 13,785 3,937 128.56
2000-01 23,269 16,342 6,927 142.39
FCCs: Foreign-Controlled Cos. (289
1995-96 5,269 8,326 -3,057 63.28
1996-97 6,341 11,314 -4,973 56.05
1997-98 7,812 9,956 -2,144 78.47
1998-99 8,017 11,323 -3,306 70.80
1999-00 8,478 13,135 -4,657 64.55
2000-01 9,654 13,281 -3,627 72.69All Companies (2,147)
1995-96 29,313 41,475 -12,162 70.68
1996-97 35,912 47,444 -11,532 75.69
1997-98 42,198 50,806 -8,608 83.06
1998-99 44,835 53,728 -8,893 83.45
1999-00 50,360 58,958 -8,598 85.42
2000-01 64,187 66,333 -2,146 96.76 Figures in brackets indicate the number of companies in the respective category.

102
Table-II.19 Product Group/Activity-wise and Ownership Category-wise
Ratio of Exports to Imports: 2000-01 (Percentages)
Activity T1: Top 50 Houses
T2: Next 50 Houses
OICs: Other Indian Cos.
FCCs: Foreign-Controlled Cos.
All Companies
(1) (2) (3) (4) (5) (6)
1. Animal Products 122.49 4,499.42 1,312.40
2. Plantations & Agricultural Products 1,503.32 1,892.08 1,653.34 1,734.04
3. Mineral Products 6.02 129.46 65.33 13.65
4. Fats, Oils & Derived Products 37.66 25.18 104.88 0.13 43.78 5. Food Products, Beverages & Tobacco Products 118.03 306.33 254.97 283.28 265.40
6. Textiles 229.7 220.64 307.99 143.72 252.38
7. Leather & Leather Products 310.10 150.00 285.32
8. Wood & Wood Products 3.57 65.03 63.96
9. Paper & Paper Products 21.15 32.23 100.36 45.38
10. Chemicals & Chemical Products 54.88 26.75 126.13 41.27 74.82
11. Plastic & Rubber Products 64.88 121.80 102.30 24.69 78.79
12. Non-Metallic Mineral Products 76.33 31.43 77.62 18.70 56.63
13. Metals & Metal Products 109.71 46.17 121.27 187.55 103.51
14. Non-Electrical Machinery 142.33 164.98 108.15 98.59 110.03
15. Electrical Machinery, Appliances, etc. 99.71 26.87 131.07 78.78 81.63
16. Electronic Items & Components 21.44 27.12 31.42 33.17 28.52
17. Transport Equipment 126.01 91.80 112.08 33.26 56.12
18. Misc. Manufactured Articles 82.12 105.49 7.17 79.30
19. Gems & Jewellery 6.34 130.03 128.42
20. Diversified Companies 112.22 597.35 65.68 249.84 124.14
21. Construction 1,044.64 20.67 47.14 43.87
22.Trading, Hotels & Restaurants 360.35 1,569.63 237.09 13.18 244.47
23. Computer Software 202.10 5.94 338.27 206.90
All Companies 81.91 75.96 134.89 74.69 92.80
Food, Beverages and Tobacco Products category because of the high 88.53
per cent share of cigarettes and smoking tobacco in its sales in 2000-01.
The company’s exports, however, include many unprocessed agricultural
items. According to the company, its International Business Division
trades in a wide range of agricultural commodities and aqua exports.17
These, obviously, have no direct relationship with the concerned TNC’s
strength in international markets nor are they related to its main product,
i.e., cigarettes. 17 These include soya meal, rice, aqua products, peanuts, coffee, wheat, sesame seeds, black
pepper, processed frozen fruits and vegetables, etc.

103
Except for metals and metal products, where exports exceeded
imports considerably, in all other chemical and engineering industries,
FCCs were not meeting their imports through exports. Moreover, their
ratios were lower than the corresponding sector averages. Another
exception is Electronic Items and Components. Even in this case, the
difference was quite narrow. Though FCCs fared better than the group’s
average in case of diversified companies, it should be noted that among
such FCCs was Hindustan Lever Ltd., a Golden Super Star Trading House
some of whose export products not only do not fall under the
manufacturing sector but are also purchased from others. For instance,
during 2000, the company purchased goods worth Rs. 2,613 crores (of
which, marine products –- Rs. 585 crores, agricultural commodities,
scourers and edible oils, fats, etc. –- Rs. 607 crores).
Table-II.20 Sector-wise Earnings, Expenditure and Net Earnings in Foreign Currencies
(US $ mn.) Primary Manufacturing Services Year
Earnings Expen-diture
Net Earnings
Earnings Expen-diture
Net Earnings
Earnings Expen-diture
Net Earnings
(1) (2) (3) (4) (5) (6) (7) (8) (9) (10)
1995-96 1,181 1,377 196 38,240 22,802 -15,438 2,054 5,134 3,080
1996-97 2,603 1,590 -1,013 42,308 27,456 -14,852 2,534 6,867 4,333
1997-98 3,265 1,945 -1,320 44,274 31,562 -12,713 3,267 8,692 5,425
1998-99 4,951 2,367 -2,585 44,757 32,186 -12,571 4,020 10,282 6,262
1999-00 5,229 1,946 -3,283 48,207 36,186 -12,021 5,523 12,228 6,705
2000-01 7,492 2,240 -5,252 51,700 44,366 -7,333 7,141 17,580 10,439Note: Converted into US$ using the ratios obtained from the data on national exports and imports
provided in the Economic Survey.
It can be seen from Table-II.20 that a substantial part of the net
earnings is contributed by the Services sector comprising essentially of
trading companies, hotels & restaurants and computer software
companies. Net earnings of the manufacturing sector also improved as the
imports remained stable while exports increased. The Primary sector did
record increasing deficits mainly because of companies in the petroleum
refining and lubricants. The results thus further reflect the importance of
industry attributes compared to ownership characteristics.

India’s External Trade during the ‘Nineties: Some Aspects – An Analysis of Customs House and Company Data
Project Director Prof. S K Goyal
Principal Researchers
Prof. K S Chalapati Rao Dr K V K Ranganathan
Dr M R Murthy
Computer Support Bhupesh Garg
Sudhir Aggarwal Dhanunjai Kumar
Secretarial Support
Umesh Singh Sunil Agarwal
Usha Joshi
Library & Documentation Amitava Dey Manoj Mehta Rakesh Gupta
Manohar Payaswini Vinod Kumar