Grid connection requirements of Renewable Energy
Presented by: Riaan SmitChief Engineer: Network Planning
2010-09-28
2Content
• Summary of interest in renewable energy developments to date
• Renewable Energy Development Areas
• Embedded Generation (EG) Applications
• Interconnection of Embedded Generation
• Joint Transmission & Distribution Grid Planning
• Western Cape GTZ-DigSilent-Eskom grid integration study
2010/10/11 2
• Western Cape GTZ-DigSilent-Eskom grid integration study
• Conclusion
• Q&A
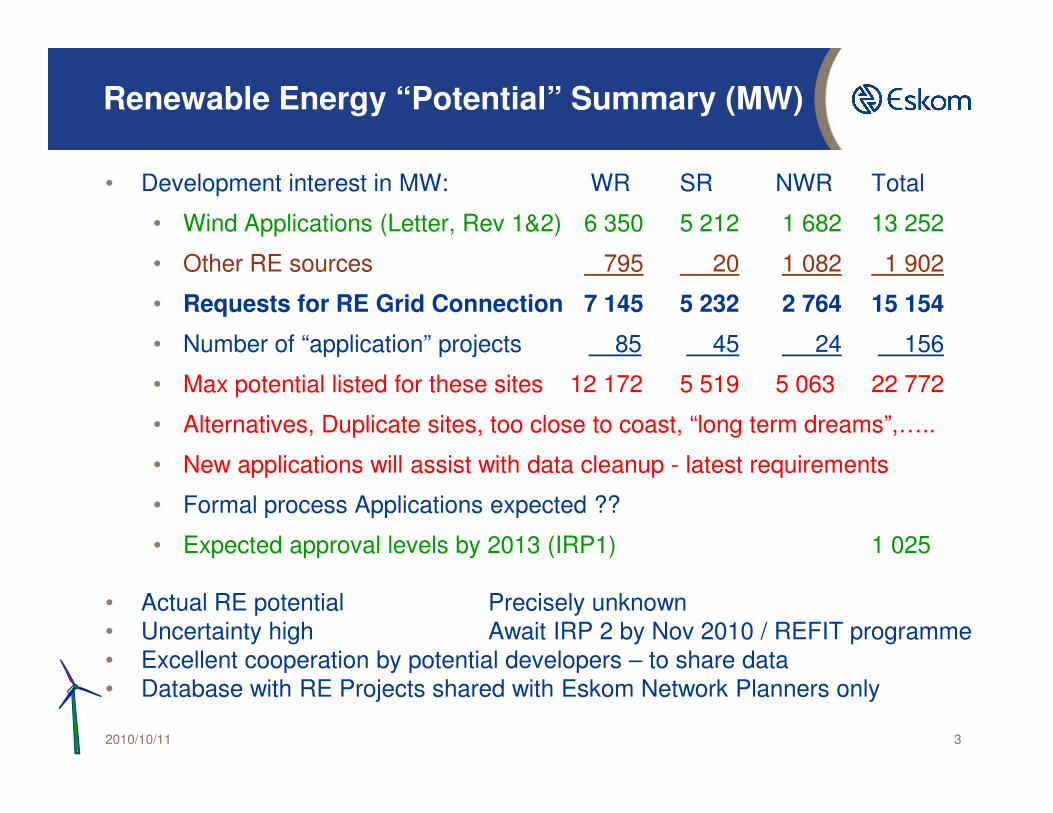
Renewable Energy “Potential” Summary (MW)
• Development interest in MW: WR SR NWR Total
• Wind Applications (Letter, Rev 1&2) 6 350 5 212 1 682 13 252
• Other RE sources 795 20 1 082 1 902
• Requests for RE Grid Connection 7 145 5 232 2 764 15 154
• Number of “application” projects 85 45 24 156
• Max potential listed for these sites 12 172 5 519 5 063 22 772
2010/10/11 3
• Alternatives, Duplicate sites, too close to coast, “long term dreams”,…..
• New applications will assist with data cleanup - latest requirements
• Formal process Applications expected ??
• Expected approval levels by 2013 (IRP1) 1 025
• Actual RE potential Precisely unknown• Uncertainty high Await IRP 2 by Nov 2010 / REFIT programme• Excellent cooperation by potential developers – to share data• Database with RE Projects shared with Eskom Network Planners only
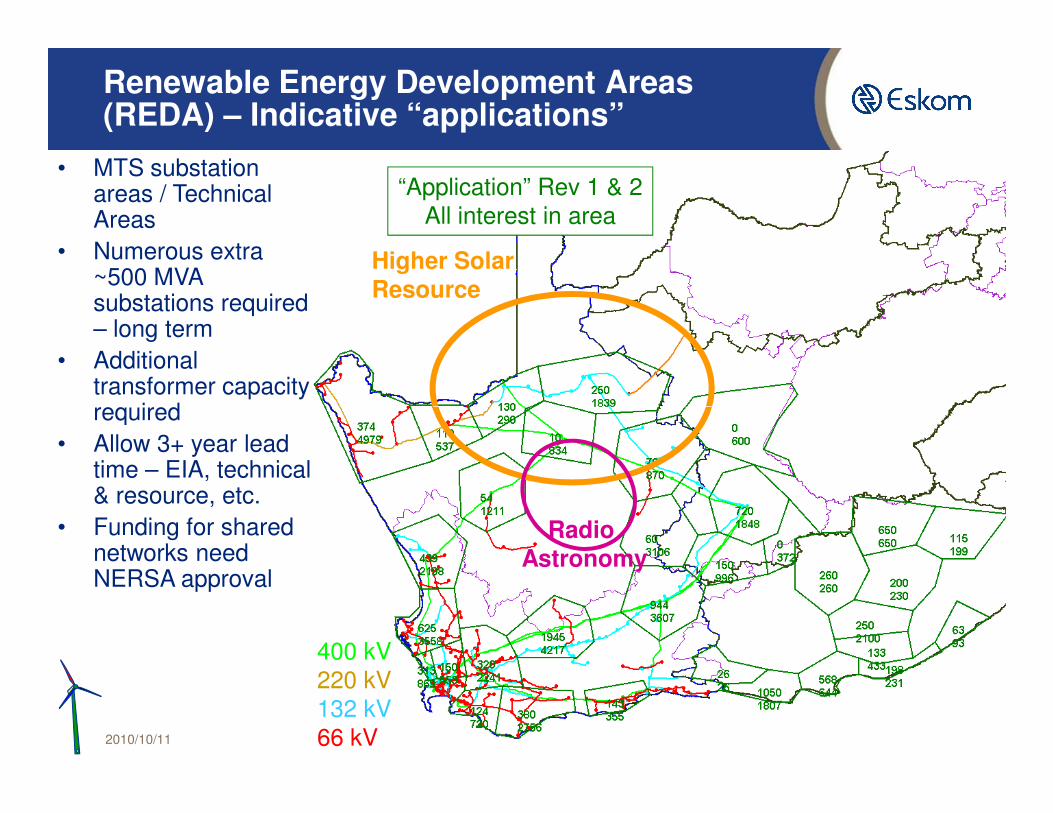
Renewable Energy Development Areas (REDA) – Indicative “applications”
Higher Solar Resource
• MTS substation areas / Technical Areas
• Numerous extra ~500 MVA substations required – long term
• Additional transformer capacity required
“Application” Rev 1 & 2All interest in area
2010/10/11 4
Radio Astronomy
required• Allow 3+ year lead
time – EIA, technical & resource, etc.
• Funding for shared networks need NERSA approval
400 kV220 kV132 kV66 kV
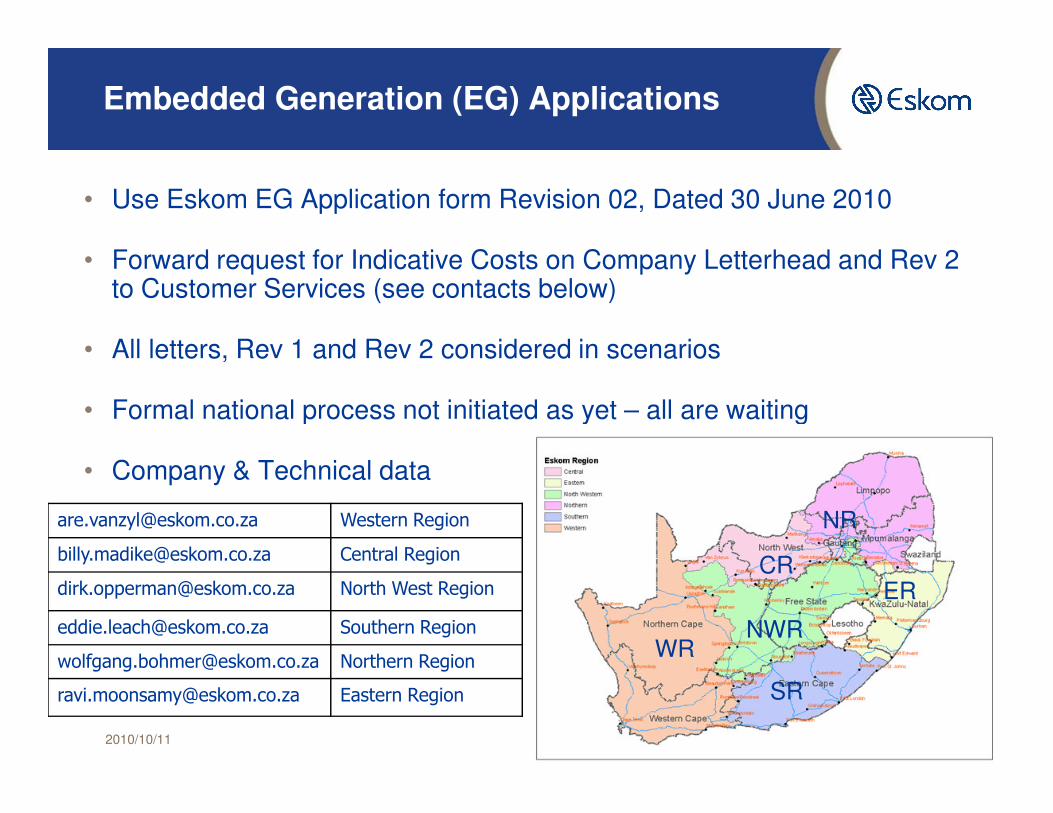
Embedded Generation (EG) Applications
• Use Eskom EG Application form Revision 02, Dated 30 June 2010
• Forward request for Indicative Costs on Company Letterhead and Rev 2 to Customer Services (see contacts below)
• All letters, Rev 1 and Rev 2 considered in scenarios
• Formal national process not initiated as yet – all are waiting
2010/10/11 5
• Formal national process not initiated as yet – all are waiting
• Company & Technical data
������������ ��� ��� ������������ �
������������� ��� ���� ����������� �
����� ���������� ��� ��� � ������������� �
������������� ��� ��� � ����������� �
� ������� ������� ��� ��� � ����������� �
������ �������� ��� ��� ����������� �
WR
SR
NWR
ER
NR
CR
Renewable Energy applications
• Applications to be processed once REFIT programme requirements fully available
• Indicative costs to support developers
• A quotation requires detail work for project submissions – Application Form Rev 2 Part 2 to be updated with all required technical data
2010/10/11 6
Form Rev 2 Part 2 to be updated with all required technical data
• Selected projects to continue once commitment fee is paid to Budget Quote stage
• Project execution will follow once PPA allocated / financial close
• Will require a Connection and Use of System Agreement to be signed
• Any programme must cater realistically for project lead times and risks, including quotation phase, EIA, construction….
Interconnection of Embedded Generation
• SA Grid Code (Transmission) and Distribution Grid Codes from NERSA
• DST 34-1765 Distribution standard serves to fulfil Eskom Distribution’s obligation under Section 8.2 (4) of the South African Distribution Code: Network Code:
• “The Distributor shall develop the protection requirement guide for connecting Embedded Generators to the Distribution System to ensure safe and reliable operation of the Distribution System”.
2010/10/11 7
• This standard does not apply to generator interconnections at Low Voltage, or generators of capacity less than 100kW. NRS097 will cater for it.
• The present revision of this standard does not cater for specific requirements with regard to the interconnection of wind farms
• Additional Wind Grid Code requirements under development
• Will require developer/IPP cooperation with proper technical data• E.g. wind turbine models
Joint Transmission & Distribution Grid Planning
• First real wind energy course in South Africa – March 2009• Arranged by DEADP, Western Province and Eskom with GTZ & DigSilent• Involved various role players and developers in industry
• GTZ-DigSilent-Eskom Western Province grid capacity study – March – Nov 2009
• GTZ-DigSilent-Eskom grid capacity credit study – March – Oct 2010
• Transmission and Distribution in-house network capacity, and fault studies in progress
• Will be used in feedback to developers to assist with applications
2010/10/11 8
• Will be used in feedback to developers to assist with applications• Transmission & Distribution workshop held Sep 2010
• Planning procedures being developed and tested
• Developers treated as if only developer, until optimisation for projects accepted for REFIT programme
• DigSilent wind turbine modelling course to Eskom Network Planners – Oct 2010 – to support proper analysis and consistent approach
• The above deals only with Eskom, Municipal needs to be considered
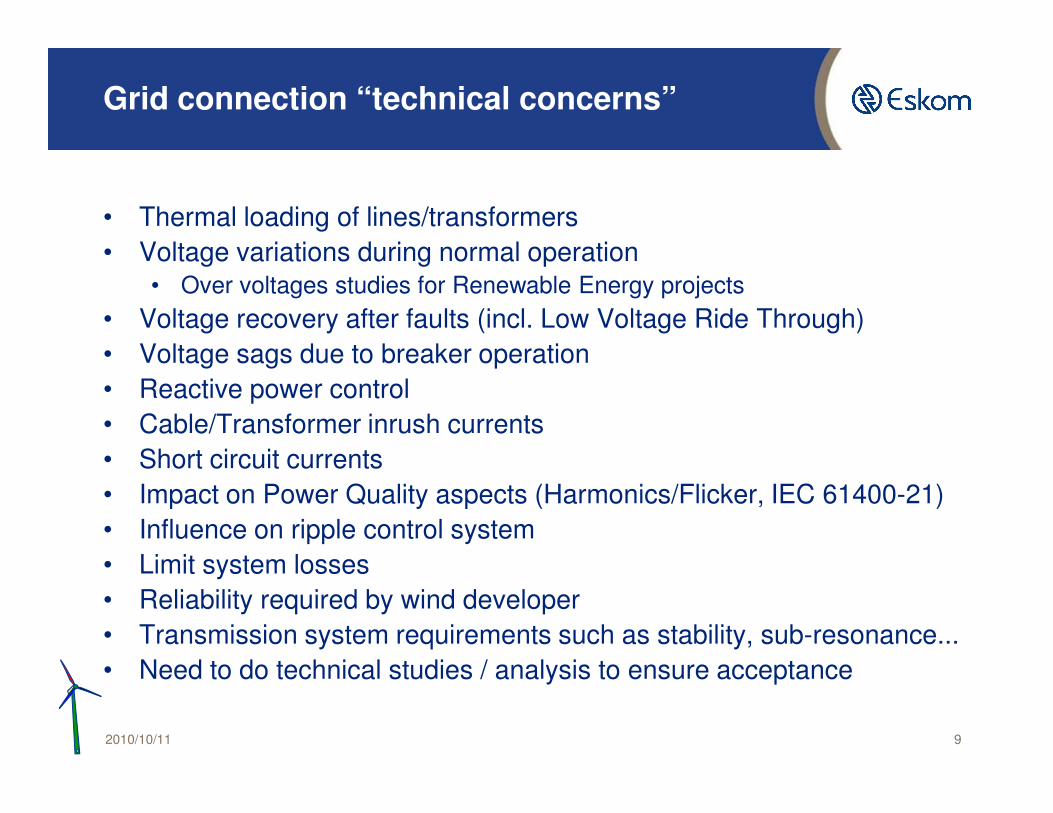
Grid connection “technical concerns”
• Thermal loading of lines/transformers• Voltage variations during normal operation
• Over voltages studies for Renewable Energy projects• Voltage recovery after faults (incl. Low Voltage Ride Through)• Voltage sags due to breaker operation• Reactive power control
2010/10/11 9
• Cable/Transformer inrush currents• Short circuit currents• Impact on Power Quality aspects (Harmonics/Flicker, IEC 61400-21)• Influence on ripple control system• Limit system losses• Reliability required by wind developer• Transmission system requirements such as stability, sub-resonance...• Need to do technical studies / analysis to ensure acceptance
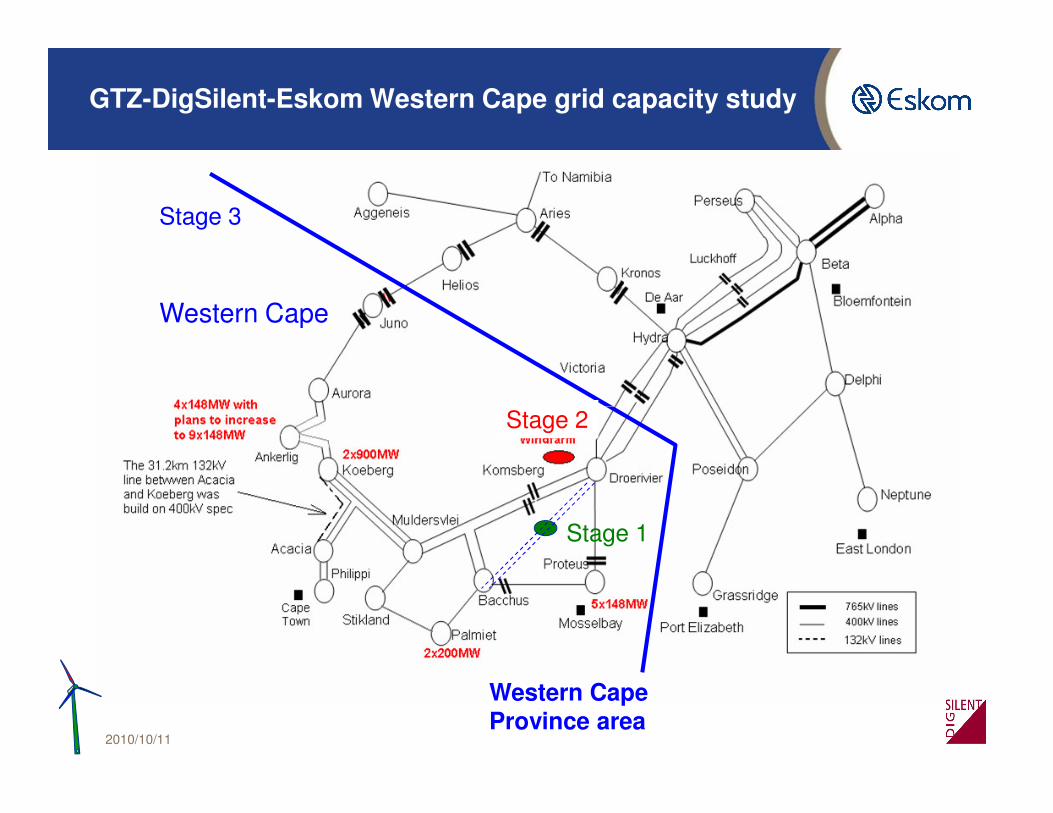
GTZ-DigSilent-Eskom Western Cape grid capacity study
Western Cape
Stage 3
Stage 2
2010/10/11 10
Stage 2
Stage 1
Western Cape Province area
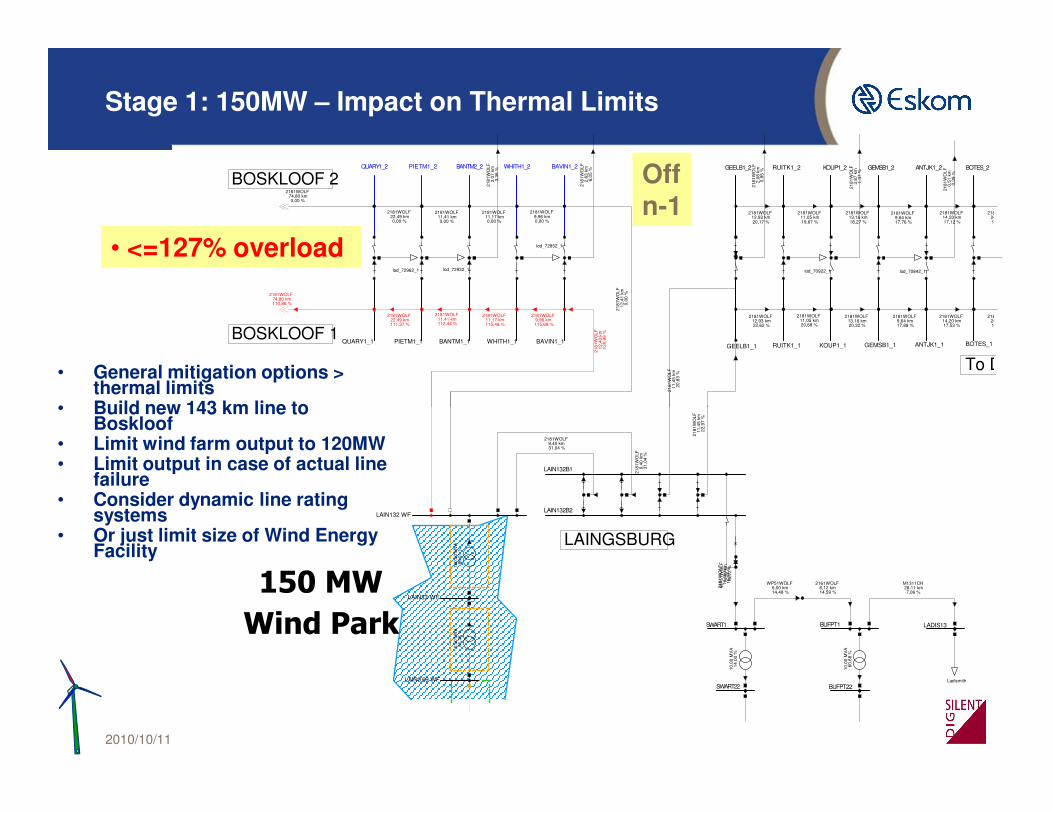
Stage 1: 150MW – Impact on Thermal Limits
To DROERIVIER
Continued onBacchus 132kV diagram
BOSKLOOF 1
BOSKLOOF 2QUARY1_2
QUARY1_1
PIETM1_2 BANTM2_2
BANTM1_1
WHITH1_2
WHITH1_1
BAVIN1_2
BAVIN1_1PIETM1_1
GEELB1_2
GEELB1_1
RUITK1_2
RUITK1_1
KOUP1_2
KOUP1_1
GEMSB1_2
GEMSB1_1
ANTJK1_2
ANTJK1_1
BOTES_2
BOTES_1
2181
WO
LF
12,4
1 km
0,00
%
lod_72962_1 lod_72932_1
lod_72852_1
lod_70922_1 lod_70842_1
2181WOLF 12,93 km20,17 %
2181WOLF 12,93 km22,62 %
2181WOLF 11,05 km19,67 %
2181WOLF 11,05 km20,68 %
2181WOLF 13,16 km18,27 %
2181WOLF 13,16 km20,32 %
2181WOLF 9,64 km17,76 %
2181WOLF 9,64 km17,88 %
2181WOLF 14,20 km17,12 %
2181WOLF 14,20 km17,53 %
2181WOLF 24,09 km16,59 %
2181WOLF 24,09 km16,33 %
2181
WO
LF
12,4
0 km
120,
99 %
2181WOLF 9,96 km115,69 %
2181
WO
LF
11,4
5 km
20,8
3 %
2181
WO
LF
2,08
km
0,95
%
2181
WO
LF
3,87
km
1,37
%
2181
WO
LF
0,51
km
0,39
%
2181WOLF 74,80 km0,00 %
2181
WO
LF
2,63
km
6,05
%
2181
WO
LF
2,07
km
3,36
%
2181WOLF 11,41 km0,00 %
2181WOLF 11,41 km112,44 %
2181WOLF 9,96 km0,00 %
2181WOLF 22,49 km111,37 %
2181WOLF 22,49 km0,00 %
2181WOLF 11,17 km115,48 %
2181WOLF 11,17 km0,00 %
2181WOLF 74,80 km110,86 %
• <=127% overload
Offn-1
• General mitigation options > thermal limits
• Build new 143 km line to
2010/10/11 11
��������
��� �
LAINGSBURG
LAIN132 WF
LAIN0.69 WF
LAIN33 WF
LAIN132B1
LADIS13
SWART22
SWART1
BUFPT22
BUFPT1
LAIN132B2
180,
00 M
VA
86,0
1 %
2,50
MV
A81
,36
%
2181WOLF 9,40 km31,04 %
Ladismith
M1311CH 28,11 km7,06 %
2161WOLF 6,12 km14,59 %
WP51WOLF 6,00 km14,48 %
2161
WO
LF
14,4
5 km
15,9
7 %
2181
WO
LF
9,40
km
31,0
4 %
2181
WO
LF
11,4
5 km
22,9
7 %
WP
51W
OLF
14
,45
km15
,72
%
10,0
0 M
VA
60,6
8 %
10,0
0 M
VA
14,0
0 %
• Build new 143 km line to Boskloof
• Limit wind farm output to 120MW • Limit output in case of actual line
failure • Consider dynamic line rating
systems• Or just limit size of Wind Energy
Facility
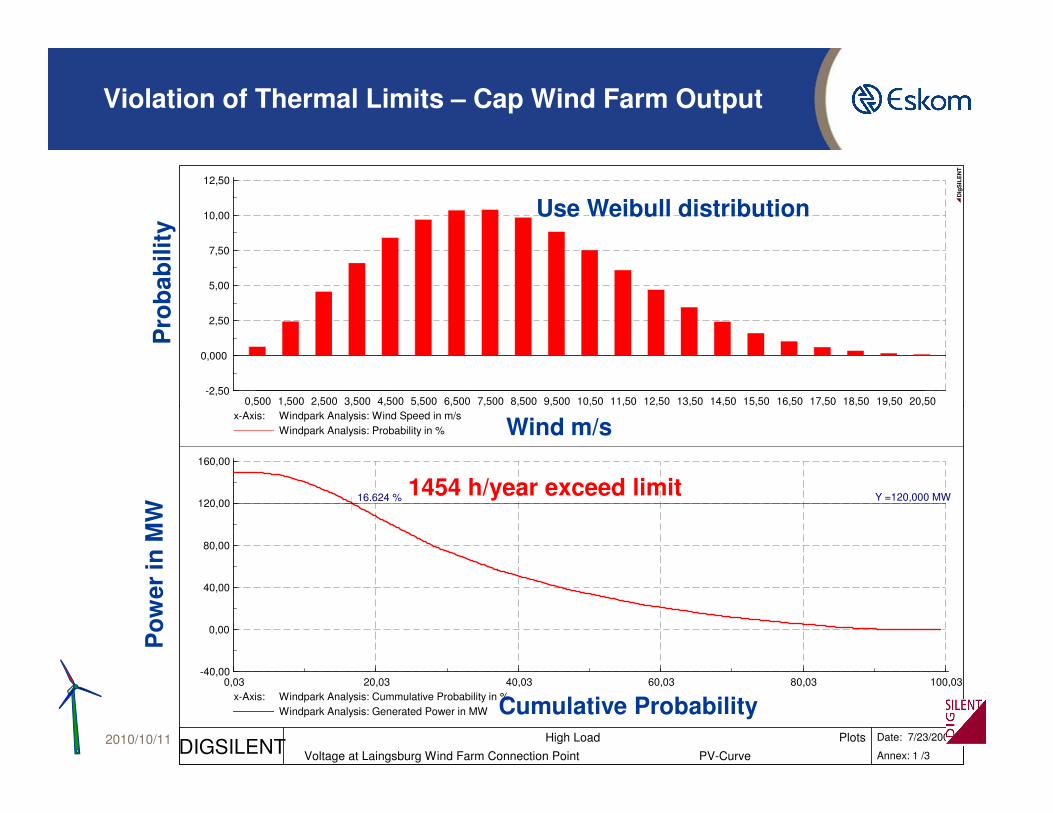
Violation of Thermal Limits – Cap Wind Farm Output
0,500 1,500 2,500 3,500 4,500 5,500 6,500 7,500 8,500 9,500 10,50 11,50 12,50 13,50 14,50 15,50 16,50 17,50 18,50 19,50 20,50
12,50
10,00
7,50
5,00
2,50
-2,50
0,000
DIg
SIL
EN
T
Pro
babi
lity
Use Weibull distribution
2010/10/11 12
x-Axis: Windpark Analysis: Wind Speed in m/sWindpark Analysis: Probability in %
100,0380,0360,0340,0320,030,03
160,00
120,00
80,00
40,00
0,00
-40,00
x-Axis: Windpark Analysis: Cummulative Probability in %Windpark Analysis: Generated Power in MW
Y =120,000 MW16.624 %
DIGSILENT High Load PlotsVoltage at Laingsburg Wind Farm Connection Point PV-Curve
Date: 7/23/2009
Annex: 1 /3
1454 h/year exceed limit
Wind m/s
Cumulative Probability
Pow
er in
MW
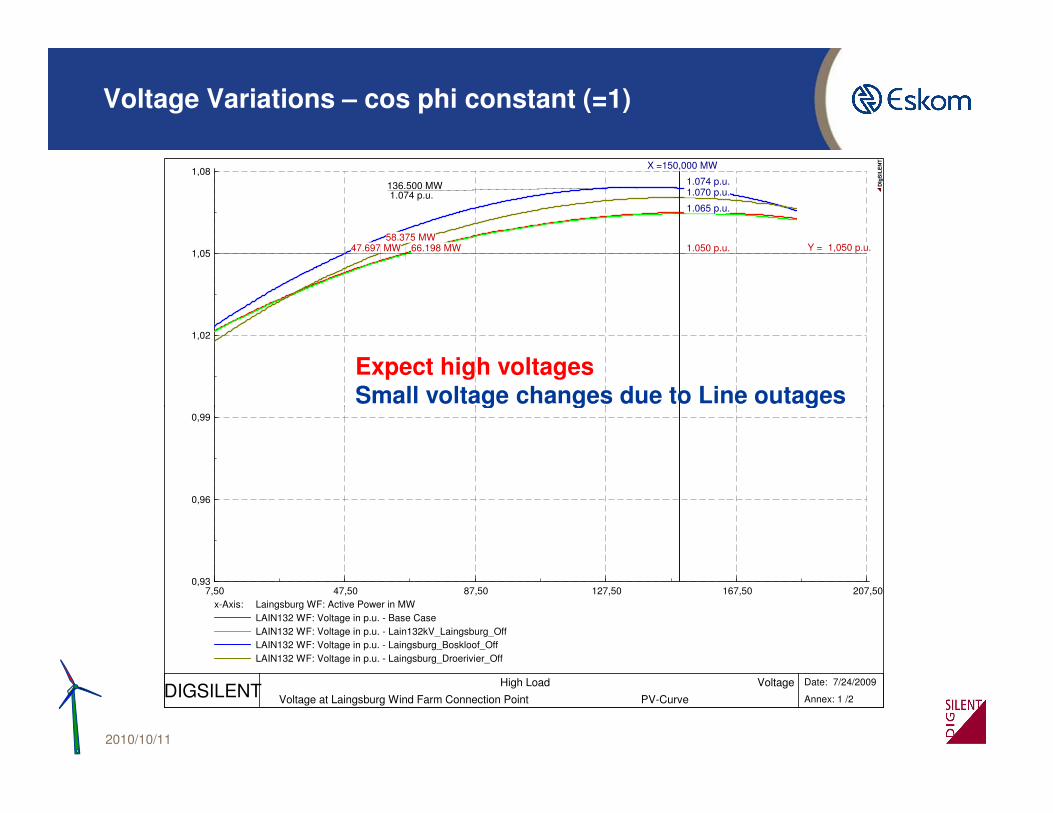
Voltage Variations – cos phi constant (=1)
1,08
1,05
1,02
Y = 1,050 p.u.47.697 MW58.375 MW
66.198 MW
X =150,000 MW
1.065 p.u.
1.070 p.u. 1.074 p.u.
1.050 p.u.
136.500 MW 1.074 p.u.
DIg
SIL
EN
T
Expect high voltagesSmall voltage changes due to Line outages
2010/10/11 13
207,50167,50127,5087,5047,507,50
0,99
0,96
0,93
x-Axis: Laingsburg WF: Active Power in MWLAIN132 WF: Voltage in p.u. - Base CaseLAIN132 WF: Voltage in p.u. - Lain132kV_Laingsburg_OffLAIN132 WF: Voltage in p.u. - Laingsburg_Boskloof_OffLAIN132 WF: Voltage in p.u. - Laingsburg_Droerivier_Off
DIGSILENT High Load Voltage
Voltage at Laingsburg Wind Farm Connection Point PV-Curve
Date: 7/24/2009
Annex: 1 /2
Small voltage changes due to Line outages
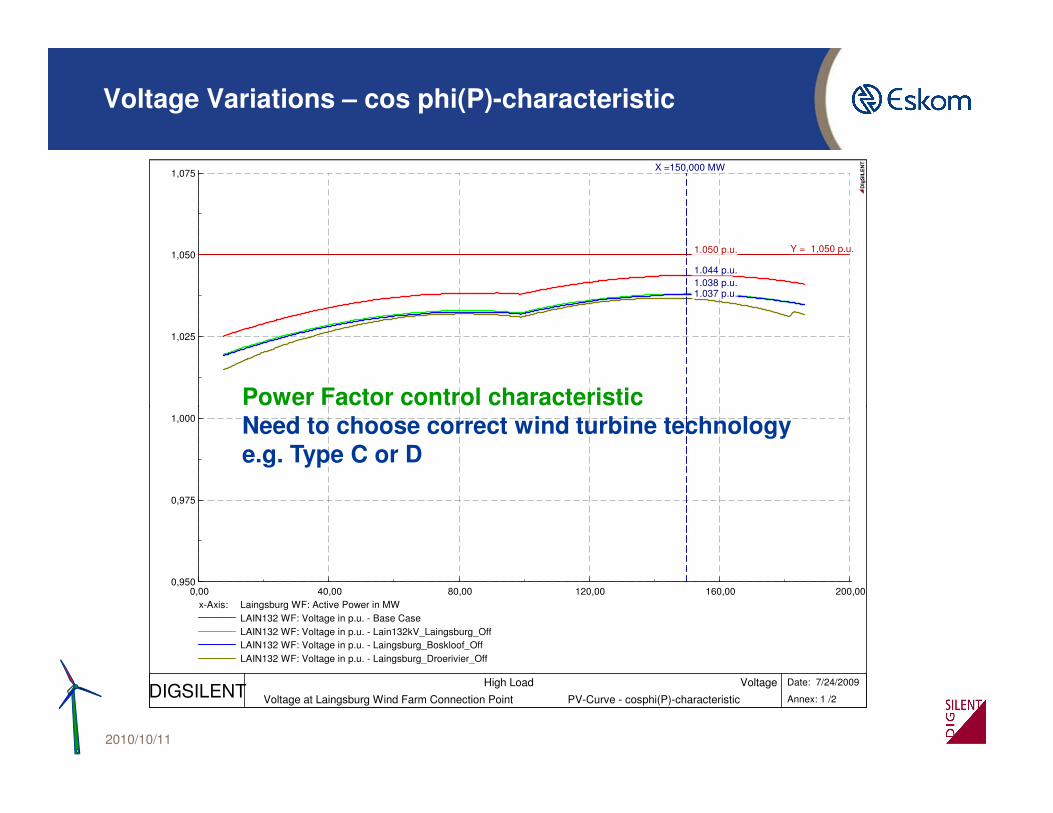
Voltage Variations – cos phi(P)-characteristic
1,075
1,050
1,025
Y = 1,050 p.u.
X =150,000 MW
1.037 p.u. 1.038 p.u. 1.044 p.u.
1.050 p.u.
DIg
SIL
EN
T
Power Factor control characteristic
2010/10/11 14
200,00160,00120,0080,0040,000,00
1,000
0,975
0,950
x-Axis: Laingsburg WF: Active Power in MWLAIN132 WF: Voltage in p.u. - Base CaseLAIN132 WF: Voltage in p.u. - Lain132kV_Laingsburg_OffLAIN132 WF: Voltage in p.u. - Laingsburg_Boskloof_OffLAIN132 WF: Voltage in p.u. - Laingsburg_Droerivier_Off
DIGSILENT High Load Voltage
Voltage at Laingsburg Wind Farm Connection Point PV-Curve - cosphi(P)-characteristic
Date: 7/24/2009
Annex: 1 /2
Power Factor control characteristicNeed to choose correct wind turbine technologye.g. Type C or D
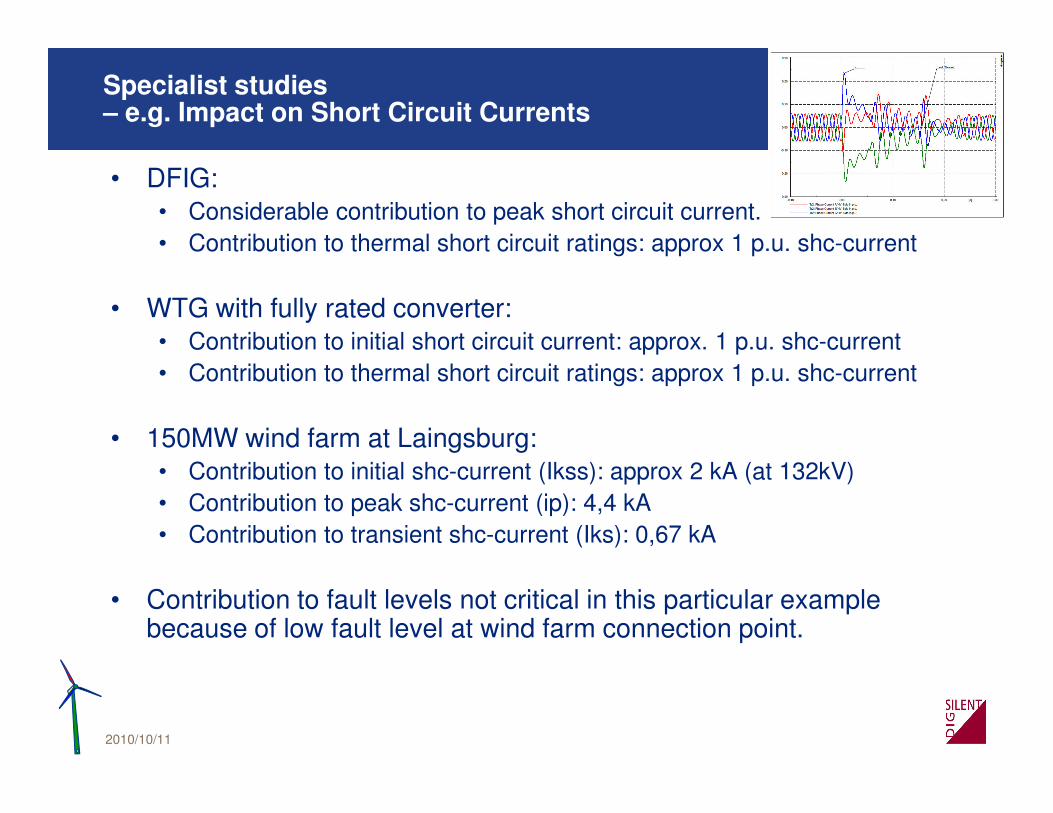
Specialist studies – e.g. Impact on Short Circuit Currents
• DFIG:• Considerable contribution to peak short circuit current.• Contribution to thermal short circuit ratings: approx 1 p.u. shc-current
• WTG with fully rated converter:• Contribution to initial short circuit current: approx. 1 p.u. shc-current• Contribution to thermal short circuit ratings: approx 1 p.u. shc-current
2010/10/11 15
• 150MW wind farm at Laingsburg:• Contribution to initial shc-current (Ikss): approx 2 kA (at 132kV)• Contribution to peak shc-current (ip): 4,4 kA• Contribution to transient shc-current (Iks): 0,67 kA
• Contribution to fault levels not critical in this particular example because of low fault level at wind farm connection point.
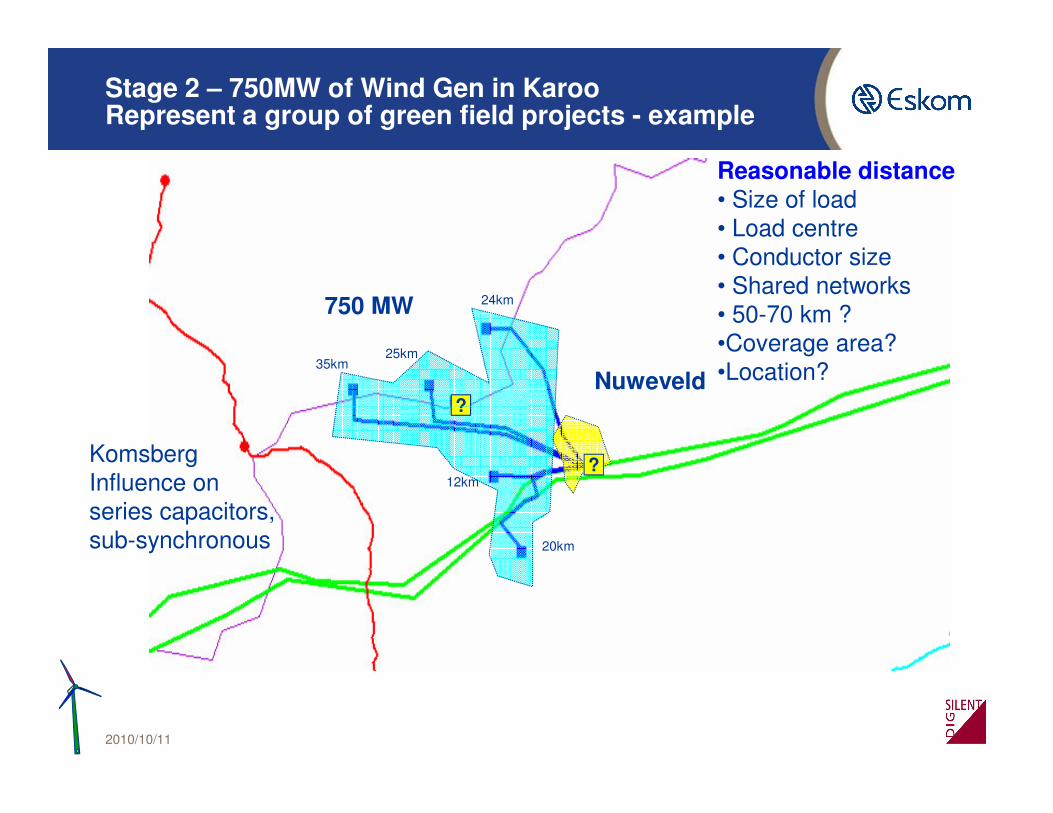
Stage 2 – 750MW of Wind Gen in KarooRepresent a group of green field projects - example
Nuweveld
750 MW
35km25km
24km
Reasonable distance• Size of load• Load centre• Conductor size• Shared networks• 50-70 km ?•Coverage area?•Location?
?
2010/10/11 16
12km
20km
KomsbergInfluence on series capacitors,sub-synchronous
?
?
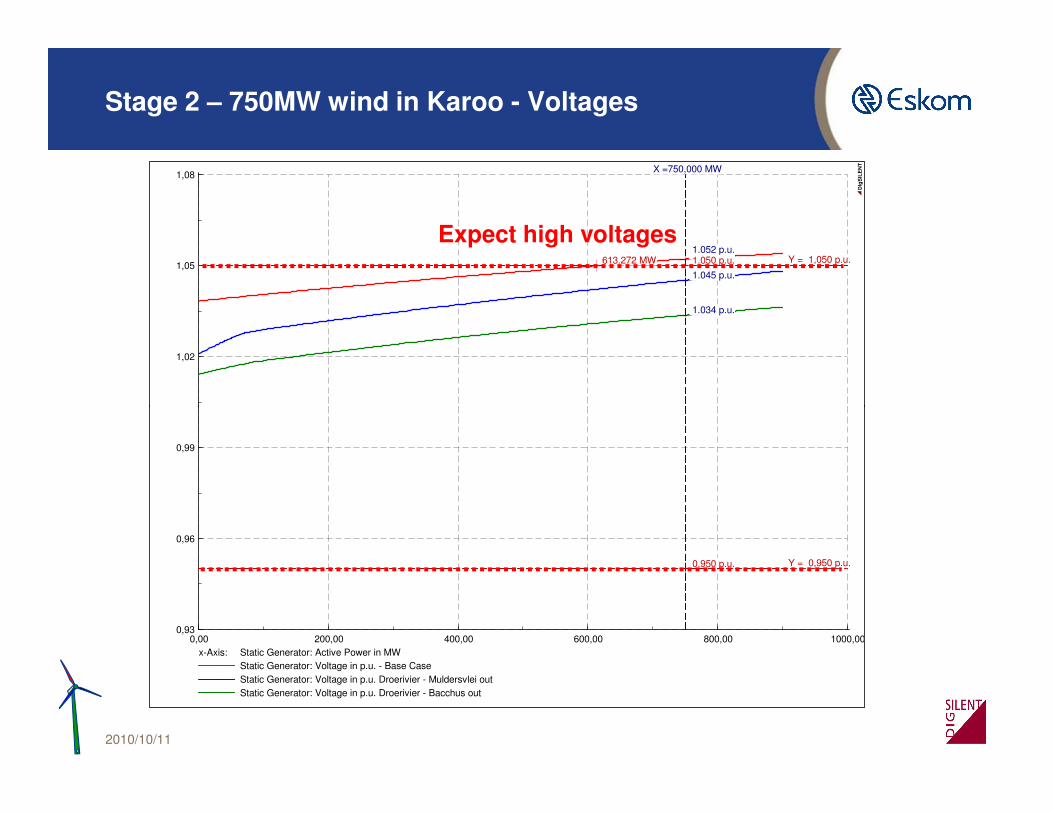
Stage 2 – 750MW wind in Karoo - Voltages
1,08
1,05
1,02
X =750,000 MW
1.050 p.u.
1.034 p.u.
1.045 p.u.
1.052 p.u. 1.050 p.u.
X =750,000 MW
1.050 p.u.
1.034 p.u.
1.045 p.u.
1.052 p.u. 1.050 p.u. Y = 1,050 p.u.613.272 MW Y = 1,050 p.u.613.272 MW
DIg
SIL
EN
T
Expect high voltages
2010/10/11 17
1000,00800,00600,00400,00200,000,00
0,99
0,96
0,93
x-Axis: Static Generator: Active Power in MWStatic Generator: Voltage in p.u. - Base CaseStatic Generator: Voltage in p.u. Droerivier - Muldersvlei outStatic Generator: Voltage in p.u. Droerivier - Bacchus out
0.950 p.u. 0.950 p.u. 0.950 p.u. 0.950 p.u. Y = 0,950 p.u.Y = 0,950 p.u.
Stage 2 – 750MW – Summary of Results
• No thermal overloads under n-1 conditions
• Voltage variations very small, even in constant power factor operation.
• Operation with constant Q (var-control) is appropriate.
• (Slow) voltage control is possible and should be considered.
• 4x100Mvar shunt reactors required at Nuweveld substation (or equivalent var-absorption of the wind farms) because of proximity to
2010/10/11 18
equivalent var-absorption of the wind farms) because of proximity to Komsberg series compensation.
• Series compensation at Komsberg should be resized for considering new line configuration.
• With adjusted series compensation, shunt reactors at Nuweveld might not be required.
• No power quality issues because of the large number of turbines and high fault level at the grid connection point
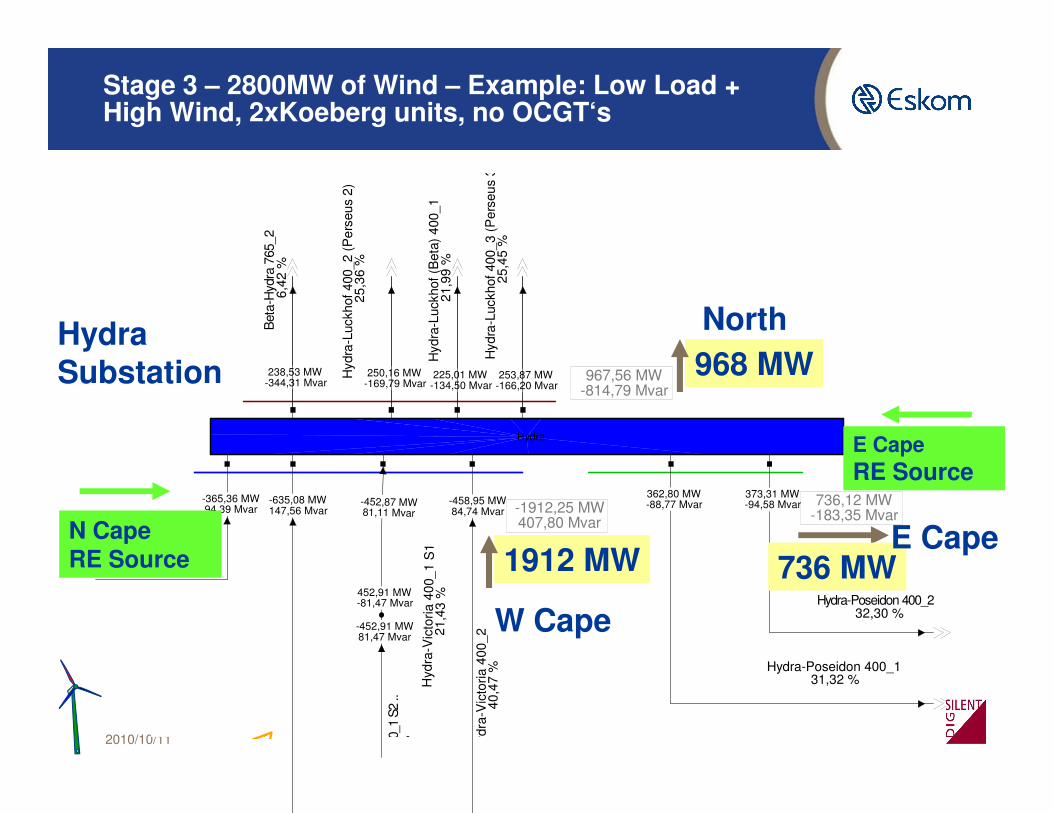
Stage 3 – 2800MW of Wind – Example: Low Load + High Wind, 2xKoeberg units, no OCGT‘s
967,56 MW-814,79 Mvar
Hyd
ra-L
uckh
of 4
00_3
(Per
seus
3)
25,4
5 %
253,87 MW-166,20 Mvar
Hyd
ra-L
uckh
of (B
eta)
400
_1
21,9
9 %
225,01 MW-134,50 Mvar
Hyd
ra-L
uckh
of 4
00_2
(Per
seus
2)
25,3
6 %
250,16 MW-169,79 Mvar
Bet
a-H
ydra
765
_2
6,42
%
238,53 MW-344,31 Mvar
968 MWNorthHydra
Substation
2010/10/11 19
Hydra
-1912,25 MW407,80 Mvar
736,12 MW-183,35 Mvar
Hydra-Poseidon 400_1 31,32 %
362,80 MW-88,77 Mvar
Hydra-Poseidon 400_2 32,30 %
373,31 MW-94,58 Mvar-365,36 MW
94,39 Mvar
Hyd
r a- V
icto
r ia 4
00_1
S1
21
,43
%
-452,87 MW81,11 Mvar
452,91 MW-81,47 Mvar
Hyd
ra-V
icto
ria 4
00_2
40
,47
%-458,95 MW84,74 Mvar
Hydr
a-Vi
ctor
ia 4
00_1
S2
..39
,90
%
-452,91 MW81,47 Mvar
-635,08 MW147,56 Mvar
1912 MW 736 MW
W Cape
E Cape
E Cape RE Source
N Cape RE Source
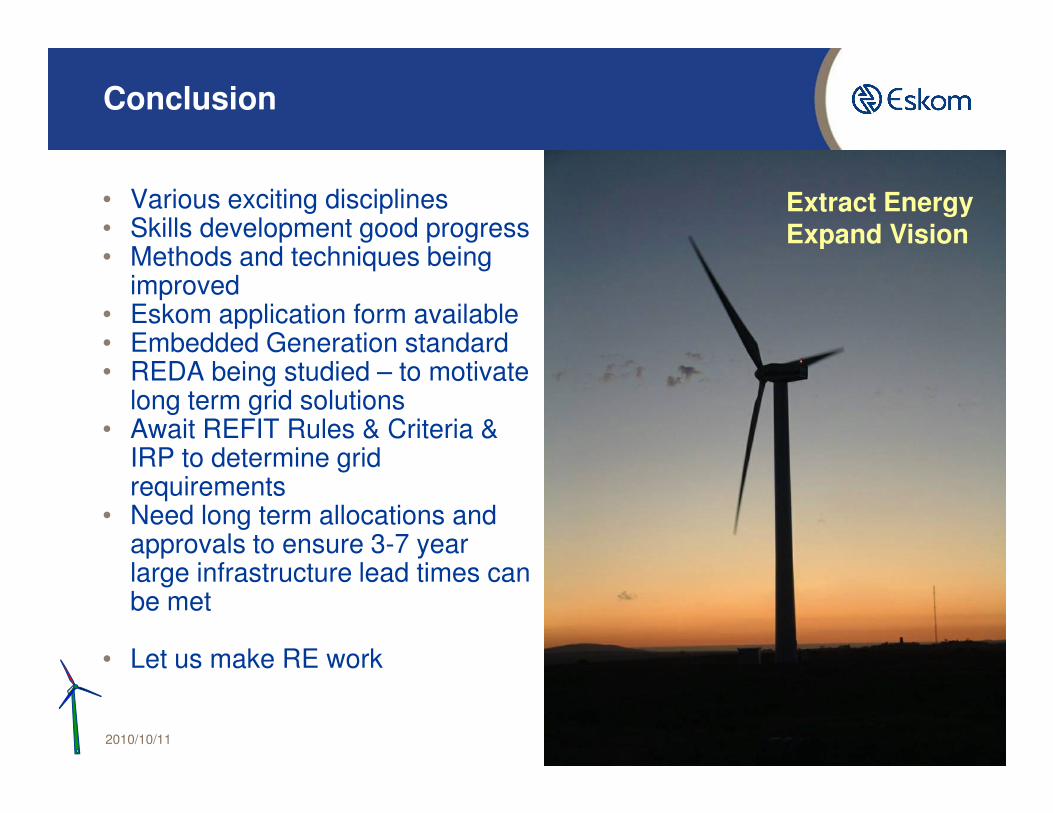
Conclusion
• Various exciting disciplines• Skills development good progress• Methods and techniques being
improved• Eskom application form available• Embedded Generation standard • REDA being studied – to motivate
long term grid solutions
Extract EnergyExpand Vision
2010/10/11 20
long term grid solutions• Await REFIT Rules & Criteria &
IRP to determine grid requirements
• Need long term allocations and approvals to ensure 3-7 year large infrastructure lead times can be met
• Let us make RE work