Grid connection From Wikipedia, the free encyclopedia In electrical grids, a power system network integrates transmission grids, distribution grids, distributed generators and loads that have connection points called busses. A bus in home circuit breaker panels is much smaller than those used on the grid, where busbars can be 50 mm in diameter in electrical substations. Traditionally, these grid connections are unidirectional point to multipoint links. In distributed generation grids, these connections are bidirectional, and the reverse flow can raise safety and reliability concerns. [1] Features in smart grids are designed to manage these conditions. A premises is generally said to have obtained grid connection when its service location becomes powered by a live connection to its service transformer. A power station is generally said to have achieved grid connection when it first supplies power outside of its own boundaries. However, a town is only said to have achieved grid connection when it is connected to several redundant sources, generally involving long-distance transmission. Solar energy From Wikipedia, the free encyclopedia For the academic journal, see Solar Energy (journal) .

Welcome message from author
This document is posted to help you gain knowledge. Please leave a comment to let me know what you think about it! Share it to your friends and learn new things together.
Transcript
Grid connectionFrom Wikipedia, the free encyclopedia
In electrical grids, a power system network integrates transmission grids, distribution grids, distributed generators and loads that have connection points called busses. A bus in home circuit breaker panels is much smaller than those used on the grid, where busbars can be 50 mm in diameter in electrical substations. Traditionally, these grid connections are unidirectional point to multipoint links. In distributed generation grids, these connections are bidirectional, and the reverse flow can raise safety and reliability concerns.[1]Features in smart grids are designed to manage these conditions.
A premises is generally said to have obtained grid connection when its service location becomes powered by a live connection to its service transformer.
A power station is generally said to have achieved grid connection when it first supplies power outside of its own boundaries. However, a town is only said to have achieved grid connection when it is connected to several redundant sources, generally involving long-distance transmission.
Solar energyFrom Wikipedia, the free encyclopedia
For the academic journal, see Solar Energy (journal).
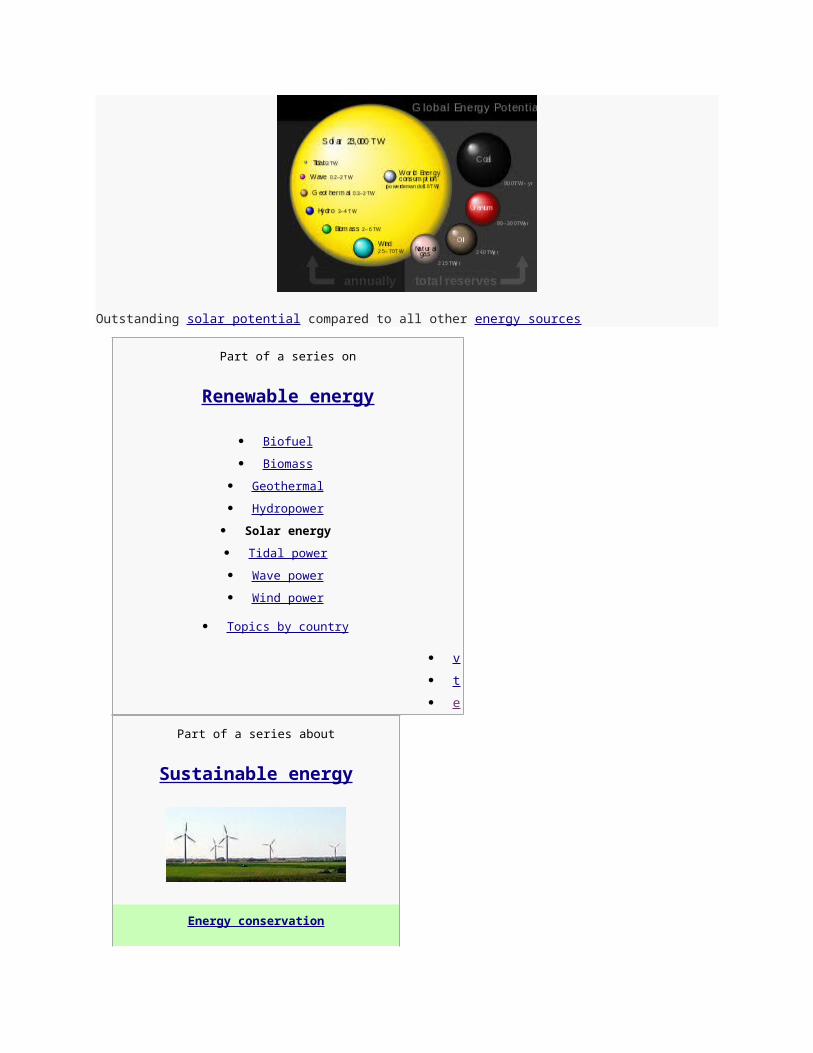
Outstanding solar potential compared to all other energy sources
Part of a series on
Renewable energy
Biofuel
Biomass
Geothermal
Hydropower
Solar energy
Tidal power
Wave power
Wind power
Topics by country
v
t
e
Part of a series about
Sustainable energy
Energy conservation
Cogeneration
Energy efficiency
Heat pump
Green building
Low-carbon power
Microgeneration
Passive solar
Renewable energy
Anaerobic digestion
Geothermal
Hydroelectricity
Solar
Tidal
Wind
Sustainable transport
Carbon-neutral fuel
Electric vehicle
Fossil-fuel phase-out
Green vehicle
Plug-in hybrid
Sustainable development portal
Renewable energy portal
Environment portal
v
t
e
Solar energy is radiant light and heat from the Sun harnessed using a range of ever-evolving technologies such as solar heating,photovoltaics, solar thermal energy, solar architecture and artificial photosynthesis.[1][2]
It is an important source of renewable energy and its technologies are broadly characterized as either passive solar or active solardepending on the way they capture and distribute solar energy or convert it into solar power. Active solar techniques include the use of photovoltaic systems, concentrated solar power and solar water heating to harness the energy. Passive solar techniques include orienting a building to the Sun, selecting materials with favorable thermal mass or light dispersing properties, and designing spaces that naturally circulate air.
The large magnitude of solar energy available makes it a highly appealing source of electricity. The United Nations Development Programme in its 2000 World Energy Assessment found that the annual potential of solar energy was 1,575–49,387 exajoules (EJ). This is several times larger than the total world energy consumption, which was 559.8 EJ in 2012.[3][4]
In 2011, the International Energy Agency said that "the development of affordable, inexhaustible and clean solar energy technologies will have huge longer-term benefits. It will increase countries’ energy security through reliance on an indigenous, inexhaustible and mostly import-independent resource, enhance sustainability, reduce pollution, lower the costs of mitigating global warming, and keep fossil fuel prices lower than otherwise. These advantages are global. Hence the additional costs of the incentives for early deployment should be considered learning investments; they must be wisely spent and need to be widely shared".[1]
Contents [hide]
1 Potential 2 Thermal energy
o 2.1 Early commercial adaption
o 2.2 Water heating o 2.3 Heating, cooling and ventilation o 2.4 Cooking o 2.5 Process heat o 2.6 Water treatment
3 Electricity production o 3.1 Photovoltaics o 3.2 Concentrated solar power
4 Architecture and urban planning 5 Agriculture and horticulture 6 Transport 7 Fuel production 8 Energy storage methods 9 Development, deployment and economics 10 ISO standards 11 See also 12 Notes 13 References 14 External links
PotentialFurther information: Solar radiation
About half the incoming solar energy reaches the Earth's surface.
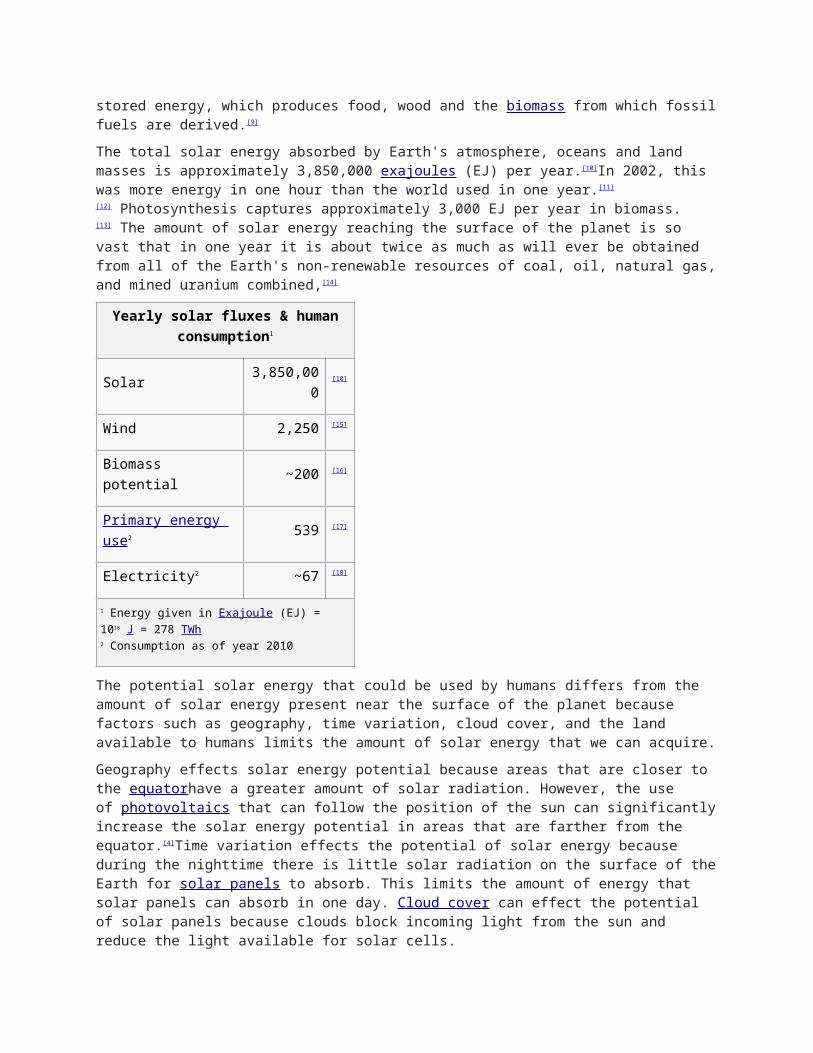
Average insolation. The theoretical area of the small black dots is sufficient to supply the world's total energy
needs of 18 TW with solar power.
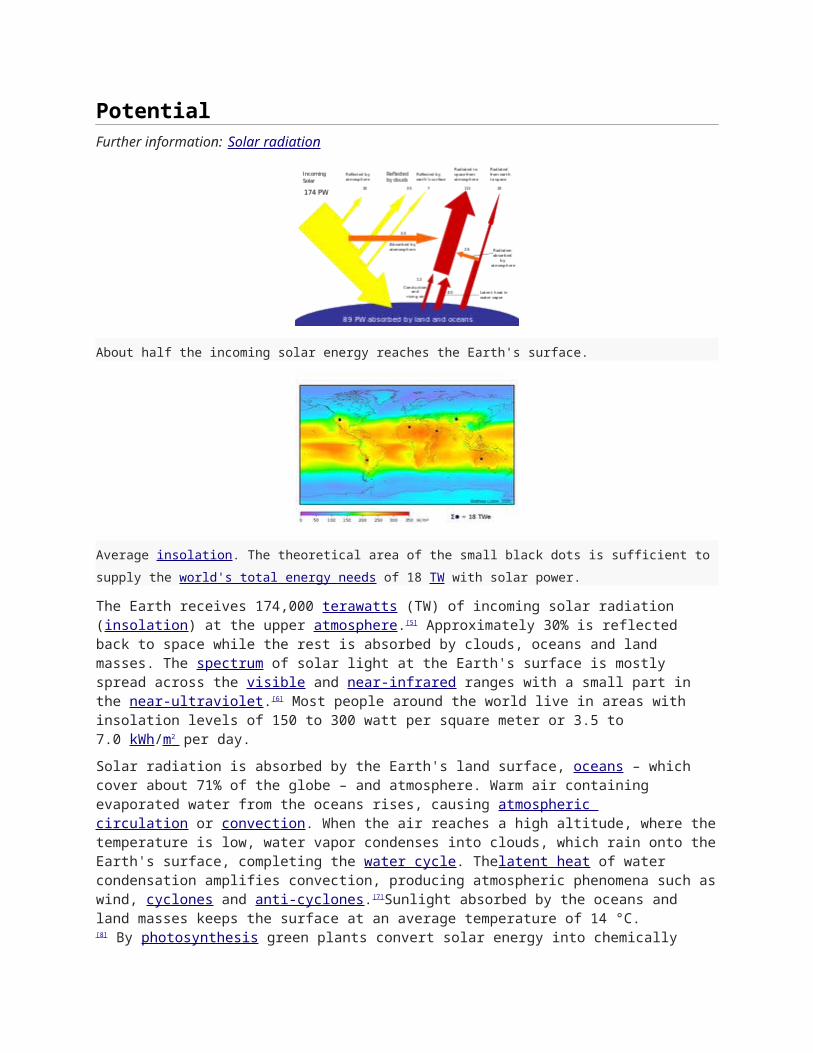
The Earth receives 174,000 terawatts (TW) of incoming solar radiation (insolation) at the upper atmosphere.[5] Approximately 30% is reflected back to space while the rest is absorbed by clouds, oceans and land masses. The spectrum of solar light at the Earth's surface is mostly spread across the visible and near-infrared ranges with a small part in the near-ultraviolet.[6] Most people around the world live in areas with insolation levels of 150 to 300 watt per square meter or 3.5 to 7.0 kWh/m 2 per day.
Solar radiation is absorbed by the Earth's land surface, oceans – which cover about 71% of the globe – and atmosphere. Warm air containing evaporated water from the oceans rises, causing atmospheric circulation or convection. When the air reaches a high altitude, where the temperature is low, water vapor condenses into clouds, which rain onto the Earth's surface, completing the water cycle. Thelatent heat of water condensation amplifies convection, producing atmospheric phenomena such as wind, cyclones and anti-cyclones.[7]Sunlight absorbed by the oceans and land masses keeps the surface at an average temperature of 14 °C.[8] By photosynthesis green plants convert solar energy into chemically stored energy, which produces food, wood and the biomass from which fossil fuels are derived.[9]
The total solar energy absorbed by Earth's atmosphere, oceans and land masses is approximately 3,850,000 exajoules (EJ) per year.[10]In 2002, this was more energy in one hour than the world used in one year.[11][12] Photosynthesis captures approximately 3,000 EJ per year in biomass.[13] The amount of solar energy reaching the surface of the planet is so vast that in one year it is about twice as much as will ever be obtained from all of the Earth's non-renewable resources of coal, oil, natural gas, and mined uranium combined,[14]
Yearly solar fluxes & human consumption1
Solar 3,850,000 [10]
Wind 2,250 [15]
Biomass potential ~200 [16]
Primary energy use2 539 [17]
Electricity2 ~67 [18]
1 Energy given in Exajoule (EJ) = 1018 J = 278 TWh 2 Consumption as of year 2010
The potential solar energy that could be used by humans differs from the amount of solar energy present near the surface of the planet because factors such as geography, time variation, cloud cover, and the land available to humans limits the amount of solar energy that we can acquire.
Geography effects solar energy potential because areas that are closer to the equatorhave a greater amount of solar radiation. However, the use of photovoltaics that can follow the position of the sun can significantly increase the solar energy potential in areas that are farther from the equator. [4]Time variation effects the potential of solar energy because during the nighttime there is little solar radiation on the surface of the Earth for solar panels to absorb. This limits the amount of energy that solar panels can absorb in one day. Cloud cover can effect the potential of solar panels because clouds block incoming light from the sun and reduce the light available for solar cells.
In addition, land availability has a large effect on the available solar energy because solar panels can only be set up on land that is unowned and suitable for solar panels. Roofs have been found to be a suitable place for solar cells, as many people have discovered that they can collect energy
directly from their homes this way. Other areas that are suitable for solar cells are lands that are unowned by businesses where solar plants can be established.[4]
Solar technologies are broadly characterized as either passive or active depending on the way they capture, convert and distribute sunlight and enable solar energy to be harnessed at different levels around the world, mostly depending on distance from the equator. Although solar energy refers primarily to the use of solar radiation for practical ends, all renewable energies, other than geothermal and tidal, derive their energy from the Sun in a direct or indirect way.
Active solar techniques use photovoltaics, concentrated solar power, solar thermal collectors, pumps, and fans to convert sunlight into useful outputs. Passive solar techniques include selecting materials with favorable thermal properties, designing spaces that naturally circulate air, and referencing the position of a building to the Sun. Active solar technologies increase the supply of energy and are considered supply side technologies, while passive solar technologies reduce the need for alternate resources and are generally considered demand side technologies.[19]
In 2000, the United Nations Development Programme, UN Department of Economic and Social Affairs, and World Energy Council published an estimate of the potential solar energy that could be used by humans each year that took into account factors such as insolation, cloud cover, and the land that is usable by humans. The estimate found that solar energy has a global potential of 1,575–49,837 EJ per year (see table below).[4]
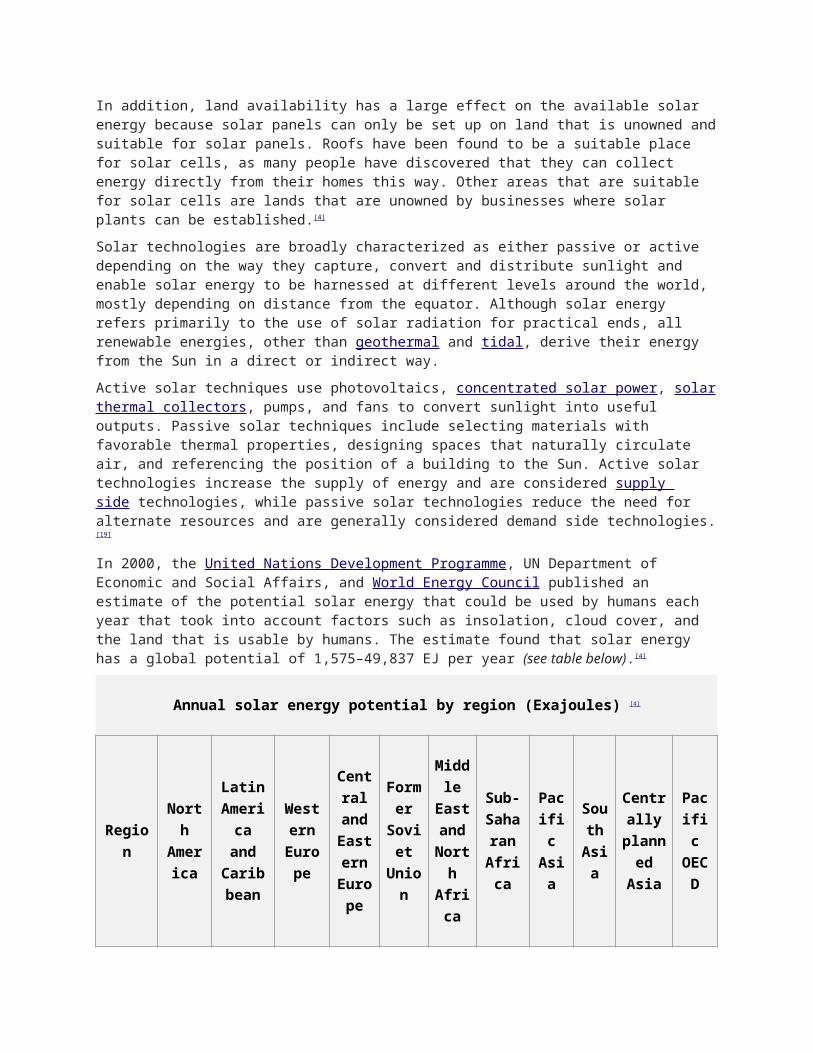
Annual solar energy potential by region (Exajoules) [4]
RegionNorth Ameri
ca
Latin America
and Caribbe
an
Western
Europe
Central and Easte
rn Europ
e
Former
Soviet
Union
Middle
East and Nort
h Afric
a
Sub-Sahar
an Africa
Pacific
Asia
South
Asia
Centrally
planned Asia
Pacific
OECD
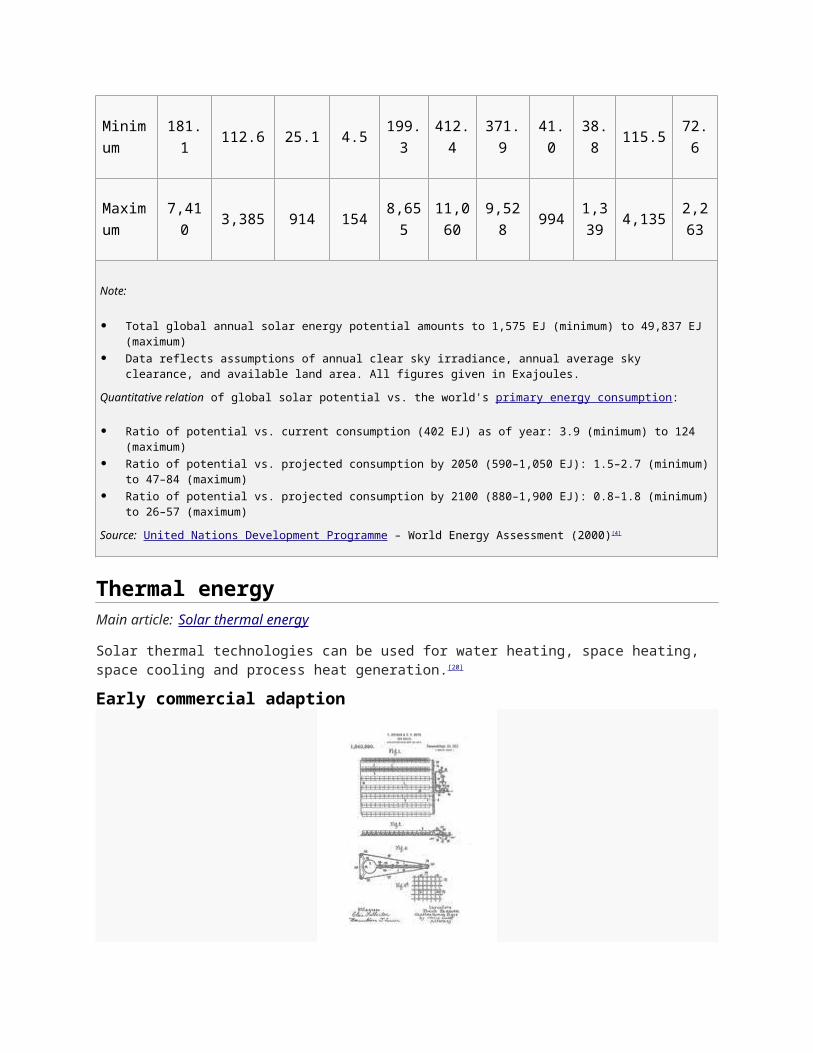
Minimum
181.1 112.6 25.1 4.5 199.3 412.4 371.9 41.0 38.8 115.5 72.6
Maximum
7,410 3,385 914 154 8,65511,06
09,528 994
1,339
4,1352,26
3
Note:
Total global annual solar energy potential amounts to 1,575 EJ (minimum) to 49,837 EJ (maximum) Data reflects assumptions of annual clear sky irradiance, annual average sky clearance, and available land area. All figures given
in Exajoules.
Quantitative relation of global solar potential vs. the world's primary energy consumption:
Ratio of potential vs. current consumption (402 EJ) as of year: 3.9 (minimum) to 124 (maximum) Ratio of potential vs. projected consumption by 2050 (590–1,050 EJ): 1.5–2.7 (minimum) to 47–84 (maximum) Ratio of potential vs. projected consumption by 2100 (880–1,900 EJ): 0.8–1.8 (minimum) to 26–57 (maximum)
Source: United Nations Development Programme – World Energy Assessment (2000)[4]
Thermal energyMain article: Solar thermal energy
Solar thermal technologies can be used for water heating, space heating, space cooling and process heat generation.[20]
Early commercial adaption
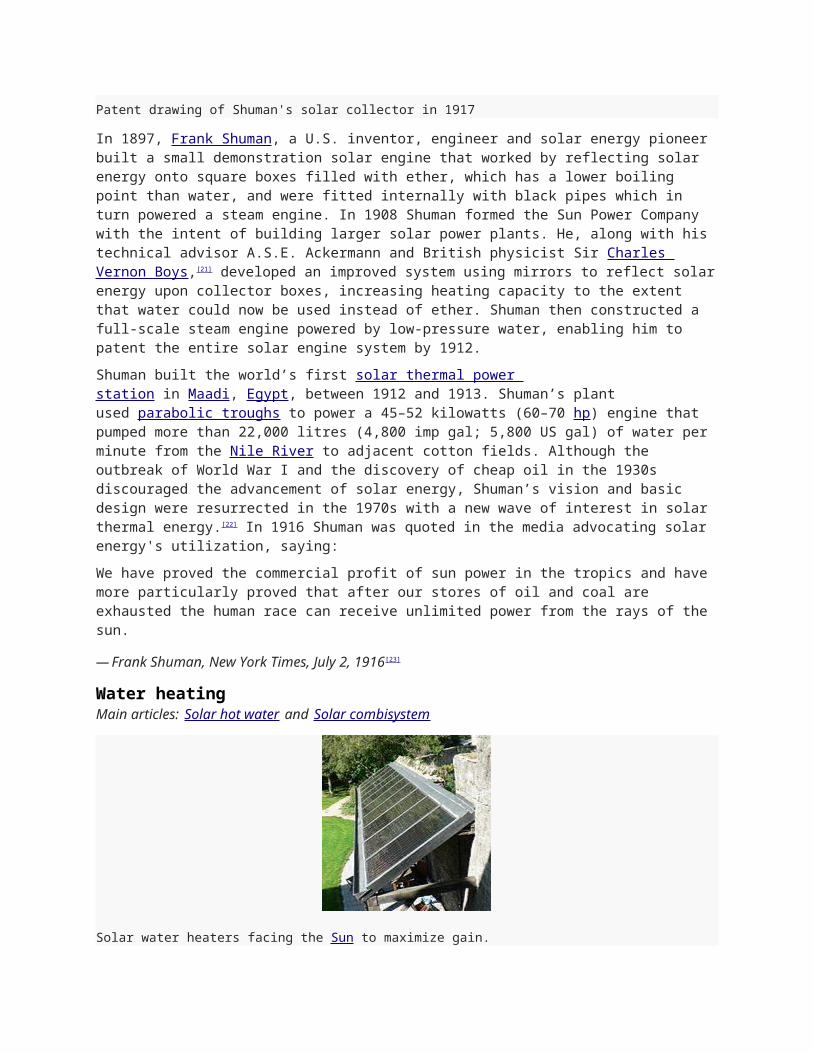
Patent drawing of Shuman's solar collector in 1917
In 1897, Frank Shuman, a U.S. inventor, engineer and solar energy pioneer built a small demonstration solar engine that worked by reflecting solar energy onto square boxes filled with ether, which has a lower boiling point than water, and were fitted internally with black pipes which in turn powered a steam engine. In 1908 Shuman formed the Sun Power Company with the intent of building larger solar power plants. He, along with his technical advisor A.S.E. Ackermann and British physicist Sir Charles Vernon Boys,[21] developed an improved system using mirrors to reflect solar energy upon collector boxes, increasing heating capacity to the extent that water could now be used instead of ether. Shuman then constructed a full-scale steam engine powered by low-pressure water, enabling him to patent the entire solar engine system by 1912.
Shuman built the world’s first solar thermal power station in Maadi, Egypt, between 1912 and 1913. Shuman’s plant used parabolic troughs to power a 45–52 kilowatts (60–70 hp) engine that pumped more than 22,000 litres (4,800 imp gal; 5,800 US gal) of water per minute from the Nile River to adjacent cotton fields. Although the outbreak of World War I and the discovery of cheap oil in the 1930s discouraged the advancement of solar energy, Shuman’s vision and basic design were resurrected in the 1970s with a new wave of interest in solar thermal energy. [22] In 1916 Shuman was quoted in the media advocating solar energy's utilization, saying:
We have proved the commercial profit of sun power in the tropics and have more particularly proved that after our stores of oil and coal are exhausted the human race can receive unlimited power from the rays of the sun.
— Frank Shuman, New York Times, July 2, 1916[23]
Water heatingMain articles: Solar hot water and Solar combisystem
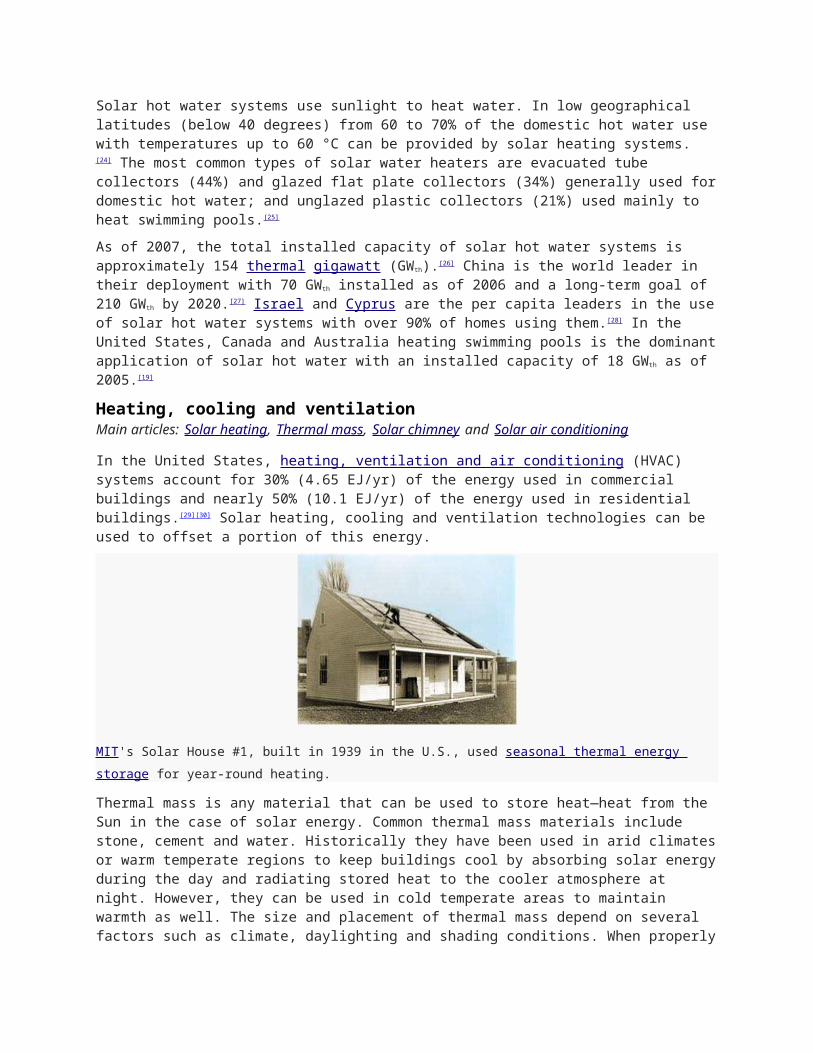
Solar water heaters facing the Sun to maximize gain.
Solar hot water systems use sunlight to heat water. In low geographical latitudes (below 40 degrees) from 60 to 70% of the domestic hot water use with temperatures up to 60 °C can be provided by solar heating systems.[24] The most common types of solar water heaters are evacuated tube collectors (44%) and glazed flat plate collectors (34%) generally used for domestic hot water; and unglazed plastic collectors (21%) used mainly to heat swimming pools.[25]
As of 2007, the total installed capacity of solar hot water systems is approximately 154 thermal gigawatt (GWth).[26] China is the world leader in their deployment with 70 GWth installed as of 2006 and a long-term goal of 210 GWth by 2020.[27] Israel and Cyprus are the per capita leaders in the use of solar hot water systems with over 90% of homes using them.[28] In the United States, Canada and Australia heating swimming pools is the dominant application of solar hot water with an installed capacity of 18 GWth as of 2005.[19]
Heating, cooling and ventilationMain articles: Solar heating, Thermal mass, Solar chimney and Solar air conditioning
In the United States, heating, ventilation and air conditioning (HVAC) systems account for 30% (4.65 EJ/yr) of the energy used in commercial buildings and nearly 50% (10.1 EJ/yr) of the energy used in residential buildings.[29][30] Solar heating, cooling and ventilation technologies can be used to offset a portion of this energy.
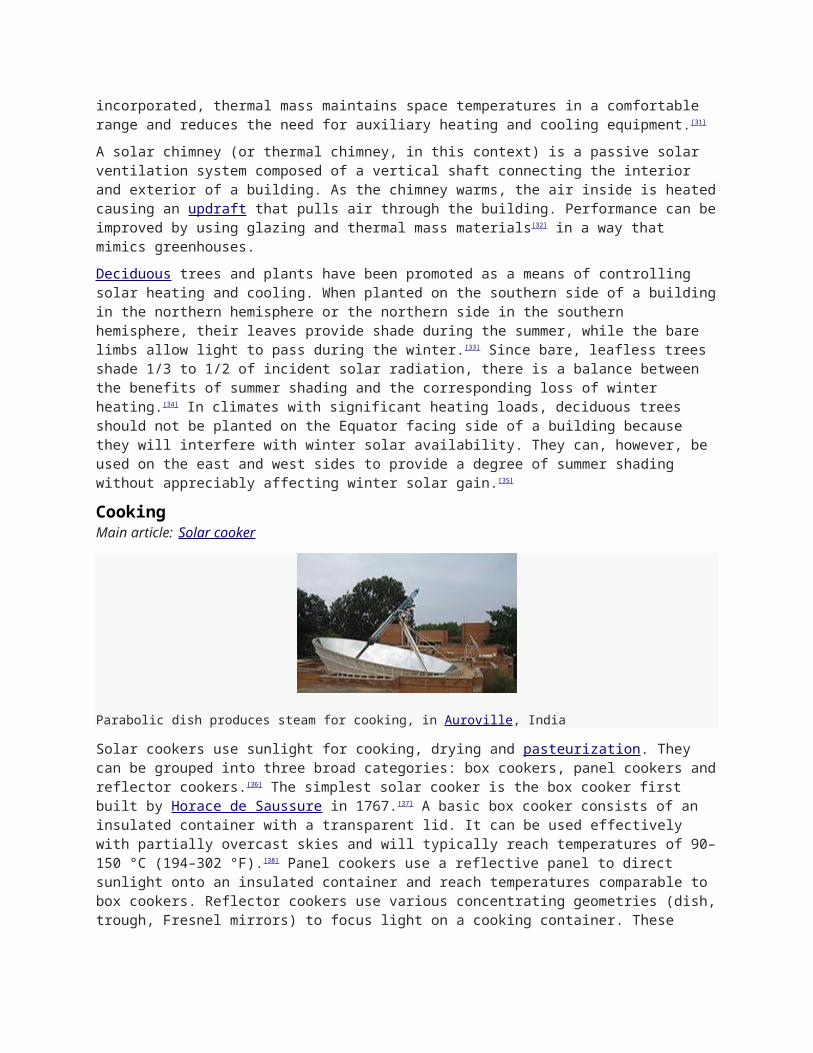
MIT's Solar House #1, built in 1939 in the U.S., used seasonal thermal energy storage for year-round heating.
Thermal mass is any material that can be used to store heat—heat from the Sun in the case of solar energy. Common thermal mass materials include stone, cement and water. Historically they have been used in arid climates or warm temperate regions to keep buildings cool by absorbing solar energy during the day and radiating stored heat to the cooler atmosphere at night. However, they can be used in cold temperate areas to maintain warmth as well. The size and placement of thermal mass depend on several factors such as climate, daylighting and shading conditions. When properly incorporated, thermal mass maintains space temperatures in a comfortable range and reduces the need for auxiliary heating and cooling equipment.[31]
A solar chimney (or thermal chimney, in this context) is a passive solar ventilation system composed of a vertical shaft connecting the interior and exterior of a building. As the chimney warms, the air inside is heated causing an updraft that pulls air through the building. Performance can be improved by using glazing and thermal mass materials[32] in a way that mimics greenhouses.
Deciduous trees and plants have been promoted as a means of controlling solar heating and cooling. When planted on the southern side of a building in the northern hemisphere or the northern side in the southern hemisphere, their leaves provide shade during the summer, while the bare limbs allow light to pass during the winter.[33] Since bare, leafless trees shade 1/3 to 1/2 of incident solar radiation, there is a balance between the benefits of summer shading and the corresponding loss of winter heating.[34] In climates with significant heating loads, deciduous trees should not be planted on the Equator facing side of a building because they will interfere with winter solar availability. They can, however, be used on the east and west sides to provide a degree of summer shading without appreciably affecting winter solar gain.[35]
CookingMain article: Solar cooker
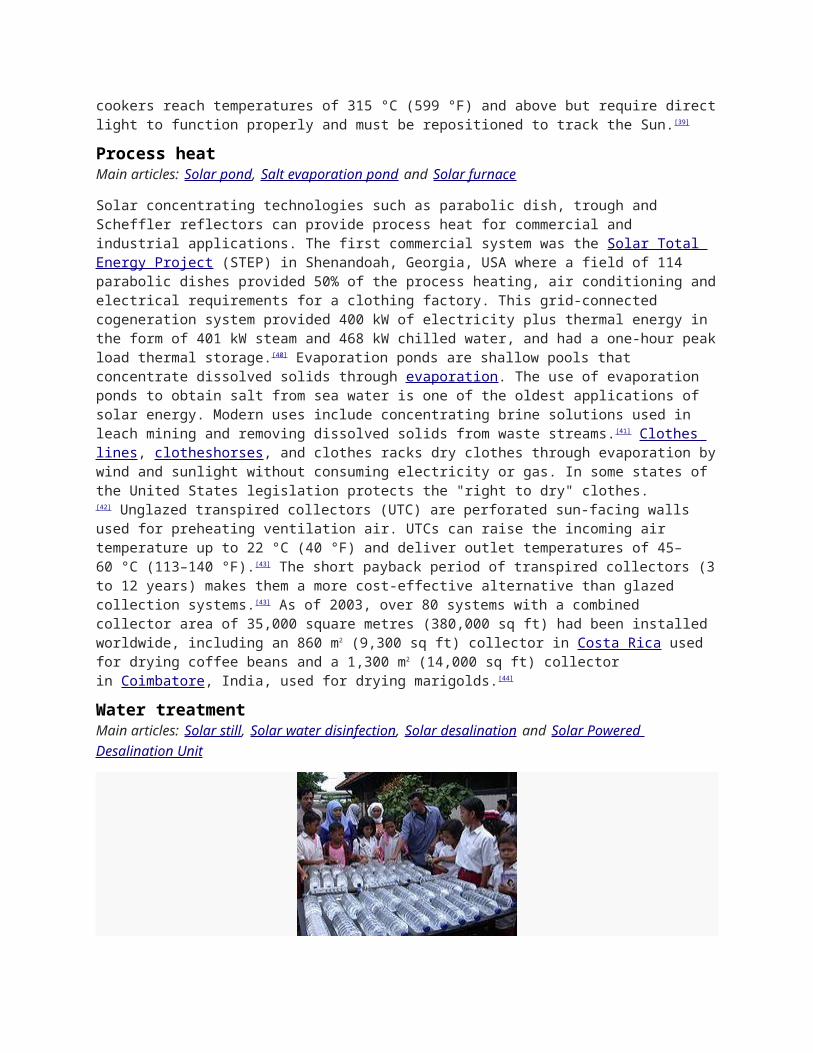
Parabolic dish produces steam for cooking, in Auroville, India
Solar cookers use sunlight for cooking, drying and pasteurization. They can be grouped into three broad categories: box cookers, panel cookers and reflector cookers. [36] The simplest solar cooker is the box cooker first built by Horace de Saussure in 1767.[37] A basic box cooker consists of an insulated container with a transparent lid. It can be used effectively with partially overcast skies and will typically reach temperatures of 90–150 °C (194–302 °F).[38] Panel cookers use a reflective panel to direct sunlight onto an insulated container and reach temperatures comparable to box cookers. Reflector cookers use various concentrating geometries (dish, trough, Fresnel mirrors) to focus light on a cooking container. These cookers reach temperatures of 315 °C (599 °F) and above but require direct light to function properly and must be repositioned to track the Sun. [39]
Process heatMain articles: Solar pond, Salt evaporation pond and Solar furnace
Solar concentrating technologies such as parabolic dish, trough and Scheffler reflectors can provide process heat for commercial and industrial applications. The first commercial system was the Solar Total Energy Project (STEP) in Shenandoah, Georgia, USA where a field of 114 parabolic dishes provided 50% of the process heating, air conditioning and electrical requirements for a clothing
factory. This grid-connected cogeneration system provided 400 kW of electricity plus thermal energy in the form of 401 kW steam and 468 kW chilled water, and had a one-hour peak load thermal storage.[40] Evaporation ponds are shallow pools that concentrate dissolved solids through evaporation. The use of evaporation ponds to obtain salt from sea water is one of the oldest applications of solar energy. Modern uses include concentrating brine solutions used in leach mining and removing dissolved solids from waste streams.[41] Clothes lines, clotheshorses, and clothes racks dry clothes through evaporation by wind and sunlight without consuming electricity or gas. In some states of the United States legislation protects the "right to dry" clothes. [42] Unglazed transpired collectors (UTC) are perforated sun-facing walls used for preheating ventilation air. UTCs can raise the incoming air temperature up to 22 °C (40 °F) and deliver outlet temperatures of 45–60 °C (113–140 °F).[43] The short payback period of transpired collectors (3 to 12 years) makes them a more cost-effective alternative than glazed collection systems.[43] As of 2003, over 80 systems with a combined collector area of 35,000 square metres (380,000 sq ft) had been installed worldwide, including an 860 m2 (9,300 sq ft) collector in Costa Rica used for drying coffee beans and a 1,300 m2 (14,000 sq ft) collector in Coimbatore, India, used for drying marigolds.[44]
Water treatmentMain articles: Solar still, Solar water disinfection, Solar desalination and Solar Powered Desalination Unit
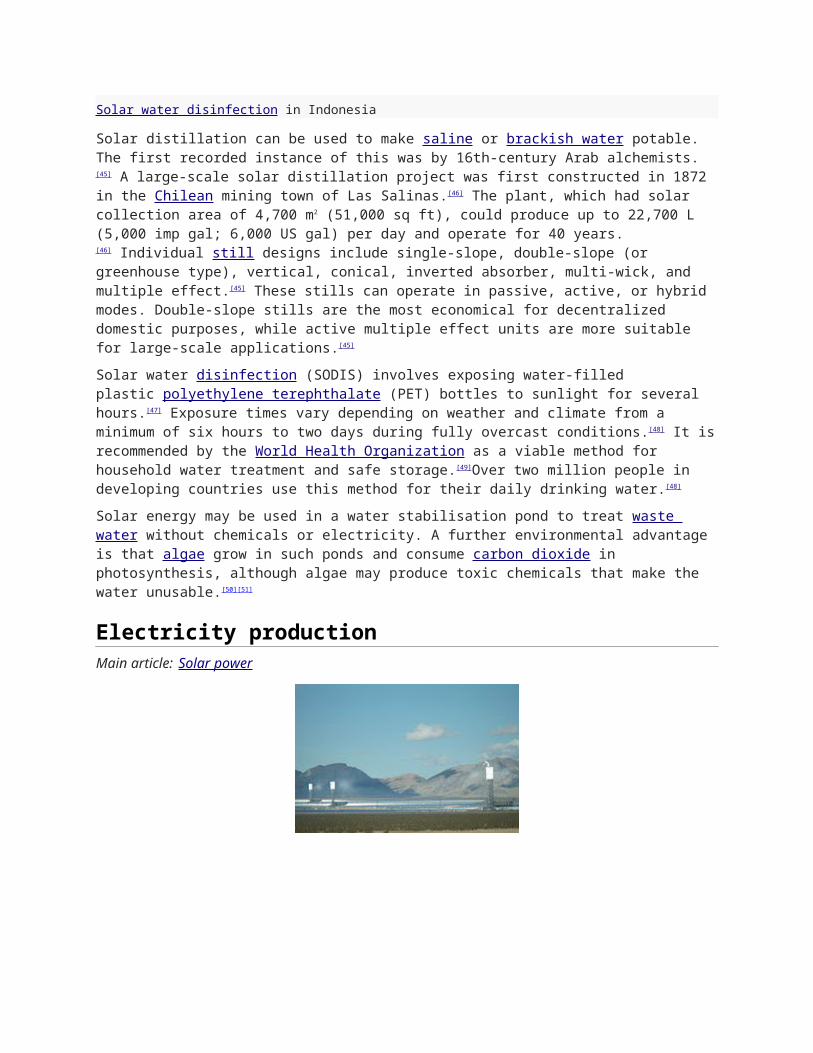
Solar water disinfection in Indonesia
Solar distillation can be used to make saline or brackish water potable. The first recorded instance of this was by 16th-century Arab alchemists.[45] A large-scale solar distillation project was first constructed in 1872 in the Chilean mining town of Las Salinas.[46] The plant, which had solar collection area of 4,700 m2 (51,000 sq ft), could produce up to 22,700 L (5,000 imp gal; 6,000 US gal) per day and operate for 40 years.[46] Individual still designs include single-slope, double-slope (or greenhouse type), vertical, conical, inverted absorber, multi-wick, and multiple effect.[45] These stills can operate in passive, active, or hybrid modes. Double-slope stills are the most economical for decentralized domestic purposes, while active multiple effect units are more suitable for large-scale applications.[45]
Solar water disinfection (SODIS) involves exposing water-filled plastic polyethylene terephthalate (PET) bottles to sunlight for several hours.[47] Exposure times vary depending on weather and climate from a minimum of six hours to two days during fully overcast conditions. [48] It is recommended by the World Health Organization as a viable method for household water treatment and safe storage.[49]Over two million people in developing countries use this method for their daily drinking water.[48]
Solar energy may be used in a water stabilisation pond to treat waste water without chemicals or electricity. A further environmental advantage is that algae grow in such ponds and consume carbon dioxide in photosynthesis, although algae may produce toxic chemicals that make the water unusable.[50][51]
Electricity productionMain article: Solar power
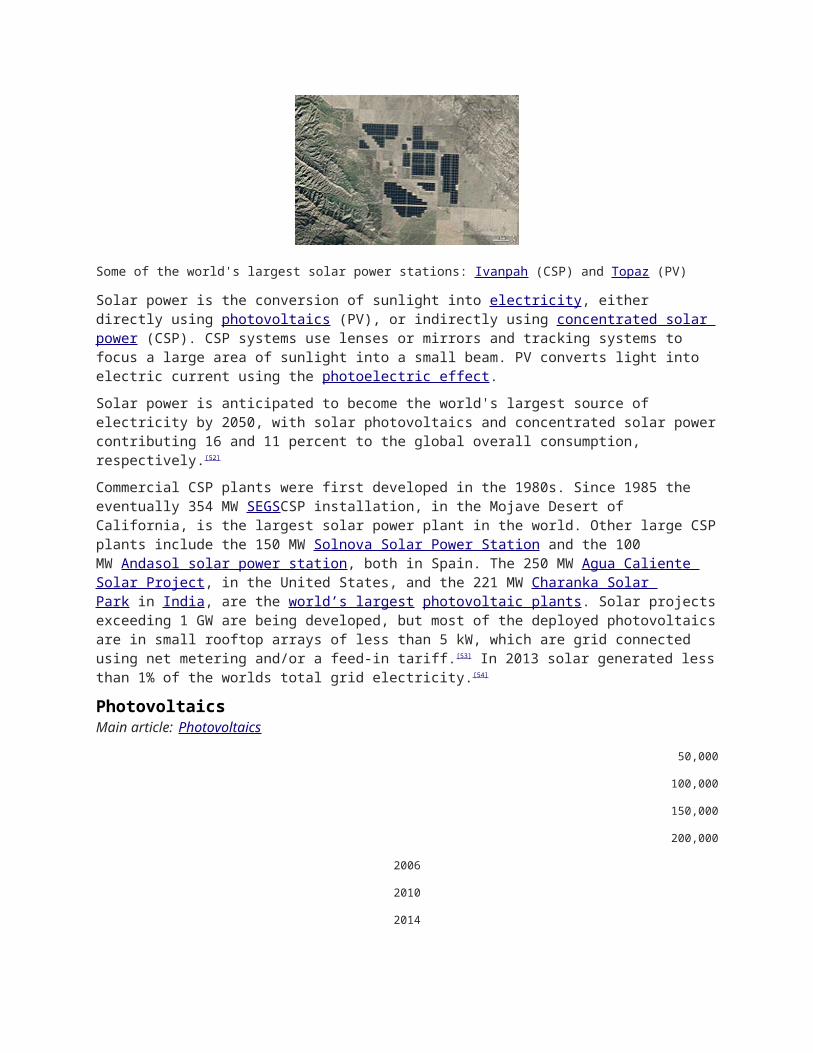
Some of the world's largest solar power stations: Ivanpah (CSP) and Topaz (PV)
Solar power is the conversion of sunlight into electricity, either directly using photovoltaics (PV), or indirectly using concentrated solar power (CSP). CSP systems use lenses or mirrors and tracking systems to focus a large area of sunlight into a small beam. PV converts light into electric current using the photoelectric effect.
Solar power is anticipated to become the world's largest source of electricity by 2050, with solar photovoltaics and concentrated solar power contributing 16 and 11 percent to the global overall consumption, respectively.[52]
Commercial CSP plants were first developed in the 1980s. Since 1985 the eventually 354 MW SEGSCSP installation, in the Mojave Desert of California, is the largest solar power plant in the world. Other large CSP plants include the 150 MW Solnova Solar Power Station and the 100 MW Andasol solar power station, both in Spain. The 250 MW Agua Caliente Solar Project, in the United States, and the 221 MW Charanka Solar Park in India, are the world’s largest photovoltaic plants. Solar projects exceeding 1 GW are being developed, but most of the deployed photovoltaics are in small rooftop arrays of less than 5 kW, which are grid connected using net metering and/or a feed-in tariff.[53] In 2013 solar generated less than 1% of the worlds total grid electricity.[54]
PhotovoltaicsMain article: Photovoltaics
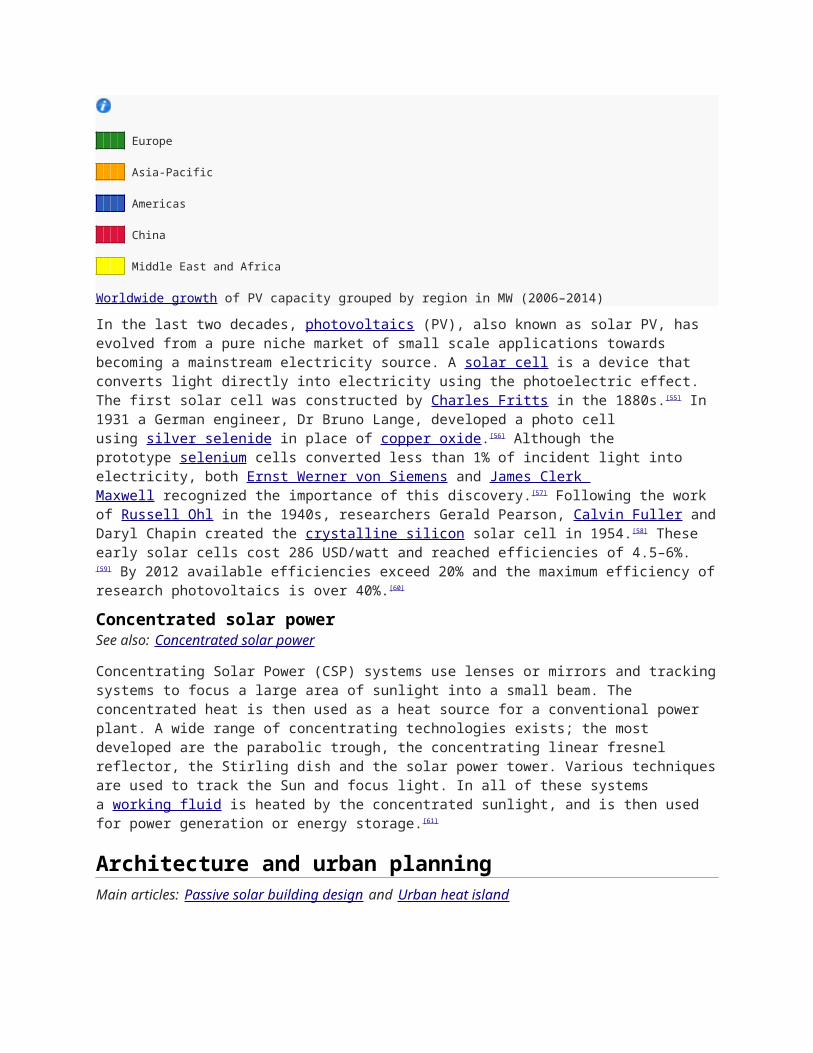
50,000
100,000
150,000
200,000
2006
2010
2014
Europe
Asia-Pacific
Americas
China
Middle East and Africa
Worldwide growth of PV capacity grouped by region in MW (2006–2014)
In the last two decades, photovoltaics (PV), also known as solar PV, has evolved from a pure niche market of small scale applications towards becoming a mainstream electricity source. A solar cell is a device that converts light directly into electricity using the photoelectric effect. The first solar cell was constructed by Charles Fritts in the 1880s.[55] In 1931 a German engineer, Dr Bruno Lange, developed a photo cell using silver selenide in place of copper oxide.[56] Although the prototype selenium cells converted less than 1% of incident light into electricity, both Ernst Werner von Siemens and James Clerk Maxwell recognized the importance of this discovery.[57] Following the work of Russell Ohl in the 1940s, researchers Gerald Pearson, Calvin Fuller and Daryl Chapin created the crystalline silicon solar cell in 1954.[58] These early solar cells cost 286 USD/watt and reached efficiencies of 4.5–6%.[59] By 2012 available efficiencies exceed 20% and the maximum efficiency of research photovoltaics is over 40%.[60]
Concentrated solar powerSee also: Concentrated solar power
Concentrating Solar Power (CSP) systems use lenses or mirrors and tracking systems to focus a large area of sunlight into a small beam. The concentrated heat is then used as a heat source for a conventional power plant. A wide range of concentrating technologies exists; the most developed are the parabolic trough, the concentrating linear fresnel reflector, the Stirling dish and the solar power tower. Various techniques are used to track the Sun and focus light. In all of these systems a working fluid is heated by the concentrated sunlight, and is then used for power generation or energy storage.[61]
Architecture and urban planningMain articles: Passive solar building design and Urban heat island
Darmstadt University of Technology, Germany, won the 2007 Solar Decathlon in Washington, D.C. with
thispassive house designed for humid and hot subtropical climate.[62]
Sunlight has influenced building design since the beginning of architectural history. [63] Advanced solar architecture and urban planning methods were first employed by the Greeks and Chinese, who oriented their buildings toward the south to provide light and warmth. [64]
The common features of passive solar architecture are orientation relative to the Sun, compact proportion (a low surface area to volume ratio), selective shading (overhangs) and thermal mass.[63] When these features are tailored to the local climate and environment they can produce well-lit spaces that stay in a comfortable temperature range. Socrates' Megaron House is a classic example of passive solar design.[63] The most recent approaches to solar design use computer modeling tying together solar lighting, heating and ventilationsystems in an integrated solar design package.[65] Active solar equipment such as pumps, fans and switchable windows can complement passive design and improve system performance.
Urban heat islands (UHI) are metropolitan areas with higher temperatures than that of the surrounding environment. The higher temperatures are a result of increased absorption of the Solar light by urban materials such as asphalt and concrete, which have loweralbedos and higher heat capacities than those in the natural environment. A straightforward method of counteracting the UHI effect is to paint buildings and roads white and plant trees. Using these methods, a hypothetical "cool communities" program in Los Angeles has projected that urban temperatures could be reduced by approximately 3 °C at an estimated cost of US$1 billion, giving estimated total annual benefits of US$530 million from reduced air-conditioning costs and healthcare savings.[66]
Agriculture and horticulture
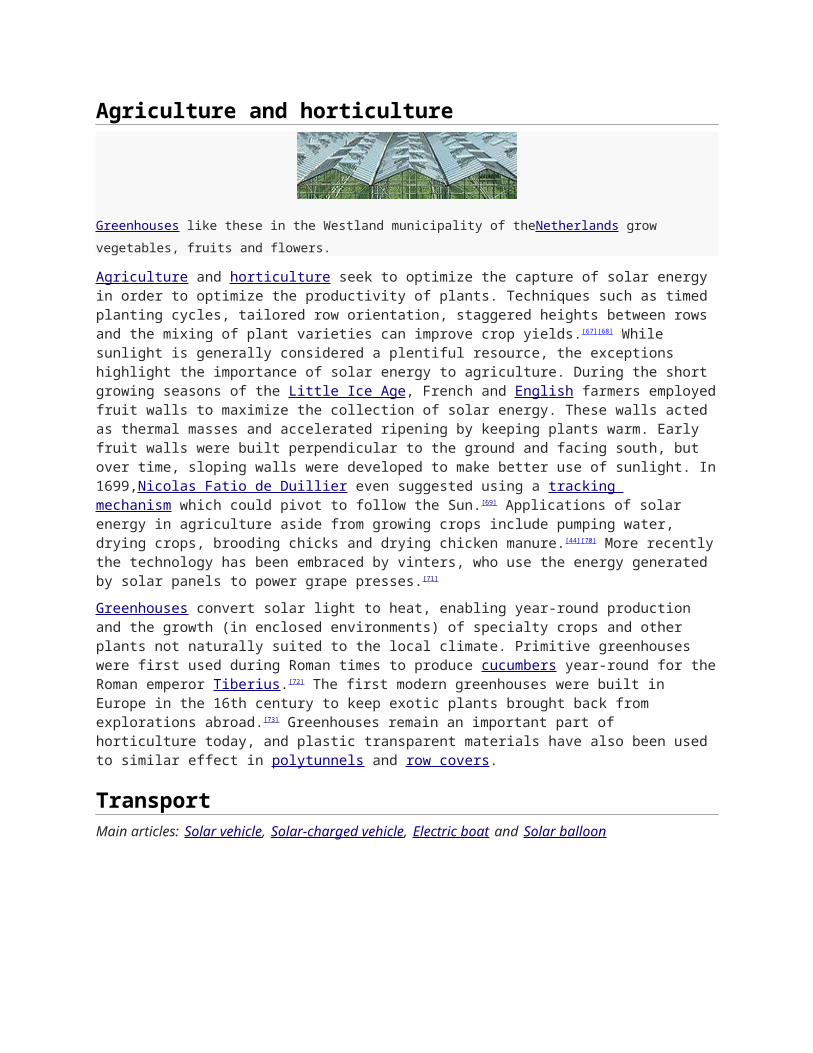
Greenhouses like these in the Westland municipality of theNetherlands grow vegetables, fruits and flowers.
Agriculture and horticulture seek to optimize the capture of solar energy in order to optimize the productivity of plants. Techniques such as timed planting cycles, tailored row orientation, staggered heights between rows and the mixing of plant varieties can improve crop yields. [67][68] While sunlight is generally considered a plentiful resource, the exceptions highlight the importance of solar energy to agriculture. During the short growing seasons of the Little Ice Age, French and English farmers employed fruit walls to maximize the collection of solar energy. These walls acted as thermal masses and accelerated ripening by keeping plants warm. Early fruit walls were built perpendicular to the ground and facing south, but over time, sloping walls were developed to make better use of sunlight. In 1699,Nicolas Fatio de Duillier even suggested using a tracking mechanism which could pivot to follow the Sun.[69] Applications of solar energy in agriculture aside from growing crops include pumping water, drying crops, brooding chicks and drying chicken manure. [44][70] More recently the technology has been embraced by vinters, who use the energy generated by solar panels to power grape presses.[71]
Greenhouses convert solar light to heat, enabling year-round production and the growth (in enclosed environments) of specialty crops and other plants not naturally suited to the local climate. Primitive greenhouses were first used during Roman times to produce cucumbers year-round for the Roman emperor Tiberius.[72] The first modern greenhouses were built in Europe in the 16th century to keep exotic plants brought back from explorations abroad.[73] Greenhouses remain an important part of
horticulture today, and plastic transparent materials have also been used to similar effect in polytunnels and row covers.
TransportMain articles: Solar vehicle, Solar-charged vehicle, Electric boat and Solar balloon
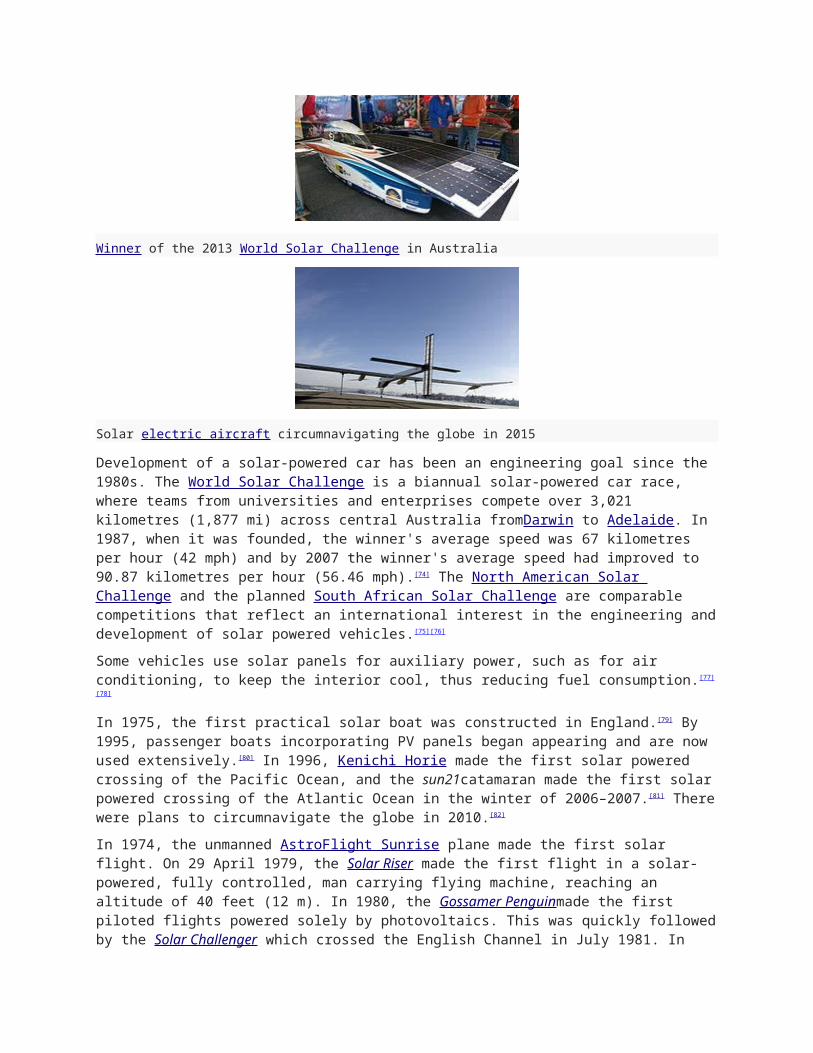
Winner of the 2013 World Solar Challenge in Australia
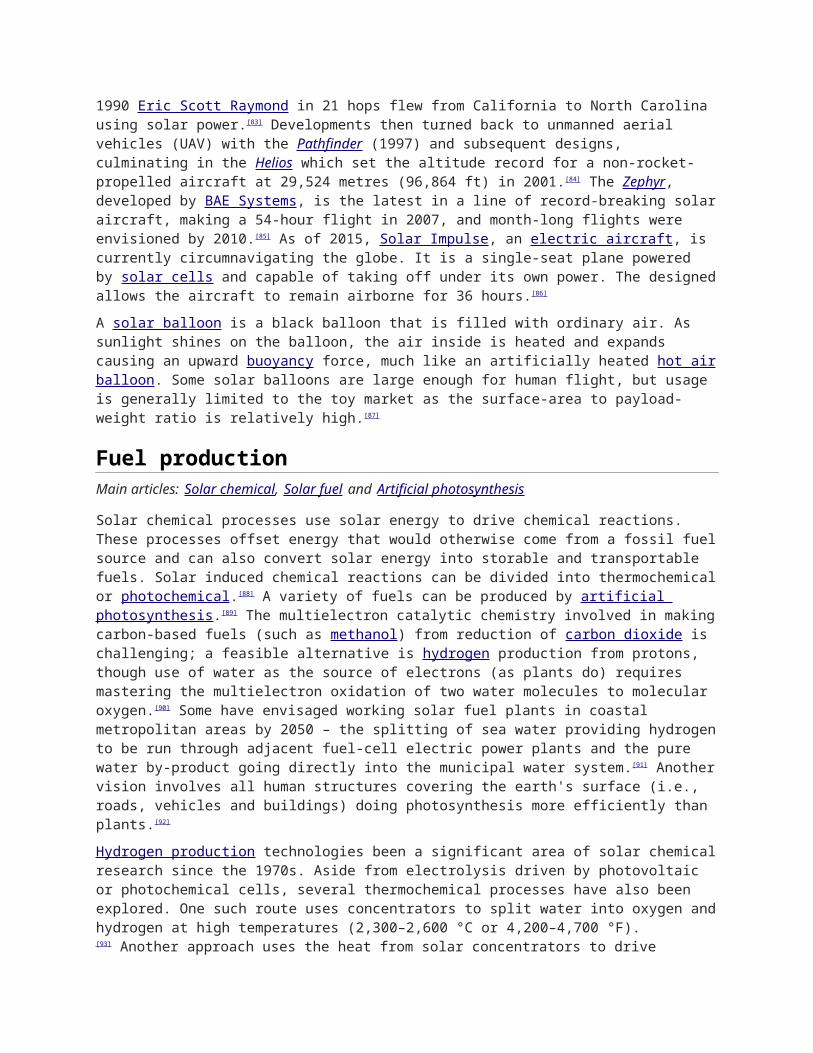
Solar electric aircraft circumnavigating the globe in 2015
Development of a solar-powered car has been an engineering goal since the 1980s. The World Solar Challenge is a biannual solar-powered car race, where teams from universities and enterprises compete over 3,021 kilometres (1,877 mi) across central Australia fromDarwin to Adelaide. In 1987, when it was founded, the winner's average speed was 67 kilometres per hour (42 mph) and by 2007 the winner's average speed had improved to 90.87 kilometres per hour (56.46 mph).[74] The North American Solar Challenge and the planned South African Solar Challenge are comparable competitions that reflect an international interest in the engineering and development of solar powered vehicles.[75][76]
Some vehicles use solar panels for auxiliary power, such as for air conditioning, to keep the interior cool, thus reducing fuel consumption.[77][78]
In 1975, the first practical solar boat was constructed in England.[79] By 1995, passenger boats incorporating PV panels began appearing and are now used extensively. [80] In 1996, Kenichi Horie made the first solar powered crossing of the Pacific Ocean, and the sun21catamaran made the first solar powered crossing of the Atlantic Ocean in the winter of 2006–2007. [81] There were plans to circumnavigate the globe in 2010.[82]
In 1974, the unmanned AstroFlight Sunrise plane made the first solar flight. On 29 April 1979, the Solar Riser made the first flight in a solar-powered, fully controlled, man carrying flying machine, reaching an altitude of 40 feet (12 m). In 1980, the Gossamer Penguinmade the first piloted flights powered solely by photovoltaics. This was quickly followed by the Solar Challenger which crossed the English Channel in July 1981. In 1990 Eric Scott Raymond in 21 hops flew from California to North Carolina using solar power.[83] Developments then turned back to unmanned aerial vehicles (UAV) with the Pathfinder (1997) and subsequent designs, culminating in the Helios which set the altitude record for a non-rocket-propelled aircraft at 29,524 metres (96,864 ft) in 2001.[84] The Zephyr,
developed by BAE Systems, is the latest in a line of record-breaking solar aircraft, making a 54-hour flight in 2007, and month-long flights were envisioned by 2010.[85] As of 2015, Solar Impulse, an electric aircraft, is currently circumnavigating the globe. It is a single-seat plane powered by solar cells and capable of taking off under its own power. The designed allows the aircraft to remain airborne for 36 hours.[86]
A solar balloon is a black balloon that is filled with ordinary air. As sunlight shines on the balloon, the air inside is heated and expands causing an upward buoyancy force, much like an artificially heated hot air balloon. Some solar balloons are large enough for human flight, but usage is generally limited to the toy market as the surface-area to payload-weight ratio is relatively high. [87]
Fuel productionMain articles: Solar chemical, Solar fuel and Artificial photosynthesis
Solar chemical processes use solar energy to drive chemical reactions. These processes offset energy that would otherwise come from a fossil fuel source and can also convert solar energy into storable and transportable fuels. Solar induced chemical reactions can be divided into thermochemical or photochemical.[88] A variety of fuels can be produced by artificial photosynthesis.[89] The multielectron catalytic chemistry involved in making carbon-based fuels (such as methanol) from reduction of carbon dioxide is challenging; a feasible alternative is hydrogen production from protons, though use of water as the source of electrons (as plants do) requires mastering the multielectron oxidation of two water molecules to molecular oxygen.[90] Some have envisaged working solar fuel plants in coastal metropolitan areas by 2050 – the splitting of sea water providing hydrogen to be run through adjacent fuel-cell electric power plants and the pure water by-product going directly into the municipal water system.[91] Another vision involves all human structures covering the earth's surface (i.e., roads, vehicles and buildings) doing photosynthesis more efficiently than plants.[92]
Hydrogen production technologies been a significant area of solar chemical research since the 1970s. Aside from electrolysis driven by photovoltaic or photochemical cells, several thermochemical processes have also been explored. One such route uses concentrators to split water into oxygen and hydrogen at high temperatures (2,300–2,600 °C or 4,200–4,700 °F).[93] Another approach uses the heat from solar concentrators to drive the steam reformation of natural gas thereby increasing the overall hydrogen yield compared to conventional reforming methods.[94] Thermochemical cycles characterized by the decomposition and regeneration of reactants present another avenue for hydrogen production. The Solzinc process under development at the Weizmann Institute uses a 1 MW solar furnace to decompose zinc oxide (ZnO) at temperatures above 1,200 °C (2,200 °F). This initial reaction produces pure zinc, which can subsequently be reacted with water to produce hydrogen.[95]
Energy storage methodsMain articles: Energy storage, Seasonal thermal energy storage, Phase change material, Grid energy storage and V2G

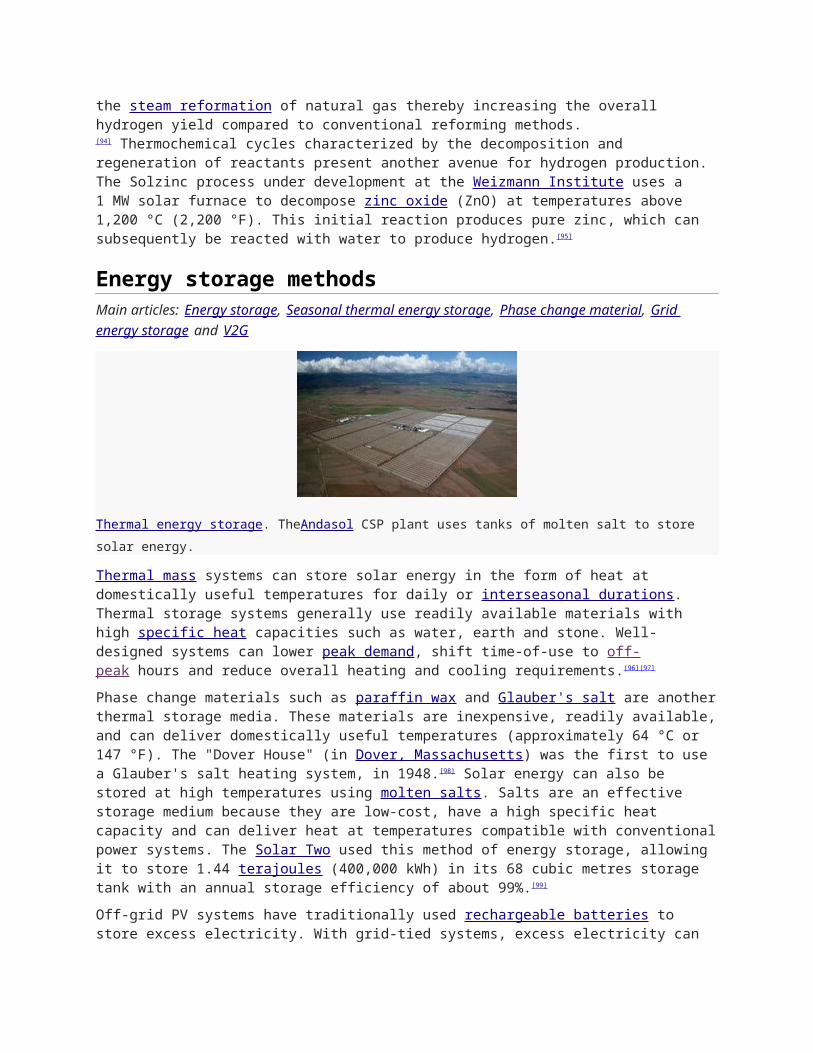
Thermal energy storage. TheAndasol CSP plant uses tanks of molten salt to store solar energy.
Thermal mass systems can store solar energy in the form of heat at domestically useful temperatures for daily or interseasonal durations. Thermal storage systems generally use readily available materials with high specific heat capacities such as water, earth and stone. Well-designed systems can lower peak demand, shift time-of-use to off-peak hours and reduce overall heating and cooling requirements.[96][97]
Phase change materials such as paraffin wax and Glauber's salt are another thermal storage media. These materials are inexpensive, readily available, and can deliver domestically useful temperatures (approximately 64 °C or 147 °F). The "Dover House" (in Dover, Massachusetts) was the first to use a Glauber's salt heating system, in 1948.[98] Solar energy can also be stored at high temperatures using molten salts. Salts are an effective storage medium because they are low-cost, have a high specific heat capacity and can deliver heat at temperatures compatible with conventional power systems. The Solar Two used this method of energy storage, allowing it to store 1.44 terajoules (400,000 kWh) in its 68 cubic metres storage tank with an annual storage efficiency of about 99%.[99]
Off-grid PV systems have traditionally used rechargeable batteries to store excess electricity. With grid-tied systems, excess electricity can be sent to the transmission grid, while standard grid electricity can be used to meet shortfalls. Net metering programs give household systems a credit for any electricity they deliver to the grid. This is handled by 'rolling back' the meter whenever the home produces more electricity than it consumes. If the net electricity use is below zero, the utility then rolls over the kilowatt hour credit to the next month.[100] Other approaches involve the use of two meters, to measure electricity consumed vs. electricity produced. This is less common due to the increased installation cost of the second meter. Most standard meters accurately measure in both directions, making a second meter unnecessary.
Pumped-storage hydroelectricity stores energy in the form of water pumped when energy is available from a lower elevation reservoir to a higher elevation one. The energy is recovered when demand is high by releasing the water, with the pump becoming a hydroelectric power generator. [101]
Development, deployment and economics
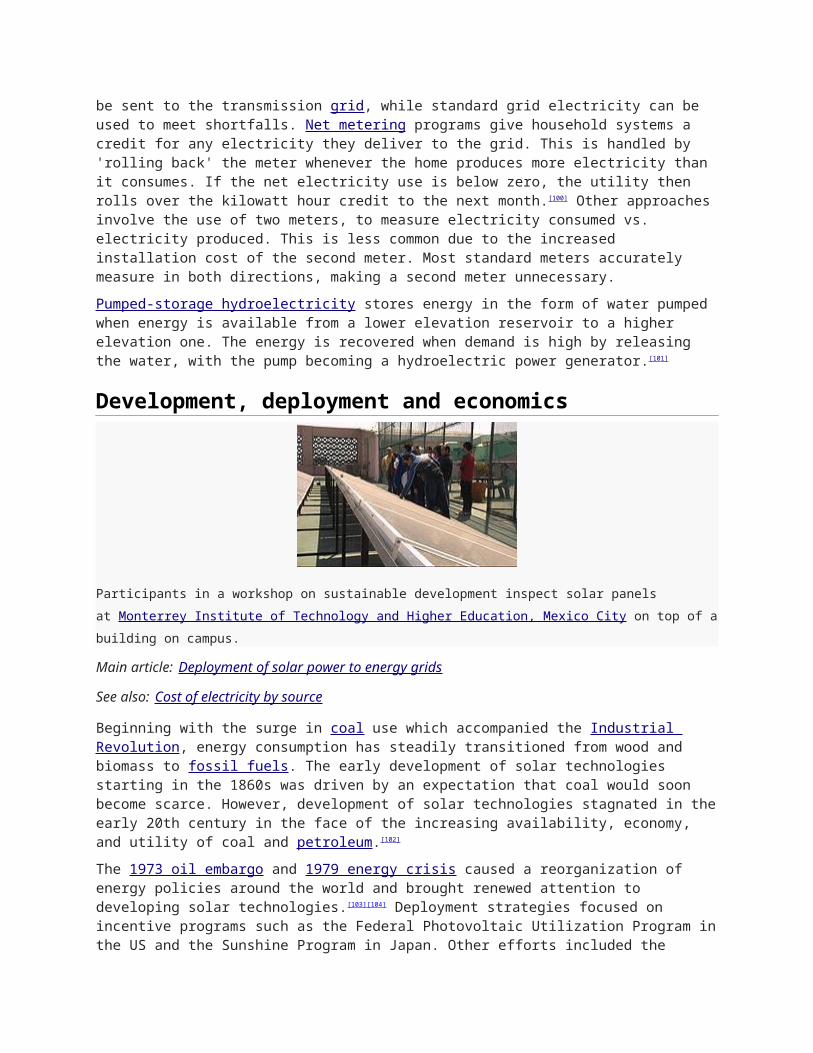
Participants in a workshop on sustainable development inspect solar panels at Monterrey Institute of
Technology and Higher Education, Mexico City on top of a building on campus.
Main article: Deployment of solar power to energy grids
See also: Cost of electricity by source
Beginning with the surge in coal use which accompanied the Industrial Revolution, energy consumption has steadily transitioned from wood and biomass to fossil fuels. The early development of solar technologies starting in the 1860s was driven by an expectation that coal would soon become scarce. However, development of solar technologies stagnated in the early 20th century in the face of the increasing availability, economy, and utility of coal and petroleum.[102]
The 1973 oil embargo and 1979 energy crisis caused a reorganization of energy policies around the world and brought renewed attention to developing solar technologies.[103][104] Deployment strategies focused on incentive programs such as the Federal Photovoltaic Utilization Program in the US and the Sunshine Program in Japan. Other efforts included the formation of research facilities in the US (SERI, now NREL), Japan (NEDO), and Germany (Fraunhofer Institute for Solar Energy Systems ISE).[105]
Commercial solar water heaters began appearing in the United States in the 1890s. [106] These systems saw increasing use until the 1920s but were gradually replaced by cheaper and more reliable heating fuels.[107] As with photovoltaics, solar water heating attracted renewed attention as a result of the oil crises in the 1970s but interest subsided in the 1980s due to falling petroleum prices. Development in the solar water heating sector progressed steadily throughout the 1990s and growth rates have averaged 20% per year since 1999.[26] Although generally underestimated, solar water heating and cooling is by far the most widely deployed solar technology with an estimated capacity of 154 GW as of 2007.[26]
The International Energy Agency has said that solar energy can make considerable contributions to solving some of the most urgent problems the world now faces:[1]
The development of affordable, inexhaustible and clean solar energy technologies will have huge longer-term benefits. It will increase countries’ energy security through reliance on an indigenous, inexhaustible and mostly import-independent resource, enhance sustainability, reduce pollution, lower the costs of mitigating climate change, and keep fossil fuel prices lower than otherwise. These advantages are global. Hence the additional costs of the incentives for early deployment should be considered learning investments; they must be wisely spent and need to be widely shared. [1]
In 2011, a report by the International Energy Agency found that solar energy technologies such as photovoltaics, solar hot water and concentrated solar power could provide a third of the world’s energy by 2060 if politicians commit to limiting climate change. The energy from the sun could play a key role in de-carbonizing the global economy alongside improvements in energy efficiency and imposing costs on greenhouse gas emitters. "The strength of solar is the incredible variety and flexibility of applications, from small scale to big scale".[108]
We have proved ... that after our stores of oil and coal are exhausted the human race can receive unlimited power from the rays of the sun.
— Frank Shuman, New York Times, July 2, 1916[23]
ISO standardsThe International Organization for Standardization has established a number of standards relating to solar energy equipment. For example, ISO 9050 relates to glass in building while ISO 10217 relates to the materials used in solar water heaters.
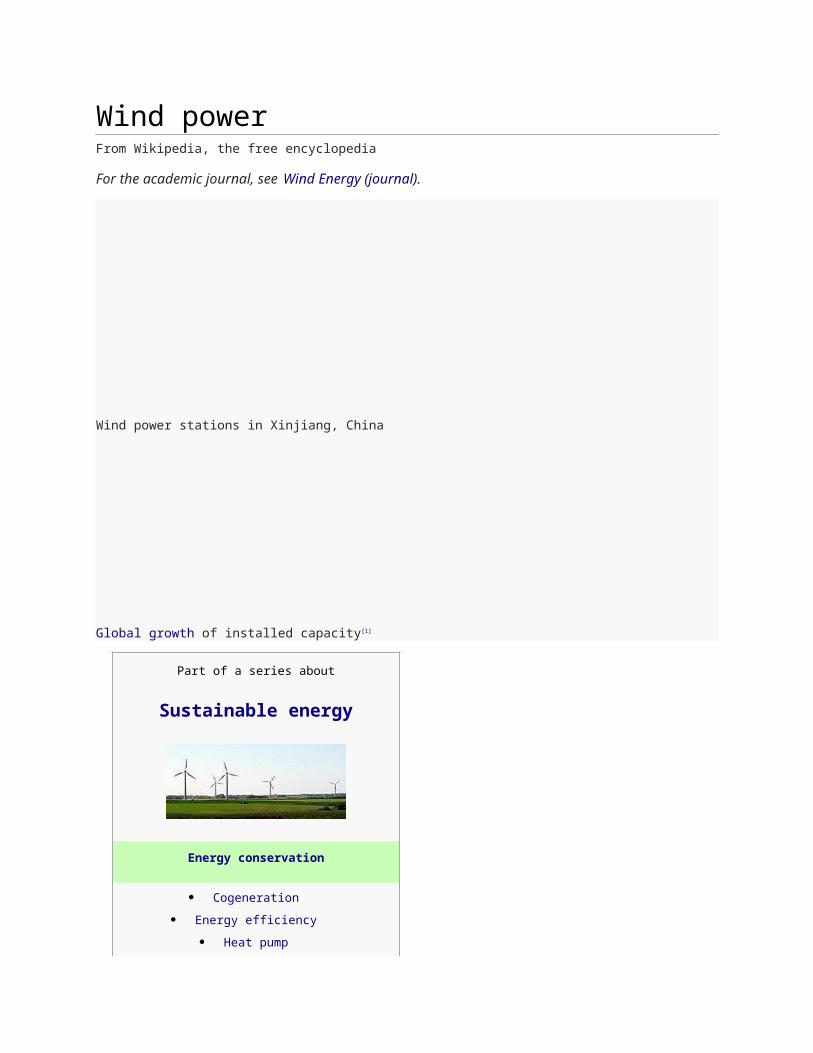
Wind powerFrom Wikipedia, the free encyclopedia
For the academic journal, see Wind Energy (journal).
Wind power stations in Xinjiang, China
Global growth of installed capacity[1]
Part of a series about
Sustainable energy
Energy conservation
Cogeneration
Energy efficiency
Heat pump
Green building
Low-carbon power
Microgeneration
Passive solar
Renewable energy
Anaerobic digestion
Geothermal
Hydroelectricity
Solar
Tidal
Wind
Sustainable transport
Carbon-neutral fuel
Electric vehicle
Fossil-fuel phase-out
Green vehicle
Plug-in hybrid
Sustainable development portal
Renewable energy portal
Environment portal
v
t
e
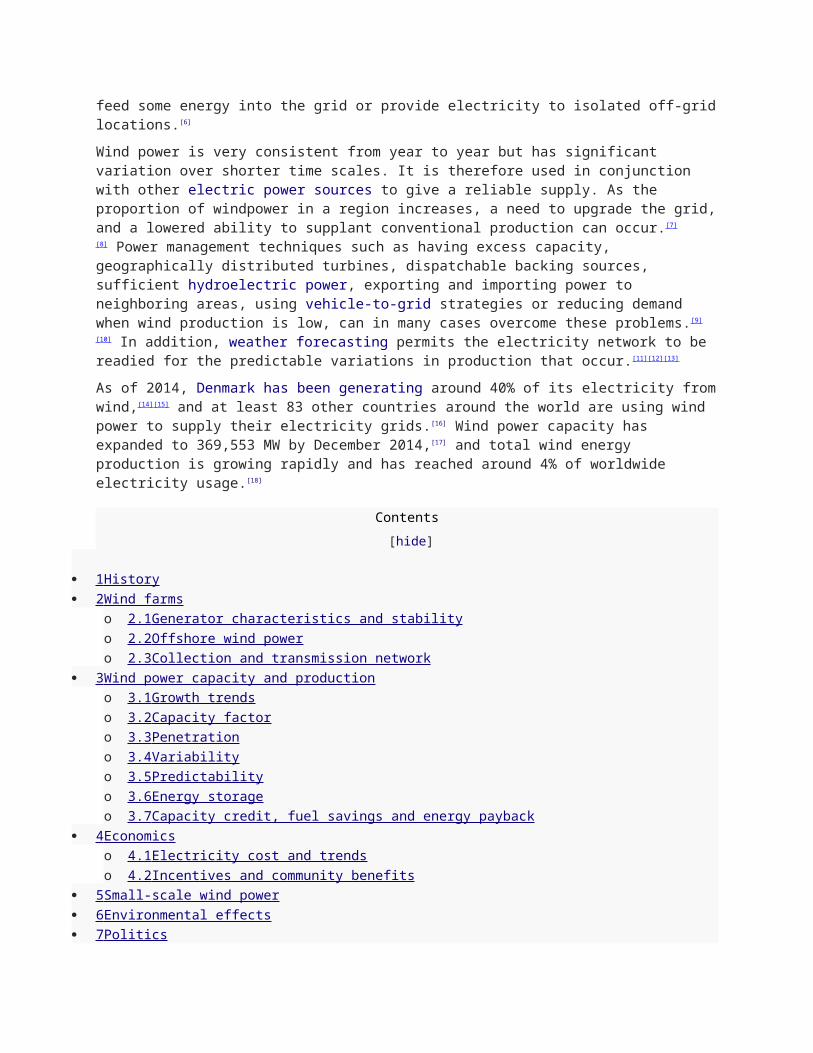
Wind power is extracted from air flow using wind turbines or sails to produce mechanical or electrical power. Windmills are used for their mechanical power, windpumps for water pumping, and sails to propel ships. Wind power as an alternative tofossil fuels, is plentiful, renewable, widely distributed, clean, produces no greenhouse gas emissions during operation, and uses little land.[2] The net effects on the environment are far less problematic than those of nonrenewable power sources.
Wind farms consist of many individual wind turbines which are connected to the electric power transmission network. Onshore wind is an inexpensive source of electricity, competitive with or in many places cheaper than coal or gas plants.[3][4][5]Offshore wind is steadier and stronger than on land, and offshore farms have less visual impact, but construction and maintenance costs are considerably higher. Small onshore wind farms can feed some energy into the grid or provide electricity to isolated off-grid locations.[6]
Wind power is very consistent from year to year but has significant variation over shorter time scales. It is therefore used in conjunction with other electric power sources to give a reliable supply. As the proportion of windpower in a region increases, a need to upgrade the grid, and a lowered
ability to supplant conventional production can occur.[7][8] Power management techniques such as having excess capacity, geographically distributed turbines, dispatchable backing sources, sufficient hydroelectric power, exporting and importing power to neighboring areas, using vehicle-to-grid strategies or reducing demand when wind production is low, can in many cases overcome these problems.[9][10] In addition, weather forecasting permits the electricity network to be readied for the predictable variations in production that occur.[11][12][13]
As of 2014, Denmark has been generating around 40% of its electricity from wind,[14][15] and at least 83 other countries around the world are using wind power to supply their electricity grids. [16] Wind power capacity has expanded to 369,553 MW by December 2014,[17] and total wind energy production is growing rapidly and has reached around 4% of worldwide electricity usage. [18]
Contents [hide]
1 History 2 Wind farms
o 2.1 Generator characteristics and stability o 2.2 Offshore wind power o 2.3 Collection and transmission network
3 Wind power capacity and production o 3.1 Growth trends o 3.2 Capacity factor o 3.3 Penetration o 3.4 Variability o 3.5 Predictability o 3.6 Energy storage o 3.7 Capacity credit, fuel savings and energy payback
4 Economics o 4.1 Electricity cost and trends o 4.2 Incentives and community benefits
5 Small-scale wind power 6 Environmental effects 7 Politics
o 7.1 Central government o 7.2 Public opinion o 7.3 Community
8 Turbine design 9 Wind energy 10 Gallery 11 See also 12 Notes 13 References 14 Further reading 15 External links
History[edit]Main article: History of wind power
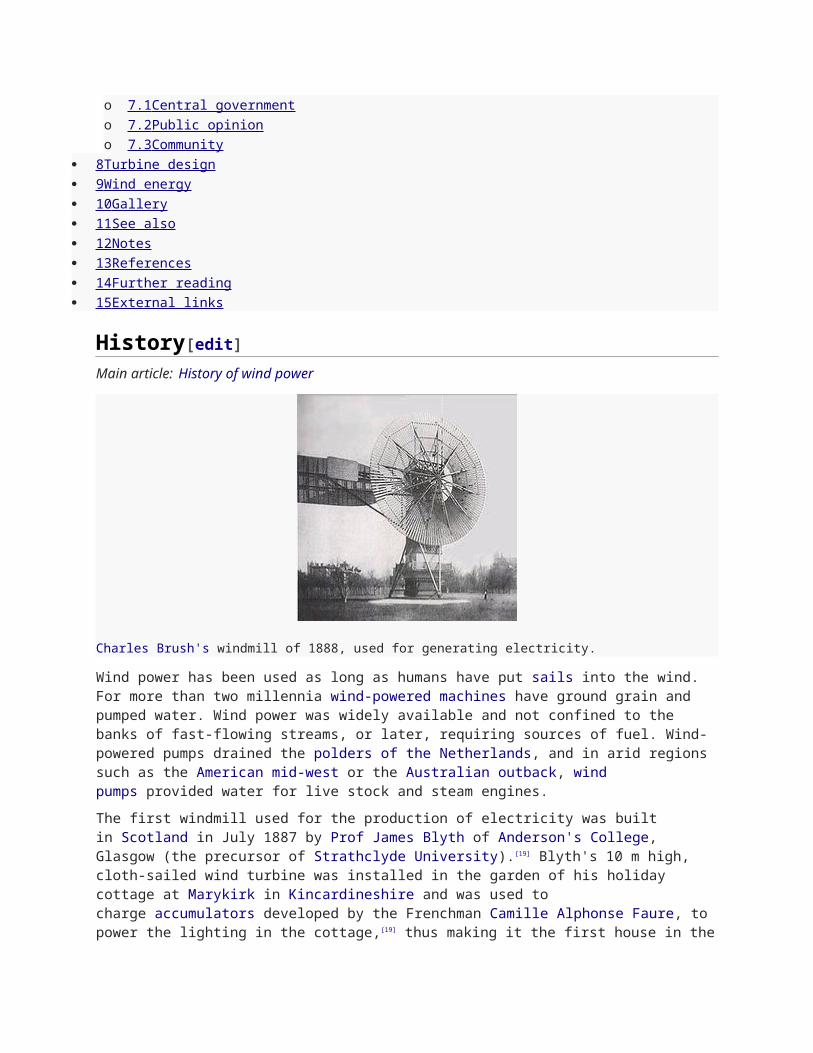
Charles Brush's windmill of 1888, used for generating electricity.
Wind power has been used as long as humans have put sails into the wind. For more than two millennia wind-powered machines have ground grain and pumped water. Wind power was widely available and not confined to the banks of fast-flowing streams, or later, requiring sources of fuel. Wind-powered pumps drained the polders of the Netherlands, and in arid regions such as the American mid-west or the Australian outback, wind pumps provided water for live stock and steam engines.
The first windmill used for the production of electricity was built in Scotland in July 1887 by Prof James Blyth of Anderson's College, Glasgow (the precursor of Strathclyde University).[19] Blyth's 10 m high, cloth-sailed wind turbine was installed in the garden of his holiday cottage at Marykirk in Kincardineshire and was used to charge accumulators developed by the Frenchman Camille Alphonse Faure, to power the lighting in the cottage,[19] thus making it the first house in the world to have its electricity supplied by wind power.[20] Blyth offered the surplus electricity to the people of Marykirk for lighting the main street, however, they turned down the offer as they thought electricity was "the work of the devil."[19] Although he later built a wind turbine to supply emergency power to the local Lunatic Asylum, Infirmary and Dispensary of Montrose the invention never really caught on as the technology was not considered to be economically viable. [19]
Across the Atlantic, in Cleveland, Ohio a larger and heavily engineered machine was designed and constructed in the winter of 1887–1888 by Charles F. Brush,[21] this was built by his engineering company at his home and operated from 1886 until 1900.[22] The Brush wind turbine had a rotor 17 m (56 foot) in diameter and was mounted on an 18 m (60 foot) tower. Although large by today's standards, the machine was only rated at 12 kW. The connected dynamo was used either to charge a bank of batteries or to operate up to 100 incandescent light bulbs, three arc lamps, and various motors in Brush's laboratory.[23]
With the development of electric power, wind power found new applications in lighting buildings remote from centrally-generated power. Throughout the 20th century parallel paths developed small wind stations suitable for farms or residences, and larger utility-scale wind generators that could be connected to electricity grids for remote use of power. Today wind powered generators operate in every size range between tiny stations for battery charging at isolated residences, up to near-gigawatt sized offshore wind farms that provide electricity to national electrical networks.
Wind farms[edit]Main articles: Wind farm and List of onshore wind farms
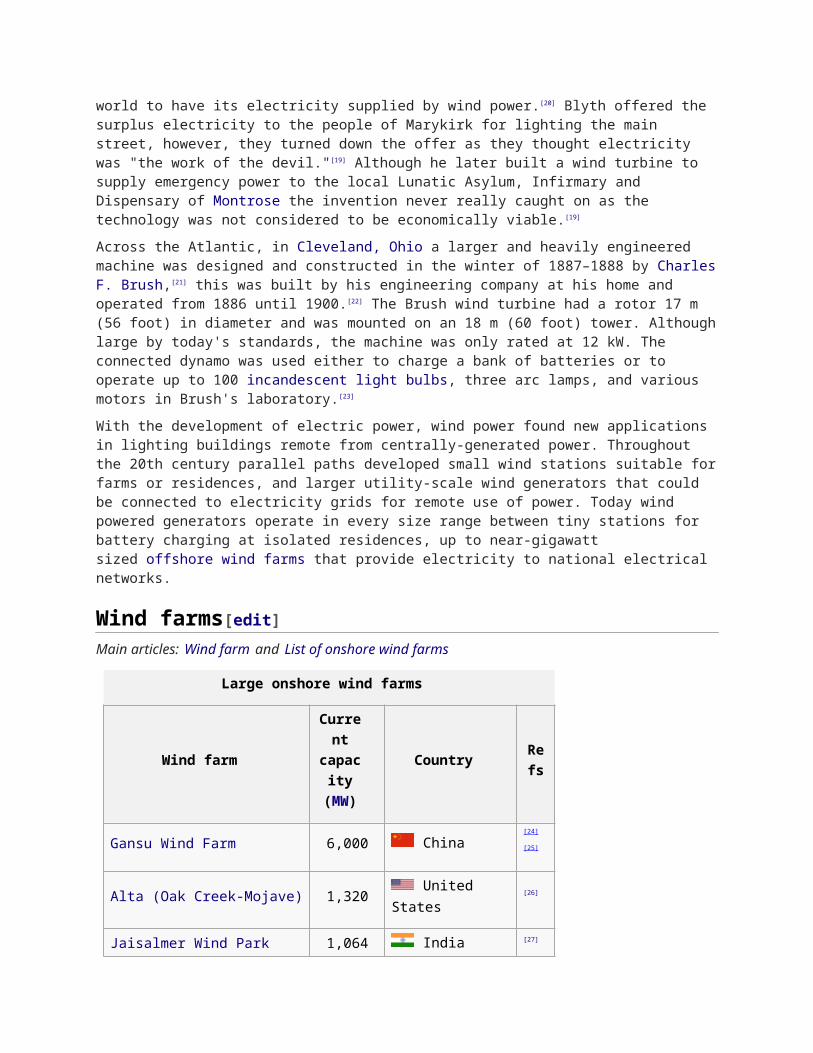
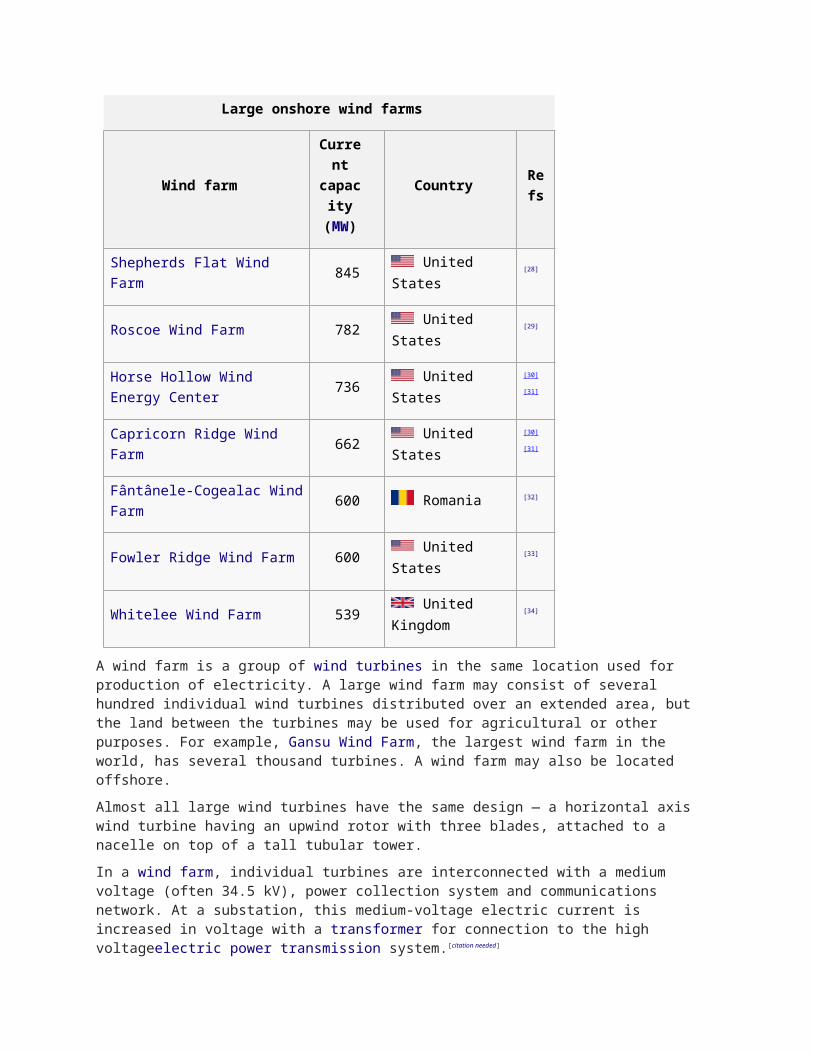
Large onshore wind farms
Wind farmCurrentcapacity
(MW)Country Refs
Gansu Wind Farm 6,000 China [24][25]
Alta (Oak Creek-Mojave) 1,320 United States [26]
Jaisalmer Wind Park 1,064 India [27]
Shepherds Flat Wind Farm 845 United States [28]
Roscoe Wind Farm 782 United States [29]
Horse Hollow Wind Energy Center 736 United States [30][31]
Capricorn Ridge Wind Farm 662 United States [30][31]
Fântânele-Cogealac Wind Farm 600 Romania [32]
Fowler Ridge Wind Farm 600 United States [33]
Whitelee Wind Farm 539 United Kingdom [34]
A wind farm is a group of wind turbines in the same location used for production of electricity. A large wind farm may consist of several hundred individual wind turbines distributed over an extended area, but the land between the turbines may be used for agricultural or other purposes. For example, Gansu Wind Farm, the largest wind farm in the world, has several thousand turbines. A wind farm may also be located offshore.
Almost all large wind turbines have the same design — a horizontal axis wind turbine having an upwind rotor with three blades, attached to a nacelle on top of a tall tubular tower.
In a wind farm, individual turbines are interconnected with a medium voltage (often 34.5 kV), power collection system and communications network. At a substation, this medium-voltage electric current is increased in voltage with a transformer for connection to the high voltageelectric power transmission system.[citation needed]
Generator characteristics and stability[edit]Induction generators, which were often used for wind power projects in the 1980s and 1990s, require reactive power for excitation so substations used in wind-power collection systems include substantial capacitor banks for power factor correction. Different types of wind turbine generators behave differently during transmission grid disturbances, so extensive modelling of the dynamic electromechanical characteristics of a new wind farm is required by transmission system operators to ensure predictable stable behaviour during system faults. In particular, induction generators cannot support the system voltage during faults, unlike steam or hydro turbine-driven synchronous generators.
Today these generators aren't used any more in modern turbines. Instead today most turbines use variable speed generators combined with partial- or full-scale power converter between the turbine
generator and the collector system, which generally have more desirable properties for grid interconnection and have Low voltage ride through-capabilities. Modern concepts use either doubly fed machines with partial-scale converters or squirrel-cage induction generators or synchronous generators (both permanently and electrically excited) with full scale converters.[35]
Transmission systems operators will supply a wind farm developer with a grid code to specify the requirements for interconnection to the transmission grid. This will include power factor, constancy of frequency and dynamic behaviour of the wind farm turbines during a system fault.[36][37]
Offshore wind power[edit]
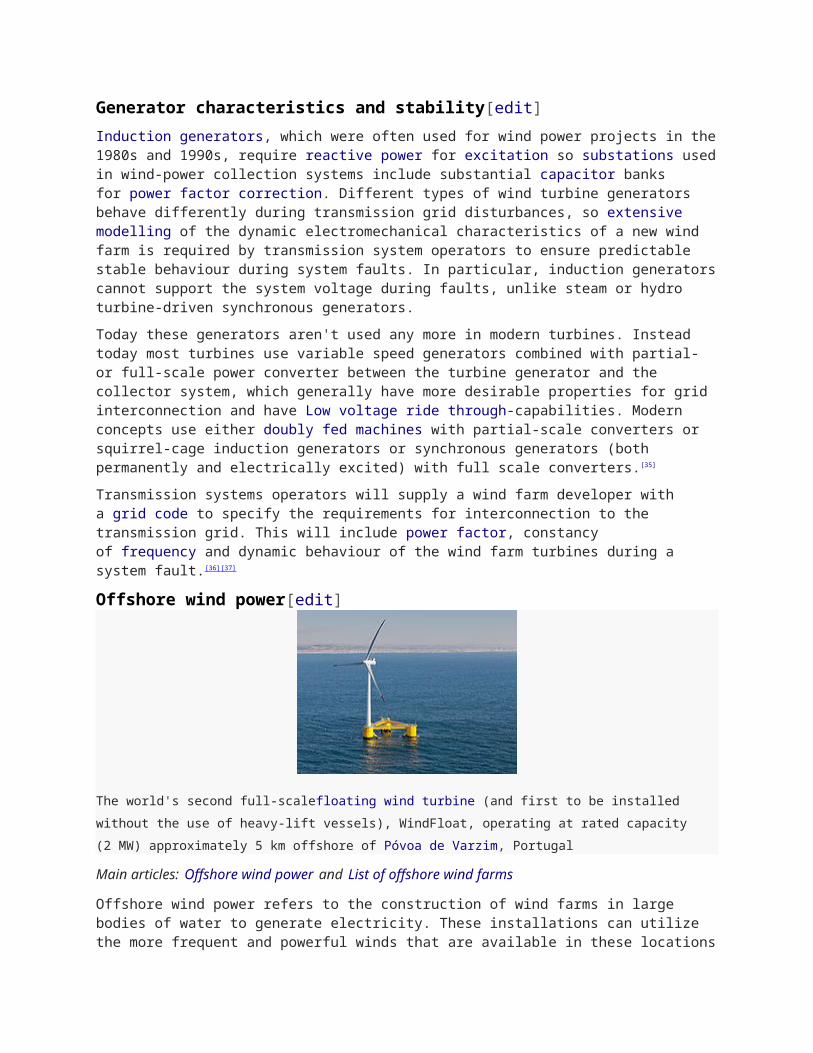
The world's second full-scalefloating wind turbine (and first to be installed without the use of heavy-lift vessels),
WindFloat, operating at rated capacity (2 MW) approximately 5 km offshore of Póvoa de Varzim, Portugal
Main articles: Offshore wind power and List of offshore wind farms
Offshore wind power refers to the construction of wind farms in large bodies of water to generate electricity. These installations can utilize the more frequent and powerful winds that are available in these locations and have less aesthetic impact on the landscape than land based projects. However, the construction and the maintenance costs are considerably higher.[38][39]
Siemens and Vestas are the leading turbine suppliers for offshore wind power. DONG Energy, Vattenfall and E.ON are the leading offshore operators.[40] As of October 2010, 3.16 GW of offshore wind power capacity was operational, mainly in Northern Europe. According to BTM Consult, more than 16 GW of additional capacity will be installed before the end of 2014 and the UK and Germany will become the two leading markets. Offshore wind power capacity is expected to reach a total of 75 GW worldwide by 2020, with significant contributions from China and the US. [40]
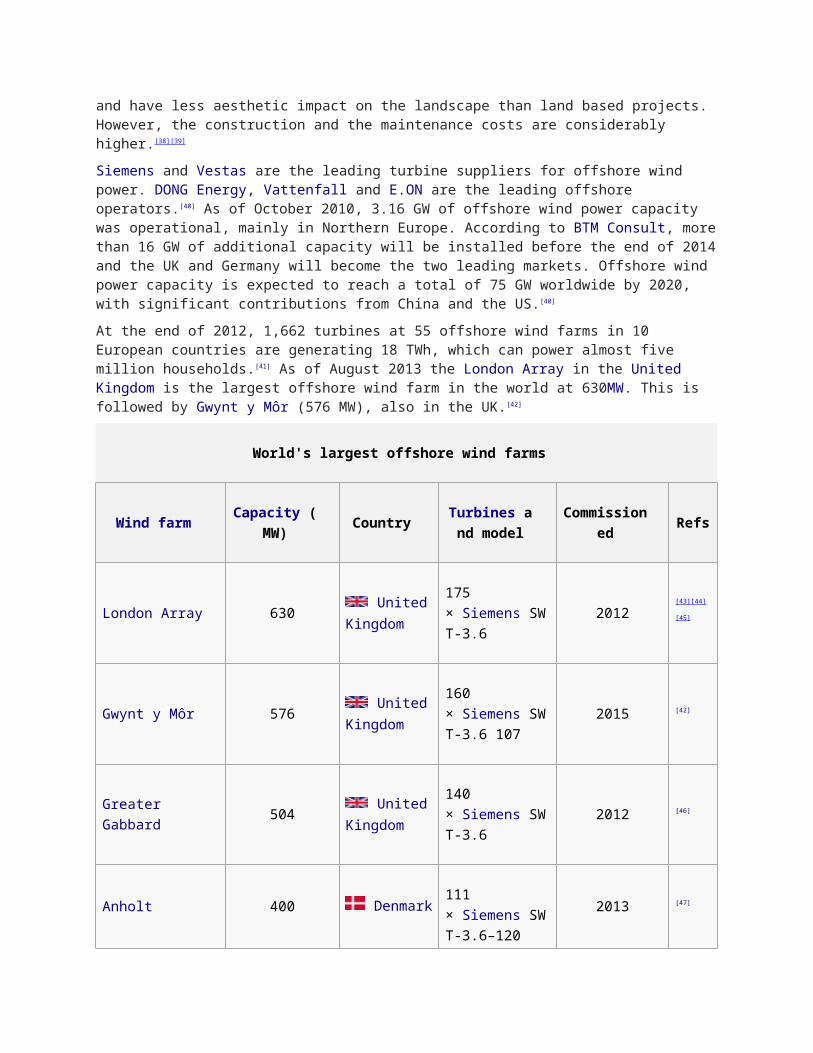
At the end of 2012, 1,662 turbines at 55 offshore wind farms in 10 European countries are generating 18 TWh, which can power almost five million households.[41] As of August 2013 the London Array in the United Kingdom is the largest offshore wind farm in the world at 630MW. This is followed by Gwynt y Môr (576 MW), also in the UK.[42]
World's largest offshore wind farms
Wind farm Capacity (MW) CountryTurbines and
modelCommissioned Refs
London Array 630 United Kingdom
175 × Siemens SWT-
2012 [43][44][45]
World's largest offshore wind farms
Wind farm Capacity (MW) CountryTurbines and
modelCommissioned Refs
3.6
Gwynt y Môr 576 United
Kingdom
160 × Siemens SWT-3.6 107
2015 [42]
Greater Gabbard 504 United
Kingdom
140 × Siemens SWT-3.6
2012 [46]
Anholt 400 Denmark111 × Siemens SWT-3.6–120
2013 [47]
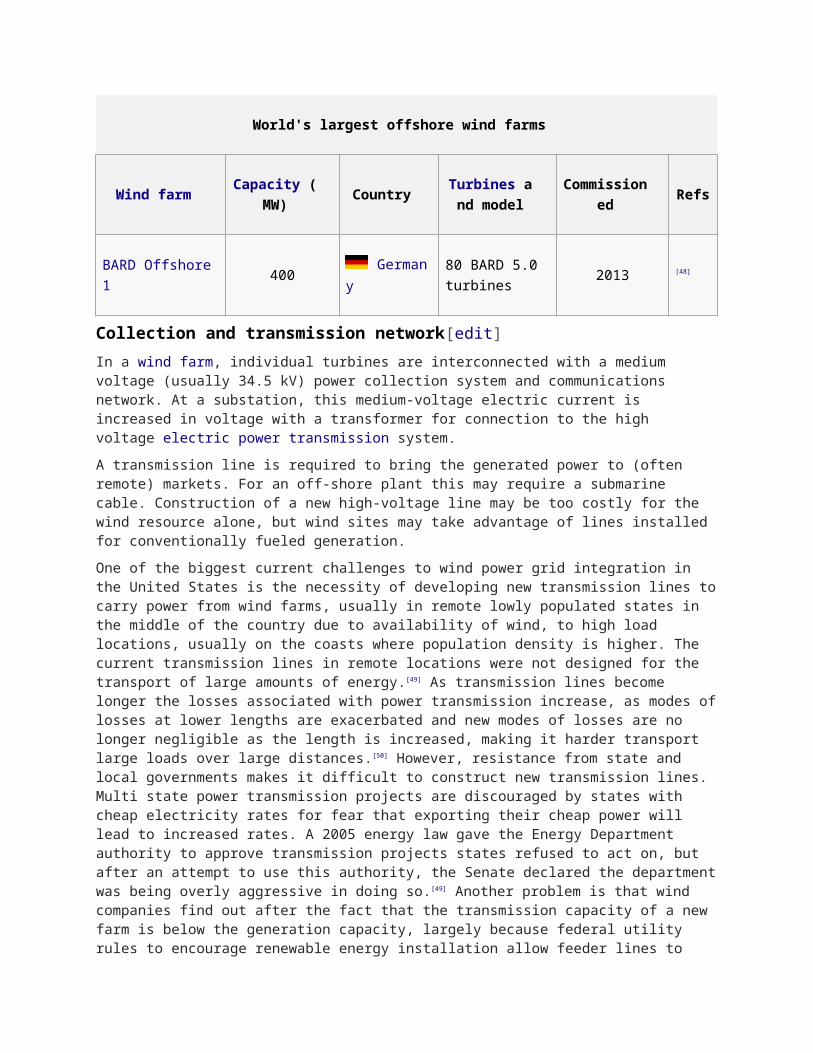
BARD Offshore 1 400 Germany80 BARD 5.0 turbines
2013 [48]
Collection and transmission network[edit]In a wind farm, individual turbines are interconnected with a medium voltage (usually 34.5 kV) power collection system and communications network. At a substation, this medium-voltage electric current is increased in voltage with a transformer for connection to the high voltage electric power transmission system.
A transmission line is required to bring the generated power to (often remote) markets. For an off-shore plant this may require a submarine cable. Construction of a new high-voltage line may be too costly for the wind resource alone, but wind sites may take advantage of lines installed for conventionally fueled generation.
One of the biggest current challenges to wind power grid integration in the United States is the necessity of developing new transmission lines to carry power from wind farms, usually in remote lowly populated states in the middle of the country due to availability of wind, to high load locations, usually on the coasts where population density is higher. The current transmission lines in remote locations were not designed for the transport of large amounts of energy. [49] As transmission lines become longer the losses associated with power transmission increase, as modes of losses at lower lengths are exacerbated and new modes of losses are no longer negligible as the length is increased, making it harder transport large loads over large distances. [50] However, resistance from
state and local governments makes it difficult to construct new transmission lines. Multi state power transmission projects are discouraged by states with cheap electricity rates for fear that exporting their cheap power will lead to increased rates. A 2005 energy law gave the Energy Department authority to approve transmission projects states refused to act on, but after an attempt to use this authority, the Senate declared the department was being overly aggressive in doing so. [49] Another problem is that wind companies find out after the fact that the transmission capacity of a new farm is below the generation capacity, largely because federal utility rules to encourage renewable energy installation allow feeder lines to meet only minimum standards. These are important issues that need to be solved, as when the transmission capacity does not meet the generation capacity, wind farms are forced to produce below their full potential or stop running all together, in a process known as curtailment. While this leads to potential renewable generation left untapped, it prevents possible grid overload or risk to reliable service.[51]
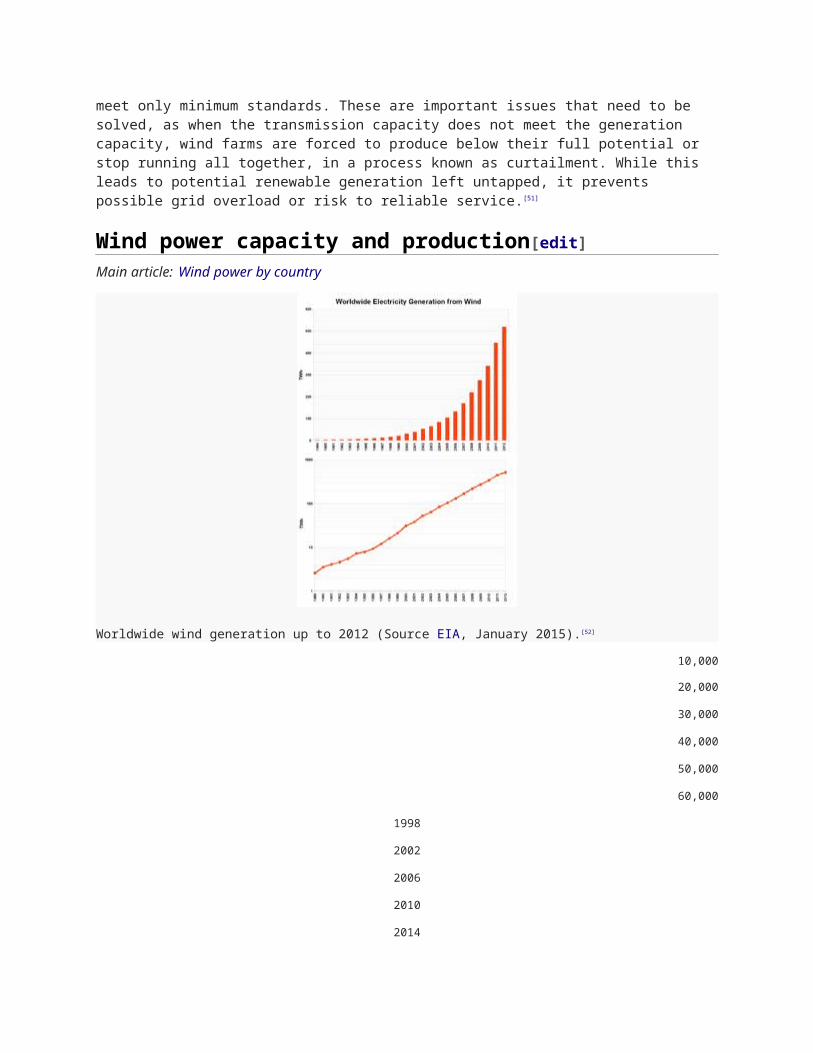
Wind power capacity and production[edit]Main article: Wind power by country
Worldwide wind generation up to 2012 (Source EIA, January 2015).[52]
10,000
20,000
30,000
40,000
50,000
60,000
1998
2002
2006
2010
2014
Global annual new installed wind capacity 1997–2014 (inMW)[17]:3
Worldwide there are now over two hundred thousand wind turbines operating, with a total nameplate capacity of 282,482 MW as of end 2012.[53] The European Union alone passed some 100,000 MW nameplate capacity in September 2012,[54] while the United States surpassed 50,000 MW in August 2012 and China's grid connected capacity passed 50,000 MW the same month.[55][56]
World wind generation capacity more than quadrupled between 2000 and 2006, doubling about every three years. The United States pioneered wind farms and led the world in installed capacity in the 1980s and into the 1990s. In 1997 installed capacity in Germany surpassed the U.S. and led until once again overtaken by the U.S. in 2008. China has been rapidly expanding its wind installations in the late 2000s and passed the U.S. in 2010 to become the world leader. As of 2011, 83 countries around the world were using wind power on a commercial basis. [16]
Wind power capacity has expanded rapidly to 336 GW in June 2014, and wind energy production was around 4% of total worldwide electricity usage, and growing rapidly.[18] The actual amount of electricity that wind is able to generate is calculated by multiplying the nameplate capacity by the capacity factor, which varies according to equipment and location. Estimates of the capacity factors for wind installations are in the range of 35% to 44%.[57]
Europe accounted for 48% of the world total wind power generation capacity in 2009. In 2010, Spain became Europe's leading producer of wind energy, achieving 42,976 GWh. Germany held the top spot in Europe in terms of installed capacity, with a total of 27,215 MW as of 31 December 2010. [58]
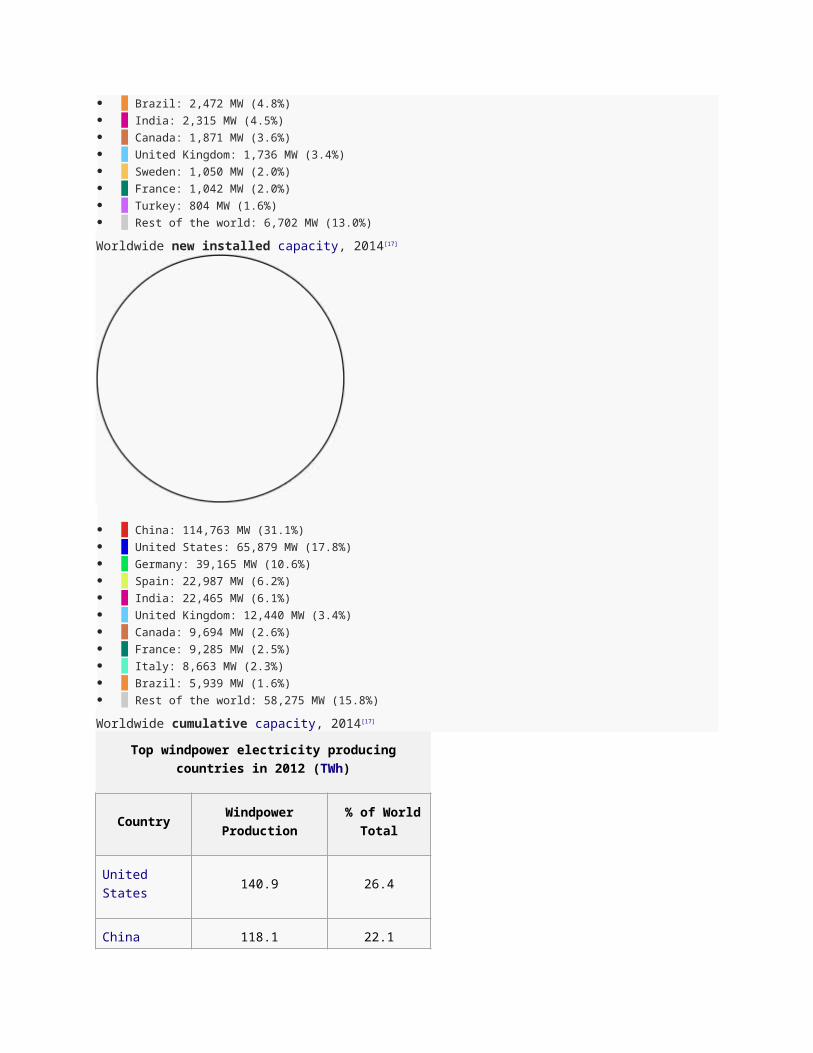
China: 23,351 MW (45.4%) Germany: 5,279 MW (10.3%) United States: 4,854 MW (9.4%) Brazil: 2,472 MW (4.8%) India: 2,315 MW (4.5%) Canada: 1,871 MW (3.6%) United Kingdom: 1,736 MW (3.4%) Sweden: 1,050 MW (2.0%) France: 1,042 MW (2.0%) Turkey: 804 MW (1.6%) Rest of the world: 6,702 MW (13.0%)
Worldwide new installed capacity, 2014[17]
China: 114,763 MW (31.1%) United States: 65,879 MW (17.8%) Germany: 39,165 MW (10.6%) Spain: 22,987 MW (6.2%) India: 22,465 MW (6.1%) United Kingdom: 12,440 MW (3.4%) Canada: 9,694 MW (2.6%) France: 9,285 MW (2.5%) Italy: 8,663 MW (2.3%) Brazil: 5,939 MW (1.6%) Rest of the world: 58,275 MW (15.8%)
Worldwide cumulative capacity, 2014[17]
Top windpower electricity producing countries in 2012 (TWh)
Country Windpower Production % of World Total
United States 140.9 26.4
China 118.1 22.1
Spain 49.1 9.2
Germany 46.0 8.6
India 30.0 5.6
United Kingdom
19.6 3.7
France 14.9 2.8
Italy 13.4 2.5
Canada 11.8 2.2
Denmark 10.3 1.9
(rest of world) 80.2 15.0
World Total 534.3 TWh 100%
Source:Observ'ER – Electricity Production From Wind Sources[59]
Growth trends[edit]
Worldwide installed wind power capacity forecast (Source: Global Wind Energy Council)[1][60]
In 2010, more than half of all new wind power was added outside of the traditional markets in Europe and North America. This was largely from new construction in China, which accounted for nearly half the new wind installations (16.5 GW).[61]
Global Wind Energy Council (GWEC) figures show that 2007 recorded an increase of installed capacity of 20 GW, taking the total installed wind energy capacity to 94 GW, up from 74 GW in 2006. Despite constraints facing supply chains for wind turbines, the annual market for wind continued to increase at an estimated rate of 37%, following 32% growth in 2006. In terms of economic value, the wind energy sector has become one of the important players in the energy markets, with the total value of new generating equipment installed in 2007 reaching €25 billion, or US$36 billion. [62]
Although the wind power industry was affected by the global financial crisis in 2009 and 2010, a BTM Consult five-year forecast up to 2013 projects substantial growth. Over the past five years the average growth in new installations has been 27.6% each year. In the forecast to 2013 the expected average annual growth rate is 15.7%.[63][64] More than 200 GW of new wind power capacity could come on line before the end of 2014. Wind power market penetration is expected to reach 3.35% by 2013 and 8% by 2018.[63][64]
In 2013 wind power constituted 13% of installed power generation capacity in the EU and generated 7.8% of power used[65]
Capacity factor[edit]Since wind speed is not constant, a wind farm's annual energy production is never as much as the sum of the generator nameplate ratings multiplied by the total hours in a year. The ratio of actual productivity in a year to this theoretical maximum is called thecapacity factor. Typical capacity
factors are 15–50%; values at the upper end of the range are achieved in favourable sites and are due to wind turbine design improvements.[66][67][nb 1]
Online data is available for some locations, and the capacity factor can be calculated from the yearly output.[68][69] For example, the German nationwide average wind power capacity factor over all of 2012 was just under 17.5% (45867 GW·h/yr / (29.9 GW × 24 × 366) = 0.1746),[70] and the capacity factor for Scottish wind farms averaged 24% between 2008 and 2010.[71]
Unlike fueled generating plants, the capacity factor is affected by several parameters, including the variability of the wind at the site and the size of the generator relative to the turbine's swept area. A small generator would be cheaper and achieve a higher capacity factor but would produce less electricity (and thus less profit) in high winds. Conversely, a large generator would cost more but generate little extra power and, depending on the type, may stall out at low wind speed. Thus an optimum capacity factor of around 40–50% would be aimed for.[67][72]
A 2008 study released by the U.S. Department of Energy noted that the capacity factor of new wind installations was increasing as the technology improves, and projected further improvements for future capacity factors.[73] In 2010, the department estimated the capacity factor of new wind turbines in 2010 to be 45%.[74] The annual average capacity factor for wind generation in the US has varied between 28.1% and 32.3% during the period 2008–2013.[75]
Penetration[edit]Country Penetration
Denmark (2014)[14][76] 39%
Portugal (2011)[77] 19%
Spain (2011)[78] 16%
Ireland (2012)[79] 16%
United Kingdom (2014)[80] 9.3%
Germany (2011)[81] 8%
United States (2013)[82] 4.5%
Wind energy penetration refers to the fraction of energy produced by wind compared with the total generation. There is no generally accepted maximum level of wind penetration. The limit for a particular grid will depend on the existing generating plants, pricing mechanisms, capacity for energy storage, demand management and other factors. An interconnected electricity grid will already include reserve generating and transmission capacity to allow for equipment failures. This reserve capacity can also serve to compensate for the varying power generation produced by wind stations. Studies have indicated that 20% of the total annual electrical energy consumption may be incorporated with minimal difficulty.[83] These studies have been for locations with geographically dispersed wind farms, some degree of dispatchable energy or hydropower with storage capacity, demand management, and interconnected to a large grid area enabling the export of electricity when needed. Beyond the 20% level, there are few technical limits, but the economic implications become more significant. Electrical utilities continue to study the effects of large scale penetration of wind generation on system stability and economics.[84][85][86][87]
A wind energy penetration figure can be specified for different durations of time, but is often quoted annually. To obtain 100% from wind annually requires substantial long term storage or substantial
interconnection to other systems which may already have substantial storage. On a monthly, weekly, daily, or hourly basis—or less—wind might supply as much as or more than 100% of current use, with the rest stored or exported. Seasonal industry might then take advantage of high wind and low usage times such as at night when wind output can exceed normal demand. Such industry might include production of silicon, aluminum,[88] steel, or of natural gas, and hydrogen, and using future long term storage to facilitate 100% energy from variable renewable energy.[89][90] Homes can also be programmed to accept extra electricity on demand, for example by remotely turning up water heater thermostats.[91]
In Australia, the state of South Australia generates around half of the nation's wind power capacity. By the end of 2011 wind power in South Australia, championed by Premier (and Climate Change Minister) Mike Rann, reached 26% of the State's electricity generation, edging out coal for the first time.[92] At this stage South Australia, with only 7.2% of Australia's population, had 54% of Australia's installed capacity.[78][92]
Variability[edit]Main article: Variable renewable energy
Windmills are typically installed in favourable windy locations. In the image, wind power generators in Spain,
near an Osborne bull.
Electricity generated from wind power can be highly variable at several different timescales: hourly, daily, or seasonally. Annual variation also exists, but is not as significant. Because instantaneous electrical generation and consumption must remain in balance to maintain grid stability, this variability can present substantial challenges to incorporating large amounts of wind power into a grid system. Intermittency and the non-dispatchable nature of wind energy production can raise costs for regulation, incremental operating reserve, and (at high penetration levels) could require an increase in the already existing energy demand management, load shedding, storage solutions or system interconnection with HVDC cables.
Fluctuations in load and allowance for failure of large fossil-fuel generating units require reserve capacity that can also compensate for variability of wind generation.
Increase in system operation costs, Euros per MWh, for 10% & 20% wind share [7]
Country 10% 20%
Germany 2.5 3.2
Denmark 0.4 0.8
Finland 0.3 1.5
Norway 0.1 0.3
Sweden 0.3 0.7
Wind power is variable, and during low wind periods it must be replaced by other power sources. Transmission networks presently cope with outages of other generation plants and daily changes in electrical demand, but the variability of intermittent power sources such as wind power, are unlike those of conventional power generation plants which, when scheduled to be operating, may be able to deliver their nameplate capacity around 95% of the time.
Presently, grid systems with large wind penetration require a small increase in the frequency of usage of natural gas spinning reserve power plants to prevent a loss of electricity in the event that conditions are not favorable for power production from the wind. At lower wind power grid penetration, this is less of an issue.[93][94][95]
GE has installed a prototype wind turbine with onboard battery similar to that of an electric car, equivalent of 1 minute of production. Despite the small capacity, it is enough to guarantee that power output complies with forecast for 15 minutes, as the battery is used to eliminate the difference rather than provide full output. The increased predictability can be used to take wind power penetration from 20 to 30 or 40 per cent. The battery cost can be retrieved by selling burst power on demand and reducing backup needs from gas plants.[96]
A report on Denmark's wind power noted that their wind power network provided less than 1% of average demand on 54 days during the year 2002.[97]Wind power advocates argue that these periods of low wind can be dealt with by simply restarting existing power stations that have been held in readiness, or interlinking with HVDC.[98] Electrical grids with slow-responding thermal power plants and without ties to networks with hydroelectric generation may have to limit the use of wind power.[97] According to a 2007 Stanford University study published in the Journal of Applied Meteorology and Climatology, interconnecting ten or more wind farms can allow an average of 33% of the total energy produced (i.e. about 8% of total nameplate capacity) to be used as reliable, baseload electric power which can be relied on to handle peak loads, as long as minimum criteria are met for wind speed and turbine height.[99][100]
Conversely, on particularly windy days, even with penetration levels of 16%, wind power generation can surpass all other electricity sources in a country. In Spain, in the early hours of 16 April 2012 wind power production reached the highest percentage of electricity production till then, at 60.46% of the total demand.[101] In Denmark, which had power market penetration of 30% in 2013, over 90 hours, wind power generated 100% of the country's power, peaking at 122% of the country's demand at 2 am on 28 October.[102]
A 2006 International Energy Agency forum presented costs for managing intermittency as a function of wind-energy's share of total capacity for several countries, as shown in the table on the right. Three reports on the wind variability in the UK issued in 2009, generally agree that variability of wind needs to be taken into account, but it does not make the grid unmanageable. The additional costs, which are modest, can be quantified.[8]
The combination of diversifying variable renewables by type and location, forecasting their variation, and integrating them with dispatchable renewables, flexible fueled generators, and demand response can create a power system that has the potential to meet power supply needs reliably. Integrating ever-higher levels of renewables is being successfully demonstrated in the real world: [103]
In 2009, eight American and three European authorities, writing in the leading electrical engineers' professional journal, didn't find "a credible and firm technical limit to the amount of wind energy that can be accommodated by electricity grids". In fact, not one of more than 200 international studies, nor official studies for the eastern and western U.S. regions, nor the International Energy Agency,
has found major costs or technical barriers to reliably integrating up to 30% variable renewable supplies into the grid, and in some studies much more. – Reinventing Fire[103]
Solar power tends to be complementary to wind.[104][105] On daily to weekly timescales, high pressure areas tend to bring clear skies and low surface winds, whereas low pressure areas tend to be windier and cloudier. On seasonal timescales, solar energy peaks in summer, whereas in many areas wind energy is lower in summer and higher in winter.[nb 2][106] Thus the intermittencies of wind and solar power tend to cancel each other somewhat. In 2007 the Institute for Solar Energy Supply Technology of the University of Kassel pilot-tested a combined power plant linking solar, wind, biogas and hydrostorage to provide load-following power around the clock and throughout the year, entirely from renewable sources.[107]
Further information: Grid balancing
Predictability[edit]Main article: Wind power forecasting
Wind power forecasting methods are used, but predictability of any particular wind farm is low for short-term operation. For any particular generator there is an 80% chance that wind output will change less than 10% in an hour and a 40% chance that it will change 10% or more in 5 hours.[108]
However, studies by Graham Sinden (2009) suggest that, in practice, the variations in thousands of wind turbines, spread out over several different sites and wind regimes, are smoothed. As the distance between sites increases, the correlation between wind speeds measured at those sites, decreases.[109]
Thus, while the output from a single turbine can vary greatly and rapidly as local wind speeds vary, as more turbines are connected over larger and larger areas the average power output becomes less variable and more predictable.[13][110]
Wind power hardly ever suffers major technical failures, since failures of individual wind turbines have hardly any effect on overall power, so that the distributed wind power is reliable and predictable,[111][unreliable source?] whereas conventional generators, while far less variable, can suffer major unpredictable outages.
Energy storage[edit]Main article: Grid energy storage. See also: List of energy storage projects.
The Sir Adam Beck Generating Complex at Niagara Falls, Canada, includes a large pumped-storage
hydroelectricity reservoir. During hours of low electrical demand excesselectrical grid power is used to
pump water up into the reservoir, which then provides an extra 174 MW of electricity during periods of
peak demand.
Typically, conventional hydroelectricity complements wind power very well. When the wind is blowing strongly, nearby hydroelectric stations can temporarily hold back their water. When the wind drops they can, provided they have the generation capacity, rapidly increase production to

compensate. This gives a very even overall power supply and virtually no loss of energy and uses no more water.
Alternatively, where a suitable head of water is not available, pumped-storage hydroelectricity or other forms of grid energy storage such as compressed air energy storage and thermal energy storage can store energy developed by high-wind periods and release it when needed.[112] The type of storage needed depends on the wind penetration level – low penetration requires daily storage, and high penetration requires both short and long term storage – as long as a month or more. Stored energy increases the economic value of wind energy since it can be shifted to displace higher cost generation during peak demand periods. The potential revenue from this arbitragecan offset the cost and losses of storage; the cost of storage may add 25% to the cost of any wind energy stored but it is not envisaged that this would apply to a large proportion of wind energy generated. For example, in the UK, the 1.7 GW Dinorwig pumped-storage plantevens out electrical demand peaks, and allows base-load suppliers to run their plants more efficiently. Although pumped-storage power systems are only about 75% efficient, and have high installation costs, their low running costs and ability to reduce the required electrical base-load can save both fuel and total electrical generation costs.[113][114]
In particular geographic regions, peak wind speeds may not coincide with peak demand for electrical power. In the U.S. states ofCalifornia and Texas, for example, hot days in summer may have low wind speed and high electrical demand due to the use of air conditioning. Some utilities subsidize the purchase of geothermal heat pumps by their customers, to reduce electricity demand during the summer months by making air conditioning up to 70% more efficient;[115] widespread adoption of this technology would better match electricity demand to wind availability in areas with hot summers and low summer winds. A possible future option may be to interconnect widely dispersed geographic areas with an HVDC "super grid". In the U.S. it is estimated that to upgrade the transmission system to take in planned or potential renewables would cost at least $60 billion,[116] while the society value of added windpower would be more than that cost.[82]
Germany has an installed capacity of wind and solar that can exceed daily demand, and has been exporting peak power to neighboring countries, with exports which amounted to some 14.7 billion kilowatt hours in 2012.[117] A more practical solution is the installation of thirty days storage capacity able to supply 80% of demand, which will become necessary when most of Europe's energy is obtained from wind power and solar power. Just as the EU requires member countries to maintain 90 days strategic reserves of oil it can be expected that countries will provide electricity storage, instead of expecting to use their neighbors for net metering. [118]
Capacity credit, fuel savings and energy payback[edit]The capacity credit of wind is estimated by determining the capacity of conventional plants displaced by wind power, whilst maintaining the same degree of system security. [119]However, the precise value is irrelevant since the main value of wind is its fuel and CO2 savings,[citation needed] and wind is not expected to be constantly available.[120]
The energy needed to build a wind farm divided into the total output over its life, Energy Return on Energy Invested, of wind power varies but averages about 20–25.[121][122]Thus, the energy payback time is typically around one year.
Economics[edit]
Wind turbines reached grid parity (the point at which the cost of wind power matches traditional sources) in some areas of Europe in the mid-2000s, and in the US around the same time. Falling prices continue to drive the levelized cost down and it has been suggested that it has reached general grid parity in Europe in 2010, and will reach the same point in the US around 2016 due to an expected reduction in capital costs of about 12%.[123]
Electricity cost and trends[edit]
Estimated cost per MWh for wind power in Denmark
The National Renewable Energy Laboratory projects that the levelized cost of wind power in the U.S. will
decline about 25% from 2012 to 2030.[124]
A turbine blade convoy passing through Edenfield in the U.K. (2008). Even longer two-piece blades are
now manufactured, and then assembled on-site to reduce difficulties in transportation.
Wind power is capital intensive, but has no fuel costs.[125] The price of wind power is therefore much more stable than the volatile prices of fossil fuel sources.[126] The marginal cost of wind energy once a station is constructed is usually less than 1-cent per kW·h. [127]
However, the estimated average cost per unit of electricity must incorporate the cost of construction of the turbine and transmission facilities, borrowed funds, return to investors (including cost of risk), estimated annual production, and other components, averaged over the projected useful life of the equipment, which may be in excess of twenty years. Energy cost estimates are highly dependent on these assumptions so published cost figures can differ substantially. In 2004, wind energy cost a fifth of what it did in the 1980s, and some expected that downward trend to continue as larger multi-megawatt turbines were mass-produced.[128] As of 2012 capital costs for wind turbines are substantially lower than 2008–2010 but are still above 2002 levels.[129] A 2011 report from the American Wind Energy Association stated, "Wind's costs have dropped over the past two years, in the range of 5 to 6 cents per kilowatt-hour recently.... about 2 cents cheaper than coal-fired electricity, and more projects were financed through debt arrangements than tax equity structures last year.... winning more mainstream acceptance from Wall Street's banks.... Equipment makers can also deliver products in the same year that they
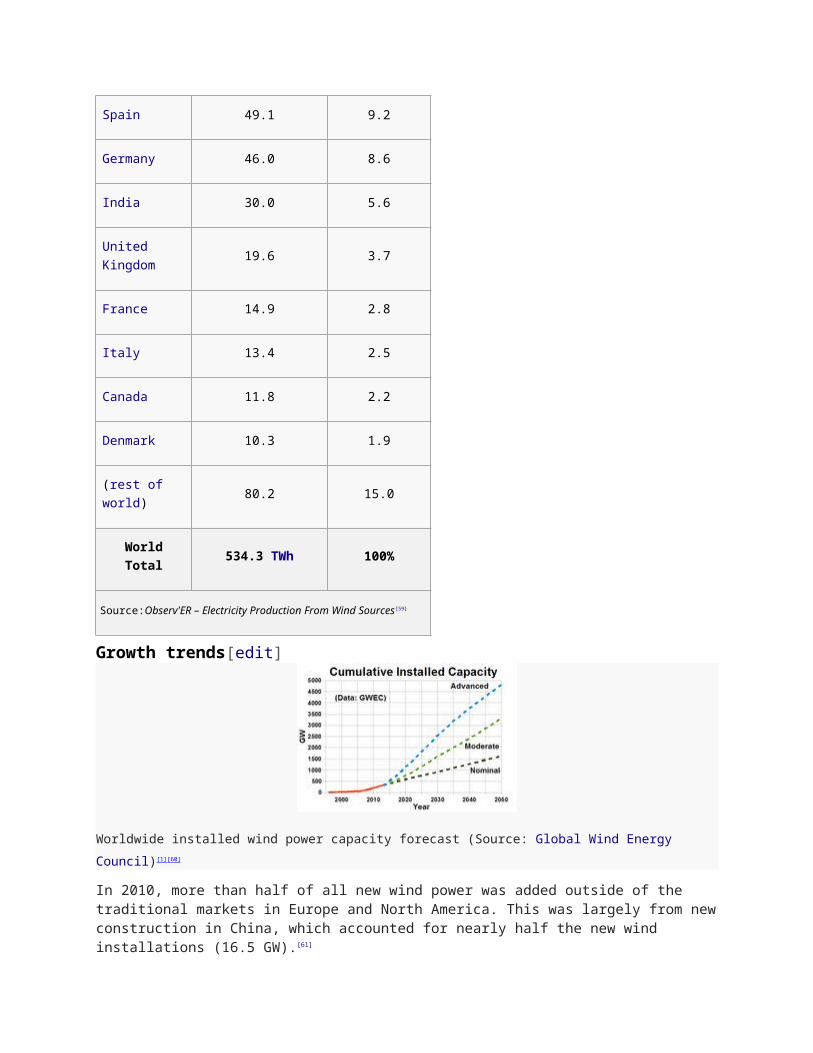
are ordered instead of waiting up to three years as was the case in previous cycles.... 5,600 MW of new installed capacity is under construction in the United States, more than double the number at this point in 2010. Thirty-five percent of all new power generation built in the United States since 2005 has come from wind, more than new gas and coal plants combined, as power providers are increasingly enticed to wind as a convenient hedge against unpredictable commodity price moves."[130]
A British Wind Energy Association report gives an average generation cost of onshore wind power of around 3.2 pence (between US 5 and 6 cents) per kW·h (2005). [131] Cost per unit of energy produced was estimated in 2006 to be 5 to 6 percent above the cost of new generating capacity in the US for coal and natural gas: wind cost was estimated at $55.80 per MW·h, coal at $53.10/MW·h and natural gas at $52.50.[132] Similar comparative results with natural gas were obtained in a governmental study in the UK in 2011.[133] In 2011 power from wind turbines could be already cheaper than fossil or nuclear plants; it is also expected that wind power will be the cheapest form of energy generation in the future.[134] The presence of wind energy, even when subsidised, can reduce costs for consumers (€5 billion/yr in Germany) by reducing the marginal price, by minimising the use of expensive peaking power plants.[135]
In February 2013 Bloomberg New Energy Finance (BNEF) reported that the cost of generating electricity from new wind farms is cheaper than new coal or new baseload gas plants. When including the current Australian federal government carbon pricing scheme their modeling gives costs (in Australian dollars) of $80/MWh for new wind farms, $143/MWh for new coal plants and $116/MWh for new baseload gas plants. The modeling also shows that "even without a carbon price (the most efficient way to reduce economy-wide emissions) wind energy is 14% cheaper than new coal and 18% cheaper than new gas."[136] Part of the higher costs for new coal plants is due to high financial lending costs because of "the reputational damage of emissions-intensive investments". The expense of gas fired plants is partly due to "export market" effects on local prices. Costs of production from coal fired plants built in "the 1970s and 1980s" are cheaper than renewable energy sources because of depreciation.[136] In 2015 BNEF calculated LCOE prices per MWh energy in new powerplants (excluding carbon costs) : $85 for onshore wind ($175 for offshore), $66–75 for coal in the Americas ($82–105 in Europe), gas $80–100.[137][138][139]
An EU study shows base cost of onshore wind power similar to coal, when subsidies and externalities are disregarded. Wind power has some of the lowest external costs.[140]
This cost has additionally reduced as wind turbine technology has improved. There are now longer and lighter wind turbine blades, improvements in turbine performance and increased power generation efficiency. Also, wind project capital and maintenance costs have continued to decline.[141] For example, the wind industry in the USA as of early 2014 is able to produce more power at lower cost by using taller wind turbines with longer blades, capturing the faster winds at higher elevations. This has opened up new opportunities and in Indiana, Michigan, and Ohio, the price of power from wind turbines built 300 feet to 400 feet above the ground can now compete with conventional fossil fuels like coal. Prices have fallen to about 4 cents per kilowatt-hour in some cases and utilities have been increasing the amount of wind energy in their portfolio, saying it is their cheapest option.[142]
A number of initiatives are working to reduce costs of electricity from offshore wind. One example is the Carbon Trust Offshore Wind Accelerator, a joint industry project, involving nine offshore wind developers, which aims to reduce the cost of offshore wind by 10% by 2015. It has been suggested that innovation at scale could deliver 25% cost reduction in offshore wind by 2020.[143] Henrik Stiesdal, former Chief Technical Officer at Siemens Wind Power, has stated that by 2025 energy from offshore wind will be one of the cheapest, scalable solutions in the UK, compared to other renewables and fossil fuel energy sources, if the true cost to society is factored into the cost of energy equation.[144] He calculates the cost at that time to be 43 EUR/MWh for onshore, and 72 EUR/MWh for offshore wind.[145]
https://en.wikipedia.org/wiki/Wind_power#cite_note-bnef.com.2F2013.2F02.2F07.2Frenewable-cheaper-138
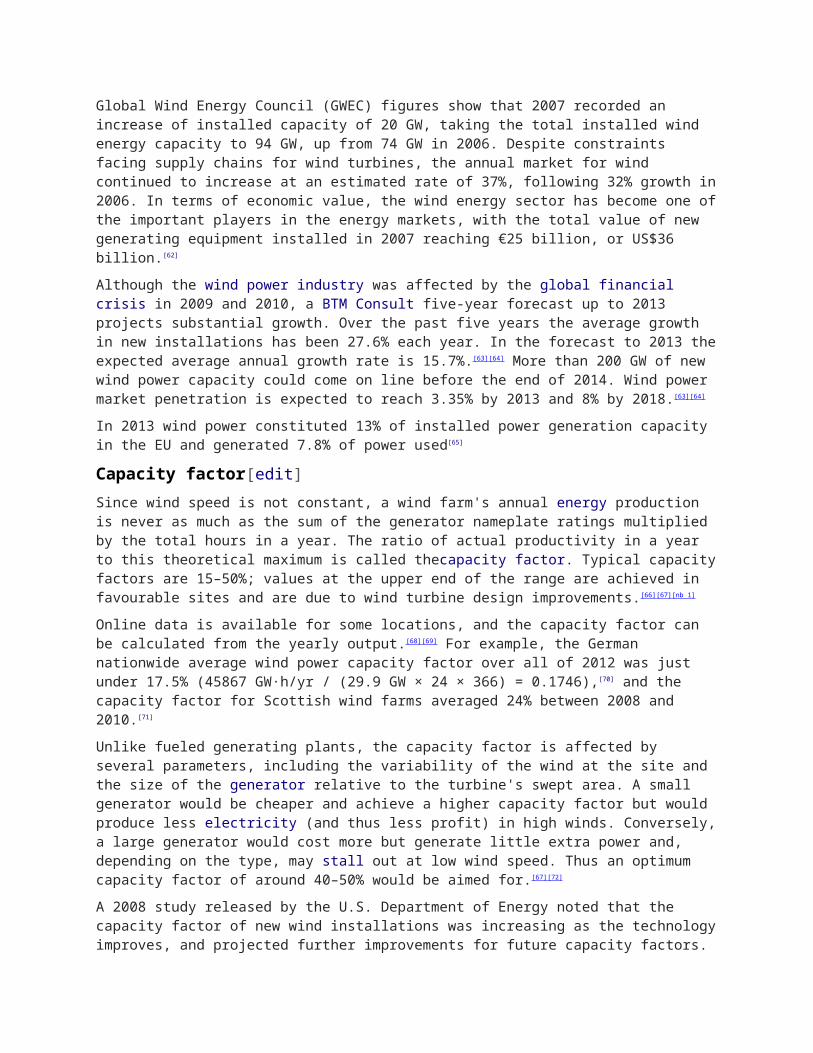
Incentives and community benefits[edit]
U.S. landowners typically receive $3,000–$5,000 annual rental income per wind turbine, while farmers
continue to grow crops or graze cattle up to the foot of the turbines. [146]Shown: the Brazos Wind Farm,
Texas.
Some of the 6,000 turbines in California's Altamont Pass Wind Farmaided by tax incentives during the
1980s.[147]
The U.S. wind industry generates tens of thousands of jobs and billions of dollars of economic activity.[148] Wind projects provide local taxes, or payments in lieu of taxes and strengthen the economy of rural communities by providing income to farmers with wind turbines on their land. [146]
[149] Wind energy in many jurisdictions receives financial or other support to encourage its development. Wind energy benefits from subsidies in many jurisdictions, either to increase its attractiveness, or to compensate for subsidies received by other forms of production which have significant negative externalities.
In the US, wind power receives a production tax credit (PTC) of 1.5¢/kWh in 1993 dollars for each kW·h produced, for the first ten years; at 2.2 cents per kW·h in 2012, the credit was renewed on 2 January 2012, to include construction begun in 2013. [150] A 30% tax credit can be applied instead of receiving the PTC.[151][152] Another tax benefit is accelerated depreciation. Many American states also provide incentives, such as exemption from property tax, mandated purchases, and additional markets for "green credits".[153] The Energy Improvement and Extension Act of 2008 contains extensions of credits for wind, including microturbines. Countries such as Canada and Germany also provide incentives for wind turbine construction, such as tax credits or minimum purchase prices for wind generation, with assured grid access (sometimes referred to as feed-in tariffs). These feed-in tariffs are typically set well above average electricity prices.[154][155] In December 2013 U.S. Senator Lamar Alexander and other Republican senators argued that the "wind energy production tax credit should be allowed to expire at the end of 2013"[156] and it expired 1 January 2014 for new installations.
Secondary market forces also provide incentives for businesses to use wind-generated power, even if there is a premium price for the electricity. For example, socially responsible
manufacturers pay utility companies a premium that goes to subsidize and build new wind power infrastructure. Companies use wind-generated power, and in return they can claim that they are undertaking strong "green" efforts. In the US the organization Green-e monitors business compliance with these renewable energy credits.[157]
Small-scale wind power[edit]Further information: Microgeneration
A small Quietrevolution QR5 Gorlov type vertical axis wind turbine on the roof of Colston Hall in Bristol,
England. Measuring 3 m in diameter and 5 m high, it has a nameplate rating of 6.5 kW.
Small-scale wind power is the name given to wind generation systems with the capacity to produce up to 50 kW of electrical power.[158]Isolated communities, that may otherwise rely on diesel generators, may use wind turbines as an alternative. Individuals may purchase these systems to reduce or eliminate their dependence on grid electricity for economic reasons, or to reduce their carbon footprint. Wind turbines have been used for household electricity generation in conjunction with battery storage over many decades in remote areas.[159]
Recent examples of small-scale wind power projects in an urban setting can be found in New York City, where, since 2009, a number of building projects have capped their roofs with Gorlov-type helical wind turbines. Although the energy they generate is small compared to the buildings' overall consumption, they help to reinforce the building's 'green' credentials in ways that "showing people your high-tech boiler" can not, with some of the projects also receiving the direct support of the New York State Energy Research and Development Authority.[160]
Grid-connected domestic wind turbines may use grid energy storage, thus replacing purchased electricity with locally produced power when available. The surplus power produced by domestic microgenerators can, in some jurisdictions, be fed into the network and sold to the utility company, producing a retail credit for the microgenerators' owners to offset their energy costs. [161]
Off-grid system users can either adapt to intermittent power or use batteries, photovoltaic or diesel systems to supplement the wind turbine. Equipment such as parking meters, traffic warning signs, street lighting, or wireless Internet gateways may be powered by a small wind turbine, possibly combined with a photovoltaic system, that charges a small battery replacing the need for a connection to the power grid.[162]
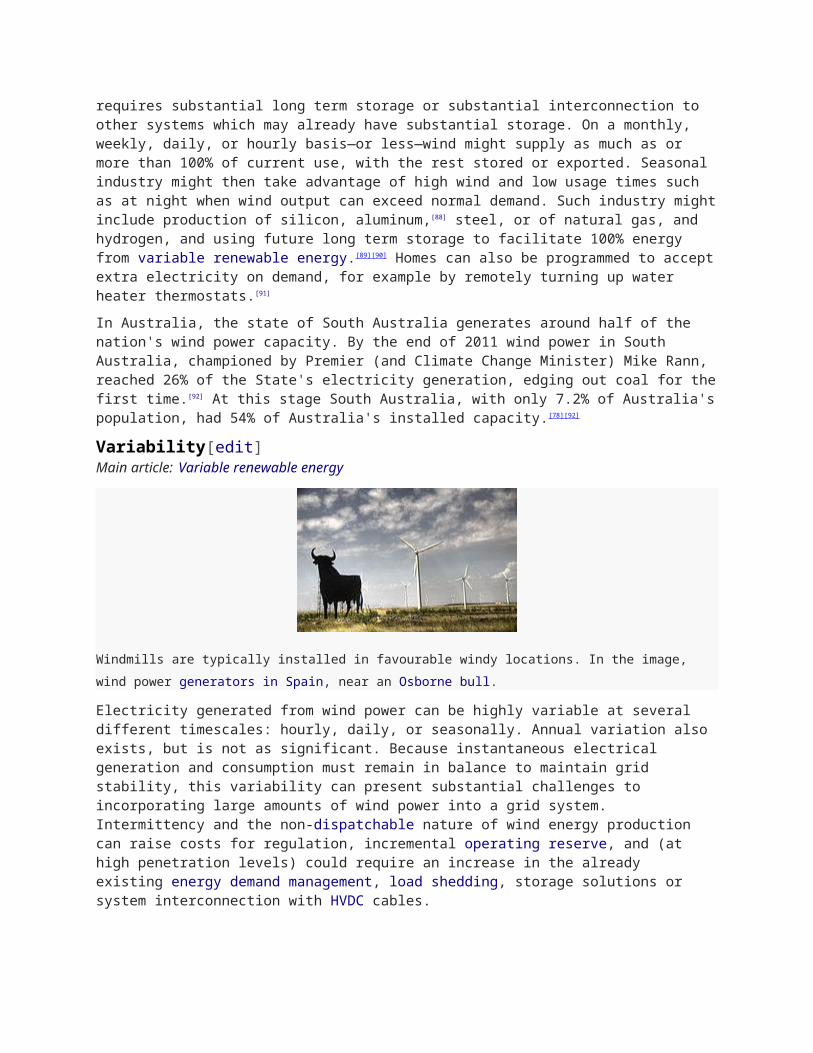
A Carbon Trust study into the potential of small-scale wind energy in the UK, published in 2010, found that small wind turbines could provide up to 1.5 terawatt hours (TW·h) per year of electricity (0.4% of total UK electricity consumption), saving 0.6 million tonnes of carbon dioxide (Mt CO2) emission savings. This is based on the assumption that 10% of households would install turbines at costs competitive with grid electricity, around 12 pence (US 19 cents) a kW·h.[163] A report prepared for the UK's government-sponsored Energy Saving Trust in 2006, found that home power generators of various kinds could provide 30 to 40% of the country's electricity needs by 2050.[164]
Distributed generation from renewable resources is increasing as a consequence of the increased awareness of climate change. The electronic interfaces required to connect renewable generation units with the utility system can include additional functions, such as the active filtering to enhance the power quality.[165]
Environmental effects[edit]Main article: Environmental impact of wind power
Livestock grazing near a wind turbine.[166]
The environmental impact of wind power when compared to the environmental impacts of fossil fuels, is relatively minor. According to theIPCC, in assessments of the life-cycle global warming potential of energy sources, wind turbines have a median value of between 12 and 11 (gCO2eq/kWh) depending on whether off- or onshore turbines are being assessed.[167]
[168] Compared with other low carbon powersources, wind turbines have some of the lowest global warming potential per unit of electrical energy generated.[169]
While a wind farm may cover a large area of land, many land uses such as agriculture are compatible with it, as only small areas of turbine foundations and infrastructure are made unavailable for use.[170][171]
There are reports of bird and bat mortality at wind turbines as there are around other artificial structures. The scale of the ecological impact may[172] or may not[173] be significant, depending on specific circumstances. Prevention and mitigation of wildlife fatalities, and protection of peat bogs,[174] affect the siting and operation of wind turbines.
Wind turbines generate some noise. At a residential distance of 300 metres (980 ft) this may be around 45 dB, which is slightly louder than a refrigerator. At 1 mile (1.6 km) distance they become inaudible.[175][176] There are anecdotal reports of negative health effects from noise on people who live very close to wind turbines.[177] Peer-reviewed research has generally not supported these claims.[178][179][180]
Aesthetic aspects of wind turbines and resulting changes of the visual landscape are significant.[181] Conflicts arise especially in scenic and heritage protected landscapes.
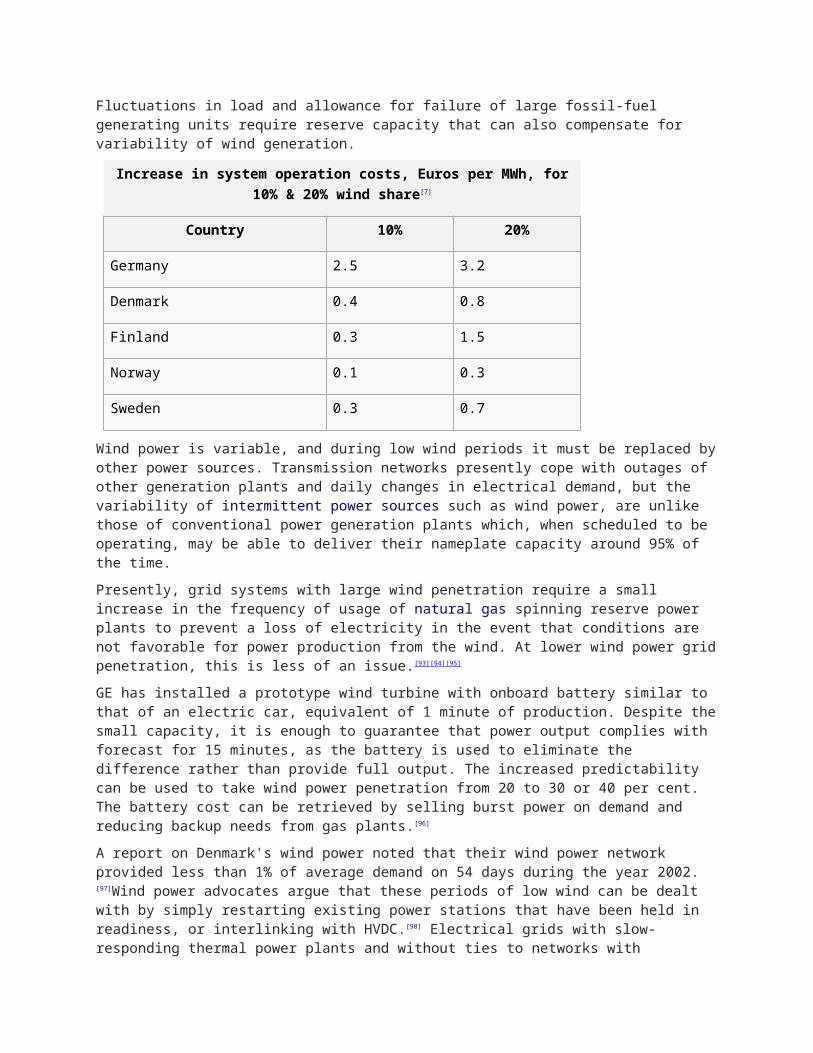
Politics[edit]
Central government[edit]
Part of the Seto Hill Windfarm in Japan.
Nuclear power and fossil fuels are subsidized by many governments, and wind power and other forms of renewable energy are also often subsidized. For example, a 2009 study by the Environmental Law Institute[182] assessed the size and structure of U.S. energy subsidies over the 2002–2008 period. The study estimated that subsidies to fossil-fuel based sources amounted to approximately $72 billion over this period and subsidies to renewable fuel sources totalled $29 billion. In the United States, the federal government has paid US$74 billion for energy subsidies to support R&D for nuclear power ($50 billion) and fossil fuels ($24 billion) from 1973 to 2003. During this same time frame, renewable energy technologies and energy efficiency received a total of US$26 billion. It has been suggested that a subsidy shift would help to level the playing field and support growing energy sectors, namely solar power, wind power, and biofuels.[183]History shows that no energy sector was developed without subsidies. [183]
According to the International Energy Agency (IEA) (2011), energy subsidies artificially lower the price of energy paid by consumers, raise the price received by producers or lower the cost of production. "Fossil fuels subsidies costs generally outweigh the benefits. Subsidies to renewables and low-carbon energy technologies can bring long-term economic and environmental benefits".[184] In November 2011, an IEA report entitled Deploying Renewables 2011 said "subsidies in green energy technologies that were not yet competitive are justified in order to give an incentive to investing into technologies with clear environmental and energy security benefits". The IEA's report disagreed with claims that renewable energy technologies are only viable through costly subsidies and not able to produce energy reliably to meet demand.
In the U.S., the wind power industry has recently increased its lobbying efforts considerably, spending about $5 million in 2009 after years of relative obscurity in Washington.[185]By comparison, the U.S. nuclear industry alone spent over $650 million on its lobbying efforts and campaign contributions during a single ten-year period ending in 2008. [186][187][188]
Following the 2011 Japanese nuclear accidents, Germany's federal government is working on a new plan for increasing energy efficiency and renewable energy commercialization, with a particular focus on offshore wind farms. Under the plan, large wind turbines will be erected far away from the coastlines, where the wind blows more consistently than it does on land, and where the enormous turbines won't bother the inhabitants. The plan aims to decrease Germany's dependence on energy derived from coal and nuclear power plants.[189]
Public opinion[edit]
Environmental group members are both more in favor of wind power (74%) as well as more opposed
(24%). Few are undecided.
Surveys of public attitudes across Europe and in many other countries show strong public support for wind power.[190][191][192] About 80% of EU citizens support wind power.[193] In Germany, where wind power has gained very high social acceptance, hundreds of thousands of people have invested in citizens' wind farms across the country and thousands of small and medium-sized enterprises are running successful businesses in a new sector that in 2008 employed 90,000 people and generated 8% of Germany's electricity.[194][195] Although wind power is a popular form of energy generation, the construction of wind farms is not universally welcomed, often for aestheticreasons.[170][190][191][192][193][196][197]
In Spain, with some exceptions, there has been little opposition to the installation of inland wind parks. However, the projects to build offshore parks have been more controversial. [198] In particular, the proposal of building the biggest offshore wind power production facility in the world in southwestern Spain in the coast of Cádiz, on the spot of the 1805 Battle of Trafalgar[199] has been met with strong opposition who fear for tourism and fisheries in the area,[200] and because the area is a war grave.[199]
Which should be increased in Scotland?[201]
In a survey conducted by Angus Reid Strategies in October 2007, 89 per cent of respondents said that using renewable energy sources like wind or solar power was positive for Canada, because these sources were better for the environment. Only 4 per cent considered using renewable sources as negative since they can be unreliable and expensive. [202] According to a Saint Consulting survey in April 2007, wind power was the alternative energy source most likely to gain public support for future development in Canada, with only 16% opposed to this type of energy. By contrast, 3 out of 4 Canadians opposed nuclear power developments. [203]
A 2003 survey of residents living around Scotland's 10 existing wind farms found high levels of community acceptance and strong support for wind power, with much support from those who lived closest to the wind farms. The results of this survey support those of an earlier Scottish Executive survey 'Public attitudes to the Environment in Scotland 2002', which found that the Scottish public would prefer the majority of their electricity to come from renewables, and which
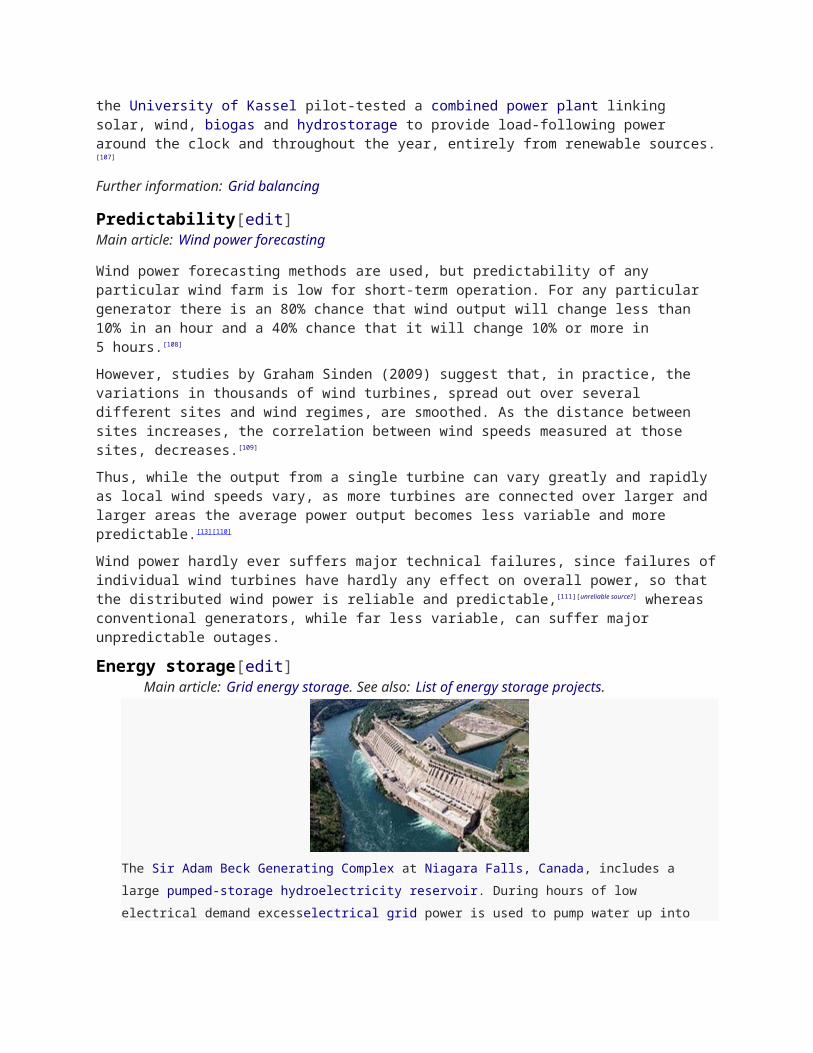
rated wind power as the cleanest source of renewable energy.[204] A survey conducted in 2005 showed that 74% of people in Scotland agree that wind farms are necessary to meet current and future energy needs. When people were asked the same question in a Scottish renewables study conducted in 2010, 78% agreed. The increase is significant as there were twice as many wind farms in 2010 as there were in 2005. The 2010 survey also showed that 52% disagreed with the statement that wind farms are "ugly and a blot on the landscape". 59% agreed that wind farms were necessary and that how they looked was unimportant.[205] Scotland is planning to obtain 100% of electricity from renewable sources by 2020.[206]
In other cases there is direct community ownership of wind farm projects. The hundreds of thousands of people who have become involved in Germany's small and medium-sized wind farms demonstrate such support there.[207]
This 2010 Harris Poll reflects the strong support for wind power in Germany, other European countries, and the U.S.[190][191][208]
Opinion on increase in number of wind farms, 2010 Harris Poll[209]
U.S.GreatBritai
nFrance Italy
Spain
Germany
% % % % % %
Strongly oppose 3 6 6 2 2 4
Oppose more than favour 9 12 16 11 9 14
Favour more than oppose
37 44 44 38 37 42
Strongly favour 50 38 33 49 53 40
Community[edit]See also: Community debate about wind farms
Wind turbines such as these, in Cumbria, England, have been opposed for a number of reasons, including
aesthetics, by some sectors of the population.[210][211]
Many wind power companies work with local communities to reduce environmental and other concerns associated with particular wind farms.[212][213][214] In other cases there is direct community ownership of wind farm projects. Appropriate government consultation, planning and approval procedures also help to minimize environmental risks.[190][215][216] Some may still object to wind farms[217] but, according to The Australia Institute, their concerns should be weighed against the need to address the threats posed by climate change and the opinions of the broader community.[218]
In America, wind projects are reported to boost local tax bases, helping to pay for schools, roads and hospitals. Wind projects also revitalize the economy of rural communities by providing steady income to farmers and other landowners.[146]
In the UK, both the National Trust and the Campaign to Protect Rural England have expressed concerns about the effects on the rural landscape caused by inappropriately sited wind turbines and wind farms.[219][220]
A panoramic view of the United Kingdom's Whitelee Wind Farm with Lochgoin Reservoir in the foreground.
Some wind farms have become tourist attractions. The Whitelee Wind Farm Visitor Centre has an exhibition room, a learning hub, a café with a viewing deck and also a shop. It is run by the Glasgow Science Centre.[221]
In Denmark, a loss-of-value scheme gives people the right to claim compensation for loss of value of their property if it is caused by proximity to a wind turbine. The loss must be at least 1% of the property's value.[222]
Despite this general support for the concept of wind power in the public at large, local opposition often exists and has delayed or aborted a number of projects.[223][224][225] For example, there are concerns that some installations can negatively affect TV and radio reception and
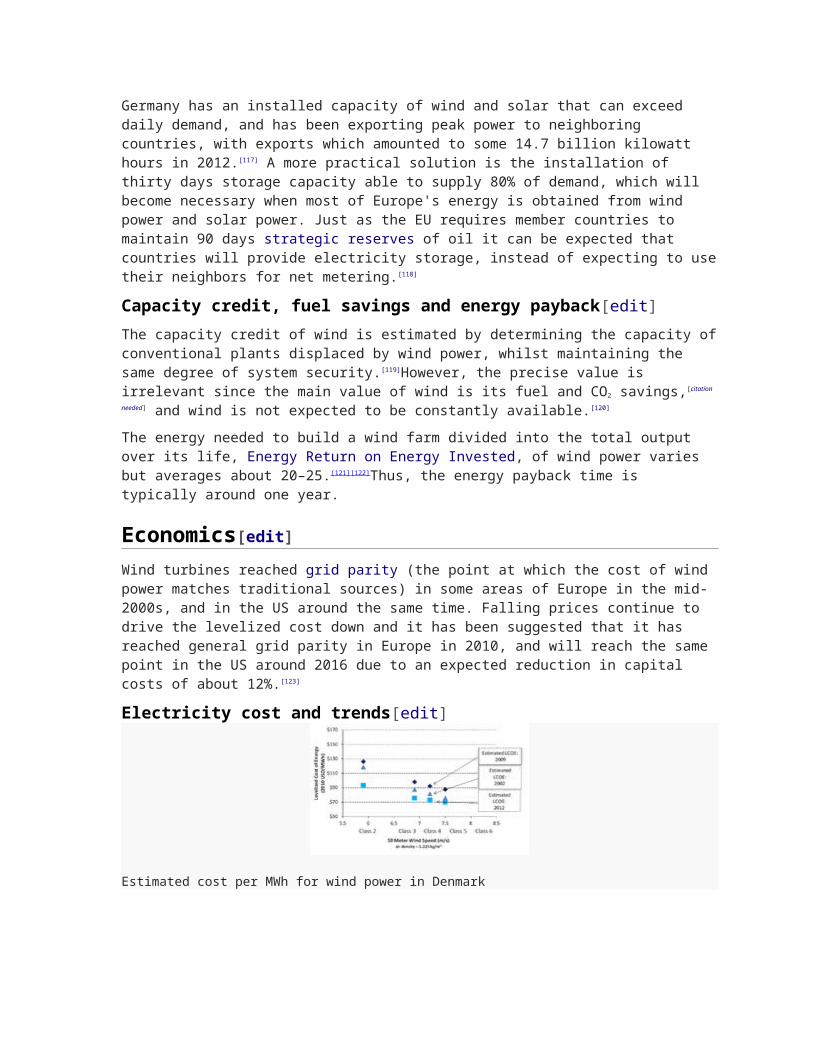
Doppler weather radar, as well as produce excessive sound and vibration levels leading to a decrease in property values.[226]Potential broadcast-reception solutions include predictive interference modeling as a component of site selection.[227][228]
While aesthetic issues are subjective and some find wind farms pleasant and optimistic, or symbols of energy independence and local prosperity, protest groups are often formed to attempt to block new wind power sites for various reasons.[217][229][230]
This type of opposition is often described as NIMBYism,[231] but research carried out in 2009 found that there is little evidence to support the belief that residents only object to renewable power facilities such as wind turbines as a result of a "Not in my Back Yard" attitude. [232]
Turbine design[edit]Main articles: Wind turbine and Wind turbine design. See also: Wind turbine aerodynamics.
Typical wind turbine components : 1-Foundation, 2-Connection to the electric grid, 3-Tower, 4-Access
ladder, 5-Wind orientation control (Yaw control), 6-Nacelle, 7-Generator, 8-Anemometer, 9-
Electric or MechanicalBrake, 10-Gearbox, 11-Rotor blade, 12-Blade pitch control, 13-Rotor hub.
Typical components of a wind turbine (gearbox, rotor shaft and brake assembly) being lifted into
position
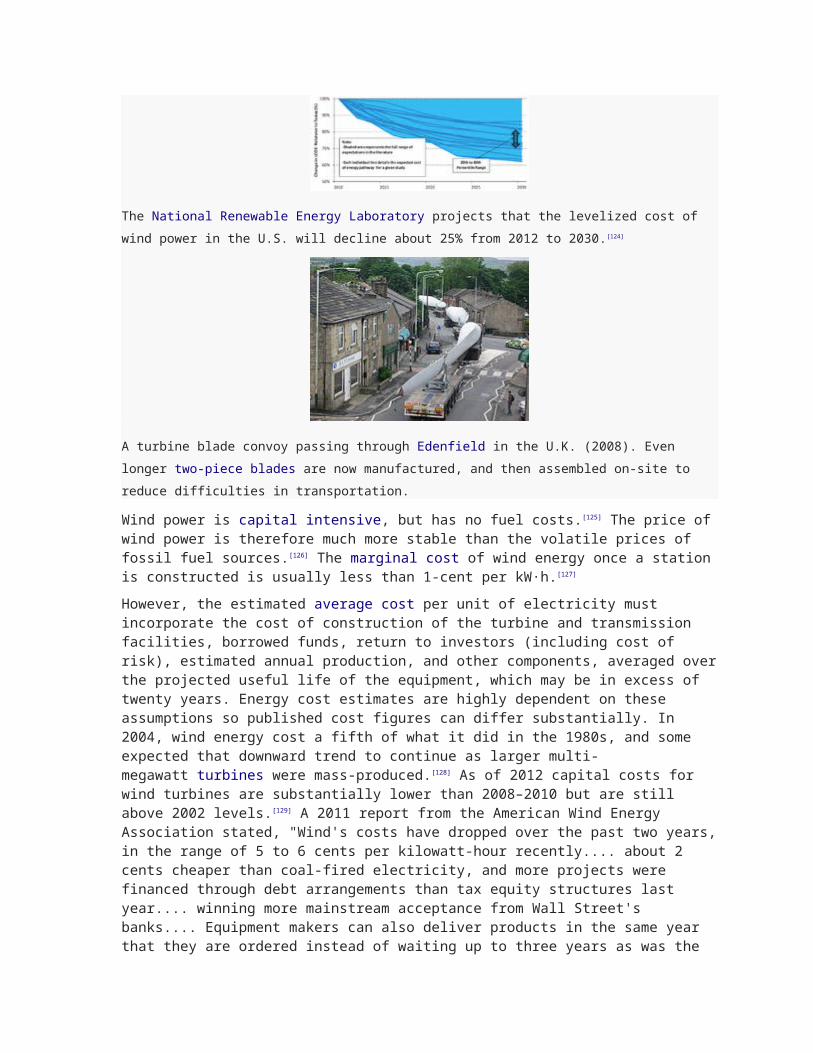
Wind turbines are devices that convert the wind's kinetic energy into electrical power. The result of over a millennium of windmilldevelopment and modern engineering, today's wind turbines are manufactured in a wide range of horizontal axis and vertical axis types. The smallest turbines are used for applications such as battery charging for auxiliary power. Slightly larger turbines can be used for making small contributions to a domestic power supply while selling unused power back to the utility supplier via the electrical grid. Arrays of large turbines, known as wind farms, have become an increasingly important source of renewable energy and are used in many countries as part of a strategy to reduce their reliance on fossil fuels.
Wind turbine design is the process of defining the form and specifications of a wind turbine to extract energy from the wind.[233] A wind turbine installation consists of the necessary systems needed to capture the wind's energy, point the turbine into the wind, convertmechanical rotation into electrical power, and other systems to start, stop, and control the turbine.
In 1919 the German physicist Albert Betz showed that for a hypothetical ideal wind-energy extraction machine, the fundamental laws of conservation of mass and energy allowed no more than 16/27 (59.3%) of the kinetic energy of the wind to be captured. This Betz limit can be approached in modern turbine designs, which may reach 70 to 80% of the theoretical Betz limit.[234][235]
The aerodynamics of a wind turbine are not straightforward. The air flow at the blades is not the same as the airflow far away from the turbine. The very nature of the way in which energy is extracted from the air also causes air to be deflected by the turbine. In addition theaerodynamics of a wind turbine at the rotor surface exhibit phenomena that are rarely seen in other aerodynamic fields. The shape and dimensions of the blades of the wind turbine are determined by the aerodynamic performance required to efficiently extract energy from the wind, and by the strength required to resist the forces on the blade. [236]
In addition to the aerodynamic design of the blades, the design of a complete wind power system must also address the design of the installation's rotor hub, nacelle, tower structure, generator, controls, and foundation.[237] Further design factors must also be considered when integrating wind turbines into electrical power grids.
Wind energy[edit]
Map of available wind power for theUnited States. Color codes indicate wind power density class.
(click to see larger)
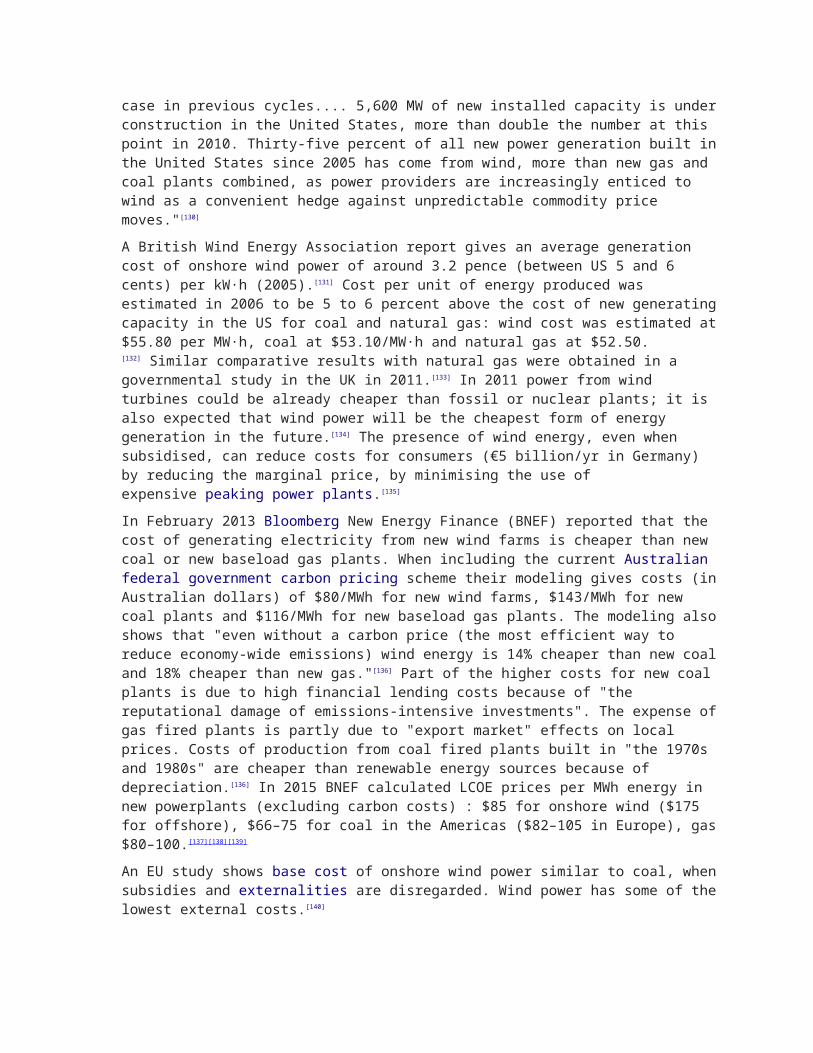
Distribution of wind speed (red) and energy (blue) for all of 2002 at the Lee Ranch facility in Colorado.
The histogram shows measured data, while the curve is the Rayleigh model distribution for the same
average wind speed.
Wind energy is the kinetic energy of air in motion, also called wind. Total wind energy flowing through an imaginary surface with area Aduring the time t is:
[238]
where ρ is the density of air; v is the wind speed; Avt is the volume of air passing through A (which is considered perpendicular to the direction of the wind); Avtρ is therefore the mass m passing through "A". Note that ½ ρv2 is the kinetic energy of the moving air per unit volume.
Power is energy per unit time, so the wind power incident on A (e.g. equal to the rotor area of a wind turbine) is:
[238]
Wind power in an open air stream is thus proportional to the third power of the wind speed; the available power increases eightfold when the wind speed doubles. Wind turbines for grid electricity therefore need to be especially efficient at greater wind speeds.
Wind is the movement of air across the surface of the Earth, affected by areas of high pressure and of low pressure.[239] The global wind kinetic energy averaged approximately 1.50 MJ/m2 over the period from 1979 to 2010, 1.31 MJ/m2 in the Northern Hemisphere with 1.70 MJ/m2 in the Southern Hemisphere. The atmosphere acts as a thermal engine, absorbing heat at higher temperatures, releasing heat at lower temperatures. The process is responsible for production of wind kinetic energy at a rate of 2.46 W/m2 sustaining thus the circulation of the atmosphere against frictional dissipation.[240] A global 1km2 map of wind resources is housed at http://irena.masdar.ac.ae/ , based on calculations by the Technical University of Denmark.[241][242][243]
The total amount of economically extractable power available from the wind is considerably more than present human power use from all sources.[244] Axel Kleidon of the Max Planck Institute in Germany, carried out a "top down" calculation on how much wind energy there is, starting with the incoming solar radiation that drives the winds by creating temperature differences in the atmosphere. He concluded that somewhere between 18 TW and 68 TW could be extracted.[245]
Cristina Archer and Mark Z. Jacobson presented a "bottom-up" estimate, which unlike Kleidon's are based on actual measurements of wind speeds, and found that
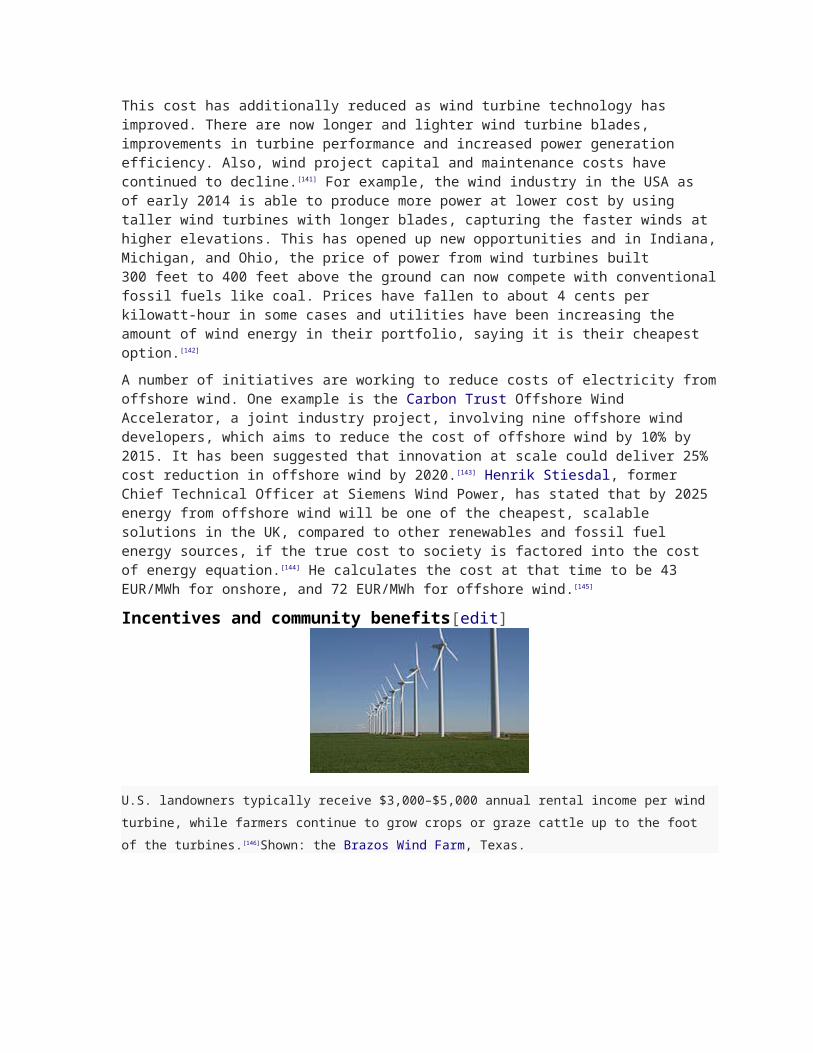
there is 1700 TW of wind power at an altitude of 100 metres over land and sea. Of this, "between 72 and 170 TW could be extracted in a practical and cost-competitive manner".[245] They later estimated 80 TW.[246] However research at Harvard University estimates 1 Watt/m2 on average and 2–10 MW/km2 capacity for large scale wind farms, suggesting that these estimates of total global wind resources are too high by a factor of about 4.[247]
The strength of wind varies, and an average value for a given location does not alone indicate the amount of energy a wind turbine could produce there.
To assess prospective wind power sites a probability distribution function is often fit to the observed wind speed data.[248] Different locations will have different wind speed distributions. The Weibull model closely mirrors the actual distribution of hourly/ten-minute wind speeds at many locations. The Weibull factor is often close to 2 and therefore aRayleigh distribution can be used as a less accurate, but simpler model.[249]
Related Documents