


GEOPHYSICAL STUDIES IN LAMU EMBAYMENT TO DETERMINE ITSSTRUCTURE AND STRATIGRAPHY
BY
Silas Masinde jSimiyu
Ta,s TaiK, Tna mTrn, />f. '
; n?pr,c« ' ^ , . v. 'A*r ***{r; n .. '■■o
Uj.A thesis submitted in partial fulfillment
for the degree of Master of Science
(Geology) in the University of Nairobi.
Nairobi, 1989.
UNIVERSITY OF MAfROirrU B S A R V

This thesis ie my original work and has not been presented a degree in any other university
Silas Mssinde Simiyu
This thesis has been submitted -for ex ami nat ion with our knDwledoe as University supervisors.
*
F.5. Er.ocai
3 .D. InJ v a ok
\A
a<Ao
tor

(iii)
CONTENTS
I LIST OF FIGURESII ABSTRACTIII ACKNOWLEDGEMENTS
CHAPTER 1
Page
(vi)(vii) (x)
INTRODUCTION
LOCATION, PHYSIOGRAPHY AND COMMUNICATION 1 .2 PURPOSE OF THE STUDY1.3 GEOLOGICAL SETTING1.4 EXPLORATION HISTORY
CHAPTER 2
1
36
6
GRAVITY SURVEYS AND DATA INTERPRETATION2.1 INTRODUCTION2.2 SURVEY PROCEDURE2.2.1 GRAVITY MEASUREMENTS2.2.2 ELEVATION MEASUREMENTS2.2.3 MONITORING OF INSTRUMENT DRIFT2.2.4 DENSITY DETERMINATION2.3 DATA REDUCTION
2.3.1 ELEVATION ESTIMATION AND ACCURACY2.3.2.1 DRIFT CORRECTION2.3.2.2 TIDAL CORRECTION2.3.2.3 LATITUDE CORRECTION2.3.2.4 TERRAIN CORRECTION2.3.2.5 FREE AIR CORRECTION2.3.2.6 BOUGUER CORRECTION
16171718 18 22242526 29
29
30
30
32
(iv)
2.4 ACCURACY OF THE SURVEY2.5 INTERPRETATION OF THE DATA2.5.1 QUALITATIVE INTERPRETATION2.5.1 .1 THE BOUGUER ANOMALY MAP2.5.1.2 REGIONAL FIELD SEPARATION2.3.1.3 INTERPRETATION OF STRUCTURES2.5.2 QUANTITATIVE INTERPRETATION OF STRUCTURES2.6 DISCUSSION OF GRAVITY RESULTS
CHAPTER 3
SEISMIC SURVEYS AND DATA INTERPRETATION3.1 INTRODUCTION3.2 DATA ACQUISITION AND QUALITY3.3 REFLECTION IDENTIFICATION3.4 MIS-TIES AND THEIR CORRECTION3.5 DIGITISATION OF SEISMIC SECTIONS3.6 TWO WAY TIME MAP CONSTRUCTION3.7 VELOCITY DETERMINATION3.8 DEPTH CONVERSION3.9 CROSS SECTIONS FROM SEISMIC SECTIONS3.10 INTERPRETATION OF DATA3.10.1 GENERAL STRUCTURE3.10.2 SEISMIC STRATIGRAPHY3.10.3 MAJOR SEISMIC STRUCTURES3.10.4 UNCONFORMITIES
DISCUSSION OF SEISMIC RESULTS
3233353538415470
7475808183838587889090939496
3.11 97

(V)
CHAPTER 4
WELL LOG DATA INTERPRETATION4.1 INTRODUCTION4.2 STRATIGRAPHY4.3 DISCUSSION OF WELL LOG DATA
CHAPTER 5
GEOLOGICAL SYNTHESIS OF GEOPHYSICAL AND WELL LOG DATA5.1 STRUCTURE5.2 BASIN GEOLOGICAL HISTORY
CHAPTER 6
PETROLEUM POTENTIAL OF THE BASIN6.1 STRATIGRAPHIC EVIDENCE6.2 STRUCTURAL EVIDENCE
CHAPTER 7
CONCLUSIONS AND RECOMMENDATION
CHAPTER 8
136139
141
1 44REFERENCESAPPENDICES-GRAVITY DATA 154


(Vi)
LIST OF FIGURES
FIG Page
1.1 Location and communication map of the study area. . 2
1.2 The extent of Lamu embayment 6
1.3 Communication, Seismic lines, gravity stations
and well location map. 11
1.4 General stratigraphy of Lamu embayment 13
2.1 'Single base' method illustration 19
2.2 Drift correction curves 21
2.3 Density determination Profiles 23
2.4 Bouguer anomaly map 362.5 Regional anomaly Profile 39
2.6 Gravity profile GP 1 43
2.7 Gravity profile GP 2 45
2.8 Gravity profile GP 3 46
2.9 Gravity profile GP 4 48
2.10 Gravity profile GP 5 49
2.11 Gravity profile GP 6 52
2.12 Gravity profile GP 7 53
2.13 The fit of a cylinder model to gravity profiles 56
2.14 The fit of a cylinder model to gravity profile GP 1 59
2.15 The fit of a cylinder model to gravity profile GP 2 60
2.16 The fit of a cylinder model to gravity profile GP 3 61
2.17 The fit of a cylinder model to gravity profile GP 4 62
2.18 Proposed model for the formation of Walu-Pandanguo
anticline 64
2 19 Validity of depth estimation assumption 68
2 20 The fit of a cylinder model on profile GP 6 69

(vii)
FIG
2.21
3.13.23.34.1
4.2
4.3
5.1
TABLE
3.1
LIST OF FIGURES
Page
The extent of oceanic crust in Lamu embayment Two way time (TWT) maps. (In pocket)Cross sections of the study area Rose diagram of fault orientation in the area Well correlation diagram of Walu, Pundanguo and Kipini wells.
Well correlation diagram of Kipini, Pate, Dodori and Mararani wells.Fence diagram of Walu, Pandanguo, Kipini, Pate, Dodori and Mararani wells.Structural map of Lamu area
73
8991
103
1 04
121
127
LIST OF TABLES
Velocity values in Pate well. 86Depth conversion table from time and velocity3.2 87

(viii)
ABSTRACT
The area of study comprises part of one of the hydrocarbon- potential basins in kenya; the Lamu basin. Major transgression and regression cycles dominated the area during different Mesozoic times. These depositional cycles together with tectonics associated with rifting and separation of Gondwanaland and also of Madagascar from Africa and the occasional doming of central Kenya resulted in a highly deformed basement with thick sedimentary cover due to subsidence and tilting.The study of the Geophysical anomalies in the area, indicated by gravity and seismic data as well as the study of 6 deep wells drilled within the area revealed that the major tectonicdisturbances of the area were caused by basement complex block faulting.
Bouguer anomalies indicate major basement variation in the northwest of the study area. Towards the coast, it becomes featureless with a two fold gravity gradient. This is attributed to the thinning of the continental crust and the presence of oceanic crust below the coastal sediments.The analysis of seismic data has shown that structures in the area are fault controlled. The major fracturing is mainly along a NNW-SSE direction. A minor trend in a NE-SW direction has been confirmed.It has also confirmed the presence of rounded closed highs that represent potential drilling locations. Well logs have shown

(ix)
that the area has good source reservoir and caprocks that could combine very well with the closed highs to accumulate oil and gas pools.

(X)
ACKNOWLEDGEMENTS
Thanks are due to Dr. P.S. Bhogal Department of* Physics University of Nairobi for his supervision of the thesis, encourangemenf, discussions and suggestions that have led to the completion of this project.
Prof. I. 0. Nyambok, Chairman, Department of Geology University of Nairobi who encouraged me to take up Petroleum Geology as a course, organized with the Ministry of Energy and Regional Development for me to receive data (on Lamu) from the National Oil Company of Kenya and supervised the project to its completion receives my deepest appreciation.
I wish to thank Mr. E.W Dindi of the Department of Geology, University of Nairobi for his constructive criticism, especially on gravity and seismic interpretation.
I am grateful to the German Academic Exchange Service (DAAD) for giving me a scholarship that has enabled me to do my postgraduate studies at the University of Nairobi. The National Council for Science and Technology (N.C.S.T.) for sponsoring the research and the Department of Surveying and Photogrammetry of the University of Nairobi for allowing me to use their field equipment.
Special thanks go to the administration police of Witu (Lamu district) who gave me the necessary security while doing my fieldwork, Miss Florence Kayere of the Department of Geology, University of Nairobi who typed my work, and to my wife Jane for her patience and continuous encouragement throughout the M.Sc.course.

-1-
1. INTRODUCTION
1.1 Location, Physiography and Communication
Lamu area is located in the northern part of Kenya coast, about 350 km north of Mombasa (Fig. 1.1.). The area for the purpose of this study is bounded by latitudes 1.500°s and 2.500°S and longitudes 40.00°E and 41.75°E. It covers an area of about 24000 km2 and constitutes part of Block 5; one of the blocks earmarked by the Government of Kenya for leasing as part of the current oil exploration intensification programme.
The area may be divided into two physiographic units, namely the coastlands and the Tana river regions. Geomorphologically, the coastal plains consist of alluvial lowlands of the Tana river delta with accumulations of terrigeneous material brought in by the Tana river. The material is moved along the coast by longshore and coastal currents, forming wide beaches with arrays of dune ridges behind them. The Tana river strip forms a belt of dense bushes and swamps. Elevation changes are gradual andgenerally show a decrease towards the sea, or more locallytowards the Tana river. The hiqhest ■j-ynesr elevation being slightlymore than 70 in above sea level around Walu.
The area is served by two major roads and one dry weather road. The main Garissa-Garsen road traverses the western part of the area with motorable tracks branching off to Masalani and Mai.
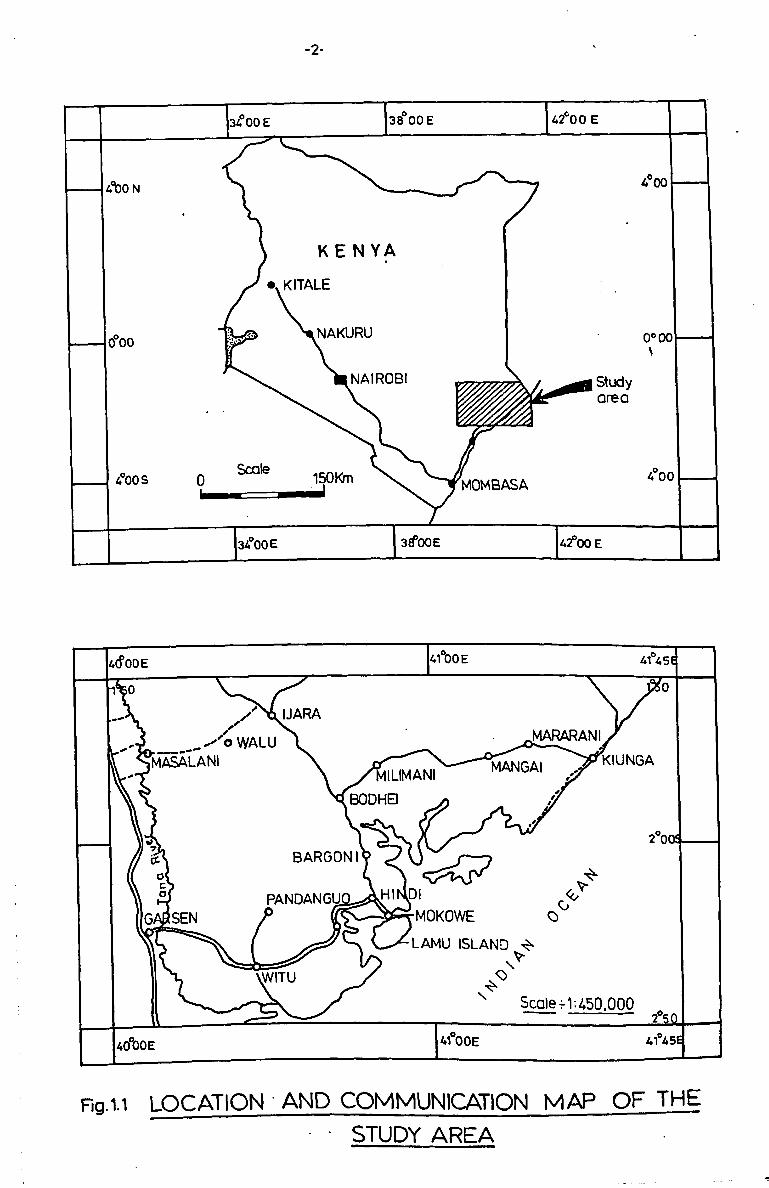
-2-
Fig. 1.1 LOCATION AND COMMUNICATION M AP O F THESTUDY AREA

-3-
The second major road traverses the southern part from Garsen through Witu to Lamu with motorable tracks branching off to Kipini and Pandanguo. A dry weather road crosses the middle of this area southwards through Ijara, Bodhei, Majengo and Hindi with a branch to Mararani and Kiunga. The presence of thorny bushes and poorly drained marshy grassland make communication difficult, especially along the Tana river strip which forms a belt of 1 - 3 km wide of heavy dense bushes. Towards the coast, are shallow lakes and on the main coastland are tidal flats covered by beach sands, muds, silts and alluvials with mangrove forests in some parts. All these contribute to the communication problems in the area.
1.2 PURPOSE OF THE STUDY
Geophysical survey of Lamu area by oil companies using gravity and seismic methods revealed that Lamu area comprises a sedimentary basin of great thickness and of a complex structural nature. (01Hollarain, 1971).
Selley (1985),Chapman(1973) and North (1984) noted that prior to the late seventies oil exploration companiss* confidentiality of results and economic consideration outweighed the need to systematically analyse and explain the formation, the relationship between structural element fabrics, the tectonic factors concerned and the geologic history of a potential field. The companies generally looked for direct indicators for the presence of oil and gas.

-4-
A potential trap was delineated and a test-well drilled with the recovered cores being analysed for presence or absence of hydrocarbons. The results were classified as confidential for a long time. This method was more economical and faster for the oil companies but not favourable for understanding the area's subsurface geology and hence petroleum potential.The writer was charged with the task of carrying out the analysis of the structural, stratigraphic and tectonics of the area using the old gravity, seismic and well log data that were acquired by oil companies (O'Hollorain 1971) ( which are no longerconfidential) and kept with National Oil Company of Kenya (NOCK). These data were first to be tested for quality and completeness and where possible acquire new data before interpretation was done.
By using the oil companies and his own data, the writer aimed at:(i) Delineating the basement characteristics using gravity
data.(ii) Delineating sedimentary structures and lithologic
thicknesses from seismic reflection data.(iii) Determining the palaeoen^ironments of deposition and
lithologic variations from well data.(iv) Determining (from i, ii, and iii) the structural fabrics
(faults and folds) of the study area, their trends and the distribution of major and minor structural elements.
(v) Evaluating the sedimentational and structural history ofthe area.

-5-
The above procedures were used to determine the presence of potential oil traps, their type, controls on their condition, extent, pattern and trend. It was also determined whether the palaeo-environmental conditions were favourable for abundant occurrence of petroleum generating organisms.
1.3 GEOLOGIC SETTING
The study area is geologically part of the Lamu embayment (Fig. 1.2). It does not have many rocks outcropping and is covered by superficial sands of fluvial origin associated with the Tana river drainage basin. Along the coastline are sands associated with longshore currents. The only rock outcrops^’are Pleistocene limestones encountered at Mokowe, Witu, Pate island and Lamu island and Upper Miocene limestones at Walu.
V
In the present study, the only reliable information on the near surface geology was obtained from shallow wells drilled in the study area by BP-Shell (1959) and from water boreholes. The well data shows that superficial deposits overlie Pleistocene raised reef and back reef limestones which are shallow water, sandy and detrital. Underlying the Pleistocene reef limestones is a succession of Pliocene sands, marly carlcareous with marine fossil foraminifera. These beds appear nearly horizontal and have light brown rounded quartz grains, garnet and sandy clays. These in turn are underlain by Miocene limestones withinterbedded shales and , minor calcareouscyclic sedimentation.
sandstones showing

-6-
Fig. 1.2 THE EXTEND OF THE LAMU EMBAYMENT ANDLOCATION OF THE STUDY AREA WITHIN THE
EMBAYMENT

-7-
1.4 EXPLORATION HISTORY
Very little geologic work has been done in the study area and therefore information on the geology is scarce. Most of the geological work has been done in the southern and the western part adjacent to this area. Gedge (1892) mapped the western part of the area, mainly centered on the Tana river region. He suggested that the Tana river was an outlet in an alluvial delta. Hobley (1894) worked in the western part of the Tana river and noted that the area was covered by alluvial sediments which extend up to 39th meridian where rocks of the basement system are exposed.
Matherson (1963) did some reconnaissance work at Galole and Lamu. In Matherson's discussion of the geology, he noted that the area was covered by superficial soils of Pleistocene to Recent age and that the underlying geology can only be inferred from the change of the type of soil cover.
Williams (1962) mapped the Fundi Isa area which is to the south of the present area. He reported a thick series of sandstones, siltstones and shales deposited under sub-aerial and lacustrine conditions which he correlated with the middle and upper members of the Permo-Triassic Duruma formation that occurs further south. He further reported a sequence of fossiliferous upper Jurassic marine sediments with conglomerates and overlying

-8-
fossiliferous limestones occupying a narrow belt across the area and a wide variety of Quaternary deposits occurring in the area which include Pleistocene lagoonal clayey sands and marls, reddish dune sands, poorly exposed raised coral reefs and associated conquinoid limestones. A thin series of fluviatile sediments which he thought to have been deposited in the lower Pleistocene times was also reported. In his report, he discussed vast areas mantled by reddish brown wind blown sands which are probably of late Pleistocene age. Recent deposits include marine sands and muds flanked by high coastal dunes with a prominent development of alluvial silt. Seawards, he reported a thin series of marine sands and clays with bright red clayey sands of Oligocene age. He also reported a gentle fold in the area with NNW-SSE axis and inferred faults with trends NNW-SSE and NNE- SSW. He suggested that faulting and folding took place after the Upper Jurassic times with a possibility of further faulting during the lower Miocene.
Stockley (1928) noted that the NNE-SSW faulting along the Kenyan coast was related to late Miocene rift faulting, noting that the structure parallels one of the common East African rift valley trends.
The exploration for oil along the Kenyan coast started in 1933 when H.G. Busk and J.P. de Vertuil from the Darcy Exploration Company and the Anglosaxony Petroleum Company Limited mapped the Kenyan coast with a view to determine the petroleum potential of

-9-
the region (Busk H.G., and de Veruil J.P.1933). They noted that there was no folding in the general sense throughout the area, but only gentle warping connected with fault movement after deposition. Dips were mostly very low 20 - 3o which increasedtowards the coast. They concluded that commercial oil could not be found on the Kenyan coast because the thickness of impervious sedimentary rocks is too small. They argued that if oil occurred then there was abundant opportunity for seepages as the area is highly faulted which in fact had not been recorded.
In 1959 four shallow wells (Lamu 1, Lamu 2, Lamu 3, and Lamu 4) were drilled by BP-Shell within the area. The aim was to obtain stratigraphic information in view of lack of exposures and to investigate the presence of structural features that could form potential traps. From the four wells, the stratigraphy was correlated resulting in the succession below:1. Superficial sands of fluvial origin associated with the
Tana river drainage.2. Pleistocene raised reef limestones and back reef deposits.3. Pliocene succession of calcareous sands with marine
fossils.4. Miocene limestones with interbedded shales and minor
calcareous sand showing cyclic sedimentation.
The correlation and horizontal dips indicated that overlying beds had not been disturbed much. This implied that structures

-10-
indicated by gravity anomalies do not affect beds of younger age and are therefore deep seated. During drilling, several shows of dry and wet gas were encountered.
Most of the geophysical work was done between 1954 and 1971. The gravity data in Lamu Embayment was collected by Geopprosco and BP-Shell between 1954 and 1971. Geopprosco's gravity survey consisted of 1600 km of widely spaced traverses along available roads(Fig.1.3). A Worden gravimeter NO. 212 was used throughout and an accuracy of l.g.u was estimated from the gravity observations. The survey was related to the gravity base at the Mombasa Airport (l.G.B. No. 357495) Elevations were determined using theodolites and standard levelling practice. An accuracy of 0.3 m was estimated although an error of 5.5 m was noted. Positioning was by airphotos and mosaics, magnetic compasses and 1:500,000 maps, an accuracy of 30 m North-South being claimed between stations. No terrain corrections were applied. The BP- Shell data was obtained in the same way as Geopprosco's where 1 :500,000 tie line copied scale maps were used. From this gravity data, the outline of the Lamu basin was delineated. Seismic data was acquired by BP-Shell (1954-1971). The seismic surveys were used to delineate a number of seismic highs on which deep wells were drilled(Fig 1.3). The analysis of the gravity, seismic and well log data by BP Shell (1971 ) delineated complex structural features within Witu-Kipini area. The structural elements were divided as follows (0'Hollarain, 1971)


22QC
----- -MAJOR ROADS
--M O R TO R A B U E TRACKS
.........SEISMIC UNE INTERPRETED
......-SEISM IC LINE ALONG ROAD
--------GRAVITY STATIONS BY OIL COMPANIES
........ GRAVITY STATIONS BY THE AUTHOR
.........DRILLED WELL — DRY
.........DRILLED WELL — GAS SHOW
5 10 15 20Km

-12-
1 . The Tana syncline with a NNW-SSE axis flanking the Kipini anticlinal structure on the western side and having a number of NNW-SSE faults.
2. The Kipini-Pandanguo anticlinal structure which extends from Walu southwards through Pandanguo-Witu to Kipini.
Walters and Linton (1973) correlated the stratigraphy from deep wells drilled by BP-Shell within and outside the present study area (Fig. 1.4). and noted that the Lamu embayment contains sediments of up to 1 0,000m thick, varying in age from Carboniferous - Permian (Karroo) to Quaternary. The earliest marine beds being middle Jurassic in age and most of the subsequent Mesozoic and Tertiary stages being represented in the overlying sedimentary succession. Basement highs were initiated during the end of Cretaceous and early Tertiary by large scale normal faulting. Regional epeirogenic movements occurred at the beginning of the Middle Eocene, near the close of the Oligocene and also in mid—Pliocene times in each case affecting profoundly the depositional regime within the embayment.
In discussing the stratigraphy of the Kenya Coast, Karanja (1982) reported that the Tertiary sediments of Lamu overlie older sediments with an unconformity and represent a distinct cycle of deposition. He suggested that Karroo age deposits of the order of 4000-6000 m thick underlie the Jurassic and younger sediments. He further reported that the Mombasa—Lamu basin wasinitiated as

-13-
AGEPlio - Quaternary /
Miocene
Oligocene
Eocene
Upper /
Middle
Lower
Upper
Middle
Lower
Palaeocene
UpperCretaceous
LowerCretaceous
Albian
Aptian
Neocoman
M /U Jurassic
NW
MissingMissing
_ 0 - 0 _
t-JZtZ—ET.r> 6 • #
SE
0- 0~ T>_* vj>- D — O - f c -
- l - L.-6- -
CD 1 M ,C t t t i■ — i l l01 M i lo> '•vfVi'pTr'A:E I I I T
E m stm
Metersr 0
-2000
-3 0 0 0
■•••■•••••• :=:- ••••••-y?-7-:.:
1000
-cooo
-5000
-6000
-7000
L-8000
White to brown sand and gravel
NW-Variagated mudstone red-brown to green
SE — Limestone —vuggy white to brown
N W - Interbedded triable sandstone and gravel
SE— Same as above
Limestone interbedded with grey calcareous shale and sandstone
Grey to tawn algal limestone
Interbedded limestones
Grey to green calcareous mudstone
Dark grey pyritic mudstone and shale
Interbedded quartzites
Grey shale
Fig. 1.4 GENERALISED STRATIGRAPHY 0FLAMUEMBAYMENT
(A fter Walters and Linton, 1973)
-14-
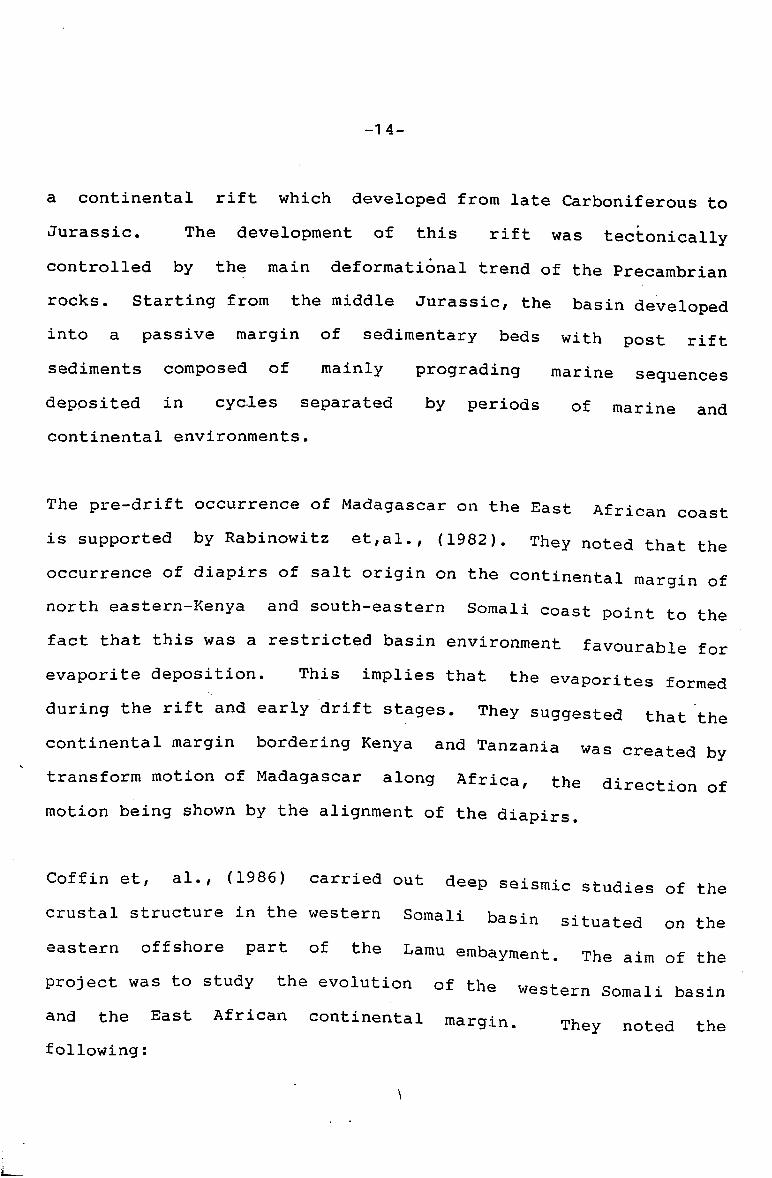
a continental rift which developed from late Carboniferous to Jurassic. The development of this rift was tectonically controlled by the main deformational trend of the Precambrian rocks. Starting from the middle Jurassic, the basin developed into a passive margin of sedimentary beds with post rift sediments composed of mainly prograding marine sequences deposited in cycles separated by periods of marine and continental environments.
The pre-drift occurrence of Madagascar on the East African coast is supported by Rabinowitz et,al., (1982). They noted that the occurrence of diapirs of salt origin on the continental margin of north eastern-Kenya and south-eastern Somali coast point to the fact that this was a restricted basin environment favourable for evaporite deposition. This implies that the evaporites formed during the rift and early drift stages. They suggested that the continental margin bordering Kenya and Tanzania was created by transform motion of Madagascar along Africa, the direction of motion being shown by the alignment of the diapirs.
Coffin et, al., (1986) carried out deep seismic studies of the crustal structure in the western Somali basin situated on the eastern offshore part of the Lamu embayment. The aim of the project was to study the evolution of the western Somali basin and the East African continental margin. They noted the following:
\

-15-
1 . Madagascar island fits very well on the Tanzania-Kenya- Somali coast and especially at Lamu.
2. Crustal structures on the Lamu coast are similar to those found on many passive margins around the world.
3. The mantle dips landward and disappears beneath a thick wedge of continental rise sediments.
4. The Jurassic sediments.overlie the oceanic crust.5. The Karroo sediments do not extend seaward from the
mainland onto the Somali basin.
An attempt has been made to establish the existence of a palaeo-triple junction of Jurassic age in Eastern Kenya (Reeves et. al1986). They postulate that two arms represented by the Mombasacoast and Somali coast respectively developed into part of theIndian Ocean. The third arm (Anza graben) which is concealed bya cover of Quaternary sediments and volcanic rocks remains asrifted, sediment filled trough extending at least as farnorthwest towards the Lake Turkana. A geometrical fault patterncorrelation with the well established mid-Cretaceous Niger deltais attempted whereby, the Anza trough is correlated with theBenue trough. They however note that for th-id .oi-u-Ls triple-junctionto exist the pre-drift Madagascar has to be re-assembled in close proximity to the Tanzania-Kenya-Somali coast.

-16-
2. GRAVITY SURVEY AND DATA INTERPRETATION
2.1 INTRODUCTION
Gravity data on Lamu was collected by BP-Shell (1954-1971) and Geopprosco (1955). The BP-Shell data used in the present study was noted by Swain and Khan (1977) to contain a series of suspected errors arising from the use of incorrect density values. Besides this, the quoted coordinates could be inaccurate due to 1:500,000 scale maps used which had been tie-line copied. Geopprosco1s (1955) survey consisted of 1600 km of widely spaced traverses, mainly along available roads and motorable tracks that existed by then with a station interval of 5 km being used.
The data acquired by both BP-Shell and Geopprosco was found inadequate by the writer due to wide traverses and station spacing used. The large scale maps and density values used were suspected to have affected the Bouguer and latitude corrections. In some areas where there was no proper communication, data was not collected at all. It was therefore necessary to do more work in the area to cover some of the sections that had not been mapped and to reduce the traverse and station spacing in order to improve on the data coverage. Density value for the area were to be determined and used as a check on the oil companies' results.

-17-
2.2 SURVEY PROCEDURE
2.2.1 GRAVITY MEASUREMENTS
Gravity survey and altimeter heighting were done simultaneously. Density determinations were carried out using the density profile method proposed by Nettleton (1962) to be discussed in section 2.2.4. Gravity observations were made at 205 stations using a Worden gravity meter (Gisco Model C.G.2 No. 232 G). The location of gravity base station was planned in advance based on the density of the BP-Shell data in the area. The survey was related to and tied to an international base station No. 1GSN71, value9780346.1 g.u. at Mombasa airport. Gravity stations wereestablished along roads and motorable tracks. a few stations were established at trigonometrical points. An approximate station spacing of 3 km was used and vehicle odometer was used to obtain this spacing. Position control was obtained by use of a prismatic compass, visual observation of road orientations junctions and drifts on topographic maps of scale 1:50,000 S base stations were located at road junctions for futur relocation.
I X
e
The precision of gravity readings was about 0.01 mgals and amaximum loop closure error estimate of 0 5 rn-u-r <aj_s . inis was doneusing the Geodetic survey method proposed by Clack(1944)
Most of the literature published concerning gravity field practice stresses the importance of returning to a base station every two to three hours to monitor and make corrections .for the

-18-
instrument drift. This practice was only used in a few cases due to the difficulty of communications in the area. However, it will be shown in section 2.2.3 that gravimeter drifts- could be adequately monitored and corrected for without such frequent base station readings.
2.2.2 ELEVATION MEASUREMENTS
The single base method, Swain and Khan (1977) was used. In this method two Pauline altimeters were used. At the start, both altimeters A1 and A2 were read simultaneously at the base station, then one altimeter was read continuously at the base station and A2 used for the roving measurements, (Fig. 2.1). As the work continued, the altimeter A1 at the base station was read at suitable intervals (10 minutes) so tnat a graph of the diurnal variation was drawn and used to correct for the values of A2. At the end of the field traversing the two altimeters were read at the base to check for vibration induced drifts in the field altimeter A2 and to complete the drift curve.
2.2.3 MONITORING OF INSTRUMENT DRIFT
Accuracy standards of gravity surveys are set so as to ensure signal/noise ratio large enough to adequately 'see' the target. The field data are therefore monitored right from the acquisition stage in order to arrive at a realistic estimate of the final plotted Bouguer anomaly. One of the parameters that requires very careful monitoring is the drift of the gravity meter used.
L

-19-
G R A V I T Y S T A T I O N N U M B E RBASE 1 2 3 A 5 6 7 8 9 1 0 11 1?Ai b
h b A2t3 Al A2Tu A i _ A
X A 1 A .T6 A1 Ao•»
X A]_ _ _ _ A lS
_ _ _ _ _ _Tft Ai a 2
T9 X . J a 2 •
J p Ai X- - - - “t
J f lJ A]_ _ _ A 2Tl2 A1 a 2
13 A 1 a 2 •
3 s . A]_ _ _ A - •
TiS A]_ _ _ A 2h A]_ _ _ A?b * L _ A?b A, A?% Ai A ?T20 1_ _ _ _ a 2h A1 a 2
h i*1 a 2
b i 1 a 2
b Ai A2 ! I
F I G . 2*1 F I E L D PROCEDURE IN THE SINGLE BASE METHOD
lira ;< L.-iwk b .. j u . t. ..rJ - t a j iim .

-20-
In this survey daily drift curves were studied to isolate suspect stations that could be repeated or discarded altogether. The practice in most cases was to take a morning start-of-loop base reading and a mid-day end-of-loop base reading, then a mid-day start-of-loop base reading and an evening end-of-loop base reading. Thus there were at least four base readings in a day. During the survey, more than 30% gravity station repeatability was ensured.
Repeat differences were calculated as repeat observed gravity minus original observed gravity. The repeat differences were used to plot daily drift curves as follows:(i) The drift value was plotted along the vertical axis, the
morning base (MB) reading was defined as having been read at zero time.
(ii) The days's drift was given by evening base reading (EB).minus morning base reading (MB) i.e. gEB - gMB
(iii) The EB reading was represented by a point at (tEB, gEB - gMB)
(iv) A straight line joining the origin (MB) with NB (Noon Base reading) and EB then represented the assumed drift over the day. The introduction of NB into the curveacted as a check on the accuracy of tne curve.
The assumed linear curve was then tested by plotting one point for each repeat reading. If they lied close to the drift line and were randomly distributed above and below the line (Fig. 2.2)

G (m
gal)
F
- 21-
o ? d r if t a n d t id a l e f f e c t s c o r r e c t io n
F,g'2 ' CURVE
-22-
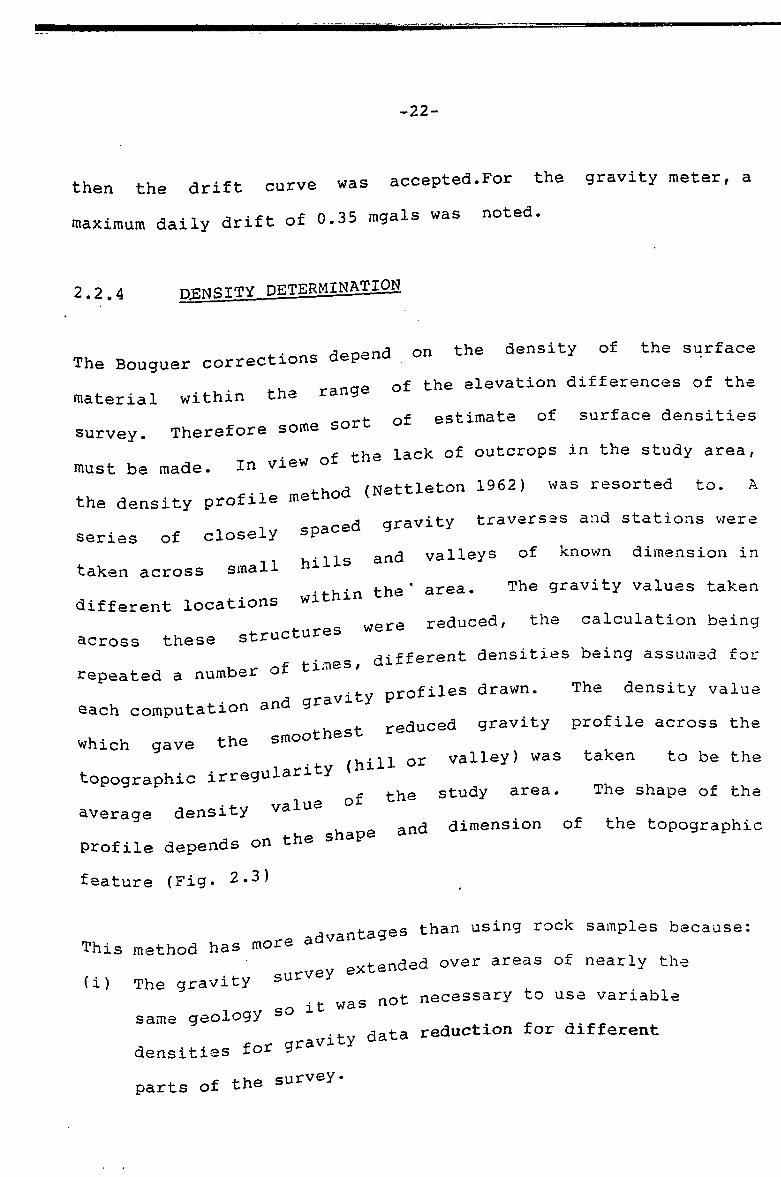
then the drift curve was accepted.For the gravity meter, a maximum daily drift of 0.35 mgals was noted.
2.2.4 OF.MSTTY determination
^ ^ jpnend on the density of the surface The Bouguer c o r r e c t i o n s Pof the elevation differences of theMaterial within the 9
of estimate of surface densitiessurvey. Therefore some sore■p fhP lack of outcrops in the study area,must be made. In view o
method (Nettleton 1962) was resorted to. A the density profile mj aravity traverses and stations wereseries of closely spac
. , and valleys of known dimension in taken across small 1
.,hin the * area. The gravity values taken different locations within thewere reduced, the calculation beingacross these structuresdifferent densities being assumed forrepeated a number of time /
tHtv profiles drawn. The density valueeach computation and gra . reduced gravity profile across thewhich gave the smoothes
nr valley) was taken to be thetopographic irregularity ( h x U■p Hie study area. The shape of th^
average density value of and dimension of the topograph-’profile depends on the shape feature (Fig. 2.3)
tages than using rock samples because:This method has more a .vtpnded over areas of nearly the(i) The gravity survey not necessary to use variable „ . co it was isame geology s° .. data reduction for differentdensities for gravity
of the survey-
ic
parts

a-23-
Fig.2.3 GRAVITY PROFILES FOR DETERMINATION OF ~ SUB-SURFACE DENSITY
I
(Met
ers)
-24-
(ii) It averages the actual densities in a way that would be impossible in working from surface samples.
(iii) It samples comparatively large mass of material.This method has also some disadvantages as noted by Dobrin (1976). It is known that topographic features owe theirexistence to contrasts in lithology, thus they may not be necessarily representative of the areas' density value. Errors due to this effect were corrected for by using small hills and small valleys of nearly the same dimension and then finding an average. The effect of erosion resistant materials on the hills is partly cancelled by the effect of the less resistant material forming valleys.
2.3 DATA REDUCTION
To investigate subsurface variation from the gravity data obtained during a survey, the data cannot be used in the form in which it is obtained. Observed gravity values depend on latitude, elevation, topography around the station and on the distribution of mass within the earth. When contribution due to the above first three factors except the fourth have been corrected for, what remains is the contribution due to density contrasts from ground level downwards. The anomalous gravity field that result is the Bouguer anomaly. Isolation of the contribution due to the density variation in the crust is achieved by using methods of removing the longest wavelength
-25-
components, assuming that these are due to density variations in the upper mantle. The outcome of the regional separation is a residual anomaly map which can be interpreted in terms of density contrast in the earth. The various corrections performed and data reduction procedures applied to the data areoutlined in this section.
2 3 «| klevatton ESTIMATION AND ACCURACY-
To test for the accuracy of altimeters, some trigonometric pointsware included. The greatest problem withof known eievdLiuua
altimeter surveying is that air pressure at any point on earth„,n = fant-.lv due to changing weather patterns. Thechanges constaru-iy
calculation of elevation from fixed (single) base altimeter data4-ho assumption that the changes in air pressure is based on the as^um^
, . ^ ^ints. the base station and the field stationbetween the two points,. - OYortlv in time and space of change. Thus thewill coincide exacuxy. air nressure between the two points is assumed difference m air pressuj tThnilv attributable to elevation differences. This constant and wnoi y-5 a unrealistic as the changes are normally not the assumption is unrwx^
. _ . a certain distance between the two points, same within a
For this assumption to hold, a distance of radius less than 25 km, altimeter A2 and base altimeter A1 was ensured,between the riexu »Temperatures were monitored using a pair of whirling hygrometer (wet and dry bulb). Temperature effects on the altimeter were corrected using a chart provided by the manufacturer. Some

-26-
altimeter readings were taken at known trigonometric points. This gave a maximum error of 4.0 metres. After the survey, stations were joined up into a network of loops and a check on the survey accuracy made. This gave a closure error of 3.2 metres which was distributed by using the least square method (clendinning and Oliver,1969). This reading error was reduced by taking three readings at a station and averaging them to get the optimum value. This could possibly give an error of about 0.01 of a metre. The calibration error is noted to be very small(0.01 of a metre).
When repeat readings were taken at the old BP-Shell station, a maximum difference of approximately 3 metres was noted. This
t-n he due to altimeter inaccuracies, limitations difference seem to oei _ moi-hod and uncertainties in relocation of the of a single base- metnuu
exact spot where these readings were taken.
2 3 2 r e d u c t i o n of gravity data
2.3.2.1 DRIFT CORRECTION
The observed gravity value is a reading corrected for meter constant tidal drift and instrument drift. This is a value which under normal survey conditions in the absence of other factors causing mass withdrawal should be repeatable at any future time providing that both the station and base station usedare recoverable.

-27-
Initially, all the readings (originals and repeats) are reduced to observed gravity values according to the linear equation
9 = 9st
where 9 b
9 s t
gEBS
9mbs
9
tEBS
tMBS
tST
9ebs “ 9mbs-------------- ^st + (~9mbs) + 9 b'-EBS _ t-MBS
observed gravity at the base station (mgals) the gravity reading at a station (mgals)
t5ga?“ in9 <end °f l0°P) baSe Station fading
the morning (start of loop) base station reading (mgals).
the observed gravity at a station= the time when evening base station reading was
takenthe time when the morning base station reading was takenthe time when the station reading gST was taken
Proper reduction of the resulting data is very important becausany errors in the final Bouguer gravity value will becombination of the errors involved in the observed gravity valand in each of the reductions applied. The Boucmer • 4. «yuer Suavity Bg isthe result of the expression.
Bg = g0 where
(dg)g 0 + (--)h - 2 n P Gh + gT
(dh)
the observed gravity value corrected for instrument drift and tidal effects (mgals)
9o

-28-
g0 = the theoretical gravity or the latitude effect (mgals) h = station elevation (metres)
dg = the free air effect (0.30861 mgals1 above sea level)dh .
p = the Bouguer density used (2.5 gm/cm3)
2 n ? Gh = Bouguer correction (0.1048 x h)
G = the universal gravitational constant (6.67 x 1 0’8cms3 g"1 cm3 )
gT = the terrain correction.HenceBg = g0 - g0 + 0.3086h - 0.1 048 x h + gT
It follows that the total probable error in Bouguer gravity eBg results from errors in all the above parameters and may be expressed as
eeg2 =eg02 + e90*+ <c-eh) + eT2where
C = the combined free air and Bouguer effect(da)h - (2 TrPG)h = 0.2038h (dh)
Cgo
eg®ehe T
error in the observed gravity value error in the theoretical gravity value error in the elevation valueerror m the terrain correction used (as for the study area, no terrain corrections were made due to the area

-29-
being flat)•Thus, the error expression becomes eBg2 = ego2 + ©9^ + (C • eh ) ^
2 .3.2 . 2 t i d a l c o r r e c t i o n
The gravitational effects of the sun and moon on the earth which <--irie>s are sufficient to have appreciable effectsproduces ocean tictes ai.
on a gravimeter.Since in the present operation, the gravimeter was returned to abase station at intervals of less than six hours, any tidal
-iff curve is expected to be only slight andeffect on tnea re a t ly affect the gravity difference therefore does not greasy
/MafHeton 1962). Consequently, it is assumed that determination (Nettieto. x. correction is negligible and was partlythe error due to tiaax
. j i•*--i nn the drift correction. Work done in the taken care or auriAiy/ ni nrl i 1982) has shown the range of tidal southern coast \U11
. h e aenerally low (0.01 to 0 .0 2mgals). corrections to be general i
2.3.2.3 t.&TTTUDF CORRECTION
Latitude corrections must be applied to gravity data to correct_ ^4- of the oblate shape of the earth and thefor the effect orcentrifugal force created by the earth's spin.
latitude, the theoretical gravity attractionAs a functiondecreases from the poles to the equator according to the

-30-
International gravity formular (Telford et. al. 1983). ga = 978031 .85 (1 + 0.0053024 Sin2 0 + 0.0000059 Sin2 2*S)mgal
g = The latitude of the gravity station in degrees.
4-he gravity value that would result if the This equation gives u c Jearth was a perfect oblate spheroid. By subtracting the theoretical gravity value from the observed gravity value, the Bouguer anomaly gravity remains.
2 .3 .2 . 4 terrain correction
, t- nnrrraohv differs significantly from the assumedIn areas where topograpi y_ 4ri=+- eiirface, terrain corrections must be made totopography of a flat sur^a
npaative effect (i.e upward attraction) of a hillaccount for tne ncy•e located near a hill. However, in the study where a station is ^
t rrain effects cannot be significant since the topographyand local topographic irregularities are rare, is reasonably tiar ciuu
2.3.2.5 EttEE AIP CORRECTION
, 4= 4-hnt the actual value of gravity is obtained onDespite the fact tnacof the earth, the standard value is giventhe physical surface
„ . .j The variation of the observed gravity value inon an ellipsoid., the earth's surface and the ellipsoid is notthe region between
, .. . ^pnendent on the variation of the mass within theknown as it isearth which is not Known, On the other hand, the variation of the theoretical gravity with elevation is known. It is therefore proper to reduce the standard gravity value from the standard

-31-
surface to the point on the physical earth. In this survey, theoretical values were continued upwards from the ellipsoid to the station. These corrections to gravity values take care of the free-air effects and Bouguer effect. The free-air correction takes care of the vertical decrease of gravity with increase of elevation, The rate of change this vertical gradient of gravity can be ' calculated quite accurately from the gravity formula and the radius of the earth. The value so calculated is:
gh - g - 0.3086h mgal
whereh = value of gravity in mgals at a height h in metres.
9 uGravity value at a reference level, commonly sea9 —level.
jc 4-he vertical gradient with latitude (only 2 % The variations or tne 4-~ fhp oole) and with elevation (only 0.3% from seafrom equator to tne
in T-m \ are too small to require attention in the level to lw KITw* aravity measurements for geophysical prospectingreduction of any gi-ci j
ttleton 1962). Therefore, we may consider the normal vertical * constant and with value of -0.3086 mgal m-1gradient Q9 313 ®
, . , . _ cimole correction called the free-air correction,which gives a simpx^

-32-
2.3.2.6 BOUGUER CORRECTION
The Bouguer correction is a correction which takes into account the effect of the material between datum level and the gravity- station. The correction depends on the thickness and density of this material. A 2.5 gem density value was used for thecorrection. The Bouguer effect tends to increase the gravity and therefore is always opposite to free air effect. Thus the free- air and Bouguer effects are always opposite in sign.
In calculating corrections to gravity stations, the free-air and the Bouguer corrections were combined into a single factor which depends on the density (P) of the surface rocks within the range of topograph differences. This factor is.
C *=(da - 2 t P G) m<3aldhwhere dg = 0.3086 mgal
dhG = 6.67 x 10 cm g s
p = 2.5 gemtherefore C = (0.3086 - 0.04193 (?) mgal m
= 0.2038 mgal m"'
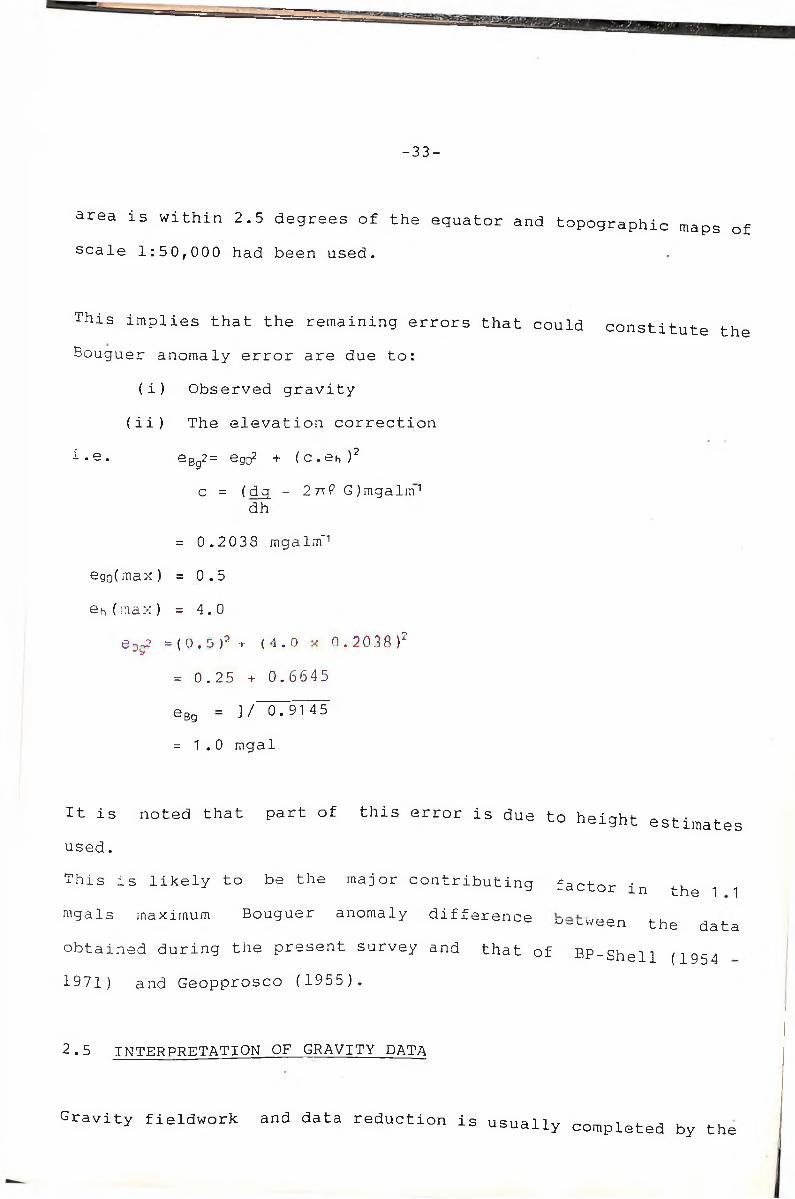
2.4 ACCURACY OF THE SURVEY
In section 2.3, it was shown that error due to terrain effect is negligible because of the uniform topography. it was also shown that the error due to theoretical gravity used is small since the
- 3 3 -
area is within 2.5 degrees of the equator and topographic maps of scale 1:50,000 had been used.
This implies that the remaining errors that could constitute theBouguer anomaly error are due to:
(i) Observed gravity(ii) The elevation correction
i -e. eBg2= egc,2 + (c.eh ) 2
c = (d_g - 2 7iP Orngalrn1 dh
= 0.2 038 mgalm"1
ego(max) = 0.5 eh(max) =4.0
e1f2 = ( 0.5 )2 + (4.0 x O. 2038)7“ 'a= 0.25 + 0.6645
eBg = ]/ 0.9145= 1 . 0 mgal
It is noted that part of this error is due to height estimates used.
This is likely to be the major contributing factor in the 1 1
mgals maximum Bouguer anomaly difference U-Lween the dataobtained during the present survey and that of BP-shell (1954 1971) and Geopprosco (1955).
2.5 INTERPRETATION OF GRAVITY DATA
Gravity fieldwork and data reduction is usually completed by the

-34-
preparation of a map showing station locations with reduced or corrected values (with latitude, elevation, Bouguer and terrain corrections having been made).
The distribution of reduced gravity values shown by any Bouguer anomaly map is caused by departures from the uniform mass distribution within the earth crust that has been assumed in reducing the station. This means that the gravity pattern of the map is caused by the sum of departures from the uniform ideal spheroid shape of the earth beginning at the surface and extending into the interior.
The earth may be considered as made up of a series of shells which may be of different densities. Gravity measurements are therefore not sensitive to vertical variations in density so long as the density is constant in horizontal layers. However, any horizontal variation in density will cause lateral variation in gravity (Dobrin 1976)
Interpretation of gravity data in the present study was done by determining the lateral variation in density which was taken to be related to lateral variations in geology. it was assumed that geologic condition that resuits in lateral variation in density and therefore geology will cause a gravity anomaly. The magnitude of this anomaly will depend on the density contrasts involved, the magnitude and the xorm of geologic deformation.

-35-
The cause of gravity variations was taken to be due to four possible causes:
(i) Variations in basement topography resulting in , basement
highs and lows.(ii) Igneous intrusionsiii) Variations in the type (density) of basement rocks
on which sedimentary rocks are overlain.
(iv) Lateral variations in the density of overlying sediments.
To determine the dimensions of causative bodies, simple models were used. Complex models were not attempted as the author had
interpretation using simple models were later found to beno access to appropriate computer softwares. Results of
geologically reasonabls and in good agreement with findings from seismic reflection and borehole logging. Initially the data were interpreted qualitatively lo identify anv interesting structures
and trends. A few of these structures were then selected for quantitative interpretation through 2D modelling. This was done
using a pocket calculator.
seismic
2.5.1 q u a l i t a t i v e i n t e r p r e t a t i o n
2.5.1 . 1
A Bouguer anomaly map was drawn at a scale of 1:250,000 with a
contour interval of 4 meals (Fig. 2.4). To obtain this map, Bouguer anomaly values were posted onto a gravity station map. Contouring was done by hand using the values at the stations for

MARARAN1

-37-
interpolation. The Bouguer anomaly in the area varies from high positive offshore to low negative onshore. The decrease m the field is both in the westward and northward direction. .The map shows that the western and north western parts were the most tectonically disturbed before they adjusted isostatically, Coffin et al (1986). The Bouguer anomalies in the western partare part of the regional anomaly. This implies that the
,. seated basement structures that havecausative bodies are. . , „ lows. The eastern part of the studyled to gravity highs and lows. 1 9 QS disturbed with a uniform decrease ofarea appears to be i«°
i northward. There is a small localised Bouguer anomaly values nortnwara.cnoerimposed on the regional around Bodhei. positive anomaly sups fi chows three structures of interest.The Bouguer anomaly map snows t
A >or nNW-SSE trending anticlinal structure along thei-ino EE1 (profile GP5 )Walu- Pandanguo line,
, . efracture crossing the Walu-Pandanguo(ii) A NE-SW synclinal s“ “structure at approximately 750 along Kitole -Jarakudaline, CC1(profile GP2)
-•It e£»d antiform around Bodhei and Milimani with(iii) A minor localiseda NE-SW trend.
. -Ronauer anomaly map of Kenya (Swain and Khan•On comparing tne y1977) with the Bouguer anomaly map of the study area, a general
noted as regards the Bouguer anomaly trends agreement 1S nvalues towards the sea) and on the (increase of anomaly vaiu

-38-
occurrence of the Walu-Pandanguo anticlinal structure. The Kenya map does not however show the Kitole-Jarakuda synclinal structureand the Bodhei antiform.
2.5.1.2 REGIONAL FIELD SEPARATION
Regional density those of removal
1 arae scale disturbances arising fromeffects areirregularities which may be at much greater depth than
possible structures in which we are interested. The of this effects is normally desirable.
. j fhP regional effect was determined by In the present study, the reg, across the least disturbed region (GP 8). drawing a profile
flnarp(q with those drawn across anomalous This profile was compared
regions, away from
It was ensured that particular anomalies
these profiles start at a distance before crossing them.
■Found superimposed on the regional and byThe residual wasresidual, the regional remained. The samesmoothing out
_ for several other profiles, each timeprocedure was followed^■F-ne GP 8 from the non-disturbed region. From comparing with profile
.... e on average regional profile for the whole all these profiles,area was determined (Fig. 2.5)
, nrofile direction to be used for determination The choice of tne_ nnfflaiv was dictated by the trend of the Bouguer of the regional anomaxy
mux contours show that the regional gradientanomaly contours.

BA
(m
gal)
NNW ' SSE
icnCO
32 -A ROSEN BAUR SAADANI
Fig.2.5 REGIONAL ANOMALY PROFILE
Scale- 1:250,000
-40-
strikes roughly NW-SE. All the profiles were drawn in that
direction.
It should be noted here that the regional determination in the present study involved a considerable amount of arbitrary• very definite quantitative basis. Thejudgement without any veiy ^final regional profile determined show that the regional anomalyincreases towards the sea (from NW to SB). The regional gradient
• The first part is mostly onshore and theoccurs in two parts.second part is offshore.
average gradient of 0.4 mgal/km. Towards Onshore, there is an aveiay y*- fhis qradient changes along Witu-Mkunumbi- the offshore part, tnis y ,,-pnt of 1.3 mgal/km. The gradient change Busuba line to a gradia 4 the regional dip of sediments (as will be seem to correspond to.. The major structures in the study areashown by seismic late / •
fhe region of gradient 0.4 mgal/km. This occur onshore within tnef small compared to the average sizegradient is rairxy
» jr 4-he anomaly associated with the structures (10 (magnitude) of tne„a.,nnal effect was therefore assumed to be mgals). The regional
negligible.
Bodhei structure, the small size of the anomalyHowever, for tne- onal-residual separation before interpretationnecessitated regi
could be done.

-41-
2.5.1 .3 INTERPRETATION OF STRUCTURES
2.5.1 .3 . 1 WALU-PANDANGUO ANTICLINE
This is a deep seated anticlinal structure which seem to be dueto a basement high. It extends for about 60 km from Walu in thenorthwest of the area to Pandanguo in the south-^cf *a closedhigh along this structure occurs at the Walu well. The ^value is - 4 mgals. This appears to be the most raised section °f the basement high. Southwards the anomaly becomes less Pronounced and disappears before reaching Mkunumbi south f Pandanguo. In the region of Alitubo, this anomaly is interrupt d by a NE-SW trending synclinal structure. The syncline divid the Walu-Pandanguo anticline into two parts with the north Western half forming a pronounced oval outline. The nature of the Bouguer anomaly north of Walu suggests that the structure *night be extending outside the present area at the north-wester corner. The trend of the anomaly contours however suggest that this extension may only be for a short distance. At Walu the anomaly is about 40 km East-West and decreases southwards to le than 30 km to the south east of Pandanguo well. The diminishin °f the anomaly southwards suggest that the structure plunges that direction.
Pour profiles across this anomaly and one alonq thea? nmge-lme
have been used to analyse the structure. Since the wa i „ ,well islocated right on the hingeline, profiles GP 1 and GP 5 were drawn through it (Fig. 2.4). At Pandanguo, profiles GP 4 and GP 5

-42-
, possible to the Pandanguo well. Thesewere drawn as close aswells served as controls on gravity results.
, 4-he area of this anomaly is good asGravity control within tne area= Y._ rloselv spaced. Since the trend of this gravity stations are cio y
, ■ ‘in the regional gradient and is part of themajor anomaly is in yi t>ocidual separation was done on the Bouguer regional, no regional resiuum q o orofiles to be used for structural anomaly profiles. AX
were h*"c* th*regional trend. B . C . . of «... « * *“ * «
interpretation is thought to beregional on the anomaly negligible.
PROFILE GP 1
Wain from Kivukoni through the Walu wellThe profile was acrossand is symmetrical about a point slightly
to Calcal (Fig* 2.mvi-; c orofile was chosen specifically for west of Walu well. This f• of the structure around Walu. Thestudying the dimensionsthe anomaly is well pronounced with anprofile shows that
- The anomaly has a smaller wavelength here amplitude of U ™gals.
nn the flanks of the peak, the fall off ofthan to the south.this may imply that the causative body isthe anomaly is sharp,
shallow at this place
PROFILE GP 2_
This profils (Fig- 2,7) southwest direction
was taken in.an approximately northeast- south of Kitole running through Alitubofrom

Hei
ght (
m)
&A (m
gol)
j Fj 2.6 BOUGUER ANOMALY PROFILE GP1| ( = 2.67gcm'3)jI Scaler 1-250,000

Hei
ght(
m)
BA
(m
gal)
-U -
26
to
SW
KITOLE ALITUBONE
JARAKUDA
C'
Pm ? 7 BOUGUER ANOMALY PROFILE GP29' ’ ( ?2= 2.67gem"3)
Sea le-r 1:250,000

-45-
to Jarakuda. The profile is symmetrical about Alitubo with anamplitude of 6 mgals. The fall off of the profile on the flanksof the peak is gentle suggesting that the body causing the
, t t is expected to be much more deeperanomaly is very deep. J-tthan at Walu. This profile was chosen with the aim of studyingthe nature of disturbance on the Walu-Pandanguo trend by the
•, • i structure in the vicinity of Alitubo.NE-SW synclinal structui
PROFILE GP 3
£.1e GP 3 (Fig. 2.8) was made in a NE-SW A Bouguer anomaly proi-n^his profile was taken some 12 km direction across the anomaly. P
o It was used for comparison with profile south of profile GP 2 .f the sort of change of depth to theGP2 to give a picture o
Hi ate south of Kitole-Alitubo-Jarakuda linestructure to the immeprofile passes through Pangani with a peakof disturbance. Theals at Delisa. The flanks of the peak are
amplitude of 1 ° m<=*4. than GP 1. This implies that at thissharper than GP 2 but lessstructure is deeper than at Walu (GP 1 ) and
point (Delisa)r e.. at Alitubo (GP 2)less deeper than
PROFILE GP 4
. 4-ho southern-most limit of the anomaly. ItThis profile is at the so
m running through Pandanguo to Rufu (Fig. 2.9). was taken from Tula
about 2.5 km south of the Pandanguo well.At Pandanguof it PaSS
-.._ at Pandanguo where it has an amplitude The peak of the profile
, The flanks of the peak of the profile are of about 9 mgals.

-46-
Fig. 2 .8BOUGUER ANOMALY PROFILE GP3
( £2= 2.67gem"3 )Scale t 1250,000

He
igh
tM
, 6A
(m
gal)
NESN
“A
“ 6
~8
10
PANDANGUO WELL
12
“U
15 10
■O
Fig. 2 .9 ROUGUER ANOMALY PROFILE GP4(p = 2.67 gem'3)
Scale rV.250.000

-48-
sharper than in profiles GP 3 and GP 2. The profiles discussed show that the increases from Pandanguo to Delisa an
depth to the structure Alitubo. At Walu, the
structure is shallowest.
PROFILE GP 5
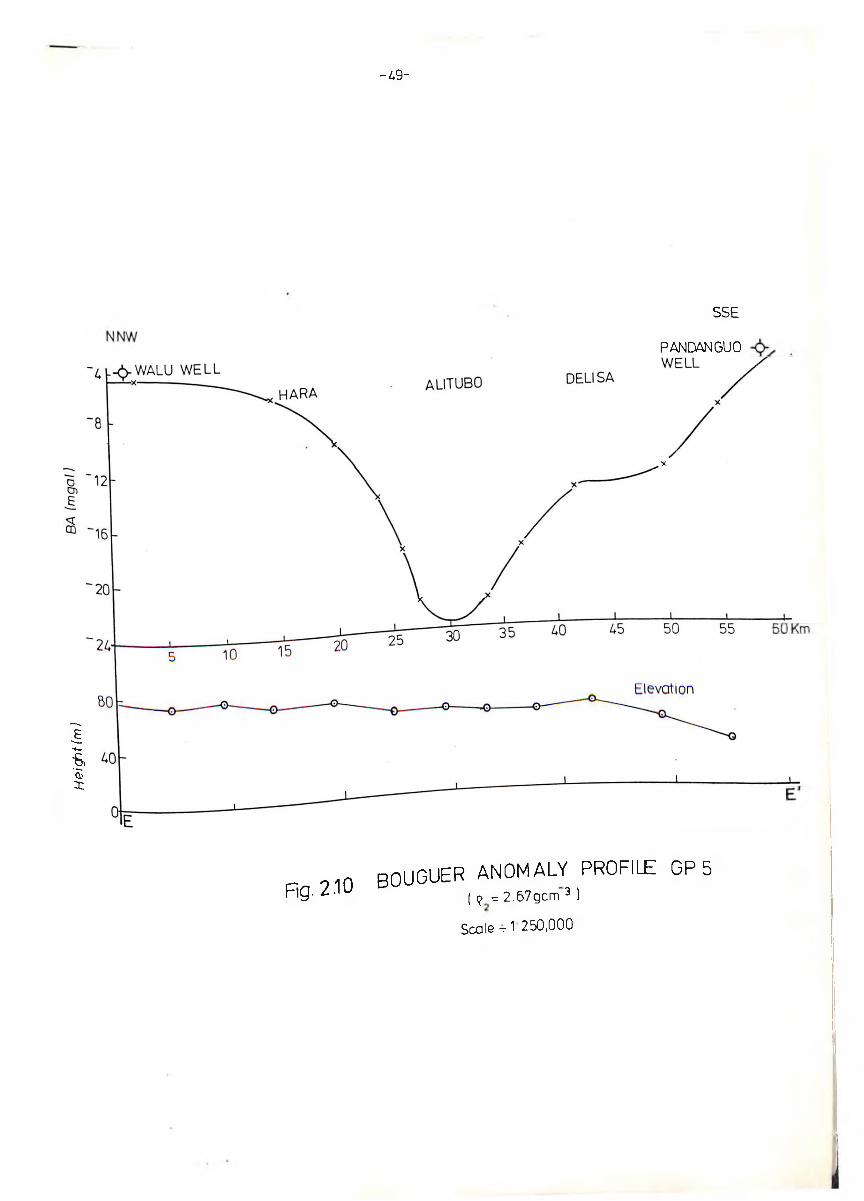
, nomendicular to other profiles (GP1 , GP2, This profile was taken p Phingeline of the structure running through GP3 and GP4) along the nmy
alitubo, Hara and the Walu well (Fig. 2.10). Pandanguo, Delisa, Awas to give a complete picture of theThe aim of this profile
. , = had been shown to be far from simplestructure's hingelinej r - o A The profile shows two differentby profiles GP1 , C3P2, and GP4.alitubo and from Alitubo to Pandanguo.
gradients from Walu to4- -5= very sharp and suggests that there The Walu-Alitubo gradient is very
. ,4.non of the structure by some sort ofwas an abrupt discontinuation subsidence at Alitubo (block form).
. ts which join into an asymptotic curveThe profile has two 9ra results in a step sort of appearancearound Delisa. This
f * s t e p - f a u l t . The profile at Alitubosuggesting the presence o9g 9 , /crraben) implying great thickness ofShows a narrow trough (9sedimentary cover.
This synclinal structurehas NE-SW trend with two near-elliptical
He
igh
t (m
)- L 9 -
SSE
PANDANGUO
Fig. 210BOUGUER ANOMALY PROFILE GP 5
( 9 = 2-67gcm 3 )
Scale -r 1-250,000

- 5 0 -
troughs at Kitole and Jarakuda. The two troughs have similarminimum Bouguer anomaly values of - 30 mgals. In the
,-i c'h'piictiiirs broadens and becomes shallow northeastern part, the structui4= M^thali. Further north to the NE of Ijara, especially north of Matnan.
„ u t i +-h a - 30 mgals minimum Bougueranother trough appears withThis trough extends outside the study area.
re not well distributed within the Ijara ,f this trough based on contours is not
anomaly values.
Since gravity stations a.
area, the definition o.
reliable.
The three troughs are s same anomaly amplitude and are
is concluded that the troughs are
iniilar in that they all have about the
Imost circular in outline. It
part of a single basin with a. troughs form the deepest parts of the
NE-SW trend. That is, the^ separation of Kitole and Jarakuda into
to have been caused by the resistance ofis likely 1tructure to subsidence.
sedimentary basin
two troughsthe Walu-Pandanguo s
2.5.1 .3.3 THE.
j around Bodhei and occur as two joinedThe anomaly is l°ca^ oi1iptical sort ox. figure with a NE-SW• ~ a near e u ^Anomalies forming „ mipr anomaly value of -4 mgals is at the trend. The maximum oU
_ -i \7 extends for a distance oi 40 km from rphe anomalyWestern part. ,f Milimani. It has an average width of• to west ox - west of Bargom u and GP7 were drawn across the anomaly7 vm The profileS 'perpendicular to the anomaly trend). a NW-SE direction (P
m

-51-
PROFILE GP 6
o is from Dulcal through Bargoni toThe profile GP6 (Fig. 2.11) is tromShaka St.b'a. Thi. •— “ °“ ly ** * r" idU*1superimposed o» the regional. «te, separation of tb. regionalby smoothing, a residual anomaly of amplitude 9 m„l, remained.
found to be at a point 3 km NE ofThe peak of the anomaly was. of the Bouguer anomaly onto theBargoni. The superimposition or
a. the causative body is not deep seated,regional suggests that
PROFILE GP 7
was drawn with the aim of trying toThis profile (Fig- 2 -' ]he structure at the two peaks (Bargonirelate the dimension of runs through Milimani and Kiangv-e.end Milimani). ^r° i anomaly by smoothing, a residualAfter removing the regi°n . ,4. 7 mqals remained with the peakt about ^anomaly of ampli domparing the residuals of profileslightly south of Mili"®111-fed that profile GP 7 has a more, gentl GPSand GP7, it is no Qf th. peak. Thfall-off of the profile on
£ the profile flanksamplitude and nature oon the northeastern side.structure is de®Per
suggests that the

SSENNW
Or
§> 12 E<CD
16
20
24
DULCAL BARGONI SHAK^ SI MBA
(a) Bouguer anomaly / ^ \
/
f \ /
/
\ /v y
s '/s'
Regional gradient
(b) Residual gravity anomaly obtained after smoothing out of the regional
20 Km
BOUGUER ANOMALY PROFILE GP6 Fig. 2.11 ( = 2.67gcm"3 )
S cater 1 :2 5 0 ,0 0 0

He
igh
t (m
) B
A
(Mg
al)
-53-
% 2 , 2 BOUGUER^ ANOMALY PROFILE
Scale-:1:250.000

-54-
2.5.2 nri&MTTTATIV” ™ t e r p RETATION
. .fa4.ive interpretation of the anomalies in order to give a quantitative
to approximate the dimensions in the study area, it was necessary tn aeologically realistic geophysical 3f the causative bodies to a geoi y
.i 4.0 be chosen (2D or 3D) depends on the ttodel. The type of model
Bouauer anomalies in Lamu showshape of the Bouguer anomaly., have lengths greatly exceeding the
that the causative bodies. H<a use of two Dimension (2D) models
width. This calls f°r (Dobrin 1976. Grant & West 1965).
. determination of whether 2D or 3D models The criterion used for .u Mettleton (1962). He notes that a are required is also given byto a 2D model, where conditionsbody can be approximated
- . _ ar essentially constant for a , fhs prof iieperpendicular to tne v .rofiie of about 2-3 times the depthdistance either side of ii Based on this criterion, the Walu-of the qection calculated
. can be considered to be due to 2D^andanguo and Bodhei anombodies.
‘tely long cylinder of radius R with a H e re we c o n s i d e r ai depth Zc below the datum. h is buriaa auhorizontal axis whic ^ cylinder into elementary parts andsurface. By divis' ction of the parts, it can be shownummation of t the cylinder at a distance r from
tot.l °the axis is:
g r

-55-
Along a surface profile perpendicular to the axis of the cylinder (Fig. 2.13), the vertical component of gravity (gz) is given by:
9z = 9 2c r= 2 7T R2G 6 Zc
r2
where r = (x2 + Zc2)05
Therefore gz = ? G 6 R2
Zc1 + X2 l " 1
Z<?\
where g2= vertical component of gravity
G = Gravitational constant
= 6.67 x 1 0 - 8 cm3 g 1 S2
R = Radius of the cylinder (m)
Zc depth to the centre of the cylinder (ra)
6density contrast between the basement andsedimentary material ( ?7 P, )gcm3
the value of_ o and normally the maximum is given by gz at x -
92 (max) = 2 7T G i R2Zc
„ ,.1p we call the value X where g is one half On the anomaly profil rt-hs half-width (Xy ). At this point theits maximum value,
quantity
r w ixf-pwiU be numerically equal to 0.5
L lz/ J(Telford, et.
i 1983, Nettleton, 1962). a ,

Depth [ km J
-56-
tii'l,4ii

-57-
Inverting the above relation, we ge
• * o h ■ 2
XVaZ C Zc
= 1
= Xu’ '7_ «ntre of the cylinder in terms of half This gives the depth to centre o
r , the radius of the cylinder willwidth. When Zc is known, then be determined from the formular.
Z c
R = ] / 3.2 ££ G2J y .hid. 1 . «u.l to P 2 -f, .
When determining t assumed density of the-3 which i s
density 2 = 2 . 6 7 gem basement rocks was ass2.50 gem' 3 inferred from
sedimentary cover.
The value of .1 =igned the cylinder used.density measurements was used for
. 2.1
t-hP Walu-Pandanguo anticline showsrim a lv outline ofBouguer anoma y along its entire length. Itis not uniform
: the structure i i the four profiles across it in„ to consider all
necessary u . variations in the structure., , a dear picture ofar to get a

-58-
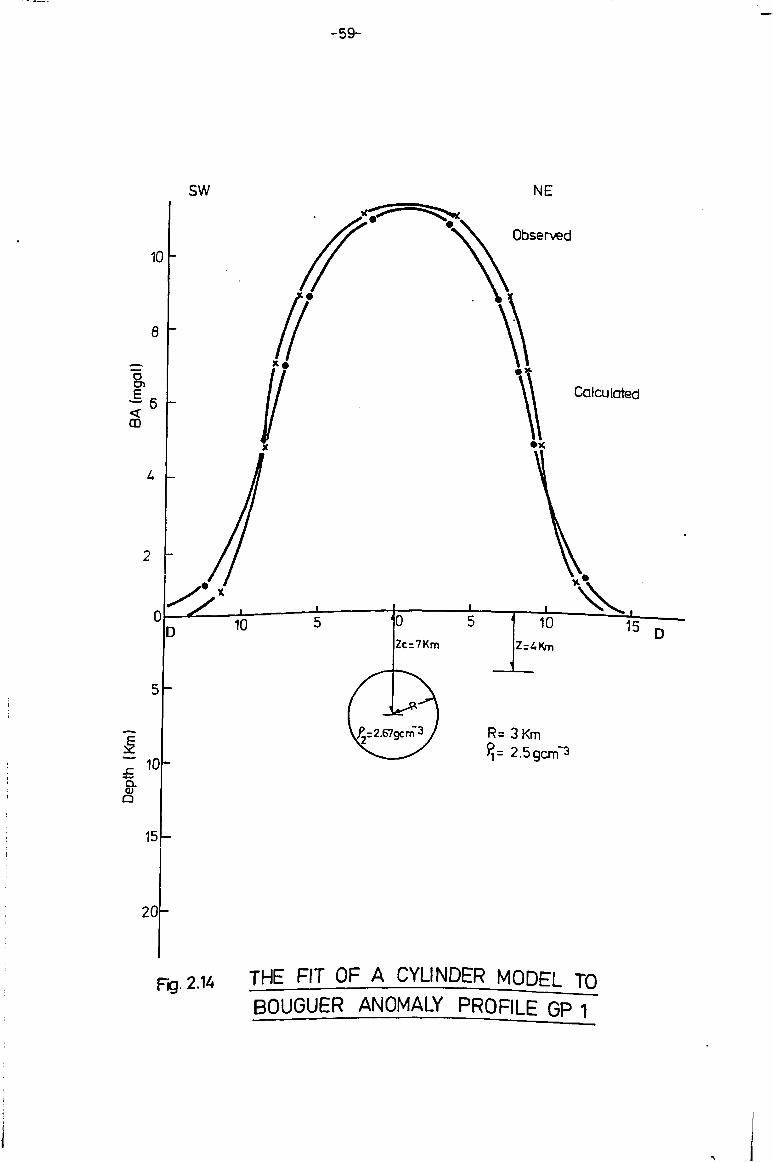
When a horizontal cylinder model was applied to them (Figs. 2.14,
2.15, 2.16 and 2.17), the estimates below were obtained.
Profile Depth (Centre) Depth (top) Radius
GP Z c Z (m) R (m)
1 7000 4000 3000
2 1 1 0 0 07800 3200
3 9500 6000 3500
4 7500 4300 3200
4. too of the cylinder at Walu (4000 ) derivedComparing depth to tn vfrom GP 1 and Pandanguo (4300) derived from GP 4, a depthdifference of 300 metres is noted. The two profiles are 60 km
_ gradient of 5m km-1. This value agrees apart. This gives a 9linn's sediment dip determined by using the very well with the r 9
Walu and Pandanguo that the structure
wells. It can be concluded from these results is plunging southeastwards.
__ - /Fiq. 2.14) with GP 2 (Fig. 2.15) and GP sparing profile GP 1 *94- fhs depth to the top of the structure at Walu , it is noted that, . Alitubo is 7800 metres. This implies thats 4000 metres and at
downthrow of about 3800 metres. The singlehere was a single
ested by the near vertical smooth nature ofownthrow is also sug
HaT.a and Alitubo. rofile GP 5 b e t w e e n riara an
of this structure appears to have had twoThe southern Part
h ow. comparing profile GP 4 (Fig. 2.17) GP 3 phases of downthr
DeP,
h|K
m>
BA
(mga
l)
-59-
F g . 2.14 t h e f it o f a c y l in d e r m o d e l to
BOUOUER ANOMALY PROFILE GP 1

ucyu i irvn/
of-\ imiyui/
- 60-
pj_ 2 ... t h e FIT O F A C V U N DER m o d e l to b o u g u e r * J--------- -----------a n o m a ly PROFILE GP2
Dep
th
(Km
) B
A (
mga
l)
-61-
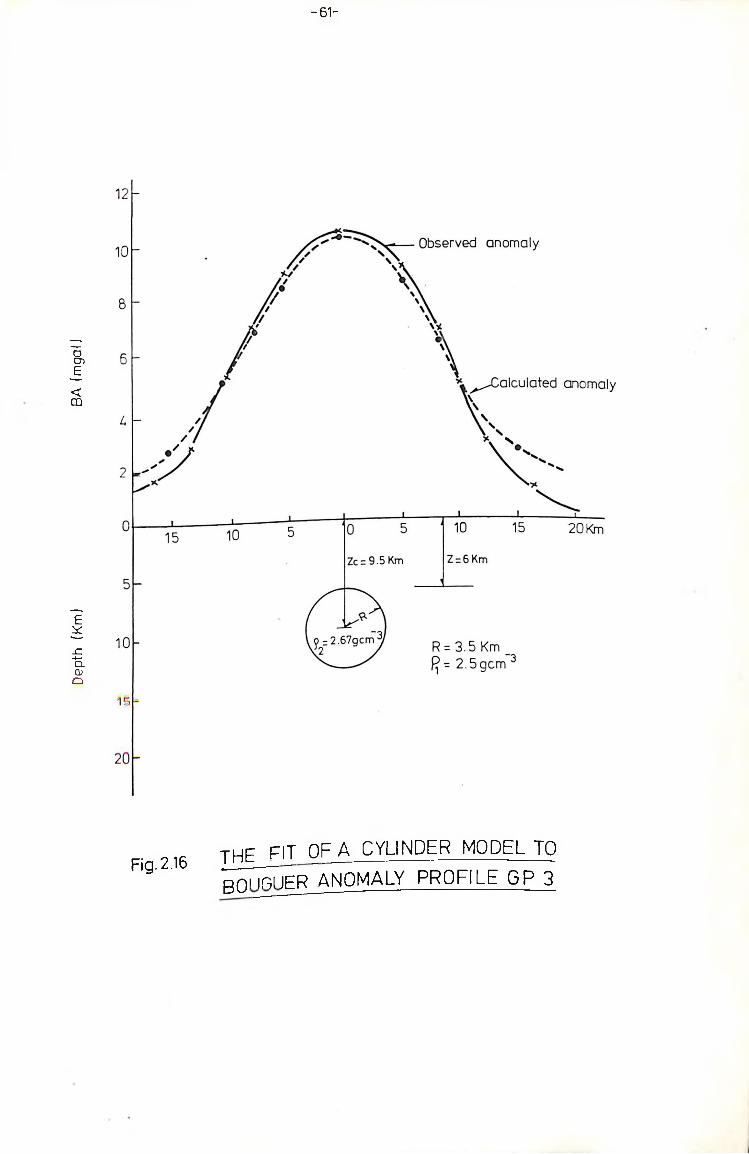
Fig. 2.16th e fit OF A CYLINDER MODEL TO ^MFuiR~ANOMALY PROFILE GP 3

Dept
h (K
m)
BA (
mga
l)
-62-
Fig. 2.17THE FIT OF A CYLINDER MODEL TO p n n n U F R ANOMALY PROFILE GP/>

-63-
(Fig. 2.16) and GP2 (Fig.2.15), it is estimated that a two step downthrow of about 1900 metres each was involved. These values have been used to put forward a model that might depict the probable events that led to the development of this structure. In this model, the Walu Pandanguo structure and the Kitole trough
, Tarakuda trough has been omitted as itsare presented. The JaraKuau yi n c l u s i o n would have made the diagrams very complicated.
However, it fits very well in the model.
stage 1. fig. 2 .18A
MT? qw direction across the anomalous area. Tensional forces in a NE-sw ai„ . .ha mm.se trend takes place from northNormal faulting m the i •of Walu to south of Pandanguo.
stage 2. Fig. 2 .18B
.ifq with the downthrow Vertical movement along faultsregion (Walu-Pandanguo line).
being away from the cenforming the Walu-Pandanguo anticline.A horst structure remains, to have been about 1900 metres.
The downthrow is estima
stage 3 Fig. 2.18 c
. forces occur across the area in NW-SEA second phase of tensi
iitina takes place in a NE-SW direction anddirection. Normal a
r-ivonounced around Ijara, Jarakuda and the faults become more pron
Fi3 2 ,8 p R O pO S j a M O D E L F g R J t ^ ^S ^ ^ W W N W O T RUCTURE STAj j
1 & 2

-66-
F'g 2.18 D PROPOSED_MpDELWALU"PANDANGUO
FOR t h e f o r m a t io n of t h f
STRUCTURE STAGE U

-67-
The Walu-Pandanguo structurebeing affected o n l y at Alitubo.
r e s i s t e d the N e - s w f r u i t i n g t h u s
two
ome
Stage 4 Fig. 2 . 1 8D
Subsidence of the central regions of the fault zone thus W i n g
the Kitole -Jarakuda structure. = heen estimated to be about 1900 metres.
The amount of throw has bee,ont-h estimates to the basement in the t
In order to determine ti nd Jarakuda, the writer had to make s
troughs at Kitole 1. fhp estimation. It was assumed that
assumptions to facility. Alitubo during the second phase of
the amount of downthrowa -Faulting) was the same as that which
disturbance (NE-SW trend faulti■p fhp two troughs (see Fig. 2.19 for
resulted Is the f o t m t w n o< , ,Depth to the two troughs is therefore
validity of assumption).ripnth to the centre Zc o±. profile GP
expected to be the same as
2 (11000 m).
the expected average depth to theUsing the same assumpti° t
+■ of the study area can be estimated, . 4_i_ western P arT:asement m e ' entre of the cylinder (structure),
to be equal to the depth to c4 the basement seawards and to the
It is i„«srr«d that d«pt», ln aacaa. ol SOOO ..
Tana River region 1:3
2.5.2.2 THEBODHEI
used in the analysis of this 2 20 ) waS u 2
rofile GP 6 (F U blinder model was applied to theo horiz°ntai y“tructure. When

-68-
F ig . 2.19

Dep
th (
km
) B
A
(mg
al)

-70-
anomaly profile, a body of radius 2500 m, . depth to the centre
5000 m and depth to the t ? P ssoo m «aS depicted.
The calculated depth to the centre (5000
depth to the basement in this area since
This may imply that the anomalous body is
high density material.
m ) c a n n o t Id o
this value a shallow
t l a c s a m e a s
is too low.
structure of
2 *6 D l S C U S S I O N O F G R A V j y L - E ^ S ^
o 4 that the overall error in the^ was shown in sub-section 2.4determined by the writer is about
^ouguer anomaly valuessize of the anomalies in the area,
1 •Omgals . Considering thebe small. The difference between
this error is considered, fhp writer s had a maximum value of . jata and tnethe oil companies data ^d ta coverage 01 areas oi structural
about 1 i maals. Also the aThis implies that the data used and
Complexity was good. ,n-c are reliable.results aj-etherefore the interpreted
that v/ere noted by BP-Shell oilAPart from the struct shown the presence of a
vity study nuac°mpany, the present 9 r _ & Walu-Pandanguo structure
-0 crossingNE'Sw synclinal stru-tui r. , le_jarakuda line. A minorat n 7 5o alongapproximately , , aic0 been determined.i ind Bodhei haa alsolocaliSSd antiform aioi
area to have a gradient iTh • has shown the
regional analyslS sea)- This occurs in two4-, . /towards tn
southeast direction
in

-71 -
ne
1 .. Ualnp iS 0.4 ruga Is km-1 . Towards theParts. On land, the Value is u. y, , „uannpg to 1 . 3 mgals km- 1 along a lioffshore part, the value changes ro a-. ^
. The increase of gravity values innearly parallel to the coast._ _ decrease in the value of depth to a sedimentary basin implies a. cpHimentary cover thickness) (Mesref the basement (a decrease m sedimenra y
, _ -is thought to be part of a passive1980). Since the study area is tno yKvopk UD of Madagascar from the East margin formed after the break up, 1976; Walters and Linton,
African Coast, (Tarling and Kent,^ a,icihle to exp
1973) .-he
oast, (Tarling ana, i n l a u s i b l e to expect thinning of
It is not geological i -the Indian Ocean. Infact one
). It IS noi yew- J
the Indian Ocean.a sedimentary cover towa
• sing density deficiencies arising. , , j.us lncreasxny"Pects that with them v e r towards the sea will give
com thickening of sedimentary cove.n,lflUor anomaly values. I.ork gone m
increasing negative aougu-9 . _ Vi/-iwn nearly the same regionsise to increasing neyat* shown nearly the same regional
er passive margin o (ig78) who worked on the New YorkS n a ' Steckler and in Bouguer anomaly values
iform incrSln have noted a Un . ie gradient). They attributed theishore (but with a tai crust. In the New York
. n o f the continentalCrease to a thinning metres per every milligal of
, a qradientsm , they estimate a y
[ange b
, c5,me in Lamu in terms of the _rly the same • is near-1-!iereas the situation _ offshore, here we have twomes towards
[Crease in anomaly va the offshore one. Thisthe onshore anaadients of increase, h thinning of the continental
there mi9‘' P Ues that in Lamu ^ _ second gradient.
factor causing'hst plus another
:h

-72-
Work done in the Verginia basin(U.S.A) by Mussman ( 1986 ) and in
the gulf of south California by Harrison and Mathur (1974 ), has
shown that this sort of two step regional anomaly gradient is
associated with the thinning of the continental crust thenfollowed by a transition to oceanic crust. This seems to be thesib, .. . _ Coffin, et. al., (1986) who worked in thesituation in Lamu, cori-i1*/w , _ . , . which is offshore Kenya have also suggestedw-stern Somali basin wnicn
the same.
was• cmst on which sediments were laid ssuming that the oceanic cu -in aravity gradient/ then the presentha cause of the change m 9
, . nn of the extent of the oceanictudy has led to the delineation-, = hnre sedimentary cover. These
rust below the present 01_ _____ fit. al. (198
ese results
f Reeves, et. al. (1986) who assertsnot agree with those
fimbayment, as far north as Oo and west of most of the Lamu - , oceanic basement (Fi<>t of the Lamu•form density oceanic basement (Fig. 2.21)
1(3itude 40o has a unif . _ 4-r-nP. we should expectR•seve -Ip
L/i- —truef we should expect the longrtion Is
__ .U 1 1 -C ves et al1s asser_lv fields to be essentially
length regional anom ^ ^ SQUth east from offsho
flat. This is only riter has put his demarthe wrii-t;j-
strip onshore v/her basement structures tha
eaturelessre to a
cationip onshore wher basement structures that have
^ave majorNorthwards, we Walu-Pandanguo structure
o f them, tnediscussed and one d3marcation.
* t h 3 line oi ‘Pears just north OJ-

/o

3* SEISMIC surveys AftD INTERPRETATION
3.1 INTRODUCTION
orincipally concerned with the reflection mapping lS P
nurtures and lithologic variations tion of sedimentary st
- Hie crust. The acquisition andthe uppermost 5 km °
, elirh that signals are detectable°cessing of data are designs
, horiZons in the highest frequency the deepest target- fin
,, m,uv within a range of 12 - 60 Hz.ttainable. This is norm - „npminters a a
Seismic
delineatior in thPr
irom
>eflection occurs wlie
orm^ivwave encounters a discontii
never anuity
the physical properties of the here is a chang- energy reflected and its
The amount ortting medium. depends upon contrasts ofrelative to in^id-n two sides of contact.
, media on thesica 1 properties Qi-
li*sJ_nce (pv) , wharenqtic impedance it _ s-n acousc-l
contrast is due u ium? = density of t r a n s i t ^ ^ ^
V
J. •'•tv in the medium
- - seismic wave v^l is given by.retiection coeffieCi^n R = , al. <1984)
= P2V2 - P1V1 Macqu i U in' 6
P2 V2 + P'1 V"1
of medium one icoustic imp® medium two
• loedanca a \coustic ln L
•qes when the incident ray isarises.flection coef^ciSn imp3dance. reflec-n of ^ aC°US a r k in 9 th e boundary betw<
7.nnS
.ector
-75-
rocks of markedly different lithology. The primary objective of
seismic interpretation is usually to prepare contour maps showing
the two way travel time to a series of reflectors which have been
Picked on seismic sections. The interpretation of the Lamu data
done with the aim of achieving this objective. Theinf- „ ,c;nn the method given by Macquillin et.interpretation was done using tne i . ■ nfomretation involved assimilation ofal- (1984). Overall, the interprecar
. ...l itv covering 2590km of seismica mass of data of varying quail y, d in the acquisition, processing and-‘-ines. The techniques usea. discussed in the followingterpretation of the da
Action.
1 2 d a t a amnTSTTION AHj2_QU^aH-
l>St0 BP-
the
, • _ area was acquired between 1954 in tniaof the seismic Between 1954 and 19501971 using old analog techniques.Ubing ° . . the western part ocnrvey m# . f i eCtion SULaid seismic re Kipini, Witu, Pa-ndanguo
r rSen/ Tana rlcovering Bura, G this survey, long spreadBodhei (O'Hollaram 1 rding was used with a
Q f field reolong offset method interval kept at 92 m.r: chatlOifstation interval kept at 92-J . -rationurd m g spread separu d subsurface cover with
p shot for six-fol°f the spreads were lines being shot off-. -] iv and a
a rentrai yshot points locatea hola depth kept a_ 16 m
9 kg allCiCharge size used >;a y in i960, iu wao realised. n f this survey
a9e. Towards the 3 hd complex and highly faulted. A■fire wasthe surbsurface struct , 46 m station interval as
l^es were
,rfaca struct 46 m station interval asfore recorded wl
theref01e

' lU t i l l M t l x
- 7 6 -
was found to give better lateral resolution, A spread
c°nfiguration of 528m - 2 3m - 0 -23m - 528m was used.
_ _ , , • _ nofp(i bv O'Hollarain (1971)er^ll, the 1954 - I960 data is norea oy /. . l 4-«y -Found that nnl o q c }->
Ov to
a2 ?th
, . . oc if was later found that unless hole very poor quality/ as i• . . A r-rc\ nr* npnpf nn Ko\ron A
} W J- — u 'little seismic penetration beyondwas in excess of 2 im,
* seconds was obtainable.
in the
pini, . -I -| acauired more seismic data in thetw®en 1964 and 1969 BP-Shell acqui
area and one line within Kipini~L and southeastern part of tne,d recion (O'Hollarain 1971). During
another in the Tana n -mnfiquration and cha
s sur 5 b
her in the Tana rive. —cnread configuration and charg-
vey, the decision on P_ structure. In ar,, tne of subsurface structure. In areas of
ased on comolexity .„read configuration or 52Sm - 23m
s structural complaxitl a 1 ., Hhere the station interval was kept ' 23m - 526m was useo. 3 suspected to be highly
# /“ , -L * *-n and hale depth at - . rike directioA, a station
t . _ acrossUted and those with lin f 264m - 1 1 m - 0 - llm
j confi9urat*-val of 23m and sprea for three-fold subsurface
ab was shotiT1 was used. This s? m inspite of drilling
maint3i^ed a* Hole depth waS ral limestones in some
' >v near surface cAcuities presented -b icvci in a single hole.
. tarned a- 3 5 palin' r c e s
!u 3-1971, a d e t a i l ed
re i.e. areas
. was carried out inj r survey was■ e i s i highs by Geopprosco f structural n
a v_r eas
I

-77-
• • pater Dodor i ,„ covered, KiP^r, ^ t e '
. • 1971). This serve had already beenHollarain since these n of therarani and Lama areas. coroPlex during acqur
ctructuaUY size used ana'l- *» ■ „ 0O„{ i 9 « « t W n ' *irlier data the spread
. . accordiugly-■■iwerevarxe the 1964-1969 and
is poor, tne
l U . t B P - » « U aata Tana d . l c *“ deas the sa pity ^ . or in Uttu Kipiai1971 data 1. “4 , U M 6 . ~ " S ” „ co„„t.t,d
- “ - — J t a e t a - ^ ls .tp.ot.d to fjae to ThisBodhei areas _ -1 9 7X ) - . ._rference from(0'HoUata4° aue to xnt-r
: the surface ^ areas £aolts in the arr in all structural the * ■
_ _^noedracted energy
tin 1976)
•n 1971)- . t^rforence fromH o U * taia , due to ^ t - r
areas i the area1 hi9h faults:Urai the ma ^^ f roit
d3vel°Ped
In 1976) . 1969 data canrtiy 1 96
. i9 6 0 . »»d Patquality of the l9 5 4 field recording
thod sitributod to : w „, o<4««' " w p t h Pd4”' StaCk1''9Th« lo„, apr.»a »"d of hi,h « * " “ » »'
CtU f1 1 to ^which reduced t e due the area.
ThiS the sea to lov;r,asults (CDP)- t o' 3- ^otrati01"1f „ steeP dipS £tical P®°“faulting and st veri:. i f ao t i ml^
y y l — aue “ 10"ting and ‘ vettlCa
, limit® due to low‘he long spread .enetrati°n
vertiCa-nergy. n v
S^all cha
Energy .
5 i z ergelimited

-78-
. nf low velocity . effect orh le increased the
s n a n o w shot *>le
layer (weathered z°Shall(
yer C^athere laced belowif shots ate P
. _ records are obtarne reflection of much oitter reflection due to weathered
laver. Thl" „ rte base of thehe low velocity boUndary at veloCity layer is
, i-y e velocl ^ The 1 0 f■he energy at th it. The base of, is at) 1000’ts-^ •
^one when a f 2^0 to a+-ed zone abovel o c i t i e S ° , t o t h e a e r a t e
tharacterised by r,rres?ori S v»iocity layer/T yl) c° _f the f°w
velocity lay®r The effects-I ry r\ ne •e \w
are:
o pOOt. leadingis hl<3h
. c ener<f ssi5ltl . laratAbsorption
vertical resold1
Lowicai .1-1veioc^ 1
and e r r a 11
eaeryjortionately larg<
„ disPcop°haveiti®slocit u a rolv bends f sharp y
travel ti®®* the baseect on tra atlocity C - ,r*n.) makesThe marked vel°c
effty ch a n 9 f (LVL) makes
the base of_t at t reflection,
dance cohtta y mUitipl®The very high lWpe s speCia
reflect° ' depth-an excellent ratiorithe Psn®thus reducing
seismic waves*
. - over (LVL'.. intra =t uhcet veiocityt that etror i« v
t, sugg®5 s0urc® °r d u 3 to lvLforegoing effectS — erCOt_ _^neSt
o X ^foregoing effect® - , ^ 1 ® ^ ,he * * ^ ^- t i ons are the X . * - data -
. tit deP^ . .n thetmictions are hh c;
t a rminations and
n.r tO ^d latar - a h ^ in ,
. 0 te 1 1 1 9 izas•^tions is U h ® WOvj
ons is U * ® « ch * ^d sm®ishotholes an

-79'rJfZ-TQmodes *ere
Of this dat3' diffr ata which «as recorded
lring - r i e , PrOCedUre‘ FOsL «as P- Ceded by a n a l ° 9spending on the proces . _ to undergo, ic equiPment' P „ these p r ° f a ^ s
nth analog magne allowed rea seismic• +-ion v?hi-cn . s variable
to digital transcrip displays are shaded inThe results «- deieted and PS& f 5cm of
Processing. *• hs de soiution of
sections in which tne have a vsrtl v ;25o,0 0 0 .
solid black. The disp tal scalS °d a hot*z°
tw° way time (TvJT) a° aS:b 3 summary
:an h-area c^ata f 1 voo^
- quality of °au54 .
69
I960
1969
1971
DataDataData
DaftGood
t - a t i o n can be interptatatlfor• +- e r
the «rlt1 data available fc° given bel°V dataPrised m percental aS *0% ° x data
const1 2 4% oi a a.,,1954 - 1960 ted tal dat
c0 nstl l6% °f1964 - 1969 . ted.ct3-tU1 969 4974
cons^ ,.as poor to r a i l a b l e w a s P
Jjata aV o f l OV7>f da * a s„ a aVa ed -was of 1 C«• +-v u nseo
the \\ data .nation, anst OV? o7erPercentage^ b tps
lC .-poreercentages =»
Quality and ther^f s e i s ^ C
,itx J =eiect i n < 3xtY. When se -,aiocl«de
rfas made to - to SL'^r®a awfthia
t unread
Ll data tation, an, nr interptst
ines f° l 9 7 1 lines asl969n =“ ,, l969 1 Q71 lines^iPctfn'S many 69 - 1 ?
When sel ^ as the _ _ l6% of■ a waS th*si, r.u
^bl,^lclPt
t*at the ted only ^6% of_ titutea■ _ ___ ~ . cO^ 1^ to „ and=etbacb
^ . One se . i-hifi

-80-
4-he l9 5 4 ' . . pr Since the
avallabl. - t n e*• data that T o s t of the *«ay area, ^ of data used1960 data c o v e r e d m i t forms
, ta availabl®^the total a t q 69 data*
, t q 64 " ■ -followed by the1969
1 fhat most of found thatro£eted, lfc anticipateov,_ inter?1 there»-ore
:hoosing l i » - tG ^ fiies- * " ^ ^completeness ohad data missing ^ data use .nteCpteted results.
i i low gna nliality 8 1 the writeraat the overall the q ta t>i -1nq to t®duC of the
was 9° l 1
Ihen choosing 1
these
ages follo^ea „tionsovt seCL
4. hediscussed in t
n n iov? gnal' rjual ^ ° i ,7 the writeraat the overall the q , hV.e data W -r«°°c , - of tnhis data was going anaiys
. duringlhe stages foll°',,e _*-i.ons-
. . „«xt seCt
^ i n q seismic, bY inspeot^- g
.fied usefuld e n t i l o g S g i v e
- ^ „ snow «here strongthey alS° t reliablere the most-i n 3 vf®1 _ foundwe4i It v?as rou
identic0" y Xogs andions might » “ ctioh logs- 3eisof seismic **£ 8o ^ . ^ 0t
f clent
fieo-- 1°9S r seismic,■ r re*"1 _nic ma3°rSeisnuc , son . eacn .
n5 atsd a o aiving ^ se^omPen mnr ted 91
^ ^ t M * * * .«•■* “ a » l o „ logs. °»e * „ „(o«iaea l0o »> th
Chan<3 ' 1.H " aVIty and lithologi' eien<31'v?ax •" i~\ 3
p lines were these
•first- followted 4 „s9ible.nr®t pOs5i
int^ 9 ft *aS^ v?ayS ,nis ***'
and li ^ e .
^ is at least ° n
1965).
lines were
* dowiJn

-81-
the structures in the area. Faults were inferred by: Termination of a reflector giving rise to characteristic ^uasi-hyperbolic diffraction patterns on a seismic section
presence of lines showing crushed rock with verticalreflector displacement.
lection markers terminating sharply at the point of a ^Qult plane and resume again in a displaced position on the °ther side of an inferred fault. Sometime, markers are Pr°longed in a small distance beyond the fault plane. in tlUs case, plane positioning was compromised between the two
case, plane Prolonged extensions
Qu*te
•or
°^ten faulting and ^ ° n marker very difficu^ation itructures§ across such s
t ^ usina strike U " eS °n^rs^ation around faults
, *"=*<>» characteristic .«>( 3Uktap0gition the undisturbed are
other structures made tracing of a Thus there was a problem of
This problem was partly sections to carry the
and other structures, using the a section so as to bring
both sides of the
V i*h<
^ S TIE.9 AMD THElR-S2SBg^^~~
is expected that reflectors on' s<2ismic interpretation, . t should coincide
,- rtion P°-L11U6 n t U n a s a t t h e i r in t e r s e

-82-
actly in terms of the two-way-time. In the present study , it
found that sections from lines shot with the same parameterswere rois-tying by a few tens of milliseconds. Lines on the 1969
1 9 7 1 data were noted to have maximum mis-ties of 1 - 35sconds. The greatest mis-ties were on 1954 lines. These
mis-ties of 80 - 150 milliseconds which were also
Lillis9aveiric°nsistent.
6 fir*t caus, of mis-ties discussed was corrected by giving a
lk Sh^ t of one line relative to another. This was facilit t}1( - 4-v^e« lines were consis-
■ i tatedine rsiduxv^ ~ -these lines were consistent.
fact that the mistiesnnf be corrected by shiftin
of the second type could• c -i-ie values involved. The J 1 a rae 11113 L.J-V-mconsistency and
r e d u c e d by giving nore weight toUe to these mis-ties wa= - . .
r.^fnnphelv sections fi
"tieto
s fto these inis-1iss . p
Unfortunately sections from therou 1969 - 1971 dat3‘ . ., of the total interpreted.
971 data constitUtSd ° nl-' olution than others and itctl°ns had higher ver fKaQls for adjustment, e p • +-h b a s —a
~ dlfficult to decide on th-
s were also attributed filter setting andDif. . . olution parameters,
kerences in d e c o n u
a^ting velocity. ~ size and survey „ chary^depths/errors m LVL and
0 led to arro-- have 1 .in phase distortion oflf France in
r°Cedures. This
lsVation correc
Sctions.

-83-
The effect of some lines not being exactly in the dip,. . . _ pnrrpcted for during velocitydirection and not having been correccea * . *
, , n u _ i960 data. This fact is shown by migration in the 1954. 70rds the sea where beds havethe greatest mis-ties being towards tne
dips exceeding 80
fi
■ions
a two-way-time map from the seit step in making reflect!
. -3nt of the two-way-timeIS the measures- then transferred tc
nf tneis the measureme _ then transferred to
rphis datalong each section. contour map showi
maP in
ion a
ctu
:®a«-ss
, +--ion Tni& —I each sectio - contour map showing^ o two wa^
order to produc-
SS .
were measured every 1.0 km. sections war-5 of much coiaple>ci ty r > of not more thanan interstructurally compleX ar recorded and horizon^
of faults wasW a s used. Positio =ides.used. Position . w sides
. .... and downthrosurad on both the up
MACONSTRUCTION: WAY-TIME (TWT_Ll— -
-C
+-he next objective•nterpreted,
had been 1 t rfZOn of interest.- sections h a each naI
loco contour »»P« °* ” l m i c “
o « too « * «»» Th, „ T . . 1 -•mt- map- lnqinq of 1o °Ps
i the shotpor the cby l o o p i n g op failed to close
reliability when a. check- __ 4-iaated
in importan . caSe waThe
-84-
contouring was first done roughly so as to identify the main
structural trends. Insertion of all faults was done and -then it
Was decided on how to join them depending on:
1- Similarity in reflection appearance and amount of throw.2- Knowledge of dorminant geological trends in the area.a i . the map so as to ensure thatAnticlinal axes were identified on tne Pn , . a loner the same axis. This wascontours intersecting them turned along„ . +-4 0 0 which whenever possible wereUs^ful in identifying minor mis-ties wni
Isolated values whichr®solved by reference to the section.
nored. Final contouring was carri lsturbed the trend were 19-
. , ' minimum spacing of 1 cm fh between faults keeping
f 2.5 cm for detail.gibility and a maximum spacing o
i- irina data between lines in the dip ere was a problem o f con o ., irikp direction lines showed na _ . . The dip and striK^
-i^e d n action. land. This value increasedU s 'ties of about 20 milliseconds
bout 10° milliseconds. On land, ^Siderably towards the ^ ^ ^ relative to another.
s Problem was solved V minimised by giving more weight
Wards the sea' thlS Pr°b unfortunately, the dip direction the dip direction °n°S'
'riedor
I'h
'nss were widely spaced
in.. was checked against the
completed' 1contouring waS -ons of complex structurescialfy r n reg
^ginal sections, e^Pe in those with faultingke ■ f closed highs a
in areas 01 . +-o different horizons weree of time rosturbances. The final mapan Prepared with clos
a xed highs painted red and closed lows

-85-
^ H-iffprent throws are shown byPainted blue (Fig. 3.1). Faults of diirerenu
different thickness.
^'~1 VELOCITY nFTERMTNATION
Wells Si
„ , n+-n depth, we need to know the order to convert the TWT maps into depc3rpa, To determine the lateral
city variations within• cions compensated sonic logs from
vertical velocity variation ,i noi +-ies were used, and seismic stacking velocitie
__ -F \t a
In
Velocityand
'incwasPoorvel
and seismic stacKiny• 4.he study area was of very low quality it
seismic data in tl of stacking velocity wasth,
seismic data mmiality of stacking velocity was
erefore axpacted that •were compared with the stacking
When w=ll velocities•t was found that the stacking
ocity given by BP-Shell, x _ _ _ _loc
, ni it was rounu city given by BP-Shell,
foo low as compared to tne ave.city (1758ms-1 ) «aS .... well velocity <
:rage• ty (I758ms-1) was ,3 3 4 4,113-1 ). Well velocity data
:°mPensated sonic log velocity
*ere therefore primarily rslied
. ,nce the average velocity in ea 0 used to deduce t
noted a rapid variation ofthere was
r +- another. Whennlie
sonic logs were uS°r mat ion. in Lamu, there - area tQ another. Whe 1 _ . formation tr°Gity in the same found that they have thn i t w a s
Snsity iogs were considere , is probably due to theThis variar
a::ie trend as sonic logs- d that in a singlejt was iouw^formed nature of the ba low^r seismic wave velocityOrn>ation, the top Part of more compaction at deeper, attributed toan the base. This was to determine the
. sonic l o g s were°ri2ons. The compensate forraation in a particular well-\ for eachera9e velocities the Pate well., _ a tv values m'h°wn in table 3.1 are v®

-86-
TABLE 3.1 VELOCITY VALUES IN PATE WELL
formation
limestone
AVERAGE VELOCITY DEPTH
Lime:
LimestoneLimestone
(ms ) (m)
4554 300-1100
sandstone shale 391 3 1 1 00-1 3I
4247 1300-1400mudstonesandstone, shale 2800 1400-1600
2902 1600-1700sandstone
sandstone, mudstone 3730 1700-18001800-2400
mudstone, siltstone Z 9 12700 2400-2600
shale3400 2600-2900
2900-3000351 6
. r 3 0O-IIOO « depth has an average velocity ofimastonas a h has an average velocity of
*, „ ,fino-2900m dePth nams -1 and a deeper limestones is-in the deeper limestones is ._ velocity in 'Oins-i The low seismic -• T k which reduced the formational
:ributed to high p o r o s i t i
lsity.
_ the whole study area, values over tneget accurate veloci thair variation within the
velocities u-le*mination of wave - tTQlls are not uniformly
In Lamu, deeparea is necessary. o. ic highs. The problem^ntrated °n s- ol
3tributed and are conc-i values into the seismic.„ the well velocity
3 how to extrapolat This problem was moreare no weirs." regions where tner , ies changes, like in the
_re lateral facibounced where there

-87-
case of continental barren Eocene beds in the north which become
Marine in the south.
An attempt was made at determining an average velocity over the whole area. The value determined was 3344 ms-1. This velocity
ocfimate of depths from the TWT.Can be used as a very rough estimate u &
3.8 DEPTH CONVERSIONS.
Ma rorl'7nns and average velocities for PS of TWT to various horizonsa particular area were used in depthtfj-erent formations m ‘
way time within a particular ^-termination by multiplying one waye the bed thickness. By making
n°rizon by velocity. Thl y, „ 0f formations from the surfaces,
Emulative addition of thickness of, determined as shown in tabledePth to a particular horizon
HORjX
1
3
h
2 0N t i m e
(t*o) T”1To
T1T2
T1T2
T3
TN-1 tN
V
(MS"!)VIV2
V3
VN
DEPTH(TO BASE OF X)(m)
T1xV1(T2-T1)V2+T1xV1 (T3-T2)V3+(T2-
THICKNESS
( m )
T1 x V1 (T2-T1)V2 (T3-T2)v3
)V2+T1V1(TN-TN-1 )VN (TN-TN-1 )VN+(TN-1 -TN-2)
VN-1+. . . + (T2-T1 ) V2 + T1 \
Whtime txo is on< way
to the
, 4-nn of horizon x and timetime to the top£ horizon x. The depth to
is one way time

-88-
each hori zon is build up by a ^layer cake method*. Where the
thickness of the second horizon is added to depth to the base of the previous horizon. This gives depth to the base of the second
horizon which is also the depth to the top of the third horizon.
The resulting depth values were then posted on the seismic
Seotions.
The accuracy of depth conversions depend very largely on how accurate the velocity determinations are. Since velocity
^termination was based on well logs, it was expected that theaCo„ , .h conversations deteriorates away fromCuracy of these depth conv_j.==>wsll_ . nn = round seismic lows. Depth conversionespecially a iounacn„ , _ j +-0 decrease towards the sea due to theCcuracy is also expected to
. • hUitv of diapirism with slumpingni9h dips of beds and a possibility(^u, . iQR2) Generally/ depth estimates areu<abi nowitz, et. al. 198^ ‘. reliable away from theteUahi* m e but becomes less rena-table near wells out-
s.v,sii
CROSS SECTIONS FRgM_SEISMlC-!ggmm£
\
- TWT maps which had beenV from LlldSs sections ware prep to obtain a rough
This was aoi ■-lv-rted to depth maps. The choice of regions to>1
erted to depth maps. choice of regions to . * t h e subsurface.gical picture 01 hQW interesting an area was
, dopsnded on'v the sections throug 1 cC-ibility of delineatingt, . ln terms of the p o s s x b x l xthe writer's view __ wpra mostly made aero;Efface structures5mic highs
LcJiiU. _ M^r => mostly made acrossThe sectxon=
ctures. - d Qf wells within theThe uneven spread(Fig.

-03-*9-3.2 CROSS SECTIONS OFLAMU AREA (BASED
-90-
dictates that thsss ssctions can bs relied upon only in fsw areas
where they cross wells. Away from the wells, reliability
diminishes..
It should be noted that sections shown in (Fig.3.2 ) were not
necessarily made along seismic lines because they were based on two way time maps that had been prepared by the writer.
^he crosform
oss sections give
good reflectors
depth to lithostratigraphic units that
In the area of study, the litho-„ . ovactlv coincide with chrono-stratigraphic units do not exactly
cu - • „ ..pile So these seismic crossstratigraphic units given m wells.Sections cannot be used as geological section
3 .1 0 GE0L0GI -7- — r r p ^ iTTQN OF _SSISillc DATAC A b I -----------
GENERAL STRUCTURE
n sections were used to^ s e i s m i c two way time maps andcioss
structures. The study area is9lve a picture of the subssuifa 1 , The faulting seems to play, a highly faulted at depth (Fig- 3- • r_ 1 elements of the area. it is
in controlling the suruc trends similarthe area have trends similar■loted that most of the structures subdivided intot ... in the area -an° ■‘-Suit directions. raui^ n .t„ , orientation (Fig- J-3,‘
groups based on their
N\'W-SSE trend. This trend is' 'na3 or group of faulL= h3V' regions and along theP- • 4. Tana river y°n°unced within Witu, _ region, the faults are
Hi? Tana riverndanguo Kipini line. -r

-91-
N
Fig. 3.3S E D!A G R A M ^ F f » y i S ! e ^ ^
-92-
all parallel and do not have any cross faults intersecting them. They are normal faults with downthrow towards the- Tana river Which devides their pattern into two. On the western part of this region the faults downthrow to the east. On the east the downthrow is to the west. This fault pattern has resulted into a
synclinal structure.
> £ T+-c pre connected by cross faults Ground Witu, the NNW-SSE faults are-t-n the south. At Bodhei and 'dost of which have downthrows to
v • fhere are three major faults with atween Bodhei and Iiararan r
th- only faults with this trend in the ‘ W-SSE trend. These are tn. o n y
-Astern part of the study area.
> . ^ well developed is in the NE-SWanother trend that is not
the coastline, especially alongSection. This is seen alongw . trend is well developed. The throwste-Kiunga coast where v This trend is also seen around^ * mostly SE (towards the sea).
th Rodhei and Pate.^odhsi and the region betwee „irfs of the study area have aMost- 4T n ,nd eastern paruso e cen ra ne-SW trend making the
of fault otl.nt.tlon. ~thvi-'-SSW faults constitute about 95%
■’•lority. Hat. th. »-** ' fault, ttand and« the total faults - «ound > » », r-.ht Structure. Tnia mak.s it a
NE-SW faults form a closed fault
c°Oplete closed high.
V,ithin the Tana river region,faults are parallel and continuous
A

- 9 3 -
with a systematic pattern of downthrow. Those towards the east
dre of a short extend and are joined into a fault network without
a Particular pattern of throw or trend. The difference in fault configuration of the two regions suggests a difference in
tectonic events that led to faulting.
3 -1 0.2 SEISMIC STRATIGRAPHY
The sedimentary sequence in the a:rea vary in thickness. Seismic
sections ,0- that tt.se is . °f « “ *■“»**
the see end locally « *
The ■ _tion towards the sea is seen on TWT overall thickness variat-
Pnppne (Horizon G) changes from p.i . n 0 lower Eoceneections in Fig. 3.2. ine • at- i oiis are also oeen on the2 c r-ivtt1 The variations•5S TWT to 4.5 S TWT., u[i • (Fig 1.4) Sections GG at
Cr°ss section TT', GG' and «H .n n , \ Eocene Horizon (C) has anP°int G, the Oligocane <r
^Proximate thicknessof 540 m, at Mkunumbi - 550 a and 1 300m at
n
HH* was considere< /horizon G) on section M.the lower Eocene (h north. At -
at H 111
ered a/horizon U11 ~~~e lower Eocene (h he north. At thes found at H 11
■ness of 800 m p =1 7 0 ), the horizc• 1 in» M6933 and
'section of seismic h » - thickness incr
thickr
izonn of seismic - thickness increases to
. q c 0 m Southwards,ness 01 .ha horizon changes from
The thickness o m at Pate. . . in the south occur. t thick i]i • +-hp north toilly moderate in * . 0f Mkunumbi through, the nortna NE-SW l i n e from Witu Qn line R72 to
oint (SP) 5175 on U - ^ ^
/
- 9 4 -
Dodori, south of this line. To the north the beds have a sub
horizontal dip and the thickness of different horizons is nearly oonstant with localised thickening and thinning. Thickness is
ma*imum in seismic lows (basins) and minimum on highs. On land, the Tana river region has the greatest sedimentary cover.
Here, the basement is estimated to be more than 8 km deep.
3 *1 0.3 MAJOR SFITSMIC STRUCTURES
lineatad a syncline, an anticline and^he seismic data has deo h . . . • _ aroa The syncline and anticline arether seismic highs m tne aua.id^n+--4r. . H Kioini-Pandanguo respectively. The mostuantified as Tana and Kipj-uxProm-: , • n_ , - -he 3odhai high.0lninent seismic hign is -*
1 0 • 3.1 the TANA s y n c l i n
•s U
a de
.-ivar from north of Mnazini to the ies beneath the Tana i .
. has a NNW-SSE trending axis. Thelta and offshore. . . _ cor
, T +■ r i d selta and offshore. 1 u . . . ,,.h tts geometry conforming to the i^d with iui:> ^m e is fault control— thenormal malts on m e• n- and paraii^^Of the near straig. - • faults have an approximate
■ernthe near straig. >- ' ^ faults have an approximat,
Part of the stuc_- a-~a T of 1 - 0 s and-f 1 6 00 m based °- stive downthrow oi
-ity o:,WJ1‘---- cide, the syncline limb- on the western side,
-ty of 3344 ms-l . . H The syncline■ t than the eastern = ia-’
■ more gentle gradient 4 linal structure on theanked by the Kipim-pandang Tana syncline is
lco step faulted.tn side which is also s c ~f on<=st part being at. line R 134 with the deepesshown on seismic
2 0 . J /
-95-
3• 10.3.2 KTPTNT-PANDANGUO ANTICLINAL TREND
This is a much faulted NNW-SSE trending anticlinal structure, . _ . n m s North-south from Pandanguo to(seismic line R 4 2) that rvj 0 structure forms a saddle sort of featureKlPini. Near Witu, the strucim
a email anticline. This might haveand divides into two forming
formed as i.. of displacement of the Kipini-Pandanguo result or 1
•ructure by faulting.
All(O'*h
inuousi/-, structure Is conti:hough the Kipini-pandang t , j between Witu and Mkunumbi. • - Historteudollarain 1971), it is « of the structure atis
rain 19 71 ) t . of the structure at_ culminations ordistortion caus ^ of the anticline, there is a
"ndan9UO an<3 KiPlnl' T°dl p horizons at Mkunumbi and east ofhallow svnrline with two deetsynclme w , cuiminations can be seen onhe pa j ii This synclm-Pandanguo well. nd SP 1690. The. Mkunumbi markeriris R 42 at SSP 1715 ne _ . ra interconnected by
of the anticline^ ° r faults on this side o _ fault configuration, 4-h at KiPin 1' rn°r faults. To the sou ' rounded seismic.urs forming an a n'Sults in a closed stru Kioini well, line R55.i9h With the peak of culmination a
3.3 _____■vh most of the fault,
faulting wi-nstructure might be due to region. The nature of
<-he central r y5.73v from with the faultsJ downthrown away structure
.. , -4. a complete cl°°e better defined with- m g makes it a coi . becomes betr_ . . The structure basement that
-ng around at* . remnantbeen formed as
It could have been

-96-
resisted basinal subsidence, or as a result of volcanic intrusion with vertical forces from below causing upwardmovement of the central region relative to the surrounding. On the seismic two-way time maps (Fig 3.1) the top of the structureappears at the base of Miocene in a sort of curved shape. The
, . . . _ +-his level occurs east of Bodhei -onstructural culmination at rni^„ c:p 9096 and R 68 SP 23456. At top Eocene,seismic line R 70 b> r
, . _ . _ cp 2335 seismic line R 6 8.culmination is on
3.10.3.4 o t h e r s e i s m i£J1I^^
y. I shallowing up of depth to seismic Cross sections show a general
. i and away from the coast line., . j„ t-he nortn-ed^Lhorizons towards tn Kipini/ Lamu, Pate,Dodori ancClosed anticlines occur a
-f Phese anticlines make a northward Mararani. The culminations of
This case can be shown by comparing theshift with ago (depth)- of TWT maps for Miocene (near base) anc culmination positions^ ^ ^ LamU( Pate, and Dodori highsEocene (middle) (Fig This northward migration
. Qhift of a b o u t 6 km.show a northwar ement subsidence towards the
t*t*ributed towith depth may be a beds dipping seawards. Then t n vounger Dsea after Eocene leading to 1 . at great depth. This implies
not aPPeal yMararani structure doe Eocene age.th.t lt be » * * °
3.10.4 IINCONFORMIII-^
The top of horizon
forms an u n c o n f o r m i t y• CretaceoE (middle _ r68/ r 56 and
surface whichcr q i s mis shown on se ic U neS R42 R48

-97-
R41 . a trace of the western limit of the unconformity can be, . rriq alonq the west of Mokowe-followed from Mkunumbi, northwards aio y
4- rs-? Rnrihei road junction around Dulcal. Bodhei road to the west of Bodhei roa
~ ioWer Eocene onto the upper-middle The onlap of horizon G, iov/eSeen on seismic line R42 and R48 atCretaceous (horizon E) isis also noted on line R68 SP 1715 and
their intersection.. Piti the onlap is noted on shotpoint 4554
R56 SP 2805. On line R4 '4.he Bodhei Ijara road. The onlap of
where this line crosses . to G in direction. Its^ , . ui on E is similar roPaleocene (horizon H) .s from Mokowe to slightly east oftrace limit forms a line Bodhei.
results
. the overall quality of data w . O it was shown that tn subsection J.z, noted that the fewIt should also be norea udi cue i-wsed was fair to P°° n(i 1 9 7 1 have their own
shot between 1969etter quality lines _ penetration due to shortQf vertical y
imitations in terms pacing allowed better lateralpacings used. Normally , q-ructures such as faults.
, 4.4- r definition °'^solution i.e betc-. control using well data and . of seismic data, co.
during the analysis , ipts made to reduce the, ^ ensured and att
jravity data has d- Data interpretation wa^. fhe poor quality
-rrors inherent in ihmitations data,jo the 1 1 ^
carried out with knowledge o confidence level* _ it This raisesmade for it-allowance being

-98-
in the interpreted results.4. fhp structures in the area are
This study has shown that most of the sThis is especially shown by the Kxpxnx-
fault controlled. . .„htch might be a continuation o, the .a
:ault controlled. . . Ma1nwhich might be a continuation o, the .a
?andanguo anticline Kioini closedalso Bodhei structures and Kipim closedPandanguo structurs.• . _ . _ — I- y-nl Isd*igh are fault controll-i
,rawn cross sections across the (1 9 7 3 ) have drawnalters and Linton Their sections agree with
based on well data.'resent study area terms of increase in
. „ of the present stucr*•he cross sections coast. However, one
. ntary cover towards thelepth of the sediment j Linton (1973) show the Tana
Walters anddisagreement aris / Qf the Walu-PanaanguoSlut-the westernsyncline which i3 °n flower than the complimentaryKipini structure aS * spring the top of Mesozoic in•de Consideij- ^syncline on the eastern si • timated to be at a depth of
Syncline lSthe Tana area, the Ta 5 . 0 km.
line on the east3.5 km and the sycnH-
the Tana syncline is shallower . 1evel/ ^rpi . . _ . +-hat at this Qf Mesozoic in theThis implies tnar ^ shows the top
K rphe oresent s n(j m the complementaryby 1 .5 km. i n *■ f 6 .3 km anat , ■ _ to be at a depth o present result is anTana syncline to ^ 9 Km. 11
. , at a depth ° and Linton (1973),syncline to D a a A by Walt-,^i.es made, i-he estimatesimprovement on u
. reasons:' T .n1.on (1973) were highlyfor the following - s and Lin -
n hy Waite-1- unif°rrna) The sections drawn by used «ere,nce the wellsspeculative s
. 4-hin the area.distributed wi

-99-
b) All the wells used were on structurally high areas and none
in synclines, so the depth estimates in synclines could be
highly unreliable.
c ) Since the same
present study, present results
wells that they used are also used in this time with two other methods, are considered to be more reliable.
thethe
d) Gravity data show
negative Bouguer
the Tana syncline as an area with a large anomaly suggesting thick sedimentary
cover, uni ike the syncline on the ea:tern side.
n the formation of Walu-PandanguoAlthough gravity data ha havp shown it to have> tr lad
'icy s =ismic data have shown it to navenature to be block type#
f the graben on the western side than the greater downthrow oi
tern one.
that has been noted on seismic e unconformity (sub Eo Dlift of the western part of
result of u l
ctions occurred aS l^vel. But sincej_3j-ic changes in sea eustaci^ ^G embayment or due . tween early Cretaceous and
ra quite hig1G sea levels wer 984 , Gignoux 1 955 ) one s. at. a1•/ figocene times (Mcquil 111' t?rn part of the study
uolift of tference would be an - the walu-Pandanguo-Kipini• pinde emergence0a which mclua
Lticline.
-1 00-
4. WELL log DATA INTERPRETATION
4 . 1 i n t r o d u c t i o n
„ fotai of Sixteen wells were drilled inBetween 1954 and 1 9 7 2 , a . n..
. v,-„h are kept at the National Oilthe study area results of w i. six 0f the sixteen wells were chosenCompany of Kenya. b f these wells was based on their Present study. choice ^ ^ used have a depth ofgeographical position ^ ^ wells at positions thatat least 1 900 metres. ^ within the area was notcould ensure uniform drilled wells areth9 I 3 C Usatisfied. This was due >- ^ ^ area (Walu, Pandanguo andconcentrated in the wester P Pate, Dodori and
ei.,i strip (L,amJfv. , , , coastalkipini) and along tn- ^ Mararani (a distance or 1 1 0• . hptweeti Walu a;Mararani). The area
apart) has no well5*. • a Pate, Dodori and Kipm1' 'n Paiidangno/
The wells used are Walu, writer by the Nationalj_ven roMararani. The well log data L were three types;
>il
rell 1°3 data _iq were three typesfor anaiy51^^ Kenya (NOCK . i Qcts and lithologycompany of Ken-> . ai density logsformati . ,
°mpensated sonic logS' and chronostratigrap ic uni- showing litho««*tl9” (’'” e^ ^ „ a utholog, logs »«•
'h. ooop.ns.ted »onlo logs. * “ ,tlo„ <0 .1 . »'•. .he seismic i-
lsed as controls in t, ,ogy logs were used. For
iithoi°9iin loh data, ' e accorapameainterpreting well 1°9 ded by NOCK
i m a y logs P ^ ity, depth, age,-ach well, the lithology ture, P°rOSlti
of rock colour,’V a description oi

-101 -
content and sometimes, salinity of the water in pores.
Many stratigraphers and sedimentologists (Pettijohn 1977, Hallara 1981 and Waller 1 9 6 0 ,Hobson and Tiratsoo,1975) acknowledged the fact that in stratigraphic studies, lithologic analysis and
nnf mifh Droblsm as it could be done by description does not present mucft pioor-_ rtfoinaist However, stratigraphic age-any average sedimentologisr.
and lithology is the most ^termination based on palaeontology anddifficult task that face^a sedxmentologist.
it- is expected that theBased on the foregoing Sc3l-'2‘'
, hv 3P- Shell, could be the greatest error in the data given b>
Tt- Should also be noted that sincechronostratigraphic boundarxes.s ■nir.d bv the same oil company, the
*11 the wells used were drilled b>chronostratigraphic boundarxes is
1,1 POSitl°nin_9o ^ The aim of using well log data was e-Pected to be c o n s i g n • different parts of the area inL° c°rrelate data from the whole area, to
1 sequence°rder to establish a --or recognize unconformities,
Q f deposits, u"-valuate contemporenei V delineate depositional
, nic fabrics anaconstruct palaeotec
terns.
re< Pa t -
-102-
The stratigraphiccomparison of palaeontology
for each well by BP-Shell)
texture, co
of the six wells involved lour and thickness (given
4.2 RTBATTGRAPHYnin the study area varies considerably i
The sedimentary cov^r north to south. The• upases from normi 1v increasesthickness and gener ]_0v/er Cretaceous whichdeepest horizon reach th Qf 3485 metres. Tne tOP °~encountered only WalU * depth of 1 485 metres andencountered at a u ^P f w?lu w3S e‘ -pn960 ThisCretaceous at wax . a dip °f o.yo
This 9ive .3165 metres at Kipi^' horizontal in the younger beds. and is nsar Ydecreases upwarcis(Pig. 4.1).
. tes that sedimentary lithologiesDrill hole information rndxca ^ ^ The lateral facies
, w throughou lls> This suggestsvary considerab y .Qn between
ffect correlatxo study area aschanges greatly a <-rols within, contro-L p_4.p Tne
a tional Kipfn - anddifferent deposit tered at Pn-,aiessnC° . a walu. During Eocene,
suggested by litho Mararani an .. dhas bean noted ^ beds ware being depositee
same trend has continenta were being
around Walu ana (Kipini, ^ ' Eocene onlaps upper
WhilS thS . SOU?aleocene ^ disconformity cannotdeposited. Tne (Fi9- 4-2)' between Walu anaformabiy w e H sCretaceous discon lack ot aIll Weil- x l i a
r d s due tobe traced northwa natur5to tne
Mararani and duetne
irse grained, dry matrix
y tine grained -detrital with some unconsolidated sands
■> interbeds ofstltstone
*ry fine groaned,detrital coralline with small lamellibranchs
nterbeds
interbeds
terbeds,fossils and slightly sholey
lignite stringers
ralcoreous interbeded with foramirirferal limestone
Poorly sorted,fine grained subtidal and shale limestone interbeds (Numulitic)(4m)
iVith occasional sittstone interbeds
yon calcareous .carbonaceous pyritic
/e ry fine grained with shale interbeds
ery f ine grained with thin shale interbedsand fine laminations ind lamellifract (thin shelled)
ine to coarse graned, slightly calcareous
alcoreaus with interbeds of sandstone
►oorly sorted with mudstone inclusion
?ded with mudstone/ very fine grained and scndstone y sorted) with carbonaceous
FOR KIP1NI PATEm a r a r a n i w e l l s
-fOfy.-
PATEO m Q s I)
DODORI(7mosl )
MARARANI.(2Qmosl)
SANDSTONE-Medium grained argileaceous
LMESTONE-Detrital foraminiferal
LIMESTONE-Sparry,sherry and d e trita l
LIMESTONE- Dolomitic with mudstone bands
ANHYDRITE-Irregular stringers
LMESTONE- With dolomite and mudstone bands
SANDSTONE- Soft with thin limestone bands LIMESTONE-Fine grained with mudstone
i jM l SANDSTONE- Soft with Ignite bands
LIMESTONE-No planktonc foraminiferal
-1 05-
Kness towards the south, especiallyincrease of sedimentary subsidence rate during this periodduring Tertiary may imply hig ® metres at Pate Qf Tertiary
„ at Wain and «'uu giving 1485 metres at
beds.
L0V7ER CRETACEOUS
Thisencountered a
5 succession ^ »' h “ 3 9 Wneck grey calcareous »M l " „„astones. The » • »
, fine graineC ^Ua _ with minor siltstonesmudstones and f m - y spndstonesrS0 grained - grained calcareous
composed of c° withinto shai dstones become more
which change upwa s# Ths _ . fr mudsto ~ brecciation oj-sandstones and ITlil the top* > -...towards h l 8 tectonic conaitiquartzose and clean indicate unS auartzc
,s thought to - ^ fine grained gsandstones i The . ly a deepening of
_c 1 9 5 7 )* , top(Dunbar and Rodge towards start 'of marine
n dark shalsS nr0babiy thesandstones and and Pr. . 1 environment
Lhe depositions
transgression.
ionzose
LE CRETACEOUS ^ in the Walu wellnCountere pyritic shales
. u was e . gr®y' ™. ceous whi° 3nd d3r toWards themiddle Creta dston^ . mudst°»e
d of c a l c a r ^ - ey ,composed o int, of calcaromposed or into y.„h changeshe base «hl* base indicate
bain the ha
o£ darK P^rlresence °

-1 06-
that they are deep water deposits and the silty top beds are
shallow water deposits. This implies that the marine. _ . j flnrinq the middle of lower Cretaceoustransgression that started during
.. . h,lf of the middle Cretaceous. In thecontinued into the first haircretaceous, a regression is most likely
second half of the midaie <-reu to have taken place around Ualu.
UPPER CRETACEOUS
.. is composed mainly of dark grey, succession in the soutnuccessio. shales have interbeds
,nd silty shales.htly daic^reous a 1 _j
tie br
SSI00 ia thS S°' The shaies have interbeds,nd silty shales.calcareous . d sandstones with subrounded
, ftne to medium grainebrown, fine shales in the lowe:
, a calcareous matrix.grains and a f qr^y„mall layers of gr~y
. , calcareous: grains and a lsvers of grey to pale brown,
,,tea with small 1are intercala medium grained sandstones withn.j-ed with
interCa , medium grained sandsorted, ° ions.
, mudstone inciujo *i opir sceous riecK^
. c composed of mudstonesthe succession
north, at Walu, th ^ sandstone interbeds. Towards,le interbeds with rare tu argillaceous. The rest
and shaleS beco shales with a few>, mudstones ana comPosed ofo r Cretaceous lSi upper -L „ interbeds.
jne and mudstone i-. x. increase towards
ous depositnnoer Cretace _ that there was
Lckness of the ‘ This r-’3to Kip1111" less at Kipmi anafth i-e fro- which was
Tinoar Cretace carbonace°ui during the P occurrence °
The °cC____ at Walu-

-1 07-
_ . ,-he depositional environmentiroughout indicates a .
rn the shoreline. The Walu arelallow water or close to t
.. . hiqh compared to Pandanguo and Krpilready a structure
• lied by the mudstone deposit his time as implied i t at theu,llnw marine environment at the
was area was Kipini at
Walu. The1 • by tuc
is time as imp- environment at the beginning, . = a shallow marm- enthology implies r towards the end of this
which becomes de Pupper Cretaceous noSition of Pate, Dondori and
. the geographical pn o d . Comparing ^ bhat the Cretaceous formation in.rarani to Walu, kipini/ Walu and pandanguo
, !iv marine.lese wells i3 followed hy the middleCretaceousPresumably) the UpPeJ- EoCene and Probably the base oficene. The Paleocene, loU'r ^ suggests that the
missing* .iddle Eocene emerging during this period.
trend wasipini-Pandanguo-^3 than Kipin^*_ • faster he Walu area emerg
:oce:i\ L.1 1 and is composed of very
Dodori welintered only the top, followed by fine
was encoun fon8s at, oorous sand»t r8st of Paleocene to
arained . ^c+-ones*
» tic o£ “ "a'ton*s. depth » ~ " p . • » « * • 1 1 i , c °"po” a
t,ta' *" t M ,lg.l, caroona b3ds. ,nt. The sedimentsiru-tfJ' avironmeiit-.alga- of-et niarin r-in° environment since
shallot -"ate water **rin~cate very a deeP bundant alveolinids and
-i ndic'a ° -,+-ains ards the top and c°n - ^ more marine,
,re m i c n tlC ara —limestones - ueThe
sandstonesnummulites.

-1 08-
since they are more fine grained, calcareous and with less
argillaceous matrix than the basal ones. This suggests thatthere was a transgression that started during the middle
^leocene and continued to the end of it.
EOCENE
The LoweDodoWal
in the wells at Pate andr Eocene was encounteredis missing in the wells at Kipini and
Otherwise, it -or-an-i and Pandanquoori. Otherwise, it lSfhp Mararani and Pandanguo wells,
u. it was not penetrated in theVJalu and Kipini, it can be
1 y-_ . i nosition «°m th-3 qeographical 1- - - J '3 * is missing in Pandanguo. In°tcluded that the lower Eoce deoth in Patehouid be existing at ceptn. in Fate,ranani, this formatio ained detrital limestones withlle succession is mainly ronauinoid limestones ofi • n +- o £g rad m g■Lehtiful forininifera int'
°cals and lamellibranc^sand shales. At the bottom
1 ic limestonesre is a series of cyc l 1 .tic shale with limestone
is dark Pyrl .... _-ach unit, ther-
ITnai? brown, clean, fi into PaJ
,:n i 5g become less darkm > 1 -i —cop *. .. r _ . ,,;na of depositionalined limestones ^ shallow111•mnlym9. , _ top iITir J • an abrupt change°urad towards the t there is
A o f eachironment. At the end _ V-» I t~iH . -it Them e previous unim
thed, poor in nu‘iur,ul from1 -hange
.ne. ua u-'-dpc Upwardl-hgers which graa
CU& c'Lihed limestones au sncixi--- -n - - n ythare is aa abruPt chan9<unit/, becomes more coarse-pcsicn
hoi5 SUCn u . „j and non-calcareous
poorly 5°rt~>r L clear waters toquite
■rd p cJ i „inq o.s the top mpl-*
ow marine.

-109-
Eocen“ is composed of a series of porous In Dodori the lower Eoce - . , of
vtic umestones with some slight rnterbeds of ,sparry micro-oolxtr ^ shales. The iimestone-shale
dense micritic limestone ^ Eocene in Pate has more
cycles are less ^ v e l o p ^ . ^ where most of the j
clastic contents than probable that in the lower■ ii mestone. 1lower Eocene Is 1 , o.ue south and southwest
• axis was developed toEocene, a deltaic a which persisted throught
t-o the northerlyof Pate in addition r Eocene succession at Pate
However,, thethe lower Eocene. the southwest.
j bv a delta towas more influenc
I
adgedeltaics (Tucker, 1973,. The fauna 'he cycles are probably « oersistent carbonaceous
s comparatively
0 QS1t the persistent carbonaceous
water/ bu deposited close to land.the shales were
leeks indicate that the ^ cycia represent penoos wnenat tne t0p ° (Dunbar and Rodgers, 1 957).ne limestones great (
. GPdiments was * he basa show increase inhe influx of s° toward
and siltstone conditions upwards.he sandstones deltaic.•eating dacreas
• ize thus indica
:ene \ the succe . ,pate area),
^,nbaymen lls This is shown oy theath of Eamu oth3r w*118’than i" ° and glaucom
influent® coally111 . .itic,
ssien shows
amu - hariUenca ^ ° y and glauconitic coastalthe dark ' shales, PVritic and
from to t Generally,the «ortl in th e south-in liroeStonas - of elastics fre
al sparry piropo
S3 in
there irom NE

-11 0-
, ,.af p3]-p was on the southern flank of theto SVJ. This suggests that Pate wasinto v/hich the continentalmiddle Eocene-Oligocene delta
received less coarse elastics than sediments were carried and so recei„ . fhp succession consists o
in
the succession consists of'"alls further NE. In Pata'
ketones, generally finer grained with terbedded shales and sandstones,• escalations than their counterparts
n°re frequent limestone, the middle Eocene in Pate
In Dodori. Below 2347m depth, t.1 limestones, which in Dodori
Consists of massive foramini e . . . . .The sandstones and siiustonesire interbedded with clasti , indicatincr a size uiius maitatingtowards the base show inCa nHitions upwards.eci“easing deltaic condi
be put into the following sub-> „ i on may
Kipini, the succe. _ upwards .divisions from the old-~=>
ClasticS•limestone-elastics-Shales- were different cyclest imply that tner
Ih«sa sub-divisions mxg 1 at Kipini-orevairr y
0:r environmental conditinot fit the pattern ofaccession do~s
Tk Kipini s the west and SWsubdivision of sticS content,3 . £,ize and °la t be related to a delta^teasing grain - aopear
They embayment activated0 v * r t h e e m b a y m e n t . o f t h e Lamu
o,. . uiie western e ^ faults (mussman, 1 986,'iginating from ti bounder^
Peri ,. „ by m o v e n t of 3 9 4-323) were probablyrtodically oy - nn1 ^_.. +- spdiments o;er 1 973). T he S ' ,
f un1^ along the western edgecence,period °£ a larger delta to the
'Sited during a-nd werethe embayment n
need W 3influence
-111-
north-east. Unit 1 may be equivalent (2657-3017) to part of the?147 at Pate and below 2200 atthick clean limestones below
T arp not cl(. .y^ Kinini limestones are not clean and arebodori. However, the Kipmx. , MW qnd W. The linderina limestones some sedimentation from the NW ana
. nnrlnri and Pate does not occur at which occurs in Mararani,Kipini was inKipini. This implies that - i .n a different
--At this stage, Pate appears to have
Positional environment.f.Tn deltas, thus not receiving anwKa-f-'v'pen tvvo ,situated mid-way The current
ing anye-n situated mid-way •> - of the deltas. The current beddi°arse sediments from eithe ^
at* Dodori suggest that th„y are a of sands wnd -n-h'pd SlZ^coar^u giai. - cir^q 1 963 . Tney3d size , and Sloss 1 963 ). Tney coulA 1ta (Krumbem anaeset beds or the - e s and sandstone beds iri3gated mudstonesequivalent to the va. - - f the delta. Th
ent the top-set oeds
n
andanguo which rept©s arqe ancestral Tana riverbesn a 1
21ta could probably haV"lining from the west.
• is composed of poorlyene successionWalu, the middle EoC inad pebbly/ argillaceous
a rse 9r:1ctea, fine to vary ^ with red mudstone beds. This
A t o n e s . It is non of deposition. The middle
Mi., . continental t„. „.»■=*»*„ • *■ e on u j3 T-Tg lU 3l
:-ns in Kipiui ©n
EOCENE
upper Eocene
^^Sewhere in the Ea’aU
pat© ; 1"10 W moi1 mad ne influence than
;robayment- Tnnew ell contains more

-112-
•imestones (nummulitic) than Dodori and Mararam which have onlysandy limestone bands.
Thp m . _ wells show that during the uppere Mararani, Dodori and Pate wenbEoceno n whose main axis might have laid to the
, a large delta wnos»«nort-h * _ the upper part of the embayment.rh of'Pate covered most of:oiis „ in coarse elastics content i
e q u e n t ly , a consistent decrease in ___ ___i_ _ iin
u— -f Cl --been ‘ „ from NE to SW. The upper part of theene strata is observed fr°
•-tent with this pattern in that• n c consisreuL.Eocene at Kipini is co . , t „nrained than their equivalent in Pate
lmsnts are less coarse <?i■“'"ils are less cocu^^ .v-i^ini succession contains more‘->°dori 'jaar the base, tne ‘ .__ th.n its equivalent m
CoarSe elastics, coal and. c+-on.= s than its equivalent inless limestones
—-o implies-ource of clastic sediments i
h n the wasmav well have been^ver ' ,er the western side
r system flowing ove~
that the+ Qf Lamu embayment, from a
rrii-al 1 v correlated withlithologicanythis .level, Kipini cannot bably due to dePositi°n
. This lS *•Dodo-' and Mararam- In the northwest, the> ~~ hic evened*Sir>g influenced by strati9rap haVe been consistently_ -x v* G L.Oss>sitional environment ^ P ^ ’ consists of very coarse-•icce sj-•lii nt a 1
, the su't w a 1 '
s wit'1 ret3f°ssil:ferous sandstoi -
_ aad clay matrix, clays ano
s also non-marine_nt wa: 3nvit°nm3n- t, .-ioiial ■3“v' continental water
a^ a a g u o , the d e p o s i t s shaU °w•th ' .flying SOinS 1 snvi.ronmant durmg upper
mudstones irnp y ^ional snK itl n u the deP°SlOverall ,
Was shallow water•

-113-
OLIGOCENE
.. 3 T"S similar in wells Kipini/ The Oligocene limestonesl deposit
. .. that the Oligocene limestoneslpate and Dodori. This indicate
coastal area.L«-e ana uoaon. ■*•**'--
. , along the present coastal area,deposition was widesprea
■ ,nd Pundanguo, elastics dominate, further inland, at Mararani . , .
. n?s deposition at the top of the However, the intermittent limestonelarge delta Which might hav* causedSuc c 3 s s i o n i n d i c a t e s t h a t t a s a n d s t o n e b e d s in W a l u a n dth® deposition of continen
lndangao area was « . « . <»• «U *°—
The-nd Mararani have sufficient
Pate, Dodori -1 . _ marine than the
niar i
r ^wells at Kipini, more marine than thecCion in Pnte. succession ,ne fauna. The sucC'3S easss towards Mararani.nvironmsnt a-
^st This marinwhera • +- o stringwe have lignit
flVliU • -lose proximity to theingers, implying .
„ p= ndanguo wells have deltaic01s ,.no Walu a»d -■^gocene shoreline*
posits which sugg
W3lU .. rjgion formed part of the upper past that ■ delta and was thus more
y- 1 v e ii Ta na L9ion of the ancestra
n beds-°oded by continent*
rained si2' =^rting and fine 9 . _ deepest P
„ increases towards Pate.sediments
•h« theo kjl *-
of the study areapate was c..- deposition at the top
is indicates tha 5 St0ne _ .The j ,-r i na this period., time. • durnDUring oligocene ,an3grssS
r of marine ^ ‘J<3gests the start
S&W.ER MIOCENE
Th!s success . a s chie^ ^ ion 1 ^
co>npos£ iime!ed of x
;tone: in mo st of the
fuKi1' ■*

-1 14-
. j psnHanauo where ws hdvs mudstones. Thiswells except in Walu and Panaanguu, . i-ransaression continued into lowerimplies that the Oligocene transgresbiu
Miocene.
. . Hense mudstones have thin limestonePandanguo, the na_
. the thin conglomerate interbeds;rbeds which correspond withThis suggests some local marine
iin the Walu mudstone e,al environments (Gignoux, 195o). The
irsions into continent. +-0 continental deoosiuon. The+- r-oraalv point ro ^ beds at Walu strongs p
i -i of the sea. At Mararani thee Hie shoreline oilangao area was . .h ±.and pale grey with d^uriuh rd dense anu p istones are ham/o hard, clens
.fp lignite and anhydritedolomit-/
trital fossils
i.nds of
v^pfal with porosities of eS are vuggy re,-la
i, the limestone 0f anhydride and lignitealso have tra^-=
15%. They ceSSion becomes micritiThe success1 ^
the base. ‘ ^ enVironmVjg! base- 1 environment
uuiet vjat-rsuggesting coraposad of limestonelower Miocene ^ grained and
.. compact,
0,nes micritic towards theInof deposition.
s throughout.C W ' "
lower Mi o c e n e grained and foraminiferalcomPact'.stones are '"°re size decrease is generally
f the wells-ie rest
--7 fine qrain with well .1.-1 . veiy 111 detrxtax.are tov
limes to _ ha u°*-base,Towards the
limst?uv" the top’matrix a bedded with pale grey
sparii .. i andde t n ta s into samfawn, h changsblecoine which cstalas, P,lcareous

-115-
with dolomites and lignite stringers.
mU . fhp deoositional environment becomesThe well data suggests that tne aepo*, north. The Oligocene transgressionmore continental towards the norm.
This resulted in the formation of continued into lower Miocene. mis re. ^ e the base with occasionalshallow shelf marine limestones ath„ri,nns The dolomites could belignite and argillaceous horizons.
, . . n s-ea water through limestonessscondary, formed by Perco a
• f 1ianite and carbonaceous beds (Salley, 1985). The succession oi
. indicate widespread marineh r . . deposits m u' extensive ,Reineck and Singh, 1975). The
tra~ „ the embaymen= ■ sgressions • ' twasn that of Pandanguo and Pate,
fp-- • _r • • • foils midway^-•es in Kipini Pate where we have reef. , is mainly marine
succession is succession is composed of. d pandanguo, th-
•••^stones. In talarone internees.
cstones witn innest
n.a
[QCENE
. . . the succession is mainlyPate and KiPinl' dolomite band
limestonesand shelly 111 ession becomes fine
Tho sueDodori. qm3ilibran^hc: at.,ath lam''
is mainly marine. Its and minor
TheDodori- libranchs at Patllin8 with lam-
-1 and cora1 1 -tal/ sparry, <al dil . , detritaIis mainly thin .iation 1 5 tisation alia
r dolomi with5 with *in° £oraminifera
le s<dccessi°niij h o i e
grained, Theander-
25%.

-116-
r . orp dolomitic with rare mudstoneIn Mararani area, limestones are aoxo., iiy._ npar the base. Some parts arekands. Trace anhydride occur
^h-ieflv fawn, micritic and buffy P^ely limestones which are chierryThe whole succession has no planktonic
c°ntaming forainmifera.- .-t, marginal deposition of limestonesf°raminifera. This suggestsand Possible lack of open s
connections with some short serai-
arid conditions.
5ar 3 pur
argillaceous, marly, silty andndanguo, the lim-st succession becomes
, h e r Lamu wells- Tn-Pure than in all ou - . an abrupt change tor walu wini G.iillaceous ar■tic and partly arg > ^ nicritic nature of
, y Y\3 base, pnds at rji-i unfossiliferous sc - mention ia shallow quitest,ble dep0^-L-+- orooao-i- - #
limestones sug9e;D *" . nal marine influx. The, with occasio-■s, maybe enclosed Ian- _ ds to limestones at Walu
clastic>t change from l°oS'' a that might have started
. rine transgr-st a northward mar
middle Miocene.environment is mainly
oSiti°nalthe ^ep r • 4-, minor mudstonether we 1 1 s' ._aStones w
d 0f 1 interbeds win- -pomoosea _ ,ids owater, cOJ of 1 _ interbeds withinof muds-
n ~ c urrenc*- 3odori having lessations. The °~ rds the west- .„=a towaias 3 than Kipmi and_ increa havingas seem to M „ te nd _, in tut" Pa _it^0n of Tana rivern,te and m , po=lu"s tnan Pat to th'
raid roThis coi its that tin
3 i“ th3 po^-'elated to influenced by theae rela was
. n3 dep°slmudsto
river.

-117-
I n K i p i n i a n d P a n d a n g u o , th e s u c c e s s io n t h ro u g h m id d le M io ce n e
c o n t a in m u d s t o n e s . The e n v iro n m e n t o f d e p o s i t i o n a t K ip in i . w a s
P r o b a b ly f u r t h e r fro m th e s h o r e l in e (more m a r in e ) a s com pared
w it h P a n d a n g u o w h ic h h a s more m udstones and l i g n i t e s u g g e s t i n g a
rain o r r e g r e s s i o n . The l i g n i t e o c c u r re n c e i n Lamu seem to
, rwinri area which probably remained increase aw ay f ro m Pate and Dodon. . irjna middle Miocene. The Kipini-
as a deep marine environment„ a r a i l l a c e o u s , more s i l t y and l e s spa n d a n g u o l im e s t o n e s a re m or-
i o r a m i n i f e r a l t h a n P a te and Dod
rosf and lagoonal environment. . .predom inant l y
implies that a Mararani does not extend to Kipini.a and Dodori anc P ^ supply of sediments fromhis is probably due to proxi th walu-Pand
. in t e r f e r e n c e oy
Phis
proximity to ^ - -obably due the Walu-Pandanguo-. r and interference y
a n c e s t r a l T an a n ve
P i n i a n t i c l i n a l trend.
4I0CENEital at s in the
st are pur<
ar3 s p a r r y , a h a l l y and d e t r i.n i, t h e l im e s t o n e s and a r g i l l a c e o u s
and becomes g r a y . The ».t «A i n a i nt0 -n-i r r i t i c m a t r ix . A tn a r f S c rra d in y am ic rxuxParts y . .f3jr0us
v. are f°ssl ' „1,aay and reef type with:s which ar -liferous, vuggysparry f°sS1 are poorly consolidated,hey are SP pate areLimaatones lUbranchs, gastropods and
dstones. - lamell• bands/ o r m i n i f e r a l . The
W it h c o n g u in o r d grained £°rThey are to very coarse
l i t a r y corals- nsolidated coarse_ _ „ ^ iv con s o n
interbeds with clean well rounded quartz in abundant clay matrix
at 200-258m.
mi of limestones which areT,1e Kipini formation i» composed 01
3 , . m r \ foraminiferal and becomes siltyletrital, shelly coralline andA+_ 2 3 2-2 63m the limestones are
and finely sandy below 2 0 2m. At___ -b n n H hp rrl r-pilj'1;careous
u
an<3 finely sandy below duzm.. rse sands and hard cal
•'iXed with unconsolidatestringers. At the base, the
mefHu,n sandstones with lignitewith gastropods and lamellibranchs.
tones are corail11 Pandanguo, limestones are detntal ards the north we - suggesting a more shallow watersandy with marl successions sugge
'^^ironment of deposition*
appears to es at Walu are
nai environment at Walulis time, the deposit1 limestones a
t pandanguo.been deeper than with BryozoaU , reous aC-tic, sparry, . It is importa^^onsition.
n implyingr t l y argili a c ~:ic, sparry, Pai- ■* . it is important to note
t 0f dep°sition'marine environment have any regionalthat Pate does
he above discussion eSSion of Pandanguo couldfniG-marlLcance. The limesto calcareous equivalent of
, the onshore lesidered to be che%1 limestones penetia
than Dodori which are in turn„ o r more sa * varies from reef- limestone, are inant faci^Thus the P1-' t aS shown in the[ Mararani. xnu § the west
to deltaicS the delta to>s in the east i m p U ® 3 th3
and Walu well5*•andanguo ana
n
the NE had ceased by the upper Miocene time
Atis
Da
. cnarrv limestones encountered at the topMararani, the sparry.. •__ The dolomitisation at the baseimplies deep water deposition.
o marine transgression during this uggests that there was a marin• ■ - ^ , - * 1 and fossiliferous nature of the entire rioa. The foraminnerai
the sea extended beyond the presentuPper Miocene show that
= n-hough it was shallower at MararaniMararani and Walu regions
-f calcareous mudstones. At Walas shown by t h e presence o f
oonn.otion i, rt— ■>/ -ar wauei a v .^.ni waS shallower than
Parry B
u, th<
clsence of
Kipini was shallower than Walu andiimpstones. A ^y Bryozoan i imes
as _ (xn a rine )covered by the sea
£^IQCENE-0UATERNARY
■ - chiefly composed or sands,, ,.v succession 1 = e Pliocene-Quaternary. , 1 limestones-
ndstones and d e t nargillaceous with sandyar8 sort/
_ . 4-ioa sandstones aes into detritalMararani, the sa This grades_ _r1 y sort- * mudstone bands at theays and are po°ri- aicareous
« i U i f . r . » a« ! « = “ “ * " ■ ' " " dthe li^3St°n,'S S'S. At Dodori / u*
ly. ^crse grained coral to c°ar”*di' . - “ *• -ini ha3-it Kip1* Tnc;succession * metras- nterbedded with
stones forming the top q£ ^ s t o n e si s comp°s'
successi0 ’1metres

unconsolidated sands. The sands are subrounded, iron stained,• „ j Th-° limestones at the top aremedium to coarse grained. ine
A . cnnrafiicallY at the surface between Tanatfetrital and are exposed sporadical yr. . . , ThiS was seen at Witu, Hindi andriver and Lamu island.M 1=_ the thick coral limestones do notMP e k e t o n i . Anywhere else, tn
occur at outcrop level.
. /, nodori are similar to that at Kipini sandstones at Pate an . ,
- argillaceous towards Mararam butbecomes more a 9 f
,rnolies that the sediments consistdspathic. this i from the basement areas furthererial eroded and transp This is shown by the
, ■> water marinemto shallow wateifeldspars.
^crease in the presence
The
undfeldmat
The f., t M ,„v » i » S * " and
ract that most ° from source area.„ance of transportfunded, implies long drs^a. . . ,h(
n c r>unded, implies long Mararani might have beenat Pate and ’
'he thin limestone bands ,onnsition from outside,leS of no a P
°tmad during lulls or cyo - geographical control,,-ani had tne
mPlying that Pate and Mar )n- sedimentation.
■r t nG RESUTiTS.SCUSSION__OF_WEL.---:iissxun — -----is composed of a thick
that the Lamu ba=i- ^ marine. Thelog data sho continent
nts varying "r hus forming wedgeof sediment the sea,•grease toward ,aS been noted by
s of beds inorea This has o
, (Fig- 4 -3 ) - sdimentary bed

Fig. 4.3 FENCE DIAGRAM FOR THE CORRELATION OF WELLS KIP INI .PATE,
DODORI, MARARANI AND WALU
WALU
MARARANI
VERTICAL SCALE

-1 2 2 -
Steckler and Watts (1978) and , Norton and Scatter(1976) to be
characteristic of passive margins.0*
, , ot-op become more marine towards the sea Sedimentary beds in the a_ a t-he beds exhibit both shallow water although on the mainland,, , ^ wof-er sediments. This suggests that
(lagoonal deltaics) and deepmarine transgression and regressions
the area was experiencing, • that throughout the period of
from time to time. This irT1P-qor periodical uplifts and downwarps.
deposition, the area was under P
Pnrpnei shallow water sediments _ to lower Eocene,Durmg the Cretaceou the embayment. This
_ the westernWere deposited along ^ shales indicating asandstonesconsists of quartzes deposition during lowerenvironment orc°ntinenta1 to deltai followed by mudstones in the
a i-nents werCetaceous. These sea ^ _ i ations in Kipini which ns intercdWalu regions and limest° ronment of deposition and may
the enviiU‘indicate a major change an ^ being on the shoreline
aression wlsuggest a minor trans noSited.
to be.f°r calcareous mudston
hprame shallow and much„ conditi°«s bee
T ceous times, tern part was liftedIn the upper Cre^ace the weSC
, Pspec;i-ai y the major phase ofOf the Lamu embayment esp ^ time,, eroded. A . structural trend might
above sea-level an rq^nquo-Kipf111 , hm-^andangn Qff the axis than-f fhe Walu - erocieuS u i t i n g a l o n g . knesses «e ' the
have occurred. Greater pitchrng. shown by
be south. This 1

% -123-
structure.
„ ,. , „j__ nf lower Eocene was lessSedimentation at the beginning or, walu Kipini trend and presumablyintercepted to the east of tne
„ mofprial from the trends wasreworked Cretaceous-lower Eoceneaivincr rise to the lower w«shed into the centre of the basin giving
The sediments during the lower EoceneCene deltaics in Pate.
. nriain as it is likely that Probably had a widely dispersed
• . . . and Mesozoic rocks were exposed duringecambrian Permo-Triassi .
1 u , limestone cycles reflect periodic°Wer Eocene. The shale _Whereas erosion of exposedreDuvenation and erosion mlan' offshore shallow waterCV , r-.i re onsnore,etaceous was taking P
Un>estones and shales were being deposi
, r.„rene time, the source areas inAt t-K f the middle ~°ceiche beginning or , idence occurred to thed a general sunsi
were uplifted a . . n n deposited in the basin.. ar sediments beingith the Tana rivoi non tectonic period.
uas follow®3 by aLift and subsidence ^ coVering of the entii
du]
iSt
was follows* ^ -.it and subsidence oVering of t h 3 entire o^horeluring this peri°d sandstones and mudstones ofwith massive continents^ this time, Walu was onshore,
• occurred. Pate, Dodori and: origin ^ - Kipin1', ^piine ariua. he shores 10 was on t
L were offs^°r. „ the start of middle occurred during the
-r-ansgressi°n sediments in the south,marine transy mar m e se
. of mOJ-e^ition OJ-/ith the depo^
- 1 2 4 -
This was followed by a minor regression during the mid middle Eocene. During the lower part of middle Eocene, widespread shelf marine limestones were deposited along the coast of Kenya. At Pate and to the north east (Mararani) the environment of Position became shallow from mid-middle Eocene upwards with sP°radic dolomitisation towards the top. In the upper part of *id<3le Eocene upwards, extensive rejuvenation of the source area ^ t have occurred. The sediments are related to a delta whose"lain m the north of Pate. The decline inln axis might have been to tnfu . m 4-n the Southwest during theths importance of the river system toth- r due to the rejuvenation of^ l e Eocene was probably partly due'alu'Pandanguo anticlinal trend at the time.
orbegan during the Oligocene,transgression oeqa
marine transg limestones being deposited onm g in Shallow water northeast (Pandanguo, Walu
H-,P west and noiental beds m , „ lower Miocene leading
. .,pnce continued dur 9Basin subsiden Qf marginal shelf
oression and depositionor marine transg walu.c as far north as Walu.es and mudstone
. .ni were probably related to Klpinl '• a 1 c0 noted * orcrin of the Lamustones, also western mar9in
. ,._n along z . n v< Miocenesedimentation ^ area periodi^.pot across anhydrites weret and were swept ites and anhy.fh variable that they have
mestones w1 j implyin^,nri and Mararani,d in Pate, Dodondeposition environm

- 1 2 5 -
Towards the
with coarse,
°f transport
end of upper Miocene, the limestones are interbedded poorly consolidated sands, implying a short-distance
and close proximity to land. This suggests a
9eneral regression Within the basin
the Tana river.
increased influence from
elastics were deposited, presumably During the Pliocene, coarse c
. _ r and drifted along the shorerelated to an ancestral Tana interbedded with reef coral^rom it The elastics are .
r„re towards the top implynlimestones which becomes• environment..shaliowj_ng of the depositio
.ng
Quaternary
Coritinental and
Gained sands at
is composed
partly marine.
the surface are
of elastics
The very
probably duna
which are partly well sorted, fine sands.
-1 2 6 -
5. GEOLOGICAL SYNTHESIS OF GEOPHYSICAL AND WELL LOG DATA
5*1 STRUCTURE
Cavity, seismic • and well data was used to prepare a structural
m^P of the area (Fig. 5.1). The structural map shows that the events leading to the occurrence of Lamu basin are complex and that there is a close relationship between faulting and folding. -*he western part 0f the study area appears to be the most
^sturbed and has major structures.
M i fvDe and increase in number withM°st of the faults are of normal type
, . _ ? 10). This might havea*Pth ( as discussed in subsection 3.10).
on the 0id faults (Alastair°ccurred as a result of movemen mioht, _ -Faults downthrow sea-wards might984). The fact that mos clear picturei faults although a clear picture
est that they are formations, . „ if deep seismic study was done,
only be acquired 1 1 a ^
; . j_h a uniform trend) m thefaults (withwell developed major e tQ regional-Faults4- fhat these fault-ern parts suggest tnau ^ fche entire embayment.
icts associated with the for ric faults that were_ d related to Ustri
{ could be deep seated an 1+. n 1 9 6 8).d subsidence (Shelton,fted during rifting an
, ,.h a seaward throw) are moreNE-SW faults along the coast of slumping or»ly compensation faults formed as a adjustraent along
due to thick sediment in thestal subsidence du . The f^nl
, clope (Shephard, 1973).buried basement s P

27-
R Z s U i°oo

-1 2 8 -
area has led to block-faulting associated with subsidence duringfLo , . , . . . m -3 -i r\r~ faults discussed and localisedthe basin s evolution. Major rauxc^
°nes form a nearea.
twork of closed structural highs and lows in the
o . , . . ,how an unconformity which runs acrossSeismic and well log data show an, . . Rndhei. Bradley (1984) notedthe ?\JMfrom Mkunumbi a*
st_rift, and underlying synrift and of the any passive margin is
area NNE from•tat the boundary between po Pre-rift sequences in the basincharacterised by a major unconformi y
. beds onto the unconformity f the post-rir^del for the onlap o Watts (1982). He
has been descrpassive margins ^ cf-rift beds onto the
onlap of the P:>sed a disconformable o* very well with theThis proposal agre
aformable surface,
ion in Lamu.baSin appear to be a devide
Lainuib-Eocene ‘ ^ of hlg>i« l°
th. >"b-formity brf. tb.t th. ° 1« ~
. This tilting and themtal inclinatl° rifting an
oroduced by subsidence (Jacksonbeds were P ifting an,or beds by subsidence to occur,iZ°ntal y ° U For the tiltmg a° fche subsidence and■cenzie 1983). along wa
a hing®11jst have been
were taking PlaCe‘

- 1 2 9 -
mi . . Tana synclinal axis to have been theThe writer expects the Tana y, . . M q og) who did some work on the longhingeline. Hutchinson et al 4.^ fhat the hinge zone is usuallyPlateform (New York) have noted that
ijCJ. , Kinrk near the hingeline within the characterised by an uplifte
Aaliarfle In the study area, thebasin and gradual subsidence s
into that model very well.Walu-Pandanguo-Kipini anticline
in the post-rift stage of basin e role of normal faults . ..
■ noctant conseqaence of sub.fa.ac, o th.avelopment is an xmpo comolex f• a„d subsidence leads to complex fl£t phase. The faulting blocks. m t e d fault blocks
’h syn ex fault
m y 014— Hlted fault blocks and with major t n
are• withrps associated hiock basement topography.
g n t —da y f a u l t --sponsible for the Pr^ t • n Lamu embayment were
, „ the basement highsese imply that the evolution.
of oasxi*rnied during the secon P
, hp attributed to salt could also
ickeninq of beds seawar too poor and tooa „ reflations
aPirism, but aeep interpretation.a thorough m t erpContinuous to all°w

5*2 BASIN (TROT.OCTCAL HISTORY
*he Lamu embayment is a sedimentary basin superimposed on theastern margin of the African platform. The gravity data suggest
lts. This fact together with well a very thick sequence of deposi. . . i__f. +-he basin might have come intod®ta direct to the suggestion that theK . Karroo sediments at the beginning ofb®ing at the same time wiuh Ka, . ^waiters and Linton, 1973).tbe upper Carboniferous times
, a result of downwarping ofTh* area of sedimentation formedAfr.can platform. It is very likely
thS SaStern mar9in ° ntinued from Carboniferous to the end ofthe downwarping con Dalaeogeographic aspect of
>p . The general priassic (Miller, 1952). Miller (1952), Caswell,th - - i s proposed bye sedimentary basin Williams, (1962). From(1956) andl953 and 1 956) Thompso t < the sedimentation was
per Triassic,UpPsr Carboniferous to uPp ive epeirogenic movement.
ntinuous negC°ntrolied by generally c _ ca-Malindi basin.T, . „ nresent Mombasa Mhls also included the pre
nNE-SSW trough which■3 in amnlated ^
Thn • nts accumu arain of the Africanhe Karroo sediments eastern marginri i- -i c now t n is present inS l o p e d along what is of this « r g m
oCtern Par * 4-he trough are nowOo"tinent. only the weste side of thev t-s of the thickens fromSnya, while sedimen ^ Karroo s <3to t)e found in MadagaS'- (Haughton/
Tanzau°astal Kenya to sou continental rift which
i n i t i o as 3basin «aS 101Mombasa

-1 31 -
, i i Kw fhp main deformation trend of the was tectonically controlled by tne maxi n jQ,,0innpd from late Carboniferous toPrecambrian rocks and developed
Jurassic.
, „ cnrrrrpsted to explain the mechanismA number of models have been suggestea- ..e 1982; Hutchinson, et. al. 1986;
of continental rifting (Watts,-,0 7 8). All models proposed can be
brunet, 1984 and Mackenzie,. . a simplified version of all of them.
combined into one that i,hp combined model that the process of
is suggested in ,follows the following stages.
c°ntinental rifting fo11
f the continental crust.f ) Convective doming ° crust leading toiil f the updomed part11) Erosion of tn
thinning. thermal equilibrium due tot returns to rn
'‘■fi) Cooling as the cr thinning.ds to mort;loss of heat. This lea extension leading to
iv) Differential l°adin5 ^ .fcle upper crust and necking in• the brrr
listric faulting 1 0 mantle._. crust anu
the ductile lowerelution of the Lamu
. ide the evoluti , to divideThis model has been use
ctageS:Sl bayment into three
i) Pre-rift stage
i;L) Rift stage ij-i) post rift stage

- 1 3 2 -
** • Pre-rift stag*
rx 3 -nnKnued during the CarboniferousDoming might have started and continuedf the aomed region continued. At
times. At these time, erosionj ^cciiblv early Permian, erosionthe end of the Carboniferous and possibly
£ ihp upper crust. With the following doming led to thinning of the
thinned crust formed a topographicr®turn to equilibrium, t e
4 „ \ j * r e deposited leading toi • i cpdiments were vlow in which glacial roupled with tensional forcesH-i-p-c , . I-* The loading^differential loading. f Gondwanaland l~d to listncAssociated with the br^-ak P
fAultiing.
•Syn-Rift Stag*. _ Triassic resulted in amid Permian t
Ihe listric faulting It _ which the Permo-Triassica arabens
humber of horsts and y CaSwell 0 956) haS n°ted that^diments were deposited. what is now the Margin of
• m times ale*subsidence in the Permian controlled by the NW-SE directedthe East African continent waS g nnE.SSW trending trough
11"-°d intension forces. This resul - directed by rivers. The„ systems wei
tnto which the drainag DurUma sandstone series-v~ i- ~ form thsr^sultant sediments
• n _rilDid subsidence occurred, more rapir part of Permia . ^coming coarse grainednring the upper Pa Qf beds D-
4.hs sequence Triassic withhis is shown by ‘-he --»* during
upp=- - Qt DW'<.h a sequsnce ths Triassic with.own by continued during
„ ,le subsidence with the break-up ofPWards. Gentl marine. ,• rr more Madagascar, the-diments becoming drift of
, the begins " 9Andwanaland and
L

- 1 3 3 -
Lamu embayment developed into a Passive margin basin. ‘ In the
, /lonnqited directly on newly formedoffshore, Jurassic beds were deposited* , 1QOO)oceanic crust (Rabinowitz, ot. a
3- Post rift stage (passive margin stage)
-np of Duruma sedimentationpredominantly continents! Karroo age
a n end after a itia] or pre-middle• • m(=> tO 311 chi'-*la the Lamu-Mombasa basin c •. -i with the Madagascar drift),(associataaassic faulting tilting that resulted in raarine
which triggered faulting and deposition of post rifti u -in This l2d c^oursion into the ba^ • D The faulting ism J h3les over Duruma group.arine limestones and s along the old existinglikely to have occurred > transgression in Lamuf ^dl- Jurassic/ ttaults. During the midd - _ horn of Africa, but the
+- nd than in'Was more limited in eXt . that marine depths wereni) indicatesf*UUa (from the Garissa wel ■ fchan in the horn area
4.he Lamu a .°°r‘sidarably greater in ^ zone of crusta tilting
(Arkell, 1 956). ThlS SU"ana * , • t h e Lamu area-aa faulting in tn-
likely to have been+-here 13■assiC transgression by closing
the marinS enclosed water massesThis isd t 0 .
anI 1KC J-Jtherer jurassi /
:ds the upper inSm a n uThis la0 enVironment that.
.his sort ot----- I t iS i n t h ,tz et. al. (1982,>t sea connections- Rabinowwrt ,
of salts noted.tion or
t thus stopping.-h the sea ctions witn
curred.

-1 34 -
fhe post rift (passive margin) sedimentation nppears to havs been
controlled by continental uplift movements in central Kenya.
•These were sporadic and separated by long periods of crustal
stability and erosion.
In 4-u -an uolift of more than 400 m wasin the upper Cretaceous, an u p x n t, Tr This uplift had a gentle gradientlr»itiated in central Kenya. m i s
a«er„slng ..s W .rfs until n,yo»a ” '5 ae5^*e• Ea“I taker, «t. ,1 . 1 9 7 2 ). « this tine, th. Hlplni-Mlu .nticlin.iA fnrmP(q and there was subsidence instructure is thought to have formedi , Qrnqion of the western part of theth* east. This led to much erosion
ess must have continued into the study area. The erosion proces. „„ Forene beds disconformably overly^wer Eocene because the middle Eocenethe r -
Kioini-Walu line, beds along the KiPm‘etaceou:
oSed Cretaceous and possibly lower Eocene - erosion of the expos water limestones andoffshore shaifo-aking place onshore, cretaceous uplift and
.. d The upper5s were being deposite . . period during whichnon tectonic f-dence were followed by a mudstones of graniticdstones snu* was deposition of the san ea (Walu and Pandanguo
f the stuoy■n in the western part o orevailed also during the
seem to have preI. This condition
. transgression began resu g
:he Oligocene a m a j o r m s being deposite
« ~ « m = l
- 1 3 5 -
continental beds in the Walu-Pandanguo area. At the beginning of
Miocene time, there was an uplift around mount Kenya (Searle,n 1 965 ). This was followed by a1 952 McCall, 1 958 and King, '»D=>'
, . onn m in central Kenya decreasing infurther uplift of about 30U mpast to 100 m in the south. The magnitude to 150 m in the east
■f flpxincr and subsidence (Pulfrey, coastal region was a zone of
^ .^onrP led to the continuation of the1960). The coastal subsidence, to deposition of marginal shelf
Oligocene transgression leading. 0 as far north as Walu.
limestones and mudston
Miocene succession, limestone-p -hhe upper w s the top Of tne
noorly conirbeaded
rests
top of the upper —F rly consolidated sands. .....
idded with coa ;thin the study area. The marinei r- pcir6 s s i onists a genera! to a major uplift of the
£0 jDe relatedission is likely he end of Miocene. An
• u occurred closein dome whicn , i Kenya was suggested by
f i 500 m in centrit of the order of /
:ey, (I960)*have continued into the
is likely °doming -1- n_,Mine to where it isend-Miocene the coasuxi-pssion oleading to • ^ b»™ “ “
resent. o»
f l e xing « ■ » “ b y ^hnlit the Qu of the Upper Tanaitervals throughout sediments
f the Plio-Pl®lst° uplift of tne
: basin.
areThis
- 1 3 6 -
6. PETROLEUM POTENTIAL OF THE BASIN
,rtn1> tvpe of basin or epicratonic The Lamu basin is an epicratonic typrhat embayments are the most embayment. Selley (1985) has noted that
for petroleum, much more than theProductive sedimentary basins
only do .they contain marineintra-cratonic basins. No. _ source potential but they occursediments and better petro
■ u.-nninq and less stable. Thuswhere the continental crust is .
_ hvdrocarbon generation. Crustal
instability also favours
Exoliferous embayments include the Tertiary
imples of proven petro Niger delta. Theser^ifed States ana o £ 4-he u m tfc!tulf coast basin or tJ f-ned basins. The Sirte embayment
are predominantly terrigeno embayment lies betweenfilled. Tne
of Libva is carconar- as carbonate filled.th i it is terrigenOUS atwo, namely i^
jj3.rnu embayment to similar• ^1 evolu^lon% relating the geologr^ one is inclined to suggest
•f thenarts OJ- ideal for petroleum^ s m s in other Pax- conditionsmeets the
that this embayment:
°ccurrence.
-------------------------------------large quantities in a trap,
. „a to occur necessarily in theX accumulates rock (notd to have a rrc and a caprock.
is need to reServoir rock
ty of the trap

-1 3 7 -
_ +-h<3 Cretaceous has sandstone unitsFrom the lithology logs,
n nd Kipini with a porosity of 15% which is encountered in Walu a
• As for caprock, the shales are wellgood enough for a reservoxr.
„ within the Cretaceous to provide a potentialdeveloped above an the intervening shales could
, cnurce potential orreserVoir b0d- .. . in both Walu and Kipini wellsc has been noted inbe good since ga norous limestones and fine
1 Q71) The sParry F(O'hollarain y 5-9%. This porosity is toohave porosities
grained sandstones the source potential of the- r-pservoii.low to be a good
, hales could be good, bituminous, dark s
The sandstones have
. transgressive, porous, sparry andThe lower Eocene is compo a very good reservoir
limestones °ffe^lcro-oolitic ^ 25
.th porositiesPossibility wltn ‘ In
f about 2 0%- form good caprocks.Porosities o- . shales. . ..ic limestones and gas was noted with!dense micritic „ moderat
irreSsion, the interbedded In this succ
development of s° ^ipini. j shaleS °
the limestones an rosities of 26-29%mocene t“ave pU' . .^nareous matrix.
low dueare -L
rock ind Pate.
t h e m i d d i - — _ t o argi Uaceous matrix
Sandstones duri 9
in. some areas
+--i l reservoir.the values — a potentialf
f o r m , o o d c a p t o c k s - . . «
throughout is p r ° b“ The iimest°neSand limited thic^ne
The
stones - n s t i t u - ^ ^ umestone interbeds
The middle Eocene ed
The shales and fl°e troieum s°ur■ ‘ p have a
. in shalestentiailoW organic content
and probably

source rock potential, though no sign ificant hyflrocarhonha vei n d i c a t i o n s o c c u r r e d in them. „n ond Oliqocene, sandstones occur withBetween the upper Eocene ana
ora ThP oliqocene and upper Eocene beds havePorosities of 2 4-2 6%. ^ne yThus, they cannot form goodno well developed caprock.
’ rnck is not well developed, reservoirs. The source tock
f limestones constitute good potential during Miocene, vuggYr reei
f 1 6 % at Dodori and Mararani. Atreservoirs with porosities
to 25%. The caprock may be formed Pate, the Porosxty 1I’cre^ might not be well developed
b* ^ fo„ grained°r continuous enoug bands may form good caprocks
s and dolomiteargillaceous limestone limestones are interspersed
At Kipini'not fracturea. ovide good caprocks. Rich
•ch should Prwith mudstone bands whi s indicate source rocko£ the limestonesorganic contents
Potential.high porosities (more than
r, ■. i dated sands have There is no caprock, sob°arse unconsoliM ,j-y.nd Quaternary28%) between Pliocene a tial reservoirs.
n 4- O t P they are not considere
,hp potential of sediments that tne. „.!<= show u and towards then,, analysls „ith depth a“u^he stratigraphic _reases W1 . ., . n
Lamu incr . This might imply
*• *" » “ ,h- ,0„«. —Alimentary u richer soursea where the sedi aettin9 3
• 1 i tv °f gtK . nOSSlbll1 Jhat there is a P

- 1 3 9 -
towards the sea at greater depth than where the present wells
have reached.
6 .2 STRUCTURAL EVIDENCE
rp, , TT 4-hat the area has a number ofThe structural map of Lamu show that, , „ DS Here trapping is expected tol9hs that could form good traps, h „ it-tna type related to tension andbe ^ anticlines of block faulting . W
c° a ip e n s a t io n f a u l t i n g .
nticlinal structures as traps is reduced byity of some a It is therefor*. the area.
'igh intensity of faulting 1 3..it- closure as i
gual
igh intensity of taUJ- closure as related to thesary to determine th structural high
. considering aiLural culmination. Witu, Kipini, Lamu,
wal u , Pandanguo,nations in t h e area, trap quaiity based o
. and Bodhei, theii» Pate, Mararam an _ follows:-
be classify0configuration,on
/ 9) Bodhei*Kipini,Walu Dodori and
1Q w i t u , ^ amU'Pandanguo ,. i +■ mi
Mararani.
Pandanguo,f uIt configuration
eS have a. and Walu structu £orming a closed
lodhei ana ,nfltion/ zOf cuimi"at network With all
5 the; ° r structure has - they are
BOd'*^ from the CSntr faUiting at Bodheibrewing away outlet. The o„ to the
,r-i thout un mi9raed but with £or oilhle condit1
ost favoura/

-1 40-
a . . , . - (ideal for a test well). Althoughanticline and accumulation ^ around Walu, the inferred faultsseismic work has not been done arouna »*a ,
~ . . , =)_ i t is an all round closed structurefrom gravity suggest that+-t p d hydrocarbons from the deep that is in a good position to trap nya
. Kitole-Jarakuda syncline across it Tana syncline to the west, Kitoie
. . the east of Walu-Pandanguoand the shallow syncline
Hnn it was shown that the highs structure. On the seismic section,
a northward shift with depth (age)along the coast ha . __ ^_
i i q drills BP-Shell were locatedincrease The existing weil
Miocene culminations (0 Hollarain 1971).
00 the basis ° f baSS . the culminations have movedAt lower horizons (Cretace ^ kilometres. Therefore
n°rthwards a distance ° relied upon.trolls cannot oe
N a t i v e results of these well
Pate and Dodori are in a very . -ni Lamu, Pate
rhe coastal wells K i p m ' offshore parts as a resulto i l from th e
9o°d position to receive , hore sediments.of • from the deep offs^ updip migration f
unconformity can also form a
t h . s t u d y « . . . “ * ’ “ b ' “ T 0«« ” ° h l S , l y
S ry good t r a p . S in c e t h ^
It!with th e lower Eocene
it can be combine _ fcy forms aimposed of shales, h that th e unco’ ales that overly sandstones sue
H .J°od stratigraphic t r a p -
-1 41 -
7. CONCLUSIONS AND_^ECOMJ^NDATlONS#•>
, seismic results show a number of highsThe combined gravity ah
. that could form good traps. Most of (basement and sedl"'6^ J blocks of anticlines. The deepthem are fault con walu.Bodhei(?) and Pandanguo.
f interest areseated structures o located based on seismic alone
•hhat have beenOther structures (along the coastline). The
• Lind p3-t*s 'are Kipini, Lamu, Dodor dotected on gravity implies thatfact that they have a0t basement. They have also
-iated with r*they may not be asso- culminations with depthnorthward snnbeen noted to have a shoW that part of the coastal
‘ty result(age) increase. Gra oceanic crust.
laid On aar
e) increase. GraV oceanic crust.^re laid on
assic sediments w, , =,n increase of sedimentsresults show an
ll l o g dai'3 , khe offshore. The wellismic and w®11 l ° 4 towards the„ i n e conditio rocks, reservoirs and
ickness and ma n a has sour ----that the ar mid-Tertiary along the
U " l l - “t l — « * “ —procks, espec trap3 i trapment from theThis make tn for oil
astline. Thl _ £aVOurablej Dodori'
mu, Pate ana _ ration'area a potential region
, v a Lamu atures maK 0 work should bestiuC . n Futnte
tratigraphy and eXplorati° • cuiminations ofr0ieum * of
detailed P®tr°or
, finition . hv BP-Shell mightr del11 .rtiled byproP® f wells d . .es 0f
entrated on ^ ^ ^
ctural highs £ W ® U Ssiting °r
t t r i b u t e d t o

-1 42-
culminations and basing the siting on shallow structures. This was evident in the wells at Lamu, Pate, Dodori and Mararani.
tfalu well was located based on gravity results alone. The aiu well was locaceu ya HeeD seismic data acquisition of the •resent study recommends a
3 rhp structure fully. At Bodhei, poorrea in order to define th
a no test well drilled. Bodhei anduality data had been used and no, aood opportunity for testing the deep
a lu areas offer a 9proper definition of the Bodhei
ediments in the area. m ed and maybe reprocessing of the oldtructure, new data is req
•-Vvf- be necessary, ata using modern techniques mx
arrP are likely not to be oil Qf Karoo agesyn-rift sequences _ lifting, heat flows are
fact that during riftr°ne due to the hydrocarbon generating
that if there W3S°tmally high. So u . expected to have occurred., -ration 15ediments, then over-mauu that this oil could have-_he possibxi i
he only hope is the into shallow traps to reduce. fhp Karroo , I, place, then theg r a t e d though the _ migration toot y
- . . _ If this Walu-Pandanguohsrmal destruction- -t is m tneto test from the deep Tana
°st favourable a rea f m igrat=„ibility nf this, the writertea (for the PosSl Because of
. structures. sediments,incline) and Bodhei ^ deep Kar
+■ to reachCommends wells reServes is
. having 9ood. sedimentS onshore. ThlsTnrassic Sfc" . he good o n *
°ssibility of the ^ but could^uced for the off^ore Par '

- 1 4 3 -
is due to the fact that these directly onto an oceanic crust.likely to be overmature seawards Possibility of migration to younger
sediments have been deposited This implies that they are but mature shorewards. The beds before overmaturation
G*ists.
f the study area are good. Withderail, the oil prospect pects. The quantity of„ v • f" Vi s Id 0 s t re Tertiary offering ontrolled by the source rocks
?etroleum in the area wil'hich have limited thicknesses.
-1 44 -
REFERENCES
Alastair, B., 1984. Structural evolution of the witch ground
graben. J. Genl Soc-London Vol 141 PP 621 -628.
Arkell, W.j., 1956. JurasOliver and Boyd. 806 p.
n-j neology for the World. Edinburgh,
B „ , and Williams, L.A.J., 1972. Geology ofBaker, B.H., Mohr, P.A. an, africa. Reol. Soc.___Am. Bull. Sec.
the eastern rift system °
Pub. No. 136. PP 67
_ and Mipen, 0., 1984. Development ofidley, M.E., Egerberg • ^fii_3672r«=ol Vol. 5 PP 3C-3672.^ basins. J ^ S t r u c t ^ , ^
5 pp. 1- T-w of the Aquitaine basin subsidence histo y
2t, M.F., 1 9 8 4 . S Mac.Vol. 121 No..n-nce curves. ----
^mined from subsi
546 .46. j.P. 1933. N p t e ^\ T p > r* t eu i 1 fH.G. and De (unpub-rept.) 10PP.
p ct ofJ<en^ "qy and oil_-£R^^~
s on the
y anu ---------the Mombasa Kwale area
The geolo^P-V.r 1953* 4_ Dp 42.
+- No. ^Surv. Ke_nxa- ReP
v • iifi-Mazeras areaof the_ Geology
P V 1956' -2R' p*v*' 34 pp 38,Rept. No'arv. Kenga Rep AConcis^Stud^
*.*•< i 573' p p ’5' " ’

-1 45-
Clack, d . , 1 944 . Plane and Geodetic Surveying 2j_ 3rd Ed.
Constable London. PP 283.
Clendinning, anc Oliver, J.G., 1969. Principles and use
of Surveying instruments. 3rd Ed. Blackie, London, pp 24-46
D. and Hautz, R.E.,. 1986. CrustalSomali basin,
Coffin, M.F., Rabinowitz, P
structure i n the WesternVol 8 6.No. 2. PP 346-371.
Roy Astr. Soc^ '°
Geophy. J.
indi, E.W., 1982.oast, Kenya. M.Sc. the
south
)rospectina.3rd
44
. „ to nonphysicalrin ,M. B, -.7..» „ HUB- PP
1957. Principles of,nd Rodgers,. "
bar, C.O., andSons. Inc. New York. PP 6-
ati graphs John Wlley
59.exploration under captain F.G.
A recent Malacol. Soc.ge, E., 1*92' Mount Kenya.
u Tana river to das up the
3 PP 513-533.ara v i r D e t r i ^ - - ^ m ^ ^
the KenyiL- - 'c R e p g r ^ ^ ^
1 955. —pprosco, 1
t ) pp.33publ rept. v *

- 1 4 6 -
Gignoux, M. 1955. stratigraphic Geology. Freeman and Company."3 R ■39-41 , 51-54.San francisco. PP 23-Jb, ^ '
Grant, F.S. and West G.F., 1965. Interpretation Theory in
Applied Geophys ics. MacCrew Hill. New York. pp 190-304.
_ M 1981. Facies Interpretation and Hallam, S. and Weller, '
Preeman and Company. San Francisco. pp Stratigraphic Recor—
45-96
1974. Gravity anomalies in_ n and Mathur, S - P"■ison, J.C. ar Geol. 3. pp 76-89.
Am. ---f of California,frica South
: or caiirui“i'-
. .araphic_Hi^^!-o£ Africa. q/- ofhton, S. H . / Edinburgh. PP 76_ 89*
Oliver and Boyd- :he Sahara. 0ilv
, res and prospects in British Eastl894 People P a
.ey, C.W., 18 q7 _i23.. IV PP 9/T VO I •-ca . G e o Q •
975 pptroleum Geology.
TiratSOO, England. PP 44'56-ion, G.D. and ^ ^ i f i e * .mtific press Ltd. _ , onic evolu
- 1986-
R w and En9 ' , w ^ rk-son , F . w- i , tef 03rni ’ island Piat
315 ' 'pp J i -1
Tectonic evolution of gonl. Soc.. AM.— Bui1.

-1 47-
Jackson, J. and Mackenzie, D. , 1 983. The geometrical evolution-- .7 , Struct. Geol. Vol. 5 pp 471 -482.of normal fault system. ---- ----
King, B.C., 1965.suits of the volcanic
J. Petrology.. v* 6 pp 67 100
Petrogenesis of the alkaline igneous rocks and intrusive centres of Eastern Uganda.
ci0<,s L.L., 1 963. Stratigraphy andv , . w c and si 'Krumbein, w.c. 4 1(14San Francisco. PP 4-104Sedimentation^ Fre'-'lTia
c„mfi remarks on the development of1978Mackenzie, D- c - iett Vol. 40 pp 25- 32.
E a r t h ^ B ^ - ^ ----sedimentary ba = r ' “
. al reconnaissance of the GalF q! 963.Geology* 1
harS°n ' (unpub.Rept)- PP 42a.GeoUSurvJiSfi^-
ole-Lamu
. .ko Gwasi area. Geol. Surv.OFfi Geology o fTT 19 58.all, G.J-H-r45. PP 5
/a. Rept.1984. An introduction
nd Barclay , w-R Bacon, «• a" and Trontman. PP 1-146,
lillin/ F*' graham. i .r-ptatiS^^smic_intS£B£§5-^'
8 8 .
1980- deserr -
' M ^ - * - ■ * * « . - • « r°ckS ,,„i. X- PP
, interpretation of , aeophysical
Structhb*1 y f Egypt. Annals of• - - e r t
off V o l * ' PP) u •

-1 4 8 -
Miller J M., 1952. The Geology of the Mariakani- Mackinnonroad area. fip.nl. Surv. Kenya^ Rept. No. pp 49
Mussman, W.J., 1986. Sedimentary and development of a passive■nar-rrin unconformity/ Verginia Apalachians. to convergent maryj-_ , Vol 97 PP 282-295 .Geol. Soc. AnuJBull^ Vol.
C» np]rre^ a1 Prospectinq for Qil-___Mcgraw1 -58.
Nettleton, L.L./ 1962 Hill, New York, London. PP
rQ.inav. Allen and Unwin. LondonNorth, P.K., 198..
a n d S y d n e y . P P 9 6 " 1 2 0 ' 24A n -z a model for the evolution
t g * i y •D •1 ter J.o./^°rton, I.D. and Sea fche Gondwanaland. J. Geophv.
o and break up °°f the Indian Ocean ana
A03-830• ,^ s earch. v. 84 pp
interpretation. . 1971* R mnanv (Unpub. rept. )Hollarain, M. , ,. oetroleum company
BP_SheU Pef .«,* For
0 “^iiaraiui^^^ipini area ^ ° r
Pp. 72
SediffiS?ettijohn, F.J.- 1 9 7
?P 718.
ntar:Harper, New York
RockjLi.
^Ifrey, W.P., 1 9 6 ° '
^£ V. Kenya., R ® p t . N°'
The
i area. Geol., of Marag0
9. PP 51 •

-1 4 9 -
n 1982 Salt diapirs _ N F and Falcey, D.1
Rabinowitz, P.O., Coffan, • northern Kenya and Southernbordering the continental margrn o
, 215. No . 4533. PP-Somali. Scie. Vol-
,n^ H n n a l qp.dimentarj singhr l'®*1 ill 125-366.
neck , H.E. and Si y Berlin- P P 45'_ verlag
ironment■ SpringT M 1986. Geophysical
a X • n • f. F.M. and MaC Kenya (Unpub. rept. )
s, C.V., Karan3a, UJ5c t i o r ^ i s J ^ ^S c e _ ^ o r _ a _ J u £ ^ l £ - £ £ y2 2
post JurassicH - f 1 9 6 5 'p and Baker, B‘ Reformation m
erson, E.P- , theirKenya an Js_ V. 121 •
_ide > 12 erosion
1965. PoStE P and Baker, B.H- t.on in relatr
Kenya ^ V. 121. PP 5aces in eastern - T . o n d o n s S ^ - ^
GeoT;_So£i— -Jtructuro. — id_Galana area.
of theGeol°P^
r „ L.D.. 195’- „ . « • » S°-Rept#
Surv. Kenyan orthwest of Kitaler the area
Geol°9y 19. PP 58‘.e, D.L., 195 Rept-
qury^JSSa^ship- G e o l ^ — — Geoloaii
don to pp 51-72.
Freeman and
, mantg—2£E l g — 7n-831985. , 65, 7U
, *»*• p" 6'8' » . « “ a“ 1 M
m l e P P 3 ” '*'3-p 1968- p e t r ^ a i —
n, p • ' a ssoc,—1 subsidence-

- 1 5 0 -
Shephard, F.P., 1973. Submarine Geology. 3rd Ed. Harper and
Reid. New York, San Fransisca, London, pp 481.
, M c ->nd Watts, A.B. , 1 978.Subsidence of the atlanticSteckler, M.5. ana ,, . margin of New york.EarthfPlan.Sc .Lett.No.41 pptype continental muj-yx
1-13.
S t o c k le y G.M. , 1928. Report on the geology of theGovernment of Zamnzibar. vol 4 pp 34-65
L’.J. and Khan, M.A., 1 977’in kenyjLi-j n e a s u r e m e n t ^ iS --------
Kenya:: A_ catalogue ofGeol. Dept. Leceister
ty PP 40'
P.E., 1 9 7 6'j Kent,D.H. and voi. 225. oc; Nature vox.
, •i1 lives. — t y s t i i u
Thepp 1 39-1 4 4 .
madagasgcar
. R e and Keys, D.A., 1 983.p , Sheriff/ K *>1., Geldart, • University Press‘ PPi-103,
. _ cambricDhvysics .
-81 3.o£ the Malindi area.
f 1 9 56. G e o l ° g /
Geol. Surv,
36- »» 63'O. . nf tropical A „ironro3nt 01
, f , r V enV1 „ P J . ROY.qediment . ,-ra Leone, — -----973- b e Sierr
penensu313'e toWn , 52-
AfricanGeol,
town 524. vol-,, No-lands.

-1 5 1 -
Walters, R. an<3
coastal Kenya. LP
Linton, R -E •' 1973* The sedimentary basin of
Watts, A.B.
changes at
1982. Tectonic
sea level. Nature
subsidence, flexure
vol. 267 pp 469-474.
and global
Weller, J .M- 1 960.i principles and Practice^
Harper and Brotht-rs^ New York. PP 235-290
Williams, L.A.J-/ north of Malindi-
the Hadu-Fundi Isa area, Rept. No. 52. pp 62.
STATION
GRAVITY

-153-
CO —) o CR. REF
E (KM)
SM 01 651.4
SM 02 657.5 ,SM 03 661.8SM 04 664.0SM 05 665.8
SM 06 670.5
SM 07 678.1
SM 08 676.1
SM 09 677.6
SM 10 678.4
SM 11 680.0
SM 12 671.6
SM 13 660.1
SM 14 659.5
SM 15 661.4
SM 16 663.4
SM 17 6 6 6 . 2
SM 18 669.1
SM 19 669.9
SM 20 685.6
SM 21 688.5
SM 22 628.0
SM 24 636.9
CR. REF N (KM)
975.0
975.4975.7975.9976.0976.3976.9976.5976.2976.0975.8 975.7974.6
974.1973.4
972.9
972.6
972.5
972.3
974.0
973.7
973.3
973.0
LONGITUDE LATITUDE
40.3607 -2.2652
40.4167 -2.2275
40.4583 -2.1942
40.4753 -2.1S55
40.4942 -2.1722
40.5332 -2.1417
40.5988 -2.0917
40.5853 -2.145S
40.5957 -2.1583
40.6035 -2.2835
40.6201 -2.1917
40.5445 -2.1917
40.4416 -2.3071
40.4367 -2.3399
40.4533 -2.4567
40,4699 -2.4583
40.4967 -2.4799
40.5225 -2.4918
40.5268 -2.4986
40.6688 -2.3524
40.6950 -2.3903
4 0 .1593 -1.7125
•10.227'! -1.7154
HEIGHT(M)
GOmgals
20.4 978028.623.3 978030.726.4 978033.627.5 978037.828.9 978041.228.5 978040.924.3 978036.223,1 978042.221.4 978045.819.8 978051.217.64 978033.9
22.9 978046.5
20 .11 978039.45
17.6 978041.4
8.7 978053.0
9.0 978054.1
6.4 978056.4
13.0 978060.65
10.3 978062.9
19.1 978071.5
15.0 978072.4
68.4 978051.1
72.8 978051.0
ANOMALY SBA(P=2.5) mgals/?
-17.6-16.2-14.0- 10.1
-07.0-07.0- 10.0
- 4.005.09.0 9-7.0- 4.59.0
10.0
12.915.018.0 25.0 27.5 -6.6 -7.7
,11

-15/.-
ST. NO. CR. REF. E (KM)
CR. REF N (KM)
longitude
SM 25 •647.0' 972.7 40.3171
SM 25. 649.9 975.6 40.4256
SM 26 647.2 975.9 40.3250
SM 27 645.8 976.2 40.3126
SM 28 650.0 - 976.5 40.352940.3878
SM 29 654.2 976.940.4100
SM 30 659.9 977.140.4591
SM 31 660.0 977.540.1643
SM 32 629.2 972.240.1892
SM 33 632.2 972.740.8720
SM 34 710.0 974.741.0587
SM 35 728.0 9 8 0.341.1542
SM 36 739.6 980.641.2133
SM 37 746.8 980.841.3085
SM 38 757.1 981.141.4166
SM 39 768.1 980.940.751°
SM 40 695.0 977.140.7102
SM 41 690.6 977.140.8724
SM 42 707.4 976.040.9l°5
$M 43 712.3 976.340.7399
SM 44 693.1 978.540.71° 2
SM 45 690.4 978.5
latitude height go(M) mgals
-1.6878 78.5 978048.8
-1.6084 6 8 .8 978056.4
-1.1750 2 2 .0 978023.1
-2.1583 23.4 978022.4
-2.1302 40.0 978029.1
-2.0894 48.6 978026.6
-2.0585 51.2 97S037.5
-2.0410 55.0 978058.5
-2.5167 10 .2 977998.7
-2.4667 15.4 9',S005.7
-2.2980 55 977996.4
-2.7816 31.2 978049.7
2 1 .6
17.0
97S058.8-2.7541978063.7-2.7587
-2.7013 13.5 97S075.9
-2.7192 18.4 978081.7
15.2 97S049.2-2.0770
97$04 3.9-2.0768 18 .6
_2.17079.2 Q"S067.1
-2 .1499 7.8 97S063.2978030.0
-1.9582 6.9
7.1978027.0
-1.9430
ANOMALYSBA(P=2.5)ir.gal s/ 0
- 11.8
- 20.8
-23.0-24.0-22.5-20.5-17.1-16.9-46.3-40.555.0-4.0S. 514.624.452.55.9-4.025.021.7
- 10.0
-13.0

-1--------
-155-
ST. NO.
SM 46
SM 47 SM 48 SM 49
SM SO SM 51 SM 52
SM S3
SM 54
SM 55
S!v1 56 SM 57
SN* 58 Sm S9
SM 60
SM 61
S't 62
SM 63
$M 64 SM 65
! SM 66
SM 67
SM 68
CR REF. CR. REF. LONGITUDE LATITUDE HEIGHT GO(M) mga
E (KM) N (KM)
ANOMALY SBA(P=2.5) mgals/9
685. 8 978. 8
683. 8 979. 1
680.0 979, 2
676. 6 979.4
673.3 979.7
669.7 979.5
664.4 979. 2
662. 2 979.5
660.0 979.7
657.,2 980. 1
655. 0 980. 2
652.,5 980.,6
649.,3 980.,7
645,.0980.,9-
645 .7 9 8 0,.5
647 .7 980 .1
645 .5 979.9
643 .6979.7
641 .5 979 .4
640 .0979 .2
638 .8979 .1
637 .4 978.9
636 . 097S.7
40.6720 -1.9204
40.6504 -1.9100
40.6178 -1.8834
40.5867 -1,8104
40.5554 -1.8401
40.5250 -1.8570
40.4832 -1.S854
40.4583 _1.8585
40.4418 -1.8334
40.4167 -1.8012
40.5917 -1.7831
.u o v—> O -1.7583
40.3420 -1.7420
40.3002 -1.7250
40.3130 -1.7666
40.3209 -1 .8002
40.3112 .1.8199
40.2906 .1.8614
40.2704 _i.8657
40.2583 -1.8832
40.2475 -1 .9 0 0 0
40.2333 _i,9085
40.2249-1.9583
26.2 978028.9
18.1 978026.3
43.4 978030.9
40.1 978026.5
36.4 978024.4
32.6 978019.5
61.7 97S032.1
61.2 978050.0
61.5 978055.5
64.9 978040.9
6 8 .8 978043.8
76.6 978047.9
76.4 978050.9
76.5 978053.2
84.1 978055.5
73.4 97S051.4
76.5 978051.7
6 8 .8978048.6
53.5 978041.4
61.2 978042.9
53.5 978038.1
48.9 978029.7
45.9 978026.1
-16.9 -16.9 - 20.0
-22.9 -24 .0 -28.1 -24.4 -26.5 -23.2 -16.1 -14.4 -12.5 -9.4 -7.0 -7.5 -8.5 -9.0
- - 10.0
-12.5 -14.4 -16.0 -23.0 -26.0
\
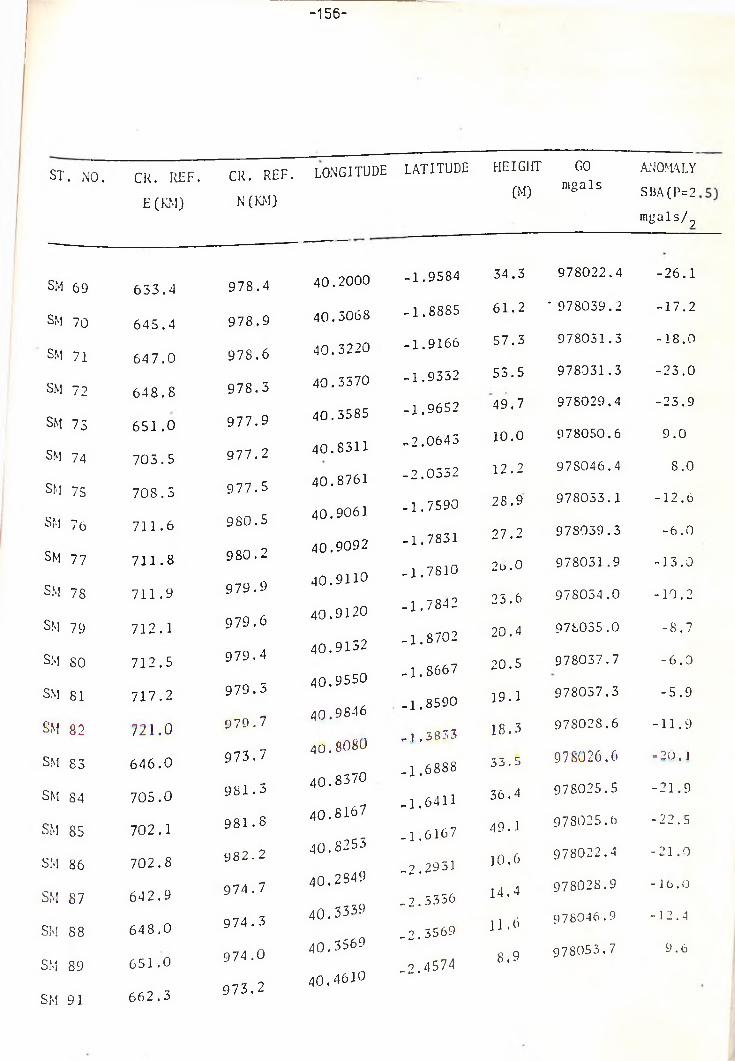
-156-
ST. NO. CR. REF.E (KM)
CR. REF. N (KM)
LONGITUDE LATITUDE HEIGHT GO(M) mgals
ANOMALYSBA(P=2m^aIs/9
SM 69 653.4 978.4 40.2000
SM 70 645.4 978.9 40.3068
SM 71 647.0 978.6 40.3220
SM 72 648.8 978.3 40.3570
SM 75 651 .0 977.9 40.5585
SM 74 705.5 977.2 40.8311
SM 75 708.5 977.5 40.8761
SM 76 711.6 980.5 40.9061
SM 77 711.8 980.2 40.909240.9110
SM 78 711.9 979.940.9120
SM 79 712.1 979.6
SM SO 712.5 979.4 40.913240.9550
SM 81 717.2 979.540.9846
SM 82 721.0 979.74 0 .8 0 8 0
SM 83 646.0 973.740.8370
SM 84 705.0 981.540.8167
SM 85 702.1 981. S40.8253
SM 86 702.8 982.240.2349
SM 87 642.9 974.740.3339
SM 88 648.0 974.34 0.3569
SM 89 651.0 974.04 0.4610
SM 91 662.3 973.2
-1.9584 34.3 978022.4 -26.1
-1.8885 61.2 * 978039.2 -17.2
-1.9166 57.3 978051.3 -18.0
-1.9352 53.5 978031.3 -23.0
-1.9652 49.7 978029.4 -25.9
-2.0645 10 .0 978050.6 9.0
-2.0332 12 .2 978046.4 8 .0
-1.7590 28.9 978053.1 -12 .6
-1.7831 27.2 978039.3 -6 . 0
-1.7810 26.0 97S051.9 -13.0
-1.7842 25.6 978034.0 -10 .2
-1.8702 20.4 978055.0 -8.7
-1.8667 20.5 978037.7 -6 . 0
-1.8590 19.1 978057.3 -5.9
- J , 3 8 3 3 18.3 97S02S.6 -11.9
-1 .6 8 8 8 33.5 978026.6 -20,1
-1.6411 36.4 978025.5 -21.9
-1.6167 49.1 978025.6 -22.5
-2.2951 10 .6978022.4 -2 1 .0
-2.5336 14.4 978028.9 -16 .0
-2.3569 11 .6978046.9 -12.4
-2.4574 8,9 978053,7 9.6

ST. MO. CR. REF.
E (KM)
GOmgals
ANOMALYSBA(P=2.i
SM 92 616.0
SM 93 619.5
SM 94 618.4
SM 95 624.5
SM 96 683.2
SM 97 692.8
SM 9S 689.5
SM 99 691.7
SM 46B 6 8 8 . 0
SM 84B 703.5
SM 83B 705.3
SM 82B 724.9
SM IB 654.6
SM 2B 659.5
SM 5B 667.5
SM 6B 672.5
SM 12B 665.5
SM 20B 687.0
SM 2 IB 6 8 6 . 2
SM 27B 647.2
SM SOB 659.5
SM 32B 630.6
CR. REF. LONGITUDE LATITUDE
N (KM)
980.0 40.0428 -2.8138
979.1 40.9524 -2.8958
976.3 40.6465 -2.1375
972.2 40.1197 -2.5208
980.5 40.6497 -1.7708
979.0 40.7341 -1.8792
979.5 40.7049 -1.8792
979.6 40.7240 -1.8549
978.7 40.6911 -1.9317
981.6 40.2685 -1.6495
981.0 40.8430 -1.7305
979.9 40.1165 -2.3203
975.2 40.3870 -2.2460
975.4 40.4372 -2 . 2 1 1 0
976.2 40.5135 -2.1565
976.5 40.5540 -2.1075
975.5 40.4940 -2.2494
973.8 40.6820 -2.3714
973.5
976.5
40.426540.3327
40.4241
40.1766
-2.5516
-2.1443 -2.0496
977.4
972.5-2.4916
HEIGHTCM)
mgals/0
43.9 978033.1 -24.835.2 978029.3 -26.631.4 978012.5 -36.217.5 977998.9 -48.538.4 978007.5 -2 1 .0
23.4 978017.6 -14.62 0 .1 978016.0 - 1 o . 424.1 978015.4 -16.516.5 97S027.9 -14.935.1 97S026.0 -21 .029.8 978020.1 -18.025.1 978043.5 -4.52 1 .0 978029.8 -16.S24.8 978032.3 -15.028.5 978046.9 -7.026.4 978059.0 -9.824.4 978036.2 - 1.0
16.0 97S071.7o 26.4
40.2 978061.4 -2 0 .2
27.0 978025.4 -23.6
53.0 978037.S - 1 6 . <•>
12 .6978002.2 -45.9

-158-
CR. REF. CR. REF. LONGITUDE E (KM) N (KM)
KF 49 636.3 988.8 40.2252
KF 52 650.0 988.5 40.6685
KF 55 650.3 988.2 40.1712
KF 60 631.3 987.9 40.1802
KJ 5 693.9 979.8 40.7432
KJ 10 697.6 980.1 40.7766
KJ 15 700.1 980.1 40.7991
KJ 20 705.1 980.4 40.8257
KJ 25 705.7 980.7 40.8491
KJ 50 709.2 980.7 40.8806
KJ 55 712.8 980.8 40.9151
KJ 40 716.0 980.9 40.9414
40.9739KJ 45 719.6 980.9
40.1072KZ 1 625.1 978.0
40.1306KZ 5 625.7 978.1
40.0072A 295 612.0 981*3
40.0203A 298 613.5 980.7
40.0315A 501 614.7 980.i
40.0541A 504 617.2
979.840.0703
A 507 619-°979.4
4 0 .0 8 0 2
A 310 620.19 7 8 . 8
40.0901A 315 6 2 1 . 2
978.4
LATITUDE h e i g h t GO ANOMALY(M) mgals SBA(P=2.5)
• mgals/9
-1.0111 96.6 . 977994.9 -19.5
-1.0417 105.9 977994.0 -19.0
-1.0539 100.2 977995.5 -20.5
-1.0944 95.5 977993.4 -21.5
-1.8389 28.7 978014.7 -16.8
-1.8306 27.4 978014.7 -16.9
-1.8111 24.2 978015.4 -16.7
-1.7972 25.7 97S015.7 -16.1
-1.7722 26.2 978015.5 -16.1
-1.7556 33,5 97S014.1 -16.0
-1.75 52.9 978015.5 -14.7
-1.7361 32.3 978017.1 -13.1
-1.7250 30.6 978019.1 -11.5
-1.9861 29.5 978004.1 -28.1
-1.4806 26.4 978008.0 -24.8
-1.7139 55.5 978001.2 -24.4
-1.7556 50.7 97S002.2 -24.6
_1.7944 46.5 978002.3 -25.4
41.5 97S002.4 -24.5-1.8533
57.1 978004.2 -25. S-1.8750
978003.5 -27.354.1-1.91^7
-1.9583 50.1 978003.7 -28.2

- 159-
ST. NO. CR. REF.E (KM)
A 292 610.4
M 15 610.1
M 20 608.4
M 25 605.1
KA 225 677.4
KA 260 6S0 . 2
KA 265 6S2.4
KA 270 684.6
KA 275 605.9
KA 230 687.9
KA 285 691.4
KA 290 694.4
KA 295 695.6
KA 300 697.4
KA 305 699.2
KA 310 698.4
KD 245 641.8
KD 250 638,. 2
KD 255 634.8
kd 260 630.7
kd 265 626.8
kd 270 623.8
CR. REF. LONGITUDE LATITUDE N (KM)
981.5 39975.4 39975.8 39976.0 39981.1 40,980.9 40.930.6 40.
980.3 40.
980.1 40.
979.7 40.
979.3 40.
978.S 40.
973.5 40.
978.4 40.
978.1 40.
977.9 40.
981.2 40.
981-1 40.
981 • 1 40.
981.1 40.
931.2 40.
981.2 40.
.9923 -1.6722
.9901 -2.2194
.9748 -2.1944
.9450 -2.1833, 5946 -1.70566203 -1.72786396 -1.75566599 -1.78616712 -1.8167
6S92 -1.8472
7207 -1.8667
7477 -1.8917
7581 -1.9278
7748 -1.9500
7905 -1.9694
7838 -2 .0 0 0
2748 -1.7058
2423 -1.7139
2117 -1.7167
1748 -1.7139
1396 -1.7111
1126-1.7000
HEIGHTCM)
GOTngais
ANOMALY SBA(P-2 mgals/,
60.5 977999:7 -2 1.6
51.9 977994.4 -54.954.8 977994.1 -34.460.2 977993.7 -55.756.8 9730006.1 -24. 140.2 97S005.4 -25.238.3 978006.8 -22.538.6 97800S.4 -2 0. S35.3 978010.9 -19.119.3 973016.5 -16.929.3 978015.7 -15.917.7 973019.3 -14.11.7 97S026.3 -1 1 .0
3.9 978028.1 -S .915.3 97802S.0 -6 . 8
14.5 978031.5 -3.879.6 978013.9 -6 .S70.6 97S015.2 -7.473.4 97S014.4 -7.569.2 978017.7 -5.1
66 .8 978014.9 -8.3
43.2978018.8 -9. 1

ST. NO. CR. REF. fc t»I)
CR. REF. N (KM)
longitude
A 516 622.9 977.9 40.1050
KJ 50 723.3 980.9 41,0068
KJ 55 725.4 980.6 41.0351
KJ 60 728.8 980.3 41.0563
KJ 65 730.7 980.3 41.0734
KJ 75 757.5 980.6 41.1351
KJ SO 741.1 980.6 41.1676 41.1959
KJ S5 744.5 980.841.2297
KJ 90 748.3 980.9Q80.9 41.2559
KJ 95 751.0981.1 4l.2860
KJ 100 754.0
758.1 981.0 41.3198KJ 105
9S1.041.3359
KJ 110 759.9981.1
41.3671KJ115 763.4
980.9 41.3985KJ 120 766.9
980-941.4302
K J12 5 770.49 80.7
41.4617KJ 1 30 773.9
980.7 41.4932KJ135 779
977.94 0,1050
A 316 622.9977.5
40.0824
A 319 629.4977.1
40.0658
A 322
A 325
613
6 1 8 . 1
976.64O.O6I7
latitude HEIGHT(M)
TOmgals
ANOMALY SBA(9=2. mgals/ 2
-2. 0000 29.0 978003.0 -29.4
-1.7506 28.8 978022.2 -8 . 6
-1.7417 32.6 978024.2 -5.9
-1.7694 28.4 97S028.5 -2.7
-1.7806 2 1 . 6 978055.0 5.0
-1.7556 2 2 .5 978039.0 6 . 8
-1.7556 2 0 . 2 978042.5 9.8
-1.7472 17.6 978046.2 13.0
-1.7561 16.7 978049,9 16.7
-1.7250 14.9 978052.2 18.6
-1.7111 15.4 978053.4 2 0 . 0
-1,7000 11.9 978055.8 21 .S
-1.7194 16.2 978059.5 2b. 1
-1 .70S5 21.4 978060.5 23.5
-1.7139 19.5 978064.5 31.7
-1.7259 17.9 978066.5 33.6
13.4 978069.0 35.2- 1 .1
-1.7417 4.5 97S072.5 36.7
.2. 0000 29.9 9780 K). 3 29.4
30.8 } 7 7*)i)L>. 0 -33,2.2 .
VO 32-7 977997. 1 -55.0
_2 ,1 }67 32.2 977996.4 3b. ]

ST. NO. CR. REF.E (KM)
L 35 644.9
L 40 647.0
L 45 649.0
L 50 652.3
L 55 655.3
L 60 659.3
L 65 662.8
L 70 666.5
L 75 670.3
L 80 673.2
L 85 676.3
L 90 680.6
L 95 683.9
L100 687.6
L105 637.8
LI 10 688.1
LI 15 688.9
LI 20 690.5
L125 693.4
L130 697.1
L135 700.5
LI 40 703.9
L 145 705.2
CR. REF. LONGITUDE
N (KM)
974.7 40.3032
974.5 4 0 . 3 2 2 1
9 74.2 40.3455
973.9 40.3694
973.7 40.4009
973.6 40.4324
973.7 40.4640
973.7 40.4977
973.7 40.5315
973.9 40.5572
974.1 40.5901
974.2 40.6239
974.3 40.6541
974.5 40.6369
974.7 40.6892
974.9 40.6914
975.6 40.6982
975.6 40.7140
975.6 40.7387
975.8 40.7725
975.940.8036
975.740.3333
975.440.84.55
LATITUDE HEIGHT
(M)
-2.2944 9.7
-2.3222 16.0-2.5444 13.4
-2.3694 9.6
-2.3S53 11.0
"2.3861 15.1-2.3S06 13.6
-2.3861 18.0-2.3806 18.6
-2.3611 14.9
-2.3472 12.9
-2.3361 18.9
-2.3275 15.0
-2.3139 7.2
-2.2972 3,8
-2.2611 6.0
-2.2278 6.9
.2.2083 7,8
-2.2056 8.3
-2.0000 11.4
-2.1833 11.6
-2.2028 11.4
-2.2333 4.5
GO ANOMALY
mgals SLA(9=2.5)i,
»igals/2 •
97S020.3 -17.8978020.0 -17.297S023.0 -14.897S028.4 10.5978034.0 -4.5978041.6 3.9978047.4 9.4978051.9 17.7978054.7 17.797S056.7 19.1
978059.5 "21.6978060.4 23.697S062.1 24. S973065.0 26.2978064.1 24.7978061.0 22.497S058.3 20.1978056.7 18.897S057.6 19.8978059.0 21.9978059.8 24.1
978064.0 26.8
978070.4 31.7
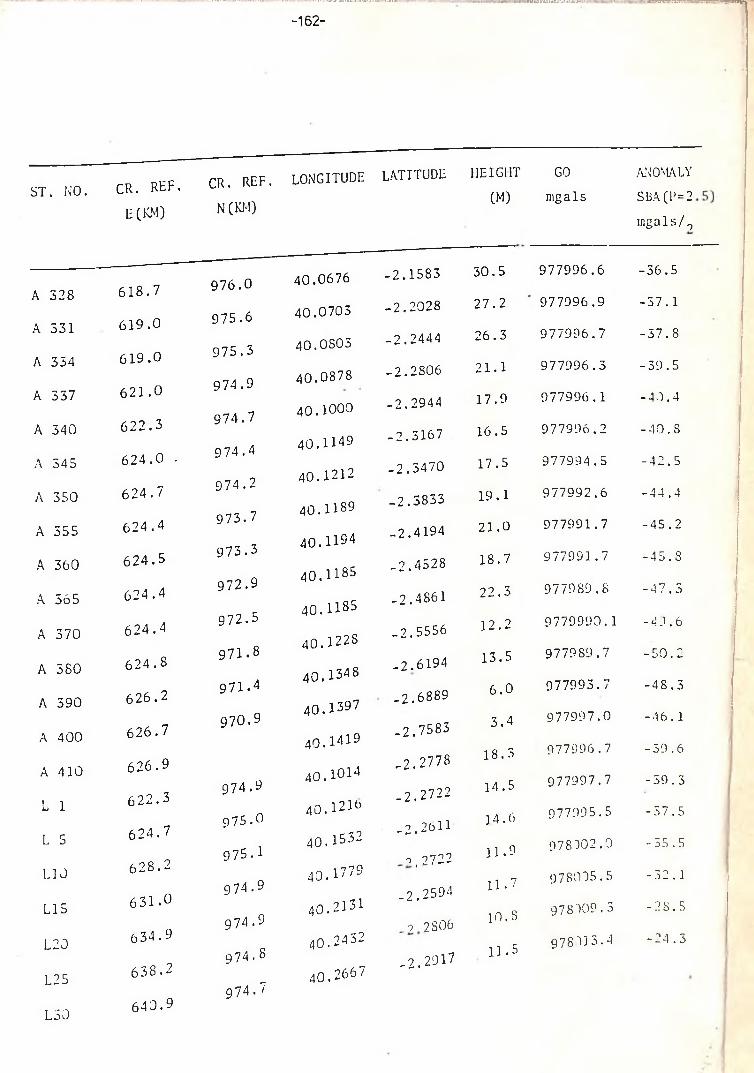
/ytf 3 M *e r . - ;TSIF..‘ . ;s • t. T i l W l . ■ --T ’ ... .,.j|gS• - • — *»• — —— .** iu . -4 i. . i . 'iu i . 'u v «a iu w ;k u w iu »-4«n . r - w -
-162-
ST. NO. CR. REF- E (KM)
CR. REF. N (KM)
LONGITUDE
A 528 618.7 976.0 40.0676
A 531 619.0 975.6 40.0703
A 354 619.0 975.3 40.0803
A 337 621.0 974.9 40.0878
A 340 622.3 974.7 40.1000
A 345 624.0 - 974.4 40.1149
A 350 624.7 974.2 40.121240.1189
A 555 624.4 973.740.1194
A 360 624.5 973.3
972.9 40.1188A 565 624.4
972.5 40.1185A 370 624.4
971.8 40.1228A 580 624.8
971.4 40.1348A 390 626.2
970.9 40.I397
A 400 626.7 40.1419A 410 626.9
974.9 40.1014L 1 622.3
975.0 4 0 .1 2 1 6
L 5 624.7975.1 40.I532
LI 0 6 2 8 . 2
974.9 40.1779
LI 5 631.°974.9
40.2131
L20 634.99 7 4 . 8
40.2432
L25
L50
638.2
640.9 974.74 0 .2 6 6 2
LATITUDE HEIGHT GO ANOMALYCM) mgals SBA(E=2
mgals/ 7
-2.1583 30.5 977996.6 -56.5
-2.2028 27.2 977996.9 -57.1
-2.2444 26.3 977996.7 -57.8
-2.2806 2 1 .1 977996.5 -39.5
-2.2944 17.9 977996.1 -49.4
-2.3167 16.5 977996.2 -40.8
-2.3470 17.5 977994.5 -42.5
-2.5833 19.1 977992.6 -44.4
-2.4194 2 1 .0 977991.7 -45.2
-2.4528 18.7 977991.7 -45.S
_2.4861 22.5 977989.8 -47.5
-2.5556 12 .2 9779990.1 -4-1.6
.2.6194 13.5 977989.7 -50.2
-2.6889 6 . 0 977995.7 -48.3
-2.7583 5.4 977997.0 -46.1
-2.2778 18.3 977996.7 -39.6
-2.2722 14.5 977997.7 -59.3
-2.261114.6 977995.5 -57.5
0 ,2722 11.9 978102.0 -55.5
_ 2 .2594 11.7 978095.5 -52.1
_9 2S06 1 0. s 978109.3 -28.5
-2,2917 11.5 978113.4 -24.3
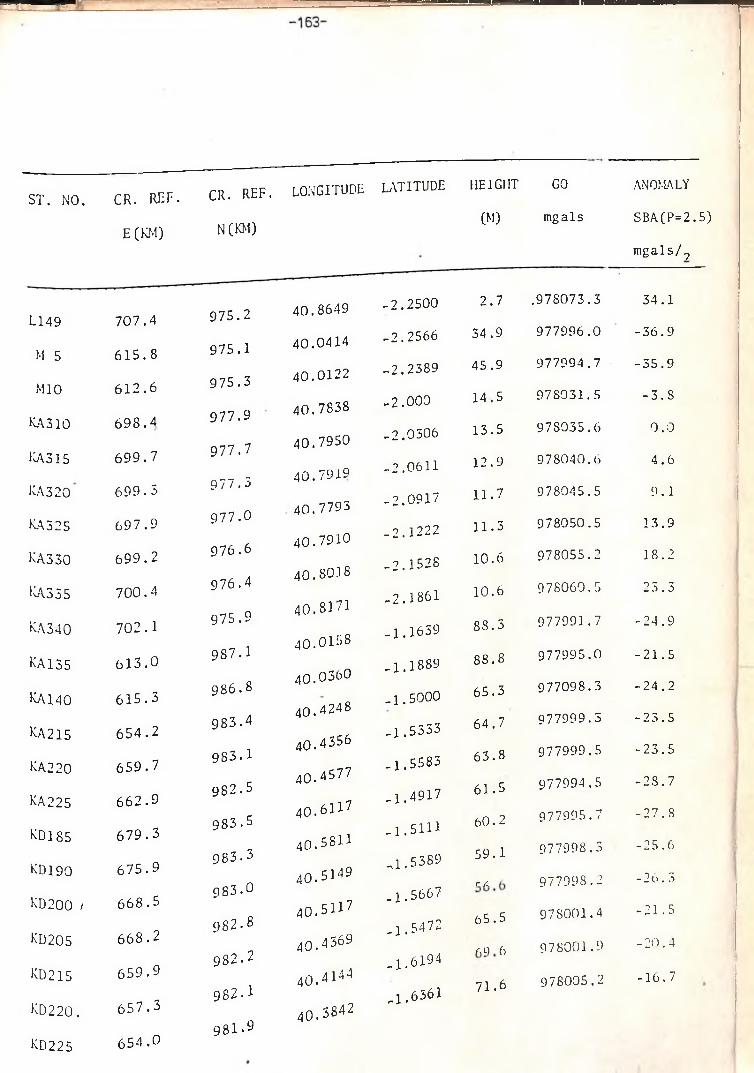
CR. REF. GO ANOMALYST. NO. CR. REF.
E (KM) N (KM)
longitude latitude height
(M) mg a Is SBA(P=2.5)
mgals/?
L149 707.4
M 5 615.8
MIO 612.6
KA310 698.4
KA315 699.7
KA320 699.3
KA325 697.9
KA330 699.2
KA335 700.4
KA340 702.1
KA135 613.0
KA140 615.3
KA215 654.2
KA220 659.7
KA225 662.9
KD185 679.3
KD190 675.9
KD200 / 668.5
KD205 668.2
KD215 659.9
KD220. 657.3
KD225 654.0
975.2
975.1
975.3
977.9
977.7
977.3
977.0
976.6
976.4
975.9
987.1
986.8983.4
983.1
982.5
983.5
983.3
983.0
9 82.8
982.2
982.1
981.9
40.8649
40.0414
40.0122
40.7838
40.7950
40.7919
40.7793
40.7910
40.8018
40.8171
40.0158
40.0360
40.4248
40.4356
40.4577
40.6U7
40.5811
40.5149
40.5H7 40.4369
40.4 l44
40.3842
-2.2500 2.7 .978073.3 34.1
-2.2566 34.9 977996.0 -36.9
-2.2389 45.9 977994.7 -55.9
-2.000 14.5 978031.5 -3.S
-2.0506 13.5 978035.6 0.0
-2.0611 12.9 978040.6 4.6
-2.0917 11.7 978045.5 9.1
-2.1222 11.5 978050.5 13.9
-2.1528 10.6 978055.2 18.2
-2.1861 10.6 978060.5 25.3
-1.1659 88.3 977991.7 -24.9
-1.1889 88.8 977995.0 -21.5
-1.5000 65.3 977098.3 -24.2
-1.5533 64.7 977999.5 -23.5
-1.5583 63.8 977999.5 -23.5
-1.4917 61.5 977994.5 -2S.7
-1.5111 60.2 977995.7 -27.8
-1.5389 59.1 977998.3 -25.6
r A 977998.2 -26.3-1.5667-1.5472 65.5 978001.4 -21.5
aq 6 978001.9 -20.4-1.619
71 6 978005.2 -16.7-1.6361 / x •

ST. NO CR. REF. CR. REF. LONGITUDE
E (KM) N (KM)
KD230 651.3 981.5 40.3604
KD235 648.2 981.4 40.3324
KD240 649.8 981.3 40.3018
A280 611.7 983.2 40.0045
A274 600.5 983.6 39.9676
A285 609.4 982.9 39.9833
A286 607.9 9S2.4 3 9 . 9 6 9 8
A289 608.8 9S2.0 39.9779
LATITUDE HEIGHT GO ANOMALY
(M) mgals SBA(P=2.5)
mgals/2*
-1.6611 74.3 978007.2 TTr—1i
-1 ,6S53 75.5 978008.4 -13.0-1.6917 82.7 978010.1 -1 0 . 0
-1.5139 6 6 . 2 - 978007.6 -15.4-1.4561 74.7 978000.5 -19.6-1.5528 64.2 978002.5 -20.4-1,5889 67.2 977998.0 -24.5
-1.6506 62.9 977999.0 -24 .6


