RESERVOIR ROCK CHARACTERIZATION OF LAMU BASIN IN SOUTHEAST KENYA KAMAU S. MAINA REG. NO: I13/2364/2007 A RESEARCH PROJECT SUBMITTED IN PARTIAL FULFILLMENT FOR THE AWARD OF BACHELOR OF SCIENCE DEGREE IN GEOLOGY, DEPARTMENT OF GEOLOGY, UNIVERSITY OF NAIROBI JUNE 3 RD , 2011

Welcome message from author
This document is posted to help you gain knowledge. Please leave a comment to let me know what you think about it! Share it to your friends and learn new things together.
Transcript

RESERVOIR ROCK CHARACTERIZATION OF LAMU
BASIN IN SOUTHEAST KENYA
KAMAU S. MAINA
REG. NO: I13/2364/2007
A RESEARCH PROJECT SUBMITTED IN PARTIAL
FULFILLMENT FOR THE AWARD OF BACHELOR OF
SCIENCE DEGREE IN GEOLOGY,
DEPARTMENT OF GEOLOGY,
UNIVERSITY OF NAIROBI
JUNE 3RD, 2011
ii
DECLARATION Student Declaration I hereby certify this project as my original work and has never been presented for examination by
any other person. No publication or reproduction of this document should be done without my
permission or liars with the Department of Geology at the University of Nairobi.
SIGN…………………………………… DATE……………………………………..
KAMAU SAMUEL MAINA
REG. NO: I13/2364/2007
Declaration by the Supervisor
This project has been submitted for examination with my approval as the supervisor
SIGN…………………………………… DATE……………………………………..
DR. D. W. ICHANG’I
Declaration by the Project Coordinator This project has been submitted for examination with my approval as the coordinator
SIGN…………………………………… DATE……………………………………..
DR. D. O. OLAGO

iii
ABSTRACT Lamu Basin formed as a result of failed arm of a tri-radial rift system (Reeves et al., 1986) that
developed passively in Mesozoic after the subsequent drift of Madagascar from the East Africa
coast. It is the largest sedimentary basin in Kenya encompassing 170,000 km2 both onshore and
offshore. Lamu Basin is characterized by distinct sandstone facies which formed from Permo-
Carboniferous through Tertiary in four Megasequences that show variation in grain sizes,
porosity, permeability, compaction, shaliness and cementation. This is largely determined by the
forces involved in the formation and their environmental setting. This categorizes the facies into;
continental rift basin sandstones, fluvial-deltaic sandstones, and the sandstones due to marine
deposition.
The study objectives were developed in line with the need to investigate on the sedimentological
(grain size, texture, thickness and sorting) and petrophysical (porosity, permeability and the
seismic velocity contrasts) parameters of mainly the sandstones as reservoir rocks. This was
achieved by adopting information from the well logs (porosity, resistivity, gamma ray and
seismic data) studied from the drilled wells in Lamu Basin. The relationships between these
properties were determined in order to evaluate the quality of the sandstone as reservoir rocks.
The results showed that the petrophysical properties of the characteristic sandstones are directly
related to their sedimentological characteristics (primary factor) but are either improved or
reduced by diagenesis (secondary factors) for instance cementation, dissolution or compaction.
The sands grade from siltstones to coarse grained (0. 0039-1.0 mm) sizes whereby the higher and
low grades are related to fluvial and deltaic origin respectively. Their porosity values range from
fair to excellent with the highs of >20% and lows of <15%. The sandstones with higher values of
effective porosity were considered permeable but <10% porous ones implied negligible
permeability. The seismic velocity contrasts were used to determine the degree of compaction of
the sandstones in relation to other rocks in the basin. High compaction depict high seismic
velocity, relatively low porosity and permeability whereas the vice versa is true.
The study was considered successful by having achieved the objectives that were set for
investigations. From the sedimentological and petrophysical point of view, most of the
sandstones in Lamu Basin have relatively good reservoir characteristics.

iv
ACKNOWLEDGEMENT
My gratitude goes the almighty Lord for giving us life and health to enable us to go through the
whole process of preparing this project. I really appreciate the great work by Dr. Ichang’i in the
corrections of this document. Thanks to the leader of the exploration team and the whole Library
staff in the National Oil Corporation of Kenya (NOCK) and the Ministry of Energy for their
indispensable support in my research work. The pieces of advice given by Mr. Muia and Mr.
Anthony were of great help into my research. I thank my parents too for their continued support
in my studies throughout the course. May the Lord bless them in abundantly.

v
DEDICATIONS
I dedicate this project to my parents (Jane and Wilson), my sisters (Bilhah and Elizabeth) and my
friends.

vi
TABLE OF CONTENTS
DECLARATION ...................................................................................................................... ii
ABSTRACT............................................................................................................................. iii
ACKNOWLEDGEMENT ...................................................................................................... iv
DEDICATIONS ........................................................................................................................v
TABLE OF CONTENTS ........................................................................................................ vi
LIST OF FIGURES .............................................................................................................. viii
LIST OF TABLES ................................................................................................................ viii
CHAPTER ONE: INTRODUCTION ......................................................................................1
1.1 Introduction .......................................................................................................................1
1.2 Lamu Basin .......................................................................................................................1
1.2.1 Lamu Basin Mega-Sequences .....................................................................................3
1.3 Previous Work ...................................................................................................................4
1.4 Foreword ...........................................................................................................................5
1.5 Objectives of the Study ......................................................................................................5
1.6 Justification of the Study ...................................................................................................6
1.7 Importance of the Study.....................................................................................................6
1.8 Methodology .....................................................................................................................6
CHAPTER TWO: SEDIMENTOLOGICAL PROPERTIES OF THE RESERVOIR
ROCK ........................................................................................................................................7
2.1 Introduction .......................................................................................................................7
2.2 Sedimentology and Characteristic Facies ...........................................................................7
2.2.1 Sandstone Facies in Lamu Basin and their Depositional Environments .......................7
2.2.2 Lithology and Texture.................................................................................................8
2.2.2.1 Grain size .............................................................................................................8
2.2.2.2 Sorting .................................................................................................................9

vii
2.2.3 Mineralogy and Textural Characteristics .....................................................................9
CHAPTER THREE: RESERVOIR AND PETROPHYSICAL PROPERTIES OF
SANDSTONES ........................................................................................................................ 12
3.1 Introduction ..................................................................................................................... 12
3.2 Porosity of the Sandstone Facies ...................................................................................... 12
3.3 Permeability .................................................................................................................... 13
3.3.1 Grain Size Model ...................................................................................................... 14
3.4 Seismic Velocity ............................................................................................................. 15
3.4.1 Velocity Contrasts .................................................................................................... 16
CHAPTER FOUR: RELATIONSHIPS BETWEEN THE SEDIMENTOLOGY AND
PETROPHYSICAL PROPERTIES OF THE RESERVOIR ROCK ................................... 19
4.1 Introduction ..................................................................................................................... 19
4.2 Porosity ........................................................................................................................... 19
4.2.1 Primary Controls....................................................................................................... 19
4.2.2 Secondary controls.................................................................................................... 19
4.2.3 Grain Size –Porosity Relationship ............................................................................. 20
4.3 Permeability .................................................................................................................... 20
4.3.1 Poro-Perma Relationship .......................................................................................... 21
4.4 Velocity Contrast -Compaction Relationship ................................................................... 21
CHAPTER FIVE: DISCUSSION, CONCLUSION AND RECOMMENDATIONS ........... 22
5.1 Discussion ....................................................................................................................... 22
5.3 Conclusion ...................................................................................................................... 22
5.4 Recommendations and Further Study .............................................................................. 22
REFERENCES ........................................................................................................................ 24
APPENDICES ......................................................................................................................... 29
Appendix I: A List of Wells Drilled In Kenyan Sedimentary Basins ...................................... 29

viii
LIST OF FIGURES Figure 1. 1: The Map Showing Wells Drilled in Kenya. ..............................................................2
Figure 1. 2: Lithostratigraphic column of Lamu Basin .................................................................3
Figure 2. 1: Grain Size Analysis ................................................................................................ 11
Figure 3. 2: Absolute Porosity of some of the Major Sandstones in Lamu Basin ...................... 13
Figure 3. 3: Seismic Velocity Contrasts between the Ewaso Sands and the Boundary Rocks ..... 16
Figure 3. 4: Seismic Velocity Contrasts between the Kofia Sands and the Boundary Rocks ....... 17
Figure 3. 5: Seismic Velocity Contrasts between the Barren Beds Sands and the Boundary Rocks
................................................................................................................................................. 18
Figure 4. 1: Grain Size- Porosity Relationship ........................................................................... 20
Figure 4. 2: Poro-Perma Analysis .............................................................................................. 21
LIST OF TABLES Table 2. 1:The Wentworth Grade Scale for the Clastic Sediments ..............................................9

1
CHARACTERIZATION OF RESERVOIR ROCK IN LAMU
BASIN
CHAPTER ONE: INTRODUCTION
1.1 Introduction Reservoir characterization involves studies on various parameters that support occurrence of
fluids in a rock. This study is an attempt to understand how the reservoir properties are related to
the stratigraphic sequences and depositional processes that were involved during the formation of
the rock. This is the basis of determining the overall quality and productivity of the reservoir
rock. This chapter will give an introduction of the study that will entail the major objective and
knowledge gap, and a review of the previous work on the Lamu Basin.
1.2 Lamu Basin Lamu Basin is located in Southeast Kenya, east of the 39th meridian, and includes the adjacent
continental shelf and slope areas of the Indian Ocean (Figure 1.1). It is the largest sedimentary
basin in Kenya encompassing 170,000 km2 both onshore and offshore has sediment thickness
ranging from 3250 m in the northern boundary to 10,000 m in the coastal area (Nyagah, 1995).
The basin consists of sediments of Permo-Carboniferous through Tertiary continental rift basin
sandstones, fluvial-deltaic sandstones, marine shales and carbonates. The offshore depo-centre
has a sedimentary column which is 12,000 m to 13,000 m thick (Nyagah, 1995).
According to Nyagah (1995) Lamu Basin is the failed arm of a tri-radial rift system (Reeves et.
al., 1986) that developed passively in Mesozoic after the subsequent drift of Madagascar from
the east coast of Africa (Bosellini, 1986). Development of the southern part of the basin as a
passive margin is closely related to considerations of the pre-drift position of Madagascar and
formation of the Indian Ocean basin during Mesozoic. Cretaceous and Tertiary strata in the basin
comprise an eastward-thickening gross succession of sediments on which eustatic sea-level
fluctuations and a sequence of unconformities related to pulses of transgressive and regressive
depositional trends are superimposed.

2
Figure 1. 1: The Map Showing Wells Drilled in Kenya.
Map available at the National Oil Corporation of Kenya Library

3
1.2.1 Lamu Basin Mega-Sequences
The Permo-Carboniferous through Tertiary sediments of the Lamu Basin can be divided into
four mega-sequences (NOCK, 1995) each bounded by regional unconformities recording
interruptions in the basin depositional history (Figure 1.2).
Figure 1. 2: Lithostratigraphic column of Lamu Basin
Figure adopted from the Integrated Report by National Oil Corporation of Kenya (1995)

4
Megasequence I show the Karoo Group of Permo-Carboniferous to Early Jurassic rocks which
occur on Precambrian basement rocks. The Megasequences are stratigraphic units with regional
continuity within the basin and commonly encompass several related depositional systems, both
vertically and laterally, with each system recording a common palaeogeographic event (Nyagah,
1988).
1.3 Previous Work The area of post-Karoo sedimentary cover was geologically mapped by various workers of the
Geological Survey of Kenya (Caswell, 1953, 1956; Karanja, 1982). Waiters and Linton (1973)
studied the development of the Karoo and post-Karoo basins. The first attempt at establishing a
complete stratigraphic correlation for the Phanerozoic rocks in the Lamu Basin was made by
Waiters and Linton (1973). Most of the units could not be readily related to a time framework,
largely on account of limited availability of subsurface information from deep wells. Cannon et.
al,. (1981) provided a more comprehensive stratigraphic analysis that also examined the
development of the basin through rifting in the Carboniferous and later detachment of
Madagascar from the coast of east Africa.
Regional studies covering the geology of East Africa have been compiled by Kent (1965, 1972),
Kamen-Kaye (1978), Kamen- Kaye and Barnes (1978, 1979), Karanja (1988) and Nyagah
(1988). Kenting Earth Science (1982) initiated the studies of Aeromagnetic Survey. Considerable
work in the investigations on potential petroleum in Eastern Kenya was done by BEICIP (1982)
which included studies of seismic surveys, Aeromagnetic, Gravity, Geophysical and
Geochemistry Anomalies. The most controversial concerns investigations related to the
palaeoposition of Madagascar in relation to Africa. A synthesis of data gathered from past results
and new information gathered by Lamont-Doherty Earth Observatory of Colombia University
was integrated with the stratigraphy of the East African and Madagascan basins and documented
by Coffin and Rabinowitz (1988). Mutunguti (1988) carried out a study to analyze Kerogen in
sediments in Lamu Basin. A detailed geological, geophysical and geochemical study of the basin
by the National Oil Corporation of Kenya was conducted in 1993 and documented in NOCK
(1995).
5
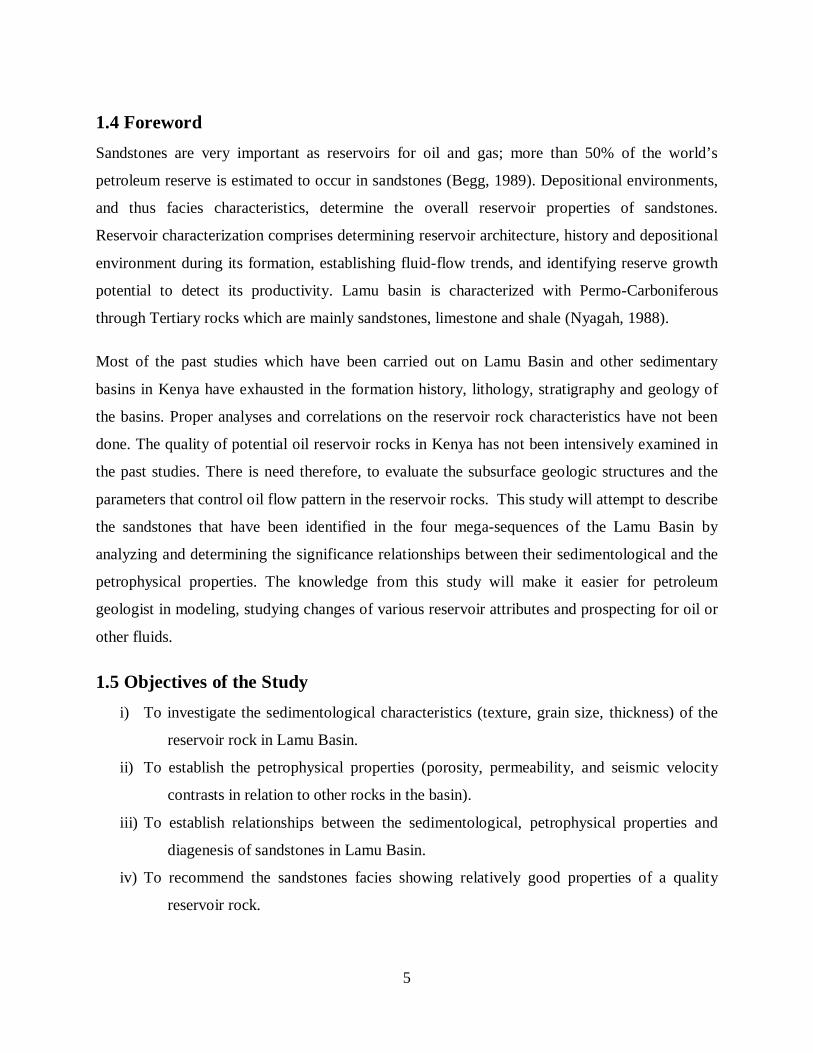
1.4 Foreword Sandstones are very important as reservoirs for oil and gas; more than 50% of the world’s
petroleum reserve is estimated to occur in sandstones (Begg, 1989). Depositional environments,
and thus facies characteristics, determine the overall reservoir properties of sandstones.
Reservoir characterization comprises determining reservoir architecture, history and depositional
environment during its formation, establishing fluid-flow trends, and identifying reserve growth
potential to detect its productivity. Lamu basin is characterized with Permo-Carboniferous
through Tertiary rocks which are mainly sandstones, limestone and shale (Nyagah, 1988).
Most of the past studies which have been carried out on Lamu Basin and other sedimentary
basins in Kenya have exhausted in the formation history, lithology, stratigraphy and geology of
the basins. Proper analyses and correlations on the reservoir rock characteristics have not been
done. The quality of potential oil reservoir rocks in Kenya has not been intensively examined in
the past studies. There is need therefore, to evaluate the subsurface geologic structures and the
parameters that control oil flow pattern in the reservoir rocks. This study will attempt to describe
the sandstones that have been identified in the four mega-sequences of the Lamu Basin by
analyzing and determining the significance relationships between their sedimentological and the
petrophysical properties. The knowledge from this study will make it easier for petroleum
geologist in modeling, studying changes of various reservoir attributes and prospecting for oil or
other fluids.
1.5 Objectives of the Study i) To investigate the sedimentological characteristics (texture, grain size, thickness) of the
reservoir rock in Lamu Basin.
ii) To establish the petrophysical properties (porosity, permeability, and seismic velocity
contrasts in relation to other rocks in the basin).
iii) To establish relationships between the sedimentological, petrophysical properties and
diagenesis of sandstones in Lamu Basin.
iv) To recommend the sandstones facies showing relatively good properties of a quality
reservoir rock.

6
1.6 Justification of the Study This study brings out the understanding of various reservoir rock parameters that favor the
occurrence of hydrocarbon in Lamu Basin. The information acquired from this study will be
essential in correlating and prospecting for other areas of similar characteristics. The knowledge
will minimize the uncertainty of high exploration costs incurred in hostile and inaccessible
potential areas.
1.7 Importance of the Study The global oil consumption is projected to increase by about 36% by 2030
(www.worldeconomicforcast). In Africa, oil consumption could nearly double in that time. As
more countries scramble for an increasingly limited supply of oil, the price and availability of
fuel will become ever more challenging issues. Correlation of the reservoir rock characteristics is
a guide in prospecting potential reservoir rocks in different area which will in turn attract foreign
investors. This will ensure new discovery, recovery, and sustenance of hydrocarbon reserves
toward vision 2030 in Kenya.
1.8 Methodology The research combined the data on the geological, geophysical and stratigraphycal studies of the
Lamu Basin in the selected wells. Seismic Petrophysics Method (Geophysical Well Log
Analysis) is applied to give the well logs and core data. Four wells were critically selected for
this study. Dodori-1, Pate-1, Kipini-1 and Kofia-1 well showed quite adequate data for the study.
Correlations on varied attributes that is, permeability, porosity, and seismic velocity contrasts,
compaction, grain sizes and texture are established to determine how they influence the quality
of the overall reservoir rock.
7
CHAPTER TWO: SEDIMENTOLOGICAL PROPERTIES OF
THE RESERVOIR ROCK
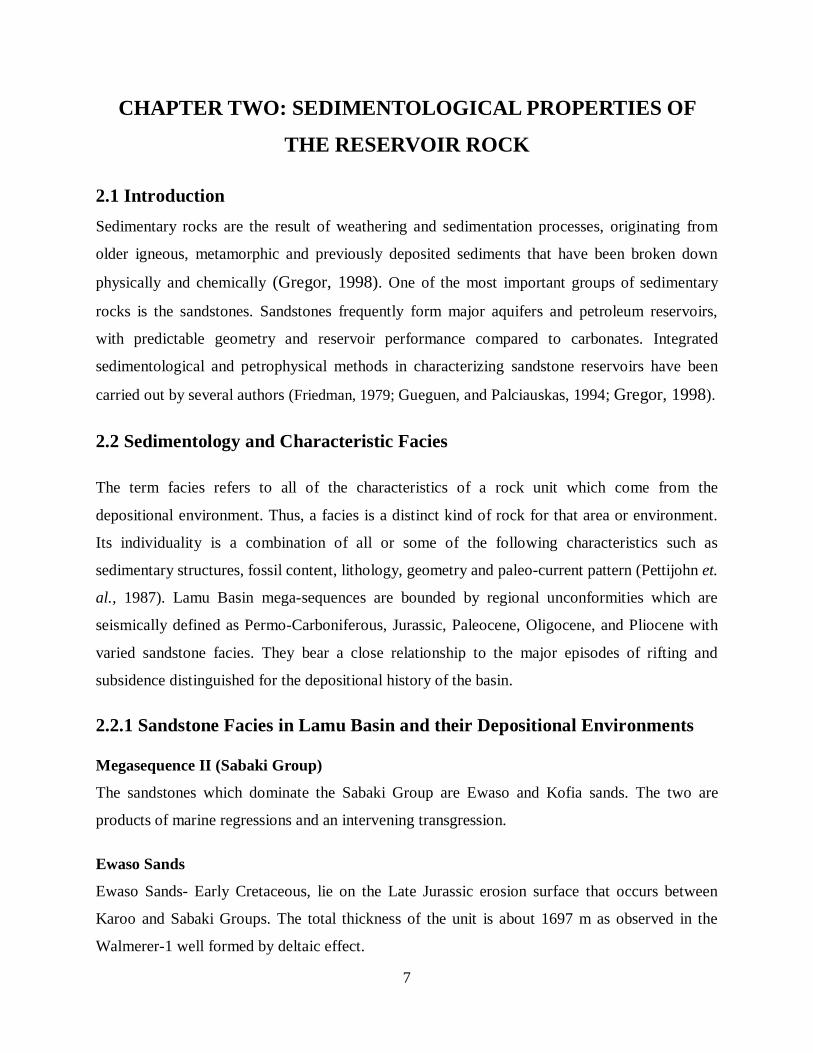
2.1 Introduction Sedimentary rocks are the result of weathering and sedimentation processes, originating from
older igneous, metamorphic and previously deposited sediments that have been broken down
physically and chemically (Gregor, 1998). One of the most important groups of sedimentary
rocks is the sandstones. Sandstones frequently form major aquifers and petroleum reservoirs,
with predictable geometry and reservoir performance compared to carbonates. Integrated
sedimentological and petrophysical methods in characterizing sandstone reservoirs have been
carried out by several authors (Friedman, 1979; Gueguen, and Palciauskas, 1994; Gregor, 1998).
2.2 Sedimentology and Characteristic Facies
The term facies refers to all of the characteristics of a rock unit which come from the
depositional environment. Thus, a facies is a distinct kind of rock for that area or environment.
Its individuality is a combination of all or some of the following characteristics such as
sedimentary structures, fossil content, lithology, geometry and paleo-current pattern (Pettijohn et.
al., 1987). Lamu Basin mega-sequences are bounded by regional unconformities which are
seismically defined as Permo-Carboniferous, Jurassic, Paleocene, Oligocene, and Pliocene with
varied sandstone facies. They bear a close relationship to the major episodes of rifting and
subsidence distinguished for the depositional history of the basin.
2.2.1 Sandstone Facies in Lamu Basin and their Depositional Environments
Megasequence II (Sabaki Group)
The sandstones which dominate the Sabaki Group are Ewaso and Kofia sands. The two are
products of marine regressions and an intervening transgression.
Ewaso Sands
Ewaso Sands- Early Cretaceous, lie on the Late Jurassic erosion surface that occurs between
Karoo and Sabaki Groups. The total thickness of the unit is about 1697 m as observed in the
Walmerer-1 well formed by deltaic effect.
8
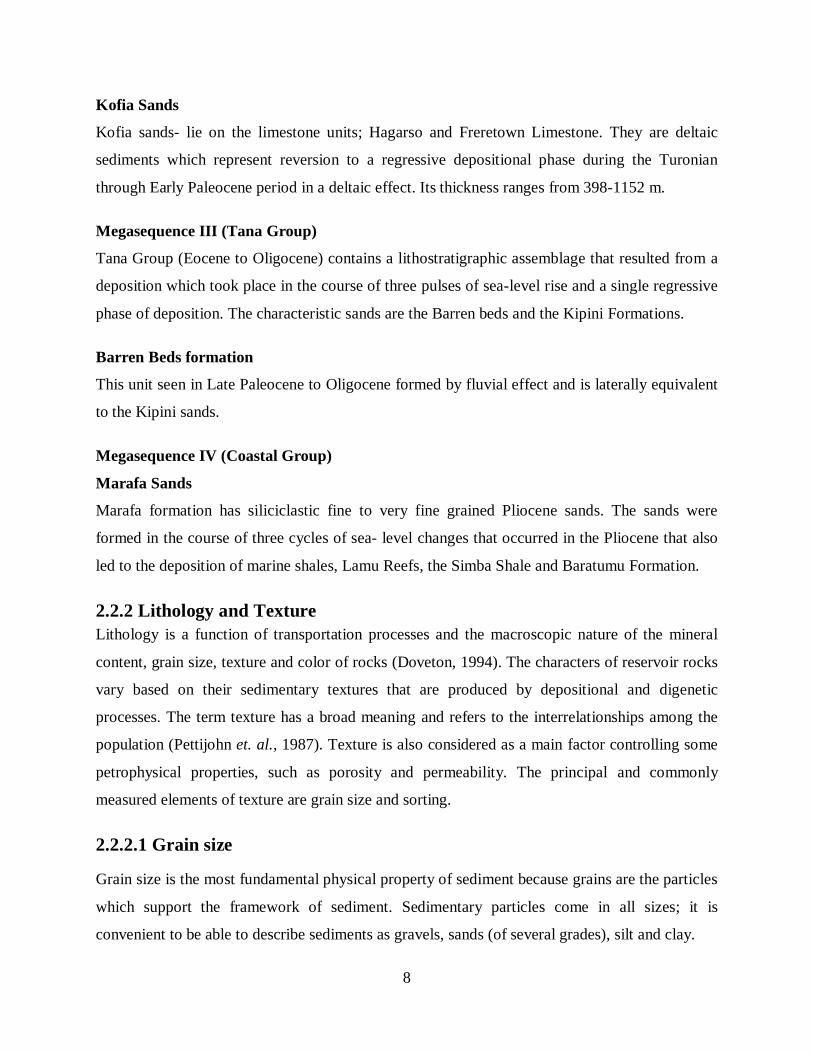
Kofia Sands
Kofia sands- lie on the limestone units; Hagarso and Freretown Limestone. They are deltaic
sediments which represent reversion to a regressive depositional phase during the Turonian
through Early Paleocene period in a deltaic effect. Its thickness ranges from 398-1152 m.
Megasequence III (Tana Group)
Tana Group (Eocene to Oligocene) contains a lithostratigraphic assemblage that resulted from a
deposition which took place in the course of three pulses of sea-level rise and a single regressive
phase of deposition. The characteristic sands are the Barren beds and the Kipini Formations.
Barren Beds formation
This unit seen in Late Paleocene to Oligocene formed by fluvial effect and is laterally equivalent
to the Kipini sands.
Megasequence IV (Coastal Group)
Marafa Sands
Marafa formation has siliciclastic fine to very fine grained Pliocene sands. The sands were
formed in the course of three cycles of sea- level changes that occurred in the Pliocene that also
led to the deposition of marine shales, Lamu Reefs, the Simba Shale and Baratumu Formation.
2.2.2 Lithology and Texture Lithology is a function of transportation processes and the macroscopic nature of the mineral
content, grain size, texture and color of rocks (Doveton, 1994). The characters of reservoir rocks
vary based on their sedimentary textures that are produced by depositional and digenetic
processes. The term texture has a broad meaning and refers to the interrelationships among the
population (Pettijohn et. al., 1987). Texture is also considered as a main factor controlling some
petrophysical properties, such as porosity and permeability. The principal and commonly
measured elements of texture are grain size and sorting.
2.2.2.1 Grain size
Grain size is the most fundamental physical property of sediment because grains are the particles
which support the framework of sediment. Sedimentary particles come in all sizes; it is
convenient to be able to describe sediments as gravels, sands (of several grades), silt and clay.

9
Table 2. 1: The Wentworth Grade Scale for the Clastic Sediments
The Wentworth grade scale for the sediments; after (Wentworth, 1922)
2.2.2.2 Sorting
Sorting gives an indication of the depositional mechanism. Sediments deposited with high
energy (strong current or waves) are generally poorly sorted; sediments which have been worked
and reworked are much better sorted (Fuchtbauer, 1974). Increasing sorting correlates with
increasing permeability whereas well-sorted sand grains are about the same size and shape but
poorly sorted sands contain grains with different size and shape (Fuchtbauer, 1974).
2.2.3 Mineralogy and Textural Characteristics Ewaso Sands
The total thickness of the Ewaso sands is 1697 m in the Walmerer-1 well. It comprises a deltaic
succession of alternating fine- to coarse-grained (0.125-1.0 mm) (Figure 2.1), orthoquartzites,
siltstones, shales and subordinate calcareous sandstones, arenaceous limestones, thin layers of
anthracite and abundance of flora. The presence of orthoquartzites is attributed to secondary
silicification associated with uplift of the Garissa-Walmerer High and the Early Tertiary
unconformity.

10
Kofia Sands
Kofia sands are located offshore about 300 km southeast of the coast of Somalia. The Sands have
a thickness that ranges from 398-1152 m at the Simba-1 well. The sands are well-cemented, and
white to pale grey, fine to medium-grained (0.125-0.5 mm) (Figure 2.1) at the Kofia-1 well in
about 928 m thickness. The sands are intercalated with olive grey, calcareous claystones and
medium to light grey calcareous silty claystones that grade in places into siltstone. In the onshore
at the Kipini-1well the unit is 398 m thick and consists of interbedded calcite-cemented
sandstones with poor to fair porosity and calcareous shales with an abundance of carbonaceous
plant remains.
Sandstone in the Barren Beds Formation
Sandstone in Barren Beds Formation occur as fluvial "red beds" which are lateral equivalents of
the Kipini unconsolidated sands (0.0039-0.0625 mm) (Figure 2.1), seen in the Middle Eocene
through Late Oligocene intervals of the Pandangua-1 (925 m), Walu-2 (1003 m), Hagarso-1 (286
m), Walmerer-1 (655 m), Garissa-1 (614 m) Kencan-1 (688 m) and the equivalent sequences in
Dodori-1 and Pate-1 wells. The sandstones are characterized with carbonate facies (Pate,
Linderina and Dodori Limestones) that built up between periods of their deposition which are
related to a tectonically influenced depositional pattern involving episodic uplift and subsidence
in marine setting which prevailed during the Palaeogene.
Kipini Sands Kipini sands occur in the Kipini Formation which is fairly extensive, covering the southern part
of the Lamu Basin on both flanks of the Walu-Kipini High. It spans the Early Eocene through
part of the Late Oligocene period. Kipini Sands which show a total thickness of 1953 m in
Kipini-1; form the major distinguishable clastic lithology in Kipini formation that often grade
into siltstones (0.0039-0.0625 mm) (Figure 2.1). They are composed of calcareous sandstones
interbedded with shale and mudstones on the higher levels, and siltstone, shale, pyritic, and
micaceous at the lower levels. These sands are also observed in Pate-1 well.
Marafa Sands Marafa Sands form the Pliocene sequence in Lamu Basin apart from Simba-1 and Walu-2 wells.
They consist of very pale orange to greyish orange, medium- to coarse-grained (0.25-1.0 mm)
poorly consolidated quartz sands with sandstones and kaolinitic clays (Nyagah, 1988). Their

11
depositional phase was synchronous with the deformation in central Kenya related to the rift
valley tectonism and was contemporaneous with north-south faulting in the Tana River valley
(Wright and Pix, 1967).
Figure 2. 1: Grain Size Analysis

12
CHAPTER THREE: RESERVOIR AND PETROPHYSICAL
PROPERTIES OF SANDSTONES
3.1 Introduction
Sandstone reservoirs are deposited in fluvial, eolian and lacustrine environments in non-marine
settings, whereas in marine settings, these rocks may be deposited in deltaic, shallow marine and
deep marine settings (Martin et. al., 1997). Petrophysical properties of sedimentary rocks are
influenced by porosity, permeability, velocity and density; these properties are partly controlled
by facies characteristics which in turn are related to depositional processes (Cant and Walker,
1976).
3.2 Porosity of the Sandstone Facies
The major parameters bearing the porosity of sandstones in Lamu Basin include shaliness, late or
early cementation, dissolution, recrystallization and fracturing (BEICIP, 1982). Low energy
conditions resulted to deposition and inclusions of Shale thus low porosity. During burial,
compaction of the sediments causes intergranular constraints, followed by dissolution where the
grains come into contact with the cement deposition in the neutral zones (Cant and Walker,
1976). Dissolution results from the percolation of under-saturated water which enhances the
porosity especially in Calcareous cemented sandstones.
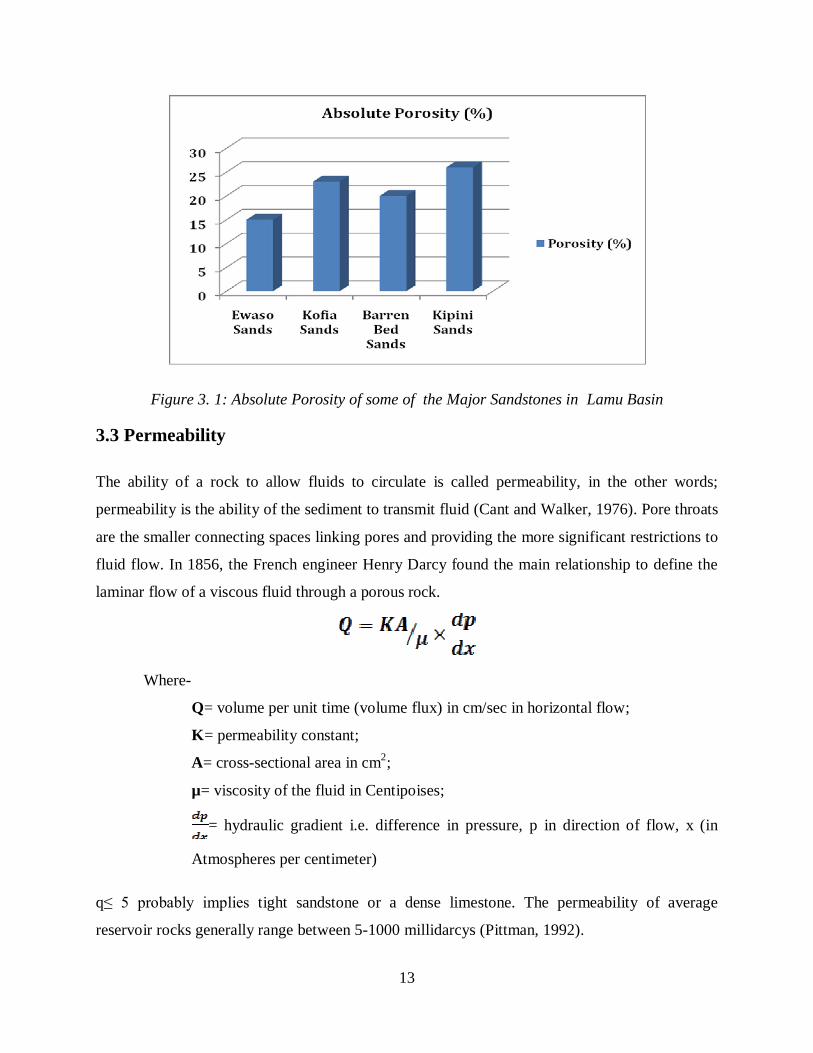
Thick intervals of poorly sorted and unconsolidated sands assigned to the Kipini sands occur in
Kipini-1 well. The sands are 26 % porous at about 300 m in the Oligocene-Middle Eocene
section that is water saturated. The Kofia sands are observed at Kofia-1 (3558-3570 m), Dodori-1
and Kipini-1 wells 4311 m that lie on the Mararani-Dodori- Pate anticlinal trend that is
dominated by Tertiary faults. The effective porosity of the Kofia sands is about 12%. They are
characterized with approximately 122 m Campanian section of 23% absolutely porous section of
100% water saturated. Barren Beds sands at Pate-1 well occur in four intervals of the Late
Eocene from 3989-4186 m with estimated porosity of 20%. The effective porosity of the Ewaso
sands is relatively as low as 15% probably due to higher compactions and their occurrence at low
depth of more than 3630 m though their abundance composition of flora.
13
Figure 3. 1: Absolute Porosity of some of the Major Sandstones in Lamu Basin
3.3 Permeability
The ability of a rock to allow fluids to circulate is called permeability, in the other words;
permeability is the ability of the sediment to transmit fluid (Cant and Walker, 1976). Pore throats
are the smaller connecting spaces linking pores and providing the more significant restrictions to
fluid flow. In 1856, the French engineer Henry Darcy found the main relationship to define the
laminar flow of a viscous fluid through a porous rock.
Where-
Q= volume per unit time (volume flux) in cm/sec in horizontal flow;
K= permeability constant;
A= cross-sectional area in cm2;
µ= viscosity of the fluid in Centipoises;
= hydraulic gradient i.e. difference in pressure, p in direction of flow, x (in
Atmospheres per centimeter)
q≤ 5 probably implies tight sandstone or a dense limestone. The permeability of average
reservoir rocks generally range between 5-1000 millidarcys (Pittman, 1992).

14
Permeability is related in a variable and complex way to porosity, pore size, arrangement of
pores and pore throats, and grain size. Fine sediments such as clay exhibit low permeability
compared to sand and gravel, due to the lack of connection between the pore space and the small
size of the pore throat. Open grain packing shows high porosity and therefore high permeability
than closed packing. Reservoir rock whose permeability is 5 md or less is called tight sand or a
dense limestone, according to its composition (Levorsen, 1965). A rough field appraisal of
reservoir permeability is:
Fair 1.0-10 md
Good 10-100 md
Very good 100-1000 md
Effective permeability is described as the ability of a rock to conduct an under-saturated fluid in
presence of other fluids in that rock (Levorsen, 1965). Begg, et. al. (1989) proposed a general
estimator for effective vertical permeability, kve, for a sandstone medium containing thin,
discontinuous, impermeable mudstones, based on effective medium theory and geometry of ideal
streamline:
Where: Vm is the volume fraction of mudstone, az is given by (ksv/ksh) 1/2, ksh and ksv are
the horizontal and vertical permeability of the sandstone, f is the barrier frequency, and d is a
mudstone dimension (d=Lm/2 for a 2D system with mean mudstone length, Lm). This
method is valid for low mudstone volume fractions and assumes thin, uncorrelated,
impermeable, discontinuous mudstone layers.
3.3.1 Grain Size Model A large amount of different theoretical models have been developed to account for the ecological
as well as economical importance of the ability of permeability prediction. Berg (1970)
published one of the first models which links directly grain size with permeability. From

15
consideration of only rectilicular pores (those pores which penetrate the porous medium without
change in shape or direction) of various packing of spheres, he developed an equation, which
relates permeability to the square of the grain diameter:
Where
K = permeability [md]
m = cementation factor (= 1.8)
= fractional porosity
d = median grain diameter [μm]
s = sorting term
The sorting term also called the percentile derivation (s= S90 – S10), incorporates any spread in
grain size into the formula and is expressed in phi units, where phi = -log2d (mm). For example a
sample with a median diameter of 0.177 mm, a value of 1 for s implies that 10 percent of the
grains are larger than 0.25 mm and 10 percent are smaller than 0.125 mm.
A Combination of theoretical, empirical, and heuristic models can be applied to attempt to repair
the bad or missing data. A common example is the problem of mud filtrate invasion (Walls, et
al., 2001; Vasquez, et al., 2004). Mud filtrate invasion occurs during drilling with over-balanced
mud weight conditions. The positive pressure gradient between the wellbore and the formation
causes some of the mud liquids to penetrate into the permeable zones, displacing original fluids
near the borehole wall. The severity of this condition varies greatly depending on permeability,
mud weight, mud type, and original fluid saturation. The relationship is expressed as;
Vs=0.73Vp-767 (m/sec)
3.4 Seismic Velocity One of the key factors needed for the successful use of seismic wave velocities in reservoir
development, characterization, and recovery is a fuller understanding of what seismic waves can
tell about the state of reservoir rocks and the fluids contained in their pore space (Gueguen and
Palciauskas, 1994).
The porous sedimentary rocks generally show lower velocities and a broader range for an
individual rock type compared to igneous and metamorphic rocks. Both features are mainly due

16
to the influence of the pore contents with their low elastic parameters. Petrophysical analysis
shows a general decrease in rock velocity with increasing porosity (Gueguen and Palciauskas,
1994).
3.4.1 Velocity Contrasts The seismic velocity contrasts between different sandstones facies and the major rocks in the
Lamu Basin; shales and limestones, have been examined from different wells. The reliable wells
are Pate-1, Kipini-1, Kofia-1, and Simba-1 wells. These wells show distinct velocities of the
same lithology for instance Kipini sands show varied velocities as observed at the Kipini-1 and
Pate-1 wells. The other examinable facies include the Ewaso, Kofia, Barren Beds sandstones.
These velocity contrasts can be applied in estimating the compaction, depth, and density of the
rock in thought.
Ewaso sands
These sands are observed in Kipini-1 well at about 6300-8300 m depth. This sedimentological
facies is intercalated with equivalent Walu shales, Hagarso and Freretown limestone sequences
and coal. The velocity contrasts between Ewaso sands and coal, Walu shales-Ewaso sands,
Hagarso and Freretown limestones zones are 87%, 50% and 33% respectively.
Figure 3. 2: Seismic Velocity Contrasts between the Ewaso Sands and the Boundary Rocks

17
Kofia sands
Kofia sands are observed in Kipini-1 well at 4800-5800 m depth. They are also interbedded with
Walu shales, Hagarso and Freretown limestone sequences. The velocity contrasts at this well
between Kipini sands-Walu shales, Kipini sands-Hagarso limestones and Walu shales-Hagarso
Limestones zones are 43%, 14% and 53% respectively. This case is also observed at Kofia-1
well where the velocity contrast between Kofia sands and Walu shale is 40%. The Values at the
Simba-1 well are lower as 31% between Walu shale-Kofia sands and 45% between Hagarso
limestone-Kofia sands. These velocity contrasts are equivalent to the values for the Kipini sands
observed in Kipini-1 well at the same depth interval.
Figure 3. 3: Seismic Velocity Contrasts between the Kofia Sands and the Boundary Rocks
Sandstone in the Barren Beds Formation
The sands are identified in Pate-1 well at the depth between 4000-9000 m in about 300 m
thickness. They are interbedded with Early Tertiary Pate and Dodori limestones and Simba
Shales. Velocity contrasts are 23% Simba shales-sands, 80% Simba shales-Pate limestone, and
46% in sands-Dodori limestone. These velocity contrasts are equivalent to the values for the
Kipini sands observed in Pate-1 well at the same depth interval.

18
Figure 3. 4: Seismic Velocity Contrasts between the Barren Beds Sands and the Boundary Rocks

19
CHAPTER FOUR: RELATIONSHIPS BETWEEN THE
SEDIMENTOLOGY AND PETROPHYSICAL PROPERTIES OF
THE RESERVOIR ROCK
4.1 Introduction The petrophysical properties of the sandstone facies are related to their deposition history in
regard to the conditions that prevailed during the processes of accumulation and diagenesis (Cant
and Walker, 1976). This chapter attempts to link these properties with their possible influencing
factors in order to evaluate the quality of sandstone as a reservoir rock.
4.2 Porosity The porosity of a given sedimentological facies would be determined by the factors involved in
the process of their deposition (primary controls) and the factors that come about in the
diagenetic processes that take place after or immediately after deposition.
4.2.1 Primary Controls In general the most important textural parameters in controlling porosity are grain size, sorting,
shape, roundness and packing. Sands with high sphericity and high roundness pack with
minimum pore space. Therefore, it is expected that as sphericity and roundness decrease,
porosity increases as a result of the bridging of pores and looser packing (Burley, and
Kantorowicz, 1986). The occurrence of shales, claystones and siltstones interbedded in the
sandstones implies low energy involved in the deposition of the sand sediments.
4.2.2 Secondary controls Diagenetic processes are the main causes of the modification of porosity in the sandstones, and
compaction and cementation are the main controlling factors (Burley, and Kantorowicz, 1986),
other factors are dissolution and recrystallization. The variability in the porosity of the highly
porous sandstones in Lamu Basin could be caused by the variation in compaction due their
occurrence in different levels for instance Ewaso Sands. Von Engelhart (1967) suggested that
grain rearrangement could reduce the porosity of sand from 40% to 28%. In additional, the
presence of orthoquartzites in the sands due to silicification could be taken into account for the
20
decrease in porosity in the Ewaso sands. Kipini and Kofia sands are interbedded with calcareous
silty claystones and calcite cement thus lower porosity.
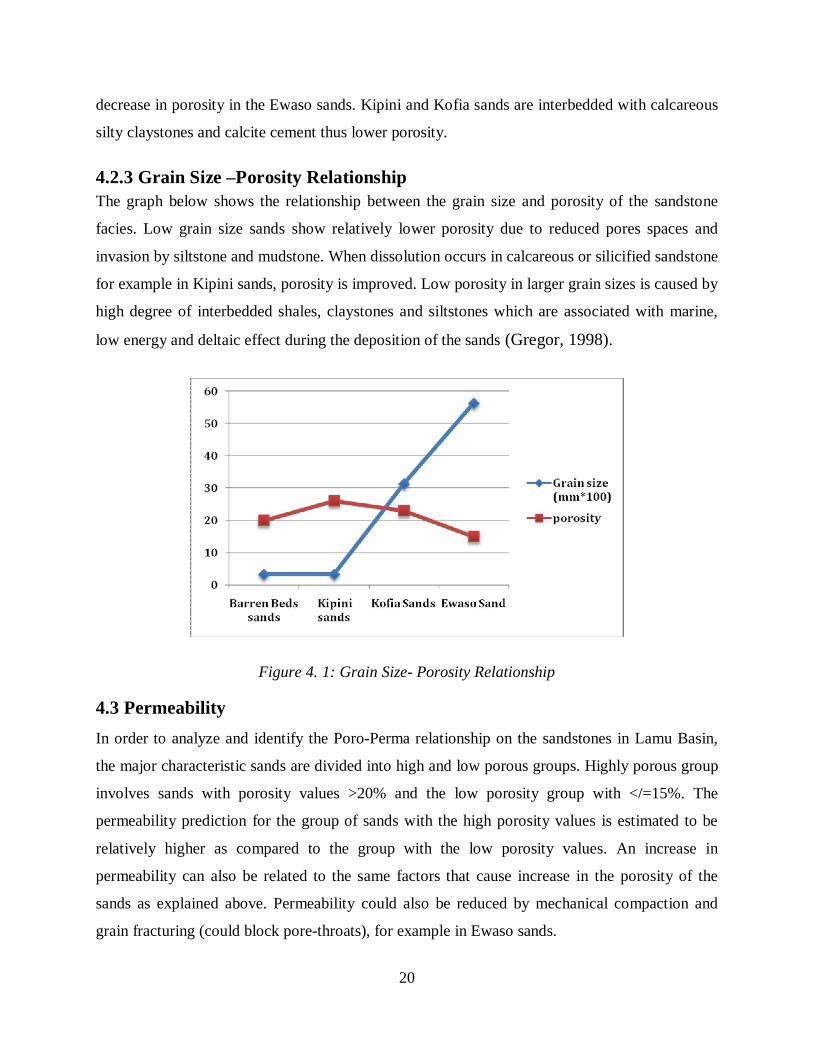
4.2.3 Grain Size –Porosity Relationship The graph below shows the relationship between the grain size and porosity of the sandstone
facies. Low grain size sands show relatively lower porosity due to reduced pores spaces and
invasion by siltstone and mudstone. When dissolution occurs in calcareous or silicified sandstone
for example in Kipini sands, porosity is improved. Low porosity in larger grain sizes is caused by
high degree of interbedded shales, claystones and siltstones which are associated with marine,
low energy and deltaic effect during the deposition of the sands (Gregor, 1998).
Figure 4. 1: Grain Size- Porosity Relationship
4.3 Permeability In order to analyze and identify the Poro-Perma relationship on the sandstones in Lamu Basin,
the major characteristic sands are divided into high and low porous groups. Highly porous group
involves sands with porosity values >20% and the low porosity group with </=15%. The
permeability prediction for the group of sands with the high porosity values is estimated to be
relatively higher as compared to the group with the low porosity values. An increase in
permeability can also be related to the same factors that cause increase in the porosity of the
sands as explained above. Permeability could also be reduced by mechanical compaction and
grain fracturing (could block pore-throats), for example in Ewaso sands.
21
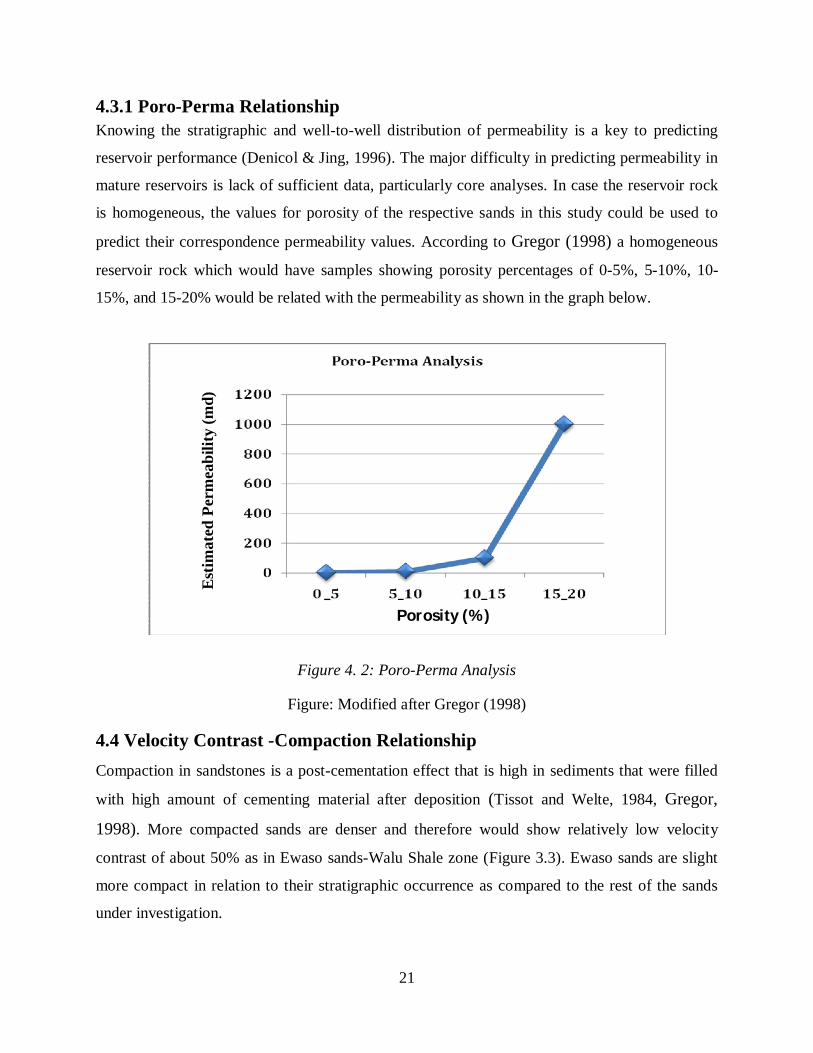
4.3.1 Poro-Perma Relationship Knowing the stratigraphic and well-to-well distribution of permeability is a key to predicting
reservoir performance (Denicol & Jing, 1996). The major difficulty in predicting permeability in
mature reservoirs is lack of sufficient data, particularly core analyses. In case the reservoir rock
is homogeneous, the values for porosity of the respective sands in this study could be used to
predict their correspondence permeability values. According to Gregor (1998) a homogeneous
reservoir rock which would have samples showing porosity percentages of 0-5%, 5-10%, 10-
15%, and 15-20% would be related with the permeability as shown in the graph below.
Figure 4. 2: Poro-Perma Analysis
Figure: Modified after Gregor (1998)
4.4 Velocity Contrast -Compaction Relationship Compaction in sandstones is a post-cementation effect that is high in sediments that were filled
with high amount of cementing material after deposition (Tissot and Welte, 1984, Gregor,
1998). More compacted sands are denser and therefore would show relatively low velocity
contrast of about 50% as in Ewaso sands-Walu Shale zone (Figure 3.3). Ewaso sands are slight
more compact in relation to their stratigraphic occurrence as compared to the rest of the sands
under investigation.
Estim
ated
Per
mea
bilit
y (m
d)
Porosity (%)

22
CHAPTER FIVE: DISCUSSION, CONCLUSION AND
RECOMMENDATIONS
5.1 Discussion The result of the grain size analyses show that the sandstones facies in Lamu Basin are generally
poorly sorted, medium to coarse grained indicating abrasion and rapid deposition (Friedman,
1979) in short distances. Kipini sand and Barren Beds resulted from fluvial deposition. They
both have desirable porosity of 26% and 20% respectively. The absolute porosity of the Kofia
sands is 23% higher than Ewaso sands with 15% probably due to increased overburden. There
exists an excellent correlation between porosity and grain size because sandstones have distinct
characteristics related to their respective depositional sequence, mode of formation and alteration
of the original porosity. Siltation and shaliness have a great effect in decreasing the porosity and
permeability. Compaction effects are negligible since it affects the whole formation to
approximately the same degree. In well sorted sandstones both compaction and overgrowth have
virtually the same effect on permeability as a function of porosity (Bryant and Blunt, 1992).
Calcareous sandstones are massively affected by dissolution which in turn widens up the pore
spaces thus higher porosity and permeability. High velocity contrasts between the sands and
other related facies imply varied degree of compaction and densities of the rocks.
5.3 Conclusion Sandstones in Lamu Basin show excellent characteristics of a potential reservoir rock for the
hydrocarbon and other fluids. The objectives of the study were met since the investigation of the
reservoir sedimentological characteristics (texture, grain size, and thickness), petrophysical
properties (porosity, permeability, and velocity contrasts in relation to other rocks in the basin)
and their relationships to the current performance of the sands have been done.
5.4 Recommendations and Further Study However lack of adequate information on permeability has caused uncertainty in analysis.
Permeability is an essential property to be considered in determination of yield of a potential
reservoir rock. There is need re-examine and carry out a clear and intensive study on
petrophysical properties and their sedimentological interpretations. This would help to evaluate

23
and correlate the performance and productivity of the reservoir rocks in Lamu Basin and other
sedimentary basins occurring in Kenya. More exploration into different well log classification
methods for instance, reservoir quality index is required.

24
REFERENCES BEGG, S. H., CARTER, R. R. & DRANFIELD, P., 1989 Assigning Effective Values to
simulator gridblock parameters for heterogeneous reservoirs. Reservoir Engineering, 4, 455-463.
BEICIP, 1982. Petroleum Potential of Eastern Kenya: Seismic, Aeromagnetic, Gravity,
Geophysical and Geochemistry Surveys, Integrated Report available at National Oil Corporation
of Kenya, pp 104-165.
BERG, R., 1970. Method of Determinating Permeability from Reservoir Rock Properties.
Transactions, Gulf Coast Association of Geological Societies, 20, p.303-317
BOSELLINI, A., 1986. East African Continental Margins. Geology, 19: pp. 76-78.
BRYANT, S and BLUNT, M., 1992. Prediction of relative permeability in simple porous media.
Physical Review, 46, p. 2004-2007
BURLEY, S. D. and KANTOROWICZ, J. D., 1986. Clastic Diagenesis. Sedimentology, 33, p.
587-604
CANNON, R. T., SIAMBI, W.M.N.S. and KARANJA, F.M., 1981. The Proto-Indian Ocean as a
probable Paleozoic/ Mesozoic tri-radial rift system in East Africa. Earth Planet. Sci. Lett., 52:
419-426.
CANT, D. J. and WALKER, R. G. 1976. Development of a Braided-Fluvial Facies Model for the
Devonian Battery Point Sandstone, Earth Science, 13, pp. 102-119. Quebec: Canada.
CASWELL, P.V., 1953. The Geology of Mombasa-Kwale Area. Geological Survey of Kenya,
Pb. 24, pp. 54.
CASWELL, P.V., 1956. Geology of the Kilifi-Mazeras Area. Geological Survey of Kenya,
Republished. 34, pp. 34
COFFIN, M. F. and RABINOWITZ, P.D., 1988. Evolution of the conjugate East African-
Madagascan margins and the Western Somali Basin. Pap. 226, p. 78

25
DENICOL, P. S. and JING, X. D., 1996. Estimating permeability of reservoir rocks from
complex resistivity data. SPWLA, 37th Annual Logging Symposium, 1996
DOVETON, J. H., 1994. Geologic Log Interpretation, Tulsa, Pb. 169 pp. 22- 35
EBINGER, C. J. and YOUNG, C.J., 1993. Subsidence and Gravity Analyses of the Lamu
Embayment. University of Leeds, Report submitted to the National Oil Corporation of Kenya,
pp. 35-40.
FRIEDMAN, G. M., 1979: Sedimentology, Springer-Verlag, New York. vol. 26, pp. 13 – 32.
FUCHTBAUER, H., 1974. Sediments and Sedimentary Rocks. Sedimentary Petrology Part II.
Stuttgart.
GREGOR, B., 1998. Sedimentological and Petrophysical Characterization of the Lochaline
Sandstone, Upper Cretaceous. Published M.sc. Thesis. NW Scotland, University of Tübingen.
pp. 36-58.
GUEGUEN, Y. and PALCIAUSKAS, V., 1994. Introduction to the Physics of Rocks. Princeton
University Press, West Sussex.
HOLLAND, M., 2004. Global Oil Status. Available online at:
http//www.worldeconomicforcast/html
INTERNATIONAL COMMISSION ON STRATIGRAPHY (ICS) 2009 "Chronostratigraphic
Units" International Stratigraphic Guide; (2009) Paper. Available online at
http//www.ics/isg/html., Accessed on 14-MAR-2011.
KAMEN-KAYE, M. and BARNES, S. U., 1978. Exploration outlook for Somalia, coastal Kenya
and Tanzania, International Oil Gas Journal, vol. 76: pp. 80-84.
KAMEN-KAYE, M. and BARNES, S.U., 1979. Exploration Geology of Northeastern Africa-
Seychelles Basin. Journal of Petroleum Geology, 2(1): pp. 23-45.
KAMEN-KAYE, M., 1978. Permian to Tertiary Faunas and Paleogeography: Somalia, Kenya,
Tanzania, Mozambique, Madagascar, South Africa. Journal of Petroleum Geology, 1(1): pp. 79-
26
101.
KARANJA, F. M., 1982. Report on the geology of the Kilifi, Gede and Sokoke area. Published
M.Sc. Thesis. p. 32. Geological Survey of Kenya, Nairobi: Kenya.
KARANJA, S.W., 1988. A Sedimentologic and Stratigraphic Study of Carboniferous through
Jurassic Strata of East Kenya. Unpublished M.Sc. Thesis, University of Windsor, Ont., 207 pp.
KENT, P. E., 1965. An Evaporite Basin in Southern Tanzania. In: Salt Basins Around Africa,
Proceedings of the Joint Meeting of the Petroleum and Geological Societies, London, 3 March
1965, pp. 41-65.
KENT, P. E., 1972. Mesozoic History of the East Coast of Africa. Nature, 238: pp. 147-148.
KENTING EARTH SCIENCE 1982. Regional Stratigraphic and structural Framework of Karoo
Rocks and their Equivalents in East Africa and Madagascar. Published Report. pp. 40-62
National Oil Corporation of Kenya.
LEVORSEN, A. I., 1965 Geology of Petroleum: Reservoir Pore Space, 2nd Edition, CBS
Publishers & Distributors Pvt. Ltd, New Delhi
MARTIN, A. J., SOLOMON, S. T. and HARTMANN, D. J., 1997. Characterization of
petrophysical flow units in carbonate reservoirs. American Association of Petroleum Geologists
Bulletin, v. 81, No.5, pp. 734- 759.
MUTUNGUTI, F., 1988. Kerogen Analysis of Sediments in Lamu Embayment of Kenya.
Unpublished M.sc. Thesis. pp. 7-10. National Oil Corporation of Kenya.
NATIONAL OIL CORPORATION OF KENYA (NOCK) 1995. Integrated Report:
Hydrocarbon Potential of Kenya. National Oil Corporation of Kenya.
NYAGAH, K., 1988. A Sedimentologic and Stratigraphic Study of Cretaceous through Tertiary
Strata of East Kenya. Unpublished MSc. Thesis, University of Windsor, Ont., 207 pp.
NYAGAH, K., 1995. “Stratigraphy, depositional history and environments of deposition of
Cretaceous through Tertiary strata in the Lamu Basin, southeast Kenya and implications for
27
reservoirs for hydrocarbon exploration”. Sedimentary Geology. National Oil Corporation of
Kenya, Nairobi, Kenya, pp. 43-71
PATTERSON, M. S., 1983. The equivalent channel model for permeability and resistivity in
fluid-saturated rock - a reappraisal. Mechanics of Materials, 2, pp. 345-352.
PETTIJOHN, F. P., POTTER, P.E. and SIEVER, R., 1987. Sands and Sandstones. Springer-
Verlag, New York.
PITTMAN, E. D., 1992. Relationship of porosity and permeability to various parameters derived
from mercury injection capillary pressure curves for sandstone. The American Association of
Petroleum Geologists Bulletin (AAPG), 76, p.191-198
REEVES, C.V., KARANJA, F. M. and MACLEOD, I. N., 1986. Geophysical evidence for a
Jurassic Triple-Junction in Kenya. Earth Planet. Science. pb. 81: 299-311.
REVIL, A. and GLOVER, P.W.J., 1997. Theory of ionic-surface electrical conduction in porous
media. Physical Review Bulletin, 55, pp.1757-1773.
TISSOT, B. P., and WELTE, D. H., 1984. Petroleum Formation and Occurrence. 2nd Edition,
Springer-Verlag, Berlin Heidelberg, N.Y.
VAN BAAREN, J. P., 1979. Quick-look permeability estimates using sidewall samples and
porosity logs. 6th Annual European Logging Symposium of the Society of Professional Well Log
Analysists. Available online at: http://www.elsspwla/permeability.html. Accessed on 13th April,
2011.
VASQUEZ, G. F., L. DILLON, C. VARELA, G. NETO, R. VELLOSO, and C. NUNES, 2004.
Elastic log editing and alternative invasion correction methods, The Leading Edge, Vol. 23, No.
1, pp. 20-25.
VON ENGELHART, W., 1967. Interstitial solutions and diagenesis in sediments. In: Diagenesis
in Sediments. (Eds.: Larsen, G and Chilingar, G.W.). Elsevier, Amsterdam.
WAITERS, L. and LINTON, E. R., 1973. The sedimentary basin of coastal Kenya. In: G. Blant

28
(Editor), Sedimentary Basins of the African Coasts, Part 2. South and East Coast. Association of
African Geological Surveys, Paris, pp. 133- 158.
WALLS JOEL D, and CARR M. B., 2001. The Use of Fluid Substitution Modeling for
Correction of Mud Filtrate Invasion in Sandstone Reservoirs, 71st Annual Meeting of Society of
Exploration Geophysicists, San Antonio, TX.
WASHBURN, E.W., 1921. Note on a method of determining the distribution of pore sizes in a
porous material. Proceedings of the National Academy of Science, 7, p.115-116.
WENTWORTH, C. K., 1922. Journal of Geology. Vol. 30, pp. 377 – 392.
WESTERN ATLAS INTERNATIONAL (W.A.I) 1990. The Hydrocarbon potential of Kenya,
Seismic Investigation, petrophysical analysis and synthetic seismograms. Unpublished
Geological Report. Available at National Oil Corporation of Kenya.
WILSON, J. C. and MCBRIDGE, E. F., 1988. Compaction and porosity evolution of Pliocene
sandstones, Ventura Basin, California. AAPG Bulletin, 72, pp.664-681.
WRIGHT, J. B. and PIX, P., 1967. Evidence of trough faulting in Eastern Central Kenya.
Institute of Geological Science. Overseas Geological Miner. Resource, 10: 30-41.

29
APPENDICES
Appendix I: A List of Wells Drilled In Kenyan Sedimentary Basins
Source: NOCK Library
Related Documents