Final Results
Presentation
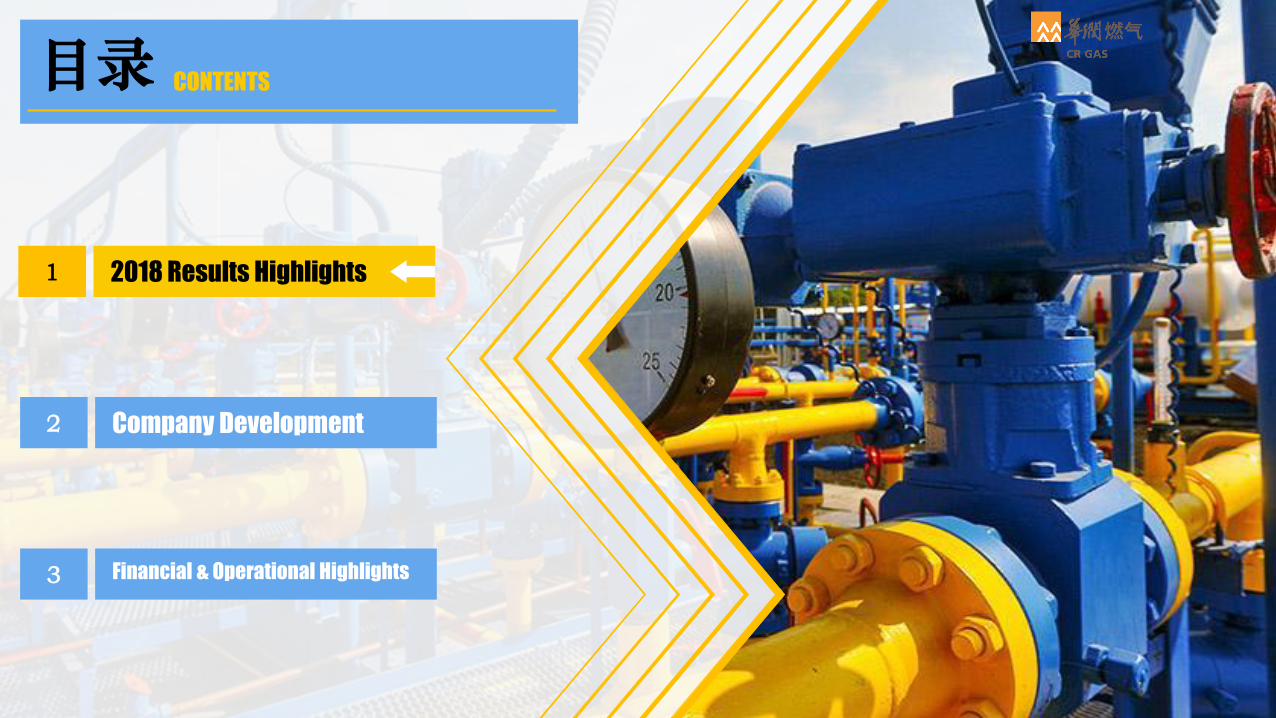
目录 CONTENTS
2018 Results Highlights1
Company Development2
Financial & Operational Highlights3
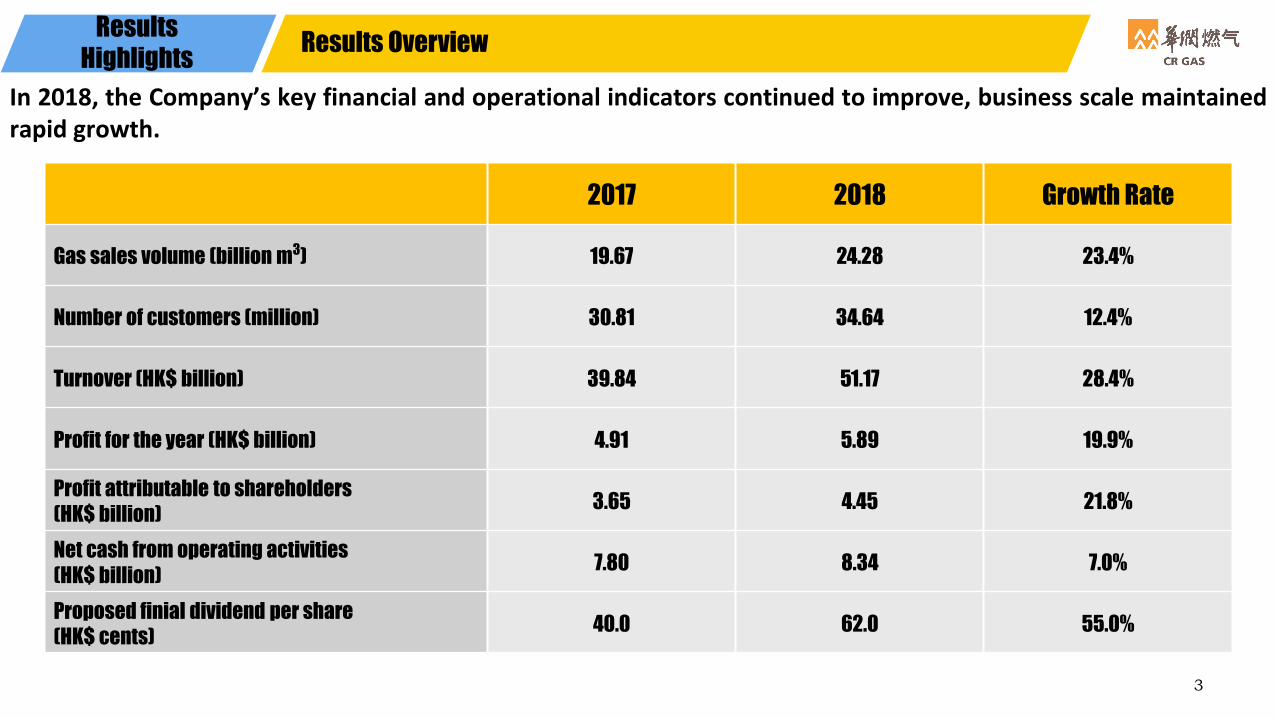
Results
HighlightsResults Overview
In 2018, the Company’s key financial and operational indicators continued to improve, business scale maintainedrapid growth.
3
2017 2018 Growth Rate
Gas sales volume (billion m3) 19.67 24.28 23.4%
Number of customers (million) 30.81 34.64 12.4%
Turnover (HK$ billion) 39.84 51.17 28.4%
Profit for the year (HK$ billion) 4.91 5.89 19.9%
Profit attributable to shareholders
(HK$ billion)3.65 4.45 21.8%
Net cash from operating activities
(HK$ billion)7.80 8.34 7.0%
Proposed finial dividend per share
(HK$ cents)40.0 62.0 55.0%
30.81
34.64
2017 2018
19.67 24.28
2017 2018
39.84 51.17
2017 2018
Results
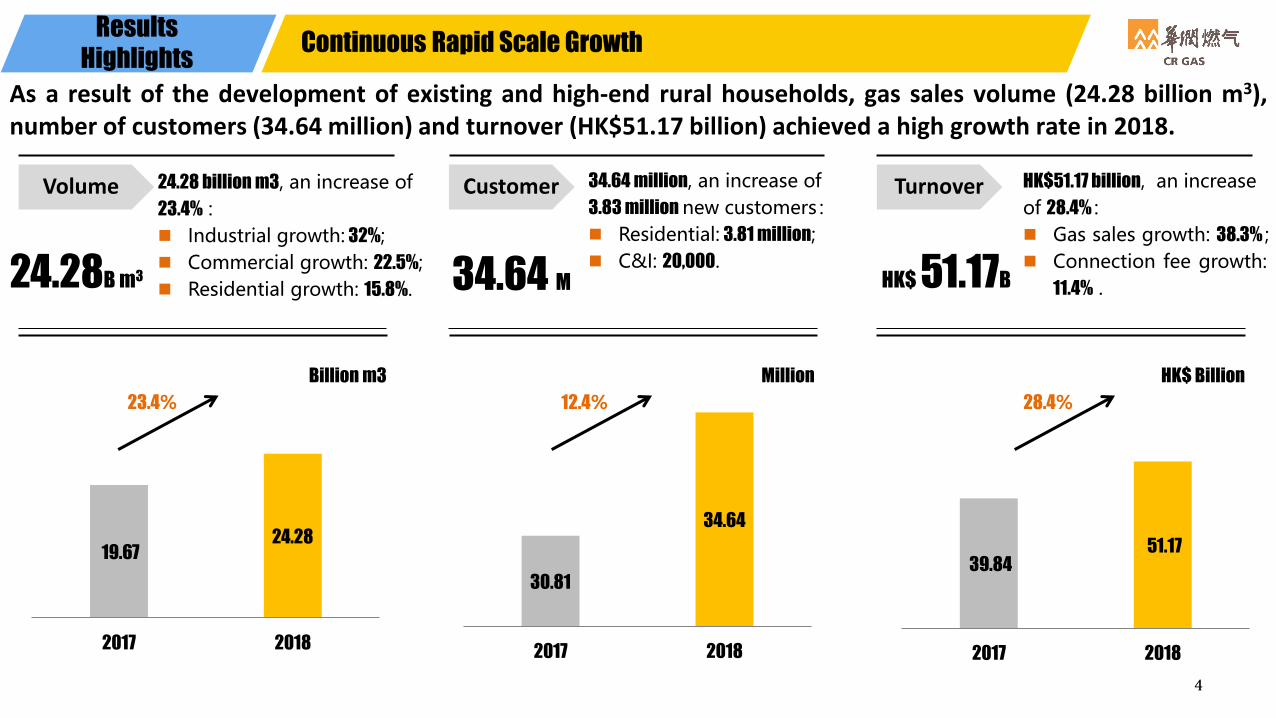
HighlightsContinuous Rapid Scale Growth
4
As a result of the development of existing and high-end rural households, gas sales volume (24.28 billion m3),number of customers (34.64 million) and turnover (HK$51.17 billion) achieved a high growth rate in 2018.
23.4% 12.4%
Billion m3
24.28 billion m3, an increase of
23.4% :
Industrial growth: 32%;
Commercial growth: 22.5%;
Residential growth: 15.8%.
34.64 million, an increase of
3.83 million new customers:
Residential: 3.81 million;
C&I: 20,000.
HK$51.17 billion, an increase
of 28.4%:
Gas sales growth: 38.3%;
Connection fee growth:
11.4% .
28.4%
Volume
24.28B m3
Customer
34.64 M
Turnover
HK$ 51.17B
Million HK$ Billion

3.65 4.45
2017 2018
Results
HighlightsSustainable Earning & Return Growth
5
In 2018, profit attributable to shareholders reached HK$4.45 billion, an increase of 21.8%; net cash flow fromoperating activities continued to increase to HK$8.34 billion.
Net Profit
HK$ 4.45 B
Profit attributable to
shareholders of
HK$4.45 billion, an
increase of 21.8%;
EPS of HK$2.04, an
increase of 21.4%.
21.8%HK$ Billion
7.0%HK$ Billion
Net cash from
operating
activities
amounted to
HK$8.34 billion, an
increase of 7.0%.
Cash Flow
HK$ 8.34 B
7.80
8.34
2017 2018

Results
HighlightsIncrease in Proposed Dividend
6
2018 proposed total dividend is HK$0.77 per share, dividend payout ratio increase from 33% in 2017 to 38% in2018, dividend amount increase 40%.
Proposed final
dividend is
HK$0.62, total
dividend is HK$0.77,
an increase of 40%;
Payout ratio: 38%.
2018 Dividend
HK$ 77 cents
40%HK$ cent
55
77
2017 2018
2017 2018
Basic EPS (HK$) 1.68 2.04
2018 Total dividend per
share (HK$)0.55 0.77
Dividend payout rate 33% 38%
Stable Growth in Dividend Payout
2018 interim dividend paid was HK$0.15 per share and proposed final
dividend is HK$0.62 per share;
2018 proposed total dividend is HK$0.77 per share , an increase of HK$0.22 per
share or 40% over the HK$0.55 per share in 2017.

Results
HighlightsSuperior Business Structure
7
CR Gas continued to optimize its business structure in 2018, gas sales revenue proportion increased 5.6ppt to78.6%, driven by the rapid growth of commercial and industrial gas sales volume.
Increase in Gas Sales Revenue Proportion
Recurring gas sales revenue
increased from 73.0% to 78.6%.
Growth in gas sales volume is mainly driven by the rapid growth of higher
margin commercial and industrial customers.
Optimization in Gas Sales Volume Mix
Growth Rate
73.0%
78.6%
2017 2018
32.0% 22.5% 5.1% 5.5%15.8%
47.7
86.4
44.5
14.2 3.9
55.2
114.1
54.5
14.9 4.1
Residential Industrial Commercial CNG Station LNG Station
2017 2018

8
Results
HighlightsSustainable Scale Growth in the Past 10 Years
In the past 10 years from 2008 to 2018, CR Gas continued to grow rapidly. CAGR of volume, customer andturnover reached 33%, 32% and 33% respectively.
Increased from 1.4 billion
m3 in 2008 to 24.3 billion
m3 in 2018, 10-years
CAGR reached 33%.
Volume CustomerIncreased from 2.2 million
in 2008 to 34.63 million in
2018, 10-years CAGR
reached 32%.
TurnoverIncreased from HK$3.0
billion in 2008 to HK$51.2
billion in 2018, 10-years
CAGR reached 33%.
14 22
56 72
93
121 133
149 163
197
243
20
08
20
09
20
10
20
11
20
12
20
13
20
14
20
15
20
16
20
17
20
18
220 342
8761050
1403
18602090
23612649
3081
3464
20
08
20
09
20
10
20
11
20
12
20
13
20
14
20
15
20
16
20
17
20
18
30 37 83
135
196 223
287 311 329
398
512
20
08
20
09
20
10
20
11
20
12
20
13
20
14
20
15
20
16
20
17
20
18
CARG: 33% CAGR: 32% CARG: 33%
HK$ Hundred MillionHundred Million m3 Ten Thousand

9
Results
HighlightsSustainable Earnings Growth in the Past 10 Years
Profitability continued to growth in the past 10 years, profit attributable to shareholders increased from HK$300million to HK$4.45 billion; total dividend increased from HK$4 cents to HK$77 cents.
Net ProfitIncreased from HK$4 cents
in 2008 to HK$77 cents
(proposed) in 2018
Dividend
Increased from HK$ 300
million in 2008 to HK$4.45
billion in 2018, 10-years
CAGR reached 31%.
CAGR: 31%
HK$ Hundred Million HK$ cent
4 6.510 12
1622
25
33
45
55
77
20
08
20
09
20
10
20
11
20
12
20
13
20
14
20
15
20
16
20
17
20
18
3.0 4.4 7.3
12.0
16.5
21.6 24.8
28.4
32.9 36.5
44.5
20
08
20
09
20
10
20
11
20
12
20
13
20
14
20
15
20
16
20
17
20
18

Results
HighlightsThe Best Credit Rating
10
In 2018, international credit rating agencies Moody’s, Standard & Poor’s and Fitch Ratings upgraded CR Gas creditrating to A3, A- and A- respectively, the highest rating granted to the Chinese city gas operators.
Upgrade
Grade A
February 2018, Moody’s upgraded CR Gas credit rating from Baa1 to A3,the highest rating granted to the
Chinese city gas operators;it affirmed CR Gas sustainable growth and outstanding performance;
June & July 2018, S&P and Fitch Ratings issued reports to upgrade CR Gas credit rating to A-;
Credit rating upgrade will further enhance CR Gas financing capacity for future development and
expansion.
Stable
Stable
Stable
Baa1 A3
BBB+
BBB+
A-
A-

目录 CONTENTS
2018 Results Highlights1
Company Development2
Financial & Operational Highlights3
Company
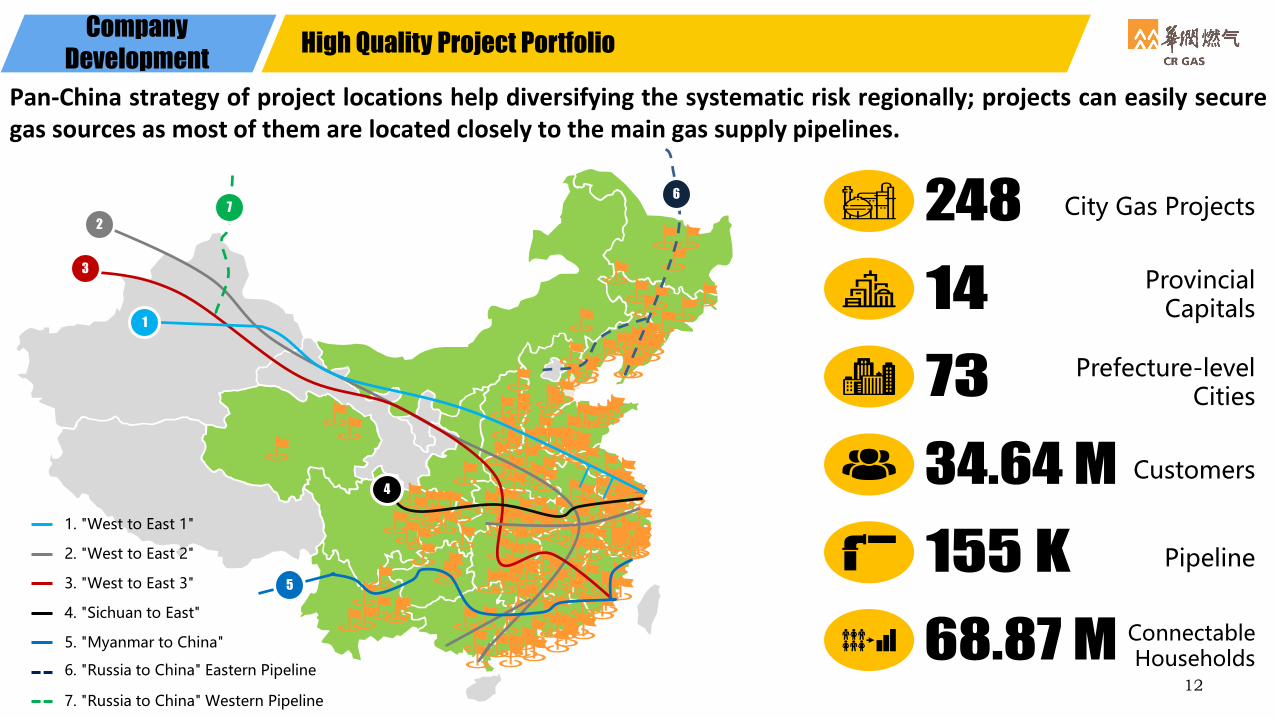
DevelopmentHigh Quality Project Portfolio
Pan-China strategy of project locations help diversifying the systematic risk regionally; projects can easily securegas sources as most of them are located closely to the main gas supply pipelines.
1
2
3
5
4
67
1. "West to East 1"
2. "West to East 2"
3. "West to East 3"
4. "Sichuan to East"
5. "Myanmar to China"
6. "Russia to China" Eastern Pipeline
7. "Russia to China" Western Pipeline
City Gas Projects
Provincial Capitals
Prefecture-level Cities
Customers
Pipeline
Connectable Households
12

Company
DevelopmentNew Investment in 2018
New projects in 2018
Group Level Location Project Level Location
马山工业园 江苏省 郑州物流园 河南郑州
惠山智慧能源 江苏省 富川县 广西贺州
宿迁洋河新区 江苏省 镇江公交新能源 江苏镇江
汕头潮阳区 广东省 衡水鸿华燃气 河北衡水
江阴高压管网 江苏省 峰峰平安燃气 河北邯郸
阳山县 广东省 昆明天然气管网 云南昆明
邹城市 山东省 四川空港燃气 四川成都
南宁市武鸣区 广西省 乐都工业园 青海乐都
普宁市纺织工业园 广东省 枣庄高新区 山东枣庄
重庆分布式能源 重庆市Group Level
Project Level
M&A Capex:
HK$1.49 billion
Concession area
added: 10,000 km2
New customers:
600,000
Annual additional
gas sales: 130 M m3
In 2018, 10 new projects were set up at group level, 9 new projects at project level, total investment was HK$1.49billion, representing a new concession area of 10,000 km2, 600,000 new customers and addition gas sales volumeof 130 million m3 per year.
13
Company
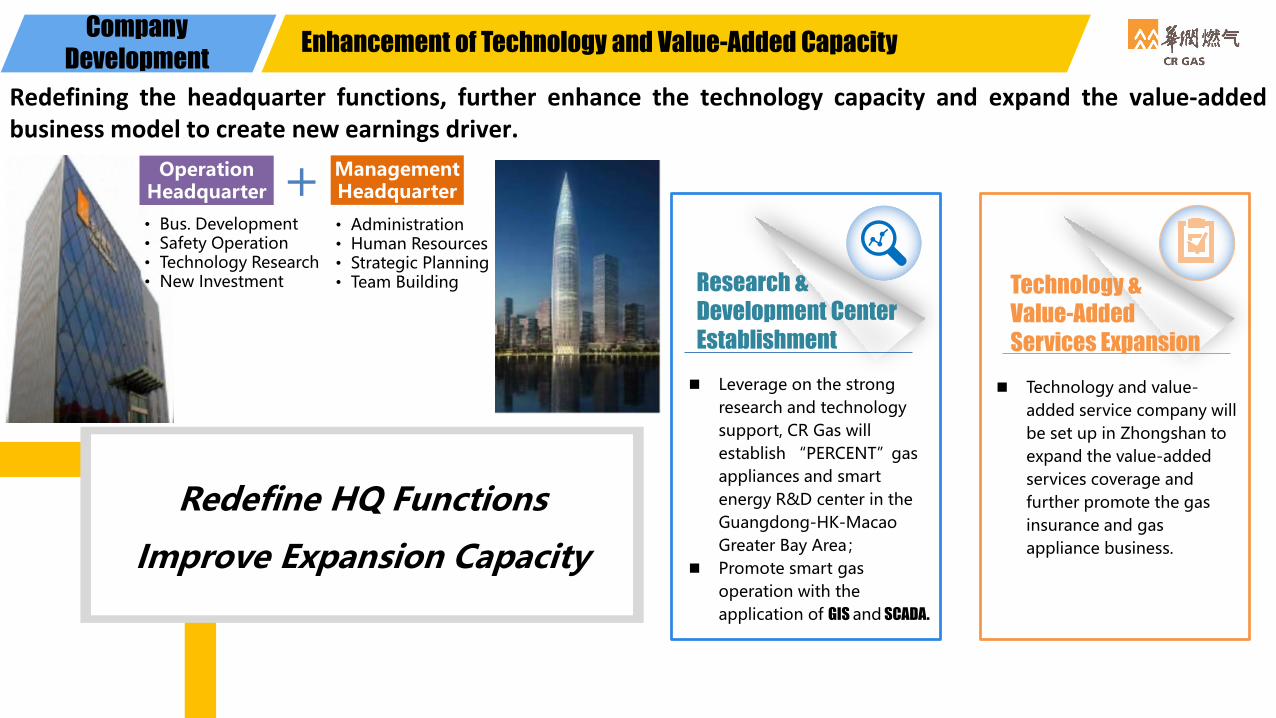
DevelopmentEnhancement of Technology and Value-Added Capacity
Redefining the headquarter functions, further enhance the technology capacity and expand the value-addedbusiness model to create new earnings driver.
Research &
Development Center
Establishment
Leverage on the strong
research and technology
support, CR Gas will
establish “PERCENT”gas
appliances and smart
energy R&D center in the
Guangdong-HK-Macao
Greater Bay Area;
Promote smart gas
operation with the
application of GIS and SCADA.
Lorem ipsum dolor sit
Lorem ipsum dolor sit
Lorem ipsum dolor sit
Technology &
Value-Added
Services Expansion
Technology and value-
added service company will
be set up in Zhongshan to
expand the value-added
services coverage and
further promote the gas
insurance and gas
appliance business.
Redefine HQ Functions
Improve Expansion Capacity
• Administration• Human Resources• Strategic Planning• Team Building
Management Headquarter
• Bus. Development• Safety Operation• Technology Research• New Investment
Operation Headquarter

Company
DevelopmentEnrichment of Industrial Value Chain
Leverage on the core city gas business, CR Gas will develop through the value chain to enrich the business model.5 midstream pipeline companies have been invested in order to expand the service coverage in the cities.
Upstream
Terminal
(Exploring)
Midstream
Pipeline
5 midstream pipeline companies
In Jiangsu, Zhejiang and Yunnan
provinces
City Gas
Gas Appliance
Charging Post
Gas InsuranceDownstream
Continue to
expand city
gas service
coverageGas
MeterDistributed
Energy
15

Company
DevelopmentExploring Integrated Energy Service Model
Actively invest in the distributed energy projects, 6 new projects were signed in 2018, total investment of HK$1.07 billion. Atotal of 23 projects were signed, total designed capacity is 287MW; 30 gas-heat projects with steam sold of 140,000 ton/year.
Ind
ust
rial
Park
Co
mm
erc
ial
Co
mp
lex
Pro
du
ctio
n
Base
Steadily Tap into the Distributed Energy Market
6 Projects signed in 2018:
Yueyang:Hospital
Shenzhen:Eco-Recreation
Park
Nanjing:Airport &
Industrial Park
Puning: Textile Industrial
Park
Chongqing: Hospital
Chongqing: Green Industrial
Park
Projects signed or in
operation:23
Designed capacity:287MW
Develop the Gas-Heat Integrated Projects
Extend from gas distribution to value-added heat
distribution:
Industrial gas-heat projects:4
• Steam:140,000 ton/year• Gas volume equivalent:10.80 million m³
Commercial heat projects:9
• Gas volume equivalent:1.96 million m³
Residential heat projects:17
• Gas volume equivalent:16.84 million m³
16

Company
DevelopmentExpanding Value-Added Business
In 2018, vehicle charging companies have been set up in Hangzhou and Nanjing, scale of value-added businesscontinue to expand.
Exploring New Energy Opportunities
38 vehicle charging stations in Hangzhou and Nanjing are in operation.
• Electric public bus served:1500 buses
• Annual electricity consumption:62 million
units
• Operating profit:HK$16.5 million
• Zhenjiang and Yueyang start operationin 2019.
Suzhou and Nanchang:Pilot cities to transformexisting gas stationsto chargingstations.
Gross Gas Appliance Revenue:
HK$770MHK$740 M
Gross Gas Insurance Revenue:
Gross Other Value-added Revenue:
HK$190MHK$90 M
HK$590MHK$320 M
17

目录 CONTENTS
2018 Results Highlights1
Financial & Operational Highlights3
Company Development2

Financial
HighlightsKey Financial Information (1)
Note: (1) Basic earnings per share is calculated based on weighted average number of issued shares, excluding restricted award shares held by trustee.
As at 31 Dec 2018 31 Dec 2017 Increase/(Decrease)
HK$’000 HK$’000
Turnover 51,165,371 39,837,597 28.4%
Gross profit 13,621,728 11,915,789 14.3%
Profit from operation(before finance costs and share of JVs & associates results)
7,530,060 6,305,062 19.4%
Profit for the year 5,888,411 4,910,867 19.9%
Profit attributable to the equity holders 4,450,101 3,653,994 21.8%
Net cash from operating activities 8,341,530 7,796,322 7.0%
Basic EPS (1) (HK$) 2.04 1.68 21.4%
Interim and proposed finial dividend per share
(HK$ cents)77 55 40.0%
19

Financial
HighlightsKey Financial Information (2)
As at 31 Dec 2018 31 Dec 2017 Increase/(Decrease)
HK$’000 HK$’000
Total assets 73,571,778 68,763,804 7.0%
Bank balance and cash 10,392,696 10,355,981 0.4%
Total bank, note and other borrowings 11,638,022 11,366,719 2.4%
Net borrowings 1,245,326 1,010,738 23.2%
Equity attributable to the equity holders 24,081,120 21,992,648 9.5%
Non-controlling interests 7,527,360 7,176,677 4.9%
Total equity 31,608,480 29,169,325 8.4%
20

Financial
HighlightsKey Financial Information (3)
Notes: (1) Debt/capitalization gearing ratio is the ratio of total bank, note and other borrowings to total bank, note and other borrowings and total equity
(2) Debt/asset gearing ratio is the ratio of total bank and note borrowings to total assets
Financial Indicators 31 Dec 2018 31 Dec 2017 Increase/(Decrease)
Gross profit margin 26.6% 29.9% (3.3ppt)
Net profit margin 11.5% 12.3% (0.8ppt)
Net profit margin attributable to owners of the
Company8.7% 9.2% (0.5ppt)
Debt to capitalization ratio (1) 26.9% 28.0% (1.1ppt)
Debt to asset ratio (2) 15.8% 16.5% (0.7ppt)
Return on equity 18.5% 16.6% 1.9ppt
21

Financial
HighlightsKey Business Information
73.0%
22.4%
1.0% 3.6%
78.6%
19.4%
0.7% 1.3%
Gas sales Connection fee Gas appliances Design &
Construction2017 2018
Revenue
29,082
40,209
8,927 9,943
2017 2018
Gas sales Connection fee
Gas Sales & Connection Revenue
38.3%
11.4%
Gas Sales Volume
12.1% 7.8%
19.4% 22.4%
27.4% 22.7%
41.1% 47.0%
2017 2018
Industrial
Residential
Commercial
Gas station
Residential Customer
30,568,361
34,376,106
2017 2018
12.5%
Household
22

Financial
HighlightsKey Cost Information
479
460 1.2%
0.9%
0.8%
0.9%
1.0%
1.1%
1.2%
100
200
300
400
500
2017 2018
As a % of revenue
Finance Costs
HK$ Million
6,781
7,421
17.0%
14.5%
13.0%
14.0%
15.0%
16.0%
17.0%
18.0%
6,400
6,600
6,800
7,000
7,200
7,400
7,600
2017 2018
As a % of revenue
Total Costs
HK$ Million
3,734
4,132 9.4%
8.1%
7.0%
7.5%
8.0%
8.5%
9.0%
9.5%
3,400
3,600
3,800
4,000
4,200
2017 2018
As a % of revenue
Selling & Distribution Expenses
HK$ Million
2,567
2,830
6.4%
5.5%
5.0%
5.2%
5.4%
5.6%
5.8%
6.0%
6.2%
6.4%
6.6%
2,400
2,450
2,500
2,550
2,600
2,650
2,700
2,750
2,800
2,850
2017 2018
As a % of revenue
General & Administrative Expenses
HK$ Million
23

Financial
HighlightsCapital Structure
HK$’000 %
Total equity 31,608,480 73.1%
Total bank, note & other borrowing 11,638,022 26.9%
Total capital 43,246,502 100.0%
Equity& Debt
HK$’000 %
Less than 1 year 5,563,132 47.8%
1-2 years 8,983 0.1%
2-5 years 5,854,586 50.3%
More than 5 years 211,321 1.8%
Total 11,638,022 100.0%
Long & Short Term Borrowings
HK$’000 %
Floating rate 5,554,150 47.7%
Fixed rate 6,083,872 52.3%
Total 11,638,022 100.0%
Fixed & Floating Borrowings
24
73.1%
26.9%Total equity
Borrowings
47.8%
0.1%
50.3%
1.8%
Less than 1 year
1-2 years
2-5 years
More than 5 years
47.7%
52.3%
Floating rate
Fixed rate

Operational
HighlightsKey Operational Information (1)
As at 31 Dec 2018 As at 31 Dec 2017 Change
Number of projects 248 238 10
Connectable householders (million) 68.87 62.86 6.01
Connectable population (million) 206.61 188.58 18.03
Penetration rate of residential household 50.3% 48.4% 1.9ppt
Gross gas sales volume (million m3) 24,278 19,667 23.4%
Residential 5,522 4,767 15.8%
Industrial 11,406 8,644 32.0%
Commercial 5,449 4,448 22.5%
CNG station 1,490 1,418 5.1%
LNG station 412 390 5.5%
Average gas tariff / cost / gross margin
(RMB per m3)2.68/2.08/0.60 2.62/2.04/0.58 0.06/0.04/0.02
25

Operational
HighlightsKey Operational Information (2)
As at 31 Dec 2018 As at 31 Dec 2017 Change
Total length of pipeline (km) 155,076 145,522 9,554
Connected customers 34,642,424 30,810,018 3,832,406
Residential 34,376,106 30,568,360 3,807,746
Industrial 18,285 15,224 3,061
Commercial 248,032 226,434 21,598
Average residential connection fee (RMB) 2,892 2,940 (48)
New residential with paid connection fee
Gross 3,224,555 2,996,077 228,478
Consolidated basis 2,243,015 2,078,327 164,688
Gas stations (CNG/LNG/L-CNG) 359 (229/85/45) 349 (227/79/43) 10 (2/6/2)
For Investor Enquiries:
Mr. K.F. CHANG Tel: 2593 8213Ms. Bei WANG Tel: 2593 8209
Fax: +852 2598 8228 E-mail: [email protected]: www.crcgas.com
Disclaimer and Contact
This presentation and subsequent discussion may contain certain forward-looking statements, including statementsregarding our intent, belief or current expectations with respect to China Resources Gas (CR Gas)’s businesses andoperations, market conditions, results of operation and financial condition, capital adequacy, specific provisions andrisk management practices. Readers are cautioned not to place undue reliance on these forward looking statements inrelation to holding, purchasing or selling securities or other financial products or instruments. CR Gas does notundertake any obligation to publicly release the result of any revisions to these forward looking statements to reflectevents or circumstances after the date hereof to reflect the occurrence of unanticipated events. Past performancecannot be relied on as a guide for future performance.