Article
Effects of Gap Size and Cardinal Directions on NaturalRegeneration, Growth Dynamics of Trees outside the Gaps andSoil Properties in European Beech Forests of Southern Italy
Silvio Bagnato, Pasquale A. Marziliano , Maria Sidari, Carmelo Mallamaci, Federica Marraand Adele Muscolo *
�����������������
Citation: Bagnato, S.; Marziliano,
P.A.; Sidari, M.; Mallamaci, C.; Marra,
F.; Muscolo, A. Effects of Gap Size
and Cardinal Directions on Natural
Regeneration, Growth Dynamics of
Trees outside the Gaps and Soil
Properties in European Beech Forests
of Southern Italy. Forests 2021, 12,
1563. https://doi.org/10.3390/
f12111563
Academic Editor: Keizo Hirai
Received: 7 October 2021
Accepted: 9 November 2021
Published: 12 November 2021
Publisher’s Note: MDPI stays neutral
with regard to jurisdictional claims in
published maps and institutional affil-
iations.
Copyright: © 2021 by the authors.
Licensee MDPI, Basel, Switzerland.
This article is an open access article
distributed under the terms and
conditions of the Creative Commons
Attribution (CC BY) license (https://
creativecommons.org/licenses/by/
4.0/).
Department of AGRARIA, “Mediterranea” University, Feo di Vito, 89122 Reggio Calabria, Italy;[email protected] (S.B.); [email protected] (P.A.M.); [email protected] (M.S.);[email protected] (C.M.); [email protected] (F.M.)* Correspondence: [email protected]; Tel.: +39-09651694364
Abstract: The present study was focused on how cardinal directions inside gaps of different sizes(small, 200 m2; medium, 400 m2; and large, 600 m2) can affect soil characteristics and tree regener-ation. Additionally, the effects of gap size on the growth dynamics of trees outside the gaps wereevaluated. The study was carried out in a European beech stand located in Aspromonte NationalPark (Southern Apennines, Calabria, Italy). Microclimatic variables, physical, chemical, and bio-chemical soil properties, natural regeneration density, and growth trees outside the gaps densityof natural regeneration were assessed. This study provided evidence for an important effect ofcardinal points on micro-environmental parameter variability, nutrient cycle, physic-chemical soilproperties, water availability, and biological processes such as trees growth and regeneration. TheEuropean beech natural regeneration was most abundant in the south part of the gaps. Thus, we canstate that cardinal points affect the trees natural regeneration in a species-specific manner. The newmicroclimatic conditions due to the gap opening had positive effects on the tree growth located alongthe gap edge, especially in the trees sampled on the edges of the medium gaps. On the contrary, thetrees located in the forest recorded a productivity coherent with the period prior the gap opening. Inmedium-sized gaps, the combination and interaction of microclimatic and soil parameters (humifica-tion and mineralization process and microbial activity) created the best conditions for beech naturalregeneration and favored an increase in the productivity of the trees at the edge of the gaps.
Keywords: biodiversity; cardinal points; Fagus sylvatica L.; gap sizes; natural regeneration; soil properties
1. Introduction
Forests, a provision source of raw material for industrial timber products, have alwaysbeen managed to optimize timber production. However, the silvicultural practices oftenadopted caused a homogenization of forest landscapes at the expense of biodiversity [1].Italy is the European country with the richest forest biodiversity and the most favorablegeographical position for a wide variety of geological, climatic, and vegetation condi-tions [2,3]. However, a management aimed at guaranteeing a maximum and constanttimber production has led to structural simplification of the forests (especially silver-fir,spruce, and beech forests) and a reduction of forest ecosystem complexity [4]. To preservethe complex dynamic of forest ecosystems, in recent decades special emphasis was placedon designing forest treatments that mimic natural processes and disturbances (close-to-nature silviculture) to promote and preserve biodiversity and ecosystem functioning [5–7].Forest disturbances have been an integral part of European forests for centuries, but theyare not a threat for forests. Rather, they promote heterogeneity at multiple spatial scales,favoring ecological resilience [8]. Natural disturbances can be considered the main driversof changes in environmental conditions [8,9]. For instance, in a forest the death of a single
Forests 2021, 12, 1563. https://doi.org/10.3390/f12111563 https://www.mdpi.com/journal/forests
Forests 2021, 12, 1563 2 of 18
tree or of several neighboring trees creates gaps, which can cause changes in light levels,temperature, soil moisture, nutrient availability, and the regeneration of microsites associ-ated with snapped or uprooted trees [10]. All of these factors, singularly or in combinationwith others, can affect tree growth, survival, and reproduction [9,11,12]. In the central andsouthern European mountains, forest gaps, often caused by natural disturbances, are idealconditions for rapid tree reproduction and growth [13,14]. Gaps can range from smallopenings formed from the death of a single tree, medium openings formed by the asyn-chronous mortality of multiple trees, to large opening related to periodic storm events [10].Gaps, in addition to being different for size, differ also in severity and frequency [8,11]and can trigger dynamic processes of forest species settlement, which causing change incomposition, structure, and age [15–17], creating heterogeneity in forests [18,19]. Apartfrom the gap sizes, the cardinal points inside of gaps also influence the microclimaticconditions [20,21] and consequent germination and growth of tree species, playing a crucialrole in the distribution of the vegetation patterns [9,22–24]).
In this study, we focused on the European beech (Fagus sylvatica L.), widespread acrossthe Europe, and one of the most investigated forest species for its economic and ecologicalimportance [25,26]. Some studies carried out in this species revealed relatively small gapsizes (<200 m2), suggesting that the European beech forests are predominantly driven by en-dogenous events with occasional intermediate disturbances, especially windthrows [27–29].
Several studies carried out in recent years on the regeneration in gaps of Europeanbeech analyzed mostly some gap characteristics, such as size or shape [10,24,30,31] andlight environment [9,21], but few studies were focused on the effects that the cardinalpoints inside a gap have on tree regeneration [9,32,33]. Most of these studies were carriedout in Central and Eastern Europe, but few have been conducted in the mountains of theMediterranean region. Thus, understanding the dynamics of regeneration processes notonly in respect to the gap of different sizes but rather in respect to the cardinal pointsinside the gaps remains an important task for guiding ecological forest management in theMediterranean mountain forests where climatic conditions change in respect to cardinaldirections, affecting, in turn, tree regeneration dynamics. It is generally stated that thegermination and survival of beech seedlings are problematic and that climatic conditionsplay a key role in its regeneration. Thus, the novelty of this study is to identify the mostfavorable position in the gap of different sizes for European beech natural regenerationand growth in a beech stands of the Apennines Mountain in southern Italy. The mainobjectives were to evaluate if and how the cardinal directions inside the gaps can influencebeech natural regeneration and if the gap opening has an effect on the growth of treesoutside the gaps (both at the gap edges and in the closed forest). This information canbe fundamental to increase its competitive ability under climatic change conditions. Thespecific objectives were: (a) to identify what is the best gap size and the most effectivecardinal direction to encourage greater regeneration of beech; (b) to verify if there aresignificant relationships among environmental factors (photosynthetically active radiation,soil moisture, and temperature), gap sizes, cardinal directions, soil properties, and beechnatural regeneration; and (c) to verify if there are significant relationship among gap sizesand growth of the old trees, both at the gap edges and in the closed forest.
2. Material and Methods
2.1. Study Sites
The study was carried out within a European beech (Fagus sylvatica L.) high forest,located in Aspromonte National Park (Southern Apennines, Calabria, Italy), in the south-east of Sarno village (RC) (38◦13′ N, 15◦96′ E). The forests here observed is on a plateauat an altitude of about 1450 m a.s.l. on a flat terrain. Soil, developed mainly from gneissand schist parent materials, is classified as Eutric Cambisols [34]. Mean annual rainfallis approximately 1603 mm, with a minimum of precipitation in summer (108 mm). Theannual number of rainy days is equal to 113. The snowfalls are frequent in the periodfrom December to March. Mean annual temperatures (10.5 ◦C) range from a minimum
Forests 2021, 12, 1563 3 of 18
of 2.5 ◦C in January to a maximum of 18.1 ◦C in August. According to the bioclimaticindices of Rivas-Martinez (1996) [35], the type of temperate, namely oceanic subtype,affects the territory. The forest stand is dominated by European beech (Fagus sylvaticaL.), with sporadic occurrence of silver-fir (Abies alba Mill), Calabrian pine (Pinus nigraArnold subsp. calabrica), and durmast oak (Quercus petraea ssp. austrotyrrhenica Brullo,Guarino and Siracusa). The shrub layer is nearly absent, but the forest floor is coveredwith a dense herb-layer. Most frequent species are Campanula trichocalycina Ten., Violareichembachiana Jord. ex Boreau, Neottia nidus-avis (L.) Rich., Lamium flexuosum Ten. Thebeech stand examined (extending about 3000 hectares) is of natural origin, with a dominantage ranging from 90 to 140 years old. In 2019, the beech forest examined had a volumeof 795 m3 ha−1, a basal area of 61 m2 ha−1, a dominant height of 25.4 m, and a densityof 850 trees ha−1. The diameters at breast height (DBH) ranged from 10 to 80 cm, withan average DBH of 30 cm. The forest evolved naturally in the last 70 years. However, inthe Southern Apennines until the Second World War beech forests had a very interestingmanagement situation, based on a selection cutting, where felling of some big old treesopened up space for new regeneration [36–39]. This type of management created a smallgroup structure, made up of trees of different age [37,40]. Particularly in the beech forest ofthis study, the traditional system consisted of a selection cut which eliminated the biggesttrees and which is repeated at short intervals (8–10 years). This type of felling created smallgaps (40 to 100 m2 in size) where beech regeneration quickly sets in [37,41].
2.2. Gap Opening
During the autumn of 2009, an experimental design to randomized blocks was realized,with three treatments repeated three times. In detail, in the study site nine circular gapswere created: three smalls (200 m2), three medium (400 m2), and three large ones (600 m2),removing all trees from the gap areas. The gaps were separated from each other by aminimum distance of around 100 m on each direction in order to avoid a “border effect”.After the cutting, to protect the beech natural regeneration from cattle grazing, each gapwas fenced with a net 1.50 m high. Small, medium, and large are relative terms used onlyto separate the three gap sizes evaluated in this study as other published studies havewide-ranging definitions of small, medium, and large canopy gap opening sizes [15,41,42].However, in this study the selection of experimenting these gap sizes is due to the practiceof forest operators to carry out cuts in managed stands, that create hole openings rangingfrom 150–200 to 600–700 m2. Each gap was paired with an adjacent under canopy coversite located 25–30 m from the edge of the gap.
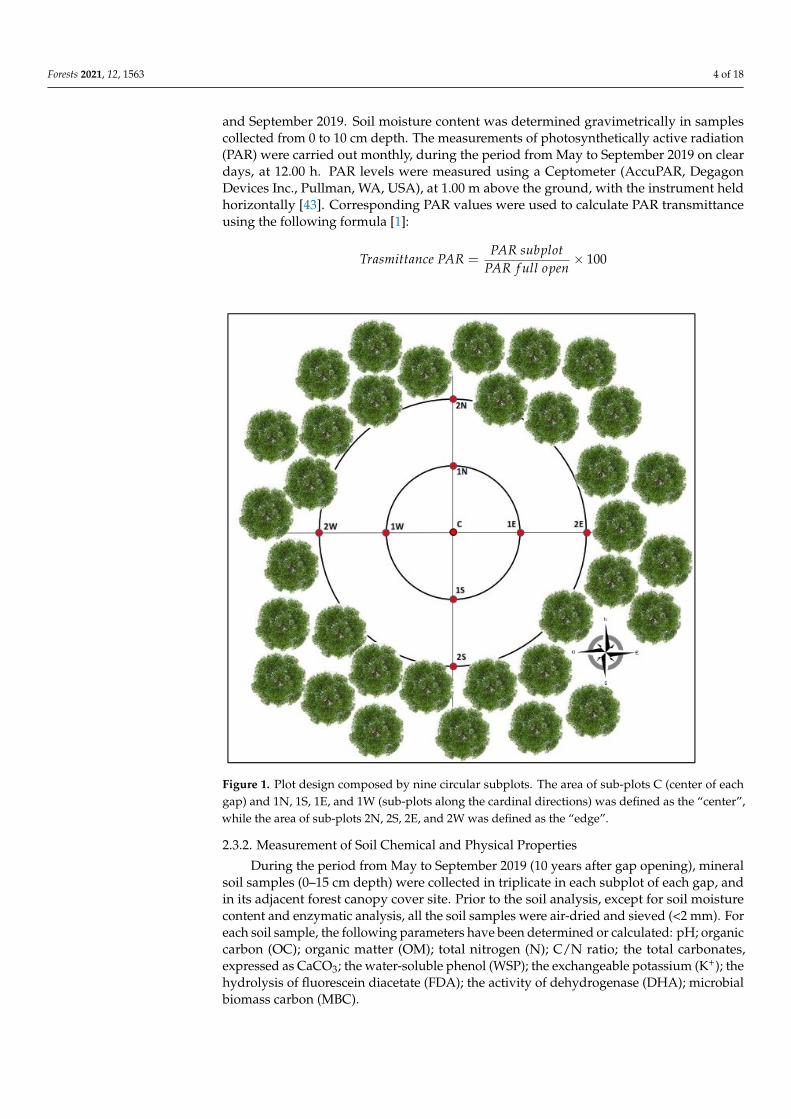
Nine circular sub-plots of 3.14 m2 (100 cm radius) were established inside each gap. Indetail, (i) one sub-plot was positioned in the centre of each gap (C); (ii) four sub-plot werelocated at one-half of the radius starting from the centre to the gap edge along the cardinaldirections (1N, 1E; 1S, 1W); and (iii) four sub-plot were located at the edge of gap alongthe cardinal directions (2N, 2E, 2S, 2W) (Figure 1). A total of 81 sub-plot were established,27 for each gap size. The area covered by the subplots referred to points (i) and (ii) wasdefined as the “center of a gap”, while the area covered by the subplots referred to point(iii) was defined as the “gap edge”.
2.3. Soil Analysis
2.3.1. Measurement of Soil Temperature, Soil Moisture and PhotosyntheticallyActive Radiation
Soil temperature, soil moisture and photosynthetically active radiation (PAR) (here-after defined as microclimatic variables) were measured in each subplot of each gap and inits adjacent forest canopy cover site. Particularly, soil temperature thermometer (Elite) wasplaced at 10 cm depth from the top of in the mineral soil. It was calculated by weighing thewet soil sampled from the field, drying it in an oven, and then weighing the dry soil. Thus,the gravimetric water content equals the wet soil mass minus the dry soil mass divided bythe dry soil mass. This parameter was measured at 12.00 during the period between May
Forests 2021, 12, 1563 4 of 18
and September 2019. Soil moisture content was determined gravimetrically in samplescollected from 0 to 10 cm depth. The measurements of photosynthetically active radiation(PAR) were carried out monthly, during the period from May to September 2019 on cleardays, at 12.00 h. PAR levels were measured using a Ceptometer (AccuPAR, DegagonDevices Inc., Pullman, WA, USA), at 1.00 m above the ground, with the instrument heldhorizontally [43]. Corresponding PAR values were used to calculate PAR transmittanceusing the following formula [1]:
Trasmittance PAR =PAR subplot
PAR f ull open× 100Forests 2021, 12, x FOR PEER REVIEW 4 of 19
Figure 1. Plot design composed by nine circular subplots. The area of sub-plots C (center of each gap) and 1N, 1S, 1E, and 1W (sub-plots along the cardinal directions) was defined as the "center", while the area of sub-plots 2N, 2S, 2E, and 2W was defined as the "edge".
2.3. Soil Analysis 2.3.1. Measurement of Soil Temperature, Soil Moisture and Photosynthetically Active Radiation
Soil temperature, soil moisture and photosynthetically active radiation (PAR) (here-after defined as microclimatic variables) were measured in each subplot of each gap and in its adjacent forest canopy cover site. Particularly, soil temperature thermometer (Elite) was placed at 10 cm depth from the top of in the mineral soil. It was calculated by weigh-ing the wet soil sampled from the field, drying it in an oven, and then weighing the dry soil. Thus, the gravimetric water content equals the wet soil mass minus the dry soil mass divided by the dry soil mass. This parameter was measured at 12.00 during the period between May and September 2019. Soil moisture content was determined gravimetrically in samples collected from 0 to 10 cm depth. The measurements of photosynthetically ac-tive radiation (PAR) were carried out monthly, during the period from May to September 2019 on clear days, at 12.00 h. PAR levels were measured using a Ceptometer (AccuPAR, Degagon Devices Inc., Pullman, WA, USA), at 1.00 m above the ground, with the instru-ment held horizontally [43]. Corresponding PAR values were used to calculate PAR trans-mittance using the following formula [1]: 𝑇𝑟𝑎𝑠𝑚𝑖𝑡𝑡𝑎𝑛𝑐𝑒 𝑃𝐴𝑅 = 𝑃𝐴𝑅 𝑠𝑢𝑏𝑝𝑙𝑜𝑡𝑃𝐴𝑅 𝑓𝑢𝑙𝑙 𝑜𝑝𝑒𝑛 × 100
Figure 1. Plot design composed by nine circular subplots. The area of sub-plots C (center of eachgap) and 1N, 1S, 1E, and 1W (sub-plots along the cardinal directions) was defined as the “center”,while the area of sub-plots 2N, 2S, 2E, and 2W was defined as the “edge”.
2.3.2. Measurement of Soil Chemical and Physical Properties
During the period from May to September 2019 (10 years after gap opening), mineralsoil samples (0–15 cm depth) were collected in triplicate in each subplot of each gap, andin its adjacent forest canopy cover site. Prior to the soil analysis, except for soil moisturecontent and enzymatic analysis, all the soil samples were air-dried and sieved (<2 mm). Foreach soil sample, the following parameters have been determined or calculated: pH; organiccarbon (OC); organic matter (OM); total nitrogen (N); C/N ratio; the total carbonates,expressed as CaCO3; the water-soluble phenol (WSP); the exchangeable potassium (K+); thehydrolysis of fluorescein diacetate (FDA); the activity of dehydrogenase (DHA); microbialbiomass carbon (MBC).
Forests 2021, 12, 1563 5 of 18
Particle size analysis was carried out by the hydrometer method using sodium hex-ametaphosphate as a dispersant [44]; pH was measured in distilled water and 1 M KCl(soil:solution ratio 1:2.5) with a glass electrode; organic carbon was determined by dichro-mate oxidation [45], and it was converted to organic matter by multiplying the percentageof carbon by 1.72; total nitrogen was measured by the Kjeldahl method [46]. Exchangeablepotassium was determined by flame photometry after extraction with 1 M NH4OAc.
Phenols were extracted with distilled water [47,48], total water-soluble phenols weredetermined by using the Folin-Ciocalteau reagent [49], tannic acid was used as a standardand the concentration of water-soluble phenolic compounds was expressed as tannic acidequivalents (µg TAE g−1dry soil).
Microbial biomass C was determined by the chloroform fumigation-extraction pro-cedure [50]. The filtered soil extracts of both fumigated and unfumigated samples wereanalyzed for soluble organic C [45].
FDA hydrolysis reaction was determined according to the methods of Adam and Dun-can [51]. Dehydrogenase (DHA) activity was determined as reported in Muscolo et al. [52].
2.4. Natural Regeneration, Tree Sampling, Ring Width and BAI Analyses
In October 2019 (10 years after the gap’s opening), all seedlings found inside eachsub-plot were counted. On 72 trees located in the edge of the gaps and on 36 trees located inforest outside the gaps, two increment cores per trees were collected at breast height and atan angle of 120◦ to each other. The tree cores were taken from two dominant trees for eachcardinal direction (N-E-S-W) at the outer edges of each gap and from four dominant treeswithin the forest, near each gap. Cores were then mounted on channeled wood, seasoned ina fresh-air dry store and sanded a few weeks later. Tree-ring widths were measured with aresolution of 0.01 mm using the LINTAB measurement equipment (Frank Rinn, Heidelberg,Germany) fitted with a Leica MS5 stereoscope (Leica Microsystems, Wetzlar, Germany).Tree ring widths were then statistically cross-dated and verified with the software TSAPsoftware package (version 4.81c). Once all measurement series were validated, tree-ringchronologies were developed. Subsequently, tree ring widths were converted into treebasal area increment (BAI), according to the following standard formula [2]:
BAI = π(
r2n − r2
n−1
)(1)
where r is the radius of the stem at breast height and n is the year of tree-ring formation.For each core, we considered the tree ring chronologies of the 15 years preceding the
gap’s opening (1995–2009) and of the 10 years following the gap’s opening were considered(2009–2019). In the first case, the average current annual increment was calculated asr15/15 [53]. where r15 is the radius increment recorded in the 15 years before of theopening of the gaps. In the second case, as r10/10 where r10 is the radius incrementrecorded in the 10 years following the opening of the gaps.
2.5. Statistical Analysis
On an exploratory level, after checking the normality of the raw values, in each gapthe regeneration density data and the microclimatic variables (PAR, soil moisture andsoil temperature) were scattered against each other to gain a general understanding oftheir relationships, through the Pearson correlation coefficient. Furthermore, we tested ifthe interaction between microclimatic variables may influence the regeneration density.Afterwards, the analysis of variance (ANOVA) was carried out to determine the effectof gap size on microclimatic variables (PAR, soil moisture and soil temperature) and onphysical and chemical soil properties. In addition, for each gap an ANOVA was carried outto determine the effect of position (center, edge) and cardinal direction (N, E, S, W) on thesame variables as above. For all analysis, when ANOVA indicated an overall significanteffect, the Tukey’s test examined which pairs differed significantly.
Forests 2021, 12, 1563 6 of 18
For beech regeneration density, we tested the differences in the beech regenerationcounts (number of seedlings per m2), considering several categorical predictor variables.Particularly, we used the following predictor variables: gap size (200–400–600 m2), subplotposition within the gap (center, edge), cardinal direction on which each subplot was situated(N, E, S, W). To evaluate the effect of predictor variables on seedling counts we used anegative binomial generalized linear model (nbGLM). In the model, we also tested theinteraction between predictive variables. The analyses were conducted with R software,version 4.1.0 (R Core Team 2021) using the MASS package.
3. Results
3.1. Soil Properties
3.1.1. Soil Temperature, Soil Moisture and PAR
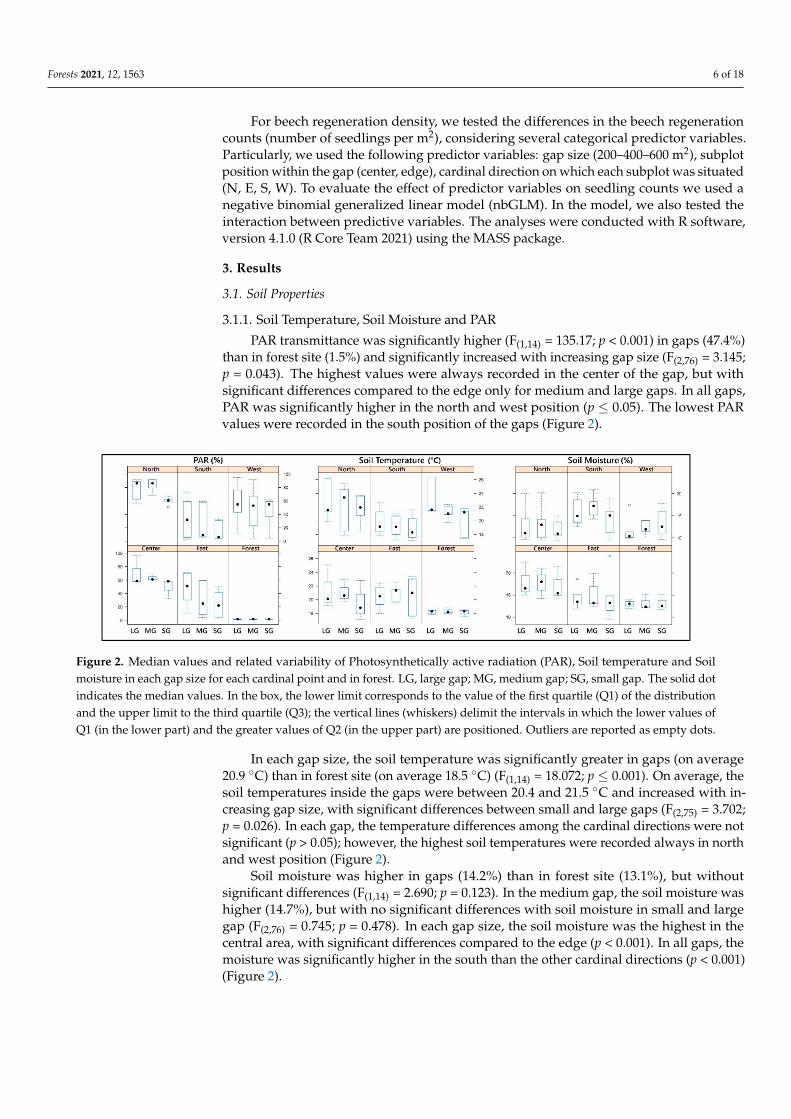
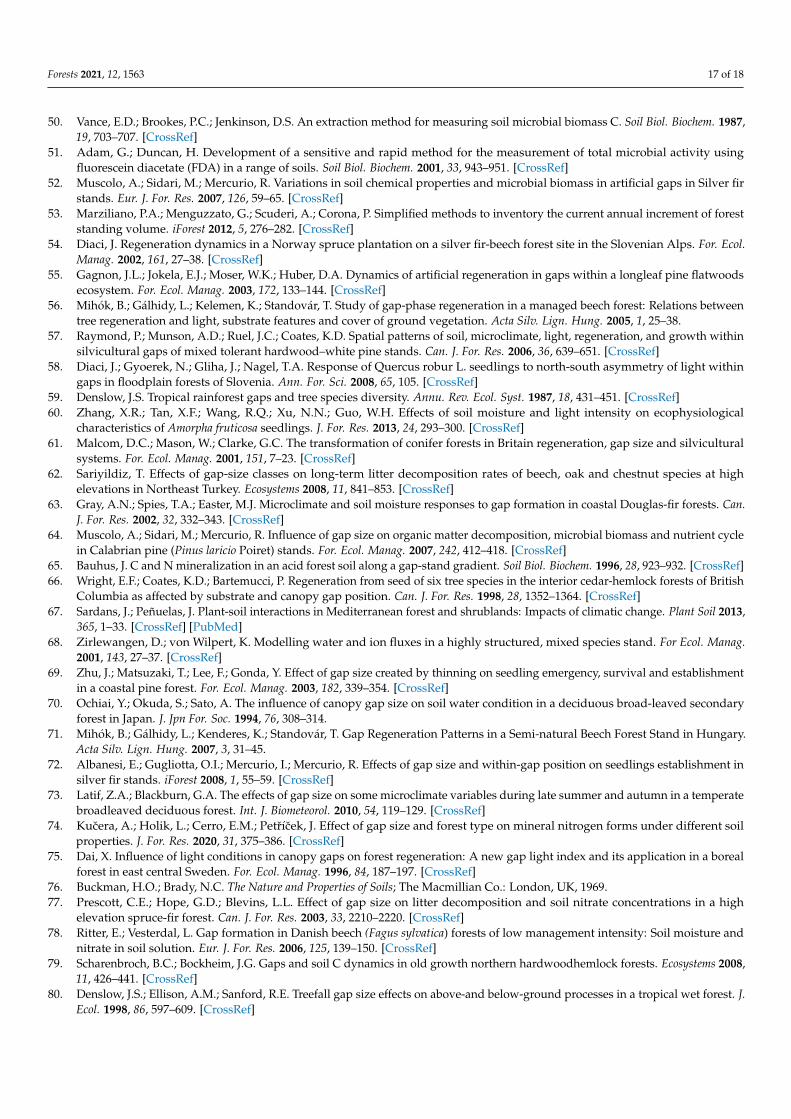
PAR transmittance was significantly higher (F(1,14) = 135.17; p < 0.001) in gaps (47.4%)than in forest site (1.5%) and significantly increased with increasing gap size (F(2,76) = 3.145;p = 0.043). The highest values were always recorded in the center of the gap, but withsignificant differences compared to the edge only for medium and large gaps. In all gaps,PAR was significantly higher in the north and west position (p ≤ 0.05). The lowest PARvalues were recorded in the south position of the gaps (Figure 2).
Forests 2021, 12, x FOR PEER REVIEW 6 of 19
2.5. Statistical Analysis On an exploratory level, after checking the normality of the raw values, in each gap
the regeneration density data and the microclimatic variables (PAR, soil moisture and soil temperature) were scattered against each other to gain a general understanding of their relationships, through the Pearson correlation coefficient. Furthermore, we tested if the interaction between microclimatic variables may influence the regeneration density. Af-terwards, the analysis of variance (ANOVA) was carried out to determine the effect of gap size on microclimatic variables (PAR, soil moisture and soil temperature) and on physical and chemical soil properties. In addition, for each gap an ANOVA was carried out to de-termine the effect of position (center, edge) and cardinal direction (N, E, S, W) on the same variables as above. For all analysis, when ANOVA indicated an overall significant effect, the Tukey’s test examined which pairs differed significantly.
For beech regeneration density, we tested the differences in the beech regeneration counts (number of seedlings per m2), considering several categorical predictor variables. Particularly, we used the following predictor variables: gap size (200–400–600 m2), subplot position within the gap (center, edge), cardinal direction on which each subplot was situ-ated (N, E, S, W). To evaluate the effect of predictor variables on seedling counts we used a negative binomial generalized linear model (nbGLM). In the model, we also tested the interaction between predictive variables. The analyses were conducted with R software, version 4.1.0 (R Core Team 2021) using the MASS package.
3. Results 3.1. Soil Properties 3.1.1. Soil Temperature, Soil Moisture and PAR
PAR transmittance was significantly higher (F(1,14) = 135.17; p < 0.001) in gaps (47.4%) than in forest site (1.5%) and significantly increased with increasing gap size (F(2,76) = 3.145; p = 0.043). The highest values were always recorded in the center of the gap, but with significant differences compared to the edge only for medium and large gaps. In all gaps, PAR was significantly higher in the north and west position (p ≤ 0.05). The lowest PAR values were recorded in the south position of the gaps (Figure 2).
Figure 2. Median values and related variability of Photosynthetically active radiation (PAR), Soil temperature and Soil moisture in each gap size for each cardinal point and in forest. LG, large gap; MG, medium gap; SG, small gap. The solid dot indicates the median values. In the box, the lower limit corresponds to the value of the first quartile (Q1) of the distri-bution and the upper limit to the third quartile (Q3); the vertical lines (whiskers) delimit the intervals in which the lower values of Q1 (in the lower part) and the greater values of Q2 (in the upper part) are positioned. Outliers are reported as empty dots.
In each gap size, the soil temperature was significantly greater in gaps (on average 20.9 °C) than in forest site (on average 18.5 °C) (F(1,14) = 18.072; p ≤ 0.001). On average, the soil temperatures inside the gaps were between 20.4 and 21.5 °C and increased with in-creasing gap size, with significant differences between small and large gaps (F(2,75) = 3.702;
Figure 2. Median values and related variability of Photosynthetically active radiation (PAR), Soil temperature and Soilmoisture in each gap size for each cardinal point and in forest. LG, large gap; MG, medium gap; SG, small gap. The solid dotindicates the median values. In the box, the lower limit corresponds to the value of the first quartile (Q1) of the distributionand the upper limit to the third quartile (Q3); the vertical lines (whiskers) delimit the intervals in which the lower values ofQ1 (in the lower part) and the greater values of Q2 (in the upper part) are positioned. Outliers are reported as empty dots.
In each gap size, the soil temperature was significantly greater in gaps (on average20.9 ◦C) than in forest site (on average 18.5 ◦C) (F(1,14) = 18.072; p ≤ 0.001). On average, thesoil temperatures inside the gaps were between 20.4 and 21.5 ◦C and increased with in-creasing gap size, with significant differences between small and large gaps (F(2,75) = 3.702;p = 0.026). In each gap, the temperature differences among the cardinal directions were notsignificant (p > 0.05); however, the highest soil temperatures were recorded always in northand west position (Figure 2).
Soil moisture was higher in gaps (14.2%) than in forest site (13.1%), but withoutsignificant differences (F(1,14) = 2.690; p = 0.123). In the medium gap, the soil moisture washigher (14.7%), but with no significant differences with soil moisture in small and largegap (F(2,76) = 0.745; p = 0.478). In each gap size, the soil moisture was the highest in thecentral area, with significant differences compared to the edge (p < 0.001). In all gaps, themoisture was significantly higher in the south than the other cardinal directions (p < 0.001)(Figure 2).
Forests 2021, 12, 1563 7 of 18
3.1.2. Soil Chemical and Physical Properties
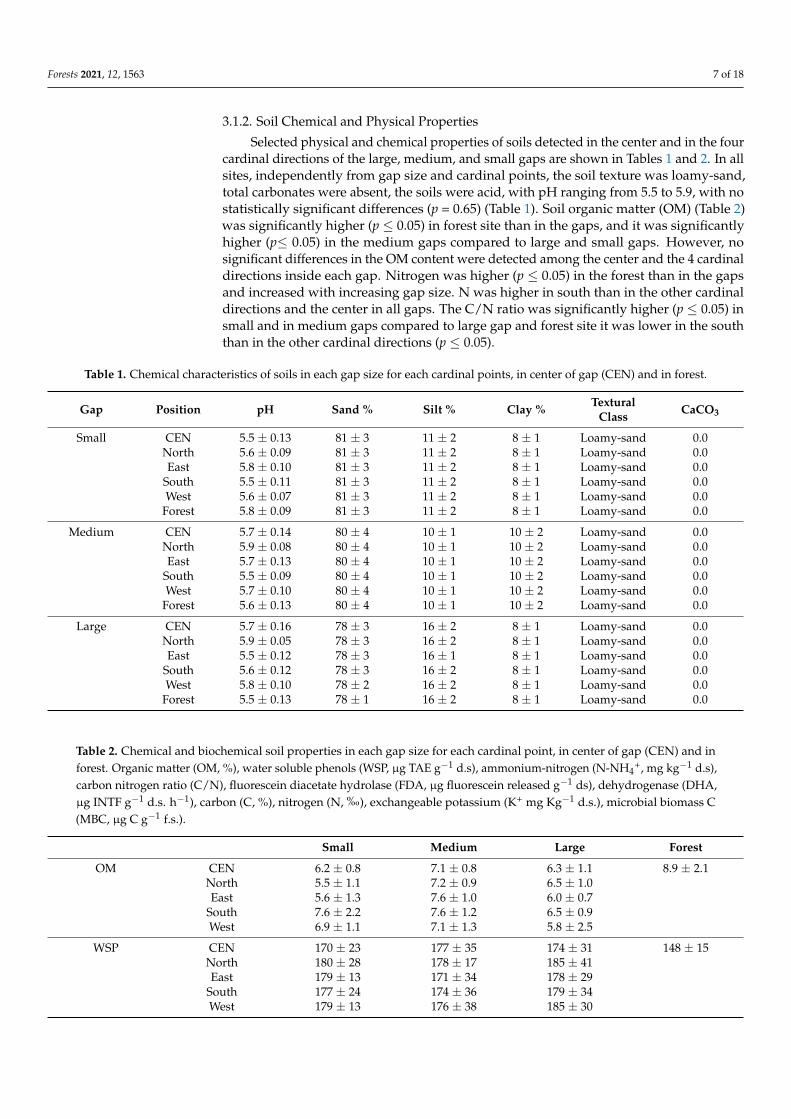
Selected physical and chemical properties of soils detected in the center and in the fourcardinal directions of the large, medium, and small gaps are shown in Tables 1 and 2. In allsites, independently from gap size and cardinal points, the soil texture was loamy-sand,total carbonates were absent, the soils were acid, with pH ranging from 5.5 to 5.9, with nostatistically significant differences (p = 0.65) (Table 1). Soil organic matter (OM) (Table 2)was significantly higher (p ≤ 0.05) in forest site than in the gaps, and it was significantlyhigher (p≤ 0.05) in the medium gaps compared to large and small gaps. However, nosignificant differences in the OM content were detected among the center and the 4 cardinaldirections inside each gap. Nitrogen was higher (p ≤ 0.05) in the forest than in the gapsand increased with increasing gap size. N was higher in south than in the other cardinaldirections and the center in all gaps. The C/N ratio was significantly higher (p ≤ 0.05) insmall and in medium gaps compared to large gap and forest site it was lower in the souththan in the other cardinal directions (p ≤ 0.05).
Table 1. Chemical characteristics of soils in each gap size for each cardinal points, in center of gap (CEN) and in forest.
Gap Position pH Sand % Silt % Clay % TexturalClass CaCO3
Small CEN 5.5 ± 0.13 81 ± 3 11 ± 2 8 ± 1 Loamy-sand 0.0North 5.6 ± 0.09 81 ± 3 11 ± 2 8 ± 1 Loamy-sand 0.0East 5.8 ± 0.10 81 ± 3 11 ± 2 8 ± 1 Loamy-sand 0.0
South 5.5 ± 0.11 81 ± 3 11 ± 2 8 ± 1 Loamy-sand 0.0West 5.6 ± 0.07 81 ± 3 11 ± 2 8 ± 1 Loamy-sand 0.0
Forest 5.8 ± 0.09 81 ± 3 11 ± 2 8 ± 1 Loamy-sand 0.0
Medium CEN 5.7 ± 0.14 80 ± 4 10 ± 1 10 ± 2 Loamy-sand 0.0North 5.9 ± 0.08 80 ± 4 10 ± 1 10 ± 2 Loamy-sand 0.0East 5.7 ± 0.13 80 ± 4 10 ± 1 10 ± 2 Loamy-sand 0.0
South 5.5 ± 0.09 80 ± 4 10 ± 1 10 ± 2 Loamy-sand 0.0West 5.7 ± 0.10 80 ± 4 10 ± 1 10 ± 2 Loamy-sand 0.0
Forest 5.6 ± 0.13 80 ± 4 10 ± 1 10 ± 2 Loamy-sand 0.0
Large CEN 5.7 ± 0.16 78 ± 3 16 ± 2 8 ± 1 Loamy-sand 0.0North 5.9 ± 0.05 78 ± 3 16 ± 2 8 ± 1 Loamy-sand 0.0East 5.5 ± 0.12 78 ± 3 16 ± 1 8 ± 1 Loamy-sand 0.0
South 5.6 ± 0.12 78 ± 3 16 ± 2 8 ± 1 Loamy-sand 0.0West 5.8 ± 0.10 78 ± 2 16 ± 2 8 ± 1 Loamy-sand 0.0
Forest 5.5 ± 0.13 78 ± 1 16 ± 2 8 ± 1 Loamy-sand 0.0
Table 2. Chemical and biochemical soil properties in each gap size for each cardinal point, in center of gap (CEN) and inforest. Organic matter (OM, %), water soluble phenols (WSP, µg TAE g−1 d.s), ammonium-nitrogen (N-NH4
+, mg kg−1 d.s),carbon nitrogen ratio (C/N), fluorescein diacetate hydrolase (FDA, µg fluorescein released g−1 ds), dehydrogenase (DHA,µg INTF g−1 d.s. h−1), carbon (C, %), nitrogen (N,
Forests 2021, 12, x FOR PEER REVIEW 8 of 19
Table 2. Chemical and biochemical soil properties in each gap size for each cardinal point, in center of gap (CEN) and in forest. Organic matter (OM, %), water soluble phenols (WSP, µg TAE g−1 d.s), ammonium-nitrogen (N-NH4+, mg kg−1 d.s), carbon nitrogen ratio (C/N), fluorescein diacetate hy-drolase (FDA, µg fluorescein released g−1 ds), dehydrogenase (DHA, µg INTF g−1 d.s. h−1), carbon (C, %), nitrogen (N, ‰), exchangeable potassium (K+ mg Kg−1 d.s.), microbial biomass C (MBC, µg C g−1 f.s.).
Small Medium Large Forest OM CEN 6.2 ± 0.8 7.1 ± 0.8 6.3 ± 1.1 8.9 ± 2.1
North 5.5 ± 1.1 7.2 ± 0.9 6.5 ± 1.0 East 5.6 ± 1.3 7.6 ± 1.0 6.0 ± 0.7 South 7.6 ± 2.2 7.6 ± 1.2 6.5 ± 0.9 West 6.9 ± 1.1 7.1 ± 1.3 5.8 ± 2.5
WSP CEN 170 ± 23 177 ± 35 174 ± 31 148 ± 15 North 180 ± 28 178 ± 17 185 ± 41 East 179 ± 13 171 ± 34 178 ± 29 South 177 ± 24 174 ± 36 179 ± 34 West 179 ± 13 176 ± 38 185 ± 30
C/N CEN 27 ± 6.5 26 ± 3.9 19 ± 3.3 21 ± 4.7 North 26 ± 9.7 28 ± 7.4 19 ± 2.6 East 29 ± 5.0 26 ± 2.5 20 ± 4.1 South 23 ± 9.7 23 ± 2.7 15 ± 1.8 West 22 ± 7.1 27 ± 5.2 20 ± 4.4
FDA CEN 40 ± 3.4 50 ± 8.3 41 ± 11.5 61 ± 5.6 North 36 ± 3.9 51 ± 8.1 39 ± 8.7 East 44 ± 9.5 49 ± 7.5 39 ± 8.1 South 54 ± 8.0 59 ± 5.9 48 ± 4.5 West 41 ± 4.7 40 ± 6.4 38 ± 10.1
DHA CEN r 7.7 ± 2.1 9.1 ± 5.1 8.3 ± 0.8 15.0 ± 5.3 North 7.0 ± 1.5 9.6 ± 1.9 7.9 ± 1.4 East 8.6 ± 3.0 8.5 ± 2.0 8.9 ± 1.5 South 10 ± 5.3 12 ± 2.0 11 ± 3.0 West 8.0 ± 2.4 8.8 ± 3.4 8.4 ± 3.1
C CENr 3.6 ± 1.1 4.1 ± 1.2 3.7 ± 0.8 5.2 ± 1.6 North 3.2 ± 0.9 4.2 ± 0.7 3.8 ± 1.2 East 3.2 ± 1.3 4.4 ± 1.4 3.5 ± 0.8 South 3.6 ± 2.3 4.4 ± 0.7 3.8 ± 1.1 West 3.3 ± 0.5 4.1 ± 1.0 3.4 ± 1.0
N CEN 1.3 ± 0.2 1.6 ± 0.2 2.0 ± 1.0 2.4 ± 0.3 North 1.2 ± 0.2 1.5 ± 03 2.0 ± 0.9 East 1.1 ± 0.3 1.7 ± 0.4 1.7 ± 0.4 South 1.6 ± 0.1 1.9 ± 0.2 2.5 ± 0.4 West 1.5 ± 0.3 1.5 ± 0.3 1.7 ± 0.5
K+ CEN 147 ± 75.5 212 ± 144.3 192 ± 103.5 312 ± 68.3 North 160 ± 80.1 238 ± 161.1 187 ± 99.6 East 160 ± 62.3 244 ± 75.4 177 ± 74.3 South 260 ± 94.7 268 ± 80.1 190 ± 100.4 West 150 ± 78.3 250 ± 101.6 167 ± 92.8
MBC CEN 3100 ± 295 3900 ± 311 2010 ± 279 3570 ± 294 North 3370 ± 175 4400 ± 293 1700 ± 313 East 3500 ± 221 4770 ± 315 1990 ± 274 South 3990 ± 337 4660 ± 339 2400 ± 364
), exchangeable potassium (K+ mg Kg−1 d.s.), microbial biomass C(MBC, µg C g−1 f.s.).
Small Medium Large Forest
OM CEN 6.2 ± 0.8 7.1 ± 0.8 6.3 ± 1.1 8.9 ± 2.1North 5.5 ± 1.1 7.2 ± 0.9 6.5 ± 1.0East 5.6 ± 1.3 7.6 ± 1.0 6.0 ± 0.7
South 7.6 ± 2.2 7.6 ± 1.2 6.5 ± 0.9West 6.9 ± 1.1 7.1 ± 1.3 5.8 ± 2.5
WSP CEN 170 ± 23 177 ± 35 174 ± 31 148 ± 15North 180 ± 28 178 ± 17 185 ± 41East 179 ± 13 171 ± 34 178 ± 29
South 177 ± 24 174 ± 36 179 ± 34West 179 ± 13 176 ± 38 185 ± 30
Forests 2021, 12, 1563 8 of 18
Table 2. Cont.
Small Medium Large Forest
C/N CEN 27 ± 6.5 26 ± 3.9 19 ± 3.3 21 ± 4.7North 26 ± 9.7 28 ± 7.4 19 ± 2.6East 29 ± 5.0 26 ± 2.5 20 ± 4.1
South 23 ± 9.7 23 ± 2.7 15 ± 1.8West 22 ± 7.1 27 ± 5.2 20 ± 4.4
FDA CEN 40 ± 3.4 50 ± 8.3 41 ± 11.5 61 ± 5.6North 36 ± 3.9 51 ± 8.1 39 ± 8.7East 44 ± 9.5 49 ± 7.5 39 ± 8.1
South 54 ± 8.0 59 ± 5.9 48 ± 4.5West 41 ± 4.7 40 ± 6.4 38 ± 10.1
DHA CEN r 7.7 ± 2.1 9.1 ± 5.1 8.3 ± 0.8 15.0 ± 5.3North 7.0 ± 1.5 9.6 ± 1.9 7.9 ± 1.4East 8.6 ± 3.0 8.5 ± 2.0 8.9 ± 1.5
South 10 ± 5.3 12 ± 2.0 11 ± 3.0West 8.0 ± 2.4 8.8 ± 3.4 8.4 ± 3.1
C CENr 3.6 ± 1.1 4.1 ± 1.2 3.7 ± 0.8 5.2 ± 1.6North 3.2 ± 0.9 4.2 ± 0.7 3.8 ± 1.2East 3.2 ± 1.3 4.4 ± 1.4 3.5 ± 0.8
South 3.6 ± 2.3 4.4 ± 0.7 3.8 ± 1.1West 3.3 ± 0.5 4.1 ± 1.0 3.4 ± 1.0
N CEN 1.3 ± 0.2 1.6 ± 0.2 2.0 ± 1.0 2.4 ± 0.3North 1.2 ± 0.2 1.5 ± 03 2.0 ± 0.9East 1.1 ± 0.3 1.7 ± 0.4 1.7 ± 0.4
South 1.6 ± 0.1 1.9 ± 0.2 2.5 ± 0.4West 1.5 ± 0.3 1.5 ± 0.3 1.7 ± 0.5
K+ CEN 147 ± 75.5 212 ± 144.3 192 ± 103.5 312 ± 68.3North 160 ± 80.1 238 ± 161.1 187 ± 99.6East 160 ± 62.3 244 ± 75.4 177 ± 74.3
South 260 ± 94.7 268 ± 80.1 190 ± 100.4West 150 ± 78.3 250 ± 101.6 167 ± 92.8
MBC CEN 3100 ± 295 3900 ± 311 2010 ± 279 3570 ± 294North 3370 ± 175 4400 ± 293 1700 ± 313East 3500 ± 221 4770 ± 315 1990 ± 274
South 3990 ± 337 4660 ± 339 2400 ± 364West 3010 ± 365 4220 ± 359 1900 ± 240
The number of water-soluble phenols was significantly higher in gaps than in theforest site, and WSP did not change significantly with the size of the gaps (p = 0.67). Nosignificant differences (p = 0.56) were detected among the four different cardinal directionsand the center for all gaps.
FDA activity was significantly higher (p ≤ 0.05) in the forest site than in the gaps,with significantly higher values in the medium gaps. In the large and small gaps, FDAactivity changed significantly between the center and the cardinal directions. In eachgap, the highest FDA activity was detected in the south (Table 2). DHA activity wassignificantly higher (p ≤ 0.05) in the forest site than in the gaps, with trend similar to FDA,and significantly higher in the medium gaps, with significantly changes between the centerand the cardinal directions. The highest activity was observed in the south of each gap.Potassium was more abundant in forest followed by medium gaps. The lowest amountwas found in the small gaps. MBC was greater in medium than the other sites and it wasmore abundant in south and east cardinal directions inside medium gaps.
3.2. Natural Regeneration
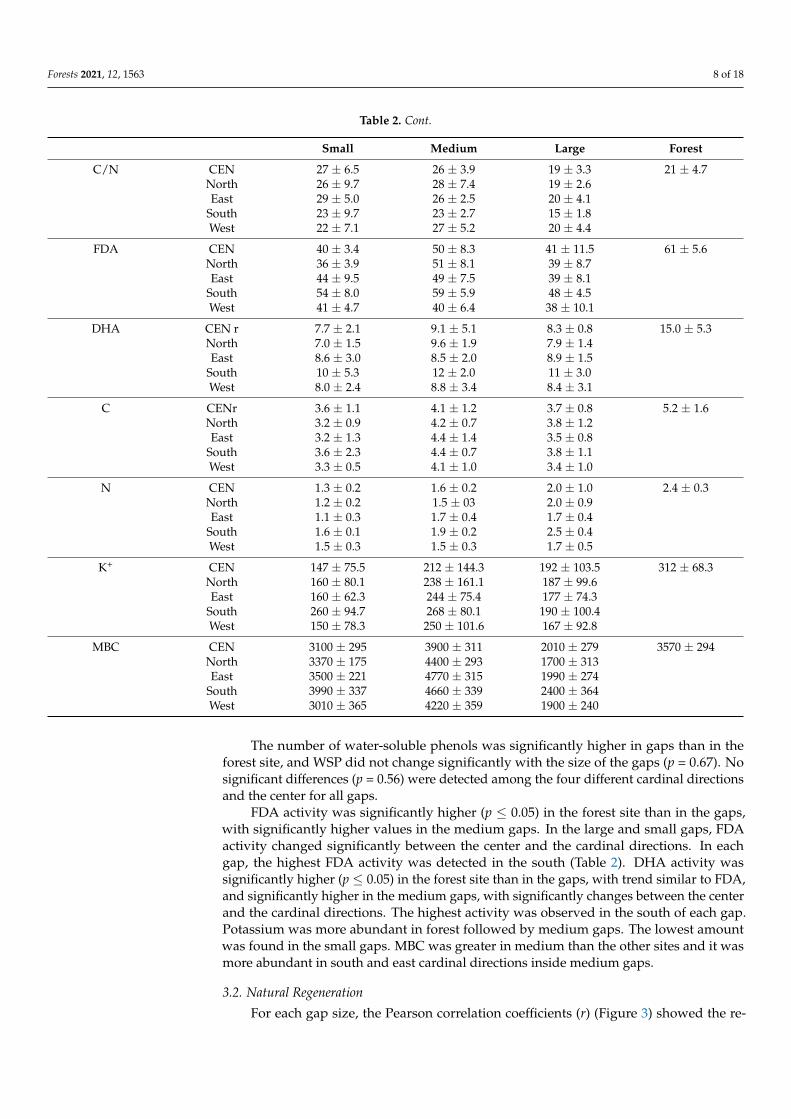
For each gap size, the Pearson correlation coefficients (r) (Figure 3) showed the re-
Forests 2021, 12, 1563 9 of 18
lationships between the beech regeneration density (number of seedlings per m2) andmicroclimatic variables. In the medium gaps the regeneration density was significantly cor-related with soil moisture (positive correlation) and soil temperature (negative correlation),while the correlation with PAR (negative correlation) was not significant. In the small andlarge gaps, the regeneration density was never significantly correlated with microclimaticvariables. For each size of the gap, no interaction terms between the microclimatic variableshad a significant effect on the regeneration density (results non-reported).
Forests 2021, 12, x FOR PEER REVIEW 9 of 19
West 3010 ± 365 4220 ± 359 1900 ± 240
The number of water-soluble phenols was significantly higher in gaps than in the forest site, and WSP did not change significantly with the size of the gaps (p = 0.67). No significant differences (p = 0.56) were detected among the four different cardinal directions and the center for all gaps.
FDA activity was significantly higher (p ≤ 0.05) in the forest site than in the gaps, with significantly higher values in the medium gaps. In the large and small gaps, FDA activity changed significantly between the center and the cardinal directions. In each gap, the highest FDA activity was detected in the south (Table 2). DHA activity was significantly higher (p ≤ 0.05) in the forest site than in the gaps, with trend similar to FDA, and signifi-cantly higher in the medium gaps, with significantly changes between the center and the cardinal directions. The highest activity was observed in the south of each gap. Potassium was more abundant in forest followed by medium gaps. The lowest amount was found in the small gaps. MBC was greater in medium than the other sites and it was more abundant in south and east cardinal directions inside medium gaps.
3.2. Natural Regeneration For each gap size, the Pearson correlation coefficients (r) (Figure 3) showed the rela-
tionships between the beech regeneration density (number of seedlings per m2) and mi-croclimatic variables. In the medium gaps the regeneration density was significantly cor-related with soil moisture (positive correlation) and soil temperature (negative correla-tion), while the correlation with PAR (negative correlation) was not significant. In the small and large gaps, the regeneration density was never significantly correlated with mi-croclimatic variables. For each size of the gap, no interaction terms between the microcli-matic variables had a significant effect on the regeneration density (results non-reported).
Figure 3. Scatterplot matrix with Pearson correlations. REGENER, natural regeneration; MOISTURE, soil moisture; TEMP, soil temperature; PAR, photosynthetically active radiation. For each gap size, n = 27. Asterisks stand for p-values: ***: p < 0.001; **: p < 0.01; * p < 0.05.
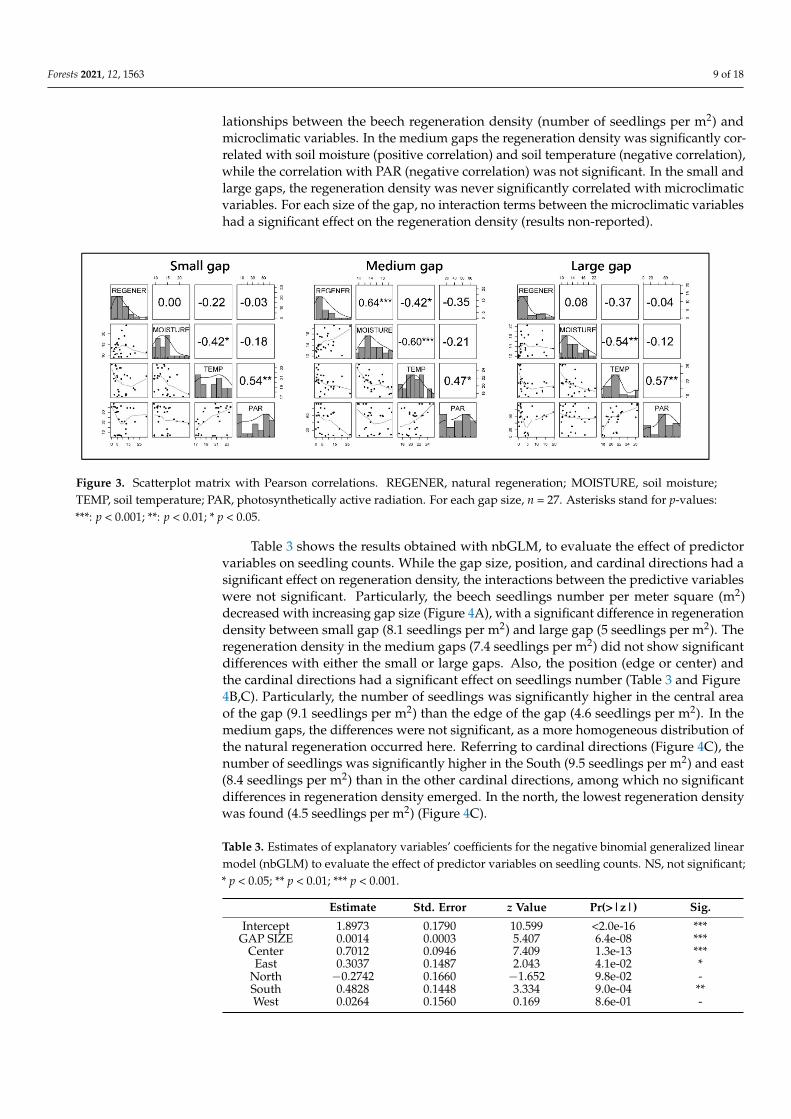
Table 3 shows the results obtained with nbGLM, to evaluate the effect of predictor variables on seedling counts. While the gap size, position, and cardinal directions had a significant effect on regeneration density, the interactions between the predictive varia-bles were not significant. Particularly, the beech seedlings number per meter square (m2) decreased with increasing gap size (Figure 4A), with a significant difference in regenera-tion density between small gap (8.1 seedlings per m2) and large gap (5 seedlings per m2). The regeneration density in the medium gaps (7.4 seedlings per m2) did not show signifi-cant differences with either the small or large gaps. Also, the position (edge or center) and the cardinal directions had a significant effect on seedlings number (Table 3 and Figure 4B,C). Particularly, the number of seedlings was significantly higher in the central area of
Figure 3. Scatterplot matrix with Pearson correlations. REGENER, natural regeneration; MOISTURE, soil moisture;TEMP, soil temperature; PAR, photosynthetically active radiation. For each gap size, n = 27. Asterisks stand for p-values:***: p < 0.001; **: p < 0.01; * p < 0.05.
Table 3 shows the results obtained with nbGLM, to evaluate the effect of predictorvariables on seedling counts. While the gap size, position, and cardinal directions had asignificant effect on regeneration density, the interactions between the predictive variableswere not significant. Particularly, the beech seedlings number per meter square (m2)decreased with increasing gap size (Figure 4A), with a significant difference in regenerationdensity between small gap (8.1 seedlings per m2) and large gap (5 seedlings per m2). Theregeneration density in the medium gaps (7.4 seedlings per m2) did not show significantdifferences with either the small or large gaps. Also, the position (edge or center) andthe cardinal directions had a significant effect on seedlings number (Table 3 and Figure4B,C). Particularly, the number of seedlings was significantly higher in the central areaof the gap (9.1 seedlings per m2) than the edge of the gap (4.6 seedlings per m2). In themedium gaps, the differences were not significant, as a more homogeneous distribution ofthe natural regeneration occurred here. Referring to cardinal directions (Figure 4C), thenumber of seedlings was significantly higher in the South (9.5 seedlings per m2) and east(8.4 seedlings per m2) than in the other cardinal directions, among which no significantdifferences in regeneration density emerged. In the north, the lowest regeneration densitywas found (4.5 seedlings per m2) (Figure 4C).
Table 3. Estimates of explanatory variables’ coefficients for the negative binomial generalized linearmodel (nbGLM) to evaluate the effect of predictor variables on seedling counts. NS, not significant;* p < 0.05; ** p < 0.01; *** p < 0.001.
Estimate Std. Error z Value Pr(>|z|) Sig.
Intercept 1.8973 0.1790 10.599 <2.0e-16 ***GAP SIZE 0.0014 0.0003 5.407 6.4e-08 ***
Center 0.7012 0.0946 7.409 1.3e-13 ***East 0.3037 0.1487 2.043 4.1e-02 *
North −0.2742 0.1660 −1.652 9.8e-02 -South 0.4828 0.1448 3.334 9.0e-04 **West 0.0264 0.1560 0.169 8.6e-01 -
Forests 2021, 12, 1563 10 of 18
Forests 2021, 12, x FOR PEER REVIEW 10 of 19
the gap (9.1 seedlings per m2) than the edge of the gap (4.6 seedlings per m2). In the me-dium gaps, the differences were not significant, as a more homogeneous distribution of the natural regeneration occurred here. Referring to cardinal directions (Figure 4C), the number of seedlings was significantly higher in the South (9.5 seedlings per m2) and east (8.4 seedlings per m2) than in the other cardinal directions, among which no significant differences in regeneration density emerged. In the north, the lowest regeneration density was found (4.5 seedlings per m2) (Figure 4C).
Table 3. Estimates of explanatory variables’ coefficients for the negative binomial generalized linear model (nbGLM) to evaluate the effect of predictor variables on seedling counts. NS, not significant; * p < 0.05; ** p < 0.01; *** p < 0.001.
Estimate Std. Error z Value Pr(>|z|) Sig. Intercept 1.8973 0.1790 10.599 <2.0e-16 ***
GAP SIZE 0.0014 0.0003 5.407 6.4e-08 *** Center 0.7012 0.0946 7.409 1.3e-13 ***
East 0.3037 0.1487 2.043 4.1e-02 * North −0.2742 0.1660 −1.652 9.8e-02 - South 0.4828 0.1448 3.334 9.0e-04 ** West 0.0264 0.1560 0.169 8.6e-01 -
Figure 4. Number of seedlings per m2 per gap-size (A), number of seedlings in the edge and in the center of gaps (B), in cardinal point (C). The box plots explanations are as in figure 2, with the difference of the median values represented here by the heavy horizontal line. Boxes with different letters indicate significant differences in number of seedlings per m2 (p < 0.05).
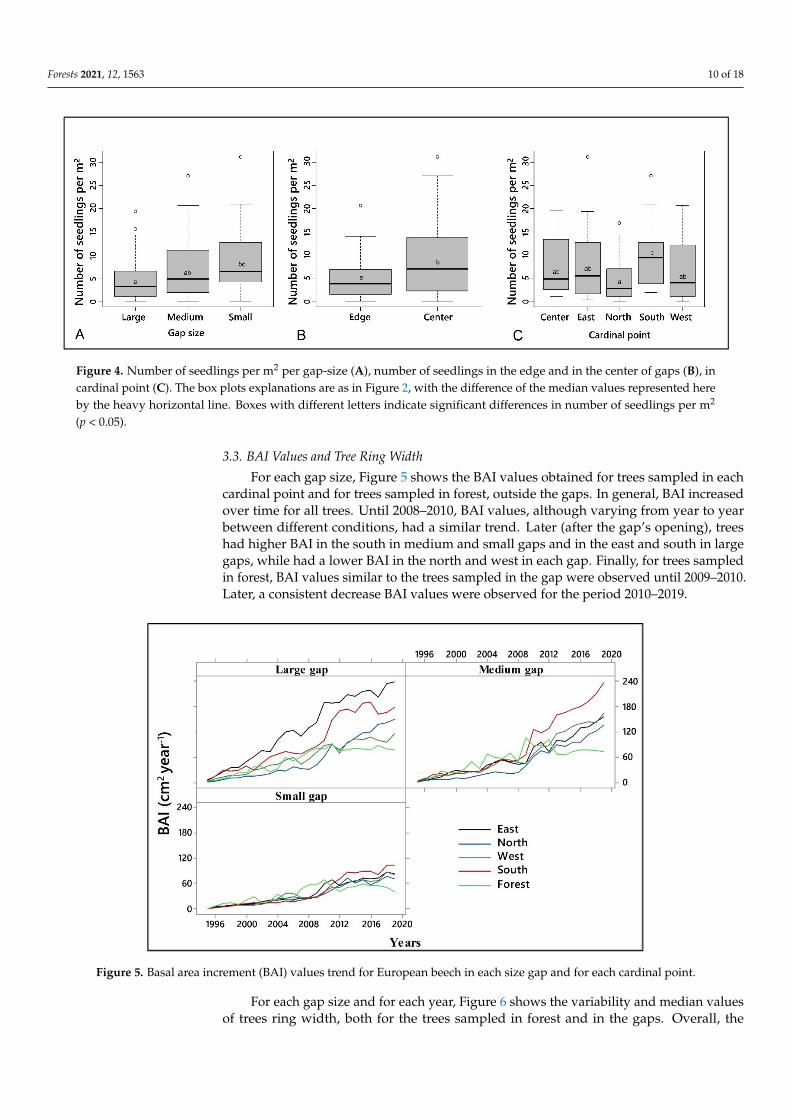
3.3. BAI Values and Tree Ring Width For each gap size, Figure 5 shows the BAI values obtained for trees sampled in each
cardinal point and for trees sampled in forest, outside the gaps. In general, BAI increased over time for all trees. Until 2008–2010, BAI values, although varying from year to year between different conditions, had a similar trend. Later (after the gap’s opening), trees had higher BAI in the south in medium and small gaps and in the east and south in large gaps, while had a lower BAI in the north and west in each gap. Finally, for trees sampled in forest, BAI values similar to the trees sampled in the gap were observed until 2009–2010. Later, a consistent decrease BAI values were observed for the period 2010–2019.
Figure 4. Number of seedlings per m2 per gap-size (A), number of seedlings in the edge and in the center of gaps (B), incardinal point (C). The box plots explanations are as in Figure 2, with the difference of the median values represented hereby the heavy horizontal line. Boxes with different letters indicate significant differences in number of seedlings per m2
(p < 0.05).
3.3. BAI Values and Tree Ring Width
For each gap size, Figure 5 shows the BAI values obtained for trees sampled in eachcardinal point and for trees sampled in forest, outside the gaps. In general, BAI increasedover time for all trees. Until 2008–2010, BAI values, although varying from year to yearbetween different conditions, had a similar trend. Later (after the gap’s opening), treeshad higher BAI in the south in medium and small gaps and in the east and south in largegaps, while had a lower BAI in the north and west in each gap. Finally, for trees sampledin forest, BAI values similar to the trees sampled in the gap were observed until 2009–2010.Later, a consistent decrease BAI values were observed for the period 2010–2019.
Forests 2021, 12, x FOR PEER REVIEW 11 of 19
Figure 5. Basal area increment (BAI) values trend for European beech in each size gap and for each cardinal point.
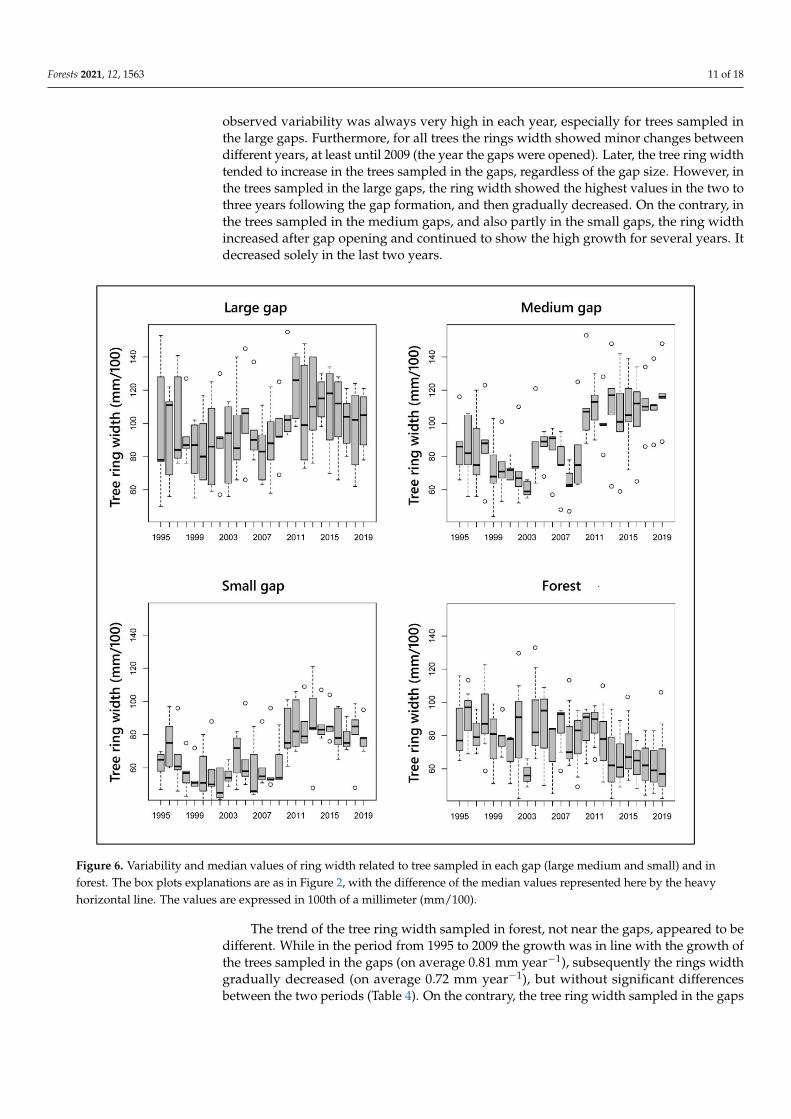
For each gap size and for each year, Figure 6 shows the variability and median values of trees ring width, both for the trees sampled in forest and in the gaps. Overall, the ob-served variability was always very high in each year, especially for trees sampled in the large gaps. Furthermore, for all trees the rings width showed minor changes between dif-ferent years, at least until 2009 (the year the gaps were opened). Later, the tree ring width tended to increase in the trees sampled in the gaps, regardless of the gap size. However, in the trees sampled in the large gaps, the ring width showed the highest values in the two to three years following the gap formation, and then gradually decreased. On the contrary, in the trees sampled in the medium gaps, and also partly in the small gaps, the ring width increased after gap opening and continued to show the high growth for several years. It decreased solely in the last two years.
Figure 5. Basal area increment (BAI) values trend for European beech in each size gap and for each cardinal point.
For each gap size and for each year, Figure 6 shows the variability and median valuesof trees ring width, both for the trees sampled in forest and in the gaps. Overall, the
Forests 2021, 12, 1563 11 of 18
observed variability was always very high in each year, especially for trees sampled inthe large gaps. Furthermore, for all trees the rings width showed minor changes betweendifferent years, at least until 2009 (the year the gaps were opened). Later, the tree ring widthtended to increase in the trees sampled in the gaps, regardless of the gap size. However, inthe trees sampled in the large gaps, the ring width showed the highest values in the two tothree years following the gap formation, and then gradually decreased. On the contrary, inthe trees sampled in the medium gaps, and also partly in the small gaps, the ring widthincreased after gap opening and continued to show the high growth for several years. Itdecreased solely in the last two years.
Forests 2021, 12, x FOR PEER REVIEW 12 of 19
Figure 6. Variability and median values of ring width related to tree sampled in each gap (large medium and small) and in forest. The box plots explanations are as in figure 2, with the difference of the median values represented here by the heavy horizontal line. The values are expressed in 100th of a millimeter (mm/100).
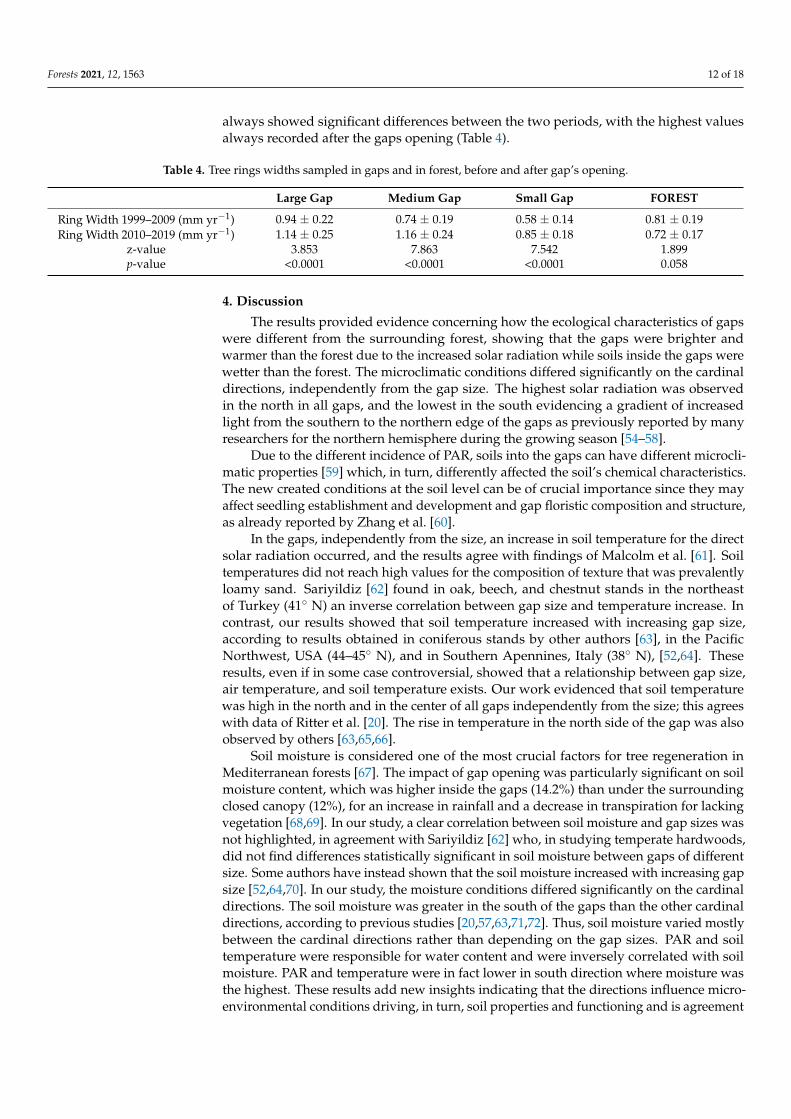
The trend of the tree ring width sampled in forest, not near the gaps, appeared to be different. While in the period from 1995 to 2009 the growth was in line with the growth of the trees sampled in the gaps (on average 0.81 mm year−1), subsequently the rings width gradually decreased (on average 0.72 mm year−1), but without significant differences be-tween the two periods (Table 4). On the contrary, the tree ring width sampled in the gaps always showed significant differences between the two periods, with the highest values always recorded after the gaps opening (Table 4).
Table 4. Tree rings widths sampled in gaps and in forest, before and after gap’s opening.
Large Gap Medium Gap Small Gap FOREST Ring Width 1999–
2009 (mm yr−1) 0.94 ± 0.22 0.74 ± 0.19 0.58 ± 0.14 0.81 ± 0.19
Ring Width 2010–2019 (mm yr−1)
1.14 ± 0.25 1.16 ± 0.24 0.85 ± 0.18 0.72 ± 0.17
z-value 3.853 7.863 7.542 1.899 p-value <0.0001 <0.0001 <0.0001 0.058
Figure 6. Variability and median values of ring width related to tree sampled in each gap (large medium and small) and inforest. The box plots explanations are as in Figure 2, with the difference of the median values represented here by the heavyhorizontal line. The values are expressed in 100th of a millimeter (mm/100).
The trend of the tree ring width sampled in forest, not near the gaps, appeared to bedifferent. While in the period from 1995 to 2009 the growth was in line with the growth ofthe trees sampled in the gaps (on average 0.81 mm year−1), subsequently the rings widthgradually decreased (on average 0.72 mm year−1), but without significant differencesbetween the two periods (Table 4). On the contrary, the tree ring width sampled in the gaps
Forests 2021, 12, 1563 12 of 18
always showed significant differences between the two periods, with the highest valuesalways recorded after the gaps opening (Table 4).
Table 4. Tree rings widths sampled in gaps and in forest, before and after gap’s opening.
Large Gap Medium Gap Small Gap FOREST
Ring Width 1999–2009 (mm yr−1) 0.94 ± 0.22 0.74 ± 0.19 0.58 ± 0.14 0.81 ± 0.19Ring Width 2010–2019 (mm yr−1) 1.14 ± 0.25 1.16 ± 0.24 0.85 ± 0.18 0.72 ± 0.17
z-value 3.853 7.863 7.542 1.899p-value <0.0001 <0.0001 <0.0001 0.058
4. Discussion
The results provided evidence concerning how the ecological characteristics of gapswere different from the surrounding forest, showing that the gaps were brighter andwarmer than the forest due to the increased solar radiation while soils inside the gaps werewetter than the forest. The microclimatic conditions differed significantly on the cardinaldirections, independently from the gap size. The highest solar radiation was observedin the north in all gaps, and the lowest in the south evidencing a gradient of increasedlight from the southern to the northern edge of the gaps as previously reported by manyresearchers for the northern hemisphere during the growing season [54–58].
Due to the different incidence of PAR, soils into the gaps can have different microcli-matic properties [59] which, in turn, differently affected the soil’s chemical characteristics.The new created conditions at the soil level can be of crucial importance since they mayaffect seedling establishment and development and gap floristic composition and structure,as already reported by Zhang et al. [60].
In the gaps, independently from the size, an increase in soil temperature for the directsolar radiation occurred, and the results agree with findings of Malcolm et al. [61]. Soiltemperatures did not reach high values for the composition of texture that was prevalentlyloamy sand. Sariyildiz [62] found in oak, beech, and chestnut stands in the northeastof Turkey (41◦ N) an inverse correlation between gap size and temperature increase. Incontrast, our results showed that soil temperature increased with increasing gap size,according to results obtained in coniferous stands by other authors [63], in the PacificNorthwest, USA (44–45◦ N), and in Southern Apennines, Italy (38◦ N), [52,64]. Theseresults, even if in some case controversial, showed that a relationship between gap size,air temperature, and soil temperature exists. Our work evidenced that soil temperaturewas high in the north and in the center of all gaps independently from the size; this agreeswith data of Ritter et al. [20]. The rise in temperature in the north side of the gap was alsoobserved by others [63,65,66].
Soil moisture is considered one of the most crucial factors for tree regeneration inMediterranean forests [67]. The impact of gap opening was particularly significant on soilmoisture content, which was higher inside the gaps (14.2%) than under the surroundingclosed canopy (12%), for an increase in rainfall and a decrease in transpiration for lackingvegetation [68,69]. In our study, a clear correlation between soil moisture and gap sizes wasnot highlighted, in agreement with Sariyildiz [62] who, in studying temperate hardwoods,did not find differences statistically significant in soil moisture between gaps of differentsize. Some authors have instead shown that the soil moisture increased with increasing gapsize [52,64,70]. In our study, the moisture conditions differed significantly on the cardinaldirections. The soil moisture was greater in the south of the gaps than the other cardinaldirections, according to previous studies [20,57,63,71,72]. Thus, soil moisture varied mostlybetween the cardinal directions rather than depending on the gap sizes. PAR and soiltemperature were responsible for water content and were inversely correlated with soilmoisture. PAR and temperature were in fact lower in south direction where moisture wasthe highest. These results add new insights indicating that the directions influence micro-environmental conditions driving, in turn, soil properties and functioning and is agreement
Forests 2021, 12, 1563 13 of 18
with the findings of Ritter et al. [20], Latif and Blackburn, and Kucera et al. [73,74]. Mi-croclimatic conditions play a key role in forest soil processes [75], particularly in organicmatter turnover which is intrinsically affected by soil moisture and temperature [76]. Inforest gaps, there is a high rate of soil organic matter decomposition and mineralization,leading to increased levels of nutrients [20,77–79]. Increments in ground nitrogen levelswere in fact observed in artificially created gaps [80].
Studies of the effects of gap sizes on litter decomposition rates showed conflictingresults [20,62,77,80,81]. C/N ratio, an index used to monitor the decomposition of litter [82],was the greatest in small gaps (where humification processes prevailed) mostly in northand east part of the gaps and the lowest in large gaps (where mineralization processesprevailed) in the south and west part of the gaps [52,64,83]. In medium gaps, the biologicalactivity was well documented by the highest activities of DHA and FDA, parametersassociated with the oxidoreductive and hydrolytic activities of soils and a great potassiumcontent resulting from the catabolism of the organic matter. These biological activities weresignificantly greater in the south of the gaps. This suggested that in the medium gaps therewas a better balance between humification and mineralization processes. In the small gaps,the humification of organic matter prevailed due to lower microbial activity. Conversely, inthe large gaps a higher mineralization process was demonstrated by a lower C/N ratio.The best soil biological conditions occurred in the medium gaps and the south was thebetter direction for the soil functioning.
These climatic and soil conditions inside the gaps influenced both beech naturalregeneration and tree growth at the edges of the gaps. In fact, the European beech re-generation, expressed as the number of seedlings per m2, was significantly influenced bythe gap size. On the other hand, recent studies resulted that the gap sizes may have aninfluence on establishment and growth of different tree species [24,84,85], confirming thestrict dependence of natural tree regeneration with light and soil characteristics affected bylight changes.
In our study, in the small gaps the beech regeneration density was significantly greaterthan in the large ones, but with no significant differences with the medium gaps. Mountfordet al. [86], in a managed beechwood in southern England, and Gálhidy et al. [87], in atemperate deciduous forest found more prolific beech regeneration in small and mediumgaps. Our results are also consistent with previous studies [32,88], reporting that Europeanbeech grew optimally in gap openings minor than 500 m2. In short, our result highlightedthat in the small and medium gaps, the combination of moderate levels of diffuse light andrelatively low levels of direct light created more favorable conditions in soil moisture andnutrients, particularly for nitrogen and potassium whose presence is important for beechnatural regeneration (species shade tolerant), confirming previous observations of otherauthors [58,89,90]. As observed by Cater and Diaci and Hammond and Pokorný, [85,91],the small and medium gaps are generally beneficial for the regeneration of shade-tolerantspecies, whereas large gaps are more adapt for light-adapted ones, suggesting that thenatural regeneration of species with different light-feeling can be steered with the size anddistribution of gaps.
In this study, it was found that there is a significant relationship between regenerationdensity and cardinal directions, evidencing that the European beech regeneration and theregeneration of shade-intolerant species may not be ascribed only to the gap size but alsoto the cardinal directions. According to Hammond and Pokorny [33], we found a greaterbeech regeneration density in the central area of the gaps compared to the outermost one,with a major density in south and east directions, only in the medium gaps. This result wasconsistent with the study of Orman et al. [9] carried on in an old growth forest in centralPoland, where the highest densities of beech seedlings were observed in plots located ingap center (as in our study). In contrast, the study of Vilhar et al. [92] showed that in abeech forest located in south-eastern Slovenia, the highest regeneration density was foundalong the edges of the gaps rather than in the center of the gaps. Orman et al. [9] found thatbeech seedlings were only affected by cardinal direction and not by gap size and that the
Forests 2021, 12, 1563 14 of 18
highest densities of beech seedlings were observed along east (as in our study) and west(unlike our study) directions. Nagel et al. (2010) Diaci et al., and Orman et al. [24,30,31],showed that large gaps can be crucial in promoting beech to taller life stages, believing thatthe gap size may influence the establishment and growth of species in different mannerdepending on species life stage (seedling, sapling, trees).
In our study, in the Mediterranean environment, in the large gaps the north positionreceived the highest direct light levels (PAR = 84.2%), while soil moisture values (12.7%)were the lowest. It is likely that these ecological factors can be the cause of a lesser beechnatural regeneration in the large gaps. In beech forest stands located in Central Bohemia(Czech Republic), Bílek et al. [90] showed that the ecological factors had an importantrole to explain the scarce regeneration density, as well as the limited cover of groundvegetation in large gap [54]. These findings suggested that the beech regeneration inforest stands was driven by gap openings, but not necessarily by the direct radiation [93],which mainly occurred at the northern edge of large gaps where we found a sparse beechnatural regeneration. The results of our study allowed us to state that moisture had a verysignificant effect on European beech regeneration in medium gaps but not in small andlarge gaps (Figure 3). On the contrary, the increase in soil temperature had a significantnegative effect on beech regeneration in medium gaps and non-significant effects in smalland large gaps.
On the other hand, soil moisture is one of the most important parameters for treeregeneration in Mediterranean forests and soil moisture content was particularly significantin the medium gaps (Figure 2). This, together with the low temperature, resulted in a greaternatural regeneration. Indeed, the temperature and moisture are negatively correlated witheach other (Figure 3), and European beech trees prefer low temperatures. Therefore, thedifference among the gaps can be related to a complex cross of data due to moisture andtemperature but also undercover vegetation amount, which in turn can affect nutrientcycles in soil.
The PAR increased as the gap size increased, but without a significant effect on beechregeneration in any gap. These results contradicted a remark of Sedmáková et al. [94] thatEuropean beech regeneration and growth was temperature-driven but confirmed data ofFarahat and Linderholm [95] showing that European beech is less sensitive to temperaturethan other parameters, as also emerged in our study, where moisture was observed to haveinfluenced beech natural regeneration very significantly in medium gaps (r = 0.68, p < 0.01).
The new microclimatic conditions due to the gap opening had effects on the treegrowth. Indeed, all of the trees located along the gap edge recorded higher productivitycompared to the period prior to the gap opening, as showed by the rapid increase inthe BAI values, especially in the trees sampled on the edges of the medium gaps. Onthe contrary, the trees located in the forest recorded BAI values coherent with the periodprior the gap opening. Trees located at the south and east had grater increments thantrees located at the north and west, especially in the medium gaps. The lower growth oftrees located in the north may depend on the highest direct light levels that generally thenorthern margin of the gaps received, and the consequent lowest soil moisture values. Thelatter was probably a result of high temperatures, high evaporation, and root competitionfrom gap edge trees [90].
Our results confirm that medium-sized gaps can create the ideal conditions to favorthe beech growth and regeneration. In natural processes of temperate forests, large gaps arerather rare [28,96]. In beech-dominated forests, the gaps larger than 400 m2 are consideredrare events [97,98].
5. Conclusions
Considering that silvicultural operations favor natural regeneration respecting nature,this study confirmed the important effect of the size of the gaps but mostly highlightedthe key role of cardinal directions inside the gaps on modulating micro-environmentalparameters, soil properties, and biological processes. The cardinal directions affected
Forests 2021, 12, 1563 15 of 18
the natural regeneration of beech which regenerated more in the south part of the gapsfollowed by the center, east, west, and north. Thus, the microclimate was different at thedifferent cardinal directions, creating in each point different conditions for tree naturalregeneration. Regarding gap size, in this study, medium gaps appeared to be the mostsustainable in terms of soil quality, maintaining the right balance between humificationand mineralization process and good microbial activity. In medium gaps, the combinationand interaction of microclimatic and soil parameters created the best conditions for thebeech natural regeneration and favored an increase in the productivity of the trees at theedge of the gaps.
Author Contributions: A.M.: conceived and designed the experiments, analyzed the data, and wrotethe manuscript. P.A.M. and M.S.: analyzed the data, performed statistical analyses, and criticallyreviewed and edited the manuscript. S.B., C.M. and F.M. performed the laboratory experimentsand collected the data in field. All authors have read and agreed to the published version ofthe manuscript.
Funding: This research did not receive any specific grant from funding agencies in the public.
Data Availability Statement: Data are contained within the article.
Conflicts of Interest: The authors declare no conflict of interest.
References1. Puettmann, K.J.; Coates, K.D.; Messier, C. A Critique of Silviculture; Managing for Complexity; Island Press: Washington, DC, USA, 2009.2. Conti, F.; Abbate, G.; Alessandrini, A.; Blasi, C. An Annotated Checklist of the Italian Vascular Flora; Palombi Editore: Roma, Italy, 2005.3. Marziliano, P.A.; Antonucci, S.; Tognetti, R.; Chirici, G.; Corona, P.; Lombardi, F. Factors affecting the quantity and type of
tree-related microhabitats in Mediterranean mountain forests of high nature value. iForest 2021, 14, 250–259. [CrossRef]4. Nocentini, S.; Buttoud, G.; Ciancio, O.; Corona, P. Managing forests in a changing world: The need for a systemic approach. A
review. For. Syst. 2017, 26, eR01. [CrossRef]5. Gardiner, B.; Blennow, K.; Carnus, J.M.; Fleischer, P.; Ingemarson, F.; Landmann, G.; Lindner, M.; Marzano, M.; Nicoll, B.;
Orazio, C.; et al. Destructive Storms in European Forests: Past and Forthcoming Impacts. European Forest Institute: Atlantic Euro-pean Regional Office. Final Report to DG Environment (07.0307/2009/SI2.540092/ETU/B.1). 2010, p. 138. Available online: https://www.researchgate.net/publication/234080766_Destructive_storms_in_European_forests_past_and_forthcoming_impacts(accessed on 4 November 2021).
6. Thom, D.; Seidl, R.; Steirer, G.; Krehan, H.; Formayer, H. Slow and fast drivers of the natural disturbance regime in CentralEuropean forest ecosystems. For. Ecol. Manag. 2013, 307, 293–302. [CrossRef]
7. Thom, D.; Seidl, R. Natural disturbance impacts on ecosystem services and biodiversity in temperate and boreal forests. Biol. Rev.2016, 91, 760–781. [CrossRef]
8. Kulakowski, D.; Svoboda, M.; Bebi, P. The central role of disturbances in mountain forests of Europe. For. Ecol. Manag. 2017, 388,1–2. [CrossRef]
9. Orman, O.; Wrzesinski, P.; Dobrowolska, D.; Szewczyk, J. Regeneration growth and crown architecture of European beech andsilver fir depend on gap characteristics and light gradient in the mixed montane old-growth stands. For. Ecol. Manag. 2021,482, 118866. [CrossRef]
10. Bottero, A.; Garbarino, M.; Dukic, V.; Govedar, Z.; Lingua, E.; Nagel, T.A.; Motta, R. Gapphase dynamics in the old-growth forestof Lom, Bosnia and Herzegovina. Silva Fenn. 2011, 45, 875–887. [CrossRef]
11. Nagel, T.A.; Svoboda, M. Gap disturbance regime in an old-growth Fagus–Abies forest in the Dinaric Mountains, Bosnia-Herzegovina. Can. J. For. Res. 2008, 38, 2728–2737. [CrossRef]
12. Rentch, J.S.; Schuler, T.M.; Nowacki, G.J.; Beane, N.R.; Ford, W.M. Canopy gap dynamics of second-growth red spruce-northernhardwood stands in West Virginia. For. Ecol. Manag. 2010, 260, 1921–1929. [CrossRef]
13. Muscolo, A.; Bagnato, S.; Sidari, M.; Mercurio, R. A review of the roles of forest canopy gaps. J. For. Res. 2014, 25, 725–736.[CrossRef]
14. Jaloviar, P.; Sedmáková, D.; Pittner, J.; Danková, L.J.; Kucbel, S.; Sedmákand, R.; Saniga, M. Gap structure and regeneration in themixed old-growth forests of National Nature Reserve Sitno, Slovakia. Forests 2020, 11, 81. [CrossRef]
15. Schliemann, S.; Bockheim, J. Methods for studying treefall gaps: A review. For. Ecol. Manag. 2011, 261, 1143–1151. [CrossRef]16. Marziliano, P.A.; Coletta, V.; Scuderi, A.; Scalise, C.; Menguzzato, G.; Lombardi, F. Forest structure of a maple old-growth stand:
A case study on the Apennines mountains (Southern Italy). J. Mt. Sci. 2017, 14, 1329–1340. [CrossRef]17. Muscolo, A.; Settineri, G.; Bagnato, S.; Mercurio, R.; Sidari, M. Use of canopy gap openings to restore coniferous stands in
Mediterranean environment. iForest 2017, 10, 322–327. [CrossRef]18. Košulic, O.; Michalko, R.; Hula, V.; Heneberg, P. Impact of canopy openness on spider communities: Implications for conservation
management of formerly coppiced Oak forests. PLoS ONE 2016, 11, e0148585. [CrossRef]
Forests 2021, 12, 1563 16 of 18
19. Wu, C.D.; Cheng, C.C.; Chang, C.C.; Lin, C.; Chang, K.C.; Chuang, Y.C. Gap shape classification using landscape indices andmultivariate statistics. Sci. Rep. 2016, 6, 38217. [CrossRef] [PubMed]
20. Ritter, E.; Dalsgaard, L.; Einhorn, K.S. Light, temperature and soil moisture regimes following gap formation in a semi-naturalbeech-dominated forest in Denmark. For. Ecol. Manag. 2005, 206, 1533. [CrossRef]
21. Rozenbergar, D.; Mikac, S.; Anic, I.; Diaci, J. Gap regeneration patterns in relationship to light heterogeneity in two old-growthbeech fir forest reserves in South East Europe. Forestry 2007, 80, 431–443.
22. Gray, A.N.; Spies, T.A.; Pabst, R.J. Canopy gaps affect long-term patterns of tree growth and mortality in mature and old-growthforests in the Pacific Northwest. For. Ecol. Manag. 2012, 281, 111–120. [CrossRef]
23. Stan, A.B.; Daniels, L.D. Growth releases across a natural canopy gap-forest gradient in old-growth forests. For. Ecol. Manag.2014, 313, 98–103. [CrossRef]
24. Orman, O.; Dobrowolska, D.; Szwagrzyk, J. Gap regeneration patterns in Carpathian old-growth mixed beech forests—Interactiveeffects of spruce bark beetle canopy disturbance and deer herbivory. For. Ecol. Manag. 2018, 430, 451–459. [CrossRef]
25. Dobrowolska, D.; Boncina, A.; Klumpp, R. Ecology and silviculture of silver fir (Abies alba Mill.): A review. J. For. Res. 2017, 22,326–335. [CrossRef]
26. Schwarz, J.A.; Bauhus, J. Benefits of mixtures on growth performance of silver fir (Abies alba) and European beech (Fagus sylvatica)increase with tree size without reducing drought tolerance. Front. For. Glob. Chang. 2019, 2, 79. [CrossRef]
27. Zeibig, A.; Diaci, J.; Wagner, S. Gap disturbance patterns of a Fagus sylvatica virgin forest remnant in the mountain vegetation beltof Slovenia. For. Snow Landsc. Res. 2005, 79, 69–80.
28. Drößler, L.; von Lüpke, B. Canopy gaps in two virgin beech forest reserves in Slovakia. J. For. Sci. 2005, 51, 446–457. [CrossRef]29. Kral, K.; Danek, P.; Janík, D.; Krucek, M.; Vrska, T. How cyclical and predictable are Central European temperate forest dynamics
in terms of development phases? J. Veg. Sci. 2018, 29, 84–97. [CrossRef]30. Nagel, T.A.; Svoboda, M.; Rugani, T.; Diaci, J. Gap regeneration and replacement patterns in an old-growth Fagus–Abies forest of
Bosnia–Herzegovina. Plant Ecol. 2010, 208, 307–318. [CrossRef]31. Diaci, J.; Adamic, T.; Rozman, A. Gap recruitment and partitioning in an old-growth beech forest of the Dinaric Mountains:
Influences of light regime, herb competition and browsing. For. Ecol. Manag. 2012, 285, 20–28. [CrossRef]32. Cater, M.; Diaci, J.; Roženbergar, D. Gap size and position influence variable response of Fagus sylvatica L. and Abies alba Mill. For.
Ecol. Manag. 2014, 325, 128–135. [CrossRef]33. Hammond, M.E.; Pokorný, R. Effects of gap size on natural regeneration and microenvironmental soil conditions in European
beech (Fagus sylvatica L.) and Norway spruce (Picea abies (L.) Karst) dominated mixed forest. Plant Soil Environ. 2020, 66, 607–615.[CrossRef]
34. FAO World Reference Base for Soil Resources. International Soil Classification System for Naming Soils and Creating Legends forSoil Maps. In World Soil Resources Reports; No. 106; FAO: Roma, Italy, 2014.
35. Rivas-Martinez, S. Clasificacìon Bioclimàtica de la tierra. Folia Bot. Madritensis 1996, 16, 1–32.36. Ciancio, O.; Iovino, F.; Mendicino, V.; Menguzzato, G.; Nicolaci, A.; Nocentini, S. Structure and management of Aleppo pine
forests. Options Méditerranéennes Ser. A 2008, 75, 61–72.37. Nocentini, S. Structure and management of beech (Fagus sylvatica L.) forests in Italy. iForest 2009, 2, 105–113. [CrossRef]38. Russo, D.; Marziliano, P.A.; Macrì, G.; Proto, A.R.; Zimbalatti, G.; Lombardi, F. Does thinning intensity affect wood quality? An
analysis of Calabrian pine in Southern Italy using a non-destructive acoustic method. Forests 2019, 10, 303. [CrossRef]39. Marziliano, P.A.; Tognetti, R.; Lombardi, F. Is tree age or tree size reducing height increment in Abies alba Mill. at its southernmost
distribution limit? Ann. For. Sci. 2019, 76, 17. [CrossRef]40. Russo, D.; Marziliano, P.A.; Macrì, G.; Zimbalatti, G.; Tognetti, R.; Lombardi, F. Tree growth and wood quality in pure vs.
mixed-species stands of European beech and Calabrian pine in Mediterranean mountain forests. Forests 2020, 11, 6. [CrossRef]41. Ciancio, O.; Iovino, F.; Menguzzato, G.; Nicolaci, A.; Nocentini, S. Structure and growth of a small group selection forest of
Calabrian pine in Southern Italy: A hypothesis for continuous cover forestry based on traditional silviculture. For. Ecol. Manag.2006, 224, 229–234. [CrossRef]
42. Arseneault, J.E.; Saunders, M.R.; Seymour, R.S.; Wagner, R.G. First decadal response to treatment in a disturbance-basedsilviculture experiment in Maine. For. Ecol. Manag. 2011, 262, 404–412. [CrossRef]
43. Comeau, P.G.; Gendron, F.; Letchford, T. A comparison of several methods for estimating light under a paper birch mixed woodstand. Can. J. For. Res. 1998, 28, 1843–1850. [CrossRef]
44. Bouyoucos, G.J. Hydrometer method improved for making particle size analysis of soils. Agron. J. 1962, 54, 464–465. [CrossRef]45. Walkley, A.; Black, I.A. An examination of the Degtjareff method for determining soil organic matter and a proposed modification
of the chromic acid titration method. Soil Sci. 1934, 37, 29–38. [CrossRef]46. Kjeldahl, J. Methode zur bestimmung des stickstoffs in organischen Körpern. Z Anal. Chem. 1883, 22, 366–382. [CrossRef]47. Kaminsky, R.; Muller, W.H. The extraction of soil phytotoxin using a neutral EDTA solution. Soil Sci. 1977, 124, 205–210.
[CrossRef]48. Kaminsky, R.; Muller, W.H. A recommendation against the use of alkaline soil extraction in the study of allelopathy. Plant Soil
1978, 49, 641–645. [CrossRef]49. Box, J.D. Investigation of the Folin-Ciocalteau reagent for the determination of polyphenolic substances in natural waters. Water
Res. 1983, 17, 511–525. [CrossRef]
Forests 2021, 12, 1563 17 of 18
50. Vance, E.D.; Brookes, P.C.; Jenkinson, D.S. An extraction method for measuring soil microbial biomass C. Soil Biol. Biochem. 1987,19, 703–707. [CrossRef]
51. Adam, G.; Duncan, H. Development of a sensitive and rapid method for the measurement of total microbial activity usingfluorescein diacetate (FDA) in a range of soils. Soil Biol. Biochem. 2001, 33, 943–951. [CrossRef]
52. Muscolo, A.; Sidari, M.; Mercurio, R. Variations in soil chemical properties and microbial biomass in artificial gaps in Silver firstands. Eur. J. For. Res. 2007, 126, 59–65. [CrossRef]
53. Marziliano, P.A.; Menguzzato, G.; Scuderi, A.; Corona, P. Simplified methods to inventory the current annual increment of foreststanding volume. iForest 2012, 5, 276–282. [CrossRef]
54. Diaci, J. Regeneration dynamics in a Norway spruce plantation on a silver fir-beech forest site in the Slovenian Alps. For. Ecol.Manag. 2002, 161, 27–38. [CrossRef]
55. Gagnon, J.L.; Jokela, E.J.; Moser, W.K.; Huber, D.A. Dynamics of artificial regeneration in gaps within a longleaf pine flatwoodsecosystem. For. Ecol. Manag. 2003, 172, 133–144. [CrossRef]
56. Mihók, B.; Gálhidy, L.; Kelemen, K.; Standovár, T. Study of gap-phase regeneration in a managed beech forest: Relations betweentree regeneration and light, substrate features and cover of ground vegetation. Acta Silv. Lign. Hung. 2005, 1, 25–38.
57. Raymond, P.; Munson, A.D.; Ruel, J.C.; Coates, K.D. Spatial patterns of soil, microclimate, light, regeneration, and growth withinsilvicultural gaps of mixed tolerant hardwood–white pine stands. Can. J. For. Res. 2006, 36, 639–651. [CrossRef]
58. Diaci, J.; Gyoerek, N.; Gliha, J.; Nagel, T.A. Response of Quercus robur L. seedlings to north-south asymmetry of light withingaps in floodplain forests of Slovenia. Ann. For. Sci. 2008, 65, 105. [CrossRef]
59. Denslow, J.S. Tropical rainforest gaps and tree species diversity. Annu. Rev. Ecol. Syst. 1987, 18, 431–451. [CrossRef]60. Zhang, X.R.; Tan, X.F.; Wang, R.Q.; Xu, N.N.; Guo, W.H. Effects of soil moisture and light intensity on ecophysiological
characteristics of Amorpha fruticosa seedlings. J. For. Res. 2013, 24, 293–300. [CrossRef]61. Malcom, D.C.; Mason, W.; Clarke, G.C. The transformation of conifer forests in Britain regeneration, gap size and silvicultural
systems. For. Ecol. Manag. 2001, 151, 7–23. [CrossRef]62. Sariyildiz, T. Effects of gap-size classes on long-term litter decomposition rates of beech, oak and chestnut species at high
elevations in Northeast Turkey. Ecosystems 2008, 11, 841–853. [CrossRef]63. Gray, A.N.; Spies, T.A.; Easter, M.J. Microclimate and soil moisture responses to gap formation in coastal Douglas-fir forests. Can.
J. For. Res. 2002, 32, 332–343. [CrossRef]64. Muscolo, A.; Sidari, M.; Mercurio, R. Influence of gap size on organic matter decomposition, microbial biomass and nutrient cycle
in Calabrian pine (Pinus laricio Poiret) stands. For. Ecol. Manag. 2007, 242, 412–418. [CrossRef]65. Bauhus, J. C and N mineralization in an acid forest soil along a gap-stand gradient. Soil Biol. Biochem. 1996, 28, 923–932. [CrossRef]66. Wright, E.F.; Coates, K.D.; Bartemucci, P. Regeneration from seed of six tree species in the interior cedar-hemlock forests of British
Columbia as affected by substrate and canopy gap position. Can. J. For. Res. 1998, 28, 1352–1364. [CrossRef]67. Sardans, J.; Peñuelas, J. Plant-soil interactions in Mediterranean forest and shrublands: Impacts of climatic change. Plant Soil 2013,
365, 1–33. [CrossRef] [PubMed]68. Zirlewangen, D.; von Wilpert, K. Modelling water and ion fluxes in a highly structured, mixed species stand. For Ecol. Manag.
2001, 143, 27–37. [CrossRef]69. Zhu, J.; Matsuzaki, T.; Lee, F.; Gonda, Y. Effect of gap size created by thinning on seedling emergency, survival and establishment
in a coastal pine forest. For. Ecol. Manag. 2003, 182, 339–354. [CrossRef]70. Ochiai, Y.; Okuda, S.; Sato, A. The influence of canopy gap size on soil water condition in a deciduous broad-leaved secondary
forest in Japan. J. Jpn For. Soc. 1994, 76, 308–314.71. Mihók, B.; Gálhidy, L.; Kenderes, K.; Standovár, T. Gap Regeneration Patterns in a Semi-natural Beech Forest Stand in Hungary.
Acta Silv. Lign. Hung. 2007, 3, 31–45.72. Albanesi, E.; Gugliotta, O.I.; Mercurio, I.; Mercurio, R. Effects of gap size and within-gap position on seedlings establishment in
silver fir stands. iForest 2008, 1, 55–59. [CrossRef]73. Latif, Z.A.; Blackburn, G.A. The effects of gap size on some microclimate variables during late summer and autumn in a temperate
broadleaved deciduous forest. Int. J. Biometeorol. 2010, 54, 119–129. [CrossRef]74. Kucera, A.; Holik, L.; Cerro, E.M.; Petrícek, J. Effect of gap size and forest type on mineral nitrogen forms under different soil
properties. J. For. Res. 2020, 31, 375–386. [CrossRef]75. Dai, X. Influence of light conditions in canopy gaps on forest regeneration: A new gap light index and its application in a boreal
forest in east central Sweden. For. Ecol. Manag. 1996, 84, 187–197. [CrossRef]76. Buckman, H.O.; Brady, N.C. The Nature and Properties of Soils; The Macmillian Co.: London, UK, 1969.77. Prescott, C.E.; Hope, G.D.; Blevins, L.L. Effect of gap size on litter decomposition and soil nitrate concentrations in a high
elevation spruce-fir forest. Can. J. For. Res. 2003, 33, 2210–2220. [CrossRef]78. Ritter, E.; Vesterdal, L. Gap formation in Danish beech (Fagus sylvatica) forests of low management intensity: Soil moisture and
nitrate in soil solution. Eur. J. For. Res. 2006, 125, 139–150. [CrossRef]79. Scharenbroch, B.C.; Bockheim, J.G. Gaps and soil C dynamics in old growth northern hardwoodhemlock forests. Ecosystems 2008,
11, 426–441. [CrossRef]80. Denslow, J.S.; Ellison, A.M.; Sanford, R.E. Treefall gap size effects on above-and below-ground processes in a tropical wet forest. J.
Ecol. 1998, 86, 597–609. [CrossRef]
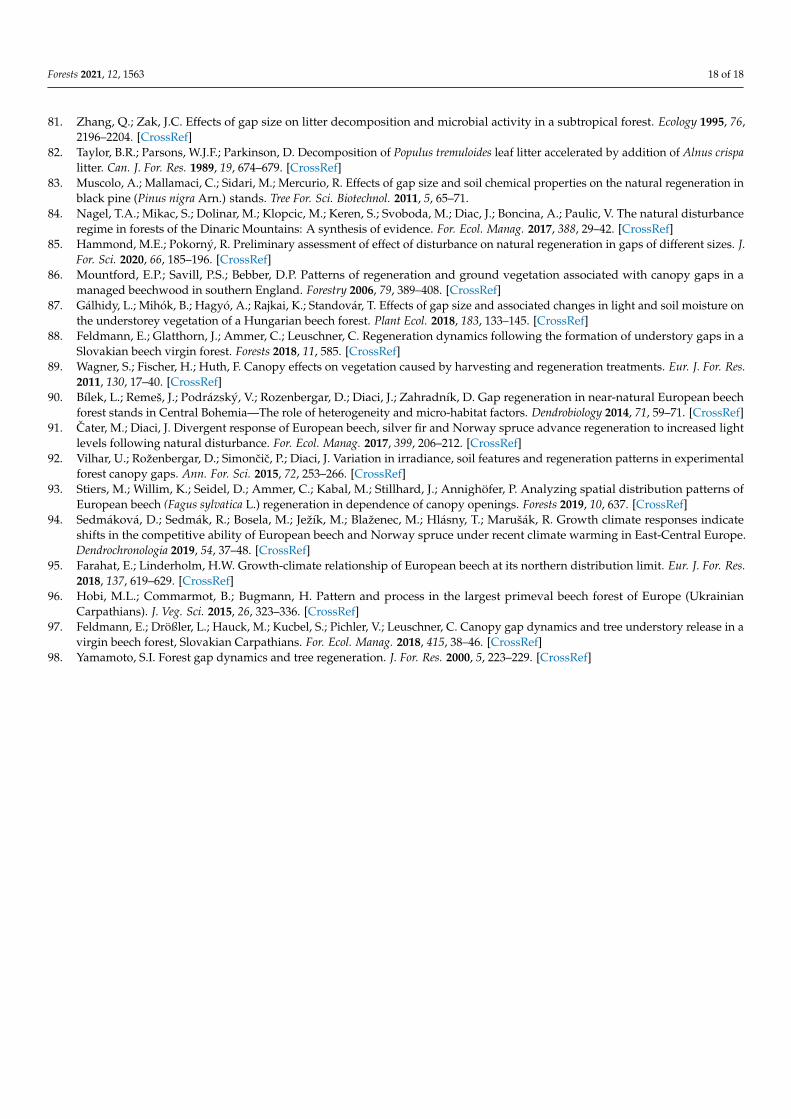
Forests 2021, 12, 1563 18 of 18
81. Zhang, Q.; Zak, J.C. Effects of gap size on litter decomposition and microbial activity in a subtropical forest. Ecology 1995, 76,2196–2204. [CrossRef]
82. Taylor, B.R.; Parsons, W.J.F.; Parkinson, D. Decomposition of Populus tremuloides leaf litter accelerated by addition of Alnus crispalitter. Can. J. For. Res. 1989, 19, 674–679. [CrossRef]
83. Muscolo, A.; Mallamaci, C.; Sidari, M.; Mercurio, R. Effects of gap size and soil chemical properties on the natural regeneration inblack pine (Pinus nigra Arn.) stands. Tree For. Sci. Biotechnol. 2011, 5, 65–71.
84. Nagel, T.A.; Mikac, S.; Dolinar, M.; Klopcic, M.; Keren, S.; Svoboda, M.; Diac, J.; Boncina, A.; Paulic, V. The natural disturbanceregime in forests of the Dinaric Mountains: A synthesis of evidence. For. Ecol. Manag. 2017, 388, 29–42. [CrossRef]
85. Hammond, M.E.; Pokorný, R. Preliminary assessment of effect of disturbance on natural regeneration in gaps of different sizes. J.For. Sci. 2020, 66, 185–196. [CrossRef]
86. Mountford, E.P.; Savill, P.S.; Bebber, D.P. Patterns of regeneration and ground vegetation associated with canopy gaps in amanaged beechwood in southern England. Forestry 2006, 79, 389–408. [CrossRef]
87. Gálhidy, L.; Mihók, B.; Hagyó, A.; Rajkai, K.; Standovár, T. Effects of gap size and associated changes in light and soil moisture onthe understorey vegetation of a Hungarian beech forest. Plant Ecol. 2018, 183, 133–145. [CrossRef]
88. Feldmann, E.; Glatthorn, J.; Ammer, C.; Leuschner, C. Regeneration dynamics following the formation of understory gaps in aSlovakian beech virgin forest. Forests 2018, 11, 585. [CrossRef]
89. Wagner, S.; Fischer, H.; Huth, F. Canopy effects on vegetation caused by harvesting and regeneration treatments. Eur. J. For. Res.2011, 130, 17–40. [CrossRef]
90. Bílek, L.; Remeš, J.; Podrázský, V.; Rozenbergar, D.; Diaci, J.; Zahradník, D. Gap regeneration in near-natural European beechforest stands in Central Bohemia—The role of heterogeneity and micro-habitat factors. Dendrobiology 2014, 71, 59–71. [CrossRef]
91. Cater, M.; Diaci, J. Divergent response of European beech, silver fir and Norway spruce advance regeneration to increased lightlevels following natural disturbance. For. Ecol. Manag. 2017, 399, 206–212. [CrossRef]
92. Vilhar, U.; Roženbergar, D.; Simoncic, P.; Diaci, J. Variation in irradiance, soil features and regeneration patterns in experimentalforest canopy gaps. Ann. For. Sci. 2015, 72, 253–266. [CrossRef]
93. Stiers, M.; Willim, K.; Seidel, D.; Ammer, C.; Kabal, M.; Stillhard, J.; Annighöfer, P. Analyzing spatial distribution patterns ofEuropean beech (Fagus sylvatica L.) regeneration in dependence of canopy openings. Forests 2019, 10, 637. [CrossRef]
94. Sedmáková, D.; Sedmák, R.; Bosela, M.; Ježík, M.; Blaženec, M.; Hlásny, T.; Marušák, R. Growth climate responses indicateshifts in the competitive ability of European beech and Norway spruce under recent climate warming in East-Central Europe.Dendrochronologia 2019, 54, 37–48. [CrossRef]
95. Farahat, E.; Linderholm, H.W. Growth-climate relationship of European beech at its northern distribution limit. Eur. J. For. Res.2018, 137, 619–629. [CrossRef]
96. Hobi, M.L.; Commarmot, B.; Bugmann, H. Pattern and process in the largest primeval beech forest of Europe (UkrainianCarpathians). J. Veg. Sci. 2015, 26, 323–336. [CrossRef]
97. Feldmann, E.; Drößler, L.; Hauck, M.; Kucbel, S.; Pichler, V.; Leuschner, C. Canopy gap dynamics and tree understory release in avirgin beech forest, Slovakian Carpathians. For. Ecol. Manag. 2018, 415, 38–46. [CrossRef]
98. Yamamoto, S.I. Forest gap dynamics and tree regeneration. J. For. Res. 2000, 5, 223–229. [CrossRef]