Commission for Agricultural Costs and PricesDepartment of Agriculture, Cooperation & Farmers Welfare
Ministry of Agriculture & Farmers Welfare Government of India
March, 2021

Vijay Paul Sharma Commission for Agricultural Costs and PricesChairman Department of Agriculture, CooperationTel : 011-23385216 & Farmers WelfareFax : 011-23383848 Ministry of Agriculture & Farmers Welfare Krishi Bhawan, New Delhi-110 001
Preface
I have the honour and privilege to submit “Price Policy for Kharif Crops: The Marketing Season 2021-22” report. The report contains the recommendations on Minimum Support Prices (MSP) for the mandated crops and a set of non-price measures. I believe that these recommendations will incentivise farmers for adoption of improved technologies and shift in cropping pattern to make kisan Atmanirbhar and Indian krishi globally competitive.
Summary of Recommendations is followed by an overview of Indian agriculture in Chapter 1. Chapter 2 of the report discusses demand-supply situation and outlook, price trends in domestic markets, terms of trade and procurement operations. Trends in productivity, yield gap analysis and important drivers of productivity are analysed in Chapter 3. Trade patterns, comparison of domestic and world prices, a review of recent trade policy changes and trade outlook are presented in Chapter 4. Costs, returns and cost projections for Kharif Marketing Season 2021-22 including inter-crop price parity issue are analysed in Chapter 5. Finally, major considerations leading to recommendations of the Minimum Support Prices and key non-price policy suggestions are discussed in Chapter 6.
Many people have assisted in preparation of this report. I take this opportunity to express my sincere thanks to State Governments, various Ministries/Departments of Government of India, farmers/farmers’ associations, representatives of organizations involved in procurement, post-harvest management, processing and marketing of agricultural commodities, agribusiness companies, and various other stakeholders for providing valuable insights and suggestions in preparation of this report. Special thanks to the Directorate of Economics and Statistics, Ministry of Agriculture & Farmers Welfare for providing data on cost estimates for this report.
Last but not least, credit goes to officers and staff of the Commission, who contributed to this report. My special thanks to Dr. Naveen P. Singh, Member (Official) for his invaluable contribution and suggestions in preparation of the report. Sincere gratitude to Sh. Anupam Mitra, Member Secretary for his contribution and efforts in preparation and timely
publication of the report. The report would not have been possible without contributions of Advisors, Shri D. K. Pandey, Dr. Mohd. Nazmuddin and Mrs. Seema, and other officers Sh. Raj Kumar, Dr. Sunil Kumar Gupta, Mrs. Manju Mary Paul, Ms. Leena Kumar, Sh. Sube Singh, Sh. Suraj Kumar Shukla, Mrs. Shivani, Mrs. Anu Malhotra, Dr. Bhavik Lukka, Md. Abdul Aleem, Sh. Mohd Shoeb, Sh. A. K. Pandey, Smt. Meenakshi Choudhary, Sh. Ashok Kumar, Sh. Chandra Kumar, Sh. Mohd. Shoeb Malik and Sh. M.K. Gupta. I would like to thank them all for their excellent contribution and support. I express my thanks to other officers and dedicated staff members the Commission for administrative support.
31th March 2021 (Vijay Paul Sharma)
VII
Cont
ents
The Marketing Season 2021-22
ContentsChapter No. Description Page No.
Acronyms XIXSummary of Recommendations XXIIIPrice-Policy Recommendations XXIIINon-Price Recommendations XXIV
1 Overview 1India's Agriculture Trade Scenario 2Central Pool Stocks and Challenges in Management of Surplus Stocks 3Ensuring Renumerative Price to Farmers 5Food Inflation 7Agricultural Marketing Reforms 8Market Infrastructure 8Direct Income Support: PM-KISAN 9Agriculture Credit 9Farm Mechanization 10Crop Diversification 10Storage and Warehousing 11Food Processing and Value Addition 12Outlook for Indian Agriculture 12World Outlook 13Structure of the Report 14
2 Demand-Supply Outlook, Prices and Price Support Operations 15World Trends and Outlook 15Domestic Scenario 17
Food Inflation 18Market Prices vis-à-vis MSP 20
Paddy 20Maize 23
Pulses 25Tur 25Moong 27Urad 29
Oilseeds 31Groundnut 31Soybean 33
Cotton 34Trends in Terms of Trade 36Procurement Policy and Operations 37Procurement Trends 38
VIII
Cont
ents
The Marketing Season 2021-22
Chapter No. Description Page No.Coverage of Farmers 40Participation of Small and Marginal Farmers in Procurement 42Land Suitability for Rice Cultivation 43
Nutri-Cereals 46Pulses 47Oilseeds 48Cotton 49
Bonus on MSP: Market Distortions 50Market Fees and Other Incidental Charges 51Equity Issues in Rice Procurement 52Food Subsidy and Economic Cost 53Awareness about MSP and FAQ Norms 55Recapitulation 55
3 Crop Yield and Input Management 57Yield Growth Trends 57
Cereals 57Pulses 58Oilseeds 58Cotton 59
Yield Trends in Major Producing States 60Rice 60Maize 62Pulses 62 Tur 63 Moong 64 Urad 64Oilseeds 65Cotton 66
Yield Gap Analysis 67Rice 67Maize 68Bajra 69Pulses 70Oilseeds 73Cotton 75
Drivers of Yield Growth 76Quality Seeds 76Irrigation 77Fertilizers 79Soil Health Management: “Swasth Dharaa, Khet Haraa” 81Farm Mechanization 81Agricultural Credit 83
Country Comparisons of Crop Yield 85Recapitulation 86
IX
Cont
ents
The Marketing Season 2021-22
Chapter No. Description Page No.4 Trade Competitiveness of Indian Agriculture 88
Global Trade Performance 88India’s Agricultural Trade Performance 89Trade Patterns and Trade Policy of Major Kharif Crops 90Rice 90
Global Production and Trade 90 India’s Trade 92 Trade Policy 93 Comparative Trends in Prices 94
Maize 95 Global Production and Trade 95 India's Trade 95 Trade Policy 96 Comparative Trends in Prices 96
Sorghum/Jowar 97Global Production and Trade 97 India's Trade 98 Comparative Trends in Prices 99
Pulses 100 Global Production and Trade 100 India's Trade 101 Trade Policy 103 Comparative Trends in Prices 104
Oilseeds and Edible Oils 105 Global Production and Trade 105 India’s Trade 107
Soybean Complex 108 Global Production and Trade 108 Soybean 108 Soybean Oil 108 Soybean Meal 109 India’s Trade 109 Comparative Price Trends 110
Groundnut 112 Global Production and Trade 112 India’s Trade 113 Comparative Price Trends 114
Sunflower 115 Global Production and Trade 115 India’s Trade 116 Comparative Price Trends 116
Trade Policy 118Cotton 119
Global Production and Trade 119 India’s Trade 120 Trade Policy 121
X
Cont
ents
The Marketing Season 2021-22
Chapter No. Description Page No. Comparative Price Trends 121
Global Outlook 122Recapitulation 123
5 Costs, Returns and Inter-Crop Parity 124Costs and Returns of Kharif Crops during TE2018-19 125Movement in Agricultural Wages and Farm Input Prices 128Cost Projections for Crop Season 2021-22 131Inter-Crop Parity in Returns of Kharif Crops 143Comparison of CACP Cost Estimates with State Estimates 144Issues Related to Sample Size under Comprehensive Scheme 146Recapitulation 147
6 Considerations and Recommendations for Price Policy 148Considerations 148
Domestic Demand-Supply Scenario 148Price Trends 149Global Scenario 149Trade Performance 150Procurement Operations and Efficacy 150Drivers of Productivity 151Terms of Trade 151Cost of Production and Profitability 152
Non-Price Policy Recommendations 152Review Open Ended-Procurement Policy 152Special Scheme for Crop Diversification in Indo-Gangetic Plains 153Review and Strengthen PM-AASHA 153Effective Participation of States in Price Support Scheme (PSS) 154Promotion of Nutri-cereals as Healthy Foods 154Improve Crop Productivity 155Bridging Yield Gaps 155Promote Balanced Use of Fertilizers 155Farm Mechanization 156Agricultural Credit 156Strengthen Market Infrastructure and Institutions 157Storage and Warehousing 157Direct Income Support: PM-KISAN 158Commodity Markets Outlook and Regional Crop Planning 158Distortions in Agricultural Markets 158MSP Awareness and Publicity 159Issues Related to Sample Size in Cost Estimation 159
Price Policy Recommendations 159
XI
List
of T
able
s
The Marketing Season 2021-22
List of TablesTable No. Title Page No.
S.1 MSPs recommended for Kharif Marketing Season 2021-22 XXIII
2.1 Global Supply and Demand Outlook for Rice, Maize and Soybean 16
2.2 Domestic Supply of Rice in India 17
2.3 Demand-Supply Estimates of Cotton in India 18
2.4 Market Prices vis-à-vis MSP of Rice in Major Producing States in KMS 2020-21 (Oct 2020 to Feb 2021) 22
2.5 Market Prices vis-à-vis MSP of Maize in Major Producing States in KMS 2020-21 (Oct 2020 to Feb 2021) 24
2.6 Market Prices vis-à-vis MSP of Tur in Major Producing States in KMS 2020-21 (Oct 2020 to Feb 2021) 26
2.7 Market Prices vis-à-vis MSP of Moong in Major Producing States in KMS 2020-21 (Oct 2020 to Feb 2021) 28
2.8 Market Prices vis-à-vis MSP of Urad in Major Producing States in KMS 2020-21 (Oct 2020 to Feb 2021) 29
2.9 Market Prices vis-à-vis MSP of Groundnut in Major Producing States in KMS 2020-21 (Oct 2020 to Feb 2021) 31
2.10 Market Prices vis-à-vis MSP of Soybean in Major Producing States in KMS 2020-21 (Oct 2020 to Feb 2021) 34
2.11 Market Prices vis-à-vis MSP of Cotton in Major Producing States in KMS 2020-21 (Oct 2020 to Feb 2021) 35
2.12 Procurement of Paddy by Farm-Size in Andhra Pradesh, Chhattisgarh, Telangana, Uttar Pradesh, Gujarat and Odisha in 2019-20 and 2020-21 42
2.13 Bonus Declared by Selected States for Paddy 50
2.14 State-wise Fees/Taxes/Charges levied on Rice Procurement 51
2.15 Share of Beneficiary Farmers, Procurement in Marketed Surplus and Procurement per Farmer in major Producing States 53
3.1 Triennial Trends in Growth Rate of Area, Production and Yield of Major Kharif Crops 59
3.2 Estimated Additional Production of Kharif Pulses by Bridging Yield Gap 72
3.3 Estimated Additional Production of Kharif Oilseeds by Bridging Yield Gaps 75
3.4 Seed Replacement Rate Target and Achievement in Major Kharif Crops, 2019-20 77
XII
List
Of t
able
s
The Marketing Season 2021-22
Table No. Title Page No.
3.5 Fertilizer Responses during Different Plan Periods 80
3.6 Yield Comparison for Major Crops (2019) 86
5.1 All-India Average Costs and Gross Returns over Actual Cost of Cultivation of Kharif Crops (Average from 2016-17 to 2018-19) 127
5.2 Average Growth Rate of Daily Wage Rates of Agricultural Labour by Major States and at All-India Level during Kharif Season 129
5.3 Trends in All-India Farm Input Price Indices (Base 2011-12 = 100) 132
5.4 Projected Cost of Production (CoP) of Mandated Kharif Crops, KMS 2021-22 133
5.5 Crop-wise Relative Average Gross Returns (%), with respect to Paddy, TE2018-19 143
6.1 MSPs recommended for KMS 2021-22 160
XIII
List
of C
hart
s
The Marketing Season 2021-22
List of ChartsChart No. Title Page No.
1.1 Trends in India’s Exports and Imports of Agricultural Products, 2010-11 to 2020-21 3
1.2 Trends in Stock Position and Stocking Norms of Total Foodgrains and Rice in the Central Pool, January 2013 to January 2021 5
2.1 Inflation of Food Articles based on Wholesale Price Index (2011-12=100) 19
2.2 Inflation of Food Articles based on Consumer Price Index (2012=100) 20
2.3 Trends in Market Prices vis-à-vis MSP of Paddy (Oct 2016 to Jan 2021) 21
2.4 Comparison of Market Prices and MSP of Paddy in Andhra Pradesh, Uttar Pradesh and West Bengal during KMS 2020-21 (Oct 2020 to Feb 2021) 22
2.5 Trends in Market Prices vis-à-vis MSP of Maize (Oct 2016 to Jan 2021) 23
2.6 Comparison of Market Prices and MSP of Maize in Karnataka, Madhya Pradesh and Maharashtra during KMS 2020-21 (Oct 2020 to Feb 2021) 24
2.7 Trends in Market Prices vis-à-vis MSP of Tur (Oct 2016 to Feb 2021) 25
2.8 Comparison of Market Prices and MSP of Tur in Karnataka, Maharashtra and MP during KMS 2020-21 (Oct 2020 to Feb 2021) 26
2.9 Trends in Market Prices vis-à-vis MSP of Moong (Oct 2016 to Feb 2021) 27
2.10 Comparison of Market Prices and MSP of Moong in Maharashtra, Rajasthan and MP during KMS 2020-21 (Oct 2020 to Feb 2021) 28
2.11 Trends in Market Prices vis-à-vis MSP of Urad (Oct 2016 to Feb 2021) 30
2.12 Comparison of Market Prices and MSP of Urad in MP, Uttar Pradesh and Tamil Nadu during KMS 2020-21 (Oct 2020 to Feb 2021) 30
2.13 Trends in Market Prices vis-à-vis MSP of Groundnut (Oct 2016 to Jan 2021) 32
2.14 Comparison of Market Prices and MSP of Groundnut in Rajasthan and Gujarat during KMS 2020-21 (Oct 2020 to Feb 2021) 32
2.15 Trends in Market Prices vis-à-vis MSP of Soybean (Oct 2016 to Jan 2021) 33
2.16 Comparison of Market Prices and MSP of Soybean in Maharashtra and Madhya Pradesh during KMS 2020-21 (Oct 2020 to Feb 2021) 34
2.17 Trends in Market Prices vis-à-vis MSP of Cotton (Oct 2016 to Jan 2021) 35
2.18 Comparison of Market Prices and MSP of Cotton in Maharashtra and Gujarat during KMS 2020-21 (Oct 2020 to Jan 2021) 36
2.19 Trends in Index of Farmers' Terms of Trade (FToT) and Agricultural Terms of Trade (AGRToT) 37
XIV
List
of C
hart
s
The Marketing Season 2021-22
Chart No. Title Page No.
2.20 Rice Procurement Trends in Major States during TE2015-16 and TE2019-20 39
2.21 Procurement of Rice in Major Producing States, TE 2019-20 40
2.22 Share of Major States in Marketed Surplus and Procurement of Rice, TE2019-20 41
2.23 Trends in Number of Paddy Farmers Benefitting from Procurement 41
2.24 India’s Rice Cultivation and Suitability Maps 44
2.25 Changing cropping pattern in Punjab: 1970-71 to 2018-19 45
2.26 Share of Over-exploited Blocks in Major Rice Growing States 45
2.27 Procurement of Nutri-Cereals during KMS 2016-17 to KMS 2020-21 46
2.28 Procurement of Maize during KMS 2016-17 to KMS 2020-21 47
2.29 Procurement of Pulses during 2016-17 to 2020-21 48
2.30 Procurement of Oilseeds during 2016-17 to 2020-21 49
2.31 Year-wise MSP procurement of Cotton during 2016-17 to 2020-21 50
2.32 Trend in Subsidy Position of FCI 54
2.33 Share of different components of Economic Cost of Rice Procurement during 2020-21 55
3.1 Average Yield of Rice in Major Producing States 60
3.2 Compound Annual Growth Rate (CAGR) in Rice Yield, 2011-12 to 2020-21 61
3.3 Average Yield of Maize in Major Producing States 62
3.4 Average Yield of Kharif Pulses in Major Producing States 63
3.5 Average Yield of Tur in Major Producing States 63
3.6 Average Yield of Moong in Major Producing States 64
3.7 Average Yield of Urad in Major Producing States 65
3.8 Average Yield of Soybean in Major Producing States 65
3.9 Average Yield of Groundnut in Major Producing States 66
3.10 Average Yield of Cotton in Major Producing States 67
3.11 Comparison of Potential, Realized and State Average Yields of Rice in Selected States 68
3.12 Comparison of Potential, Realized and State Average Yields of Maize in Selected States 69
3.13 Comparison of Potential, Realized and State Average Yields of Bajra in Selected States 70
3.14 Comparison of Potential, Realized and State Average Yields of Tur in Selected States 71
XV
List
of C
hart
s
The Marketing Season 2021-22
Chart No. Title Page No.
3.15 Comparison of Potential, Realized and State Average Yields of Urad in Selected States 71
3.16 Comparison of Potential, Realized and State Average Yields of Moong in Selected States 72
3.17 Comparison of Potential, Realized and State Average Yields of Oilseeds in Selected States- Soybean 73
3.18 Comparison of Potential, Realized and State Average Yields of Oilseeds in Selected States- Sesamum 74
3.19 Comparison of Potential, Realized and State Average Yields of Oilseeds in Selected States- Nigerseed 74
3.20 Comparison of Potential, Realized and State Average Yields of Cotton in Selected States 76
3.21 Foodgrains Yield and Irrigation Coverage in Major States 78
3.22 Share of Major States in Area Covered under Micro-Irrigation under PMKSY More Crop Per Drop (2019-20) 79
3.23 Trends in Consumption of Fertilizers 80
3.24 Trend in Distribution of Agricultural credit 84
3.25 State-wise Agricultural Credit to GVA (Crops) Ratio (2019-20) 85
4.1 Composition of India’s Agricultural Exports and Imports in 2019-20 90
4.2 Global Players in Rice Markets, TE2019-20 91
4.3 India’s Export of Rice, 2010-11 to 2020-21 92
4.4 MSP, Domestic and International Prices of Paddy, 2016 to 2020 94
4.5 Global Players in Maize Market, TE2019-20 95
4.6 India's Exports of Maize, 2010-11 to 2020-21 96
4.7 MSP, Domestic and International Prices of Maize, 2016-2020 97
4.8 Major Producers of Jowar in TE2019-20 98
4.9 India's Exports of Jowar, 2010-11 to 2020-21 99
4.10 MSP, Domestic and International Prices of Jowar, 2016-2020 99
4.11 Major Producers of Pulses, TE2019 101
4.12 India’s Import of Pulses, 2010-11 to 2020-21 102
4.13 Changing Composition of India’s Pulses Imports 102
4.14 MSP, Domestic and International Prices of Arhar, 2016-2020 104
4.15 MSP, Domestic and International Prices of Urad, 2016-2020 105
4.16 MSP, Domestic and International Prices of Moong, 2016-2020 105
XVI
List
of C
hart
s
The Marketing Season 2021-22
Chart No. Title Page No.
4.17 Major Producers of Oilseeds and Vegetable Oils, TE2019-20 106
4.18 India’s Import of Edible Oils, 2010-11 to 2020-21 107
4.19 India’s Import of Soybean Oil, 2010-11 to 2020-21 109
4.20 India’s Export of Soybean Meal, 2010-11 to 2020-21 110
4.21 MSP, Domestic and International Prices of Soybean, 2016 to 2020 110
4.22 Domestic and International Prices of Soybean Oil, 2016 to 2020 111
4.23 Domestic and International Prices of Soybean Meal, 2016 to 2020 112
4.24 India’s Export of Groundnut, 2010-11 to 2020-21 113
4.25 MSP, Domestic and International Prices of Groundnut, 2016 to 2020 114
4.26 Domestic and International Prices of Groundnut Oil, 2016 to 2020 114
4.27 India’s Import of Sunflower Oil, 2010-11 to 2020-21 116
4.28 MSP, Domestic and International Prices of Sunflower Seed, 2016 to 2020 116
4.29 Domestic and International Prices of Sunflower Oil, 2016 to 2020 117
4.30 Global Players in Cotton markets, TE2019-20 120
4.31 India's Exports of Cotton, 2010-11 to 2020-21 121
4.32 MSP, Domestic and International Prices of Raw Cotton, 2016-2020 122
5.1 All-India Average Gross Returns of Kharif Crops, TE2018-19 128
5.2 Average Daily Wage Rates and Growth in Wages in Selected States during Kharif Season 2020 130
5.3 Movements in WPI of Farm Inputs during Kharif Season in 2019 and 2020 131
5.4 (a to m) Supply Curve and Projected CoP for Mandated Kharif Crops, KMS 2021-22 136
5.5 Crop-wise Relative Average Gross Returns (%), with respect to Paddy, TE2018-19 144
XVII
List
of A
nnex
Tab
les
The Marketing Season 2021-22
List of Annex TablesTable No. Title Page No.
1.1 All-India Estimates of Area under Principal Crops 162
1.2 All-India Estimates of Production of Principal Crops 164
1.3 All-India Estimates of Yield of Principal Crops 166
1.4 Share of Major States in All-India Production of Mandated Kharif Crops, TE2020-21 168
2.1 World Supply and Use of Coarse Grains and Oilseeds 169
2.2 World Supply and Use of Cotton 170
2.3 List of DCP States for Rice and Wheat 171
2.4 Procurement of Nutri-Cereals and Maize in Major Producing States during KMS 2019-20 and KMS 2020-21 172
2.5 State-wise Procurement of Pulses (KMS 2018-19 to KMS 2020-21) 173
2.6 State-wise Procurement of Groundnut and Soybean (KMS 2018-19 to KMS 2020-21) 174
2.7 Break-up of Economic Cost of Rice Procurement by FCI 175
2.8 Sanctioned quantity and Procurement of pulses and oilseeds under PSS (average of 2018-19 and 2019-20) 176
3.1 State-wise Number of Machinery Distributed on Individual Ownership Basis and CHCs /Hi-tech Hubs/Farm Machinery Banks Established since Inception of SMAM and CRM Schemes
177
4.1 Leading Exporters and Importers in World Merchandise Trade, 2019 178
4.2 Top 10 Exporters and Importers of Agricultural Products, 2019 180
4.3 India's Total Exports and Imports vis-a-vis Agricultural Exports and Imports, 2010-11 to 2019-20 181
4.4 Major Export Destinations of Indian Rice, 2016-17 to 2019-20 182
4.5 India's Top Import Origins of Pulses 183
4.6 Import Duty on Edible Oils w.e.f 2nd February, 2021 184
4.7 India's Agricultural Exports of Major Commoditities 185
4.8 India's Agricultural Imports of Major Commoditities 186
4.9 Quarterly Domestic and International Prices of Kharif Crops 187
5.1 Average Gross Returns over Actual Cost of Cultivation of Kharif Crops in Selected States, TE2018-19 189
XVIII
List
of A
nnex
Tab
les
The Marketing Season 2021-22
Table No. Title Page No.
5.2 Month-wise and State-wise Average Daily Wage Rates for Agricultural Labour (Man) 195
5.3 Monthly Wholesale Price Index (Base 2011-12=100) of Major Farm Inputs 200
5.4 Projected Cost of Production (A2, A2+FL & C2) of Kharif Crops for KMS 2021-22 and Production Shares during TE2019-20 203
5.5 (a to n) Break-up of Cost of Cultivation 207
5.6 All-India Projected Costs of Production of Kharif Crops for KMS 2021-22 and KMS 2020-21 299
5.7 Camparision of State and CACP Projected Cost of Production (C2) of Kharif Crops for KMS 2021-22 300
5.8 Crop-wise States having small/thin Sample Sizes and Non-Projection of Cost of Production of Kharif Crops for KMS 2021-22 304
5.9 Crop-wise Inclusion of States under Comprehensive Scheme 306
XIX
Acro
nym
s
The Marketing Season 2021-22
AcronymsA2 Actual paid out cost
A2+FL Actual paid out cost plus imputed value of family labour
AGMARKNET Agricultural Marketing Information Network
AGRToT Agriculture Terms of Trade
AICRP All India Coordinated Research Project
AMI Agriculture Market Infrastructure
AMIS Agricultural Market Information System
APEDA Agricultural and Processed Food Products Export Development Authority
APMC Agricultural Produce Market Committee
ASEAN Association of Southeast Asian Nations
ATMA Agricultural Technology Management Agency
BE Budget Estimates
C2 Comprehensive cost including imputed rent and interest on owned land and capital
CAB Cotton Advisory Board
CACP Commission for Agricultural Costs and Prices
CAGR Compound Annual Growth Rate
CCI Cotton Corporation of India
CFPI Consumer Food Price Index
CHC Custom Hiring Centre
CIP Central Issue Price
CIPI Composite Input Price Index
CoC Cost of Cultivation
CoP Cost of Production
CPI Consumer Price Index
CPO Crude Palm Oil
CRM Crop Residue Management
CS Comprehensive Scheme
DAC&FW Department of Agriculture, Cooperation & Farmers Welfare
DCP Decentralized Procurement
XX
Acro
nym
s
The Marketing Season 2021-22
DES Directorate of Economics and Statistics
DGCIS Directorate General of Commerce Intelligence & Statistics
DGFT Directorate General of Foreign Trade
DIPP Department of Industrial Policy & Promotion
DMI Directorate of Marketing & Inspection
EDI Electronic Data Interchange
e-NAM National Agriculture Market
EU European Union
FAI Fertilizers Association of India
FAO Food and Agriculture Organisation
FAQ Fair Average Quality
FCI Food Corporation of India
FFPI FAO Food Price Index
FLDs Front Line Demonstrations
FMTTIs Farm Machinery Training and Testing Institutes
FOB Free on Board
FTA Free Trade Agreement
FToT Farmers' Terms of Trade
GDP Gross Domestic Products
GMO Genetically Modified Organisms
GrAMs Gramin Agricultural Markets
GVA Gross Value Added
GVO Gross Value of Output
HSD High Speed Diesel
ICAR Indian Council of Agricultural Research
ICDS Integrated Child Development Services
IGC International Grains Council
IMCECA India-Malaysia Comprehensive Economic Cooperation Agreement
KMS Kharif Marketing Season
KVK Krishi Vigyan Kendra
LCS Land Custom Stations
MDM Mid-Day Meal
MEIS Merchandise Exports from India Scheme
XXI
Acro
nym
s
The Marketing Season 2021-22
MEP Minimum Export Price
MIP Minimum Import Price
MoSPI Ministry of Statistics and Programme Implementation
MRL Maximum Residue Limit
MSP Minimum Support Price
NABARD National Bank for Agriculture and Rural Development
NAFED National Agricultural Cooperative Marketing Federation of India Ltd.
NFSA National Food Security Act
NMSA National Mission for Sustainable Agriculture
NPC National Productivity Council
NPK Nitrogen, Phosphorous and Potassium
NSSF National Small Savings Fund
NWRs Negotiable Warehouse Receipts
OECD Organisation for Economic Co-operation and Development
OGL Open General License
OWS Other Welfare Schemes
PDPS Price Deficiency Payment Scheme
PDS Public Distribution System
PEG Private Entrepreneur Guarantee Scheme
PM-AASHA Pradhan Mantri Annadata Aay Sanrakshan Abhiyan
PM-GKAY Pradhan Mantri Garib Kalyan Anna Yojana
PM-KISAN Pradhan Mantri Kisan Samman Nidhi
PMKSY Pradhan Mantri Krishi Sinchayee Yojana
PMSSY Pradhan Mantri Matsya Sampada Yojana
PPM Parts Per Million
PPP Public Private Partnership
PPSS Private Procurement & Stockist Scheme
PSS Price Support Scheme
qtl/ha quintal per hectare
RBD Refined Bleached and Deodorized
RE Revised Estimates
RRB Regional Rural Bank
SAU State Agricultural Universities
XXII
Acro
nym
s
The Marketing Season 2021-22
SCB Scheduled Commercial Banks
SHC Soil Health Card
SMAM Sub-Mission on Agricultural Mechanization
SPS Sanitary & Phytosanitary Measures
SRR Seed Replacement Ratio
STE State Trading Enterprises
TE Triennium Ending
TMA Transport and Marketing Assistance Scheme
TRQ Tariff Rate Quota
UAE United Arab Emirates
USA United States of America
USDA United States Department of Agriculture
VRR Varietal Replacement Ratio
w.r.t with respect to
WDRA Warehousing Development and Regulatory Authority
WPI Wholesale Price Index
WSF Water Soluble Fertilizer
WTO World Trade Organization
XXIII
Sum
mar
y of
Rec
omm
enda
tions
The Marketing Season 2021-22
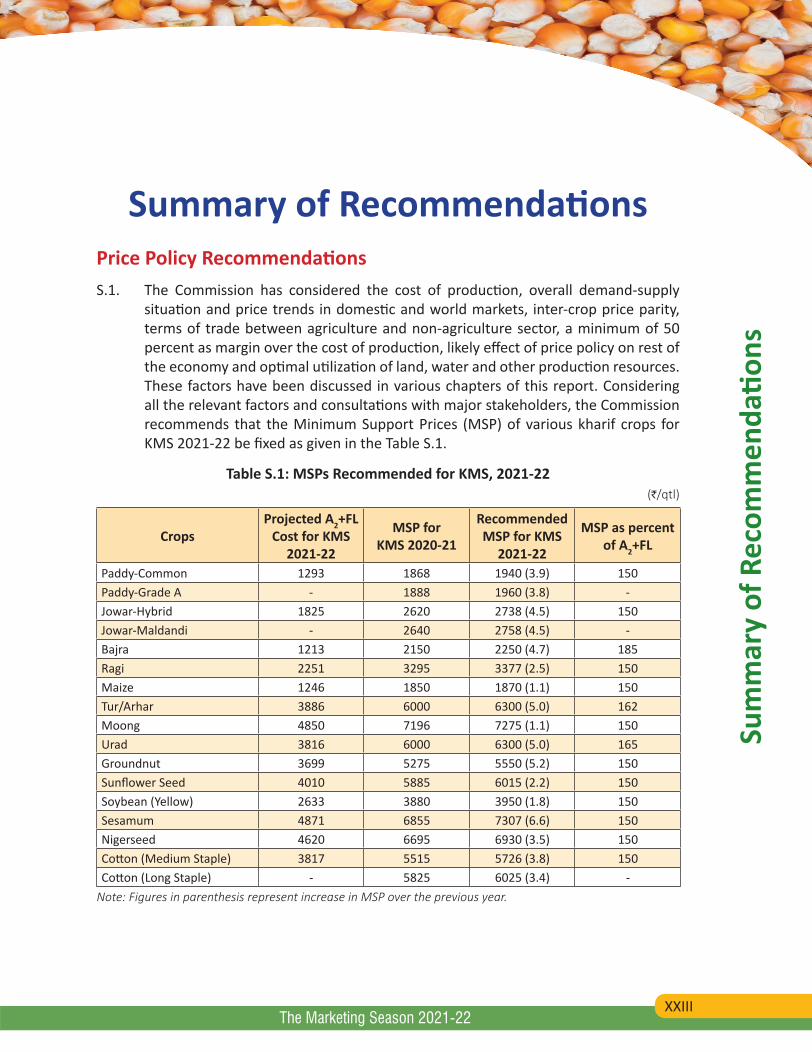
Summary of RecommendationsPrice Policy RecommendationsS.1. The Commission has considered the cost of production, overall demand-supply
situation and price trends in domestic and world markets, inter-crop price parity, terms of trade between agriculture and non-agriculture sector, a minimum of 50 percent as margin over the cost of production, likely effect of price policy on rest of the economy and optimal utilization of land, water and other production resources. These factors have been discussed in various chapters of this report. Considering all the relevant factors and consultations with major stakeholders, the Commission recommends that the Minimum Support Prices (MSP) of various kharif crops for KMS 2021-22 be fixed as given in the Table S.1.
Table S.1: MSPs Recommended for KMS, 2021-22(`/qtl)
CropsProjected A2+FL
Cost for KMS 2021-22
MSP forKMS 2020-21
Recommended MSP for KMS
2021-22
MSP as percent of A2+FL
Paddy-Common 1293 1868 1940 (3.9) 150Paddy-Grade A - 1888 1960 (3.8) -Jowar-Hybrid 1825 2620 2738 (4.5) 150Jowar-Maldandi - 2640 2758 (4.5) -Bajra 1213 2150 2250 (4.7) 185Ragi 2251 3295 3377 (2.5) 150Maize 1246 1850 1870 (1.1) 150Tur/Arhar 3886 6000 6300 (5.0) 162Moong 4850 7196 7275 (1.1) 150Urad 3816 6000 6300 (5.0) 165Groundnut 3699 5275 5550 (5.2) 150Sunflower Seed 4010 5885 6015 (2.2) 150Soybean (Yellow) 2633 3880 3950 (1.8) 150Sesamum 4871 6855 7307 (6.6) 150Nigerseed 4620 6695 6930 (3.5) 150Cotton (Medium Staple) 3817 5515 5726 (3.8) 150Cotton (Long Staple) - 5825 6025 (3.4) -
Note: Figures in parenthesis represent increase in MSP over the previous year.
XXIV
Sum
mar
y of
Rec
omm
enda
tions
The Marketing Season 2021-22
Non-Price Recommendations
Liquidation of Excess StocksS.2. As recommended in the Kharif Price Policy Report KMS 2020-21 and Rabi Price Policy
Report RMS 2021-22, the Commission reiterates disposal of excess foodgrains stocks to save huge carrying cost of excessive stocks and ease storage space constraint.
S.3. The Government has appreciably taken some steps in that direction by additional allocation of foodgrains under Pradhan Mantri Garib Kalyan Anna Yojana (PM-GKAY) and Open Market Sale Scheme (Domestic) (OMSS(D)). Offtake of foodgrains under PM-GKAY has been quite significant but actual sale under OMSS(D) has been low. The exports of rice and wheat have also increased during 2020-21. Despite additional offtake of foodgrains and higher exports during 2020-21, rice and wheat stocks as on 28th February 2021 were 58.2 million tonnes, about 2.7 times higher than stocking norms for the quarter beginning April 1, while rice stocks were 2.1 times higher and wheat stocks were 4 times higher than stocking norms.
S.4. In view of the above situation, the Commission suggests that additional allocation of foodgrains to Antyodaya Anna Yojana (AAY) beneficiaries and Priority Households (PHH) under National Food Security Act (NFSA) should be made, while old stocks may be diverted for other purposes such as ethanol production and feed purpose. The Commission also suggests that beneficiary households should be given 3 months ration instead of monthly quota as this will make storage space available for procurement in the ensuing season, reduce storage costs of Central and State agencies and also save the consumers from hassles of monthly visits to Fair Price Shops.
S.5. The foodgrains management calls for a well-thought policy framework to manage higher production, procurement, and resultant stocks, thereby, shifting policy narrative from food production to food management.
Review Open-ended Procurement PolicyS.6. Due to increased production and procurement of rice and wheat in last few years, the
Government has emerged as the single largest buyer of foodgrains and driven out private sector from the market. In some rice producing States like Punjab, Haryana, and Telangana, more than 80 percent of marketed surplus of rice is procured by Government agencies, which is primarily triggered by open-ended procurement policy.
S.7. The Commission, therefore, reiterates its earlier recommendation that the Central Government should review open-ended procurement policy for rice and wheat and take a policy decision to procure from small and marginal farmers, who constitute 86 percent of total operational holdings, and a fixed quantity from farmers having more
XXV
Sum
mar
y of
Rec
omm
enda
tions
The Marketing Season 2021-22
than two hectare farm size. Efforts should also be made to strengthen procurement operations in other major rice producing States like West Bengal, Uttar Pradesh, Assam, Bihar, etc. to meet at least the State requirements under NFSA and other welfare Schemes.
Special Programme for Crop Diversification in North-Western PlainsS.8. Over-dependence on rice-wheat cropping system in Punjab and Haryana due to
assured procurement policy has led to serious problems of groundwater over-exploitation, soil fertility depletion, plateauing yields and distorted cropping pattern. The Commission strongly feels that this is not a desirable trend and not in the best interest of the farmers and the country. Maize, pulses, oilseeds and horticultural crops have great potential for crop diversification but due to low profitability, high risks and lack of effective procurement system in these crops compared to rice, farmers have no incentive to shift to these crops. Therefore, there is a need to reorient policy direction to reduce such distortions and encourage demand-driven sustainable crop diversification in the States.
S.9. The Commission recommends that a comprehensive programme should be prepared for crop diversification in Punjab, Haryana and western Uttar Pradesh and both the Central and State Governments should fund the programme for minimum five years and provide direct incentive to farmers for crop diversification. The Commission reiterates its earlier suggestion that additional incentive on per hectare basis, the difference in returns from rice and alternative crops, may be paid through Direct Benefit Transfer (DBT) to farmers and such incentives will be WTO compliant under environmental sustainability programmes.
S.10. The Commission has made conscious efforts to realign the MSPs in favour of oilseeds, pulses and nutri-cereals to encourage crop diversification but procurement system for such crops should be strengthened through Price Support Scheme (PSS), Price Deficiency Payment Scheme (PDPS) and Private Procurement and Stockist Scheme (PPSS) under PM-AASHA with active participation of private sector.
Review and Strengthen PM-AASHA S.11. The performance of Pradhan Mantri Annadata Aay SanraksHan Abhiyan (PM-AASHA)
has remained far from satisfactory. The allocation for PM-AASHA has significantly declined from ₹1,500 crore in 2019-20 to ₹400 crore in 2021-22, while expenditure under the Scheme has been extremely low.
S.12. The Commission feels that the Scheme has great potential of benefiting the farmers but there is an urgent need to review PM-AASHA and address implementation issues. The Commission suggests that a Committee comprising of representatives from Central and State Governments and private sector should be constituted to review the Scheme and recommend changes to make it effective. The Commission also recommends that maize should be included under the PDPS and PPSS.
XXVI
Sum
mar
y of
Rec
omm
enda
tions
The Marketing Season 2021-22
Participation of States in Effective Implementation of Price Support Scheme S.13. The Price Support Scheme (PSS) depends on market situation and is implemented
at the request of the concerned State/UT Government. Despite significant increase in procurement of pulses and under PSS oilseeds during the last few years, market prices have remained subdued. State Governments need to be more proactive as it is often seen that the sanctioned quantity is lower than procurement limit of 25 percent production in oilseeds and pulses, while actual procurement is much lower than the sanctioned quantity. Therefore, as procurement under PSS is done at the request of the State Governments/UTs, the Commission recommends that States should take pro-active steps to intervene in the market at right time and strengthen procurement operations by providing adequate logistical support under PSS. In addition, private sector participation should be encouraged and supported in procurement operations and creating better market linkages. The Commission is of the view that PDPS and PPSS are better options than physical procurement in case of oilseeds and maize.
Inclusion of Nutri-Cereals under Public Distribution System (PDS)S.14. The nutri-cereals, which are climate-resilient and have high nutrient content, were
a traditional staple food of the dryland regions in the country but their consumption has significantly declined over the past few decades. Some State Governments such as Odisha, Karnataka, Haryana, etc. have taken initiatives to strengthen procurement of nutri-cereals and promote household consumption through inclusion of millets in PDS and other welfare schemes.
S.15. The Commission strongly feels that inclusion of nutri-cereals under the PDS and other welfare schemes in major producing States will encourage production of these climate-resilient crops and address problem of malnutrition. To generate demand for value-added products from urban population, special Research & Development (R&D) efforts should be made to develop appropriate technologies. The Commission recommends that R&D institutions should make concerted efforts to improve productivity and shelf life of nutri-cereals, which are major constraints.
Review Fertilizer PricingS.16. The retail prices of Phosphatic and Potassic (P&K) fertilizers have risen sharply while,
the price of urea (N) has remained almost fixed after implementation of Nutrient Based Subsidy (NBS) Scheme in 2010. The widening differential between prices of urea and P&K fertilizers has led to excess use of N at the expense of P&K fertilizers which resulted in imbalanced use of nutrients leading to decline in fertiliser use efficiency.
XXVII
Sum
mar
y of
Rec
omm
enda
tions
The Marketing Season 2021-22
S.17. The Commission recommends that the price of urea should be increased in a phased manner and the subsidy be enhanced on P&K fertilizers to reduce their effective prices without putting any additional burden on farmers and keeping the fertilizer subsidy constant. The Commission also suggests that the ceiling on quantity of subsidized urea per hectare should be operationalized based on information from soil health card, extent of irrigation, etc. to control overuse of the nitrogenous fertiliser.
Focus on Improving Productivity and Bridging Yield Gaps S.18. One of the main solutions to rising cost of production and low profitability lies in
improving productivity. The current yields in India are much lower than the world average and benchmark country yields. Moreover, large yield gaps exist in most crops with wide spatial variations in the country. Bridging yield gap by accelerating technological dissemination and adoption by farmers needs to be accorded the highest priority. More emphasis on R&D, irrigation, quality inputs and better farm practices in this regard will go a long way. The Commission recommends a shift in policy focus discourse involving integrated and holistic approaches to reorient from input-intensive to knowledge-intensive agriculture to bridge yield gaps whilst enhancing profitability levels.
Farm MechanisationS.19. The farm-labour shortages and higher wages particularly during peak agricultural
season, coupled with rising cost of production have necessitated the farm mechanisation. This will reduce unit cost of production, thereby enhancing competitiveness and farm profitabilty. Considering the fragmented nature of land holdings in India, it is important to address the problem of farm mechanization on a collective rather than individual basis to ensure economic viability. The Commission has noted wide inter-State disparity in number of agricultural machinery distributed as well as number of Custom Hiring Centres (CHCs), high-tech machinery hubs and farm machinery banks. The Commission recommends that special efforts should be made to increase the level of farm mechanization in States that are lagging behind in this aspect and expand the CHCs to enable small and marginal farmers adopt farm mechanization. The issue of high GST on farm machinery needs to be addressed.
Improved Access and Distribution of Institutional CreditS.20. Despite substantial increase in flow of credit to agriculture, several challenges of
accessibility in credit to small and marginal farmers/tenant farmers/sharecroppers/landless labourers and disparity in distribution of agricultural credit remain. In Tamil Nadu, agricultural credit is more than double the Gross Value Added (GVA) from crop sector, while in States like West Bengal, Madhya Pradesh and Jharkhand it is less than 35 percent.
XXVIII
Sum
mar
y of
Rec
omm
enda
tions
The Marketing Season 2021-22
S.21. The Government has appreciably taken some steps in this direction and launched Kisan Credit Card (KCC) saturation drive to provide universal access to institutional concessional credit to all farmers with special focus on coverage of PM-KISAN beneficiaries. The Commission believes that such initiatives will help in facilitating easy access to institutional credit; however, concerted efforts are needed to improve credit off-take by small and marginal farmers, Central, Eastern and North-eastern States and address issue of over-borrowing in some States.
Remove Market DistortionsS.22. Agricultural markets face various distortions ranging from domestic marketing to
restrictions on stockholding, high fees/charges, bonus on MSP, trade restrictions, etc. leading to market imperfection that jeopardise interplay of demand and supply dynamics. Some States impose high market fee and other charges as well as pay bonus on the MSP, which affect inter-crop parity and drive out the private trade and investment. However, it needs to be appreciated here that the Central Government has made amendments in Essential Commodities Act (ECA) and introduced reforms in agricultural marketing system to remove some of these distortions and create competitive and efficient markets. The Commission is of the opinion that efforts may be made to achieve convergence in market taxes and cess across States to create a national market. The Commission recommends that States should be persuaded to reduce such charges and procurement should be restricted in the States, which levy high fees and other charges and pay bonus.
Develop Robust Commodity Outlook and Regional Crop PlanningS.23. Market information on prices and demand-supply situation is an important
instrument in obtaining early signals of price situation and managing price volatility. Food consumption patterns are changing due to various factors leading to demand-supply mismatch for some commodities. Optimum crop plan at regional levels based on agro-climatic conditions and other resource endowments should be prepared to meet changing demand patterns. The Commission recommends that robust market intelligence and commodity outlook system should be developed to provide regular advisories to farmers in order to make informed decisions about production and marketing of their produce. The Agro-Economic Research Centres/Units under the Directorate of Economics and Statistics, Ministry of Agriculture & Farmers Welfare can help in generating field level data on prices, demand-supply situation and market outlook reports based on farm-level empirical evidences. In the medium to long term, efforts should be made to develop regional crop plan based on regional resource endowment and local taste.
XXIX
Sum
mar
y of
Rec
omm
enda
tions
The Marketing Season 2021-22
Promote Food Processing and Value-AdditionS.24. The demand for high-value crops and processed foods has considerably increased
due to rising incomes, increasing urbanisation, rapidly expanding markets, advances in technology and liberalized trade. Thus, promotion of value-addition is imperative for increasing nutritional status and providing employment as well. It is important to note that the value-addition in India is less than 10 percent, while it is more than 50 percent in countries like Brazil, Indonesia, USA, etc. Government has taken several initiatives for encouraging food processing including 100 percent FDI at the forefront of developmental agenda and launched various schemes to promote agro-processing in the country. The Commission calls for a coordinated effort in a mission mode to reduce post-harvest losses, enhance value-addition, and thereby increase exports.
Improving Information on Market/Mandi Prices (Agmarknet)S.25. It is generally recognised that information on market prices of agricultural
commodities has improved over time but is far from adequate. The prospects for improvement in collection of mandi prices are more promising and it would help in better policy formulation and analysis. The Commission recommends that in addition to the variety of a crop, quality of produce (FAQ/non-FAQ) should be included in the mandi prices collected through Agmarknet Portal.
Awareness about MSP and FAQ NormsS.26. Several studies have pointed out that there is lack of awareness among farmers
about the MSP and procurement operations. The Commission recommends that Central and State Governments should leverage ICT tools, social media platforms, electronic and print media to give wide publicity of MSP, various components of PM-AASHA, details of procurement centers, procurement period, registration/documents requirements, and information about procurement agencies as well as Fair Average Quality (FAQ) specifications of grains.
Review Number of Commodities under Commission’s MandateS.27. The Commission has carefully examined that the number of agricultural commodities
under its mandate is too large. As production of some commodities such as sunflower, nigerseed, safflower, etc. has substantially declined, recommending MSP for such agricultural commodities does not serve any purpose. Therefore, it is recommended that the number of commodities under the MSP regime may be reviewed.
XXX
Sum
mar
y of
Rec
omm
enda
tions
The Marketing Season 2021-22
Issues Related to Sample Size in Cost EstimationS.28. The sample size in certain crops under the ‘Comprehensive Scheme for Studying
the Cost of Cultivation of Principal Crops in India’ is small and can adversely affect the reliability of cost estimates. The Commission, therefore, strongly recommends that sample size for the crops should be increased and made more representative to have reliable estimates.
*****
1
Chap
ter 1
Chapter 1
The Marketing Season 2021-22
Overview1.1. The COVID-19 pandemic has brought significant disruptions in agriculture sector
affecting both supply and demand and put pressure on livelihoods of millions of farmers and agribusinesses around the world. However, Indian agriculture sector has shown resilience and performed exceptionally well during the pandemic, which is evident from significantly higher growth rate than other sectors of the economy. The Gross Value Added (GVA) at Basic Prices (2011-12 prices) from ‘agriculture, forestry and fishing’ sector is estimated to increase by 3.7 percent during 2020-21, while total GVA is estimated to decline by 6.5 percent in 2020-21. The performance can also be gleaned from the Second Advance Estimates of Production of Foodgrains for 2020-21, which is expected to reach new high of 303.3 million tonnes in 2020-21, about 2 percent increase over 2019-20. The overall record production is driven by higher production of rice, wheat, maize and pulses. Agricultural exports are expected to be higher in 2020-21 due to increased exports of rice, cotton, oil meals, wheat and sugar.
1.2. Foodgrains production, for the first time, is likely to cross a 300 million tonnes mark in 2020-21, with production of rice at 120.3 million tonnes and wheat at 109.2 million tonnes. Maize production is estimated at 30.2 million tonnes, an increase of 4.8 percent over the last year, while nutri-cereals production is likely to be marginally lower at 17.2 million tonnes. However, among nutri-cereals, ragi production is expected to increase from about 1.76 million tonnes in 2019-20 to 1.87 million tonnes in 2020-21, while production of jowar and bajra is expected to fall marginally. Further, total pulses production is expected to increase to 24.4 million tonnes in 2020-21, 6.1 percent higher than 2019-20. Production of total nine oilseeds in 2020-21 is likely to be higher than 2019-20 by 12.3 percent at 37.3 million tonnes, driven by higher production of soybean (22.1%) and mustard (14.3%). Cotton production, after registering an impressive growth of 28.6 percent in 2019-20, is expected to record moderate growth of 1.3 percent in 2020-21. All-India area, production and yield of mandated kharif crops during last 10 years are given in Annex Tables 1.1-1.3 and shares of major producing States in total production during the Triennium Ending (TE) 2019-20 are given in Annex Table 1.4.
1.3. During 2020, above normal rainfall during the south-west monsoon (June-September), 109 percent of Long Period Average (LPA) of 88 cm, and normal rainfall (101% of LPA) during northeast monsoon season (October-December) over the country contributed significantly to higher foodgrains production. According to Central Water Commission (CWC) Reservoir Storage Bulletin of 11th March 2021, live
2
Ove
rvie
w
The Marketing Season 2021-22
storage available in 130 reservoirs in the country was 84.376 Billion Cubic Meters (BCM), which was 48 percent of total live storage capacity of these reservoirs, 88 percent of live storage of corresponding period of last year and 123 percent of storage of average of last ten years. Overall storage position is less than the corresponding period of last year but is better than the average storage of last ten years during the corresponding period.
1.4. Over the past few years, Government has taken several initiatives for modernizing agriculture and improving farmers’ income. In 2020, the Central Government introduced historic reforms in agricultural marketing system, which will help in attracting private investment in creating post-harvest infrastructure, efficient value chains and agro-processing. Agriculture Infrastructure Fund of ₹ one lakh crore will help in creating post-harvest management infrastructure at farm gate for farmers, while Central Sector Scheme “Formation and Promotion of 10,000 Farmer Producer Organizations (FPOs)” with a budgetary provision of ₹6,865 crore for 5 years will strengthen linkages with markets and agri-value chains. In order to provide seamless logistics, Kisan Rail was launched to transport perishables and agri-products, including milk, meat and fish and Indian Railways have operated 208 Kisan Rail services transporting approximately 68 thousand tonnes of perishables upto 5th February 2021 since the launch of first Kisan Rail service on 7th August 2020.
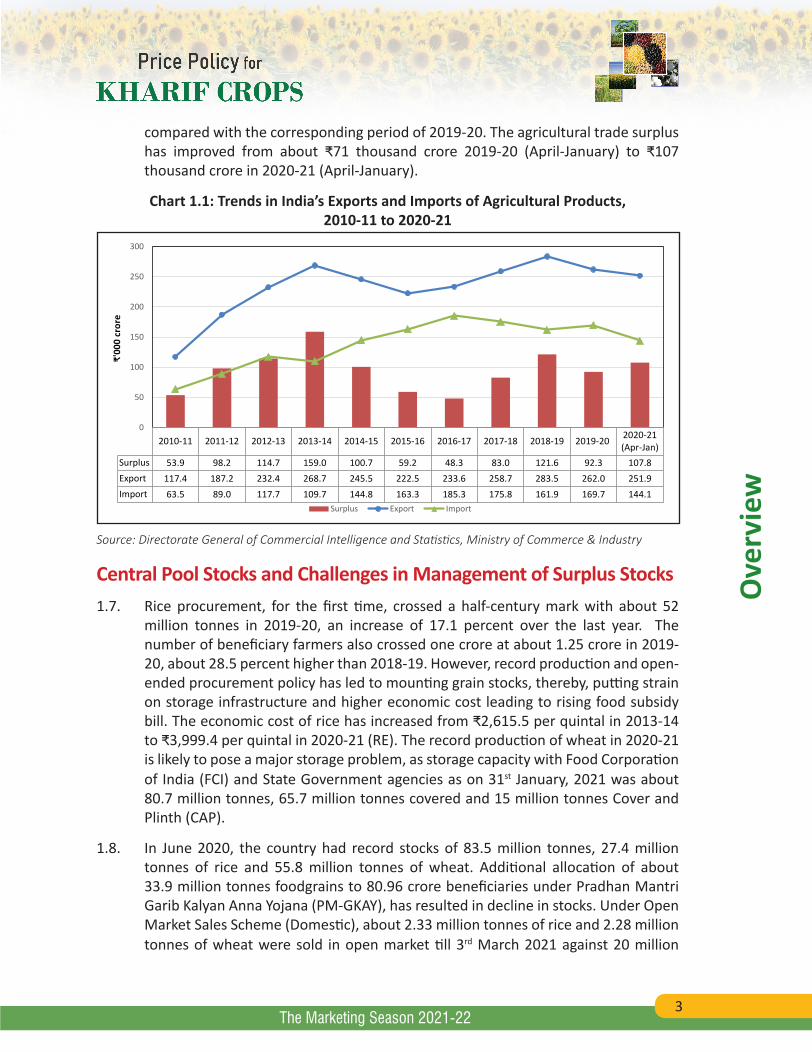
India’s Agriculture Trade Scenario1.5. In 2019-20, the value of agricultural exports declined by 7.6 percent, after three
consecutive years of increase (Chart 1.1). Agricultural exports amounted to ₹2.62 lakh crore in 2019-20. Despite COVID-19 challenges, agricultural exports are expected to be higher in 2020-21 compared to 2019-20. Indian exports of agricultural commodities have risen from ₹2.15 lakh crore during 2019-20 (April-January) to ₹2.51 lakh crore during 2020-21 (April-January), increase of 16.8 percent. Increase in exports are mainly driven by higher agricultural production, which remained relatively unaffected by COVID-19 disruptions due to various timely interventions by the Government, and a significant increase in global food commodity prices. Rice exports, a major export commodity in export basket, increased by 42.2 percent in 2020-21 (Apr-Jan) over the corresponding period in 2019-20. Other products that registered high growth in exports include spices, sugar, cotton, oil meals, wheat, groundnut, fresh vegetables, processed fruits and juices, etc.
1.6. During 2019-20, agricultural imports increased by 4.9 percent, after two consecutive years of decline and higher imports were mainly driven by increased imports of cotton (5.5%), spices (6%) and pulses (6%). Agricultural imports in 2020-21 (April-January) remained virtually unchanged at ₹1.44 lakh crore as in 2019-20 (April-January). Within the import basket, import of pulses increased 20.9 percent and vegetable oils 18.7 percent. Other major products that witnessed higher imports included fresh fruits and sugar. On the other hand, imports of cashew, spices, wood products, natural rubber and cotton declined during 2020-21 (April-January)
3
Ove
rvie
w
The Marketing Season 2021-22
compared with the corresponding period of 2019-20. The agricultural trade surplus has improved from about ₹71 thousand crore 2019-20 (April-January) to ₹107 thousand crore in 2020-21 (April-January).
Chart 1.1: Trends in India’s Exports and Imports of Agricultural Products, 2010-11 to 2020-21
2010-11 2011-12 2012-13 2013-14 2014-15 2015-16 2016-17 2017-18 2018-19 2019-20 2020-21(Apr-Jan)
Surplus 53.9 98.2 114.7 159.0 100.7 59.2 48.3 83.0 121.6 92.3 107.8Export 117.4 187.2 232.4 268.7 245.5 222.5 233.6 258.7 283.5 262.0 251.9Import 63.5 89.0 117.7 109.7 144.8 163.3 185.3 175.8 161.9 169.7 144.1
0
50
100
150
200
250
300
₹'0
00 c
rore
Surplus Export Import
Source: Directorate General of Commercial Intelligence and Statistics, Ministry of Commerce & Industry
Central Pool Stocks and Challenges in Management of Surplus Stocks1.7. Rice procurement, for the first time, crossed a half-century mark with about 52
million tonnes in 2019-20, an increase of 17.1 percent over the last year. The number of beneficiary farmers also crossed one crore at about 1.25 crore in 2019-20, about 28.5 percent higher than 2018-19. However, record production and open-ended procurement policy has led to mounting grain stocks, thereby, putting strain on storage infrastructure and higher economic cost leading to rising food subsidy bill. The economic cost of rice has increased from ₹2,615.5 per quintal in 2013-14 to ₹3,999.4 per quintal in 2020-21 (RE). The record production of wheat in 2020-21 is likely to pose a major storage problem, as storage capacity with Food Corporation of India (FCI) and State Government agencies as on 31st January, 2021 was about 80.7 million tonnes, 65.7 million tonnes covered and 15 million tonnes Cover and Plinth (CAP).
1.8. In June 2020, the country had record stocks of 83.5 million tonnes, 27.4 million tonnes of rice and 55.8 million tonnes of wheat. Additional allocation of about 33.9 million tonnes foodgrains to 80.96 crore beneficiaries under Pradhan Mantri Garib Kalyan Anna Yojana (PM-GKAY), has resulted in decline in stocks. Under Open Market Sales Scheme (Domestic), about 2.33 million tonnes of rice and 2.28 million tonnes of wheat were sold in open market till 3rd March 2021 against 20 million
4
Ove
rvie
w
The Marketing Season 2021-22
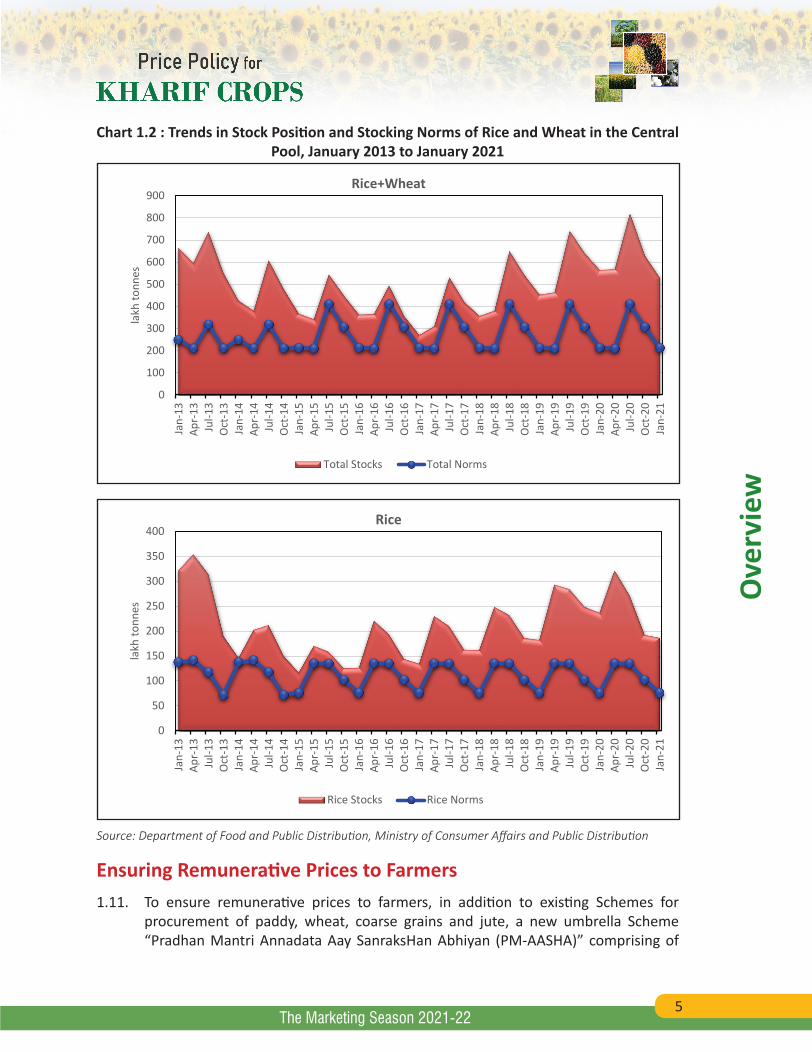
tonnes (15 million tonnes of wheat and 5 million tonnes of rice) fixed for 2020-21. Total rice and wheat stocks as on 28th February 2021 were 58.2 million tonnes, marginally lower than previous year but 30.2 percent lower than in June 2020. Rice stocks were 8.8 percent lower than last year but wheat stocks were 7.3 percent higher compared with the last year. However, total rice and wheat stocks were 2.7 times higher than stocking norms for Central Pool for the quarter beginning April 1. Rice stocks were 2.1 times higher and wheat stocks were 4 times higher than stocking norms (Chart 1.2).
1.9. With wheat production estimated at record 109.2 million tonnes and forecast of higher procurement of rice and wheat in coming season, as per FCI estimates, central pool stocks are likely to be 104.4 million tonnes on July 1, 2021, about 63.3 million tonnes higher than stocking norms. Rice stocks are estimated to be 3.4 times more than stocking norms, while wheat stocks are expected to be more than double the stocking norms in July 2021. The excess stocks will put pressure on exchequer in terms of higher storage and financing costs, and create storage space shortage.
1.10. The Central Government should review open-ended procurement policy and take a policy decision to restrict rice and wheat procurement from small and marginal farmers and a fixed quantum of procurement from semi-medium, medium and large farmers which would benefit more than 90 percent of farmers. To liquidate excess stocks, additional allocation of foodgrains to Antyodaya Anna Yojana (AAY) beneficiaries and Priority Households (PHH) under National Food Security Act (NFSA) and Other Welfare Schemes (OWS) should be made. Open market operations and exports are other options for offloading excess foodgrains stocks. Further, special efforts should be made to expand procurement of nutri-cereals and inclusion of nutri-cereals under NFSA and other welfare schemes like Integrated Child Development Services (ICDS), Mid-Day Meal (MDM), etc. This is necessary to mainstream nutrition-approach in developmental policies and bring about rationality in pricing, contain burgeoning stocks of grains and food subsidy bill and promote diversification of agriculture. It is worth mentioning that Government of Odisha has launched “Special Programme for Promotion of Millets in Tribal Areas” in 72 blocks in 14 districts to revive millets in rainfed farming systems and promote household consumption. The procurement of ragi in the State has increased from about 18 thousand quintals in 2018-19 to over one lakh quintals in 2020-21.
5
Ove
rvie
w
The Marketing Season 2021-22
Chart 1.2 : Trends in Stock Position and Stocking Norms of Rice and Wheat in the Central Pool, January 2013 to January 2021
0
100
200
300
400
500
600
700
800
900
Jan-
13Ap
r-13
Jul-1
3O
ct-1
3Ja
n-14
Apr-
14Ju
l-14
Oct
-14
Jan-
15Ap
r-15
Jul-1
5O
ct-1
5Ja
n-16
Apr-
16Ju
l-16
Oct
-16
Jan-
17Ap
r-17
Jul-1
7O
ct-1
7Ja
n-18
Apr-
18Ju
l-18
Oct
-18
Jan-
19Ap
r-19
Jul-1
9O
ct-1
9Ja
n-20
Apr-
20Ju
l-20
Oct
-20
Jan-
21
lakh
tonn
es
Rice+Wheat
Total Stocks Total Norms
0
50
100
150
200
250
300
350
400
Jan-
13Ap
r-13
Jul-1
3O
ct-1
3Ja
n-14
Apr-
14Ju
l-14
Oct
-14
Jan-
15Ap
r-15
Jul-1
5O
ct-1
5Ja
n-16
Apr-
16Ju
l-16
Oct
-16
Jan-
17Ap
r-17
Jul-1
7O
ct-1
7Ja
n-18
Apr-
18Ju
l-18
Oct
-18
Jan-
19Ap
r-19
Jul-1
9O
ct-1
9Ja
n-20
Apr-
20Ju
l-20
Oct
-20
Jan-
21
lakh
tonn
es
Rice
Rice Stocks Rice Norms
Source: Department of Food and Public Distribution, Ministry of Consumer Affairs and Public Distribution
Ensuring Remunerative Prices to Farmers1.11. To ensure remunerative prices to farmers, in addition to existing Schemes for
procurement of paddy, wheat, coarse grains and jute, a new umbrella Scheme “Pradhan Mantri Annadata Aay SanraksHan Abhiyan (PM-AASHA)” comprising of
6
Ove
rvie
w
The Marketing Season 2021-22
Price Support Scheme (PSS) for pulses, oilseeds and copra, Price Deficiency Payment Scheme (PDPS) for oilseeds and Pilot of Private Procurement & Stockist Scheme (PPSS) for oilseeds was launched in 2018.
1.12. There has been significant increase in procurement and number of beneficiary farmers over the years. The number of paddy farmers who benefitted from procurement operations has increased significantly from about 73 lakh in 2015-16 to about 1.25 crore in 2019-20, an increase of over 70 percent, while procurement of rice has increased from 34.2 million tonnes to nearly 52 million tonnes during the period. However, there are large variations in procurement as well as beneficiary farmers across the States. During the TE2019-20, Punjab had the largest share (25.3%) in rice procurement, while other major rice producing States like Uttar Pradesh (7.4%), West Bengal (4.1%), Bihar (2.3%) and Assam (0.3%) had very low share in procurement. However, during the last five years, rice procurement has increased by 67.2 percent in Uttar Pradesh, 17.2 percent in West Bengal and 10 percent in Bihar. Similarly, coverage of beneficiary farmers under rice procurement is high in Punjab (116.8%) and Haryana (114.9%) while, top two producers, namely, Uttar Pradesh (4.2%) and West Bengal (9.4%) have low coverage1. Majority of farmers in Uttar Pradesh, West Bengal and other Eastern and North-Eastern States are marginal and small with poor access to Government procurement, and resort to distress sale. Therefore, there is a need to bring more farmers from these States under the ambit of procurement operations.
1.13. There has been a significant increase in procurement of pulses and oilseeds during the last few years. Total procurement of pulses has increased from about 8,000 tonnes in 2017-18 to about 42 lakh tonnes in 2018-19, which declined to 14.9 lakh tonnes during the 2019-20 season due to improved prices. During 2020-21, procurement of pulses under PSS was 21.8 lakh tonnes (as on 11th March 2021) valued at ₹1,069 crore. In case of oilseeds, procurement under PSS has increased from about two lakh tonnes in 2016-17 valued at ₹4,256 crore to 18.2 lakh tonnes (₹8,262.7 crore) in 2019-20 and was lower at about 10.9 lakh tonnes in 2020-21 due to lower market arrivals as market prices were high. Around 87.7 lakh pulses and oilseeds farmers have benefitted from procurement operations during the last five years. Effective participation of States/UTs is necessary to improve effectiveness of procurement operations under PSS, as procurement depends on market situation and based on request from States/UTs. The overall procurement quantity is fixed at 25 percent of actual production of the commodity for a year/season, and in case State/UT Governments intends to procure over 25 percent of production, they can procure at their own cost and through own agencies. However, so far, restriction of 25 percent of production has not been a constraint as the sanctioned quantity as well as actual procurement have been much lower in most of the States.
1 Number of paddy operational holdings as per All India Report on Agriculture Census 2015-16 has been taken as a proxy to number of paddy farmers
7
Ove
rvie
w
The Marketing Season 2021-22
1.14. The Commission is of the view that PDPS and PPSS under PM-AASHA have great potential to ensure remunerative prices to farmers for pulses, oilseeds and other commercial crops. However, progress of PM-AASHA has remained far from satisfactory, e.g., budget allocation of ₹1,400 crore under PM-AASHA during 2018-19 remained unutilized and allocation for 2019-20 was reduced from ₹1,500 crore (BE) to ₹321 crore (RE) and actual expenditure was ₹313.2 crore. The allocation was further reduced to ₹ 500 crore in 2020-21 (BE) and revised to ₹200 crore in 2020-21 (RE) but no expenditure was incurred up to 12th March 2021. During 2021-22, an allocation of ₹400 crore has been made for PM-AASHA Scheme in the Union Budget. Therefore, special efforts are needed to popularize the Scheme among State Governments, private sector players and other stakeholders.
Food Inflation1.15. Global food prices, as measured by a FAO Food Price Index (FFPI), registered a new
high in February 2021 since July 2014, rising by more than 16 percent year-on-year, underpinned by large increases in the prices of cereals (26.5%) and edible oils (51.1%) and moderate rise in dairy (9.9%) and sugar (9.5%) prices. The FAO All Rice Price Index (2014-2016=100) rose for the third successive month in February 2021 to reach 116 points, 11.4 percent above February 2020 level, driven by surge in price indices of lower quality indica (17.8%) and japonica (12.5%) rice. World maize prices in February were 45.5 percent higher than the previous year due to strong import demand, especially from China and shrinking exports. The FAO Vegetable Oil Price Index averaged 147.4 points in February, the highest level since April 2012, due to rising prices of palm, soybean, rapeseed and sunflower oil on account of low stocks in major exporting countries and lower production forecast for 2021.
1.16. The Consumer Food Price Index (CFPI) inflation in the country, after remaining subdued in the last few years, recorded a rising trend in 2019 and 2020. During the last six months, year-on-year inflation rate based on CFPIs was the highest (11%) in October 2020 mainly driven by vegetables (18.39%), meat and fish (18.63%), pulses and products (18.34%), oils and fats (15.17%), spices (11.28%), while cereals and products recorded a moderate inflation rate (3.53%). The inflation rate based on CFPIs for all-India showed declining trend during the last three months and was 1.89 percent in January 2021 due to fall in inflation rate of vegetables (-15.84%), cereals and products (0.07%), eggs (12.85%), while inflation rate of oils and fats, and fruits showed an increase. In February 2021, inflation rate increased to 3.87 percent, with oils and fats (20.78%), pulses and products (12.54%), meat and fish (11.34%) and eggs (11.13%) recording significantly high inflation rates.
1.17. The annual rate of inflation for ‘Food Articles’ based on Wholesale Price Index (WPI) also followed almost a similar trend. During last six months, inflation was the highest (8.37%) in September 2020 due to high rate of inflation in vegetables (38.12%) and pulses (12.53%). Thereafter, a declining trend was observed and WPI based inflation of food articles was (-)2.8 percent in January 2021 due to steep decline in cereals
8
Ove
rvie
w
The Marketing Season 2021-22
(-7.34%), particularly wheat (-11.62%), vegetables (-20.82%) and egg, meat and fish (-1.76%). The rate of inflation based on WPI Food Articles increased from (-)2.8 percent in January 2021 to 3.31 percent in February 2021 and pulses (10.25%), onion (31.28%) and fruits (9.48%) contributed to the increase.
Agricultural Marketing Reforms1.18. Reforms to agriculture marketing system in the country have been attempted for
over last two decades. The Government appointed an Expert Committee in 2000 and Inter-Ministerial Task Force in 2001 to examine the recommendations of the Expert Committee. The Model APMC Act, 2003 and Model APMC Rules, 2007 were circulated to States for adoption. Various other committees/working groups such as Empowered Committee of 10 States in 2010, Working Group on Agricultural Production (2010), Five Year Plan Working Group of Planning Commission, Committee of State Ministers, In-charge of Agricultural Marketing (2013), NITI Aayog Task Force on Agriculture Development, Doubling Farmers Income Committee, Model Agriculture Produce and Livestock Marketing (APLM) Act 2017, Model Agriculture Produce and Livestock Contract Farming Act 2018, etc. had recommended various agri-marketing reforms.
1.19. To create a free and efficient agricultural marketing ecosystem and unlock opportunities for new investments, Government has introduced landmark reforms in the recent years. Farmers’ Produce Trade and Commerce (Promotion & Facilitation) Act, 2020 will provide farmers more choice in selling their produce, facilitate inter-state movement and bring transparency and better services. The Farmers (Empowerment & Protection) Agreement on Price Assurance and Farm Services Act, 2020 will create direct linkages between buyer and seller and better access to modern technology and quality inputs. The Essential Commodities (Amendment) Act, 2020 that deregulates various agricultural commodities will attract investment in storage facilities, cold storages etc., ensure better price realization for farmers and stability in market prices for consumers.
Market Infrastructure1.20. Realising opportunities in transforming agriculture requires improved marketing
and value-addition infrastructure through both public and private investment. The Government has accorded high priority for development and modernisation of agricultural market infrastructure. The Central Sector Scheme of Financing Facility under ‘Agriculture Infrastructure Fund’ was launched in 2020, under which financing facility of ₹1,00,000 crore will be provided for funding agriculture infrastructure projects at farm-gate and aggregation points and post-harvest management as well as for augmenting infrastructure facilities of Agricultural Produce Market Committees (APMCs). Government has set up Agri-Marketing Infrastructure Fund (AMIF) with a corpus of ₹2,000 crore to develop and upgrade agricultural marketing infrastructure in 22,000 rural haats into Gramin Agricultural Markets (GrAMs) and
9
Ove
rvie
w
The Marketing Season 2021-22
APMCs. The 2021-22 Union Budget introduced “Agriculture Infrastructure and Development Cess” (AIDC) on a small number of items to generate resources for improving agricultural infrastructure.
1.21. The National Agriculture Market (e-NAM), which was launched in April 2016 to create a unified national market for agricultural commodities, has made impressive progress as about 1.7 crore farmers are registered and ₹1.22 lakh crore of trade value has been carried out through e-NAMs. In addition to 1,000 mandis already integrated with e-NAM, 1,000 more mandis will be integrated with the platform.
Direct Income Support to Farmers: PM-KISAN1.22. Pradhan Mantri KIsan SAmman Nidhi (PM-KISAN), a Central Sector Scheme with
100 percent funding from Government of India, was launched on 1st December 2018 under which an income support of ₹6,000 per year was provided to small and marginal farmers in three equal instalments of ₹2,000 subject to certain exclusions relating to higher income groups. The Scheme was later expanded to cover all farmers in May 2019. Under the Scheme, more than ₹1.15 lakh crore (up to 24th February, 2021) has been disbursed to 10.78 crore farmer families since the inception of the Scheme. Uttar Pradesh has the highest number of beneficiaries (2.43 crore) followed by Maharashtra (1.09 crore), Madhya Pradesh (83 lakh), Bihar (78 lakh), Rajasthan (70.52 lakh), Gujarat (57.84 lakh) and Andhra Pradesh (53.4 lakh). West Bengal has not joined the Scheme.
1.23. Many States have implemented similar Schemes, e.g., “YSR Rythu Bharosa” Scheme by Andhra Pradesh, “Agriculture Investment Support Scheme” (“Rythu Bandhu”) by Telangana, “Krushak Assistance for Livelihood and Income Augmentation - KALIA” by Odisha, Mukhya Mantri Kisan Kalyan Yojana in Madhya Pradesh, Rajiv Gandhi Kisan Nyay Yojana in Chhattisgarh, Krishak Bandhu Scheme of West Bengal, etc.
Agricultural Credit1.24. The Government has given high priority to extend the reach of institutional credit
to farmers and provide interest subvention on short-term crop loans up to ₹3 lakh. The agriculture credit flow has increased from about ₹9.15 lakh crore in 2015-16 to ₹13.93 lakh crore in 2019-20, more than 50 percent increase. The target for 2020-21 was ₹15 lakh crore, which has been increased to ₹16.5 lakh crore for 2021-22.However, the issue of inequality in distribution of agricultural credit across States and farm categories is a matter of concern and needs to be addressed. In some States, agricultural credit is higher than their gross value added (GVA) from agriculture, indicating the possibility of diversion of credit for non-agricultural purpose.
1.25. With the goal of providing universal access to institutional concessional credit to all farmers including animal husbandry, dairy and fisheries, Kisan Credit Card (KCC) saturation drive was initiated in February 2020 with special focus on coverage of
10
Ove
rvie
w
The Marketing Season 2021-22
PM-KISAN beneficiaries and a target of issuing additional 2.5 crore KCCs has been set. Significant progress has been made in this direction as more than 1.82 crore KCCs have been issued to eligible farmers.
Farm Mechanization1.26. Indian agriculture is facing critical labour shortages, rising labour costs, and a major
constraint on both farm profitability and global competitiveness. To address the issue, Sub-Mission on Agricultural Mechanization (SMAM) is being implemented since April 2014 under the Umbrella Scheme ‘Green Revolution – Krishonnati Yojana’. In addition, to address paddy straw burning and protect environment from air pollution as well as prevent loss of nutrients and soil micro-organisms due to burning of crop residue, a Central Sector Scheme on “Promotion of Agricultural Mechanization for In-Situ Management of Crop Residue in the States of Punjab, Haryana, Uttar Pradesh and NCT Delhi” was implemented in April 2018. The Scheme promotes in-situ management of crop residue by retention and incorporation into the soil with appropriate mechanization and creates awareness through demonstration and capacity building activities for effective utilization and management of crop residue. About ₹6,026 crore has been spent under both programmes since inception of the Schemes.
1.27. Since majority of Indian farms are small and fragmented, investment in large machinery is not a viable option. Therefore, expansion of agricultural machinery services through Custom Hiring Centres (CHCs) offers the possibility of increased mechanization on such farms. There is a need to develop sustainable agricultural mechanization strategies and supportive policies that can promote agricultural mechanization practices and technologies among farmers. Both public and private sector should work together to support innovations in mechanization and disseminate knowledge on agricultural mechanization to promote mechanization initiatives at the field level.
Crop Diversification1.28. Over-dependence on rice-wheat cropping system combined with availability of
free power in North-western plains has resulted in depletion of groundwater and deterioration of soil quality, posing a serious threat to sustainability. As per Central Ground Water Board report on Dynamic Ground Water Resources of India, 2017, 79 percent of blocks in Punjab and 61 percent in Haryana were in ‘Over-Exploited’ category indicating groundwater extraction exceeding the annual replenishable groundwater recharge. Additionally, even though crop yields in these States are high, yields have started plateauing. Therefore, there is a need for crop diversification towards maize, pulses, oilseeds, and horticultural crops. The Commission feels that the right strategy should be to change policy direction first by correcting the factors that contribute to such distortion and then by adopting measures that encourage demand driven crop diversification including attractive price incentives and supportive marketing/procurement systems.
11
Ove
rvie
w
The Marketing Season 2021-22
1.29. The Government has recognized the problem of mono-cropping and subsequent non-judicious resource use. To contain this effect, Crop Diversification Programme (CDP) was launched in 2013-14 to shift area under paddy to other alternative crops in original Green Revolution States. However, not much progress has been made so far on crop diversification in the region because of low returns and high risks from alternative crops, lack of assured marketing and remunerative prices, non-availability of appropriate proven technology for alternative crops, etc. State Governments have also taken some initiatives to promote crop diversification. Government of Haryana has launched ‘Mera Pani Meri Virasat’ Scheme for crop diversification with a target of bringing one lakh hectare area under maize, cotton, bajra, pulses and horticulture crops through giving ₹7,000 per acre, assured procurement at MSP and farm machinery to farmers. Government of Punjab has allocated ₹200 crore in the budget 2021-22 for undertaking crop diversification measures during the year. However, a major policy shift in pricing and procurement for alternative crops as well as substantial investment in Research and Development (R&D), market infrastructure and value-addition are needed.
Storage and Warehousing1.30. The storage capacity in the country has increased over last two decades, however,
increased production and procurement due to open-ended procurement policy has led to huge stocks and shortage of scientific storage. The total storage capacity available with FCI and State Government agencies for storage of foodgrains as on 31st January 2021 was about 80.7 million tonnes. Of the total capacity, 65.7 million tonnes was covered storage and about 15 million tonnes (18.6%) was CAP (cover and plinth) storage. The total stocks of rice and wheat held by FCI and State agencies as on 28th February 2021 were about 57.8 million tonnes.
1.31. Government is implementing various Schemes for creating scientific storage facilities in the country. To promote Public Private Partnership (PPP) in creation of storage facilities, Government introduced “Private Entrepreneur Guarantee Scheme” (PEG) in 2008 and about 14.4 million tonnes of capacity has been created under the Scheme as on 30th November 2020. In addition, Ministry of Agriculture and Farmers Welfare is implementing a capital investment subsidy sub-scheme Agricultural Marketing Infrastructure (AMI) under Integrated Scheme for Agricultural Marketing (ISAM) for creating storage facilities. Efforts should be made to create scientific storage systems at farm level and modernize grain handling and storage infrastructure in the country for efficient and effective handling of grains.
1.32. The Negotiable Warehouse Receipts (NWRs) System was launched in 2011 and Electronic Negotiable Warehouse Receipt (e-NWR) System in 2017 to provide loan to farmers against electronic warehouse receipts of agricultural commodities. As on 30th November 2020, 3,433 (1,831 valid registration) warehouses were registered with Warehousing Development and Regulatory Authority (WDRA) and total loan of about ₹2,522 crore has been financed against NWRs/e-NWR since its inception.
12
Ove
rvie
w
The Marketing Season 2021-22
The financing on e-NWR will get a boost after the integration of e-NWR with e-NAM.There is a need to promote and popularize NWRs financing among farmers.
Food Processing and Value Addition1.33. Demand for high-value crops and processed products has considerably increased
owing to rising income, increasing urbanization, rapidly expanding markets, advances in technology and liberalized trade. However, value-addition in India is less than 10 percent while it is more than 50 percent in countries like Brazil, Indonesia, USA, etc. Recognizing importance of food processing and value-addition, the Government has placed the food processing industry at the forefront of development agenda and launched several Schemes to promote agro-processing in the country. The Central Sector Scheme – SAMPADA (Scheme for Agro-Marine Processing and Development for Agro-Processing Clusters) with an allocation of ₹6,000 crore was approved in 2017 for agro-marine processing and development of agro-processing clusters. Pradhan Mantri Matsya Sampada Yojana (PMMSY) with a total estimated investment of ₹20,050 crores for development of fisheries sector will be implemented from 2020-21 to 2024-25. Animal Husbandry Infrastructure Development Fund (AHIDF) with an outlay of ₹15,000 crore has been approved for setting up dairy and meat processing facilities and value-addition infrastructure. Under Aatmanirbhar Bharat Abhiyan, a Centrally Sponsored Scheme “PM Formalisation of Micro Food Processing Enterprises (PM-FME) Scheme” with an outlay of ₹10,000 crore for providing financial, technical and business support for upgradation of existing micro food processing enterprises was implemented in June 2020. The “Operation Greens” Scheme for Tomato, Onion and Potato (TOP) has been extended to all fruits and vegetables (TOTAL) for a period of six months on pilot basis as part of Aatmanirbhar Bharat Abhiyan.
1.34. The Commission believes that these initiatives and recent reforms in regulatory frameworks will pave the way for new opportunities in food processing sector. Government, private sector, farmers and other stakeholders need to partner in such endeavours.
Outlook for Indian Agriculture1.35. As per Second Advance Estimates for 2020-21, total foodgrains production in the
country is estimated at 303.3 million tonnes and kharif foodgrains production is estimated to increase by 2.9 percent at 147.95 million tonnes. Total rice production during 2020-21 is estimated at 120.3 million tonnes, about 7 percent higher than the last five-year average production of 112.4 million tonnes. In addition, there are excess stocks of rice held by FCI and State agencies at 28.2 million tonnes as on 28th February 2021 as against the buffer stock norm of 13.58 million tonnes (as on 1st April of each year). Additional allocation of rice under PM-GKAY and other Schemes due to COVID-19 pandemic and higher exports in 2020-21 have been able to liquidate rice stocks but problem of excess stocks in 2021-22 will remain key
13
Ove
rvie
w
The Marketing Season 2021-22
issue requiring concerted efforts. In 2020-21, total maize production is expected to increase by 4.3 percent, while kharif maize production is estimated to increase by more than 10 percent compared to 2019-20. Total pulses production during 2020-21 is estimated at 24.4 million tonnes, about 1.4 million tonnes more than in 2019-20. Total oilseeds as well as kharif oilseeds production is estimated to increase significantly by about 12.4 percent in 2020-21. Cotton production is estimated to increase marginally (1.3%) to 36.5 million bales in 2020-21.
1.36. The above normal rainfall during the south-west monsoon, normal rainfall during north-east monsoon season and comfortable storage position of 130 reservoirs are expected to contribute to increased foodgrains production in the country in the ensuing season.
World Outlook 1.37. According to the latest Agricultural Market Information System (AMIS) Market
Monitor of the FAO, despite challenges posed by the COVID-19 pandemic and weather vagaries, world rice production is likely reach a new record of 513 million tonnes in 2020-21, up 1.1 percent from the 2019-20. Global trade in rice is forecast to expand by 6.9 percent in 2020-21 to 48.2 million tonnes driven by surge in African imports, in particular by Côte d’Ivoire, Nigeria and Senegal. India is expected to retain its export leadership in the rice world trade. Global rice ending stocks in 2020-21 are forecast at 182.5 million tonnes, almost at the 2019-20 level.
1.38. Preliminary forecasts of oilseeds crops for the 2020-21 season point towards a tightening supply-demand situation for oilseeds and their derived products. Global oilseed production is forecast to reach a new record in 2020-21, due to higher soybean production in the United States of America and Brazil. World sunflower seed and rapeseed production could remain depressed, while palm oil production is forecast to grow in 2020-21. Global oils/fats and meals/cakes consumption is forecast to increase and would slightly exceed world production, resulting in lower stocks.
1.39. According to International Cotton Advisory Committee, world cotton production is forecast to fall by about 2 million tonnes, while consumption is forecast to increase from 22.8 million tonnes in 2019-20 to 24.5 million tonnes in 2020-21 and as a result, ending stocks are forecast to decrease by about 1.4 percent in 2020-21.
1.40. The FAO Food Price Index (FFPI) averaged 116 points in February 2021, consecutive rise for ninth month and reached highest level since July 2014. The FAO Cereal Price Index was 1.5 points higher than January and 26.3 points above February 2020 level. Maize prices in February were significantly higher than the previous year, primarily due to strong import demand and shrinking export supplies. The FAO Vegetable Oil Price Index averaged 147.4 points in February, reaching the highest level since April 2012 due to high prices of palm, soy, rape and sunflower oils. International palm oil prices rose for a ninth consecutive month in February. Oilseeds prices are forecast
14
Ove
rvie
w
The Marketing Season 2021-22
to remain strong in 2021-22 due to global demand outstripping supply. The world soybean price is forecast to be slightly higher in 2021-22 than in 2020-21. The world cotton price is forecast to increase in 2021-22 due to strong import demand and global consumption growth.
Structure of the Report1.41. The report is organized as follows. Chapter 2 presents the demand-supply trends,
outlook and procurement operations of mandated crops. Chapter 3 analyses trends in crop productivity, yield gap analysis and discusses major drivers of productivity. Chapter 4 presents an overview of trade patterns, trends in domestic and world prices, review of trade policies and trade outlook. Chapter 5 analyses the cost of production, returns and cost projections of crops. Finally, Chapter 6 highlights key considerations and concludes by presenting price and non-price policy recommendations.
*****
15
Chap
ter 2
Chapter 2
The Marketing Season 2021-22
Demand-Supply Outlook, Prices and Price Support Operations
World Trends and Outlook2.1 Global demand-supply trends and outlook for three major kharif crops viz. rice,
maize and soybean as estimated by Food and Agricultural Organisation (FAO), United States Department of Agriculture (USDA) and International Grain Council (IGC) are given in Table 2.1. All the three agencies indicate that production is likely to improve in 2020-21 over the previous year. As per FAO’s latest estimates, global rice production in 2020-21 is forecast at 513.2 million tonnes, up 2.06 percent from 2019-20. USDA and IGC have also forecast an increase in global rice output in 2020-21 by about 1.4 percent and 1.3 percent respectively. All estimates forecast the global consumption of rice to increase in 2020-21 over the last year. World rice supplies are projected to increase by 7.2 million tonnes as per FAO estimates, 8.2 million tonnes as per USDA and 5 million tonnes as per IGC projections. FAO expects world rice trade to increase by 6.9 percent in 2020-21 and IGC forecast show 4.6 percent increase, while USDA projects 2.9 percent increase in global rice trade. FAO and IGC forecast show global ending stocks in 2020-21 to be slightly higher than 2019-20.
2.2 World maize production as per FAO’s estimate is likely to be 1,152.8 million tonnes in 2020-21, about 1.3 percent higher than 2019-20. USDA and IGC also estimate global maize production to increase by 1.6 percent and 0.8 percent, respectively in 2020-21. World maize utilization is forecast to increase by 1.9 percent as per FAO estimates, 1.5 percent as per USDA estimates and 0.8 percent as per IGC estimates. FAO’s latest forecast for world trade in maize stands at 187.1 million tonnes, 7.3 percent higher than 2019-20. USDA and IGC also forecast increase in maize trade in 2020-21. Trade forecast were scaled up sharply, primarily on exceptionally higher imports by China. The ending stocks in 2020-21 are forecast to contract from last year by about (-)8.6 percent as per FAO estimates, (-)5.4 percent as per USDA and (-)9.8 percent as per IGC forecast. Stocks forecasts are lowered because of substantial downward adjustments to China’s inventories following revised feed estimates and lower inventories on account of higher exports.
2.3 World production of soybean is forecast to increase significantly in 2020-21 compared to 2019-20 as per FAO, USDA and IGC, hence, supply is likely to improve in 2020-21. They have also projected an increase in utilisation and lower ending
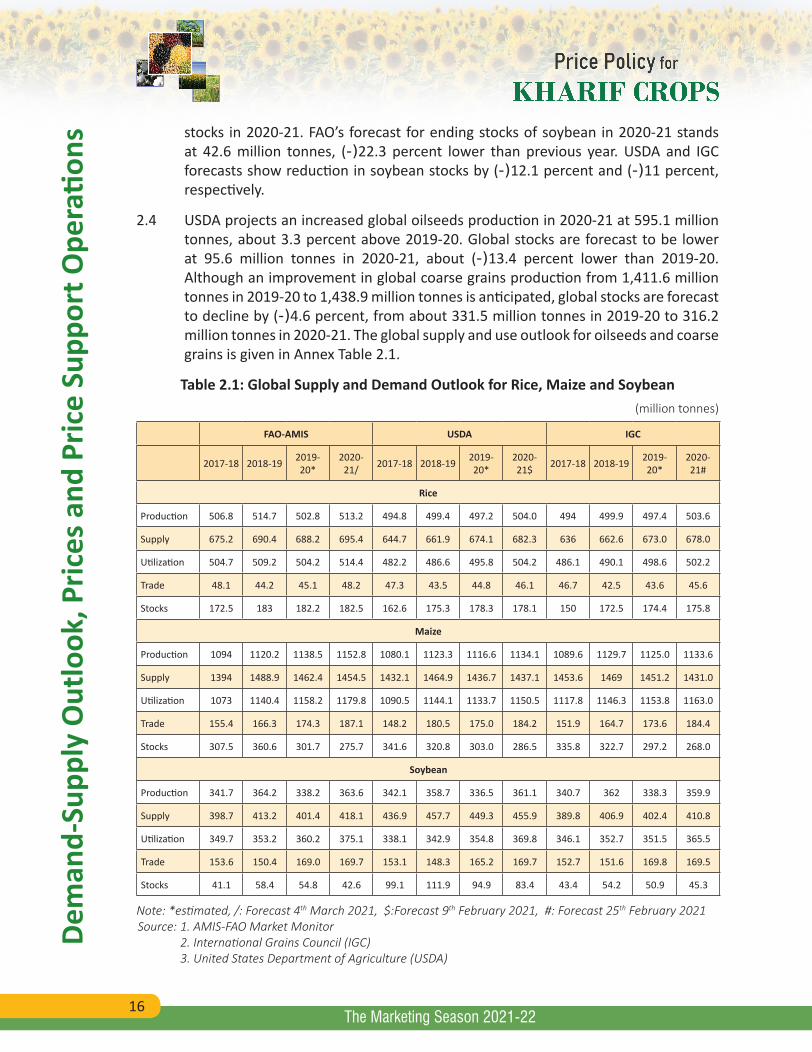
16
Dem
and-
Supp
ly O
utlo
ok, P
rices
and
Pric
e Su
ppor
t Ope
ratio
ns
The Marketing Season 2021-22
stocks in 2020-21. FAO’s forecast for ending stocks of soybean in 2020-21 stands at 42.6 million tonnes, (-)22.3 percent lower than previous year. USDA and IGC forecasts show reduction in soybean stocks by (-)12.1 percent and (-)11 percent, respectively.
2.4 USDA projects an increased global oilseeds production in 2020-21 at 595.1 million tonnes, about 3.3 percent above 2019-20. Global stocks are forecast to be lower at 95.6 million tonnes in 2020-21, about (-)13.4 percent lower than 2019-20. Although an improvement in global coarse grains production from 1,411.6 million tonnes in 2019-20 to 1,438.9 million tonnes is anticipated, global stocks are forecast to decline by (-)4.6 percent, from about 331.5 million tonnes in 2019-20 to 316.2 million tonnes in 2020-21. The global supply and use outlook for oilseeds and coarse grains is given in Annex Table 2.1.
Table 2.1: Global Supply and Demand Outlook for Rice, Maize and Soybean(million tonnes)
FAO-AMIS USDA IGC
2017-18 2018-19 2019-20*
2020-21/ 2017-18 2018-19 2019-
20*2020-21$ 2017-18 2018-19 2019-
20*2020-21#
Rice
Production 506.8 514.7 502.8 513.2 494.8 499.4 497.2 504.0 494 499.9 497.4 503.6
Supply 675.2 690.4 688.2 695.4 644.7 661.9 674.1 682.3 636 662.6 673.0 678.0
Utilization 504.7 509.2 504.2 514.4 482.2 486.6 495.8 504.2 486.1 490.1 498.6 502.2
Trade 48.1 44.2 45.1 48.2 47.3 43.5 44.8 46.1 46.7 42.5 43.6 45.6
Stocks 172.5 183 182.2 182.5 162.6 175.3 178.3 178.1 150 172.5 174.4 175.8
Maize
Production 1094 1120.2 1138.5 1152.8 1080.1 1123.3 1116.6 1134.1 1089.6 1129.7 1125.0 1133.6
Supply 1394 1488.9 1462.4 1454.5 1432.1 1464.9 1436.7 1437.1 1453.6 1469 1451.2 1431.0
Utilization 1073 1140.4 1158.2 1179.8 1090.5 1144.1 1133.7 1150.5 1117.8 1146.3 1153.8 1163.0
Trade 155.4 166.3 174.3 187.1 148.2 180.5 175.0 184.2 151.9 164.7 173.6 184.4
Stocks 307.5 360.6 301.7 275.7 341.6 320.8 303.0 286.5 335.8 322.7 297.2 268.0
Soybean
Production 341.7 364.2 338.2 363.6 342.1 358.7 336.5 361.1 340.7 362 338.3 359.9
Supply 398.7 413.2 401.4 418.1 436.9 457.7 449.3 455.9 389.8 406.9 402.4 410.8
Utilization 349.7 353.2 360.2 375.1 338.1 342.9 354.8 369.8 346.1 352.7 351.5 365.5
Trade 153.6 150.4 169.0 169.7 153.1 148.3 165.2 169.7 152.7 151.6 169.8 169.5
Stocks 41.1 58.4 54.8 42.6 99.1 111.9 94.9 83.4 43.4 54.2 50.9 45.3
Note: *estimated, /: Forecast 4th March 2021, $:Forecast 9th February 2021, #: Forecast 25th February 2021Source: 1. AMIS-FAO Market Monitor 2. International Grains Council (IGC) 3. United States Department of Agriculture (USDA)
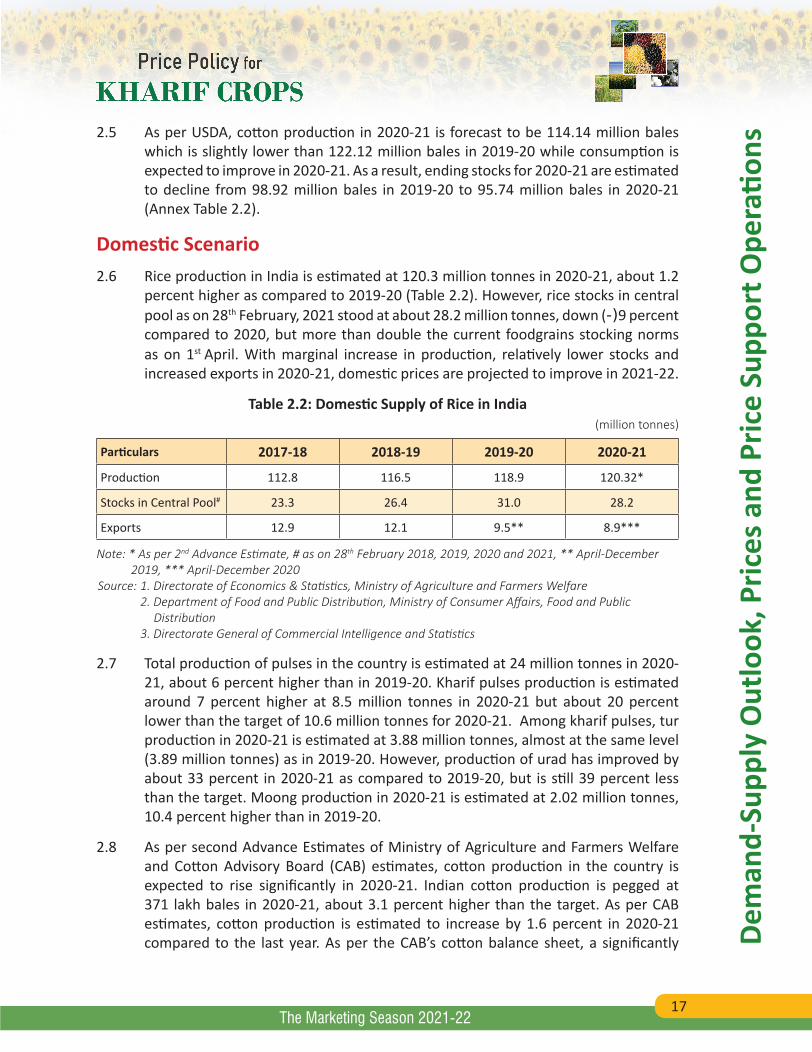
17
Dem
and-
Supp
ly O
utlo
ok, P
rices
and
Pric
e Su
ppor
t Ope
ratio
ns
The Marketing Season 2021-22
2.5 As per USDA, cotton production in 2020-21 is forecast to be 114.14 million bales which is slightly lower than 122.12 million bales in 2019-20 while consumption is expected to improve in 2020-21. As a result, ending stocks for 2020-21 are estimated to decline from 98.92 million bales in 2019-20 to 95.74 million bales in 2020-21 (Annex Table 2.2).
Domestic Scenario2.6 Rice production in India is estimated at 120.3 million tonnes in 2020-21, about 1.2
percent higher as compared to 2019-20 (Table 2.2). However, rice stocks in central pool as on 28th February, 2021 stood at about 28.2 million tonnes, down (-)9 percent compared to 2020, but more than double the current foodgrains stocking norms as on 1st April. With marginal increase in production, relatively lower stocks and increased exports in 2020-21, domestic prices are projected to improve in 2021-22.
Table 2.2: Domestic Supply of Rice in India(million tonnes)
Particulars 2017-18 2018-19 2019-20 2020-21
Production 112.8 116.5 118.9 120.32*
Stocks in Central Pool# 23.3 26.4 31.0 28.2
Exports 12.9 12.1 9.5** 8.9***
Note: * As per 2nd Advance Estimate, # as on 28th February 2018, 2019, 2020 and 2021, ** April-December 2019, *** April-December 2020Source: 1. Directorate of Economics & Statistics, Ministry of Agriculture and Farmers Welfare 2. Department of Food and Public Distribution, Ministry of Consumer Affairs, Food and Public Distribution 3. Directorate General of Commercial Intelligence and Statistics
2.7 Total production of pulses in the country is estimated at 24 million tonnes in 2020-21, about 6 percent higher than in 2019-20. Kharif pulses production is estimated around 7 percent higher at 8.5 million tonnes in 2020-21 but about 20 percent lower than the target of 10.6 million tonnes for 2020-21. Among kharif pulses, tur production in 2020-21 is estimated at 3.88 million tonnes, almost at the same level (3.89 million tonnes) as in 2019-20. However, production of urad has improved by about 33 percent in 2020-21 as compared to 2019-20, but is still 39 percent less than the target. Moong production in 2020-21 is estimated at 2.02 million tonnes, 10.4 percent higher than in 2019-20.
2.8 As per second Advance Estimates of Ministry of Agriculture and Farmers Welfare and Cotton Advisory Board (CAB) estimates, cotton production in the country is expected to rise significantly in 2020-21. Indian cotton production is pegged at 371 lakh bales in 2020-21, about 3.1 percent higher than the target. As per CAB estimates, cotton production is estimated to increase by 1.6 percent in 2020-21 compared to the last year. As per the CAB’s cotton balance sheet, a significantly
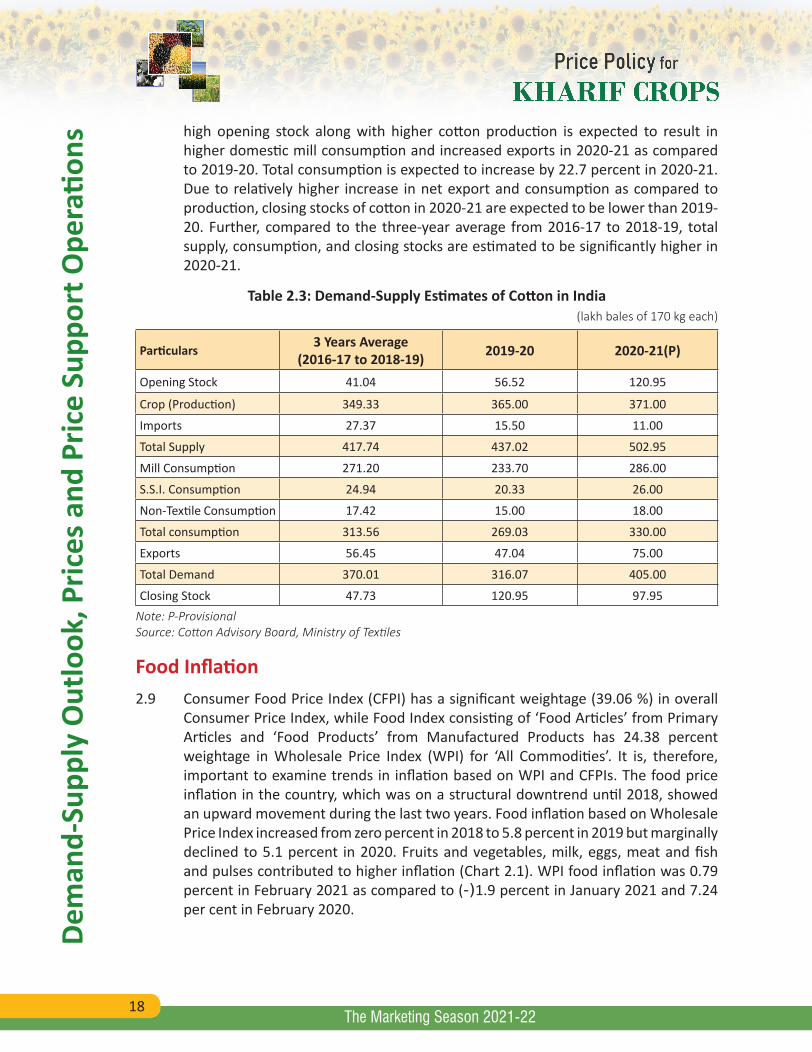
18
Dem
and-
Supp
ly O
utlo
ok, P
rices
and
Pric
e Su
ppor
t Ope
ratio
ns
The Marketing Season 2021-22
high opening stock along with higher cotton production is expected to result in higher domestic mill consumption and increased exports in 2020-21 as compared to 2019-20. Total consumption is expected to increase by 22.7 percent in 2020-21. Due to relatively higher increase in net export and consumption as compared to production, closing stocks of cotton in 2020-21 are expected to be lower than 2019-20. Further, compared to the three-year average from 2016-17 to 2018-19, total supply, consumption, and closing stocks are estimated to be significantly higher in 2020-21.
Table 2.3: Demand-Supply Estimates of Cotton in India (lakh bales of 170 kg each)
Particulars 3 Years Average (2016-17 to 2018-19) 2019-20 2020-21(P)
Opening Stock 41.04 56.52 120.95
Crop (Production) 349.33 365.00 371.00
Imports 27.37 15.50 11.00
Total Supply 417.74 437.02 502.95
Mill Consumption 271.20 233.70 286.00
S.S.I. Consumption 24.94 20.33 26.00
Non-Textile Consumption 17.42 15.00 18.00
Total consumption 313.56 269.03 330.00
Exports 56.45 47.04 75.00
Total Demand 370.01 316.07 405.00
Closing Stock 47.73 120.95 97.95Note: P-ProvisionalSource: Cotton Advisory Board, Ministry of Textiles
Food Inflation2.9 Consumer Food Price Index (CFPI) has a significant weightage (39.06 %) in overall
Consumer Price Index, while Food Index consisting of ‘Food Articles’ from Primary Articles and ‘Food Products’ from Manufactured Products has 24.38 percent weightage in Wholesale Price Index (WPI) for ‘All Commodities’. It is, therefore, important to examine trends in inflation based on WPI and CFPIs. The food price inflation in the country, which was on a structural downtrend until 2018, showed an upward movement during the last two years. Food inflation based on Wholesale Price Index increased from zero percent in 2018 to 5.8 percent in 2019 but marginally declined to 5.1 percent in 2020. Fruits and vegetables, milk, eggs, meat and fish and pulses contributed to higher inflation (Chart 2.1). WPI food inflation was 0.79 percent in February 2021 as compared to (-)1.9 percent in January 2021 and 7.24 per cent in February 2020.
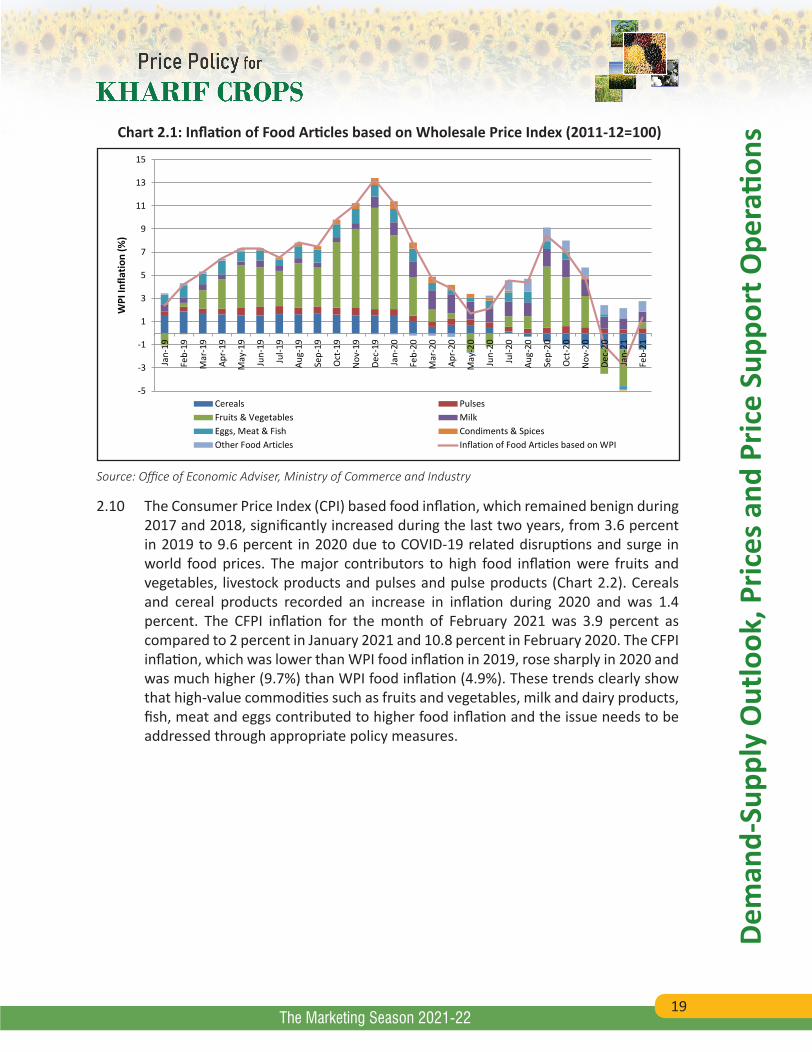
19
Dem
and-
Supp
ly O
utlo
ok, P
rices
and
Pric
e Su
ppor
t Ope
ratio
ns
The Marketing Season 2021-22
Chart 2.1: Inflation of Food Articles based on Wholesale Price Index (2011-12=100)
-5
-3
-1
1
3
5
7
9
11
13
15Ja
n-19
Feb-
19
Mar
-19
Apr-
19
May
-19
Jun-
19
Jul-1
9
Aug-
19
Sep-
19
Oct
-19
Nov
-19
Dec-
19
Jan-
20
Feb-
20
Mar
-20
Apr-
20
May
-20
Jun-
20
Jul-2
0
Aug-
20
Sep-
20
Oct
-20
Nov
-20
Dec-
20
Jan-
21
Feb-
21
WPI
Infla
tion
(%)
Cereals PulsesFruits & Vegetables MilkEggs, Meat & Fish Condiments & SpicesOther Food Articles Inflation of Food Articles based on WPI
Source: Office of Economic Adviser, Ministry of Commerce and Industry
2.10 The Consumer Price Index (CPI) based food inflation, which remained benign during 2017 and 2018, significantly increased during the last two years, from 3.6 percent in 2019 to 9.6 percent in 2020 due to COVID-19 related disruptions and surge in world food prices. The major contributors to high food inflation were fruits and vegetables, livestock products and pulses and pulse products (Chart 2.2). Cereals and cereal products recorded an increase in inflation during 2020 and was 1.4 percent. The CFPI inflation for the month of February 2021 was 3.9 percent as compared to 2 percent in January 2021 and 10.8 percent in February 2020. The CFPI inflation, which was lower than WPI food inflation in 2019, rose sharply in 2020 and was much higher (9.7%) than WPI food inflation (4.9%). These trends clearly show that high-value commodities such as fruits and vegetables, milk and dairy products, fish, meat and eggs contributed to higher food inflation and the issue needs to be addressed through appropriate policy measures.
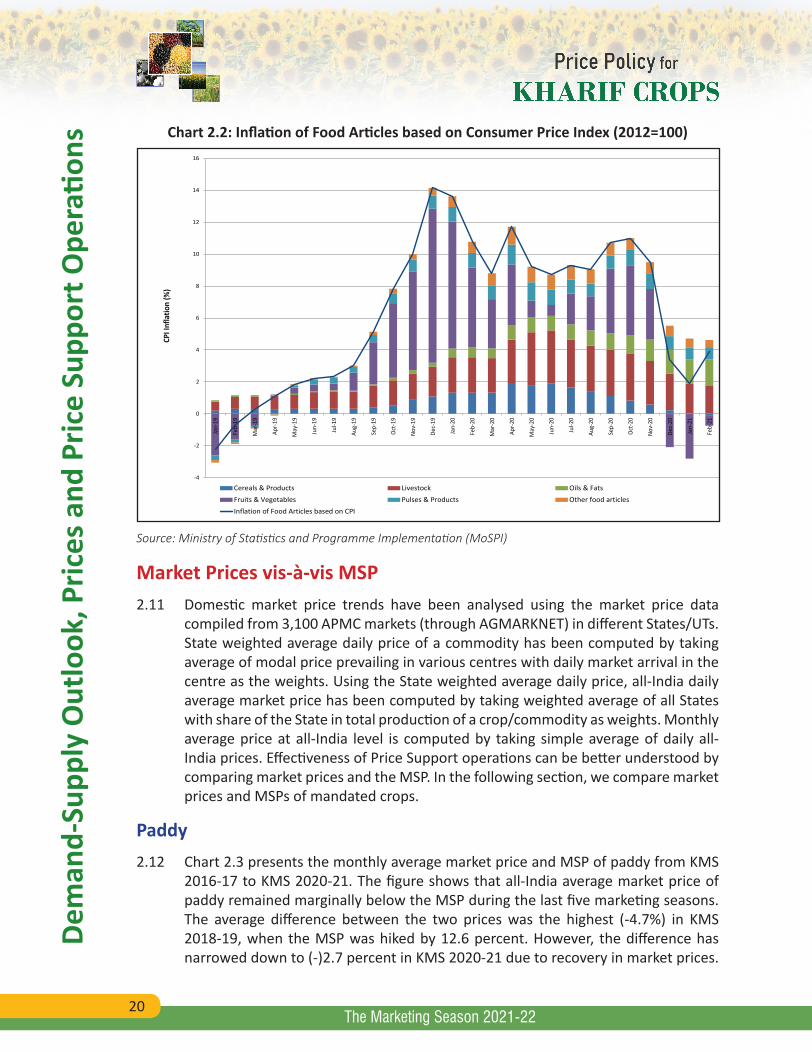
20
Dem
and-
Supp
ly O
utlo
ok, P
rices
and
Pric
e Su
ppor
t Ope
ratio
ns
The Marketing Season 2021-22
Chart 2.2: Inflation of Food Articles based on Consumer Price Index (2012=100)
-4
-2
0
2
4
6
8
10
12
14
16
Jan-
19
Feb-
19
Mar
-19
Apr-1
9
May
-19
Jun-
19
Jul-1
9
Aug-
19
Sep-
19
Oct-1
9
Nov-
19
Dec-
19
Jan-
20
Feb-
20
Mar
-20
Apr-2
0
May
-20
Jun-
20
Jul-2
0
Aug-
20
Sep-
20
Oct-2
0
Nov-
20
Dec-
20
Jan-
21
Feb-
21
CPI I
nfla
tion
(%)
Cereals & Products Livestock Oils & FatsFruits & Vegetables Pulses & Products Other food articlesInflation of Food Articles based on CPI
Source: Ministry of Statistics and Programme Implementation (MoSPI)
Market Prices vis-à-vis MSP2.11 Domestic market price trends have been analysed using the market price data
compiled from 3,100 APMC markets (through AGMARKNET) in different States/UTs. State weighted average daily price of a commodity has been computed by taking average of modal price prevailing in various centres with daily market arrival in the centre as the weights. Using the State weighted average daily price, all-India daily average market price has been computed by taking weighted average of all States with share of the State in total production of a crop/commodity as weights. Monthly average price at all-India level is computed by taking simple average of daily all-India prices. Effectiveness of Price Support operations can be better understood by comparing market prices and the MSP. In the following section, we compare market prices and MSPs of mandated crops.
Paddy2.12 Chart 2.3 presents the monthly average market price and MSP of paddy from KMS
2016-17 to KMS 2020-21. The figure shows that all-India average market price of paddy remained marginally below the MSP during the last five marketing seasons. The average difference between the two prices was the highest (-4.7%) in KMS 2018-19, when the MSP was hiked by 12.6 percent. However, the difference has narrowed down to (-)2.7 percent in KMS 2020-21 due to recovery in market prices.
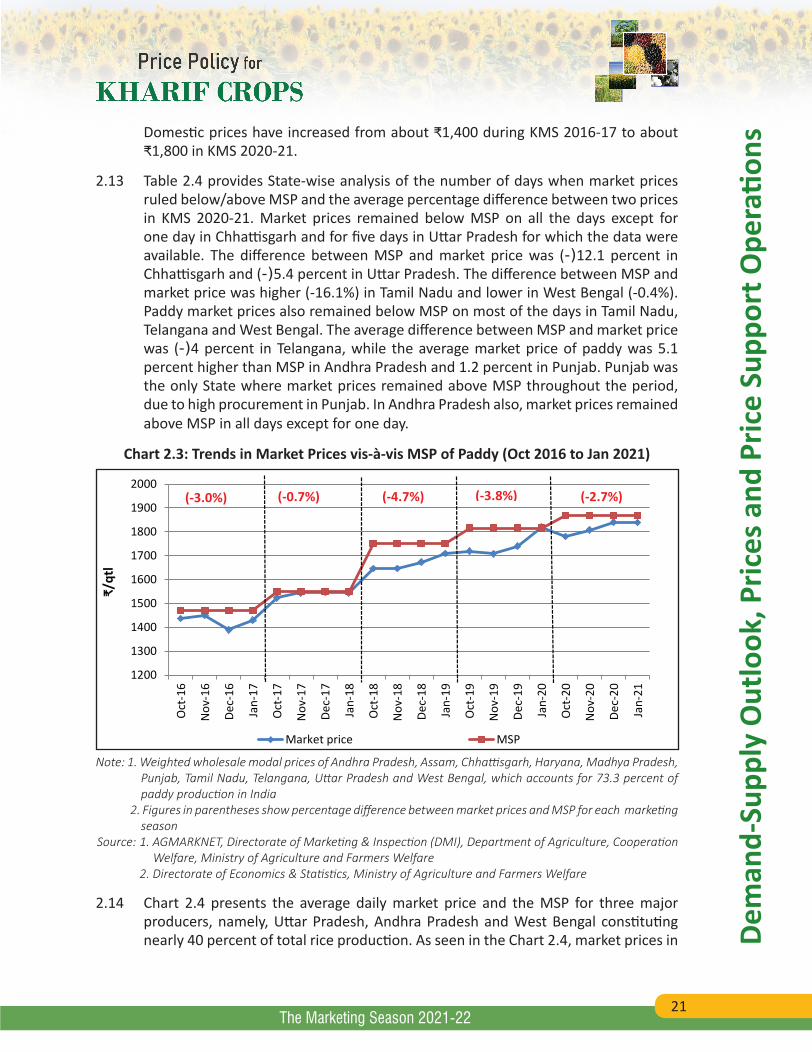
21
Dem
and-
Supp
ly O
utlo
ok, P
rices
and
Pric
e Su
ppor
t Ope
ratio
ns
The Marketing Season 2021-22
Domestic prices have increased from about ₹1,400 during KMS 2016-17 to about ₹1,800 in KMS 2020-21.
2.13 Table 2.4 provides State-wise analysis of the number of days when market prices ruled below/above MSP and the average percentage difference between two prices in KMS 2020-21. Market prices remained below MSP on all the days except for one day in Chhattisgarh and for five days in Uttar Pradesh for which the data were available. The difference between MSP and market price was (-)12.1 percent in Chhattisgarh and (-)5.4 percent in Uttar Pradesh. The difference between MSP and market price was higher (-16.1%) in Tamil Nadu and lower in West Bengal (-0.4%). Paddy market prices also remained below MSP on most of the days in Tamil Nadu, Telangana and West Bengal. The average difference between MSP and market price was (-)4 percent in Telangana, while the average market price of paddy was 5.1 percent higher than MSP in Andhra Pradesh and 1.2 percent in Punjab. Punjab was the only State where market prices remained above MSP throughout the period, due to high procurement in Punjab. In Andhra Pradesh also, market prices remained above MSP in all days except for one day.
Chart 2.3: Trends in Market Prices vis-à-vis MSP of Paddy (Oct 2016 to Jan 2021)
1200
1300
1400
1500
1600
1700
1800
1900
2000
Oct
-16
Nov
-16
Dec-
16
Jan-
17
Oct
-17
Nov
-17
Dec-
17
Jan-
18
Oct
-18
Nov
-18
Dec-
18
Jan-
19
Oct
-19
Nov
-19
Dec-
19
Jan-
20
Oct
-20
Nov
-20
Dec-
20
Jan-
21
₹/qt
l
Market price MSP
(-3.0%) (-0.7%) (-4.7%) (-3.8%) (-2.7%)
Note: 1. Weighted wholesale modal prices of Andhra Pradesh, Assam, Chhattisgarh, Haryana, Madhya Pradesh, Punjab, Tamil Nadu, Telangana, Uttar Pradesh and West Bengal, which accounts for 73.3 percent of paddy production in India
2. Figures in parentheses show percentage difference between market prices and MSP for each marketing season
Source: 1. AGMARKNET, Directorate of Marketing & Inspection (DMI), Department of Agriculture, Cooperation Welfare, Ministry of Agriculture and Farmers Welfare
2. Directorate of Economics & Statistics, Ministry of Agriculture and Farmers Welfare
2.14 Chart 2.4 presents the average daily market price and the MSP for three major producers, namely, Uttar Pradesh, Andhra Pradesh and West Bengal constituting nearly 40 percent of total rice production. As seen in the Chart 2.4, market prices in
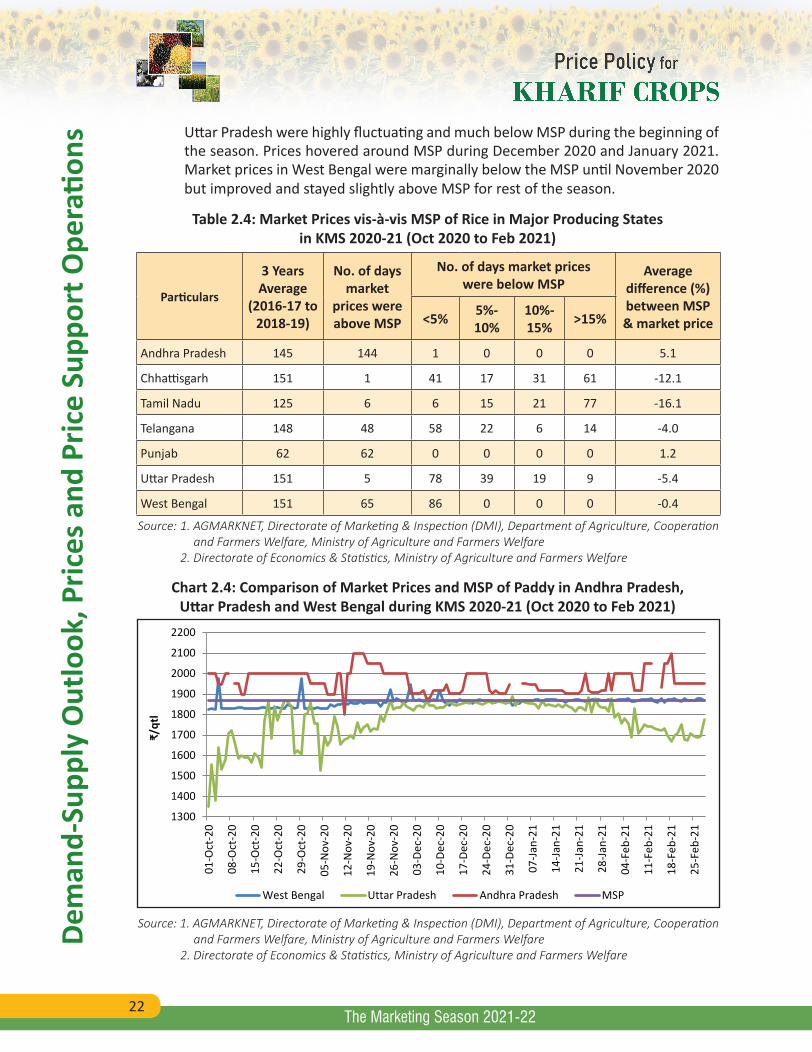
22
Dem
and-
Supp
ly O
utlo
ok, P
rices
and
Pric
e Su
ppor
t Ope
ratio
ns
The Marketing Season 2021-22
Uttar Pradesh were highly fluctuating and much below MSP during the beginning of the season. Prices hovered around MSP during December 2020 and January 2021. Market prices in West Bengal were marginally below the MSP until November 2020 but improved and stayed slightly above MSP for rest of the season.
Table 2.4: Market Prices vis-à-vis MSP of Rice in Major Producing States in KMS 2020-21 (Oct 2020 to Feb 2021)
Particulars
3 Years Average
(2016-17 to 2018-19)
No. of days market
prices were above MSP
No. of days market prices were below MSP
Average difference (%) between MSP & market price <5% 5%-
10%10%-15% >15%
Andhra Pradesh 145 144 1 0 0 0 5.1
Chhattisgarh 151 1 41 17 31 61 -12.1
Tamil Nadu 125 6 6 15 21 77 -16.1
Telangana 148 48 58 22 6 14 -4.0
Punjab 62 62 0 0 0 0 1.2
Uttar Pradesh 151 5 78 39 19 9 -5.4
West Bengal 151 65 86 0 0 0 -0.4
Source: 1. AGMARKNET, Directorate of Marketing & Inspection (DMI), Department of Agriculture, Cooperation and Farmers Welfare, Ministry of Agriculture and Farmers Welfare
2. Directorate of Economics & Statistics, Ministry of Agriculture and Farmers Welfare
Chart 2.4: Comparison of Market Prices and MSP of Paddy in Andhra Pradesh, Uttar Pradesh and West Bengal during KMS 2020-21 (Oct 2020 to Feb 2021)
1300
1400
1500
1600
1700
1800
1900
2000
2100
2200
01-O
ct-2
0
08-O
ct-2
0
15-O
ct-2
0
22-O
ct-2
0
29-O
ct-2
0
05-N
ov-2
0
12-N
ov-2
0
19-N
ov-2
0
26-N
ov-2
0
03-D
ec-2
0
10-D
ec-2
0
17-D
ec-2
0
24-D
ec-2
0
31-D
ec-2
0
07-Ja
n-21
14-Ja
n-21
21-Ja
n-21
28-Ja
n-21
04-F
eb-2
1
11-F
eb-2
1
18-F
eb-2
1
25-F
eb-2
1
₹/qt
l
West Bengal Uttar Pradesh Andhra Pradesh MSP
Source: 1. AGMARKNET, Directorate of Marketing & Inspection (DMI), Department of Agriculture, Cooperation and Farmers Welfare, Ministry of Agriculture and Farmers Welfare
2. Directorate of Economics & Statistics, Ministry of Agriculture and Farmers Welfare
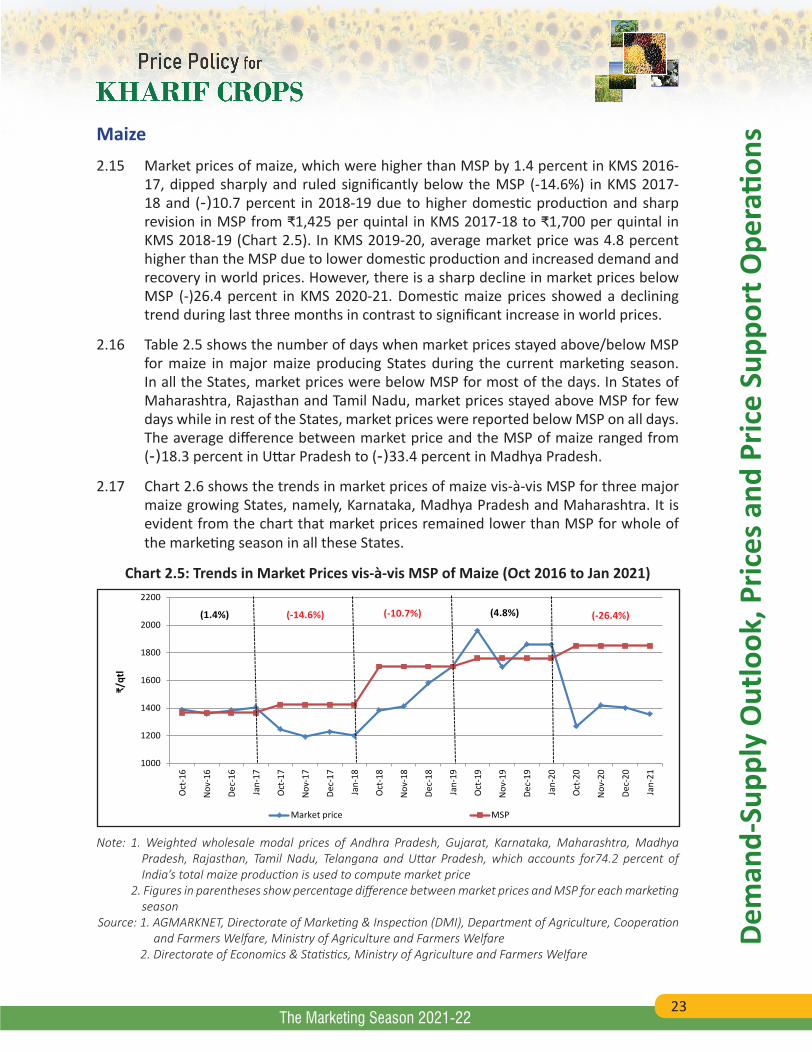
23
Dem
and-
Supp
ly O
utlo
ok, P
rices
and
Pric
e Su
ppor
t Ope
ratio
ns
The Marketing Season 2021-22
Maize2.15 Market prices of maize, which were higher than MSP by 1.4 percent in KMS 2016-
17, dipped sharply and ruled significantly below the MSP (-14.6%) in KMS 2017-18 and (-)10.7 percent in 2018-19 due to higher domestic production and sharp revision in MSP from ₹1,425 per quintal in KMS 2017-18 to ₹1,700 per quintal in KMS 2018-19 (Chart 2.5). In KMS 2019-20, average market price was 4.8 percent higher than the MSP due to lower domestic production and increased demand and recovery in world prices. However, there is a sharp decline in market prices below MSP (-)26.4 percent in KMS 2020-21. Domestic maize prices showed a declining trend during last three months in contrast to significant increase in world prices.
2.16 Table 2.5 shows the number of days when market prices stayed above/below MSP for maize in major maize producing States during the current marketing season. In all the States, market prices were below MSP for most of the days. In States of Maharashtra, Rajasthan and Tamil Nadu, market prices stayed above MSP for few days while in rest of the States, market prices were reported below MSP on all days. The average difference between market price and the MSP of maize ranged from (-)18.3 percent in Uttar Pradesh to (-)33.4 percent in Madhya Pradesh.
2.17 Chart 2.6 shows the trends in market prices of maize vis-à-vis MSP for three major maize growing States, namely, Karnataka, Madhya Pradesh and Maharashtra. It is evident from the chart that market prices remained lower than MSP for whole of the marketing season in all these States.
Chart 2.5: Trends in Market Prices vis-à-vis MSP of Maize (Oct 2016 to Jan 2021)
1000
1200
1400
1600
1800
2000
2200
Oct
-16
Nov
-16
Dec-
16
Jan-
17
Oct
-17
Nov
-17
Dec-
17
Jan-
18
Oct
-18
Nov
-18
Dec-
18
Jan-
19
Oct
-19
Nov
-19
Dec-
19
Jan-
20
Oct
-20
Nov
-20
Dec-
20
Jan-
21
₹/qt
l
Market price MSP
(1.4%) (-14.6%) (-10.7%) (4.8%) (-26.4%)
Note: 1. Weighted wholesale modal prices of Andhra Pradesh, Gujarat, Karnataka, Maharashtra, Madhya Pradesh, Rajasthan, Tamil Nadu, Telangana and Uttar Pradesh, which accounts for74.2 percent of India’s total maize production is used to compute market price
2. Figures in parentheses show percentage difference between market prices and MSP for each marketing season
Source: 1. AGMARKNET, Directorate of Marketing & Inspection (DMI), Department of Agriculture, Cooperation and Farmers Welfare, Ministry of Agriculture and Farmers Welfare
2. Directorate of Economics & Statistics, Ministry of Agriculture and Farmers Welfare
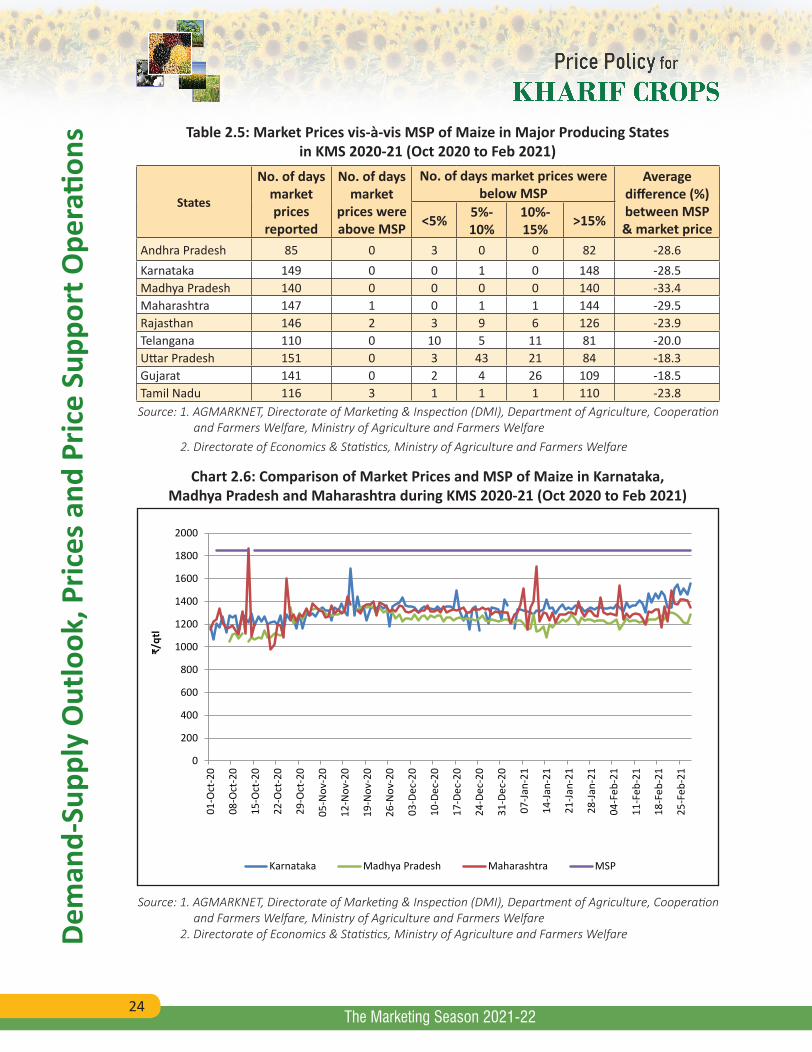
24
Dem
and-
Supp
ly O
utlo
ok, P
rices
and
Pric
e Su
ppor
t Ope
ratio
ns
The Marketing Season 2021-22
Table 2.5: Market Prices vis-à-vis MSP of Maize in Major Producing States in KMS 2020-21 (Oct 2020 to Feb 2021)
States
No. of days market prices
reported
No. of days market
prices were above MSP
No. of days market prices were below MSP
Average difference (%) between MSP & market price<5% 5%-
10%10%-15% >15%
Andhra Pradesh 85 0 3 0 0 82 -28.6Karnataka 149 0 0 1 0 148 -28.5Madhya Pradesh 140 0 0 0 0 140 -33.4Maharashtra 147 1 0 1 1 144 -29.5Rajasthan 146 2 3 9 6 126 -23.9Telangana 110 0 10 5 11 81 -20.0Uttar Pradesh 151 0 3 43 21 84 -18.3Gujarat 141 0 2 4 26 109 -18.5Tamil Nadu 116 3 1 1 1 110 -23.8Source: 1. AGMARKNET, Directorate of Marketing & Inspection (DMI), Department of Agriculture, Cooperation
and Farmers Welfare, Ministry of Agriculture and Farmers Welfare 2. Directorate of Economics & Statistics, Ministry of Agriculture and Farmers Welfare
Chart 2.6: Comparison of Market Prices and MSP of Maize in Karnataka, Madhya Pradesh and Maharashtra during KMS 2020-21 (Oct 2020 to Feb 2021)
0
200
400
600
800
1000
1200
1400
1600
1800
2000
01-O
ct-2
0
08-O
ct-2
0
15-O
ct-2
0
22-O
ct-2
0
29-O
ct-2
0
05-N
ov-2
0
12-N
ov-2
0
19-N
ov-2
0
26-N
ov-2
0
03-D
ec-2
0
10-D
ec-2
0
17-D
ec-2
0
24-D
ec-2
0
31-D
ec-2
0
07-Ja
n-21
14-Ja
n-21
21-Ja
n-21
28-Ja
n-21
04-F
eb-2
1
11-F
eb-2
1
18-F
eb-2
1
25-F
eb-2
1
₹/qt
l
Karnataka Madhya Pradesh Maharashtra MSP
Source: 1. AGMARKNET, Directorate of Marketing & Inspection (DMI), Department of Agriculture, Cooperation and Farmers Welfare, Ministry of Agriculture and Farmers Welfare
2. Directorate of Economics & Statistics, Ministry of Agriculture and Farmers Welfare
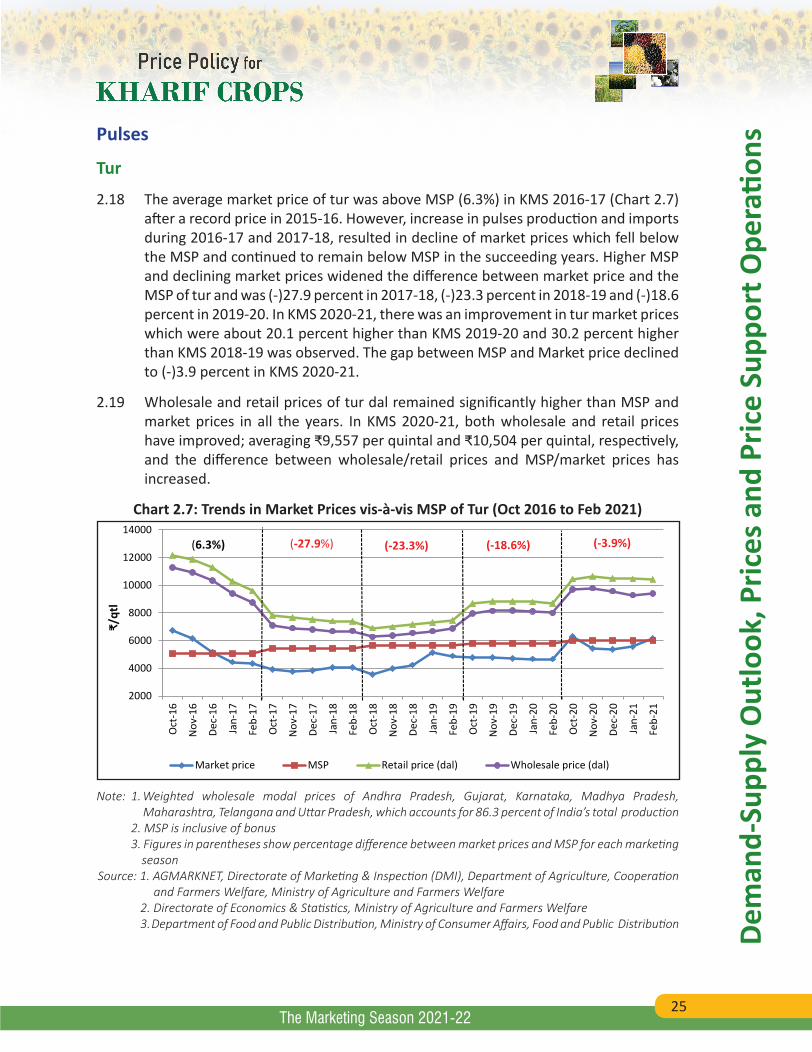
25
Dem
and-
Supp
ly O
utlo
ok, P
rices
and
Pric
e Su
ppor
t Ope
ratio
ns
The Marketing Season 2021-22
Pulses
Tur
2.18 The average market price of tur was above MSP (6.3%) in KMS 2016-17 (Chart 2.7) after a record price in 2015-16. However, increase in pulses production and imports during 2016-17 and 2017-18, resulted in decline of market prices which fell below the MSP and continued to remain below MSP in the succeeding years. Higher MSP and declining market prices widened the difference between market price and the MSP of tur and was (-)27.9 percent in 2017-18, (-)23.3 percent in 2018-19 and (-)18.6 percent in 2019-20. In KMS 2020-21, there was an improvement in tur market prices which were about 20.1 percent higher than KMS 2019-20 and 30.2 percent higher than KMS 2018-19 was observed. The gap between MSP and Market price declined to (-)3.9 percent in KMS 2020-21.
2.19 Wholesale and retail prices of tur dal remained significantly higher than MSP and market prices in all the years. In KMS 2020-21, both wholesale and retail prices have improved; averaging ₹9,557 per quintal and ₹10,504 per quintal, respectively, and the difference between wholesale/retail prices and MSP/market prices has increased.
Chart 2.7: Trends in Market Prices vis-à-vis MSP of Tur (Oct 2016 to Feb 2021)
2000
4000
6000
8000
10000
12000
14000
Oct
-16
Nov
-16
Dec-
16
Jan-
17
Feb-
17
Oct
-17
Nov
-17
Dec-
17
Jan-
18
Feb-
18
Oct
-18
Nov
-18
Dec-
18
Jan-
19
Feb-
19
Oct
-19
Nov
-19
Dec-
19
Jan-
20
Feb-
20
Oct
-20
Nov
-20
Dec-
20
Jan-
21
Feb-
21
₹/qt
l
Market price MSP Retail price (dal) Wholesale price (dal)
(6.3%) (-27.9%) (-23.3%) (-18.6%) (-3.9%)
Note: 1. Weighted wholesale modal prices of Andhra Pradesh, Gujarat, Karnataka, Madhya Pradesh, Maharashtra, Telangana and Uttar Pradesh, which accounts for 86.3 percent of India’s total production
2. MSP is inclusive of bonus 3. Figures in parentheses show percentage difference between market prices and MSP for each marketing
seasonSource: 1. AGMARKNET, Directorate of Marketing & Inspection (DMI), Department of Agriculture, Cooperation
and Farmers Welfare, Ministry of Agriculture and Farmers Welfare 2. Directorate of Economics & Statistics, Ministry of Agriculture and Farmers Welfare 3. Department of Food and Public Distribution, Ministry of Consumer Affairs, Food and Public Distribution
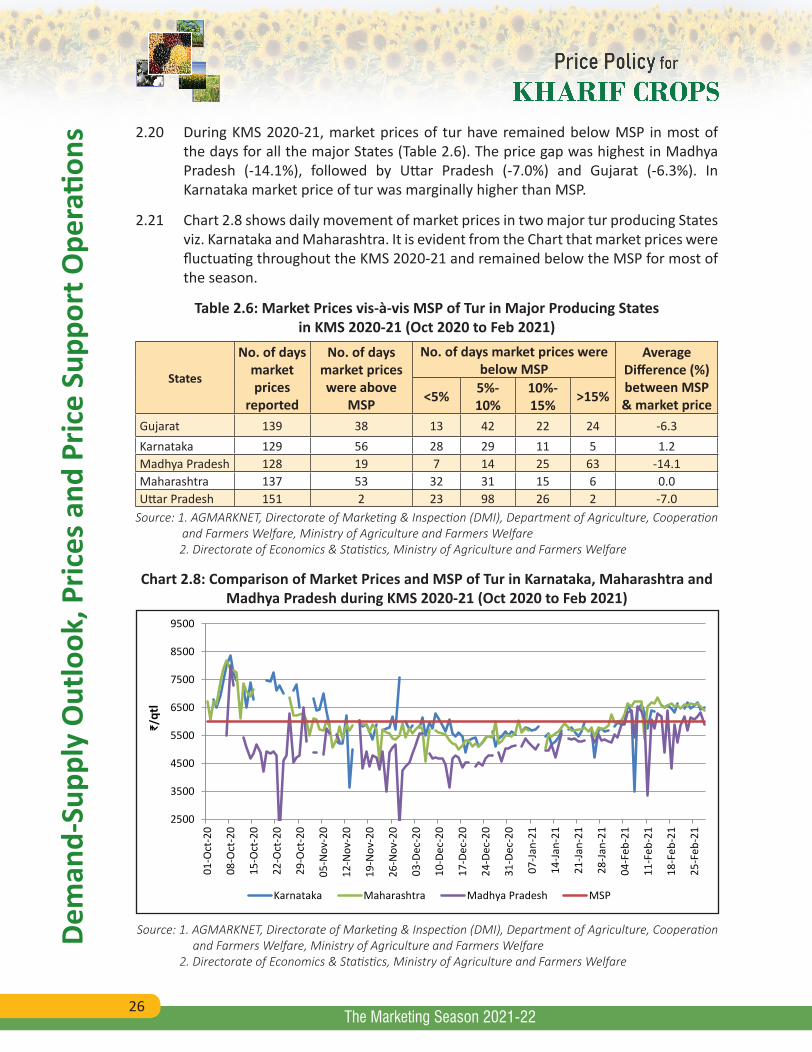
26
Dem
and-
Supp
ly O
utlo
ok, P
rices
and
Pric
e Su
ppor
t Ope
ratio
ns
The Marketing Season 2021-22
2.20 During KMS 2020-21, market prices of tur have remained below MSP in most of the days for all the major States (Table 2.6). The price gap was highest in Madhya Pradesh (-14.1%), followed by Uttar Pradesh (-7.0%) and Gujarat (-6.3%). In Karnataka market price of tur was marginally higher than MSP.
2.21 Chart 2.8 shows daily movement of market prices in two major tur producing States viz. Karnataka and Maharashtra. It is evident from the Chart that market prices were fluctuating throughout the KMS 2020-21 and remained below the MSP for most of the season.
Table 2.6: Market Prices vis-à-vis MSP of Tur in Major Producing States in KMS 2020-21 (Oct 2020 to Feb 2021)
States
No. of days market prices
reported
No. of days market prices were above
MSP
No. of days market prices were below MSP
Average Difference (%) between MSP & market price<5% 5%-
10%10%-15% >15%
Gujarat 139 38 13 42 22 24 -6.3Karnataka 129 56 28 29 11 5 1.2Madhya Pradesh 128 19 7 14 25 63 -14.1Maharashtra 137 53 32 31 15 6 0.0Uttar Pradesh 151 2 23 98 26 2 -7.0
Source: 1. AGMARKNET, Directorate of Marketing & Inspection (DMI), Department of Agriculture, Cooperation and Farmers Welfare, Ministry of Agriculture and Farmers Welfare
2. Directorate of Economics & Statistics, Ministry of Agriculture and Farmers Welfare
Chart 2.8: Comparison of Market Prices and MSP of Tur in Karnataka, Maharashtra and Madhya Pradesh during KMS 2020-21 (Oct 2020 to Feb 2021)
2500
3500
4500
5500
6500
7500
8500
9500
01-O
ct-2
0
08-O
ct-2
0
15-O
ct-2
0
22-O
ct-2
0
29-O
ct-2
0
05-N
ov-2
0
12-N
ov-2
0
19-N
ov-2
0
26-N
ov-2
0
03-D
ec-2
0
10-D
ec-2
0
17-D
ec-2
0
24-D
ec-2
0
31-D
ec-2
0
07-Ja
n-21
14-Ja
n-21
21-Ja
n-21
28-Ja
n-21
04-F
eb-2
1
11-F
eb-2
1
18-F
eb-2
1
25-F
eb-2
1
₹/qt
l
Karnataka Maharashtra Madhya Pradesh MSP
Source: 1. AGMARKNET, Directorate of Marketing & Inspection (DMI), Department of Agriculture, Cooperation and Farmers Welfare, Ministry of Agriculture and Farmers Welfare
2. Directorate of Economics & Statistics, Ministry of Agriculture and Farmers Welfare
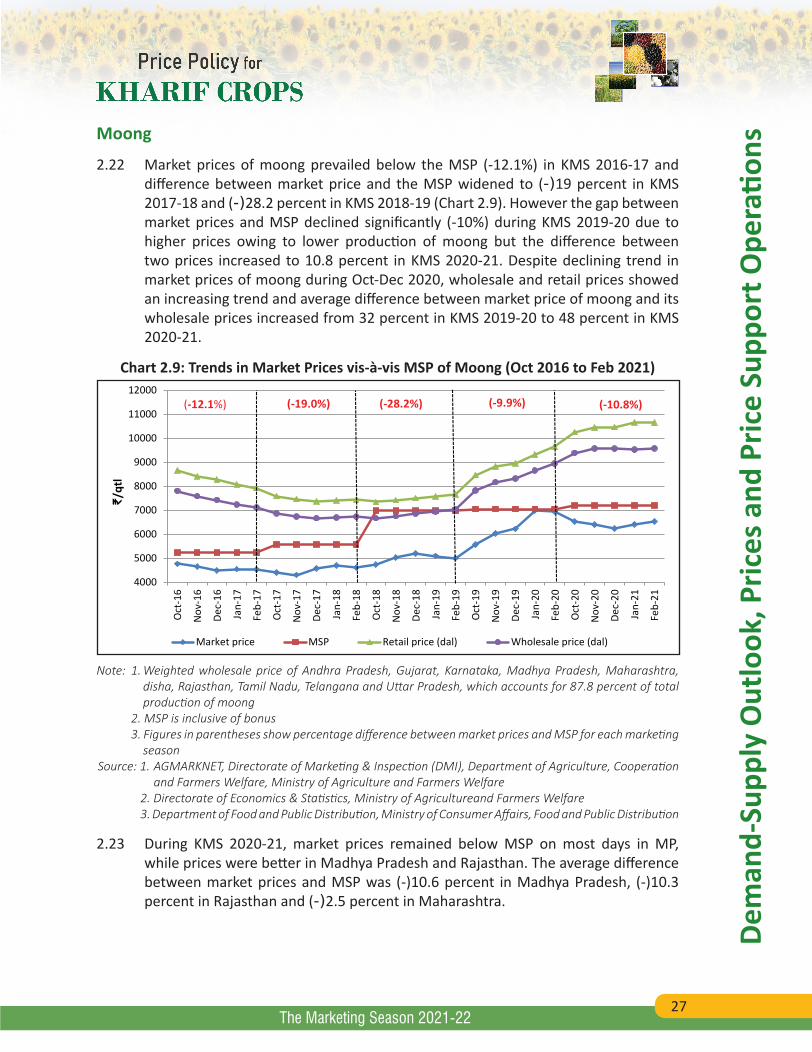
27
Dem
and-
Supp
ly O
utlo
ok, P
rices
and
Pric
e Su
ppor
t Ope
ratio
ns
The Marketing Season 2021-22
Moong
2.22 Market prices of moong prevailed below the MSP (-12.1%) in KMS 2016-17 and difference between market price and the MSP widened to (-)19 percent in KMS 2017-18 and (-)28.2 percent in KMS 2018-19 (Chart 2.9). However the gap between market prices and MSP declined significantly (-10%) during KMS 2019-20 due to higher prices owing to lower production of moong but the difference between two prices increased to 10.8 percent in KMS 2020-21. Despite declining trend in market prices of moong during Oct-Dec 2020, wholesale and retail prices showed an increasing trend and average difference between market price of moong and its wholesale prices increased from 32 percent in KMS 2019-20 to 48 percent in KMS 2020-21.
Chart 2.9: Trends in Market Prices vis-à-vis MSP of Moong (Oct 2016 to Feb 2021)
4000
5000
6000
7000
8000
9000
10000
11000
12000
Oct
-16
Nov
-16
Dec-
16
Jan-
17
Feb-
17
Oct
-17
Nov
-17
Dec-
17
Jan-
18
Feb-
18
Oct
-18
Nov
-18
Dec-
18
Jan-
19
Feb-
19
Oct
-19
Nov
-19
Dec-
19
Jan-
20
Feb-
20
Oct
-20
Nov
-20
Dec-
20
Jan-
21
Feb-
21
₹/qt
l
Market price MSP Retail price (dal) Wholesale price (dal)
(-19.0%) (-28.2%) (-9.9%) (-10.8%) (-12.1%)
Note: 1. Weighted wholesale price of Andhra Pradesh, Gujarat, Karnataka, Madhya Pradesh, Maharashtra, disha, Rajasthan, Tamil Nadu, Telangana and Uttar Pradesh, which accounts for 87.8 percent of total production of moong
2. MSP is inclusive of bonus 3. Figures in parentheses show percentage difference between market prices and MSP for each marketing
season Source: 1. AGMARKNET, Directorate of Marketing & Inspection (DMI), Department of Agriculture, Cooperation
and Farmers Welfare, Ministry of Agriculture and Farmers Welfare 2. Directorate of Economics & Statistics, Ministry of Agricultureand Farmers Welfare 3. Department of Food and Public Distribution, Ministry of Consumer Affairs, Food and Public Distribution
2.23 During KMS 2020-21, market prices remained below MSP on most days in MP, while prices were better in Madhya Pradesh and Rajasthan. The average difference between market prices and MSP was (-)10.6 percent in Madhya Pradesh, (-)10.3 percent in Rajasthan and (-)2.5 percent in Maharashtra.
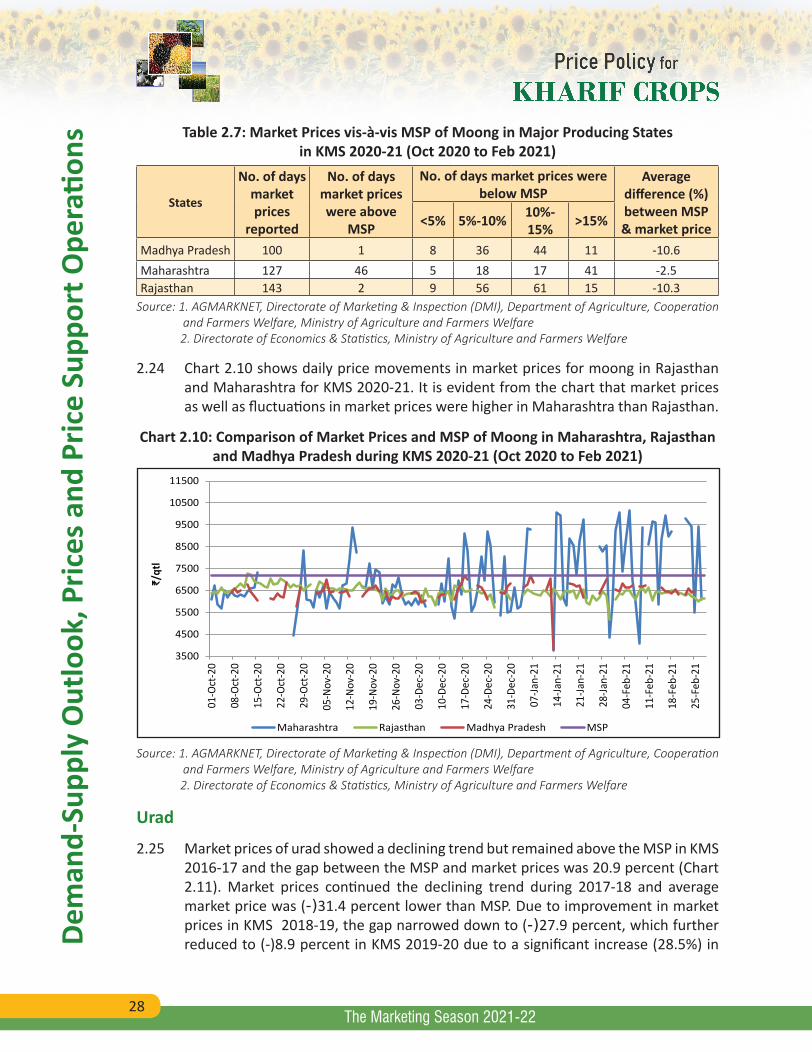
28
Dem
and-
Supp
ly O
utlo
ok, P
rices
and
Pric
e Su
ppor
t Ope
ratio
ns
The Marketing Season 2021-22
Table 2.7: Market Prices vis-à-vis MSP of Moong in Major Producing States in KMS 2020-21 (Oct 2020 to Feb 2021)
States
No. of days market prices
reported
No. of days market prices were above
MSP
No. of days market prices were below MSP
Average difference (%) between MSP & market price<5% 5%-10% 10%-
15% >15%
Madhya Pradesh 100 1 8 36 44 11 -10.6Maharashtra 127 46 5 18 17 41 -2.5Rajasthan 143 2 9 56 61 15 -10.3
Source: 1. AGMARKNET, Directorate of Marketing & Inspection (DMI), Department of Agriculture, Cooperation and Farmers Welfare, Ministry of Agriculture and Farmers Welfare
2. Directorate of Economics & Statistics, Ministry of Agriculture and Farmers Welfare
2.24 Chart 2.10 shows daily price movements in market prices for moong in Rajasthan and Maharashtra for KMS 2020-21. It is evident from the chart that market prices as well as fluctuations in market prices were higher in Maharashtra than Rajasthan.
Chart 2.10: Comparison of Market Prices and MSP of Moong in Maharashtra, Rajasthan and Madhya Pradesh during KMS 2020-21 (Oct 2020 to Feb 2021)
3500
4500
5500
6500
7500
8500
9500
10500
11500
01-O
ct-2
0
08-O
ct-2
0
15-O
ct-2
0
22-O
ct-2
0
29-O
ct-2
0
05-N
ov-2
0
12-N
ov-2
0
19-N
ov-2
0
26-N
ov-2
0
03-D
ec-2
0
10-D
ec-2
0
17-D
ec-2
0
24-D
ec-2
0
31-D
ec-2
0
07-Ja
n-21
14-Ja
n-21
21-Ja
n-21
28-Ja
n-21
04-F
eb-2
1
11-F
eb-2
1
18-F
eb-2
1
25-F
eb-2
1
₹/qt
l
Maharashtra Rajasthan Madhya Pradesh MSP
Source: 1. AGMARKNET, Directorate of Marketing & Inspection (DMI), Department of Agriculture, Cooperation and Farmers Welfare, Ministry of Agriculture and Farmers Welfare
2. Directorate of Economics & Statistics, Ministry of Agriculture and Farmers Welfare
Urad
2.25 Market prices of urad showed a declining trend but remained above the MSP in KMS 2016-17 and the gap between the MSP and market prices was 20.9 percent (Chart 2.11). Market prices continued the declining trend during 2017-18 and average market price was (-)31.4 percent lower than MSP. Due to improvement in market prices in KMS 2018-19, the gap narrowed down to (-)27.9 percent, which further reduced to (-)8.9 percent in KMS 2019-20 due to a significant increase (28.5%) in
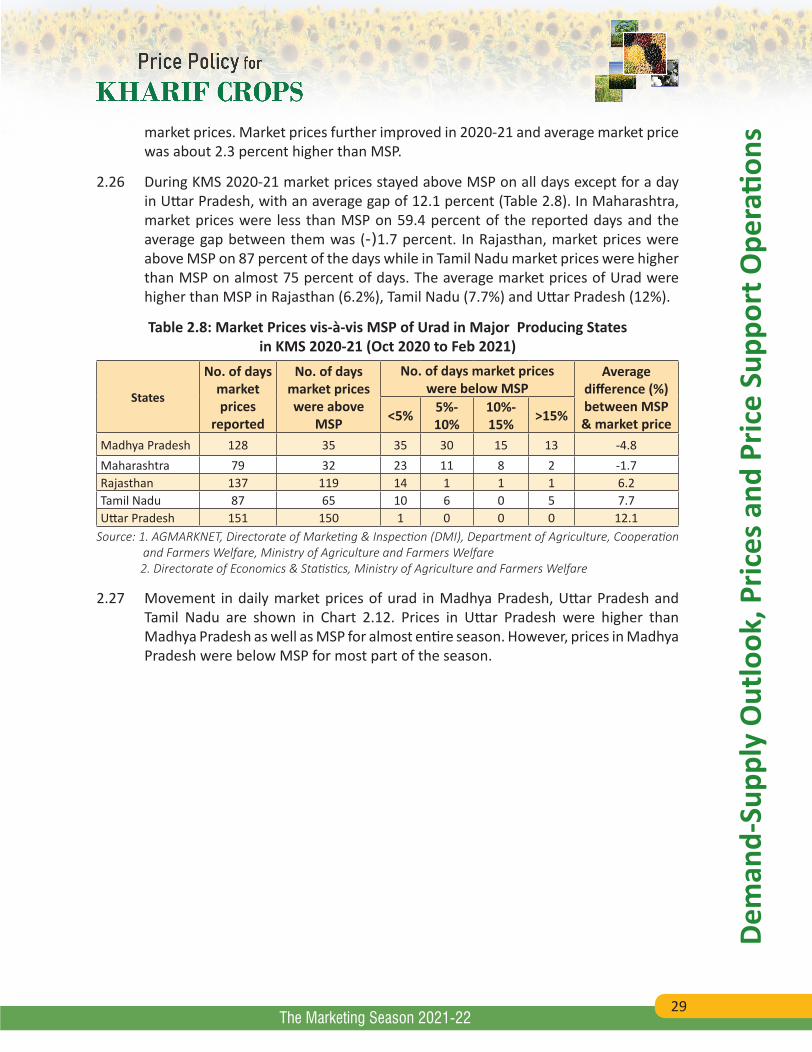
29
Dem
and-
Supp
ly O
utlo
ok, P
rices
and
Pric
e Su
ppor
t Ope
ratio
ns
The Marketing Season 2021-22
market prices. Market prices further improved in 2020-21 and average market price was about 2.3 percent higher than MSP.
2.26 During KMS 2020-21 market prices stayed above MSP on all days except for a day in Uttar Pradesh, with an average gap of 12.1 percent (Table 2.8). In Maharashtra, market prices were less than MSP on 59.4 percent of the reported days and the average gap between them was (-)1.7 percent. In Rajasthan, market prices were above MSP on 87 percent of the days while in Tamil Nadu market prices were higher than MSP on almost 75 percent of days. The average market prices of Urad were higher than MSP in Rajasthan (6.2%), Tamil Nadu (7.7%) and Uttar Pradesh (12%).
Table 2.8: Market Prices vis-à-vis MSP of Urad in Major Producing States in KMS 2020-21 (Oct 2020 to Feb 2021)
States
No. of days market prices
reported
No. of days market prices were above
MSP
No. of days market prices were below MSP
Average difference (%) between MSP & market price <5% 5%-
10%10%-15% >15%
Madhya Pradesh 128 35 35 30 15 13 -4.8Maharashtra 79 32 23 11 8 2 -1.7Rajasthan 137 119 14 1 1 1 6.2Tamil Nadu 87 65 10 6 0 5 7.7Uttar Pradesh 151 150 1 0 0 0 12.1
Source: 1. AGMARKNET, Directorate of Marketing & Inspection (DMI), Department of Agriculture, Cooperation and Farmers Welfare, Ministry of Agriculture and Farmers Welfare
2. Directorate of Economics & Statistics, Ministry of Agriculture and Farmers Welfare
2.27 Movement in daily market prices of urad in Madhya Pradesh, Uttar Pradesh and Tamil Nadu are shown in Chart 2.12. Prices in Uttar Pradesh were higher than Madhya Pradesh as well as MSP for almost entire season. However, prices in Madhya Pradesh were below MSP for most part of the season.
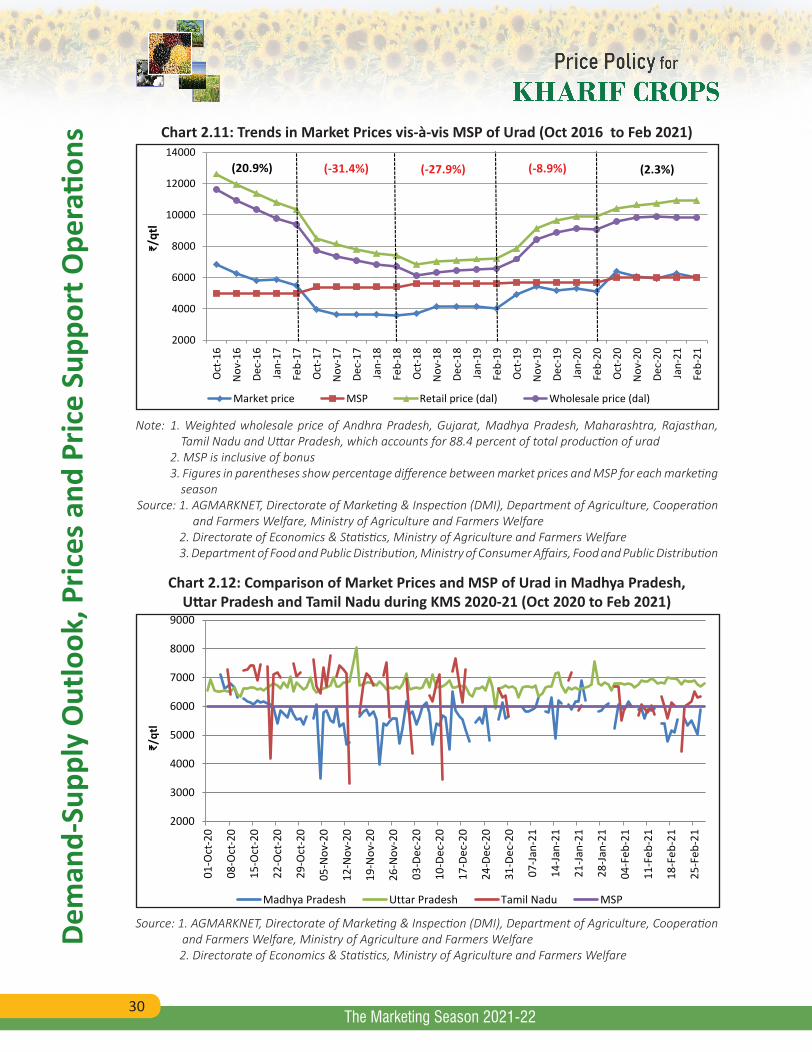
30
Dem
and-
Supp
ly O
utlo
ok, P
rices
and
Pric
e Su
ppor
t Ope
ratio
ns
The Marketing Season 2021-22
Chart 2.11: Trends in Market Prices vis-à-vis MSP of Urad (Oct 2016 to Feb 2021)
2000
4000
6000
8000
10000
12000
14000
Oct
-16
Nov
-16
Dec-
16
Jan-
17
Feb-
17
Oct
-17
Nov
-17
Dec-
17
Jan-
18
Feb-
18
Oct
-18
Nov
-18
Dec-
18
Jan-
19
Feb-
19
Oct
-19
Nov
-19
Dec-
19
Jan-
20
Feb-
20
Oct
-20
Nov
-20
Dec-
20
Jan-
21
Feb-
21
₹/qt
l
Market price MSP Retail price (dal) Wholesale price (dal)
(20.9%) (-31.4%) (-27.9%) (-8.9%) (2.3%)
Note: 1. Weighted wholesale price of Andhra Pradesh, Gujarat, Madhya Pradesh, Maharashtra, Rajasthan, Tamil Nadu and Uttar Pradesh, which accounts for 88.4 percent of total production of urad
2. MSP is inclusive of bonus 3. Figures in parentheses show percentage difference between market prices and MSP for each marketing
seasonSource: 1. AGMARKNET, Directorate of Marketing & Inspection (DMI), Department of Agriculture, Cooperation
and Farmers Welfare, Ministry of Agriculture and Farmers Welfare 2. Directorate of Economics & Statistics, Ministry of Agriculture and Farmers Welfare 3. Department of Food and Public Distribution, Ministry of Consumer Affairs, Food and Public Distribution
Chart 2.12: Comparison of Market Prices and MSP of Urad in Madhya Pradesh, Uttar Pradesh and Tamil Nadu during KMS 2020-21 (Oct 2020 to Feb 2021)
2000
3000
4000
5000
6000
7000
8000
9000
01-O
ct-2
0
08-O
ct-2
0
15-O
ct-2
0
22-O
ct-2
0
29-O
ct-2
0
05-N
ov-2
0
12-N
ov-2
0
19-N
ov-2
0
26-N
ov-2
0
03-D
ec-2
0
10-D
ec-2
0
17-D
ec-2
0
24-D
ec-2
0
31-D
ec-2
0
07-Ja
n-21
14-Ja
n-21
21-Ja
n-21
28-Ja
n-21
04-F
eb-2
1
11-F
eb-2
1
18-F
eb-2
1
25-F
eb-2
1
₹/qt
l
Madhya Pradesh Uttar Pradesh Tamil Nadu MSP
Source: 1. AGMARKNET, Directorate of Marketing & Inspection (DMI), Department of Agriculture, Cooperation and Farmers Welfare, Ministry of Agriculture and Farmers Welfare
2. Directorate of Economics & Statistics, Ministry of Agriculture and Farmers Welfare
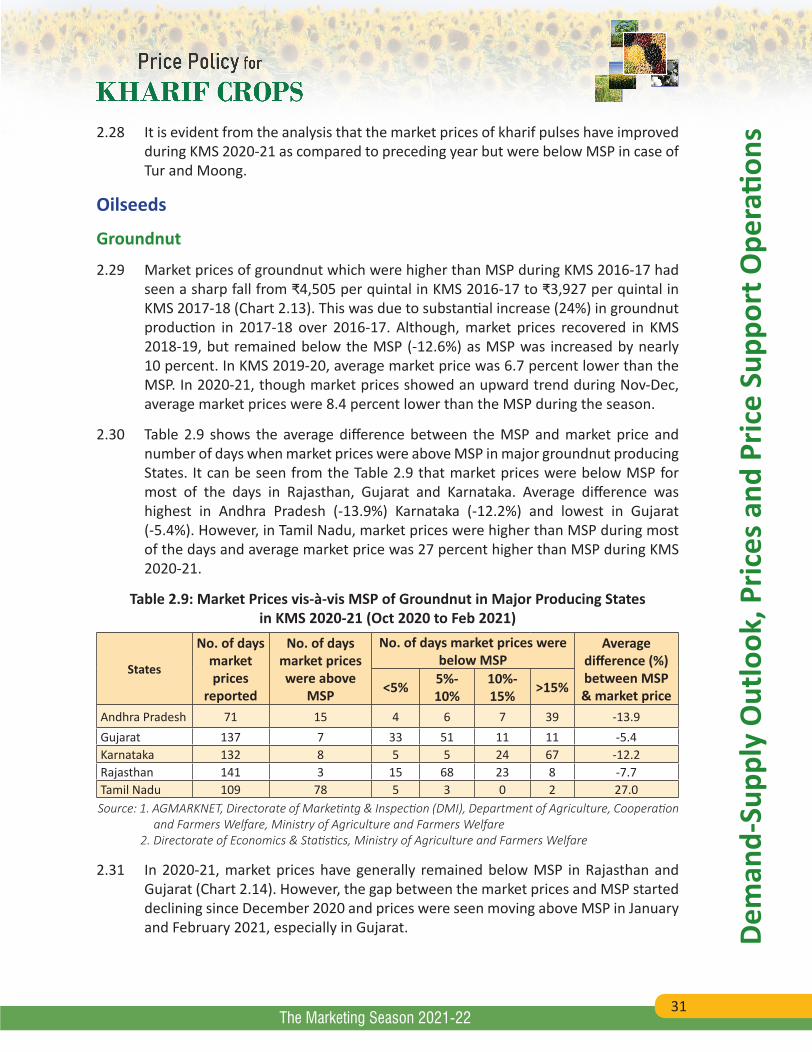
31
Dem
and-
Supp
ly O
utlo
ok, P
rices
and
Pric
e Su
ppor
t Ope
ratio
ns
The Marketing Season 2021-22
2.28 It is evident from the analysis that the market prices of kharif pulses have improved during KMS 2020-21 as compared to preceding year but were below MSP in case of Tur and Moong.
Oilseeds
Groundnut
2.29 Market prices of groundnut which were higher than MSP during KMS 2016-17 had seen a sharp fall from ₹4,505 per quintal in KMS 2016-17 to ₹3,927 per quintal in KMS 2017-18 (Chart 2.13). This was due to substantial increase (24%) in groundnut production in 2017-18 over 2016-17. Although, market prices recovered in KMS 2018-19, but remained below the MSP (-12.6%) as MSP was increased by nearly 10 percent. In KMS 2019-20, average market price was 6.7 percent lower than the MSP. In 2020-21, though market prices showed an upward trend during Nov-Dec, average market prices were 8.4 percent lower than the MSP during the season.
2.30 Table 2.9 shows the average difference between the MSP and market price and number of days when market prices were above MSP in major groundnut producing States. It can be seen from the Table 2.9 that market prices were below MSP for most of the days in Rajasthan, Gujarat and Karnataka. Average difference was highest in Andhra Pradesh (-13.9%) Karnataka (-12.2%) and lowest in Gujarat (-5.4%). However, in Tamil Nadu, market prices were higher than MSP during most of the days and average market price was 27 percent higher than MSP during KMS 2020-21.
Table 2.9: Market Prices vis-à-vis MSP of Groundnut in Major Producing States in KMS 2020-21 (Oct 2020 to Feb 2021)
States
No. of days market prices
reported
No. of days market prices were above
MSP
No. of days market prices were below MSP
Average difference (%)between MSP & market price <5% 5%-
10%10%-15% >15%
Andhra Pradesh 71 15 4 6 7 39 -13.9Gujarat 137 7 33 51 11 11 -5.4Karnataka 132 8 5 5 24 67 -12.2Rajasthan 141 3 15 68 23 8 -7.7Tamil Nadu 109 78 5 3 0 2 27.0Source: 1. AGMARKNET, Directorate of Marketintg & Inspection (DMI), Department of Agriculture, Cooperation
and Farmers Welfare, Ministry of Agriculture and Farmers Welfare 2. Directorate of Economics & Statistics, Ministry of Agriculture and Farmers Welfare
2.31 In 2020-21, market prices have generally remained below MSP in Rajasthan and Gujarat (Chart 2.14). However, the gap between the market prices and MSP started declining since December 2020 and prices were seen moving above MSP in January and February 2021, especially in Gujarat.
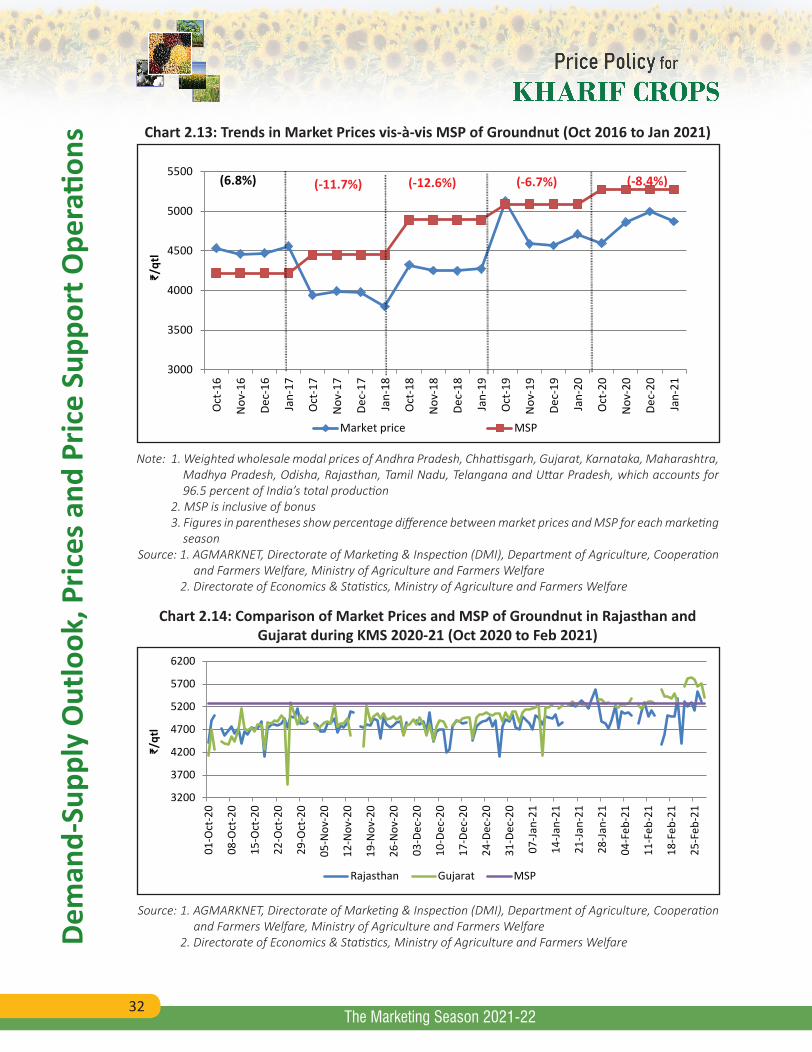
32
Dem
and-
Supp
ly O
utlo
ok, P
rices
and
Pric
e Su
ppor
t Ope
ratio
ns
The Marketing Season 2021-22
Chart 2.13: Trends in Market Prices vis-à-vis MSP of Groundnut (Oct 2016 to Jan 2021)
3000
3500
4000
4500
5000
5500
Oct
-16
Nov
-16
Dec-
16
Jan-
17
Oct
-17
Nov
-17
Dec-
17
Jan-
18
Oct
-18
Nov
-18
Dec-
18
Jan-
19
Oct
-19
Nov
-19
Dec-
19
Jan-
20
Oct
-20
Nov
-20
Dec-
20
Jan-
21
₹/qt
l
Market price MSP
(6.8%) (-11.7%) (-12.6%) (-6.7%) (-8.4%)
Note: 1. Weighted wholesale modal prices of Andhra Pradesh, Chhattisgarh, Gujarat, Karnataka, Maharashtra, Madhya Pradesh, Odisha, Rajasthan, Tamil Nadu, Telangana and Uttar Pradesh, which accounts for 96.5 percent of India’s total production
2. MSP is inclusive of bonus 3. Figures in parentheses show percentage difference between market prices and MSP for each marketing
seasonSource: 1. AGMARKNET, Directorate of Marketing & Inspection (DMI), Department of Agriculture, Cooperation
and Farmers Welfare, Ministry of Agriculture and Farmers Welfare 2. Directorate of Economics & Statistics, Ministry of Agriculture and Farmers Welfare
Chart 2.14: Comparison of Market Prices and MSP of Groundnut in Rajasthan and Gujarat during KMS 2020-21 (Oct 2020 to Feb 2021)
3200
3700
4200
4700
5200
5700
6200
01-O
ct-2
0
08-O
ct-2
0
15-O
ct-2
0
22-O
ct-2
0
29-O
ct-2
0
05-N
ov-2
0
12-N
ov-2
0
19-N
ov-2
0
26-N
ov-2
0
03-D
ec-2
0
10-D
ec-2
0
17-D
ec-2
0
24-D
ec-2
0
31-D
ec-2
0
07-Ja
n-21
14-Ja
n-21
21-Ja
n-21
28-Ja
n-21
04-F
eb-2
1
11-F
eb-2
1
18-F
eb-2
1
25-F
eb-2
1
₹/qt
l
Rajasthan Gujarat MSP
Source: 1. AGMARKNET, Directorate of Marketing & Inspection (DMI), Department of Agriculture, Cooperation and Farmers Welfare, Ministry of Agriculture and Farmers Welfare
2. Directorate of Economics & Statistics, Ministry of Agriculture and Farmers Welfare
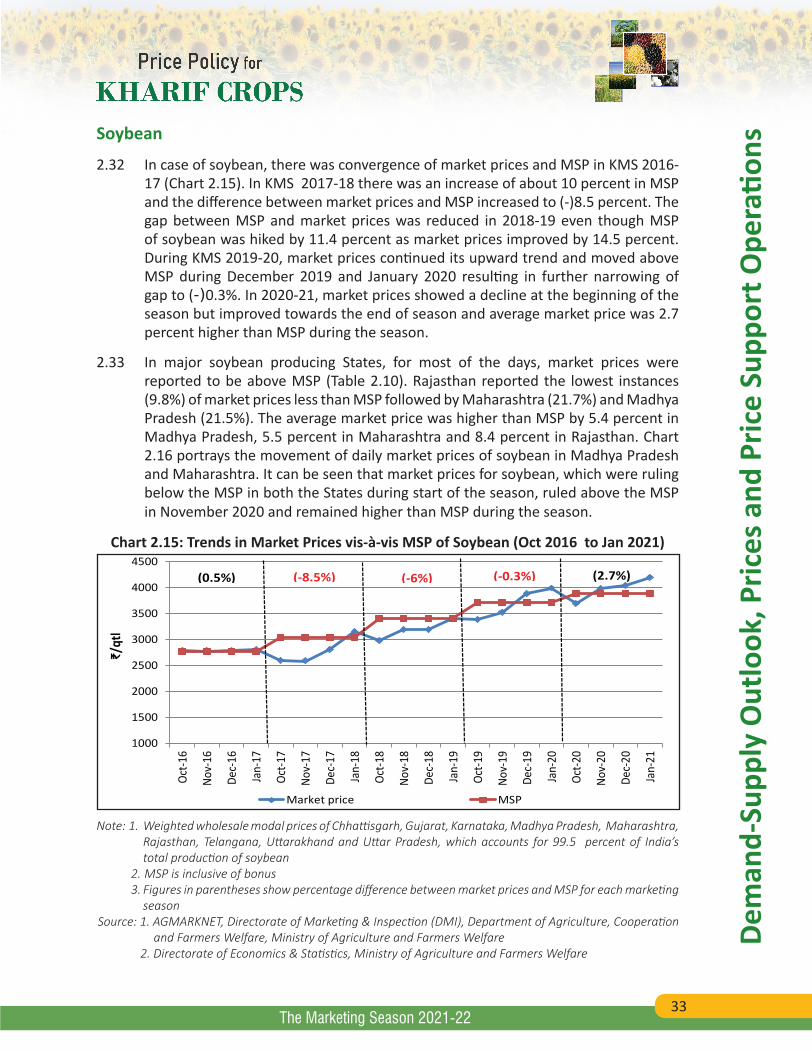
33
Dem
and-
Supp
ly O
utlo
ok, P
rices
and
Pric
e Su
ppor
t Ope
ratio
ns
The Marketing Season 2021-22
Soybean
2.32 In case of soybean, there was convergence of market prices and MSP in KMS 2016-17 (Chart 2.15). In KMS 2017-18 there was an increase of about 10 percent in MSP and the difference between market prices and MSP increased to (-)8.5 percent. The gap between MSP and market prices was reduced in 2018-19 even though MSP of soybean was hiked by 11.4 percent as market prices improved by 14.5 percent. During KMS 2019-20, market prices continued its upward trend and moved above MSP during December 2019 and January 2020 resulting in further narrowing of gap to (-)0.3%. In 2020-21, market prices showed a decline at the beginning of the season but improved towards the end of season and average market price was 2.7 percent higher than MSP during the season.
2.33 In major soybean producing States, for most of the days, market prices were reported to be above MSP (Table 2.10). Rajasthan reported the lowest instances (9.8%) of market prices less than MSP followed by Maharashtra (21.7%) and Madhya Pradesh (21.5%). The average market price was higher than MSP by 5.4 percent in Madhya Pradesh, 5.5 percent in Maharashtra and 8.4 percent in Rajasthan. Chart 2.16 portrays the movement of daily market prices of soybean in Madhya Pradesh and Maharashtra. It can be seen that market prices for soybean, which were ruling below the MSP in both the States during start of the season, ruled above the MSP in November 2020 and remained higher than MSP during the season.
Chart 2.15: Trends in Market Prices vis-à-vis MSP of Soybean (Oct 2016 to Jan 2021)
1000
1500
2000
2500
3000
3500
4000
4500
Oct-1
6
Nov-
16
Dec-
16
Jan-
17
Oct-1
7
Nov-
17
Dec-
17
Jan-
18
Oct-1
8
Nov-
18
Dec-
18
Jan-
19
Oct-1
9
Nov-
19
Dec-
19
Jan-
20
Oct-2
0
Nov-
20
Dec-
20
Jan-
21
₹/qt
l
Market price MSP
(0.5%) (-8.5%) (-6%) (-0.3%) (2.7%)
Note: 1. Weighted wholesale modal prices of Chhattisgarh, Gujarat, Karnataka, Madhya Pradesh, Maharashtra, Rajasthan, Telangana, Uttarakhand and Uttar Pradesh, which accounts for 99.5 percent of India’s total production of soybean
2. MSP is inclusive of bonus 3. Figures in parentheses show percentage difference between market prices and MSP for each marketing
seasonSource: 1. AGMARKNET, Directorate of Marketing & Inspection (DMI), Department of Agriculture, Cooperation
and Farmers Welfare, Ministry of Agriculture and Farmers Welfare 2. Directorate of Economics & Statistics, Ministry of Agriculture and Farmers Welfare
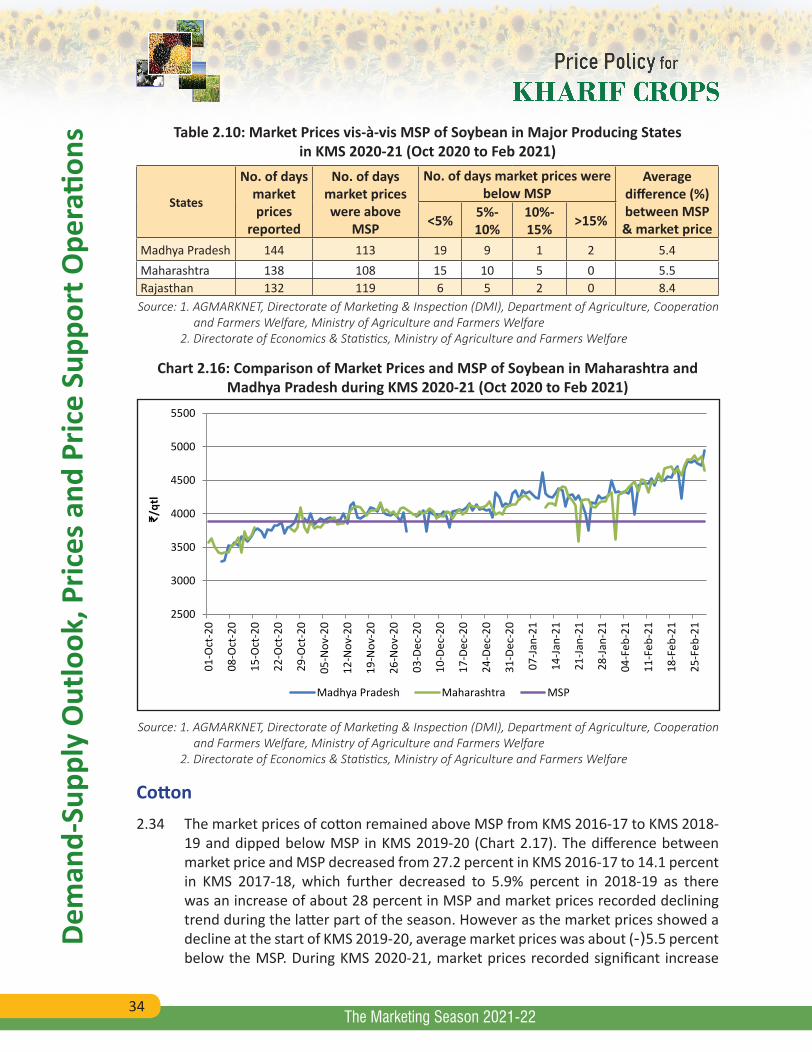
34
Dem
and-
Supp
ly O
utlo
ok, P
rices
and
Pric
e Su
ppor
t Ope
ratio
ns
The Marketing Season 2021-22
Table 2.10: Market Prices vis-à-vis MSP of Soybean in Major Producing States in KMS 2020-21 (Oct 2020 to Feb 2021)
States
No. of days market prices
reported
No. of days market prices were above
MSP
No. of days market prices were below MSP
Average difference (%)between MSP & market price <5% 5%-
10%10%-15% >15%
Madhya Pradesh 144 113 19 9 1 2 5.4Maharashtra 138 108 15 10 5 0 5.5Rajasthan 132 119 6 5 2 0 8.4Source: 1. AGMARKNET, Directorate of Marketing & Inspection (DMI), Department of Agriculture, Cooperation
and Farmers Welfare, Ministry of Agriculture and Farmers Welfare 2. Directorate of Economics & Statistics, Ministry of Agriculture and Farmers Welfare
Chart 2.16: Comparison of Market Prices and MSP of Soybean in Maharashtra and Madhya Pradesh during KMS 2020-21 (Oct 2020 to Feb 2021)
2500
3000
3500
4000
4500
5000
5500
01-O
ct-2
0
08-O
ct-2
0
15-O
ct-2
0
22-O
ct-2
0
29-O
ct-2
0
05-N
ov-2
0
12-N
ov-2
0
19-N
ov-2
0
26-N
ov-2
0
03-D
ec-2
0
10-D
ec-2
0
17-D
ec-2
0
24-D
ec-2
0
31-D
ec-2
0
07-Ja
n-21
14-Ja
n-21
21-Ja
n-21
28-Ja
n-21
04-F
eb-2
1
11-F
eb-2
1
18-F
eb-2
1
25-F
eb-2
1
₹/qt
l
Madhya Pradesh Maharashtra MSP
Source: 1. AGMARKNET, Directorate of Marketing & Inspection (DMI), Department of Agriculture, Cooperation and Farmers Welfare, Ministry of Agriculture and Farmers Welfare
2. Directorate of Economics & Statistics, Ministry of Agriculture and Farmers Welfare
Cotton2.34 The market prices of cotton remained above MSP from KMS 2016-17 to KMS 2018-
19 and dipped below MSP in KMS 2019-20 (Chart 2.17). The difference between market price and MSP decreased from 27.2 percent in KMS 2016-17 to 14.1 percent in KMS 2017-18, which further decreased to 5.9% percent in 2018-19 as there was an increase of about 28 percent in MSP and market prices recorded declining trend during the latter part of the season. However as the market prices showed a decline at the start of KMS 2019-20, average market prices was about (-)5.5 percent below the MSP. During KMS 2020-21, market prices recorded significant increase
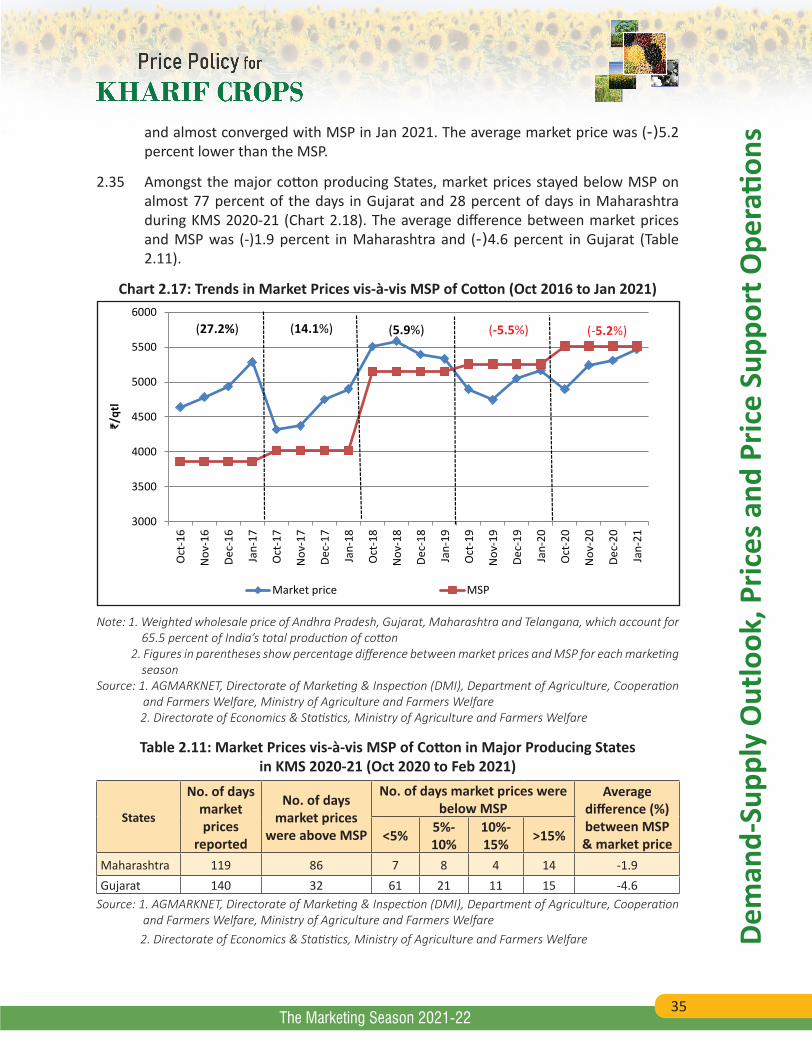
35
Dem
and-
Supp
ly O
utlo
ok, P
rices
and
Pric
e Su
ppor
t Ope
ratio
ns
The Marketing Season 2021-22
and almost converged with MSP in Jan 2021. The average market price was (-)5.2 percent lower than the MSP.
2.35 Amongst the major cotton producing States, market prices stayed below MSP on almost 77 percent of the days in Gujarat and 28 percent of days in Maharashtra during KMS 2020-21 (Chart 2.18). The average difference between market prices and MSP was (-)1.9 percent in Maharashtra and (-)4.6 percent in Gujarat (Table 2.11).
Chart 2.17: Trends in Market Prices vis-à-vis MSP of Cotton (Oct 2016 to Jan 2021)
3000
3500
4000
4500
5000
5500
6000
Oct
-16
Nov
-16
Dec-
16
Jan-
17
Oct
-17
Nov
-17
Dec-
17
Jan-
18
Oct
-18
Nov
-18
Dec-
18
Jan-
19
Oct
-19
Nov
-19
Dec-
19
Jan-
20
Oct
-20
Nov
-20
Dec-
20
Jan-
21
₹/qt
l
Market price MSP
(27.2%) (14.1%) (5.9%) (-5.5%) (-5.2%)
Note: 1. Weighted wholesale price of Andhra Pradesh, Gujarat, Maharashtra and Telangana, which account for 65.5 percent of India’s total production of cotton
2. Figures in parentheses show percentage difference between market prices and MSP for each marketing season
Source: 1. AGMARKNET, Directorate of Marketing & Inspection (DMI), Department of Agriculture, Cooperation and Farmers Welfare, Ministry of Agriculture and Farmers Welfare
2. Directorate of Economics & Statistics, Ministry of Agriculture and Farmers Welfare
Table 2.11: Market Prices vis-à-vis MSP of Cotton in Major Producing States in KMS 2020-21 (Oct 2020 to Feb 2021)
States
No. of days market prices
reported
No. of days market prices
were above MSP
No. of days market prices were below MSP
Average difference (%)between MSP & market price <5% 5%-
10%10%-15% >15%
Maharashtra 119 86 7 8 4 14 -1.9Gujarat 140 32 61 21 11 15 -4.6
Source: 1. AGMARKNET, Directorate of Marketing & Inspection (DMI), Department of Agriculture, Cooperation and Farmers Welfare, Ministry of Agriculture and Farmers Welfare
2. Directorate of Economics & Statistics, Ministry of Agriculture and Farmers Welfare
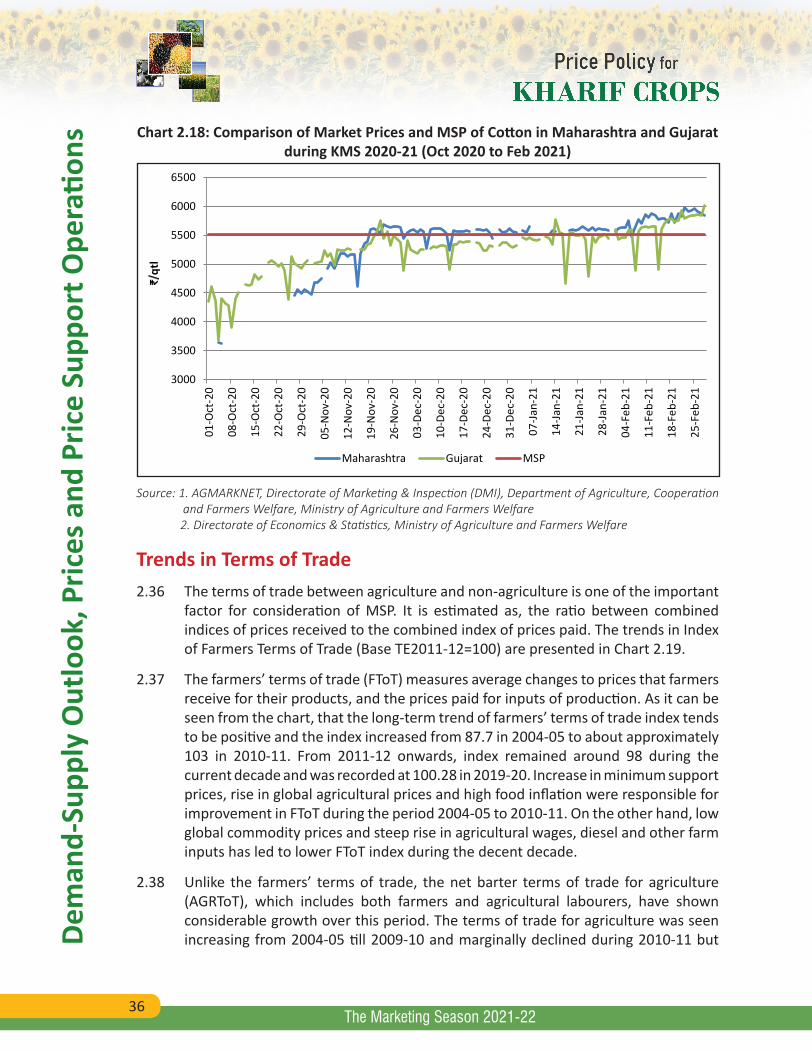
36
Dem
and-
Supp
ly O
utlo
ok, P
rices
and
Pric
e Su
ppor
t Ope
ratio
ns
The Marketing Season 2021-22
Chart 2.18: Comparison of Market Prices and MSP of Cotton in Maharashtra and Gujarat during KMS 2020-21 (Oct 2020 to Feb 2021)
3000
3500
4000
4500
5000
5500
6000
6500
01-O
ct-2
0
08-O
ct-2
0
15-O
ct-2
0
22-O
ct-2
0
29-O
ct-2
0
05-N
ov-2
0
12-N
ov-2
0
19-N
ov-2
0
26-N
ov-2
0
03-D
ec-2
0
10-D
ec-2
0
17-D
ec-2
0
24-D
ec-2
0
31-D
ec-2
0
07-Ja
n-21
14-Ja
n-21
21-Ja
n-21
28-Ja
n-21
04-F
eb-2
1
11-F
eb-2
1
18-F
eb-2
1
25-F
eb-2
1
₹/qt
l
Maharashtra Gujarat MSP
Source: 1. AGMARKNET, Directorate of Marketing & Inspection (DMI), Department of Agriculture, Cooperation and Farmers Welfare, Ministry of Agriculture and Farmers Welfare
2. Directorate of Economics & Statistics, Ministry of Agriculture and Farmers Welfare
Trends in Terms of Trade2.36 The terms of trade between agriculture and non-agriculture is one of the important
factor for consideration of MSP. It is estimated as, the ratio between combined indices of prices received to the combined index of prices paid. The trends in Index of Farmers Terms of Trade (Base TE2011-12=100) are presented in Chart 2.19.
2.37 The farmers’ terms of trade (FToT) measures average changes to prices that farmers receive for their products, and the prices paid for inputs of production. As it can be seen from the chart, that the long-term trend of farmers’ terms of trade index tends to be positive and the index increased from 87.7 in 2004-05 to about approximately 103 in 2010-11. From 2011-12 onwards, index remained around 98 during the current decade and was recorded at 100.28 in 2019-20. Increase in minimum support prices, rise in global agricultural prices and high food inflation were responsible for improvement in FToT during the period 2004-05 to 2010-11. On the other hand, low global commodity prices and steep rise in agricultural wages, diesel and other farm inputs has led to lower FToT index during the decent decade.
2.38 Unlike the farmers’ terms of trade, the net barter terms of trade for agriculture (AGRToT), which includes both farmers and agricultural labourers, have shown considerable growth over this period. The terms of trade for agriculture was seen increasing from 2004-05 till 2009-10 and marginally declined during 2010-11 but
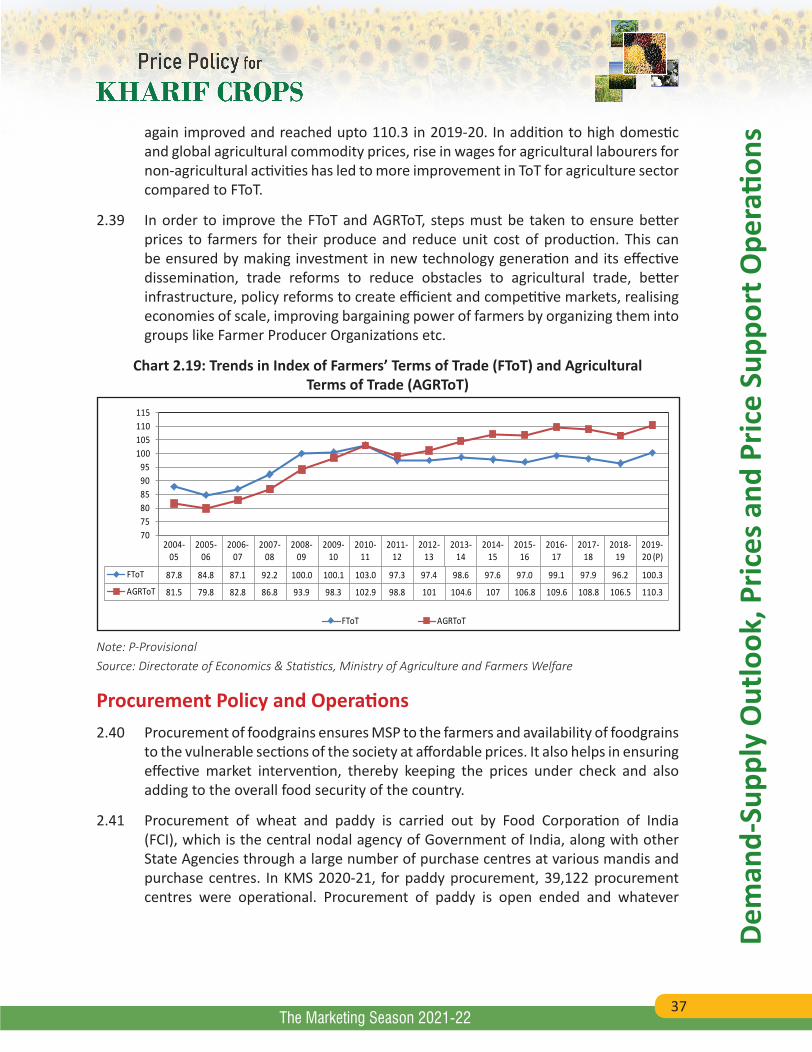
37
Dem
and-
Supp
ly O
utlo
ok, P
rices
and
Pric
e Su
ppor
t Ope
ratio
ns
The Marketing Season 2021-22
again improved and reached upto 110.3 in 2019-20. In addition to high domestic and global agricultural commodity prices, rise in wages for agricultural labourers for non-agricultural activities has led to more improvement in ToT for agriculture sector compared to FToT.
2.39 In order to improve the FToT and AGRToT, steps must be taken to ensure better prices to farmers for their produce and reduce unit cost of production. This can be ensured by making investment in new technology generation and its effective dissemination, trade reforms to reduce obstacles to agricultural trade, better infrastructure, policy reforms to create efficient and competitive markets, realising economies of scale, improving bargaining power of farmers by organizing them into groups like Farmer Producer Organizations etc.
Chart 2.19: Trends in Index of Farmers’ Terms of Trade (FToT) and Agricultural Terms of Trade (AGRToT)
2004-05
2005-06
2006-07
2007-08
2008-09
2009-10
2010-11
2011-12
2012-13
2013-14
2014-15
2015-16
2016-17
2017-18
2018-19
2019-20 (P)
FToT 87.8 84.8 87.1 92.2 100.0 100.1 103.0 97.3 97.4 98.6 97.6 97.0 99.1 97.9 96.2 100.3
AGRToT 81.5 79.8 82.8 86.8 93.9 98.3 102.9 98.8 101 104.6 107 106.8 109.6 108.8 106.5 110.3
707580859095
100105110115
FToT AGRToT
Note: P-ProvisionalSource: Directorate of Economics & Statistics, Ministry of Agriculture and Farmers Welfare
Procurement Policy and Operations2.40 Procurement of foodgrains ensures MSP to the farmers and availability of foodgrains
to the vulnerable sections of the society at affordable prices. It also helps in ensuring effective market intervention, thereby keeping the prices under check and also adding to the overall food security of the country.
2.41 Procurement of wheat and paddy is carried out by Food Corporation of India (FCI), which is the central nodal agency of Government of India, along with other State Agencies through a large number of purchase centres at various mandis and purchase centres. In KMS 2020-21, for paddy procurement, 39,122 procurement centres were operational. Procurement of paddy is open ended and whatever
38
Dem
and-
Supp
ly O
utlo
ok, P
rices
and
Pric
e Su
ppor
t Ope
ratio
ns
The Marketing Season 2021-22
quantity is offered by the farmers during the procurement season in conformity to quality standards is purchased at MSP by the Government agencies for central pool. State Governments utilise coarse cereals for distribution under National Food Security Act (NFSA) as well as Other Welfare Schemes (OWS) which are procured in consultation with FCI.
2.42 Centralized and Decentralized Procurement System exist for the procurement of foodgrains. Under centralized procurement system procurement of foodgrains is undertaken by the FCI directly or by the State agencies and stocks are handed over to FCI for storage. FCI reimburses the cost of the foodgrains procured by State agencies as soon as the agencies deliver stocks to FCI. Decentralized Procurement (DCP) of foodgrains was introduced by Government in 1997-98 to enhance efficiency of procurement and PDS, encourage local procurement of foodgrains more suited to the local taste and to extend benefits of MSP to local farmers as well as save on transit costs. Under the DCP system, the State Government or its agencies procure, store and distribute rice/wheat/coarse cereals against allocation for NFSA and OWS in the State and hand over the excess stocks to FCI in Central Pool. Government of India reimburses the expenditure incurred by the State Government on procurement, storage and distribution of DCP stocks on the laid down principles. At present, 15 States (8 for rice and 7 for rice/wheat) are under DCP system (Annex Table 2.3).
2.43 National Agricultural Cooperative Marketing Federation of India Ltd. (NAFED) procures pulses and oilseeds under Price Support Scheme (PSS) and Price Stabilization Fund (PSF) while Cotton Corporation of India (CCI) is the nodal agency for procurement of kapas (cotton) and undertakes Minimum Support Price (MSP) operations when prices of Fair Average Quality (FAQ) grade kapas fall below the MSP without any quantitative limits.
Procurement Trends2.44 There has been a significant increase in procurement of rice during the last five years.
Average procurement of rice has increased from 32.7 million tonnes in TE2015-16 to 44.9 million tonnes in TE2019-20, about 37 percent increase. Almost a similar trend was observed in all major rice producing states. As may be seen from Chart 2.20 that Telangana has recorded the highest increase (243.3%) in rice procurement between TE2015-16 and TE2019-20, followed by Uttar Pradesh (72.6%), Haryana (68.1%) and Madhya Pradesh (56.1%). Punjab, which has the largest share in rice procurement, recorded 34.9 percent increase in procurement between TE2015-16 and TE2019-20, while Bihar, Uttarakhand and Andhra Pradesh showed a decline during the period.
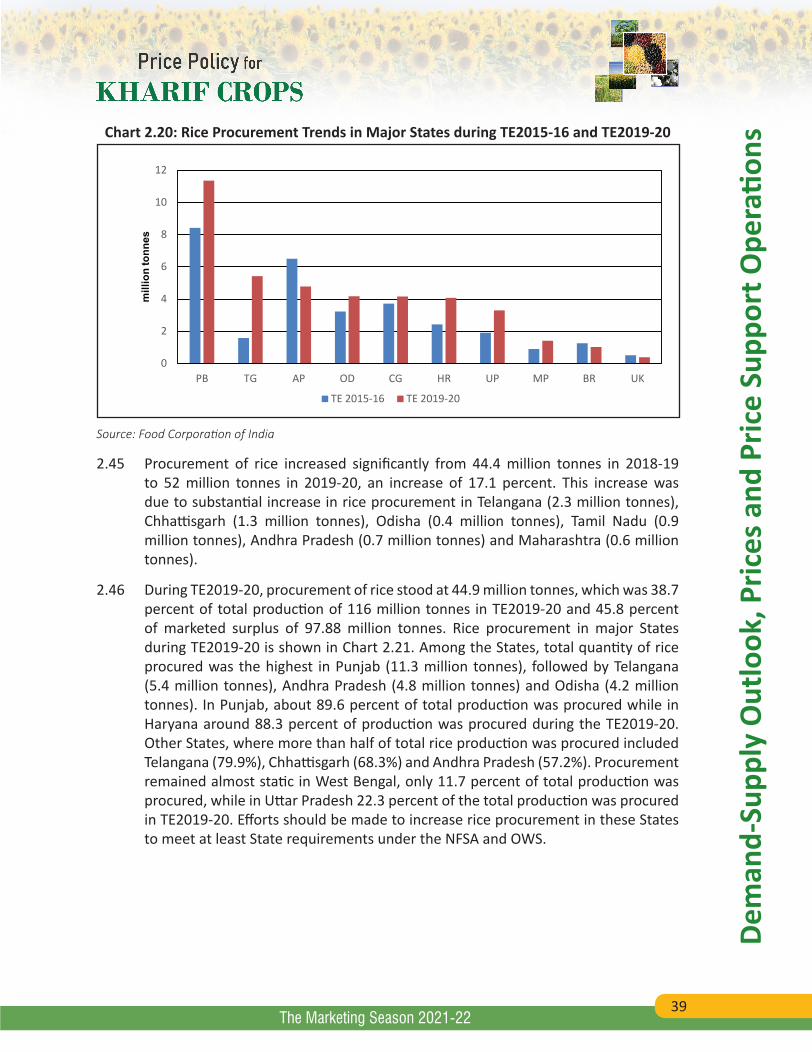
39
Dem
and-
Supp
ly O
utlo
ok, P
rices
and
Pric
e Su
ppor
t Ope
ratio
ns
The Marketing Season 2021-22
Chart 2.20: Rice Procurement Trends in Major States during TE2015-16 and TE2019-20
0
2
4
6
8
10
12
PB TG AP OD CG HR UP MP BR UK
mill
ion
tonn
es
TE 2015-16 TE 2019-20
Source: Food Corporation of India
2.45 Procurement of rice increased significantly from 44.4 million tonnes in 2018-19 to 52 million tonnes in 2019-20, an increase of 17.1 percent. This increase was due to substantial increase in rice procurement in Telangana (2.3 million tonnes), Chhattisgarh (1.3 million tonnes), Odisha (0.4 million tonnes), Tamil Nadu (0.9 million tonnes), Andhra Pradesh (0.7 million tonnes) and Maharashtra (0.6 million tonnes).
2.46 During TE2019-20, procurement of rice stood at 44.9 million tonnes, which was 38.7 percent of total production of 116 million tonnes in TE2019-20 and 45.8 percent of marketed surplus of 97.88 million tonnes. Rice procurement in major States during TE2019-20 is shown in Chart 2.21. Among the States, total quantity of rice procured was the highest in Punjab (11.3 million tonnes), followed by Telangana (5.4 million tonnes), Andhra Pradesh (4.8 million tonnes) and Odisha (4.2 million tonnes). In Punjab, about 89.6 percent of total production was procured while in Haryana around 88.3 percent of production was procured during the TE2019-20. Other States, where more than half of total rice production was procured included Telangana (79.9%), Chhattisgarh (68.3%) and Andhra Pradesh (57.2%). Procurement remained almost static in West Bengal, only 11.7 percent of total production was procured, while in Uttar Pradesh 22.3 percent of the total production was procured in TE2019-20. Efforts should be made to increase rice procurement in these States to meet at least State requirements under the NFSA and OWS.
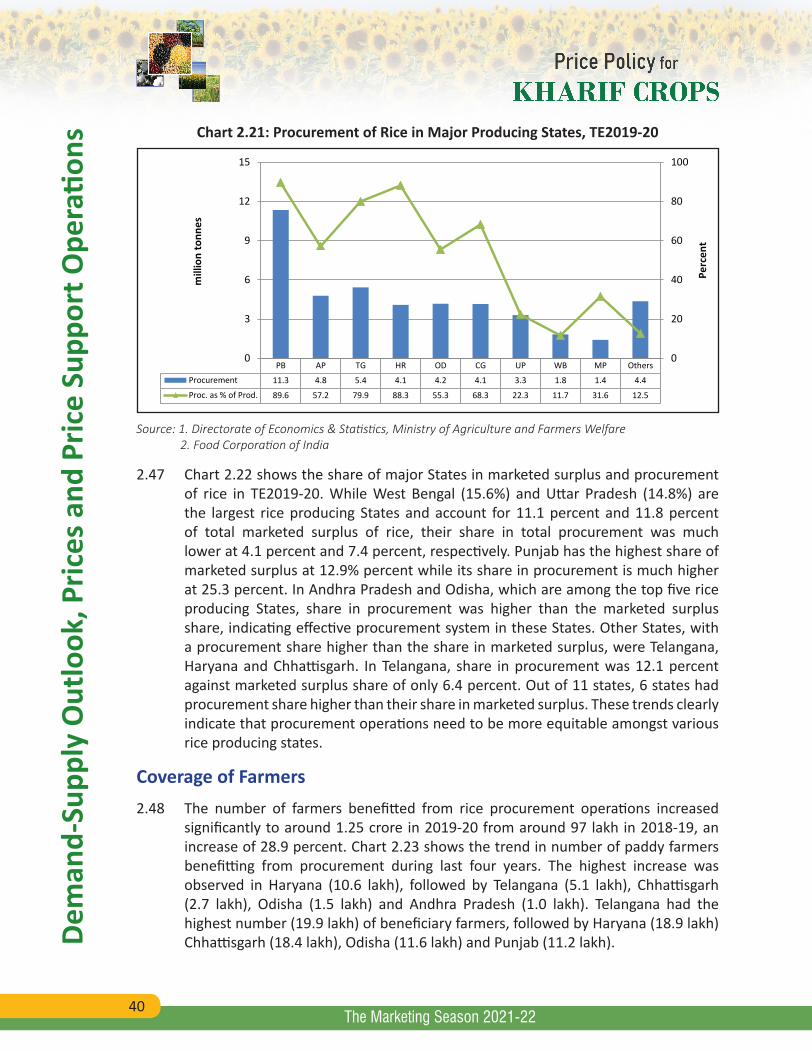
40
Dem
and-
Supp
ly O
utlo
ok, P
rices
and
Pric
e Su
ppor
t Ope
ratio
ns
The Marketing Season 2021-22
Chart 2.21: Procurement of Rice in Major Producing States, TE2019-20
PB AP TG HR OD CG UP WB MP Others
Procurement 11.3 4.8 5.4 4.1 4.2 4.1 3.3 1.8 1.4 4.4
Proc. as % of Prod. 89.6 57.2 79.9 88.3 55.3 68.3 22.3 11.7 31.6 12.5
0
20
40
60
80
100
0
3
6
9
12
15
Perc
ent
mill
ion
tonn
es
Source: 1. Directorate of Economics & Statistics, Ministry of Agriculture and Farmers Welfare 2. Food Corporation of India
2.47 Chart 2.22 shows the share of major States in marketed surplus and procurement of rice in TE2019-20. While West Bengal (15.6%) and Uttar Pradesh (14.8%) are the largest rice producing States and account for 11.1 percent and 11.8 percent of total marketed surplus of rice, their share in total procurement was much lower at 4.1 percent and 7.4 percent, respectively. Punjab has the highest share of marketed surplus at 12.9% percent while its share in procurement is much higher at 25.3 percent. In Andhra Pradesh and Odisha, which are among the top five rice producing States, share in procurement was higher than the marketed surplus share, indicating effective procurement system in these States. Other States, with a procurement share higher than the share in marketed surplus, were Telangana, Haryana and Chhattisgarh. In Telangana, share in procurement was 12.1 percent against marketed surplus share of only 6.4 percent. Out of 11 states, 6 states had procurement share higher than their share in marketed surplus. These trends clearly indicate that procurement operations need to be more equitable amongst various rice producing states.
Coverage of Farmers2.48 The number of farmers benefitted from rice procurement operations increased
significantly to around 1.25 crore in 2019-20 from around 97 lakh in 2018-19, an increase of 28.9 percent. Chart 2.23 shows the trend in number of paddy farmers benefitting from procurement during last four years. The highest increase was observed in Haryana (10.6 lakh), followed by Telangana (5.1 lakh), Chhattisgarh (2.7 lakh), Odisha (1.5 lakh) and Andhra Pradesh (1.0 lakh). Telangana had the highest number (19.9 lakh) of beneficiary farmers, followed by Haryana (18.9 lakh) Chhattisgarh (18.4 lakh), Odisha (11.6 lakh) and Punjab (11.2 lakh).
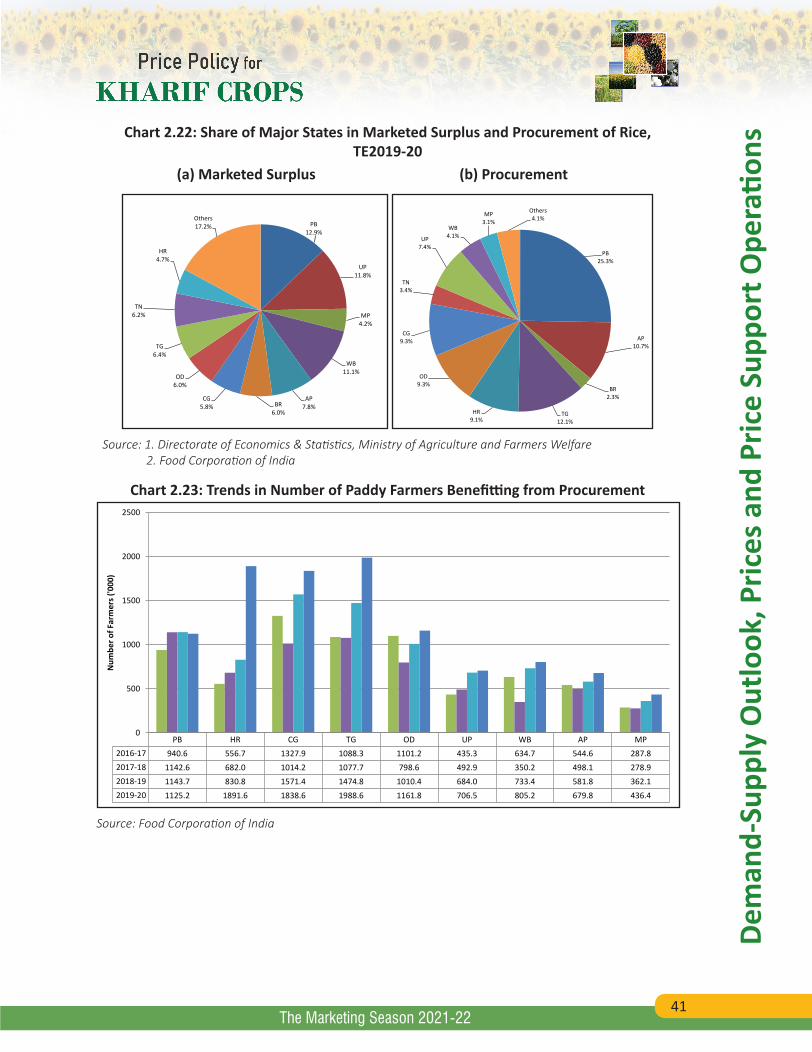
41
Dem
and-
Supp
ly O
utlo
ok, P
rices
and
Pric
e Su
ppor
t Ope
ratio
ns
The Marketing Season 2021-22
Chart 2.22: Share of Major States in Marketed Surplus and Procurement of Rice, TE2019-20
(a) Marketed Surplus (b) Procurement
PB 12.9%
UP 11.8%
MP 4.2%
WB 11.1%
AP 7.8% BR
6.0%
CG 5.8%
OD 6.0%
TG 6.4%
TN 6.2%
HR 4.7%
Others 17.2%
PB 25.3%
AP 10.7%
BR 2.3%
TG 12.1%
HR 9.1%
OD 9.3%
CG 9.3%
TN 3.4%
UP 7.4%
WB 4.1%
MP 3.1%
Others 4.1%
Source: 1. Directorate of Economics & Statistics, Ministry of Agriculture and Farmers Welfare 2. Food Corporation of India
Chart 2.23: Trends in Number of Paddy Farmers Benefitting from Procurement
PB HR CG TG OD UP WB AP MP 2016-17 940.6 556.7 1327.9 1088.3 1101.2 435.3 634.7 544.6 287.8 2017-18 1142.6 682.0 1014.2 1077.7 798.6 492.9 350.2 498.1 278.9 2018-19 1143.7 830.8 1571.4 1474.8 1010.4 684.0 733.4 581.8 362.1 2019-20 1125.2 1891.6 1838.6 1988.6 1161.8 706.5 805.2 679.8 436.4
0
500
1000
1500
2000
2500
Num
ber o
f Far
mer
s ('0
00)
Source: Food Corporation of India
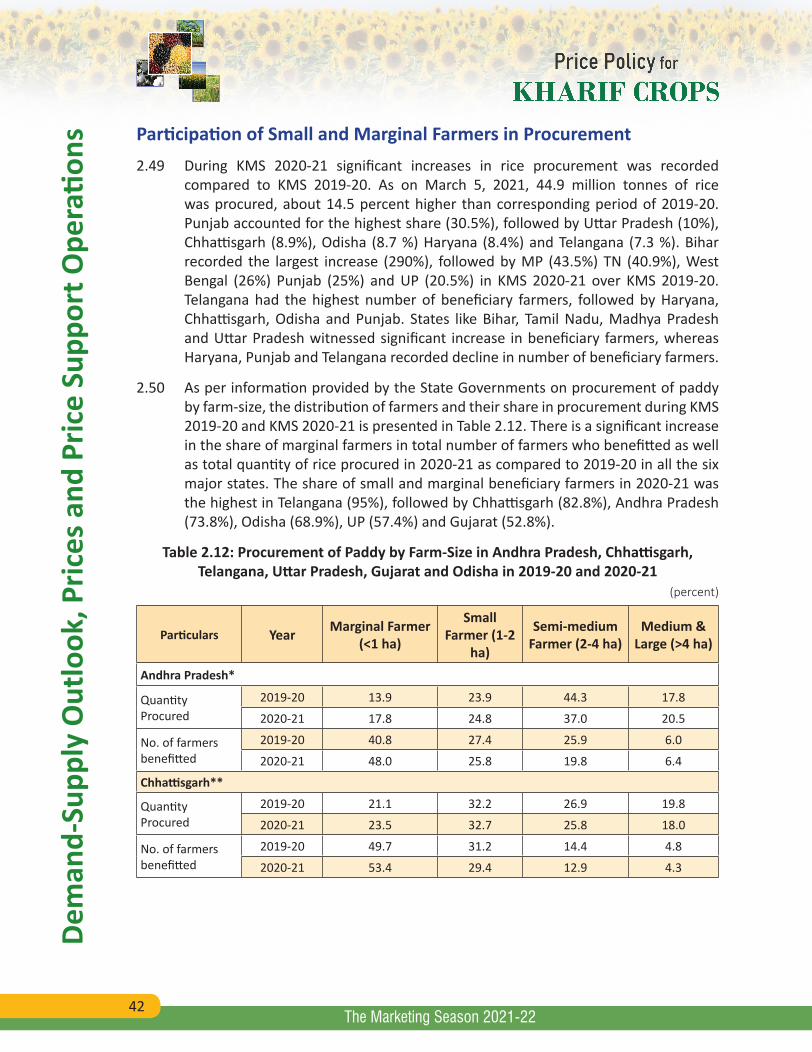
42
Dem
and-
Supp
ly O
utlo
ok, P
rices
and
Pric
e Su
ppor
t Ope
ratio
ns
The Marketing Season 2021-22
Participation of Small and Marginal Farmers in Procurement 2.49 During KMS 2020-21 significant increases in rice procurement was recorded
compared to KMS 2019-20. As on March 5, 2021, 44.9 million tonnes of rice was procured, about 14.5 percent higher than corresponding period of 2019-20. Punjab accounted for the highest share (30.5%), followed by Uttar Pradesh (10%), Chhattisgarh (8.9%), Odisha (8.7 %) Haryana (8.4%) and Telangana (7.3 %). Bihar recorded the largest increase (290%), followed by MP (43.5%) TN (40.9%), West Bengal (26%) Punjab (25%) and UP (20.5%) in KMS 2020-21 over KMS 2019-20. Telangana had the highest number of beneficiary farmers, followed by Haryana, Chhattisgarh, Odisha and Punjab. States like Bihar, Tamil Nadu, Madhya Pradesh and Uttar Pradesh witnessed significant increase in beneficiary farmers, whereas Haryana, Punjab and Telangana recorded decline in number of beneficiary farmers.
2.50 As per information provided by the State Governments on procurement of paddy by farm-size, the distribution of farmers and their share in procurement during KMS 2019-20 and KMS 2020-21 is presented in Table 2.12. There is a significant increase in the share of marginal farmers in total number of farmers who benefitted as well as total quantity of rice procured in 2020-21 as compared to 2019-20 in all the six major states. The share of small and marginal beneficiary farmers in 2020-21 was the highest in Telangana (95%), followed by Chhattisgarh (82.8%), Andhra Pradesh (73.8%), Odisha (68.9%), UP (57.4%) and Gujarat (52.8%).
Table 2.12: Procurement of Paddy by Farm-Size in Andhra Pradesh, Chhattisgarh, Telangana, Uttar Pradesh, Gujarat and Odisha in 2019-20 and 2020-21
(percent)
Particulars Year Marginal Farmer (<1 ha)
Small Farmer (1-2
ha)
Semi-medium Farmer (2-4 ha)
Medium & Large (>4 ha)
Andhra Pradesh*
Quantity Procured
2019-20 13.9 23.9 44.3 17.8
2020-21 17.8 24.8 37.0 20.5
No. of farmers benefitted
2019-20 40.8 27.4 25.9 6.0
2020-21 48.0 25.8 19.8 6.4
Chhattisgarh**
Quantity Procured
2019-20 21.1 32.2 26.9 19.8
2020-21 23.5 32.7 25.8 18.0
No. of farmers benefitted
2019-20 49.7 31.2 14.4 4.8
2020-21 53.4 29.4 12.9 4.3
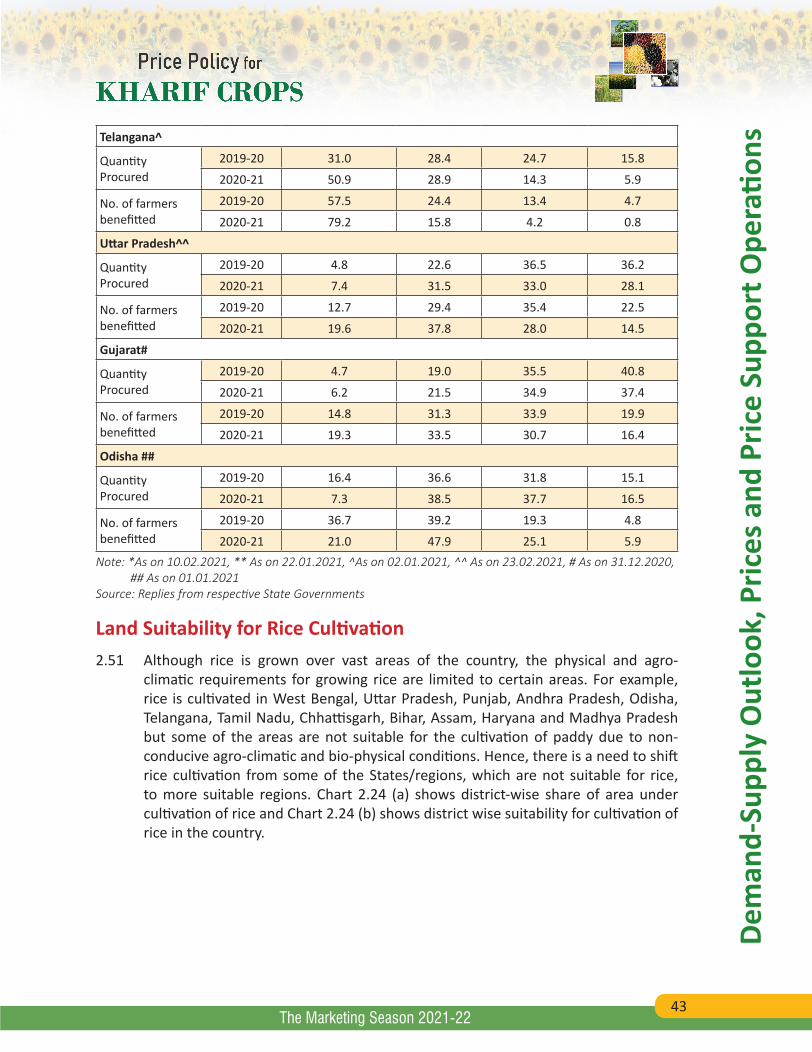
43
Dem
and-
Supp
ly O
utlo
ok, P
rices
and
Pric
e Su
ppor
t Ope
ratio
ns
The Marketing Season 2021-22
Telangana^
Quantity Procured
2019-20 31.0 28.4 24.7 15.8
2020-21 50.9 28.9 14.3 5.9
No. of farmers benefitted
2019-20 57.5 24.4 13.4 4.7
2020-21 79.2 15.8 4.2 0.8
Uttar Pradesh^^
Quantity Procured
2019-20 4.8 22.6 36.5 36.2
2020-21 7.4 31.5 33.0 28.1
No. of farmers benefitted
2019-20 12.7 29.4 35.4 22.5
2020-21 19.6 37.8 28.0 14.5
Gujarat#
Quantity Procured
2019-20 4.7 19.0 35.5 40.8
2020-21 6.2 21.5 34.9 37.4
No. of farmers benefitted
2019-20 14.8 31.3 33.9 19.9
2020-21 19.3 33.5 30.7 16.4
Odisha ##
Quantity Procured
2019-20 16.4 36.6 31.8 15.1
2020-21 7.3 38.5 37.7 16.5
No. of farmers benefitted
2019-20 36.7 39.2 19.3 4.8
2020-21 21.0 47.9 25.1 5.9Note: *As on 10.02.2021, ** As on 22.01.2021, ^As on 02.01.2021, ^^ As on 23.02.2021, # As on 31.12.2020, ## As on 01.01.2021Source: Replies from respective State Governments
Land Suitability for Rice Cultivation2.51 Although rice is grown over vast areas of the country, the physical and agro-
climatic requirements for growing rice are limited to certain areas. For example, rice is cultivated in West Bengal, Uttar Pradesh, Punjab, Andhra Pradesh, Odisha, Telangana, Tamil Nadu, Chhattisgarh, Bihar, Assam, Haryana and Madhya Pradesh but some of the areas are not suitable for the cultivation of paddy due to non-conducive agro-climatic and bio-physical conditions. Hence, there is a need to shift rice cultivation from some of the States/regions, which are not suitable for rice, to more suitable regions. Chart 2.24 (a) shows district-wise share of area under cultivation of rice and Chart 2.24 (b) shows district wise suitability for cultivation of rice in the country.
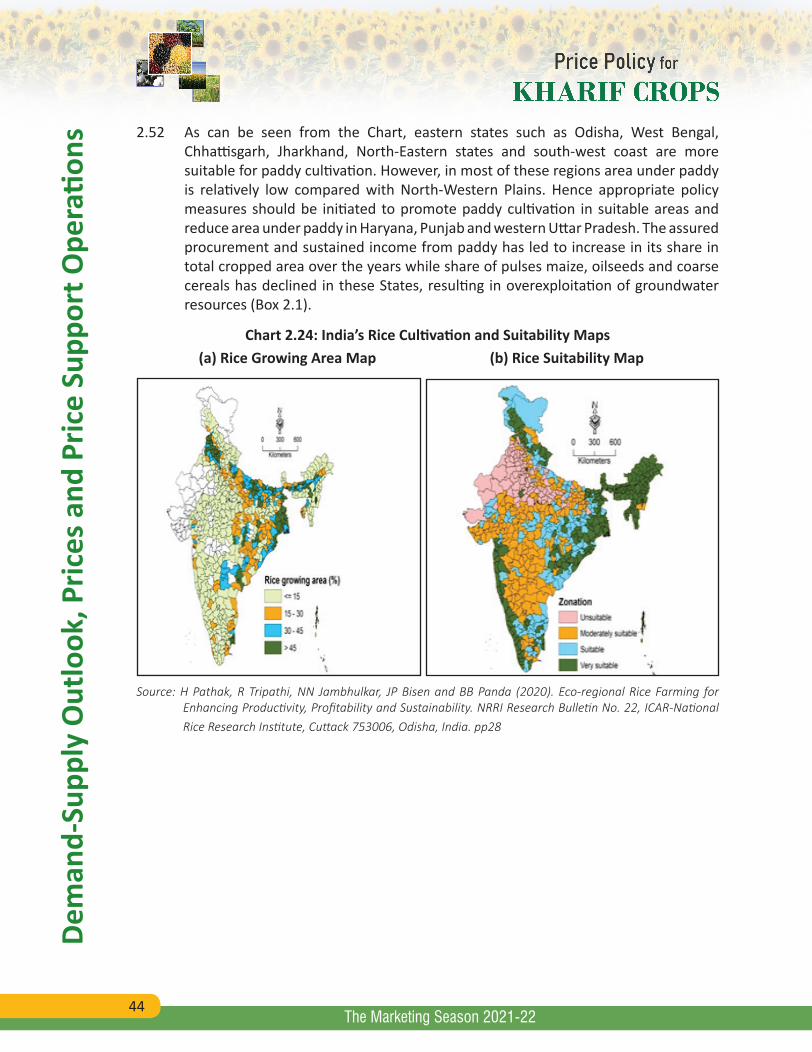
44
Dem
and-
Supp
ly O
utlo
ok, P
rices
and
Pric
e Su
ppor
t Ope
ratio
ns
The Marketing Season 2021-22
2.52 As can be seen from the Chart, eastern states such as Odisha, West Bengal, Chhattisgarh, Jharkhand, North-Eastern states and south-west coast are more suitable for paddy cultivation. However, in most of these regions area under paddy is relatively low compared with North-Western Plains. Hence appropriate policy measures should be initiated to promote paddy cultivation in suitable areas and reduce area under paddy in Haryana, Punjab and western Uttar Pradesh. The assured procurement and sustained income from paddy has led to increase in its share in total cropped area over the years while share of pulses maize, oilseeds and coarse cereals has declined in these States, resulting in overexploitation of groundwater resources (Box 2.1).
Chart 2.24: India’s Rice Cultivation and Suitability Maps (a) Rice Growing Area Map (b) Rice Suitability Map
Source: H Pathak, R Tripathi, NN Jambhulkar, JP Bisen and BB Panda (2020). Eco-regional Rice Farming for
Enhancing Productivity, Profitability and Sustainability. NRRI Research Bulletin No. 22, ICAR-National Rice Research Institute, Cuttack 753006, Odisha, India. pp28
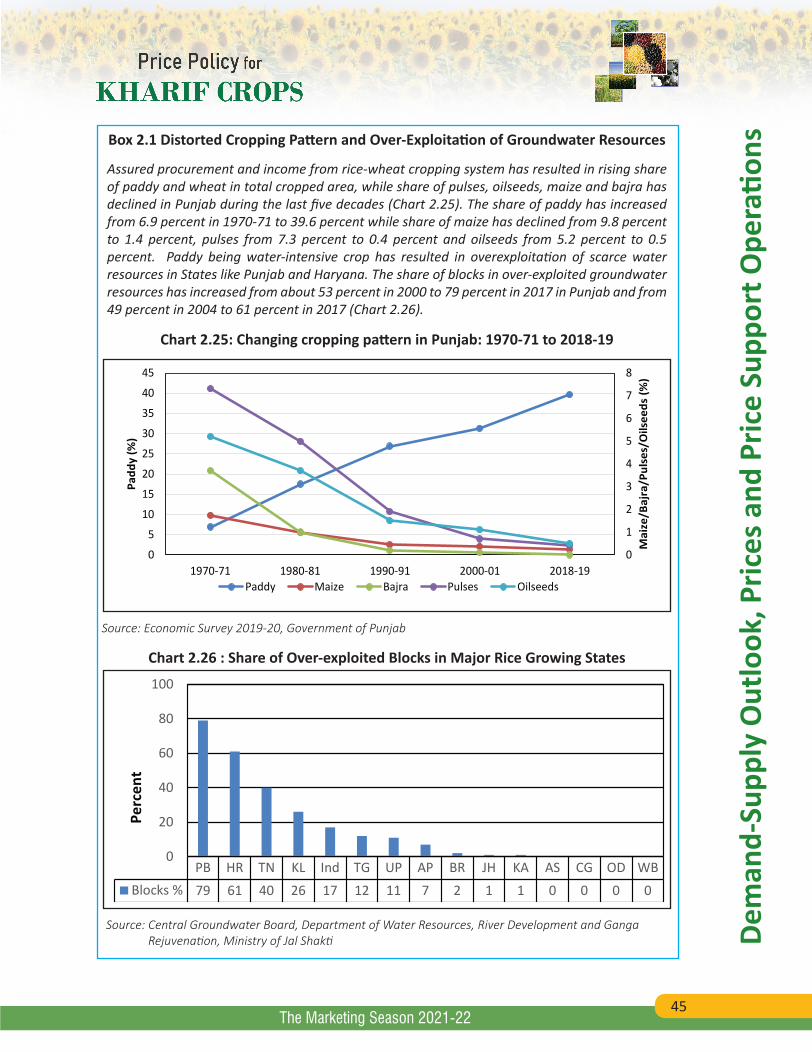
45
Dem
and-
Supp
ly O
utlo
ok, P
rices
and
Pric
e Su
ppor
t Ope
ratio
ns
The Marketing Season 2021-22
Box 2.1 Distorted Cropping Pattern and Over-Exploitation of Groundwater Resources
Assured procurement and income from rice-wheat cropping system has resulted in rising share of paddy and wheat in total cropped area, while share of pulses, oilseeds, maize and bajra has declined in Punjab during the last five decades (Chart 2.25). The share of paddy has increased from 6.9 percent in 1970-71 to 39.6 percent while share of maize has declined from 9.8 percent to 1.4 percent, pulses from 7.3 percent to 0.4 percent and oilseeds from 5.2 percent to 0.5 percent. Paddy being water-intensive crop has resulted in overexploitation of scarce water resources in States like Punjab and Haryana. The share of blocks in over-exploited groundwater resources has increased from about 53 percent in 2000 to 79 percent in 2017 in Punjab and from 49 percent in 2004 to 61 percent in 2017 (Chart 2.26).
Chart 2.25: Changing cropping pattern in Punjab: 1970-71 to 2018-19
0
1
2
3
4
5
6
7
8
0
5
10
15
20
25
30
35
40
45
1970-71 1980-81 1990-91 2000-01 2018-19
Mai
ze/B
ajra
/Pul
ses/
Oils
eeds
(%)
Padd
y (%
)
Paddy Maize Bajra Pulses Oilseeds
Source: Economic Survey 2019-20, Government of Punjab
Chart 2.26 : Share of Over-exploited Blocks in Major Rice Growing States
PB HR TN KL Ind TG UP AP BR JH KA AS CG OD WBBlocks % 79 61 40 26 17 12 11 7 2 1 1 0 0 0 0
0
20
40
60
80
100
Perc
ent
Source: Central Groundwater Board, Department of Water Resources, River Development and Ganga Rejuvenation, Ministry of Jal Shakti
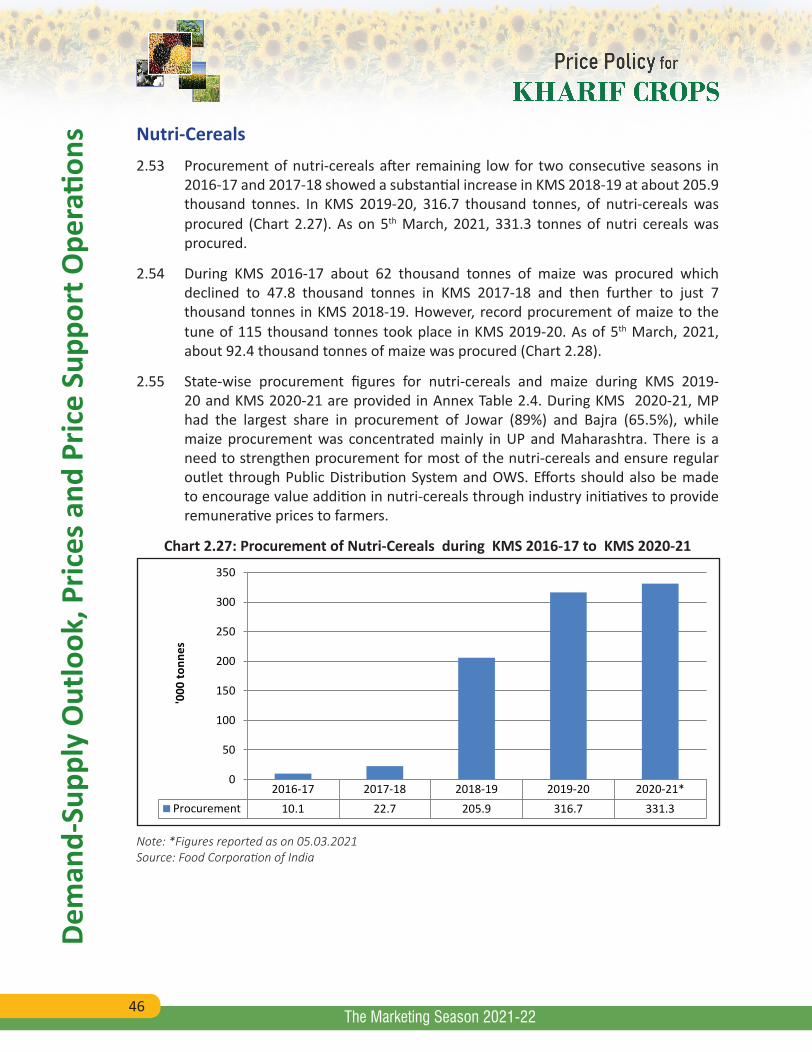
46
Dem
and-
Supp
ly O
utlo
ok, P
rices
and
Pric
e Su
ppor
t Ope
ratio
ns
The Marketing Season 2021-22
Nutri-Cereals2.53 Procurement of nutri-cereals after remaining low for two consecutive seasons in
2016-17 and 2017-18 showed a substantial increase in KMS 2018-19 at about 205.9 thousand tonnes. In KMS 2019-20, 316.7 thousand tonnes, of nutri-cereals was procured (Chart 2.27). As on 5th March, 2021, 331.3 tonnes of nutri cereals was procured.
2.54 During KMS 2016-17 about 62 thousand tonnes of maize was procured which declined to 47.8 thousand tonnes in KMS 2017-18 and then further to just 7 thousand tonnes in KMS 2018-19. However, record procurement of maize to the tune of 115 thousand tonnes took place in KMS 2019-20. As of 5th March, 2021, about 92.4 thousand tonnes of maize was procured (Chart 2.28).
2.55 State-wise procurement figures for nutri-cereals and maize during KMS 2019-20 and KMS 2020-21 are provided in Annex Table 2.4. During KMS 2020-21, MP had the largest share in procurement of Jowar (89%) and Bajra (65.5%), while maize procurement was concentrated mainly in UP and Maharashtra. There is a need to strengthen procurement for most of the nutri-cereals and ensure regular outlet through Public Distribution System and OWS. Efforts should also be made to encourage value addition in nutri-cereals through industry initiatives to provide remunerative prices to farmers.
Chart 2.27: Procurement of Nutri-Cereals during KMS 2016-17 to KMS 2020-21
2016-17 2017-18 2018-19 2019-20 2020-21*Procurement 10.1 22.7 205.9 316.7 331.3
0
50
100
150
200
250
300
350
'00
0 to
nnes
Note: *Figures reported as on 05.03.2021Source: Food Corporation of India
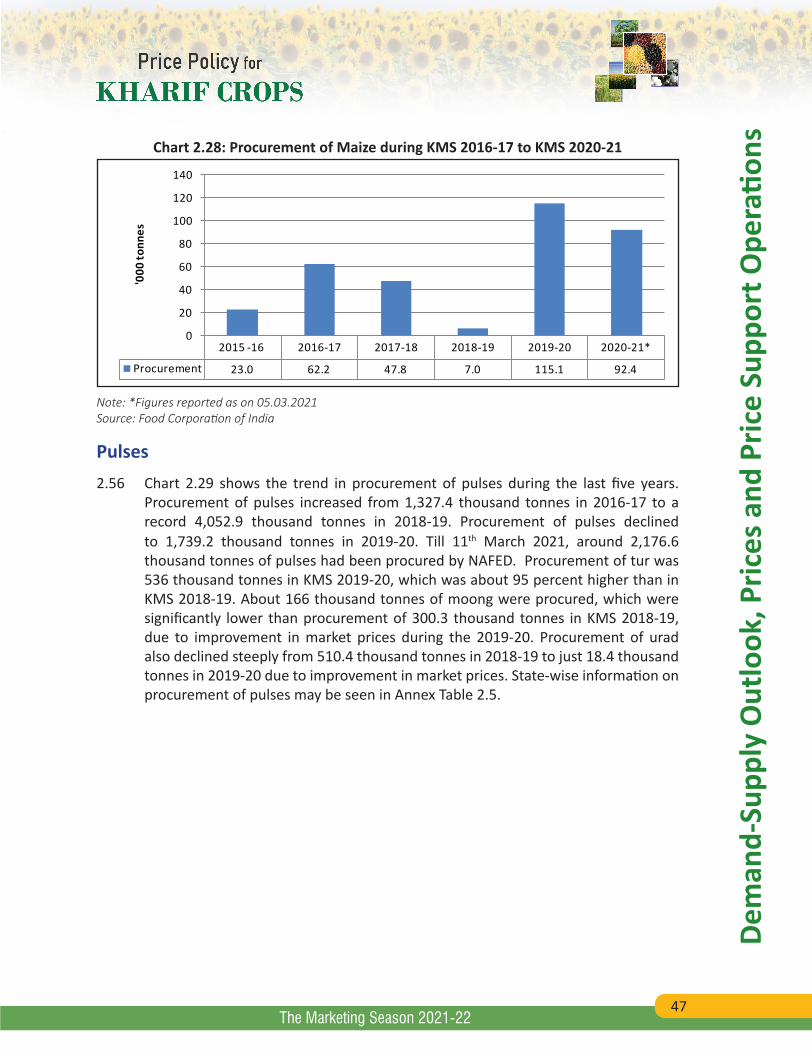
47
Dem
and-
Supp
ly O
utlo
ok, P
rices
and
Pric
e Su
ppor
t Ope
ratio
ns
The Marketing Season 2021-22
Chart 2.28: Procurement of Maize during KMS 2016-17 to KMS 2020-21
2015 -16 2016-17 2017-18 2018-19 2019-20 2020-21*
Procurement 23.0 62.2 47.8 7.0 115.1 92.4
0
20
40
60
80
100
120
140
'000
tonn
es
Note: *Figures reported as on 05.03.2021Source: Food Corporation of India
Pulses2.56 Chart 2.29 shows the trend in procurement of pulses during the last five years.
Procurement of pulses increased from 1,327.4 thousand tonnes in 2016-17 to a record 4,052.9 thousand tonnes in 2018-19. Procurement of pulses declined to 1,739.2 thousand tonnes in 2019-20. Till 11th March 2021, around 2,176.6 thousand tonnes of pulses had been procured by NAFED. Procurement of tur was 536 thousand tonnes in KMS 2019-20, which was about 95 percent higher than in KMS 2018-19. About 166 thousand tonnes of moong were procured, which were significantly lower than procurement of 300.3 thousand tonnes in KMS 2018-19, due to improvement in market prices during the 2019-20. Procurement of urad also declined steeply from 510.4 thousand tonnes in 2018-19 to just 18.4 thousand tonnes in 2019-20 due to improvement in market prices. State-wise information on procurement of pulses may be seen in Annex Table 2.5.
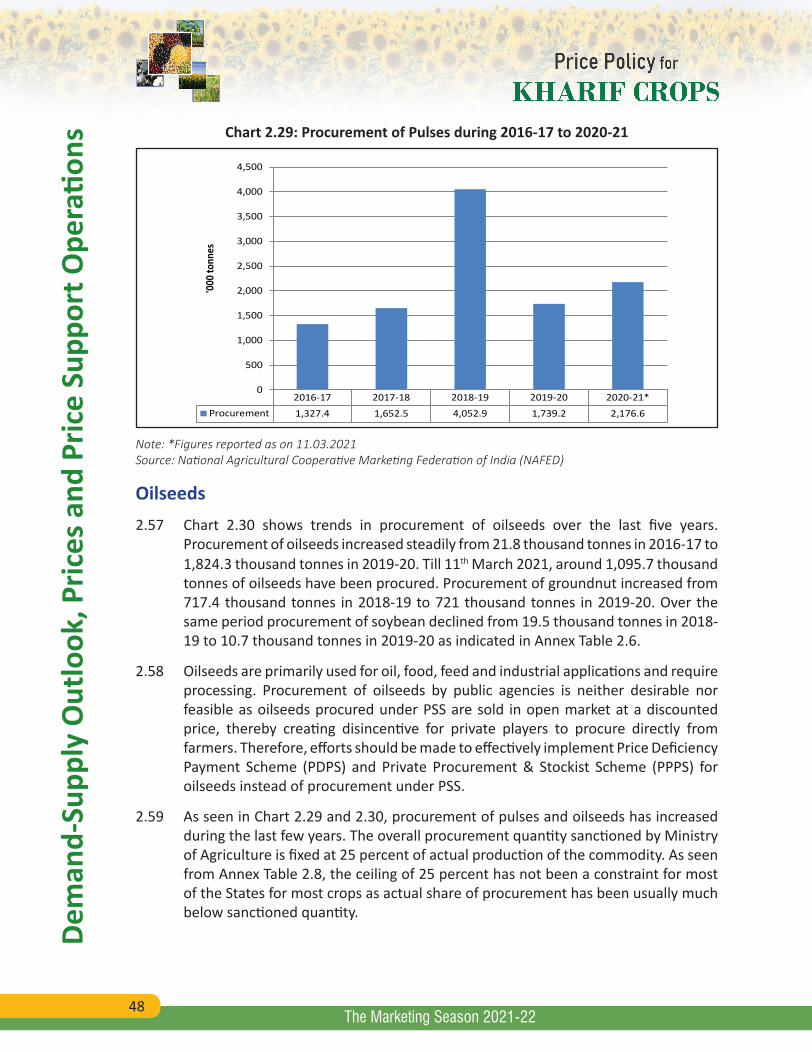
48
Dem
and-
Supp
ly O
utlo
ok, P
rices
and
Pric
e Su
ppor
t Ope
ratio
ns
The Marketing Season 2021-22
Chart 2.29: Procurement of Pulses during 2016-17 to 2020-21
2016-17 2017-18 2018-19 2019-20 2020-21*Procurement 1,327.4 1,652.5 4,052.9 1,739.2 2,176.6
0
500
1,000
1,500
2,000
2,500
3,000
3,500
4,000
4,500
'000
tonn
es
Note: *Figures reported as on 11.03.2021Source: National Agricultural Cooperative Marketing Federation of India (NAFED)
Oilseeds2.57 Chart 2.30 shows trends in procurement of oilseeds over the last five years.
Procurement of oilseeds increased steadily from 21.8 thousand tonnes in 2016-17 to 1,824.3 thousand tonnes in 2019-20. Till 11th March 2021, around 1,095.7 thousand tonnes of oilseeds have been procured. Procurement of groundnut increased from 717.4 thousand tonnes in 2018-19 to 721 thousand tonnes in 2019-20. Over the same period procurement of soybean declined from 19.5 thousand tonnes in 2018-19 to 10.7 thousand tonnes in 2019-20 as indicated in Annex Table 2.6.
2.58 Oilseeds are primarily used for oil, food, feed and industrial applications and require processing. Procurement of oilseeds by public agencies is neither desirable nor feasible as oilseeds procured under PSS are sold in open market at a discounted price, thereby creating disincentive for private players to procure directly from farmers. Therefore, efforts should be made to effectively implement Price Deficiency Payment Scheme (PDPS) and Private Procurement & Stockist Scheme (PPPS) for oilseeds instead of procurement under PSS.
2.59 As seen in Chart 2.29 and 2.30, procurement of pulses and oilseeds has increased during the last few years. The overall procurement quantity sanctioned by Ministry of Agriculture is fixed at 25 percent of actual production of the commodity. As seen from Annex Table 2.8, the ceiling of 25 percent has not been a constraint for most of the States for most crops as actual share of procurement has been usually much below sanctioned quantity.
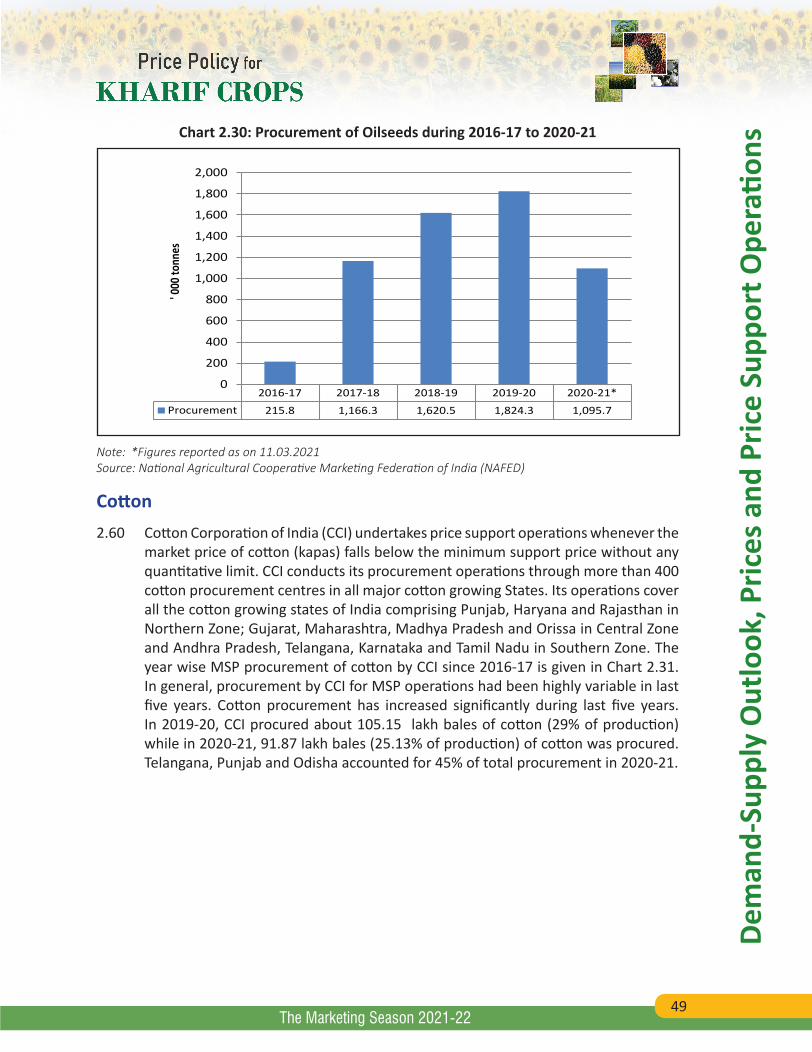
49
Dem
and-
Supp
ly O
utlo
ok, P
rices
and
Pric
e Su
ppor
t Ope
ratio
ns
The Marketing Season 2021-22
Chart 2.30: Procurement of Oilseeds during 2016-17 to 2020-21
2016-17 2017-18 2018-19 2019-20 2020-21*Procurement 215.8 1,166.3 1,620.5 1,824.3 1,095.7
0
200
400
600
800
1,000
1,200
1,400
1,600
1,800
2,000' 0
00 to
nnes
Note: *Figures reported as on 11.03.2021Source: National Agricultural Cooperative Marketing Federation of India (NAFED)
Cotton2.60 Cotton Corporation of India (CCI) undertakes price support operations whenever the
market price of cotton (kapas) falls below the minimum support price without any quantitative limit. CCI conducts its procurement operations through more than 400 cotton procurement centres in all major cotton growing States. Its operations cover all the cotton growing states of India comprising Punjab, Haryana and Rajasthan in Northern Zone; Gujarat, Maharashtra, Madhya Pradesh and Orissa in Central Zone and Andhra Pradesh, Telangana, Karnataka and Tamil Nadu in Southern Zone. The year wise MSP procurement of cotton by CCI since 2016-17 is given in Chart 2.31. In general, procurement by CCI for MSP operations had been highly variable in last five years. Cotton procurement has increased significantly during last five years. In 2019-20, CCI procured about 105.15 lakh bales of cotton (29% of production) while in 2020-21, 91.87 lakh bales (25.13% of production) of cotton was procured. Telangana, Punjab and Odisha accounted for 45% of total procurement in 2020-21.
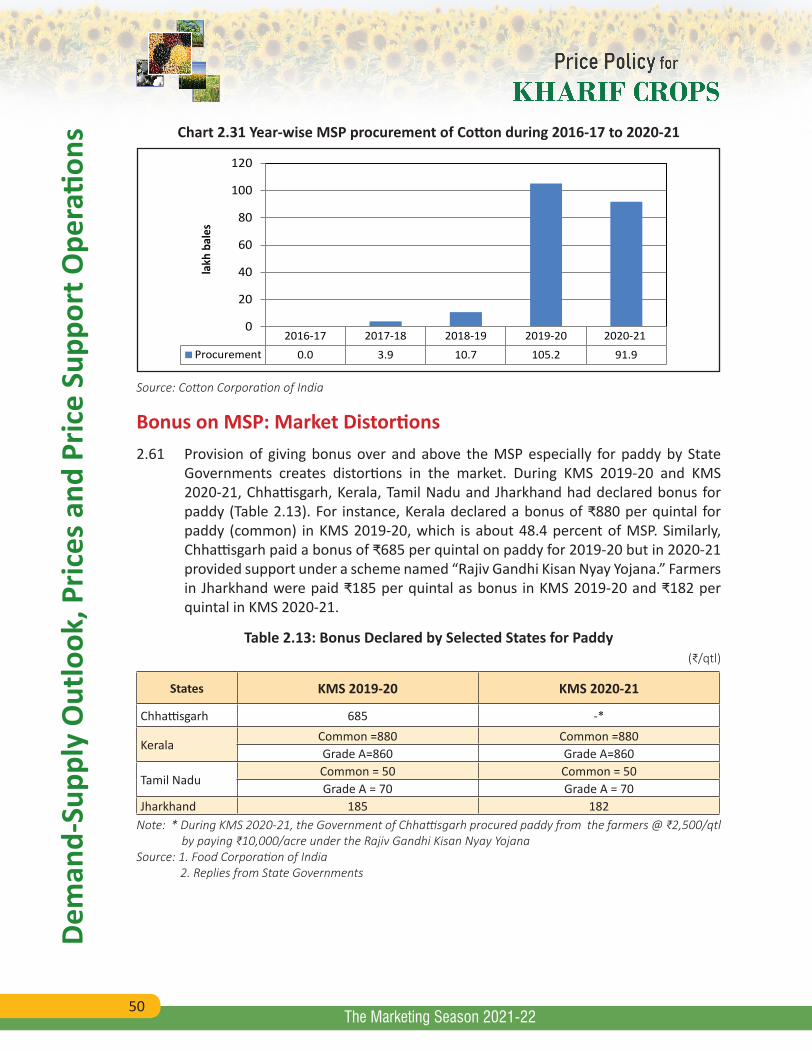
50
Dem
and-
Supp
ly O
utlo
ok, P
rices
and
Pric
e Su
ppor
t Ope
ratio
ns
The Marketing Season 2021-22
Chart 2.31 Year-wise MSP procurement of Cotton during 2016-17 to 2020-21
2016-17 2017-18 2018-19 2019-20 2020-21Procurement 0.0 3.9 10.7 105.2 91.9
0
20
40
60
80
100
120
lakh
bal
es
Source: Cotton Corporation of India
Bonus on MSP: Market Distortions2.61 Provision of giving bonus over and above the MSP especially for paddy by State
Governments creates distortions in the market. During KMS 2019-20 and KMS 2020-21, Chhattisgarh, Kerala, Tamil Nadu and Jharkhand had declared bonus for paddy (Table 2.13). For instance, Kerala declared a bonus of ₹880 per quintal for paddy (common) in KMS 2019-20, which is about 48.4 percent of MSP. Similarly, Chhattisgarh paid a bonus of ₹685 per quintal on paddy for 2019-20 but in 2020-21 provided support under a scheme named “Rajiv Gandhi Kisan Nyay Yojana.” Farmers in Jharkhand were paid ₹185 per quintal as bonus in KMS 2019-20 and ₹182 per quintal in KMS 2020-21.
Table 2.13: Bonus Declared by Selected States for Paddy(₹/qtl)
States KMS 2019-20 KMS 2020-21
Chhattisgarh 685 -*
Kerala Common =880 Common =880Grade A=860 Grade A=860
Tamil Nadu Common = 50 Common = 50Grade A = 70 Grade A = 70
Jharkhand 185 182Note: * During KMS 2020-21, the Government of Chhattisgarh procured paddy from the farmers @ ₹2,500/qtl
by paying ₹10,000/acre under the Rajiv Gandhi Kisan Nyay YojanaSource: 1. Food Corporation of India 2. Replies from State Governments
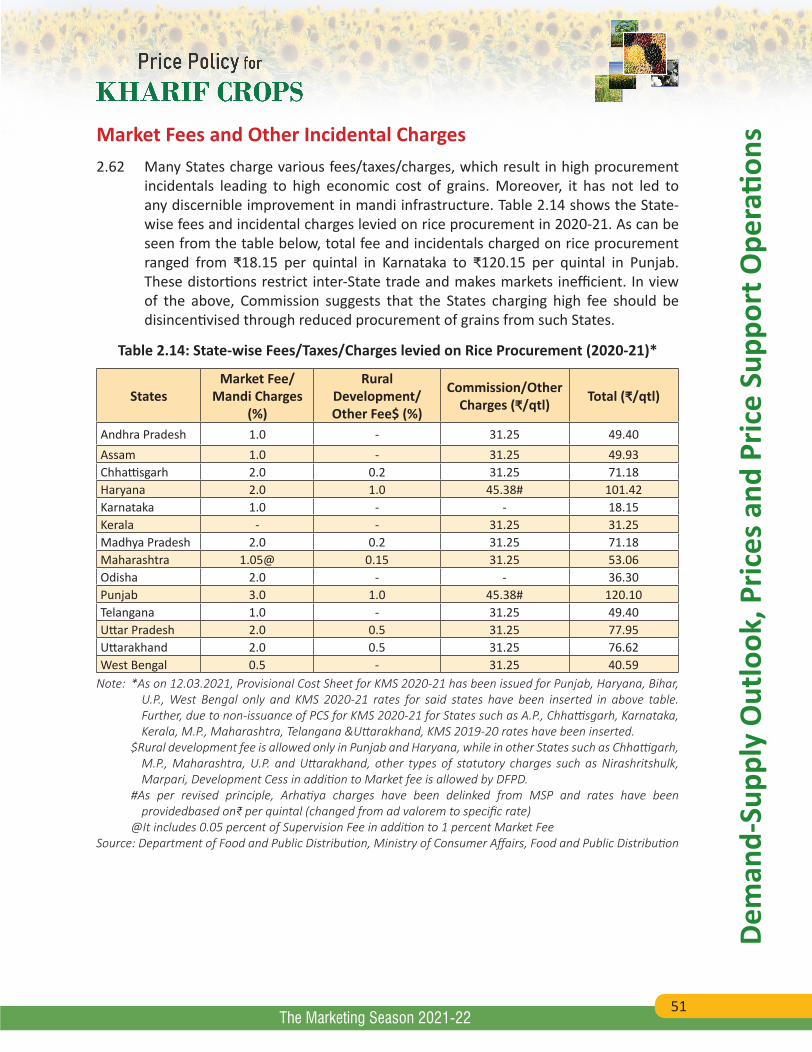
51
Dem
and-
Supp
ly O
utlo
ok, P
rices
and
Pric
e Su
ppor
t Ope
ratio
ns
The Marketing Season 2021-22
Market Fees and Other Incidental Charges2.62 Many States charge various fees/taxes/charges, which result in high procurement
incidentals leading to high economic cost of grains. Moreover, it has not led to any discernible improvement in mandi infrastructure. Table 2.14 shows the State-wise fees and incidental charges levied on rice procurement in 2020-21. As can be seen from the table below, total fee and incidentals charged on rice procurement ranged from ₹18.15 per quintal in Karnataka to ₹120.15 per quintal in Punjab. These distortions restrict inter-State trade and makes markets inefficient. In view of the above, Commission suggests that the States charging high fee should be disincentivised through reduced procurement of grains from such States.
Table 2.14: State-wise Fees/Taxes/Charges levied on Rice Procurement (2020-21)*
StatesMarket Fee/
Mandi Charges (%)
Rural Development/ Other Fee$ (%)
Commission/Other Charges (₹/qtl) Total (₹/qtl)
Andhra Pradesh 1.0 - 31.25 49.40Assam 1.0 - 31.25 49.93Chhattisgarh 2.0 0.2 31.25 71.18Haryana 2.0 1.0 45.38# 101.42Karnataka 1.0 - - 18.15Kerala - - 31.25 31.25Madhya Pradesh 2.0 0.2 31.25 71.18Maharashtra 1.05@ 0.15 31.25 53.06Odisha 2.0 - - 36.30Punjab 3.0 1.0 45.38# 120.10Telangana 1.0 - 31.25 49.40Uttar Pradesh 2.0 0.5 31.25 77.95Uttarakhand 2.0 0.5 31.25 76.62West Bengal 0.5 - 31.25 40.59
Note: *As on 12.03.2021, Provisional Cost Sheet for KMS 2020-21 has been issued for Punjab, Haryana, Bihar, U.P., West Bengal only and KMS 2020-21 rates for said states have been inserted in above table. Further, due to non-issuance of PCS for KMS 2020-21 for States such as A.P., Chhattisgarh, Karnataka, Kerala, M.P., Maharashtra, Telangana &Uttarakhand, KMS 2019-20 rates have been inserted.
$Rural development fee is allowed only in Punjab and Haryana, while in other States such as Chhattigarh, M.P., Maharashtra, U.P. and Uttarakhand, other types of statutory charges such as Nirashritshulk, Marpari, Development Cess in addition to Market fee is allowed by DFPD.
#As per revised principle, Arhatiya charges have been delinked from MSP and rates have been providedbased on₹ per quintal (changed from ad valorem to specific rate)
@It includes 0.05 percent of Supervision Fee in addition to 1 percent Market FeeSource: Department of Food and Public Distribution, Ministry of Consumer Affairs, Food and Public Distribution
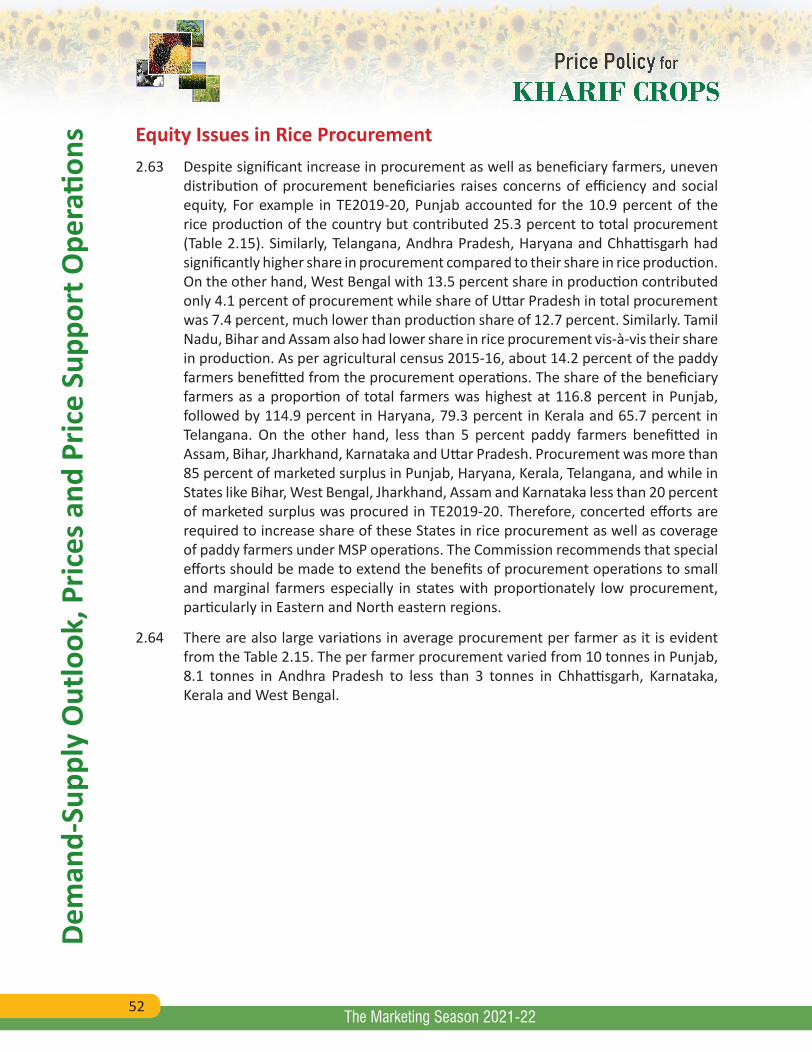
52
Dem
and-
Supp
ly O
utlo
ok, P
rices
and
Pric
e Su
ppor
t Ope
ratio
ns
The Marketing Season 2021-22
Equity Issues in Rice Procurement 2.63 Despite significant increase in procurement as well as beneficiary farmers, uneven
distribution of procurement beneficiaries raises concerns of efficiency and social equity, For example in TE2019-20, Punjab accounted for the 10.9 percent of the rice production of the country but contributed 25.3 percent to total procurement (Table 2.15). Similarly, Telangana, Andhra Pradesh, Haryana and Chhattisgarh had significantly higher share in procurement compared to their share in rice production. On the other hand, West Bengal with 13.5 percent share in production contributed only 4.1 percent of procurement while share of Uttar Pradesh in total procurement was 7.4 percent, much lower than production share of 12.7 percent. Similarly. Tamil Nadu, Bihar and Assam also had lower share in rice procurement vis-à-vis their share in production. As per agricultural census 2015-16, about 14.2 percent of the paddy farmers benefitted from the procurement operations. The share of the beneficiary farmers as a proportion of total farmers was highest at 116.8 percent in Punjab, followed by 114.9 percent in Haryana, 79.3 percent in Kerala and 65.7 percent in Telangana. On the other hand, less than 5 percent paddy farmers benefitted in Assam, Bihar, Jharkhand, Karnataka and Uttar Pradesh. Procurement was more than 85 percent of marketed surplus in Punjab, Haryana, Kerala, Telangana, and while in States like Bihar, West Bengal, Jharkhand, Assam and Karnataka less than 20 percent of marketed surplus was procured in TE2019-20. Therefore, concerted efforts are required to increase share of these States in rice procurement as well as coverage of paddy farmers under MSP operations. The Commission recommends that special efforts should be made to extend the benefits of procurement operations to small and marginal farmers especially in states with proportionately low procurement, particularly in Eastern and North eastern regions.
2.64 There are also large variations in average procurement per farmer as it is evident from the Table 2.15. The per farmer procurement varied from 10 tonnes in Punjab, 8.1 tonnes in Andhra Pradesh to less than 3 tonnes in Chhattisgarh, Karnataka, Kerala and West Bengal.
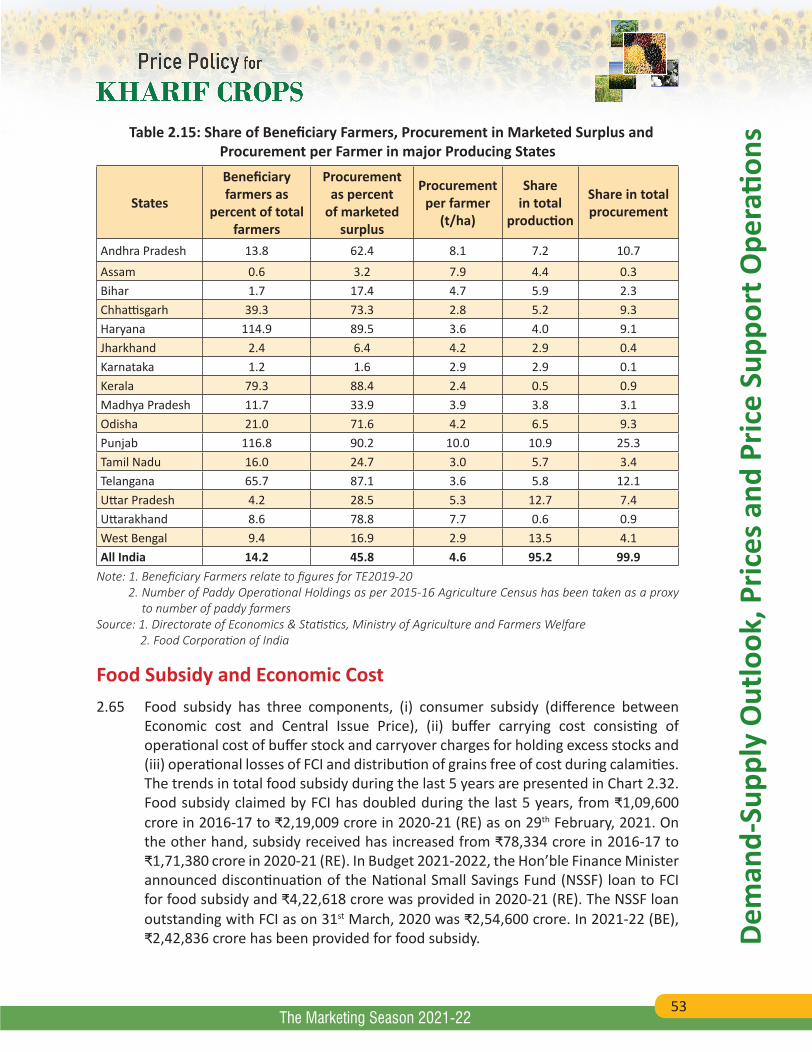
53
Dem
and-
Supp
ly O
utlo
ok, P
rices
and
Pric
e Su
ppor
t Ope
ratio
ns
The Marketing Season 2021-22
Table 2.15: Share of Beneficiary Farmers, Procurement in Marketed Surplus and Procurement per Farmer in major Producing States
States
Beneficiary farmers as
percent of total farmers
Procurement as percent
of marketed surplus
Procurement per farmer
(t/ha)
Share in total
production
Share in total procurement
Andhra Pradesh 13.8 62.4 8.1 7.2 10.7
Assam 0.6 3.2 7.9 4.4 0.3Bihar 1.7 17.4 4.7 5.9 2.3Chhattisgarh 39.3 73.3 2.8 5.2 9.3Haryana 114.9 89.5 3.6 4.0 9.1Jharkhand 2.4 6.4 4.2 2.9 0.4Karnataka 1.2 1.6 2.9 2.9 0.1Kerala 79.3 88.4 2.4 0.5 0.9Madhya Pradesh 11.7 33.9 3.9 3.8 3.1Odisha 21.0 71.6 4.2 6.5 9.3Punjab 116.8 90.2 10.0 10.9 25.3Tamil Nadu 16.0 24.7 3.0 5.7 3.4Telangana 65.7 87.1 3.6 5.8 12.1Uttar Pradesh 4.2 28.5 5.3 12.7 7.4Uttarakhand 8.6 78.8 7.7 0.6 0.9West Bengal 9.4 16.9 2.9 13.5 4.1All India 14.2 45.8 4.6 95.2 99.9
Note: 1. Beneficiary Farmers relate to figures for TE2019-20 2. Number of Paddy Operational Holdings as per 2015-16 Agriculture Census has been taken as a proxy
to number of paddy farmers Source: 1. Directorate of Economics & Statistics, Ministry of Agriculture and Farmers Welfare 2. Food Corporation of India
Food Subsidy and Economic Cost2.65 Food subsidy has three components, (i) consumer subsidy (difference between
Economic cost and Central Issue Price), (ii) buffer carrying cost consisting of operational cost of buffer stock and carryover charges for holding excess stocks and (iii) operational losses of FCI and distribution of grains free of cost during calamities. The trends in total food subsidy during the last 5 years are presented in Chart 2.32. Food subsidy claimed by FCI has doubled during the last 5 years, from ₹1,09,600 crore in 2016-17 to ₹2,19,009 crore in 2020-21 (RE) as on 29th February, 2021. On the other hand, subsidy received has increased from ₹78,334 crore in 2016-17 to ₹1,71,380 crore in 2020-21 (RE). In Budget 2021-2022, the Hon’ble Finance Minister announced discontinuation of the National Small Savings Fund (NSSF) loan to FCI for food subsidy and ₹4,22,618 crore was provided in 2020-21 (RE). The NSSF loan outstanding with FCI as on 31st March, 2020 was ₹2,54,600 crore. In 2021-22 (BE), ₹2,42,836 crore has been provided for food subsidy.
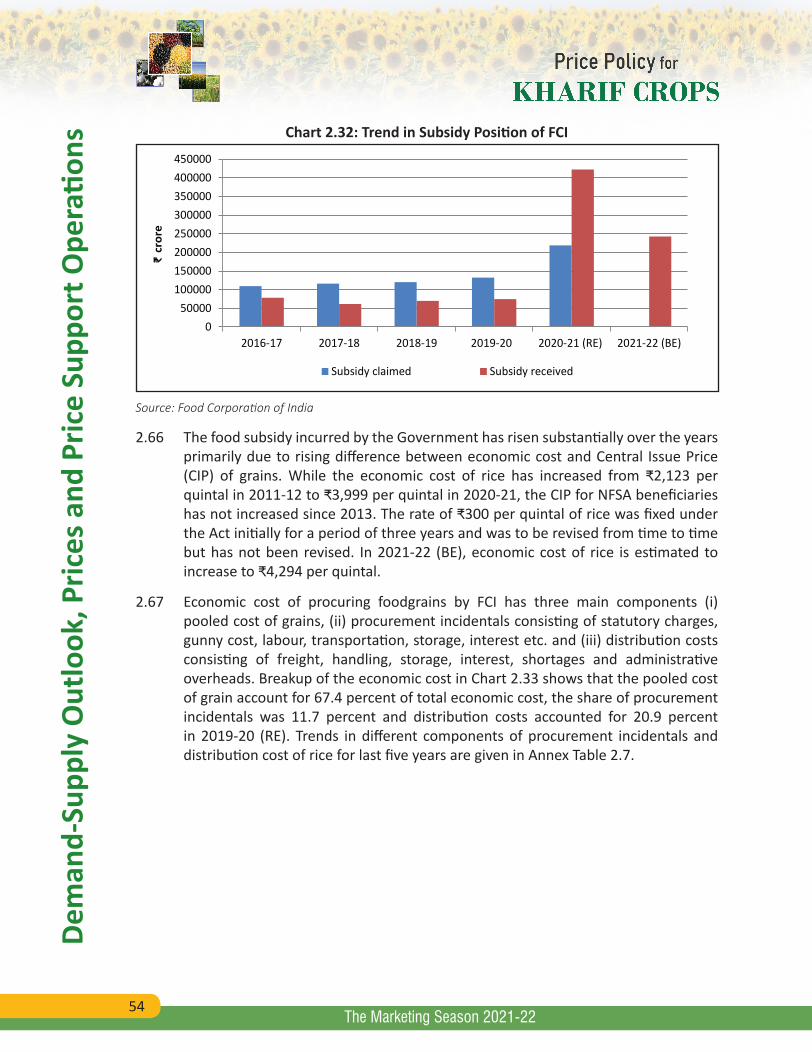
54
Dem
and-
Supp
ly O
utlo
ok, P
rices
and
Pric
e Su
ppor
t Ope
ratio
ns
The Marketing Season 2021-22
Chart 2.32: Trend in Subsidy Position of FCI
050000
100000150000200000250000300000350000400000450000
2016-17 2017-18 2018-19 2019-20 2020-21 (RE) 2021-22 (BE)
₹ cr
ore
Subsidy claimed Subsidy received
Source: Food Corporation of India
2.66 The food subsidy incurred by the Government has risen substantially over the years primarily due to rising difference between economic cost and Central Issue Price (CIP) of grains. While the economic cost of rice has increased from ₹2,123 per quintal in 2011-12 to ₹3,999 per quintal in 2020-21, the CIP for NFSA beneficiaries has not increased since 2013. The rate of ₹300 per quintal of rice was fixed under the Act initially for a period of three years and was to be revised from time to time but has not been revised. In 2021-22 (BE), economic cost of rice is estimated to increase to ₹4,294 per quintal.
2.67 Economic cost of procuring foodgrains by FCI has three main components (i) pooled cost of grains, (ii) procurement incidentals consisting of statutory charges, gunny cost, labour, transportation, storage, interest etc. and (iii) distribution costs consisting of freight, handling, storage, interest, shortages and administrative overheads. Breakup of the economic cost in Chart 2.33 shows that the pooled cost of grain account for 67.4 percent of total economic cost, the share of procurement incidentals was 11.7 percent and distribution costs accounted for 20.9 percent in 2019-20 (RE). Trends in different components of procurement incidentals and distribution cost of rice for last five years are given in Annex Table 2.7.
55
Dem
and-
Supp
ly O
utlo
ok, P
rices
and
Pric
e Su
ppor
t Ope
ratio
ns
The Marketing Season 2021-22
Chart 2.33: Share of different Components of Economic Cost of Rice Procurement during 2020-21
Pooled cost of grain
67.4%Procurement
Incidentals11.7%
Freight4.4%
Handling charges
2.1%
Storage charges1.4%
Interest11.7%
Shortages0.5% Admin
overheads0.8%
Source: Food Corporation of India
Awareness about MSP and FAQ Norms2.68 Creating awareness about prevailing MSP, FAQ standards, system of procurement,
payment mechanism etc. would help in ensuring better prices to farmers and adoption of modern technologies in farming through which we can ensure successful implementation of Scheme. Wide publicity about MSP, FAQ norms and procurement agencies by the Central and State Governments in regional/vernacular, electronic and print media and also through pamphlets and announcements in the villages well before the start of procurement season will help in reaching out to large number of farmers. In addition, farmers need to be trained about FAQ norms and post-harvest handling methods and access to infrastructure to minimize post-harvest losses and improve quality to get better prices.
Recapitulation2.69 As per estimates of FAO, USDA and IGC, world production of rice in 2020-21 is
projected to improve over 2019-20. In case of maize and soybean also, FAO USDA and IGC forecasts a rise in production. In India, with marginal increase in production, lower stocks and increase in exports, domestic prices of rice are projected to improve in 2020-21. Total production of pulses as well as kharif pulses in 2020-21 is estimated to be higher than 2019-20, though lower than the target for 2020-21. Also, cotton production in the country is estimated to rise significantly in 2020-21.
56
Dem
and-
Supp
ly O
utlo
ok, P
rices
and
Pric
e Su
ppor
t Ope
ratio
ns
The Marketing Season 2021-22
2.70 All India average market prices of paddy remained below MSP during the last five marketing seasons. The difference between market prices and MSP had narrowed in KMS 2019-20 which further narrowed in KMS 2020-21. In case of maize, there was a steep decline in the market prices in KMS 2020-21 and the average market price was 26.4 percent lower than MSP. For pulses such as tur and moong market prices remained below MSP in KMS 2020-21 though market prices improved over previous two years. In case of urad, average market prices remained slightly above MSP in KMS 2020-21. In case of groundnut, gap between MSP and average market price widened in KMS 2020-21. For soybean, average market prices remained slightly above MSP in KMS 2020-21. The market prices of cotton were above MSP from KMS 2016-17 to KMS 2018-19 but fell below MSP in subsequent years.
2.71 Significant improvement was witnessed in the procurement of rice in 2019-20 as compared to 2018-19. However, there exists a considerable disparity in procurement vis-à-vis production share. On the one hand, State which have relatively less production viz., Punjab, Telangana, Chhattisgarh and Haryana have procured more than their share in production, while on the other states viz., West Bengal, Tamil Nadu, Himachal Pradesh, Bihar and Assam have procured relatively less quantity than their production share. Rice procurement can be increased in leading rice producing states like West Bengal and Uttar Pradesh to meet at least the State requirement under NFSA and OWS. There is a dire need to holistically execute procurement operations covering mainly the small and marginal farmers and low procurement states having significant production.
2.72 In addition, creating large scale awareness campaign about prevailing MSP, FAQ standards, system of procurement, payment mechanism etc. is highly warranted in order to bring more farmers under safety net/ assurance system. The procurement agencies of the Central and State Governments may organise wide publicity about MSP, FAQ norms in regional/vernacular, electronic and print media and also through pamphlets and announcements in the villages well before the start of procurement season. Also farmers need to be trained about FAQ norms and post-harvest handling methods and access to infrastructure to minimize post-harvest losses and improve quality to get better prices.
*****
57
Chap
ter 3
Chapter 3
The Marketing Season 2021-22
Crop Yield and Input Management3.1 Agriculture is the crucial sector in India as it ensures food and nutritional security
to growing population. The availability of land for agriculture is diminishing due to rapid urbanization and industrialization, thus in order to feed growing population, enhancement of yield level is only viable option. Moreover, improvement in yield will bring down the cost of production and make farming a viable, remunerative and globally competitive enterprise. Although, there are considerable improvements in crop cultivation and management in the last several decades leading to a significant rise in yield level in almost all crops, but in recent years it was observed that the yield levels have stagnated or started declining in selected crops in some regions. Current yield levels are also lower than potential yield pointing to realizable Yield gains. Further, India’s overall yield levels in major crops still lag behind many countries in the world. The prime reasons attributed to this are monsoon dependency, slow pace of irrigation expansion, and decline in soil fertility among others. Given the set of binding constraints on use of key inputs and other resource endowments, India is at the cusp of enhancing yield levels of major crops. This chapter presents an analysis of the trends in yield for kharif crops at the national as well as State level and compares the country’s yield level with the prominent countries of the world. In addition, the chapter also enumerates various factors that impede agricultural yield at the national level along with various initiatives taken to improve yield.
Yield Growth Trends3.2 Table 3.1 analyses and presents the average growth rates in the area, production
and yield of major kharif crops for Triennial Ending (TE) 2010-11, 2015-16 and 2020-21.
Cereals3.3 Production of total cereals witnessed the highest growth (2.4%) in TE2020-21 as
a result of highest growth in area (0.4%) and yield (2.0%) during the last 14 years. Similarly, kharif cereals recorded highest growth in production (2.1%) in TE2020-21 as a result of highest growth in yield (2.2%) though there was a marginal decline in rate of growth of area under kharif cereals over the same period. Growth in rice production accelerated to 2.2 percent in TE2020-21 after recovering from a decline of (-)0.3 percent in TE2015-16 as a result of steep increase in rate of growth of yield from (-)0.8 percent in TE2015-16 to 2 percent in TE2020-21. Jowar recorded the highest rate of growth of yield (7.4%) among all kharif cereals in TE2020-21
58
Crop
Yie
ld a
nd In
put M
anag
emen
t
The Marketing Season 2021-22
after recording deceleration in growth of yield in TE2015-16 (-)5.4 percent and (-)2 percent in TE2010-11. Owing to this, rate of growth of jowar production has also sharply increased to 3 percent in TE2020-21 after recording successive negative growth rates in TE2010-11 and TE2015-16. However, growth in area under jowar has been negative for the last 14 years. Bajra and ragi have also shown growth in production at 4.4 percent and 3.6 percent, respectively in TE2020-21 as a result of growth in yield even though both the crops suffered declined in area under cultivation in TE2020-21. Maize is the only kharif cereal with positive growth in area in the last fourteen years. Maize production recorded a growth of 1.7 percent in TE2020-21, which though higher than the growth recorded in TE2015-16 (0.7%), is much less than that recorded in TE2010-11 (6.3%). After recording a growth of 4.2 percent in yield in TE2010-11, maize yield has been stagnant inTE2015-16 followed by marginal increase (0.5%) in TE2020-21.
Pulses3.4 After recording a growth of 8 percent in TE2010-11 there has been a deceleration in
production of total pulses though the deceleration has slowed from (-)3.6 percent in TE2015-16 to (-)0.9 percent in TE2020-21. Growth in yield slowed to (-)5.9 percent in TE2015-16 after recording a growth of 3.6 percent in TE2010-11 and has been stagnant in TE2020-21. Growth in area under pulses declined by (-)0.9 percent in TE2020-21 after registering growth of 4.1 percent in TE2010-11 and 2.5 percent in TE2015-16. The trend in kharif pulses has been similar with deceleration in production in TE2020-21 (-)2.8 percent as a result of decline in both area under kharif pulses and yield. Urad recorded a steep decline in production at (-)8.9 percent in TE2020-21 as a result of significant deceleration in area under cultivation (-)7.4 percent and negative growth in yield (-)1.2 percent. Rate of growth in production and yield of tur has been continuously negative since TE2010-11, though the rate of decline in both production and yield has been slower in TE2020-21 compared to TE2015-16. Moong recorded the highest growth in production among major kharif pulses in TE2020-21 at 9.4 percent as a result of growth in yield (5.1%) and area (4%).
Oilseeds3.5 There has been a sharp increase in production of total oilseeds in TE2020-21 by 6
percent after decline of (-)6.1 percent in TE2015-16 as a result of increase in both area (5.6 %) and yield (0.4 %) in TE2020-21. Similarly, kharif oilseeds witnessed an impressive growth of 6.2 percent in production in TE 2020-21 after a negative growth of (-)6.5 percent in TE2015-16 as a result of increase in rate of growth of area at 6.5 percent outweighing marginal decline in yield in TE2020-21. Of all major kharif oilseeds, soybean recorded the sharpest increase in production at 9.4 percent in TE2020-21 after a decline of (-)16.4 percent in TE2015-16 as a result of increase in area (8%) and yield (1.5%) in TE2020-21. Groundnut also witnessed a growth of 7.5 percent in production in TE2020-21 supported by growth in both area (6.7%) and
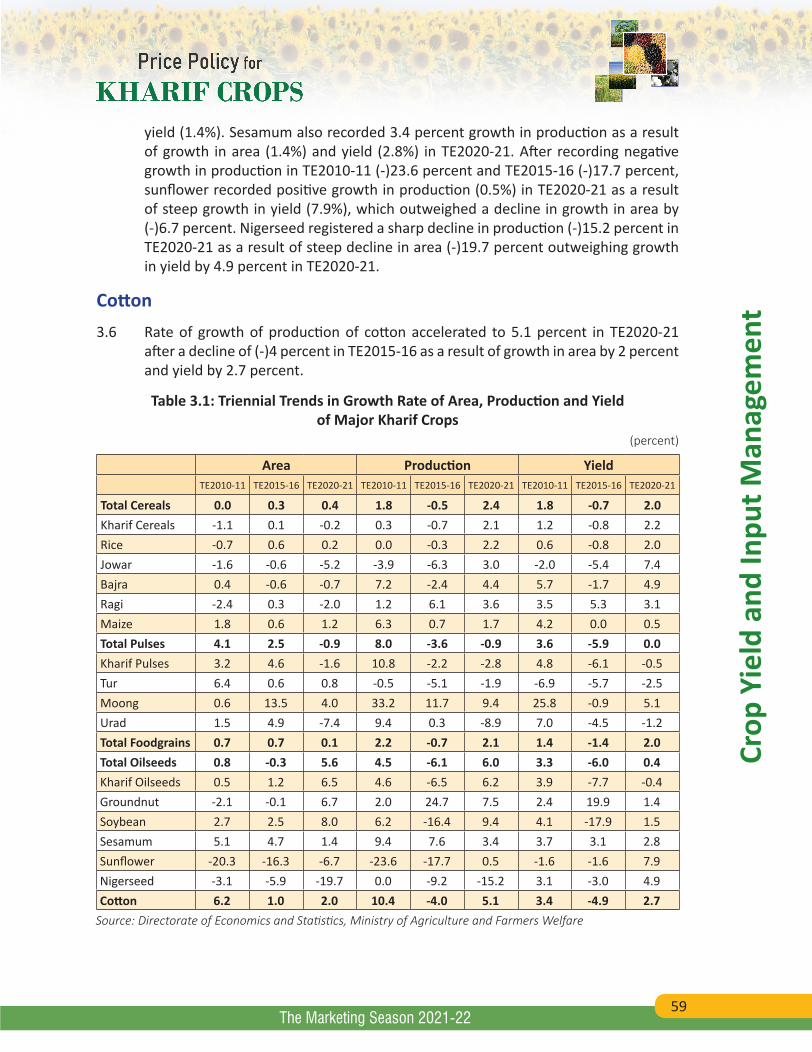
59
Crop
Yie
ld a
nd In
put M
anag
emen
t
The Marketing Season 2021-22
yield (1.4%). Sesamum also recorded 3.4 percent growth in production as a result of growth in area (1.4%) and yield (2.8%) in TE2020-21. After recording negative growth in production in TE2010-11 (-)23.6 percent and TE2015-16 (-)17.7 percent, sunflower recorded positive growth in production (0.5%) in TE2020-21 as a result of steep growth in yield (7.9%), which outweighed a decline in growth in area by (-)6.7 percent. Nigerseed registered a sharp decline in production (-)15.2 percent in TE2020-21 as a result of steep decline in area (-)19.7 percent outweighing growth in yield by 4.9 percent in TE2020-21.
Cotton3.6 Rate of growth of production of cotton accelerated to 5.1 percent in TE2020-21
after a decline of (-)4 percent in TE2015-16 as a result of growth in area by 2 percent and yield by 2.7 percent.
Table 3.1: Triennial Trends in Growth Rate of Area, Production and Yield of Major Kharif Crops
(percent)
Area Production YieldTE2010-11 TE2015-16 TE2020-21 TE2010-11 TE2015-16 TE2020-21 TE2010-11 TE2015-16 TE2020-21
Total Cereals 0.0 0.3 0.4 1.8 -0.5 2.4 1.8 -0.7 2.0Kharif Cereals -1.1 0.1 -0.2 0.3 -0.7 2.1 1.2 -0.8 2.2Rice -0.7 0.6 0.2 0.0 -0.3 2.2 0.6 -0.8 2.0Jowar -1.6 -0.6 -5.2 -3.9 -6.3 3.0 -2.0 -5.4 7.4Bajra 0.4 -0.6 -0.7 7.2 -2.4 4.4 5.7 -1.7 4.9Ragi -2.4 0.3 -2.0 1.2 6.1 3.6 3.5 5.3 3.1Maize 1.8 0.6 1.2 6.3 0.7 1.7 4.2 0.0 0.5Total Pulses 4.1 2.5 -0.9 8.0 -3.6 -0.9 3.6 -5.9 0.0Kharif Pulses 3.2 4.6 -1.6 10.8 -2.2 -2.8 4.8 -6.1 -0.5Tur 6.4 0.6 0.8 -0.5 -5.1 -1.9 -6.9 -5.7 -2.5Moong 0.6 13.5 4.0 33.2 11.7 9.4 25.8 -0.9 5.1Urad 1.5 4.9 -7.4 9.4 0.3 -8.9 7.0 -4.5 -1.2Total Foodgrains 0.7 0.7 0.1 2.2 -0.7 2.1 1.4 -1.4 2.0Total Oilseeds 0.8 -0.3 5.6 4.5 -6.1 6.0 3.3 -6.0 0.4Kharif Oilseeds 0.5 1.2 6.5 4.6 -6.5 6.2 3.9 -7.7 -0.4Groundnut -2.1 -0.1 6.7 2.0 24.7 7.5 2.4 19.9 1.4Soybean 2.7 2.5 8.0 6.2 -16.4 9.4 4.1 -17.9 1.5Sesamum 5.1 4.7 1.4 9.4 7.6 3.4 3.7 3.1 2.8Sunflower -20.3 -16.3 -6.7 -23.6 -17.7 0.5 -1.6 -1.6 7.9Nigerseed -3.1 -5.9 -19.7 0.0 -9.2 -15.2 3.1 -3.0 4.9Cotton 6.2 1.0 2.0 10.4 -4.0 5.1 3.4 -4.9 2.7
Source: Directorate of Economics and Statistics, Ministry of Agriculture and Farmers Welfare
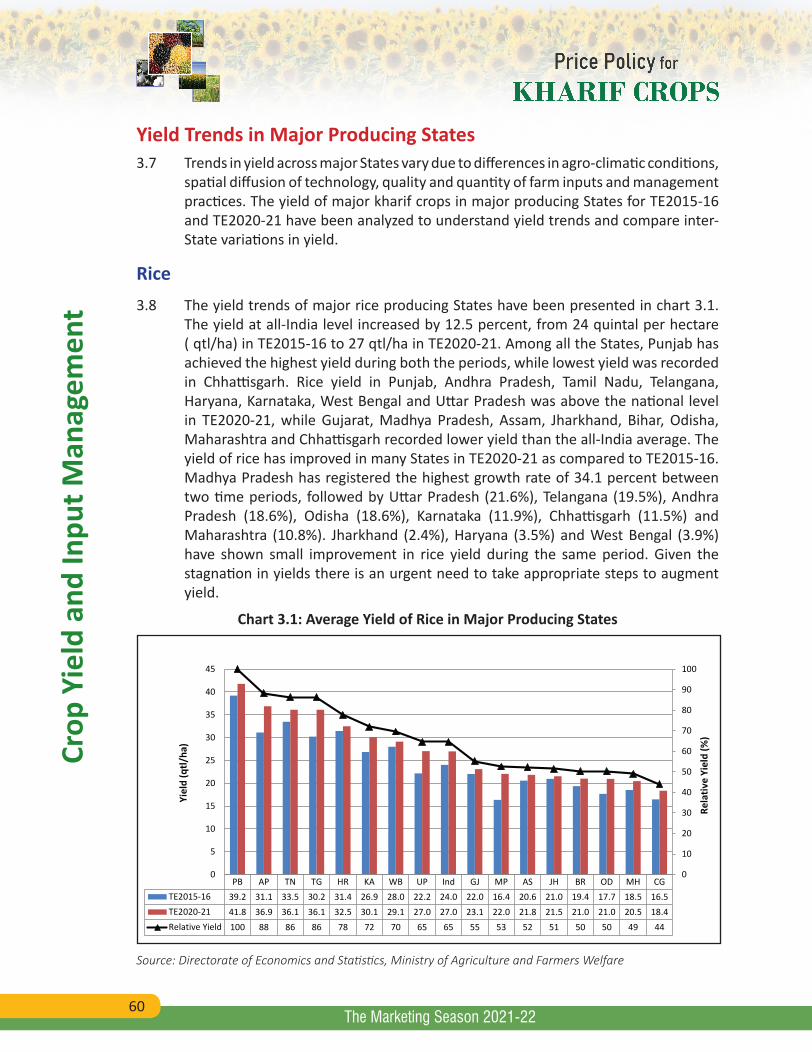
60
Crop
Yie
ld a
nd In
put M
anag
emen
t
The Marketing Season 2021-22
Yield Trends in Major Producing States 3.7 Trends in yield across major States vary due to differences in agro-climatic conditions,
spatial diffusion of technology, quality and quantity of farm inputs and management practices. The yield of major kharif crops in major producing States for TE2015-16 and TE2020-21 have been analyzed to understand yield trends and compare inter-State variations in yield.
Rice3.8 The yield trends of major rice producing States have been presented in chart 3.1.
The yield at all-India level increased by 12.5 percent, from 24 quintal per hectare ( qtl/ha) in TE2015-16 to 27 qtl/ha in TE2020-21. Among all the States, Punjab has achieved the highest yield during both the periods, while lowest yield was recorded in Chhattisgarh. Rice yield in Punjab, Andhra Pradesh, Tamil Nadu, Telangana, Haryana, Karnataka, West Bengal and Uttar Pradesh was above the national level in TE2020-21, while Gujarat, Madhya Pradesh, Assam, Jharkhand, Bihar, Odisha, Maharashtra and Chhattisgarh recorded lower yield than the all-India average. The yield of rice has improved in many States in TE2020-21 as compared to TE2015-16. Madhya Pradesh has registered the highest growth rate of 34.1 percent between two time periods, followed by Uttar Pradesh (21.6%), Telangana (19.5%), Andhra Pradesh (18.6%), Odisha (18.6%), Karnataka (11.9%), Chhattisgarh (11.5%) and Maharashtra (10.8%). Jharkhand (2.4%), Haryana (3.5%) and West Bengal (3.9%) have shown small improvement in rice yield during the same period. Given the stagnation in yields there is an urgent need to take appropriate steps to augment yield.
Chart 3.1: Average Yield of Rice in Major Producing States
PB AP TN TG HR KA WB UP Ind GJ MP AS JH BR OD MH CGTE2015-16 39.2 31.1 33.5 30.2 31.4 26.9 28.0 22.2 24.0 22.0 16.4 20.6 21.0 19.4 17.7 18.5 16.5TE2020-21 41.8 36.9 36.1 36.1 32.5 30.1 29.1 27.0 27.0 23.1 22.0 21.8 21.5 21.0 21.0 20.5 18.4Relative Yield 100 88 86 86 78 72 70 65 65 55 53 52 51 50 50 49 44
0
10
20
30
40
50
60
70
80
90
100
0
5
10
15
20
25
30
35
40
45
Rela
tive
Yiel
d (%
)
Yiel
d (q
tl/ha
)
Source: Directorate of Economics and Statistics, Ministry of Agriculture and Farmers Welfare
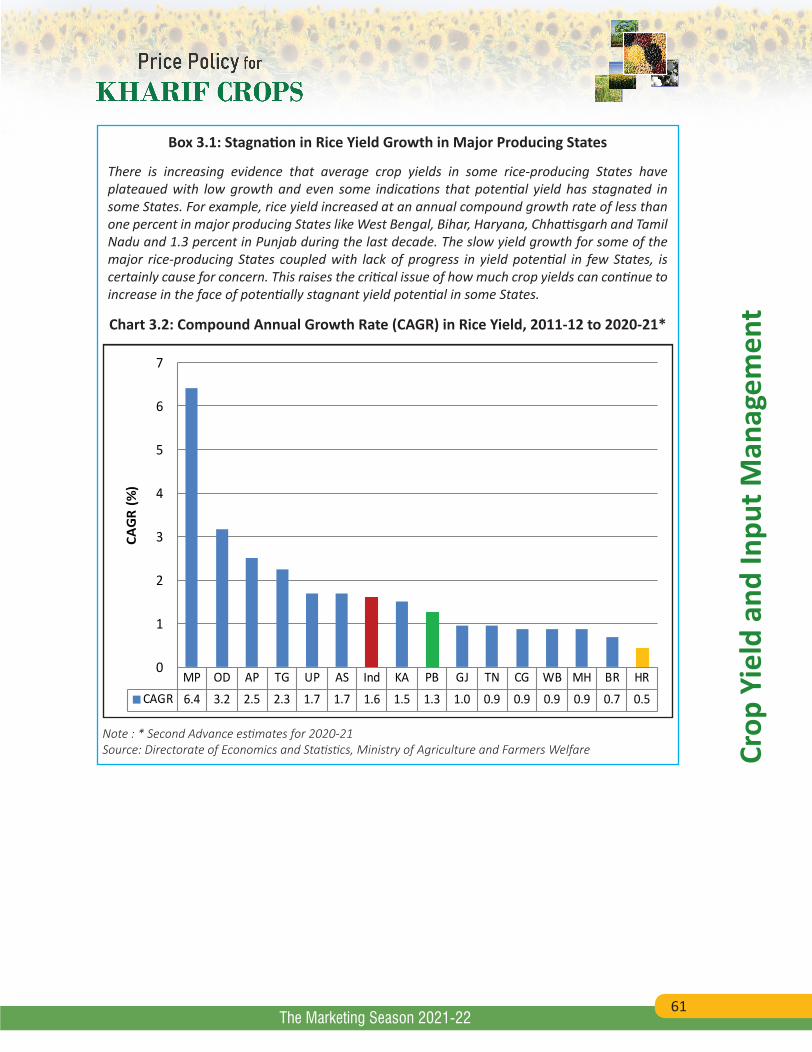
61
Crop
Yie
ld a
nd In
put M
anag
emen
t
The Marketing Season 2021-22
Box 3.1: Stagnation in Rice Yield Growth in Major Producing States
There is increasing evidence that average crop yields in some rice-producing States have plateaued with low growth and even some indications that potential yield has stagnated in some States. For example, rice yield increased at an annual compound growth rate of less than one percent in major producing States like West Bengal, Bihar, Haryana, Chhattisgarh and Tamil Nadu and 1.3 percent in Punjab during the last decade. The slow yield growth for some of the major rice-producing States coupled with lack of progress in yield potential in few States, is certainly cause for concern. This raises the critical issue of how much crop yields can continue to increase in the face of potentially stagnant yield potential in some States.
Chart 3.2: Compound Annual Growth Rate (CAGR) in Rice Yield, 2011-12 to 2020-21*
MP OD AP TG UP AS Ind KA PB GJ TN CG WB MH BR HRCAGR 6.4 3.2 2.5 2.3 1.7 1.7 1.6 1.5 1.3 1.0 0.9 0.9 0.9 0.9 0.7 0.5
0
1
2
3
4
5
6
7
CAG
R (%
)
Note : * Second Advance estimates for 2020-21 Source: Directorate of Economics and Statistics, Ministry of Agriculture and Farmers Welfare
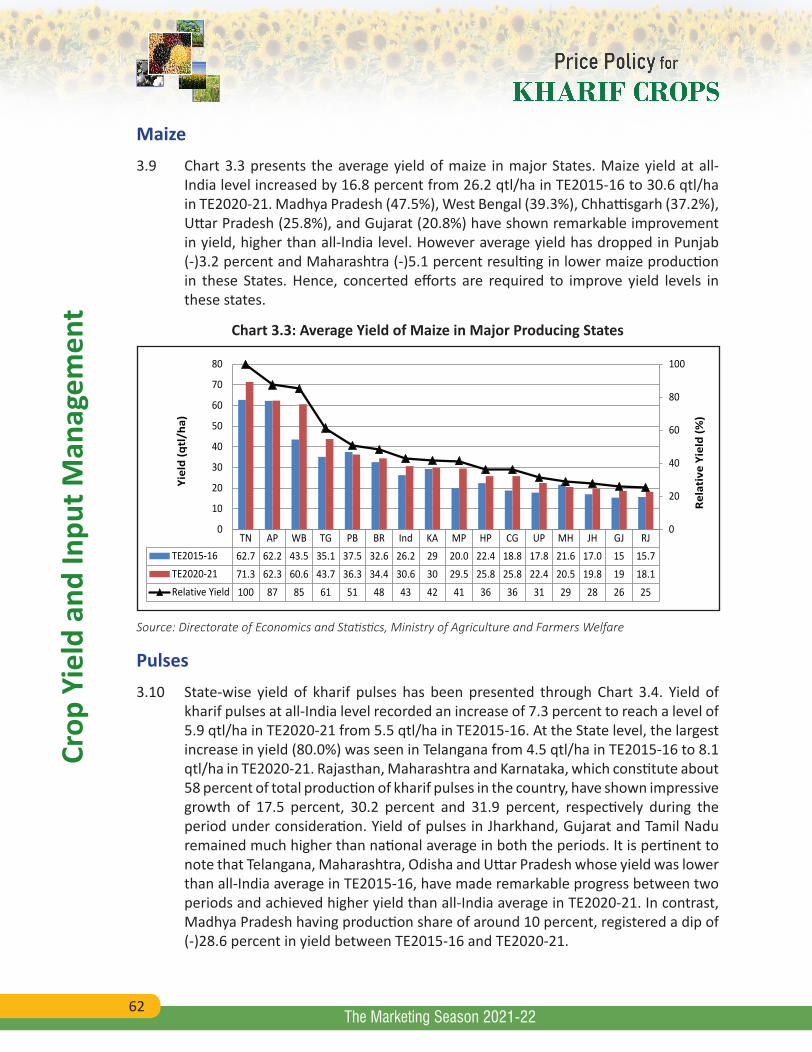
62
Crop
Yie
ld a
nd In
put M
anag
emen
t
The Marketing Season 2021-22
Maize3.9 Chart 3.3 presents the average yield of maize in major States. Maize yield at all-
India level increased by 16.8 percent from 26.2 qtl/ha in TE2015-16 to 30.6 qtl/ha in TE2020-21. Madhya Pradesh (47.5%), West Bengal (39.3%), Chhattisgarh (37.2%), Uttar Pradesh (25.8%), and Gujarat (20.8%) have shown remarkable improvement in yield, higher than all-India level. However average yield has dropped in Punjab (-)3.2 percent and Maharashtra (-)5.1 percent resulting in lower maize production in these States. Hence, concerted efforts are required to improve yield levels in these states.
Chart 3.3: Average Yield of Maize in Major Producing States
TN AP WB TG PB BR Ind KA MP HP CG UP MH JH GJ RJTE2015-16 62.7 62.2 43.5 35.1 37.5 32.6 26.2 29 20.0 22.4 18.8 17.8 21.6 17.0 15 15.7TE2020-21 71.3 62.3 60.6 43.7 36.3 34.4 30.6 30 29.5 25.8 25.8 22.4 20.5 19.8 19 18.1Relative Yield 100 87 85 61 51 48 43 42 41 36 36 31 29 28 26 25
0
20
40
60
80
100
0
10
20
30
40
50
60
70
80
Rela
tive
Yie
ld (%
)
Yiel
d (q
tl/h
a)
Source: Directorate of Economics and Statistics, Ministry of Agriculture and Farmers Welfare
Pulses3.10 State-wise yield of kharif pulses has been presented through Chart 3.4. Yield of
kharif pulses at all-India level recorded an increase of 7.3 percent to reach a level of 5.9 qtl/ha in TE2020-21 from 5.5 qtl/ha in TE2015-16. At the State level, the largest increase in yield (80.0%) was seen in Telangana from 4.5 qtl/ha in TE2015-16 to 8.1 qtl/ha in TE2020-21. Rajasthan, Maharashtra and Karnataka, which constitute about 58 percent of total production of kharif pulses in the country, have shown impressive growth of 17.5 percent, 30.2 percent and 31.9 percent, respectively during the period under consideration. Yield of pulses in Jharkhand, Gujarat and Tamil Nadu remained much higher than national average in both the periods. It is pertinent to note that Telangana, Maharashtra, Odisha and Uttar Pradesh whose yield was lower than all-India average in TE2015-16, have made remarkable progress between two periods and achieved higher yield than all-India average in TE2020-21. In contrast, Madhya Pradesh having production share of around 10 percent, registered a dip of (-)28.6 percent in yield between TE2015-16 and TE2020-21.
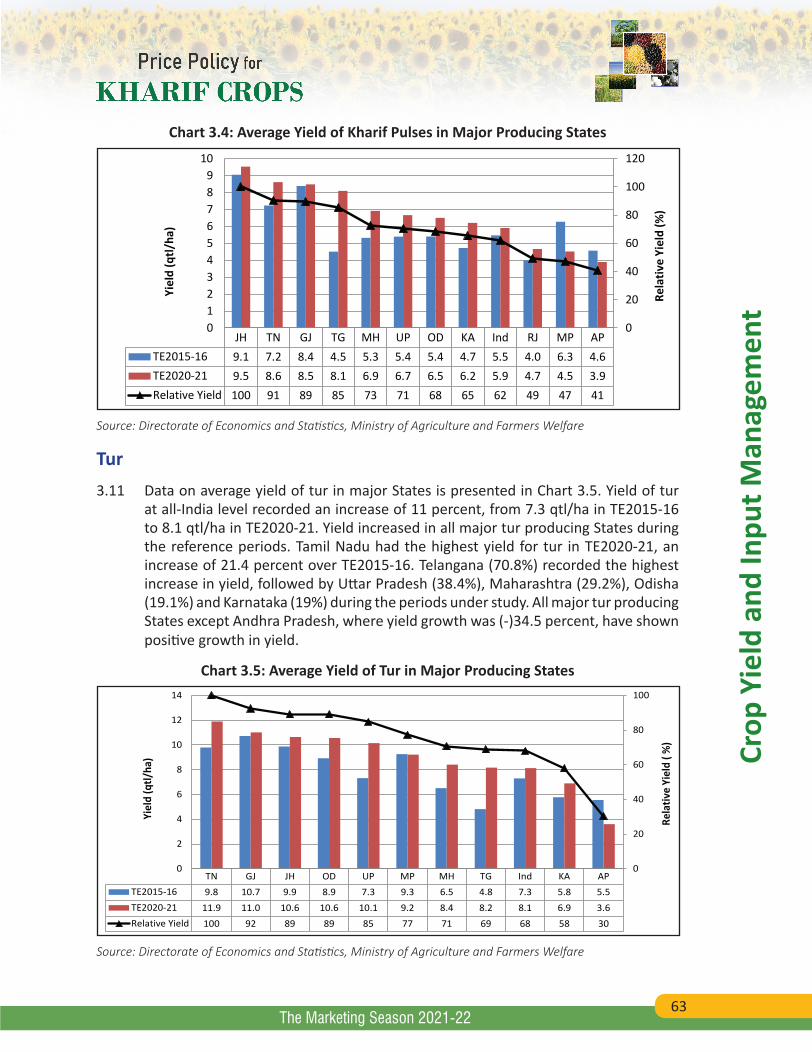
63
Crop
Yie
ld a
nd In
put M
anag
emen
t
The Marketing Season 2021-22
Chart 3.4: Average Yield of Kharif Pulses in Major Producing States
JH TN GJ TG MH UP OD KA Ind RJ MP APTE2015-16 9.1 7.2 8.4 4.5 5.3 5.4 5.4 4.7 5.5 4.0 6.3 4.6TE2020-21 9.5 8.6 8.5 8.1 6.9 6.7 6.5 6.2 5.9 4.7 4.5 3.9Relative Yield 100 91 89 85 73 71 68 65 62 49 47 41
0
20
40
60
80
100
120
0123456789
10
Rela
tive
Yiel
d (%
)
Yiel
d (q
tl/ha
)
Source: Directorate of Economics and Statistics, Ministry of Agriculture and Farmers Welfare
Tur3.11 Data on average yield of tur in major States is presented in Chart 3.5. Yield of tur
at all-India level recorded an increase of 11 percent, from 7.3 qtl/ha in TE2015-16 to 8.1 qtl/ha in TE2020-21. Yield increased in all major tur producing States during the reference periods. Tamil Nadu had the highest yield for tur in TE2020-21, an increase of 21.4 percent over TE2015-16. Telangana (70.8%) recorded the highest increase in yield, followed by Uttar Pradesh (38.4%), Maharashtra (29.2%), Odisha (19.1%) and Karnataka (19%) during the periods under study. All major tur producing States except Andhra Pradesh, where yield growth was (-)34.5 percent, have shown positive growth in yield.
Chart 3.5: Average Yield of Tur in Major Producing States
TN GJ JH OD UP MP MH TG Ind KA APTE2015-16 9.8 10.7 9.9 8.9 7.3 9.3 6.5 4.8 7.3 5.8 5.5TE2020-21 11.9 11.0 10.6 10.6 10.1 9.2 8.4 8.2 8.1 6.9 3.6Relative Yield 100 92 89 89 85 77 71 69 68 58 30
0
20
40
60
80
100
0
2
4
6
8
10
12
14
Rela
tive
Yiel
d ( %
)
Yiel
d (q
tl/ha
)
Source: Directorate of Economics and Statistics, Ministry of Agriculture and Farmers Welfare
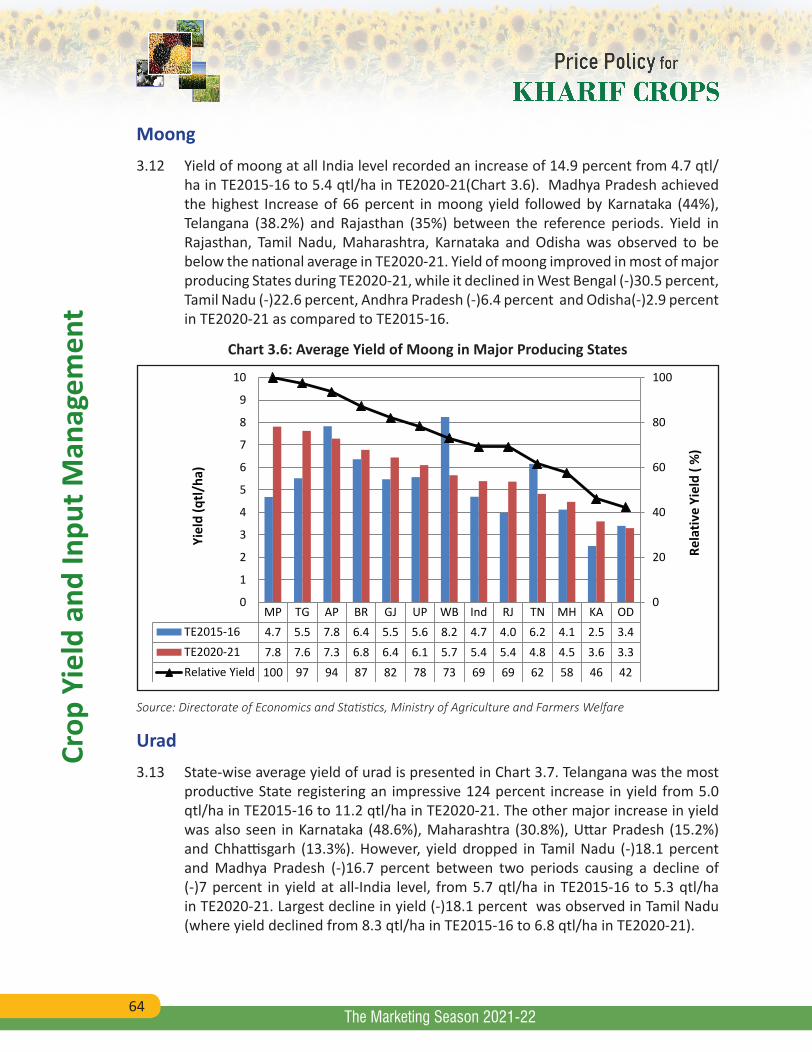
64
Crop
Yie
ld a
nd In
put M
anag
emen
t
The Marketing Season 2021-22
Moong3.12 Yield of moong at all India level recorded an increase of 14.9 percent from 4.7 qtl/
ha in TE2015-16 to 5.4 qtl/ha in TE2020-21(Chart 3.6). Madhya Pradesh achieved the highest Increase of 66 percent in moong yield followed by Karnataka (44%), Telangana (38.2%) and Rajasthan (35%) between the reference periods. Yield in Rajasthan, Tamil Nadu, Maharashtra, Karnataka and Odisha was observed to be below the national average in TE2020-21. Yield of moong improved in most of major producing States during TE2020-21, while it declined in West Bengal (-)30.5 percent, Tamil Nadu (-)22.6 percent, Andhra Pradesh (-)6.4 percent and Odisha(-)2.9 percent in TE2020-21 as compared to TE2015-16.
Chart 3.6: Average Yield of Moong in Major Producing States
MP TG AP BR GJ UP WB Ind RJ TN MH KA ODTE2015-16 4.7 5.5 7.8 6.4 5.5 5.6 8.2 4.7 4.0 6.2 4.1 2.5 3.4TE2020-21 7.8 7.6 7.3 6.8 6.4 6.1 5.7 5.4 5.4 4.8 4.5 3.6 3.3Relative Yield 100 97 94 87 82 78 73 69 69 62 58 46 42
0
20
40
60
80
100
0
1
2
3
4
5
6
7
8
9
10
Rela
tive
Yiel
d ( %
)
Yiel
d (q
tl/ha
)
Source: Directorate of Economics and Statistics, Ministry of Agriculture and Farmers Welfare
Urad3.13 State-wise average yield of urad is presented in Chart 3.7. Telangana was the most
productive State registering an impressive 124 percent increase in yield from 5.0 qtl/ha in TE2015-16 to 11.2 qtl/ha in TE2020-21. The other major increase in yield was also seen in Karnataka (48.6%), Maharashtra (30.8%), Uttar Pradesh (15.2%) and Chhattisgarh (13.3%). However, yield dropped in Tamil Nadu (-)18.1 percent and Madhya Pradesh (-)16.7 percent between two periods causing a decline of (-)7 percent in yield at all-India level, from 5.7 qtl/ha in TE2015-16 to 5.3 qtl/ha in TE2020-21. Largest decline in yield (-)18.1 percent was observed in Tamil Nadu (where yield declined from 8.3 qtl/ha in TE2015-16 to 6.8 qtl/ha in TE2020-21).
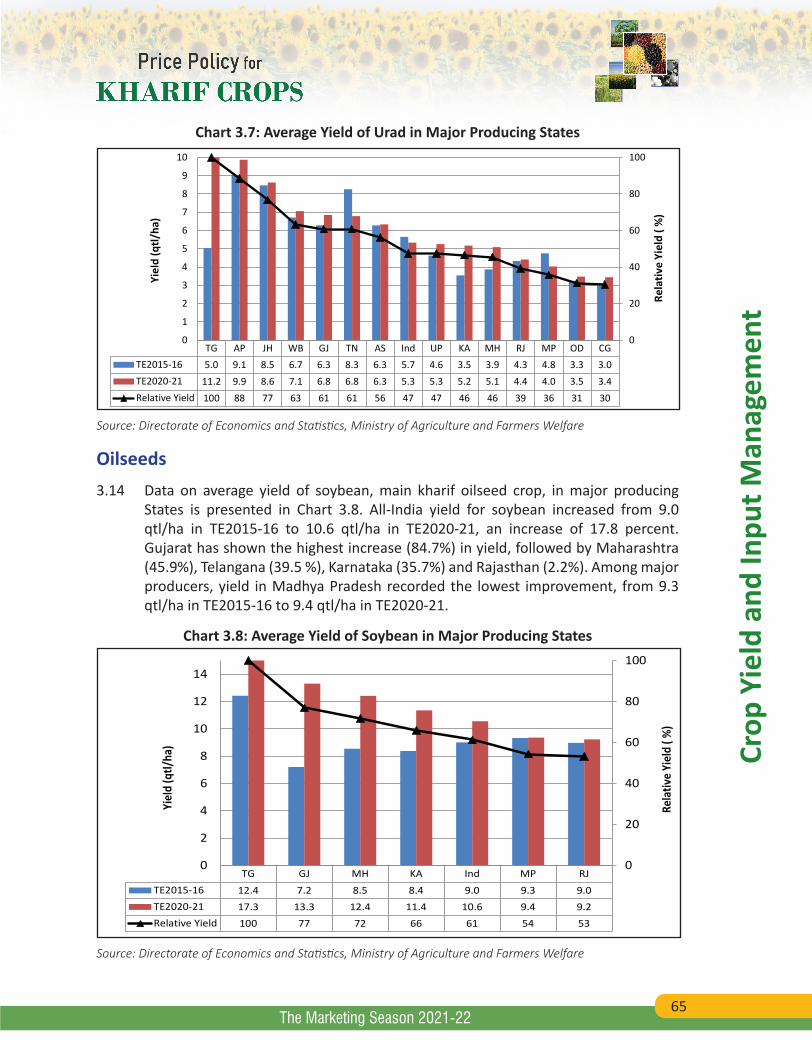
65
Crop
Yie
ld a
nd In
put M
anag
emen
t
The Marketing Season 2021-22
Chart 3.7: Average Yield of Urad in Major Producing States
TG AP JH WB GJ TN AS Ind UP KA MH RJ MP OD CGTE2015-16 5.0 9.1 8.5 6.7 6.3 8.3 6.3 5.7 4.6 3.5 3.9 4.3 4.8 3.3 3.0TE2020-21 11.2 9.9 8.6 7.1 6.8 6.8 6.3 5.3 5.3 5.2 5.1 4.4 4.0 3.5 3.4Relative Yield 100 88 77 63 61 61 56 47 47 46 46 39 36 31 30
0
20
40
60
80
100
0
1
2
3
4
5
6
7
8
9
10
Rela
tive
Yiel
d ( %
)
Yiel
d (q
tl/ha
)
Source: Directorate of Economics and Statistics, Ministry of Agriculture and Farmers Welfare
Oilseeds3.14 Data on average yield of soybean, main kharif oilseed crop, in major producing
States is presented in Chart 3.8. All-India yield for soybean increased from 9.0 qtl/ha in TE2015-16 to 10.6 qtl/ha in TE2020-21, an increase of 17.8 percent. Gujarat has shown the highest increase (84.7%) in yield, followed by Maharashtra (45.9%), Telangana (39.5 %), Karnataka (35.7%) and Rajasthan (2.2%). Among major producers, yield in Madhya Pradesh recorded the lowest improvement, from 9.3 qtl/ha in TE2015-16 to 9.4 qtl/ha in TE2020-21.
Chart 3.8: Average Yield of Soybean in Major Producing States
TG GJ MH KA Ind MP RJTE2015-16 12.4 7.2 8.5 8.4 9.0 9.3 9.0TE2020-21 17.3 13.3 12.4 11.4 10.6 9.4 9.2Relative Yield 100 77 72 66 61 54 53
0
20
40
60
80
100
0
2
4
6
8
10
12
14Re
lativ
e Yi
eld
( %)
Yiel
d (q
tl/ha
)
Source: Directorate of Economics and Statistics, Ministry of Agriculture and Farmers Welfare
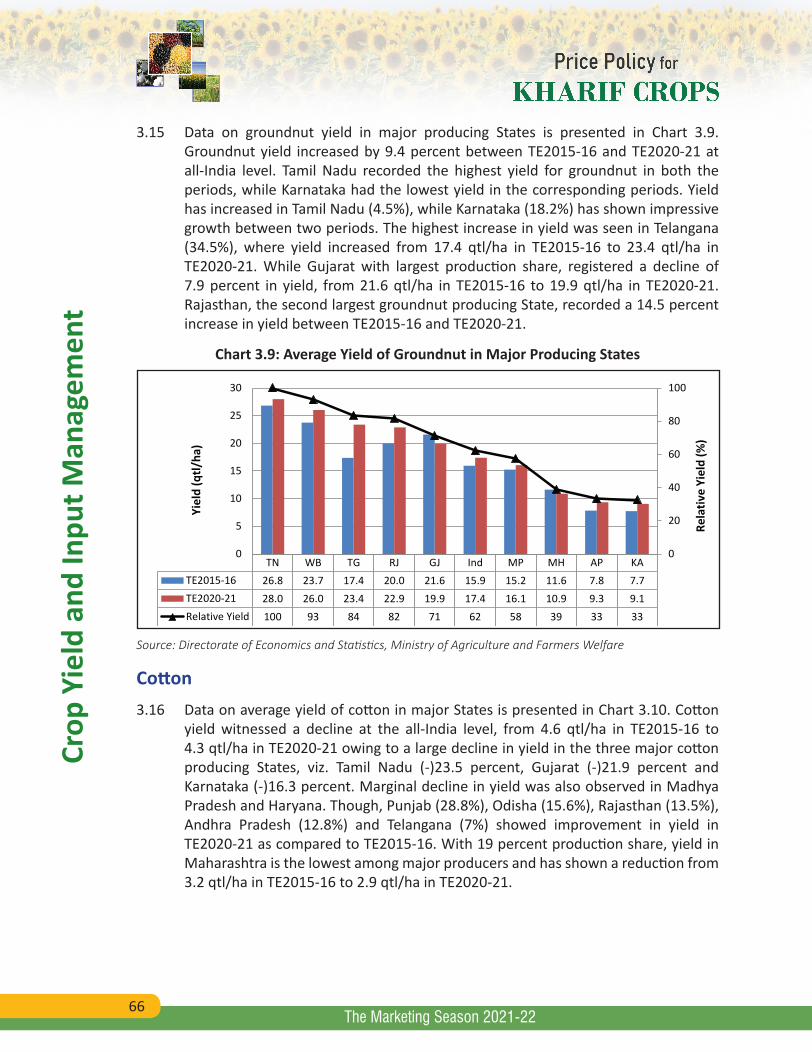
66
Crop
Yie
ld a
nd In
put M
anag
emen
t
The Marketing Season 2021-22
3.15 Data on groundnut yield in major producing States is presented in Chart 3.9. Groundnut yield increased by 9.4 percent between TE2015-16 and TE2020-21 at all-India level. Tamil Nadu recorded the highest yield for groundnut in both the periods, while Karnataka had the lowest yield in the corresponding periods. Yield has increased in Tamil Nadu (4.5%), while Karnataka (18.2%) has shown impressive growth between two periods. The highest increase in yield was seen in Telangana (34.5%), where yield increased from 17.4 qtl/ha in TE2015-16 to 23.4 qtl/ha in TE2020-21. While Gujarat with largest production share, registered a decline of 7.9 percent in yield, from 21.6 qtl/ha in TE2015-16 to 19.9 qtl/ha in TE2020-21. Rajasthan, the second largest groundnut producing State, recorded a 14.5 percent increase in yield between TE2015-16 and TE2020-21.
Chart 3.9: Average Yield of Groundnut in Major Producing States
TN WB TG RJ GJ Ind MP MH AP KATE2015-16 26.8 23.7 17.4 20.0 21.6 15.9 15.2 11.6 7.8 7.7TE2020-21 28.0 26.0 23.4 22.9 19.9 17.4 16.1 10.9 9.3 9.1Relative Yield 100 93 84 82 71 62 58 39 33 33
0
20
40
60
80
100
0
5
10
15
20
25
30
Rela
tive
Yiel
d (%
)
Yiel
d (q
tl/ha
)
Source: Directorate of Economics and Statistics, Ministry of Agriculture and Farmers Welfare
Cotton3.16 Data on average yield of cotton in major States is presented in Chart 3.10. Cotton
yield witnessed a decline at the all-India level, from 4.6 qtl/ha in TE2015-16 to 4.3 qtl/ha in TE2020-21 owing to a large decline in yield in the three major cotton producing States, viz. Tamil Nadu (-)23.5 percent, Gujarat (-)21.9 percent and Karnataka (-)16.3 percent. Marginal decline in yield was also observed in Madhya Pradesh and Haryana. Though, Punjab (28.8%), Odisha (15.6%), Rajasthan (13.5%), Andhra Pradesh (12.8%) and Telangana (7%) showed improvement in yield in TE2020-21 as compared to TE2015-16. With 19 percent production share, yield in Maharashtra is the lowest among major producers and has shown a reduction from 3.2 qtl/ha in TE2015-16 to 2.9 qtl/ha in TE2020-21.
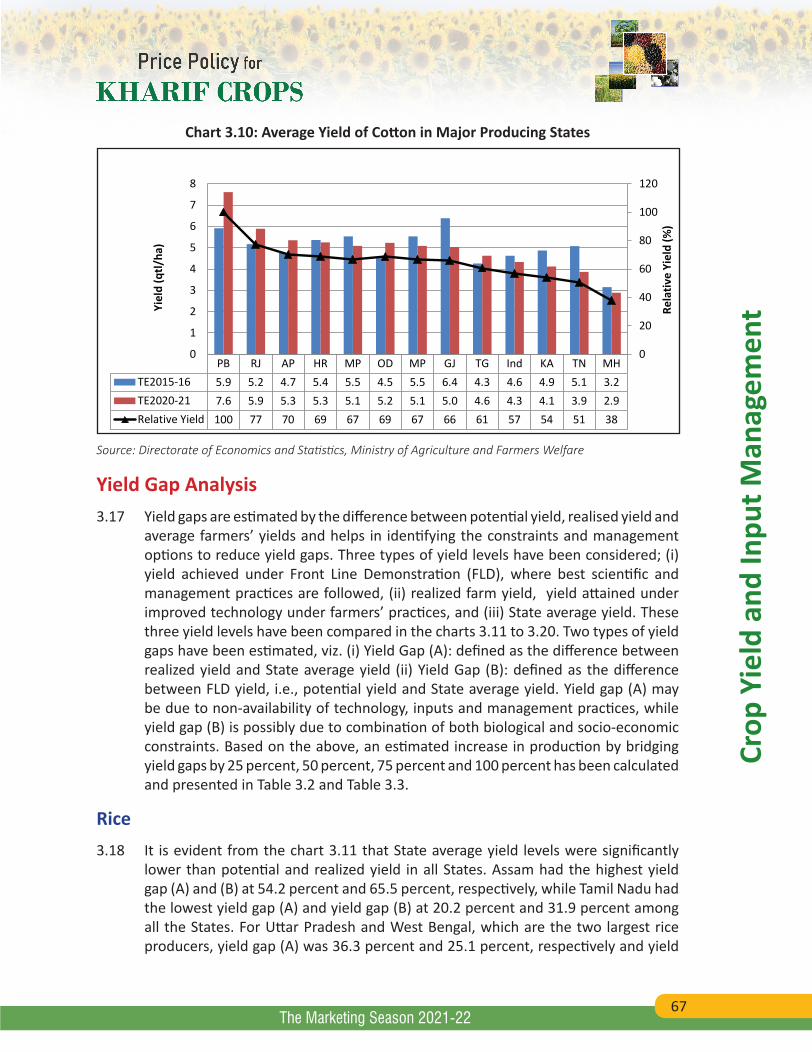
67
Crop
Yie
ld a
nd In
put M
anag
emen
t
The Marketing Season 2021-22
Chart 3.10: Average Yield of Cotton in Major Producing States
PB RJ AP HR MP OD MP GJ TG Ind KA TN MHTE2015-16 5.9 5.2 4.7 5.4 5.5 4.5 5.5 6.4 4.3 4.6 4.9 5.1 3.2TE2020-21 7.6 5.9 5.3 5.3 5.1 5.2 5.1 5.0 4.6 4.3 4.1 3.9 2.9Relative Yield 100 77 70 69 67 69 67 66 61 57 54 51 38
0
20
40
60
80
100
120
0
1
2
3
4
5
6
7
8
Rela
tive
Yiel
d (%
)
Yiel
d (q
tl/ha
)
Source: Directorate of Economics and Statistics, Ministry of Agriculture and Farmers Welfare
Yield Gap Analysis3.17 Yield gaps are estimated by the difference between potential yield, realised yield and
average farmers’ yields and helps in identifying the constraints and management options to reduce yield gaps. Three types of yield levels have been considered; (i) yield achieved under Front Line Demonstration (FLD), where best scientific and management practices are followed, (ii) realized farm yield, yield attained under improved technology under farmers’ practices, and (iii) State average yield. These three yield levels have been compared in the charts 3.11 to 3.20. Two types of yield gaps have been estimated, viz. (i) Yield Gap (A): defined as the difference between realized yield and State average yield (ii) Yield Gap (B): defined as the difference between FLD yield, i.e., potential yield and State average yield. Yield gap (A) may be due to non-availability of technology, inputs and management practices, while yield gap (B) is possibly due to combination of both biological and socio-economic constraints. Based on the above, an estimated increase in production by bridging yield gaps by 25 percent, 50 percent, 75 percent and 100 percent has been calculated and presented in Table 3.2 and Table 3.3.
Rice3.18 It is evident from the chart 3.11 that State average yield levels were significantly
lower than potential and realized yield in all States. Assam had the highest yield gap (A) and (B) at 54.2 percent and 65.5 percent, respectively, while Tamil Nadu had the lowest yield gap (A) and yield gap (B) at 20.2 percent and 31.9 percent among all the States. For Uttar Pradesh and West Bengal, which are the two largest rice producers, yield gap (A) was 36.3 percent and 25.1 percent, respectively and yield
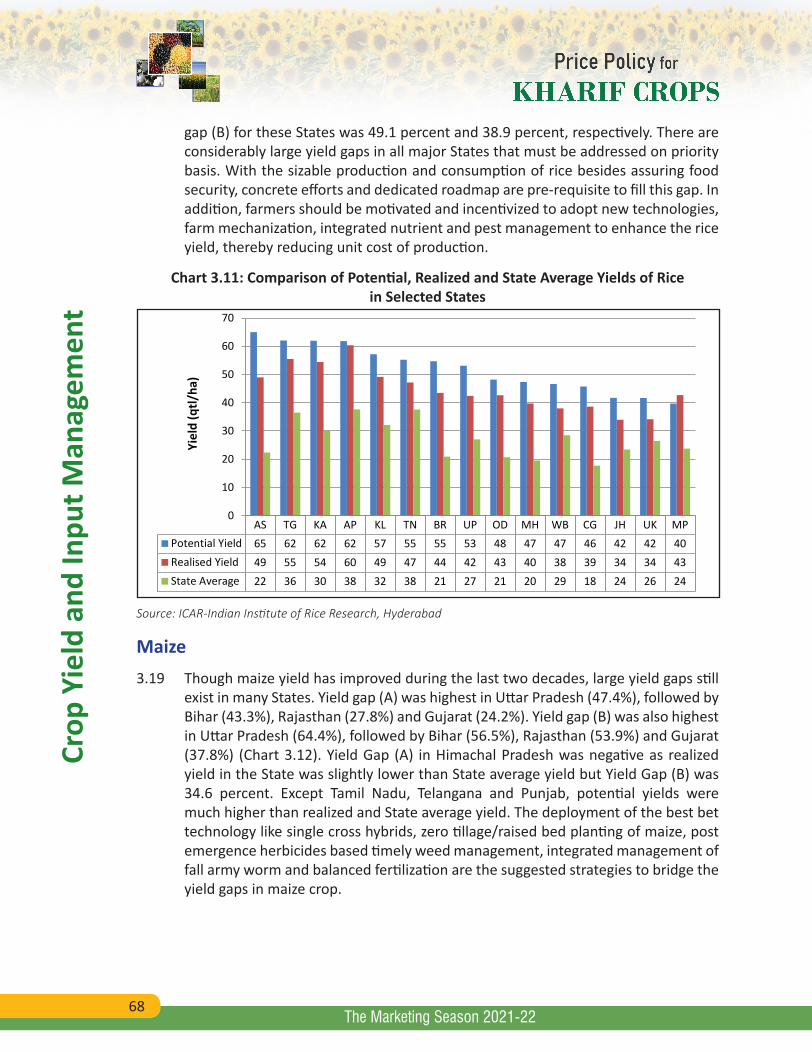
68
Crop
Yie
ld a
nd In
put M
anag
emen
t
The Marketing Season 2021-22
gap (B) for these States was 49.1 percent and 38.9 percent, respectively. There are considerably large yield gaps in all major States that must be addressed on priority basis. With the sizable production and consumption of rice besides assuring food security, concrete efforts and dedicated roadmap are pre-requisite to fill this gap. In addition, farmers should be motivated and incentivized to adopt new technologies, farm mechanization, integrated nutrient and pest management to enhance the rice yield, thereby reducing unit cost of production.
Chart 3.11: Comparison of Potential, Realized and State Average Yields of Rice in Selected States
AS TG KA AP KL TN BR UP OD MH WB CG JH UK MPPotential Yield 65 62 62 62 57 55 55 53 48 47 47 46 42 42 40Realised Yield 49 55 54 60 49 47 44 42 43 40 38 39 34 34 43State Average 22 36 30 38 32 38 21 27 21 20 29 18 24 26 24
0
10
20
30
40
50
60
70
Yiel
d (q
tl/ha
)
Source: ICAR-Indian Institute of Rice Research, Hyderabad
Maize3.19 Though maize yield has improved during the last two decades, large yield gaps still
exist in many States. Yield gap (A) was highest in Uttar Pradesh (47.4%), followed by Bihar (43.3%), Rajasthan (27.8%) and Gujarat (24.2%). Yield gap (B) was also highest in Uttar Pradesh (64.4%), followed by Bihar (56.5%), Rajasthan (53.9%) and Gujarat (37.8%) (Chart 3.12). Yield Gap (A) in Himachal Pradesh was negative as realized yield in the State was slightly lower than State average yield but Yield Gap (B) was 34.6 percent. Except Tamil Nadu, Telangana and Punjab, potential yields were much higher than realized and State average yield. The deployment of the best bet technology like single cross hybrids, zero tillage/raised bed planting of maize, post emergence herbicides based timely weed management, integrated management of fall army worm and balanced fertilization are the suggested strategies to bridge the yield gaps in maize crop.
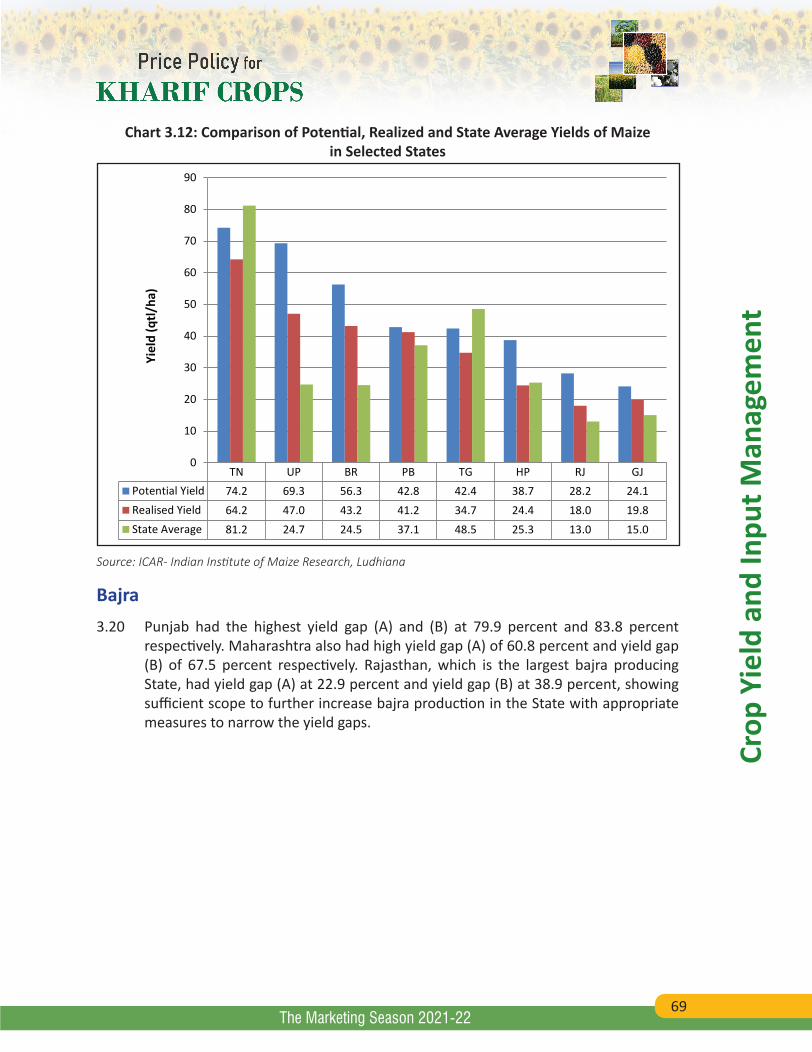
69
Crop
Yie
ld a
nd In
put M
anag
emen
t
The Marketing Season 2021-22
Chart 3.12: Comparison of Potential, Realized and State Average Yields of Maize in Selected States
TN UP BR PB TG HP RJ GJPotential Yield 74.2 69.3 56.3 42.8 42.4 38.7 28.2 24.1Realised Yield 64.2 47.0 43.2 41.2 34.7 24.4 18.0 19.8State Average 81.2 24.7 24.5 37.1 48.5 25.3 13.0 15.0
0
10
20
30
40
50
60
70
80
90
Yiel
d (q
tl/ha
)
Source: ICAR- Indian Institute of Maize Research, Ludhiana
Bajra3.20 Punjab had the highest yield gap (A) and (B) at 79.9 percent and 83.8 percent
respectively. Maharashtra also had high yield gap (A) of 60.8 percent and yield gap (B) of 67.5 percent respectively. Rajasthan, which is the largest bajra producing State, had yield gap (A) at 22.9 percent and yield gap (B) at 38.9 percent, showing sufficient scope to further increase bajra production in the State with appropriate measures to narrow the yield gaps.
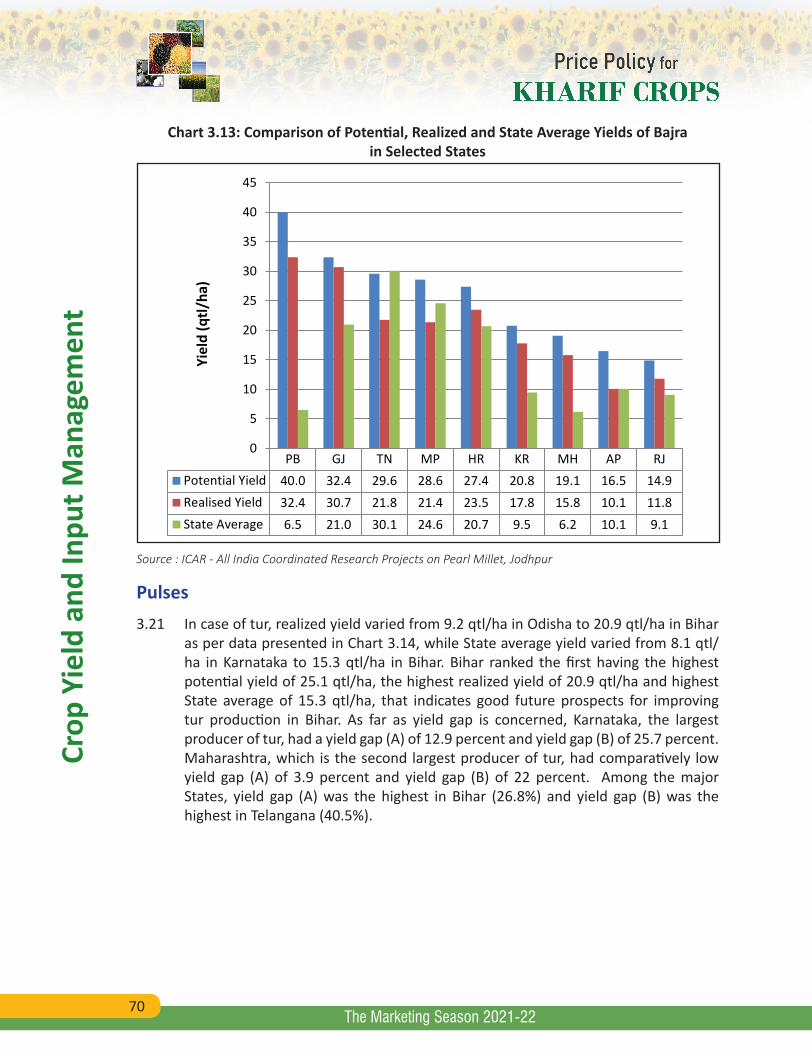
70
Crop
Yie
ld a
nd In
put M
anag
emen
t
The Marketing Season 2021-22
Chart 3.13: Comparison of Potential, Realized and State Average Yields of Bajra in Selected States
PB GJ TN MP HR KR MH AP RJPotential Yield 40.0 32.4 29.6 28.6 27.4 20.8 19.1 16.5 14.9Realised Yield 32.4 30.7 21.8 21.4 23.5 17.8 15.8 10.1 11.8State Average 6.5 21.0 30.1 24.6 20.7 9.5 6.2 10.1 9.1
0
5
10
15
20
25
30
35
40
45Yi
eld
(qtl/
ha)
Source : ICAR - All India Coordinated Research Projects on Pearl Millet, Jodhpur
Pulses3.21 In case of tur, realized yield varied from 9.2 qtl/ha in Odisha to 20.9 qtl/ha in Bihar
as per data presented in Chart 3.14, while State average yield varied from 8.1 qtl/ha in Karnataka to 15.3 qtl/ha in Bihar. Bihar ranked the first having the highest potential yield of 25.1 qtl/ha, the highest realized yield of 20.9 qtl/ha and highest State average of 15.3 qtl/ha, that indicates good future prospects for improving tur production in Bihar. As far as yield gap is concerned, Karnataka, the largest producer of tur, had a yield gap (A) of 12.9 percent and yield gap (B) of 25.7 percent. Maharashtra, which is the second largest producer of tur, had comparatively low yield gap (A) of 3.9 percent and yield gap (B) of 22 percent. Among the major States, yield gap (A) was the highest in Bihar (26.8%) and yield gap (B) was the highest in Telangana (40.5%).
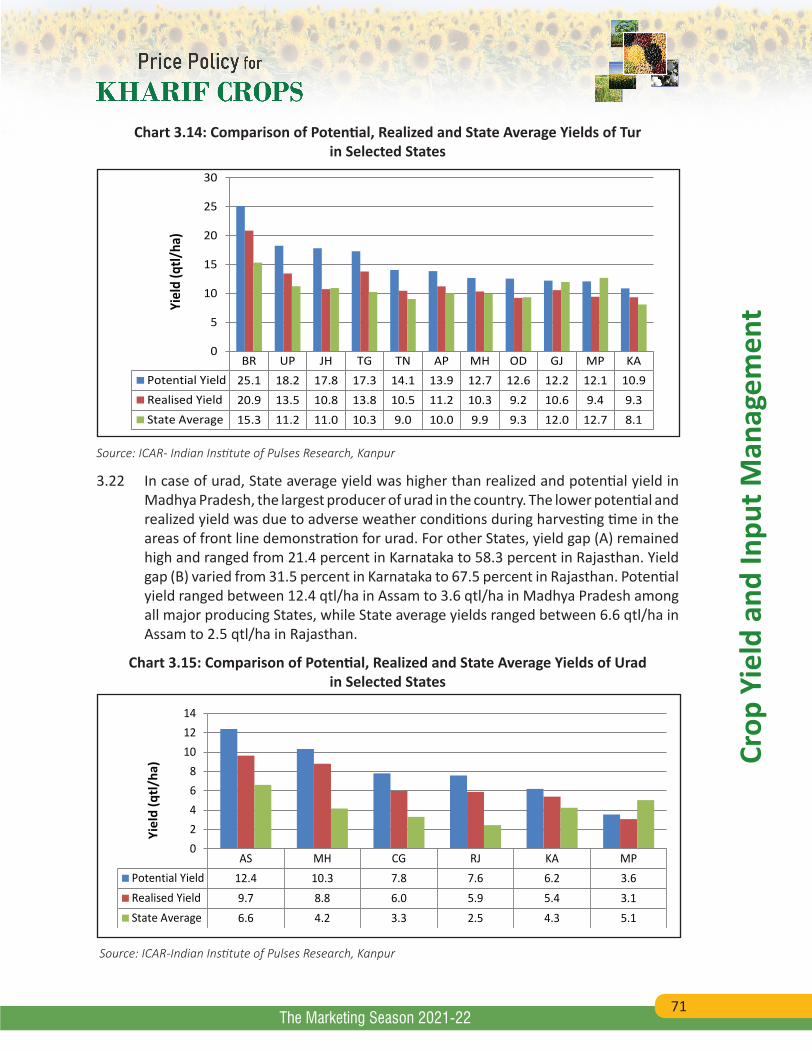
71
Crop
Yie
ld a
nd In
put M
anag
emen
t
The Marketing Season 2021-22
Chart 3.14: Comparison of Potential, Realized and State Average Yields of Tur in Selected States
BR UP JH TG TN AP MH OD GJ MP KAPotential Yield 25.1 18.2 17.8 17.3 14.1 13.9 12.7 12.6 12.2 12.1 10.9Realised Yield 20.9 13.5 10.8 13.8 10.5 11.2 10.3 9.2 10.6 9.4 9.3State Average 15.3 11.2 11.0 10.3 9.0 10.0 9.9 9.3 12.0 12.7 8.1
0
5
10
15
20
25
30Yi
eld
(qtl/
ha)
Source: ICAR- Indian Institute of Pulses Research, Kanpur
3.22 In case of urad, State average yield was higher than realized and potential yield in Madhya Pradesh, the largest producer of urad in the country. The lower potential and realized yield was due to adverse weather conditions during harvesting time in the areas of front line demonstration for urad. For other States, yield gap (A) remained high and ranged from 21.4 percent in Karnataka to 58.3 percent in Rajasthan. Yield gap (B) varied from 31.5 percent in Karnataka to 67.5 percent in Rajasthan. Potential yield ranged between 12.4 qtl/ha in Assam to 3.6 qtl/ha in Madhya Pradesh among all major producing States, while State average yields ranged between 6.6 qtl/ha in Assam to 2.5 qtl/ha in Rajasthan.
Chart 3.15: Comparison of Potential, Realized and State Average Yields of Urad in Selected States
AS MH CG RJ KA MPPotential Yield 12.4 10.3 7.8 7.6 6.2 3.6Realised Yield 9.7 8.8 6.0 5.9 5.4 3.1State Average 6.6 4.2 3.3 2.5 4.3 5.1
02468
101214
Yiel
d (q
tl/ha
)
Source: ICAR-Indian Institute of Pulses Research, Kanpur
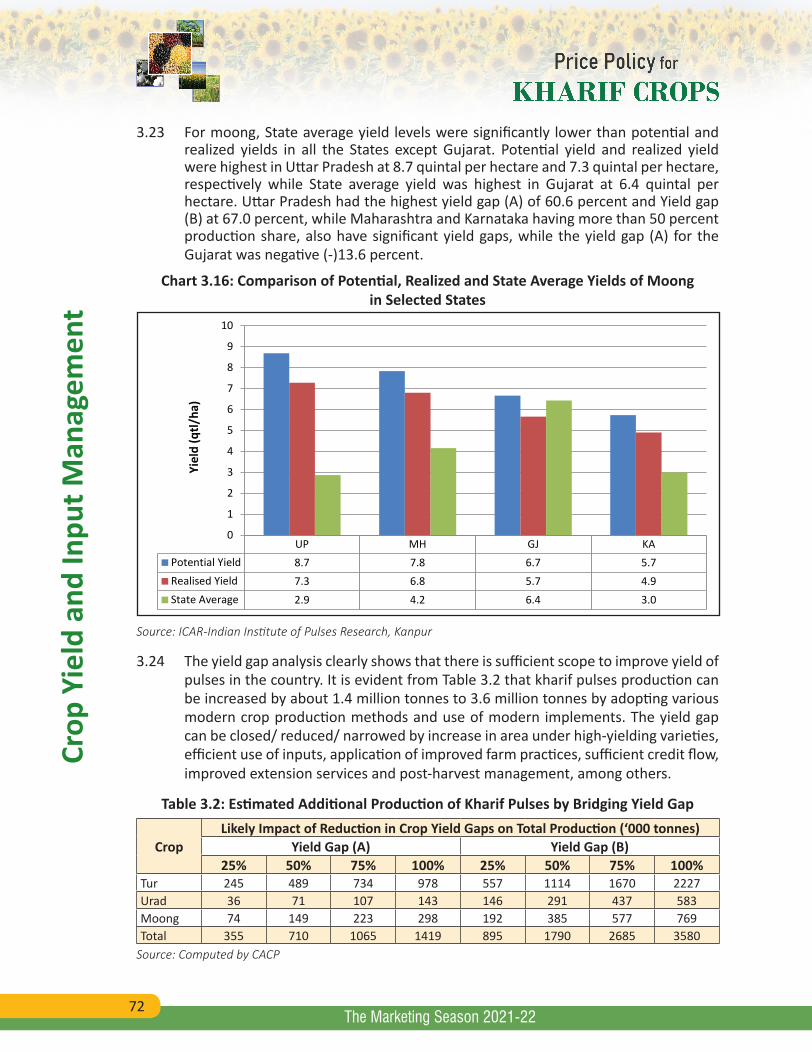
72
Crop
Yie
ld a
nd In
put M
anag
emen
t
The Marketing Season 2021-22
3.23 For moong, State average yield levels were significantly lower than potential and realized yields in all the States except Gujarat. Potential yield and realized yield were highest in Uttar Pradesh at 8.7 quintal per hectare and 7.3 quintal per hectare, respectively while State average yield was highest in Gujarat at 6.4 quintal per hectare. Uttar Pradesh had the highest yield gap (A) of 60.6 percent and Yield gap (B) at 67.0 percent, while Maharashtra and Karnataka having more than 50 percent production share, also have significant yield gaps, while the yield gap (A) for the Gujarat was negative (-)13.6 percent.
Chart 3.16: Comparison of Potential, Realized and State Average Yields of Moong in Selected States
UP MH GJ KAPotential Yield 8.7 7.8 6.7 5.7Realised Yield 7.3 6.8 5.7 4.9State Average 2.9 4.2 6.4 3.0
0
1
2
3
4
5
6
7
8
9
10
Yiel
d (q
tl/ha
)
Source: ICAR-Indian Institute of Pulses Research, Kanpur
3.24 The yield gap analysis clearly shows that there is sufficient scope to improve yield of pulses in the country. It is evident from Table 3.2 that kharif pulses production can be increased by about 1.4 million tonnes to 3.6 million tonnes by adopting various modern crop production methods and use of modern implements. The yield gap can be closed/ reduced/ narrowed by increase in area under high-yielding varieties, efficient use of inputs, application of improved farm practices, sufficient credit flow, improved extension services and post-harvest management, among others.
Table 3.2: Estimated Additional Production of Kharif Pulses by Bridging Yield Gap
CropLikely Impact of Reduction in Crop Yield Gaps on Total Production (‘000 tonnes)
Yield Gap (A) Yield Gap (B)25% 50% 75% 100% 25% 50% 75% 100%
Tur 245 489 734 978 557 1114 1670 2227Urad 36 71 107 143 146 291 437 583Moong 74 149 223 298 192 385 577 769Total 355 710 1065 1419 895 1790 2685 3580
Source: Computed by CACP
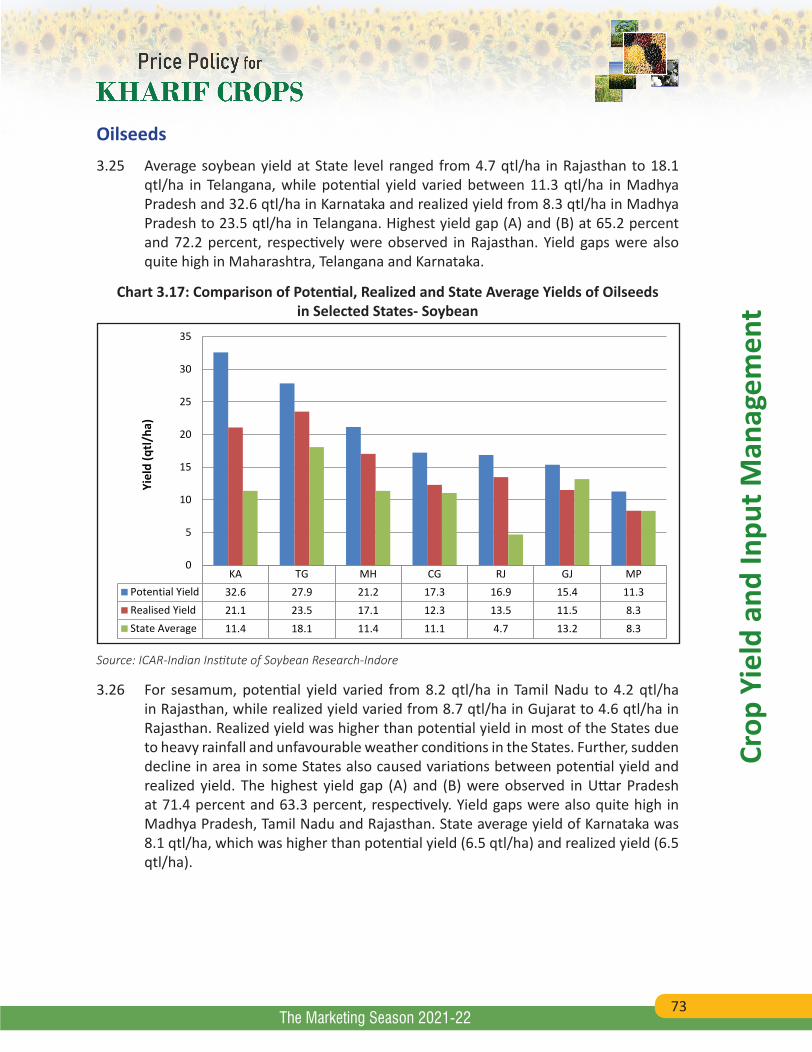
73
Crop
Yie
ld a
nd In
put M
anag
emen
t
The Marketing Season 2021-22
Oilseeds 3.25 Average soybean yield at State level ranged from 4.7 qtl/ha in Rajasthan to 18.1
qtl/ha in Telangana, while potential yield varied between 11.3 qtl/ha in Madhya Pradesh and 32.6 qtl/ha in Karnataka and realized yield from 8.3 qtl/ha in Madhya Pradesh to 23.5 qtl/ha in Telangana. Highest yield gap (A) and (B) at 65.2 percent and 72.2 percent, respectively were observed in Rajasthan. Yield gaps were also quite high in Maharashtra, Telangana and Karnataka.
Chart 3.17: Comparison of Potential, Realized and State Average Yields of Oilseeds in Selected States- Soybean
KA TG MH CG RJ GJ MPPotential Yield 32.6 27.9 21.2 17.3 16.9 15.4 11.3Realised Yield 21.1 23.5 17.1 12.3 13.5 11.5 8.3State Average 11.4 18.1 11.4 11.1 4.7 13.2 8.3
0
5
10
15
20
25
30
35
Yiel
d (q
tl/ha
)
Source: ICAR-Indian Institute of Soybean Research-Indore
3.26 For sesamum, potential yield varied from 8.2 qtl/ha in Tamil Nadu to 4.2 qtl/ha in Rajasthan, while realized yield varied from 8.7 qtl/ha in Gujarat to 4.6 qtl/ha in Rajasthan. Realized yield was higher than potential yield in most of the States due to heavy rainfall and unfavourable weather conditions in the States. Further, sudden decline in area in some States also caused variations between potential yield and realized yield. The highest yield gap (A) and (B) were observed in Uttar Pradesh at 71.4 percent and 63.3 percent, respectively. Yield gaps were also quite high in Madhya Pradesh, Tamil Nadu and Rajasthan. State average yield of Karnataka was 8.1 qtl/ha, which was higher than potential yield (6.5 qtl/ha) and realized yield (6.5 qtl/ha).
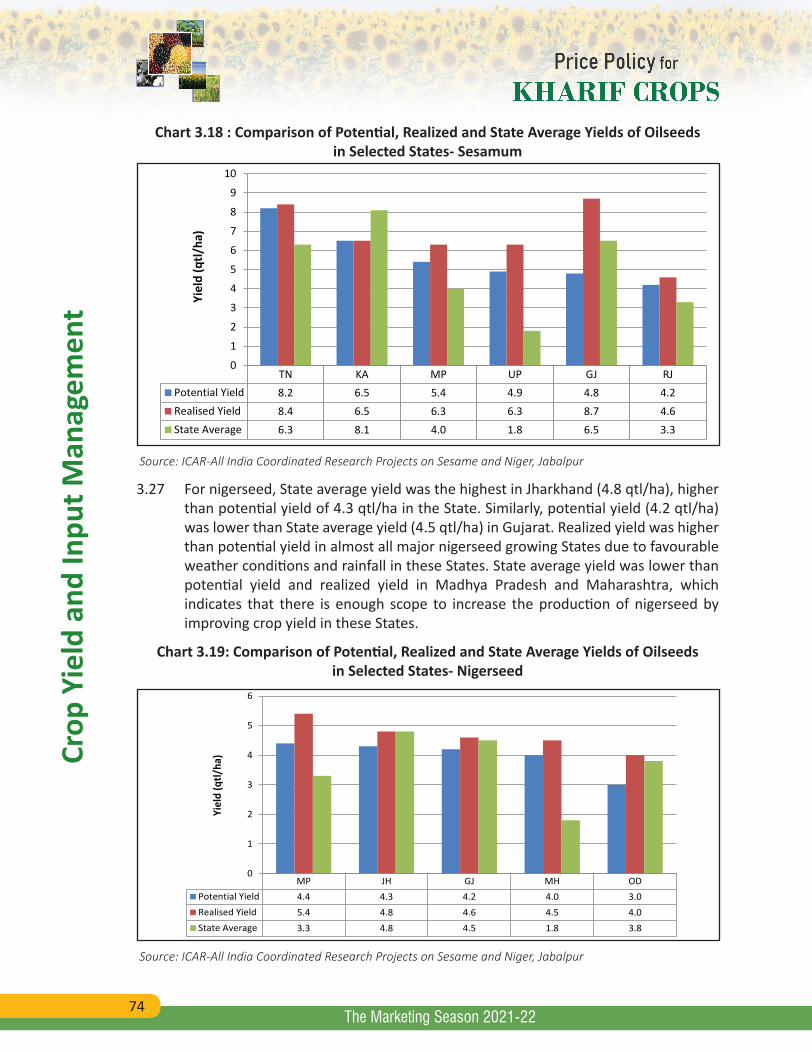
74
Crop
Yie
ld a
nd In
put M
anag
emen
t
The Marketing Season 2021-22
Chart 3.18 : Comparison of Potential, Realized and State Average Yields of Oilseeds in Selected States- Sesamum
TN KA MP UP GJ RJPotential Yield 8.2 6.5 5.4 4.9 4.8 4.2Realised Yield 8.4 6.5 6.3 6.3 8.7 4.6State Average 6.3 8.1 4.0 1.8 6.5 3.3
0
1
2
3
4
5
6
7
8
9
10
Yiel
d (q
tl/ha
)
Source: ICAR-All India Coordinated Research Projects on Sesame and Niger, Jabalpur
3.27 For nigerseed, State average yield was the highest in Jharkhand (4.8 qtl/ha), higher than potential yield of 4.3 qtl/ha in the State. Similarly, potential yield (4.2 qtl/ha) was lower than State average yield (4.5 qtl/ha) in Gujarat. Realized yield was higher than potential yield in almost all major nigerseed growing States due to favourable weather conditions and rainfall in these States. State average yield was lower than potential yield and realized yield in Madhya Pradesh and Maharashtra, which indicates that there is enough scope to increase the production of nigerseed by improving crop yield in these States.
Chart 3.19: Comparison of Potential, Realized and State Average Yields of Oilseeds in Selected States- Nigerseed
MP JH GJ MH ODPotential Yield 4.4 4.3 4.2 4.0 3.0Realised Yield 5.4 4.8 4.6 4.5 4.0State Average 3.3 4.8 4.5 1.8 3.8
0
1
2
3
4
5
6
Yiel
d (q
tl/ha
)
Source: ICAR-All India Coordinated Research Projects on Sesame and Niger, Jabalpur
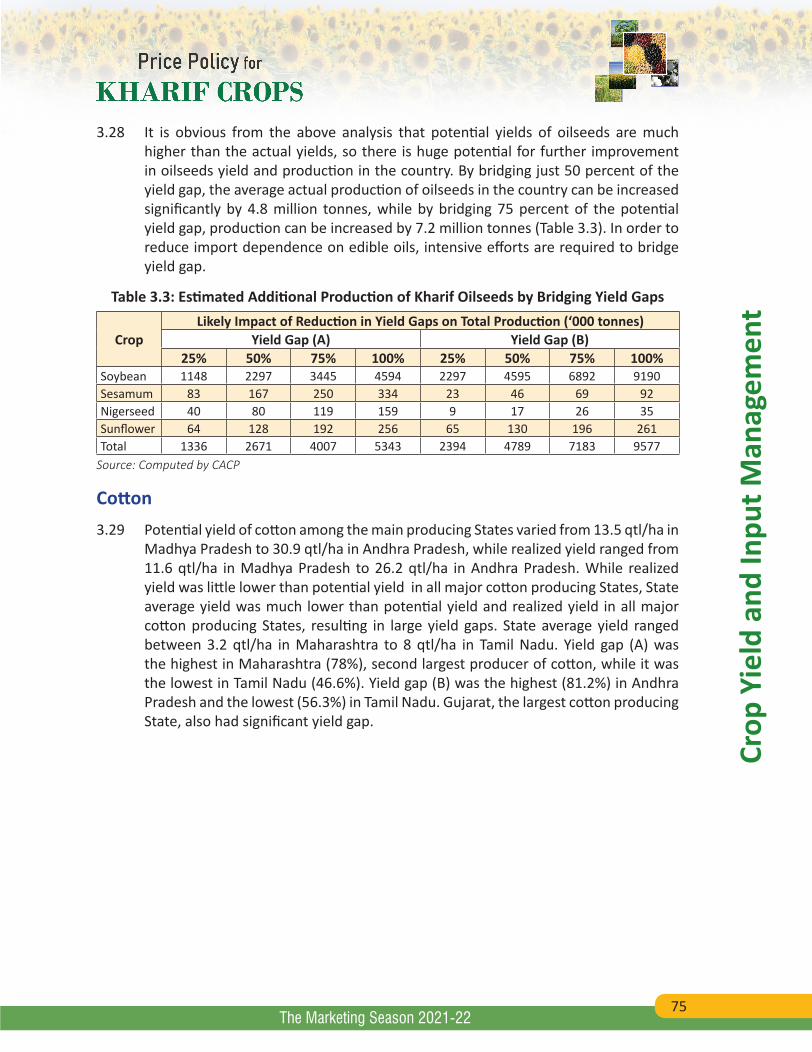
75
Crop
Yie
ld a
nd In
put M
anag
emen
t
The Marketing Season 2021-22
3.28 It is obvious from the above analysis that potential yields of oilseeds are much higher than the actual yields, so there is huge potential for further improvement in oilseeds yield and production in the country. By bridging just 50 percent of the yield gap, the average actual production of oilseeds in the country can be increased significantly by 4.8 million tonnes, while by bridging 75 percent of the potential yield gap, production can be increased by 7.2 million tonnes (Table 3.3). In order to reduce import dependence on edible oils, intensive efforts are required to bridge yield gap.
Table 3.3: Estimated Additional Production of Kharif Oilseeds by Bridging Yield Gaps
CropLikely Impact of Reduction in Yield Gaps on Total Production (‘000 tonnes)
Yield Gap (A) Yield Gap (B)25% 50% 75% 100% 25% 50% 75% 100%
Soybean 1148 2297 3445 4594 2297 4595 6892 9190Sesamum 83 167 250 334 23 46 69 92Nigerseed 40 80 119 159 9 17 26 35Sunflower 64 128 192 256 65 130 196 261Total 1336 2671 4007 5343 2394 4789 7183 9577
Source: Computed by CACP
Cotton3.29 Potential yield of cotton among the main producing States varied from 13.5 qtl/ha in
Madhya Pradesh to 30.9 qtl/ha in Andhra Pradesh, while realized yield ranged from 11.6 qtl/ha in Madhya Pradesh to 26.2 qtl/ha in Andhra Pradesh. While realized yield was little lower than potential yield in all major cotton producing States, State average yield was much lower than potential yield and realized yield in all major cotton producing States, resulting in large yield gaps. State average yield ranged between 3.2 qtl/ha in Maharashtra to 8 qtl/ha in Tamil Nadu. Yield gap (A) was the highest in Maharashtra (78%), second largest producer of cotton, while it was the lowest in Tamil Nadu (46.6%). Yield gap (B) was the highest (81.2%) in Andhra Pradesh and the lowest (56.3%) in Tamil Nadu. Gujarat, the largest cotton producing State, also had significant yield gap.
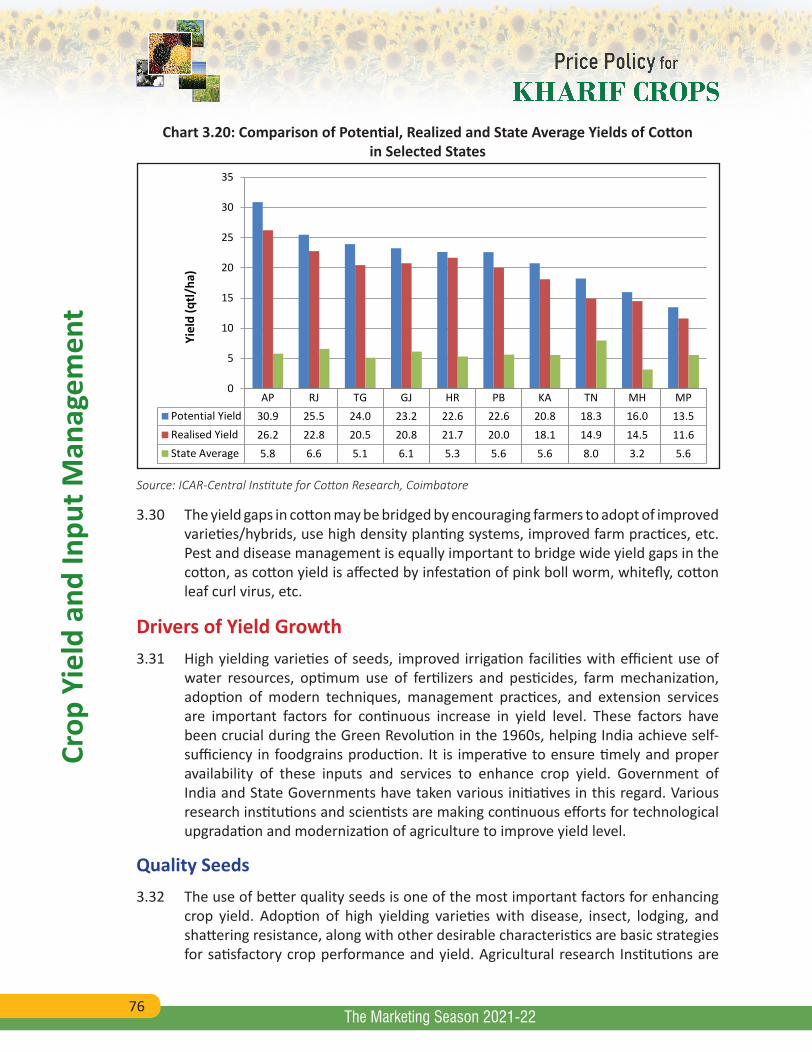
76
Crop
Yie
ld a
nd In
put M
anag
emen
t
The Marketing Season 2021-22
Chart 3.20: Comparison of Potential, Realized and State Average Yields of Cotton in Selected States
AP RJ TG GJ HR PB KA TN MH MPPotential Yield 30.9 25.5 24.0 23.2 22.6 22.6 20.8 18.3 16.0 13.5Realised Yield 26.2 22.8 20.5 20.8 21.7 20.0 18.1 14.9 14.5 11.6State Average 5.8 6.6 5.1 6.1 5.3 5.6 5.6 8.0 3.2 5.6
0
5
10
15
20
25
30
35Yi
eld
(qtl/
ha)
Source: ICAR-Central Institute for Cotton Research, Coimbatore
3.30 The yield gaps in cotton may be bridged by encouraging farmers to adopt of improved varieties/hybrids, use high density planting systems, improved farm practices, etc. Pest and disease management is equally important to bridge wide yield gaps in the cotton, as cotton yield is affected by infestation of pink boll worm, whitefly, cotton leaf curl virus, etc.
Drivers of Yield Growth 3.31 High yielding varieties of seeds, improved irrigation facilities with efficient use of
water resources, optimum use of fertilizers and pesticides, farm mechanization, adoption of modern techniques, management practices, and extension services are important factors for continuous increase in yield level. These factors have been crucial during the Green Revolution in the 1960s, helping India achieve self-sufficiency in foodgrains production. It is imperative to ensure timely and proper availability of these inputs and services to enhance crop yield. Government of India and State Governments have taken various initiatives in this regard. Various research institutions and scientists are making continuous efforts for technological upgradation and modernization of agriculture to improve yield level.
Quality Seeds 3.32 The use of better quality seeds is one of the most important factors for enhancing
crop yield. Adoption of high yielding varieties with disease, insect, lodging, and shattering resistance, along with other desirable characteristics are basic strategies for satisfactory crop performance and yield. Agricultural research Institutions are
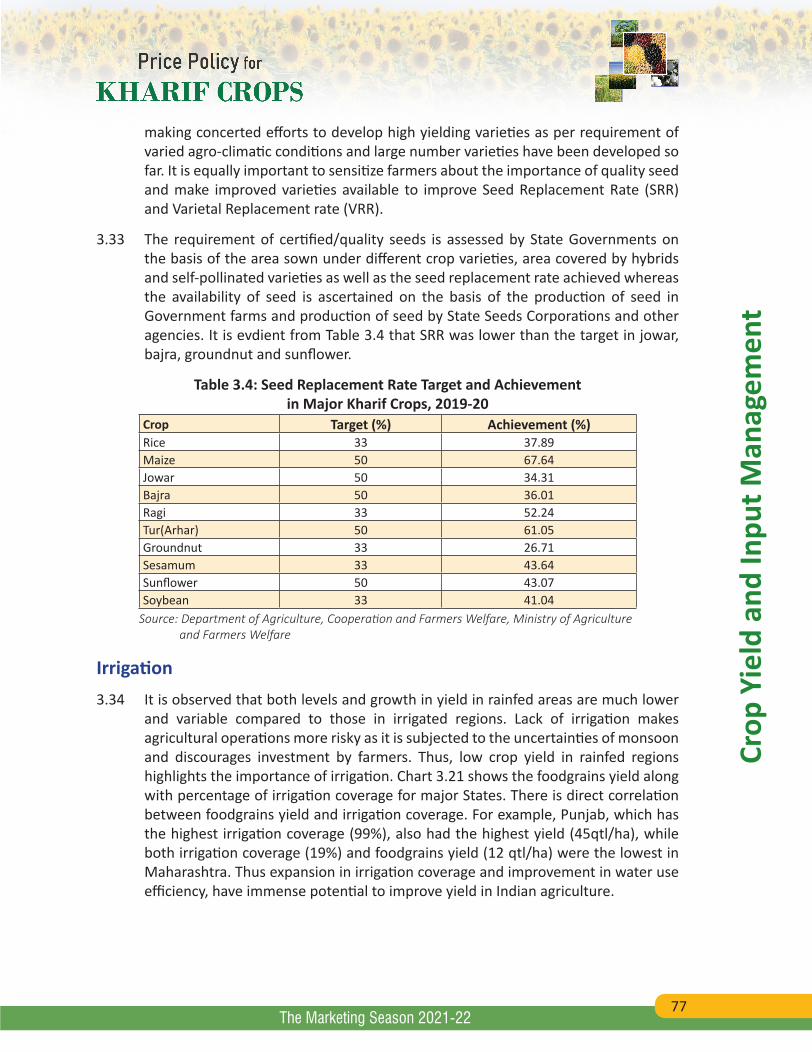
77
Crop
Yie
ld a
nd In
put M
anag
emen
t
The Marketing Season 2021-22
making concerted efforts to develop high yielding varieties as per requirement of varied agro-climatic conditions and large number varieties have been developed so far. It is equally important to sensitize farmers about the importance of quality seed and make improved varieties available to improve Seed Replacement Rate (SRR) and Varietal Replacement rate (VRR).
3.33 The requirement of certified/quality seeds is assessed by State Governments on the basis of the area sown under different crop varieties, area covered by hybrids and self-pollinated varieties as well as the seed replacement rate achieved whereas the availability of seed is ascertained on the basis of the production of seed in Government farms and production of seed by State Seeds Corporations and other agencies. It is evdient from Table 3.4 that SRR was lower than the target in jowar, bajra, groundnut and sunflower.
Table 3.4: Seed Replacement Rate Target and Achievement in Major Kharif Crops, 2019-20
Crop Target (%) Achievement (%)Rice 33 37.89Maize 50 67.64Jowar 50 34.31Bajra 50 36.01Ragi 33 52.24Tur(Arhar) 50 61.05Groundnut 33 26.71Sesamum 33 43.64Sunflower 50 43.07Soybean 33 41.04
Source: Department of Agriculture, Cooperation and Farmers Welfare, Ministry of Agriculture and Farmers Welfare
Irrigation3.34 It is observed that both levels and growth in yield in rainfed areas are much lower
and variable compared to those in irrigated regions. Lack of irrigation makes agricultural operations more risky as it is subjected to the uncertainties of monsoon and discourages investment by farmers. Thus, low crop yield in rainfed regions highlights the importance of irrigation. Chart 3.21 shows the foodgrains yield along with percentage of irrigation coverage for major States. There is direct correlation between foodgrains yield and irrigation coverage. For example, Punjab, which has the highest irrigation coverage (99%), also had the highest yield (45qtl/ha), while both irrigation coverage (19%) and foodgrains yield (12 qtl/ha) were the lowest in Maharashtra. Thus expansion in irrigation coverage and improvement in water use efficiency, have immense potential to improve yield in Indian agriculture.
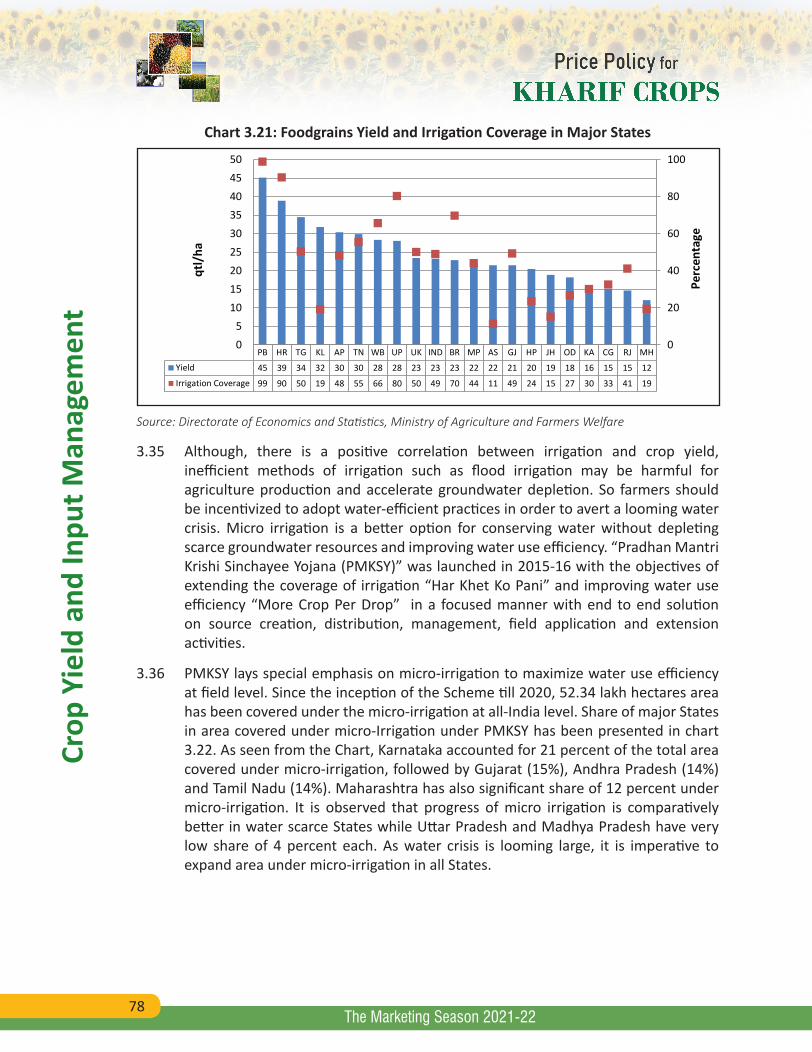
78
Crop
Yie
ld a
nd In
put M
anag
emen
t
The Marketing Season 2021-22
Chart 3.21: Foodgrains Yield and Irrigation Coverage in Major States
PB HR TG KL AP TN WB UP UK IND BR MP AS GJ HP JH OD KA CG RJ MH
Yield 45 39 34 32 30 30 28 28 23 23 23 22 22 21 20 19 18 16 15 15 12
Irrigation Coverage 99 90 50 19 48 55 66 80 50 49 70 44 11 49 24 15 27 30 33 41 19
0
20
40
60
80
100
05
101520253035404550
Perc
enta
ge
qtl/
ha
Source: Directorate of Economics and Statistics, Ministry of Agriculture and Farmers Welfare
3.35 Although, there is a positive correlation between irrigation and crop yield, inefficient methods of irrigation such as flood irrigation may be harmful for agriculture production and accelerate groundwater depletion. So farmers should be incentivized to adopt water-efficient practices in order to avert a looming water crisis. Micro irrigation is a better option for conserving water without depleting scarce groundwater resources and improving water use efficiency. “Pradhan Mantri Krishi Sinchayee Yojana (PMKSY)” was launched in 2015-16 with the objectives of extending the coverage of irrigation “Har Khet Ko Pani” and improving water use efficiency “More Crop Per Drop” in a focused manner with end to end solution on source creation, distribution, management, field application and extension activities.
3.36 PMKSY lays special emphasis on micro-irrigation to maximize water use efficiency at field level. Since the inception of the Scheme till 2020, 52.34 lakh hectares area has been covered under the micro-irrigation at all-India level. Share of major States in area covered under micro-Irrigation under PMKSY has been presented in chart 3.22. As seen from the Chart, Karnataka accounted for 21 percent of the total area covered under micro-irrigation, followed by Gujarat (15%), Andhra Pradesh (14%) and Tamil Nadu (14%). Maharashtra has also significant share of 12 percent under micro-irrigation. It is observed that progress of micro irrigation is comparatively better in water scarce States while Uttar Pradesh and Madhya Pradesh have very low share of 4 percent each. As water crisis is looming large, it is imperative to expand area under micro-irrigation in all States.
79
Crop
Yie
ld a
nd In
put M
anag
emen
t
The Marketing Season 2021-22
Chart 3.22: Share of Major States in Area Covered under Micro-Irrigation under PMKSY- More Crop Per Drop (2019-20)
KA21%
GJ15%
AP14%
TN14%
MH12%
Others6%
RJ6%
TG4%
MP4%
UP4%
Source: Department of Agriculture, Cooperation and Farmers Welfare, Ministry of Agriculture and Farmers Welfare
Fertilizers3.37 Fertilizer is one of the key inputs in crop production that has played a major role
in ensuring food security in India. Indian fertilizer industry has been reportedly facing the problem of raw material availability for production of fertilizers causing the import of both raw materials and finished products. Moreover, heavy subsidy on urea, custom duties on imported raw material and higher GST rate on certain inputs are other major constraints for the fertilizer industry in India that need to be rationalized.
3.38 On consumption part, India is second largest consumer of fertilizers in the world. However, per hectare fertilizer consumption is still low compared to most of the developed countries. Besides, fertilizer use in India is highly imbalanced. Nutrient consumption is skewed in favour of nitrogenous (N) fertilizers due to heavy subsidy on urea. The distortion in nutrient prices has created distortion in NPK consumption ratio. The trend in consumption of NPK fertilizers is given in Chart 3.23. As seen from the Chart, there was a significant increase in the consumption of phosphatic (5.0%) and potassic fertilizers (4.3%) compared with nitrogenous fertilizers (2.1%) between 2013-14 and 2019-20. As a result, NPK ratio improved from 8.0:2.7:1.0 in 2013-14 to 6.1:2.5:1.0 in 2017-18, but the ratio deteriorated to (7.1:2.8:1.0) in
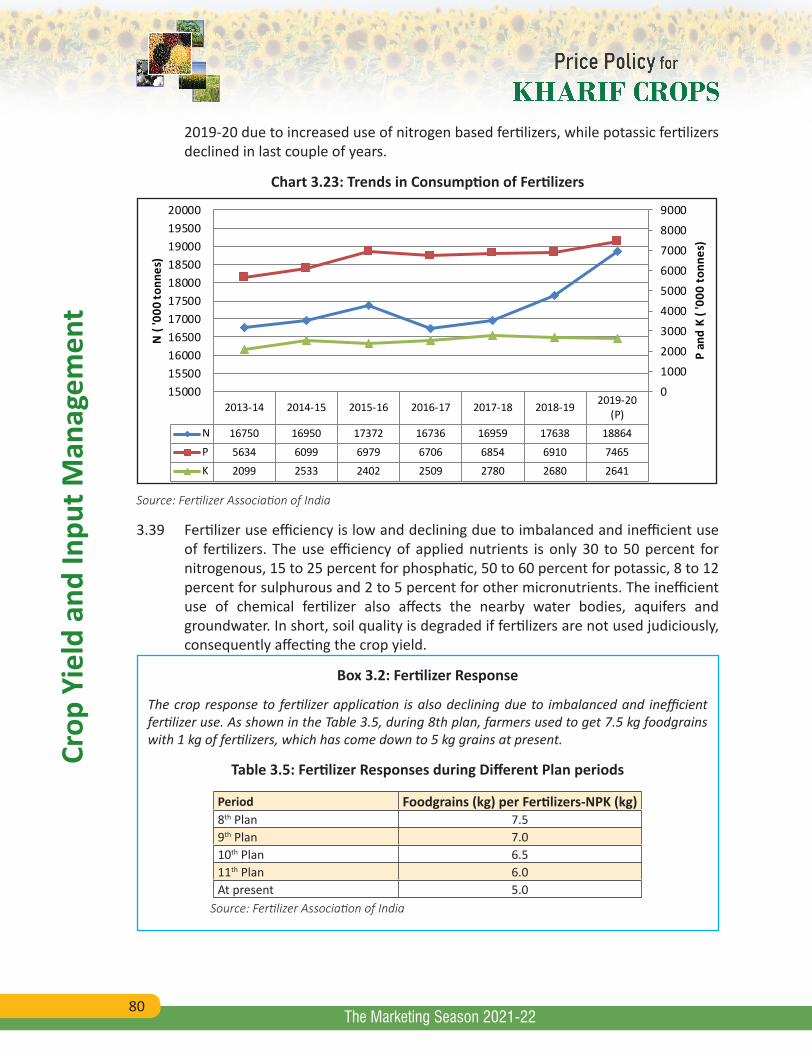
80
Crop
Yie
ld a
nd In
put M
anag
emen
t
The Marketing Season 2021-22
2019-20 due to increased use of nitrogen based fertilizers, while potassic fertilizers declined in last couple of years.
Chart 3.23: Trends in Consumption of Fertilizers
2013-14 2014-15 2015-16 2016-17 2017-18 2018-19 2019-20(P)
N 16750 16950 17372 16736 16959 17638 18864P 5634 6099 6979 6706 6854 6910 7465K 2099 2533 2402 2509 2780 2680 2641
0100020003000400050006000700080009000
1500015500160001650017000175001800018500190001950020000
P an
d K
( '00
0 to
nnes
)
N (
'000
tonn
es)
Source: Fertilizer Association of India
3.39 Fertilizer use efficiency is low and declining due to imbalanced and inefficient use of fertilizers. The use efficiency of applied nutrients is only 30 to 50 percent for nitrogenous, 15 to 25 percent for phosphatic, 50 to 60 percent for potassic, 8 to 12 percent for sulphurous and 2 to 5 percent for other micronutrients. The inefficient use of chemical fertilizer also affects the nearby water bodies, aquifers and groundwater. In short, soil quality is degraded if fertilizers are not used judiciously, consequently affecting the crop yield.
Box 3.2: Fertilizer Response
The crop response to fertilizer application is also declining due to imbalanced and inefficient fertilizer use. As shown in the Table 3.5, during 8th plan, farmers used to get 7.5 kg foodgrains with 1 kg of fertilizers, which has come down to 5 kg grains at present.
Table 3.5: Fertilizer Responses during Different Plan periods
Period Foodgrains (kg) per Fertilizers-NPK (kg)8th Plan 7.59th Plan 7.010th Plan 6.511th Plan 6.0At present 5.0
Source: Fertilizer Association of India
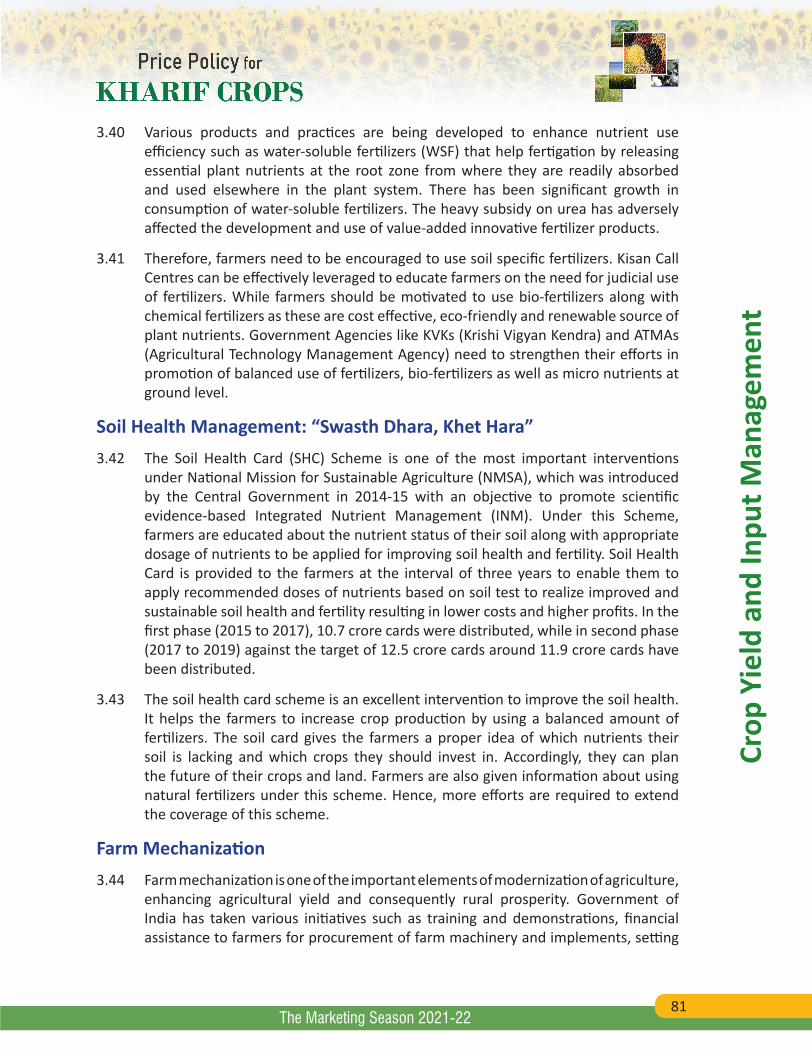
81
Crop
Yie
ld a
nd In
put M
anag
emen
t
The Marketing Season 2021-22
3.40 Various products and practices are being developed to enhance nutrient use efficiency such as water-soluble fertilizers (WSF) that help fertigation by releasing essential plant nutrients at the root zone from where they are readily absorbed and used elsewhere in the plant system. There has been significant growth in consumption of water-soluble fertilizers. The heavy subsidy on urea has adversely affected the development and use of value-added innovative fertilizer products.
3.41 Therefore, farmers need to be encouraged to use soil specific fertilizers. Kisan Call Centres can be effectively leveraged to educate farmers on the need for judicial use of fertilizers. While farmers should be motivated to use bio-fertilizers along with chemical fertilizers as these are cost effective, eco-friendly and renewable source of plant nutrients. Government Agencies like KVKs (Krishi Vigyan Kendra) and ATMAs (Agricultural Technology Management Agency) need to strengthen their efforts in promotion of balanced use of fertilizers, bio-fertilizers as well as micro nutrients at ground level.
Soil Health Management: “Swasth Dhara, Khet Hara”3.42 The Soil Health Card (SHC) Scheme is one of the most important interventions
under National Mission for Sustainable Agriculture (NMSA), which was introduced by the Central Government in 2014-15 with an objective to promote scientific evidence-based Integrated Nutrient Management (INM). Under this Scheme, farmers are educated about the nutrient status of their soil along with appropriate dosage of nutrients to be applied for improving soil health and fertility. Soil Health Card is provided to the farmers at the interval of three years to enable them to apply recommended doses of nutrients based on soil test to realize improved and sustainable soil health and fertility resulting in lower costs and higher profits. In the first phase (2015 to 2017), 10.7 crore cards were distributed, while in second phase (2017 to 2019) against the target of 12.5 crore cards around 11.9 crore cards have been distributed.
3.43 The soil health card scheme is an excellent intervention to improve the soil health. It helps the farmers to increase crop production by using a balanced amount of fertilizers. The soil card gives the farmers a proper idea of which nutrients their soil is lacking and which crops they should invest in. Accordingly, they can plan the future of their crops and land. Farmers are also given information about using natural fertilizers under this scheme. Hence, more efforts are required to extend the coverage of this scheme.
Farm Mechanization3.44 Farm mechanization is one of the important elements of modernization of agriculture,
enhancing agricultural yield and consequently rural prosperity. Government of India has taken various initiatives such as training and demonstrations, financial assistance to farmers for procurement of farm machinery and implements, setting
82
Crop
Yie
ld a
nd In
put M
anag
emen
t
The Marketing Season 2021-22
up custom hiring centres and financial assistance to small and marginal farmers for hiring machinery and implements in low mechanized regions to promote farm mechanization. Farm Machinery Training and Testing Institutes (FMTTIs), State Agricultural Universities (SAUs) and ICARs are working to ensure quality of farm machinery and implements.
3.45 Farm mechanization is required in the present context of shortage of labour and rising agricultural wages. Mechanization also enhances the yield of natural resources and reduces drudgery associated with various farm operations. In order to pay special emphasis towards promotion of agricultural mechanization in the country, Sub-Mission on Agricultural mechanization (SMAM) had been initiated since April, 2014. The mission was set up with the objectives of increasing the reach of farm mechanization to small and marginal farmers; promoting Custom Hiring Centers to help small and marginal farmers who could not procure machines due to high cost of individual ownership; creating hubs for hi-tech and high value farm equipments; creating awareness among stakeholders through demonstration and capacity building activities; ensuring performance testing and certification through testing centers. Promotion through training, testing and demonstration is the main component of this scheme. Financial assistance for procurement of agricultural machinery and equipment is also given under this scheme. Since the inception of the Scheme, an amount of of ₹ 4,354.65 crore has been released, 1,288.06 thousand subsidized machines have been distributed to individual farmers and 27.74 thousand Custom Hiring Centres/ Farm Machinery Banks have been established in the different part of the country. In 2020-21, budget of ₹1,033 crore have been provided for the scheme, out of which ₹ 553 crore have been released to the State Governments.
3.46 A Central Sector Scheme on ‘Promotion of Agricultural Mechanization for In-Situ Management of Crop Residue in the States of Punjab, Haryana, Uttar Pradesh and NCT of Delhi since April 2018. The scheme aims to promote in-situ management of crop residue by its retention and incorporation into the soil through the use of appropriate mechanization technology with a view to protecting the environment from air pollution and preventing loss of nutrients and micro- organisms caused by burning of crop residue. Since the inception of the Scheme, fund of ₹ 1,671.68 crore has been released, 70.53 thousand machines have been distributed under subsidy to individual farmers and 30.96 thousand Custom Hiring Centres / Farm Machinery Banks have been established in the different part of the country.
3.47 As far as coverage in term of types of machinery in Custom Hiring Centres is concerned, it includes machinery related to land development, tillage, seed bed preparations, crop protection, harvesting, threshing and value addition machinery appropriate for the area according to crops grown. The Custom Hiring Centres established under Crop residue management scheme include machine for management of crop residue such as Super Straw Management System for Combine harvester, happy seeder, super seeder, hydraulically reversible mould board plough, zero seed drill,
83
Crop
Yie
ld a
nd In
put M
anag
emen
t
The Marketing Season 2021-22
straw chopper, rotary slasher, rota vator, straw baler, crop ripper and ripper binder. In order to make effective use of machines available with the Custom Hiring Centres and farmers, Farm Machinery Solutions App - FARMS App has been developed, which connects the farmers with Custom Hiring Service Centers in their area. This mobile app encompasses a fair and transparent rental process while focusing on quality, dependability and timely delivery of the services. More than 55.03 lakh farmers have also been registered on this mobile app till 10th March, 2021. State-wise Number of Machinery distributed on Individual Ownership Basis and CHCs /Hitech Hubs/Farm Machinery Banks established since inception of SMAM and CRM (Crop Residue Management) Schemes is provided in Annex Table 3.1.
3.48 Though various initiatives have been taken for increasing the level of farm mechanization, still it stands at about 40 to 45 percent in India which is low as compared to other developed countries. Regional disparities have also been observed in the mechanization of agriculture. Uttar Pradesh, Haryana and Punjab have high level of farm mechanization while it is negligible in north- eastern States. Thus, progress of farm mechanization in India is slow due to small size of holdings in India and low income level of small and marginal farmers. Moreover, imposition of GST on farm implements and equipments has put extra burden on farmers as manufacturers would be compelled to increase the prices. More concerted efforts are required to increase the level of mechanization in India. There are many self-propelled machineries and equipments, which are suitable for small land holdings and can be used by even individual farmers. Farmers should be made aware about the benefits of farm mechanization and should be motivated through organizing more demonstrations and awareness programmes in this regard.
Agricultural Credit3.49 The trend of agriculture credit from different agencies has been presented in Chart
3.24. The flow of credit to agricultural sector has increased from ₹9.2 lakh crore in 2015-16 to ₹13.9 lakh crore in 2019-20. Impressive growth has been witnessed in agriculture credit flow from scheduled commercial bank (SCBs), which has increased from ₹6.4 lakh crore in 2015-16 to ₹10.7 lakh crore in 2019-20, an increase of 66.4 percent. The performance of cooperative Banks and Regional Rural banks (RRB) in this regard is unsatisfactory. The share of Cooperative banks in agriculture credit was 17 percent in 2015-16, which reduced to 11 percent in 2019-20 and share of Regional Rural Banks declined from 13 percent in 2015-16 to 12 percent in 2019-20.
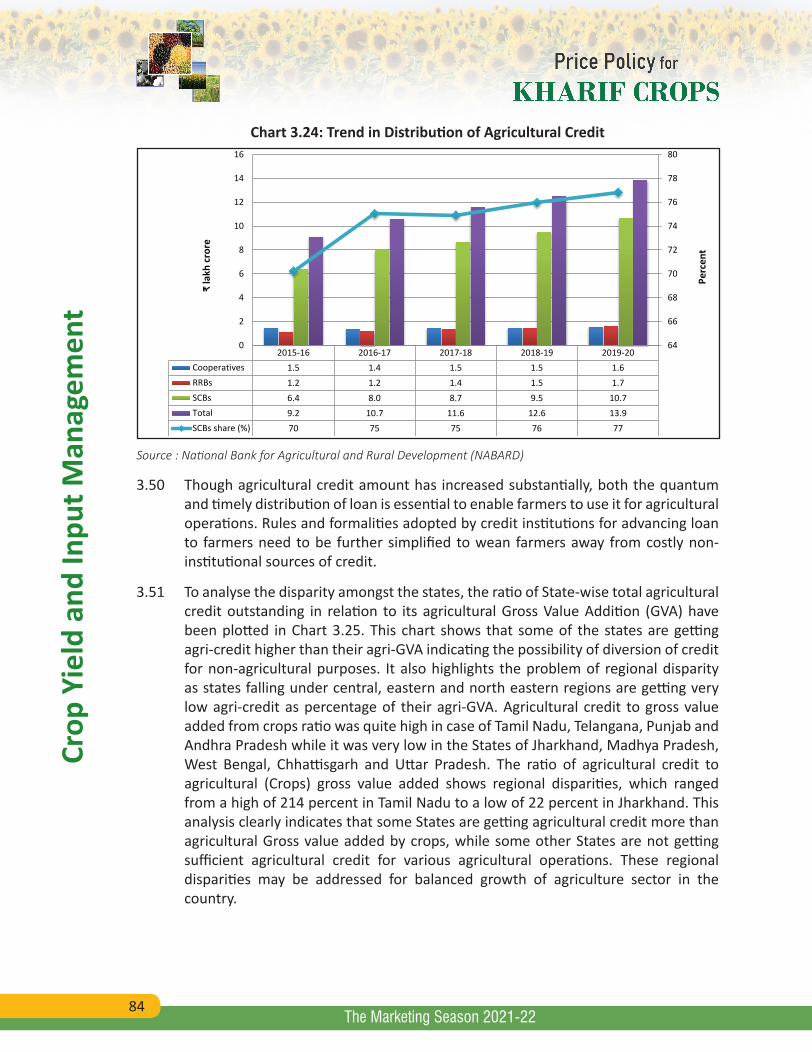
84
Crop
Yie
ld a
nd In
put M
anag
emen
t
The Marketing Season 2021-22
Chart 3.24: Trend in Distribution of Agricultural Credit
2015-16 2016-17 2017-18 2018-19 2019-20Cooperatives 1.5 1.4 1.5 1.5 1.6RRBs 1.2 1.2 1.4 1.5 1.7SCBs 6.4 8.0 8.7 9.5 10.7Total 9.2 10.7 11.6 12.6 13.9SCBs share (%) 70 75 75 76 77
64
66
68
70
72
74
76
78
80
0
2
4
6
8
10
12
14
16
Perc
ent
₹
lakh
cro
re
Source : National Bank for Agricultural and Rural Development (NABARD)
3.50 Though agricultural credit amount has increased substantially, both the quantum and timely distribution of loan is essential to enable farmers to use it for agricultural operations. Rules and formalities adopted by credit institutions for advancing loan to farmers need to be further simplified to wean farmers away from costly non-institutional sources of credit.
3.51 To analyse the disparity amongst the states, the ratio of State-wise total agricultural credit outstanding in relation to its agricultural Gross Value Addition (GVA) have been plotted in Chart 3.25. This chart shows that some of the states are getting agri-credit higher than their agri-GVA indicating the possibility of diversion of credit for non-agricultural purposes. It also highlights the problem of regional disparity as states falling under central, eastern and north eastern regions are getting very low agri-credit as percentage of their agri-GVA. Agricultural credit to gross value added from crops ratio was quite high in case of Tamil Nadu, Telangana, Punjab and Andhra Pradesh while it was very low in the States of Jharkhand, Madhya Pradesh, West Bengal, Chhattisgarh and Uttar Pradesh. The ratio of agricultural credit to agricultural (Crops) gross value added shows regional disparities, which ranged from a high of 214 percent in Tamil Nadu to a low of 22 percent in Jharkhand. This analysis clearly indicates that some States are getting agricultural credit more than agricultural Gross value added by crops, while some other States are not getting sufficient agricultural credit for various agricultural operations. These regional disparities may be addressed for balanced growth of agriculture sector in the country.
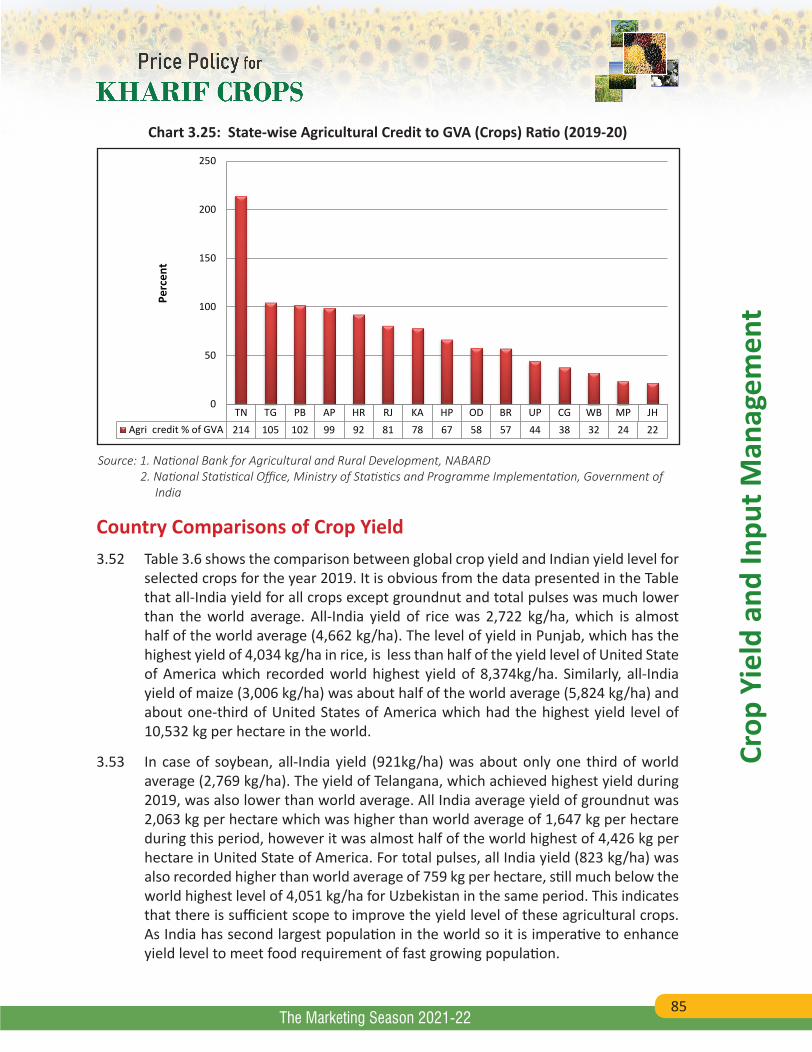
85
Crop
Yie
ld a
nd In
put M
anag
emen
t
The Marketing Season 2021-22
Chart 3.25: State-wise Agricultural Credit to GVA (Crops) Ratio (2019-20)
TN TG PB AP HR RJ KA HP OD BR UP CG WB MP JHAgri credit % of GVA 214 105 102 99 92 81 78 67 58 57 44 38 32 24 22
0
50
100
150
200
250 P
erce
nt
Source: 1. National Bank for Agricultural and Rural Development, NABARD 2. National Statistical Office, Ministry of Statistics and Programme Implementation, Government of
India
Country Comparisons of Crop Yield3.52 Table 3.6 shows the comparison between global crop yield and Indian yield level for
selected crops for the year 2019. It is obvious from the data presented in the Table that all-India yield for all crops except groundnut and total pulses was much lower than the world average. All-India yield of rice was 2,722 kg/ha, which is almost half of the world average (4,662 kg/ha). The level of yield in Punjab, which has the highest yield of 4,034 kg/ha in rice, is less than half of the yield level of United State of America which recorded world highest yield of 8,374kg/ha. Similarly, all-India yield of maize (3,006 kg/ha) was about half of the world average (5,824 kg/ha) and about one-third of United States of America which had the highest yield level of 10,532 kg per hectare in the world.
3.53 In case of soybean, all-India yield (921kg/ha) was about only one third of world average (2,769 kg/ha). The yield of Telangana, which achieved highest yield during 2019, was also lower than world average. All India average yield of groundnut was 2,063 kg per hectare which was higher than world average of 1,647 kg per hectare during this period, however it was almost half of the world highest of 4,426 kg per hectare in United State of America. For total pulses, all India yield (823 kg/ha) was also recorded higher than world average of 759 kg per hectare, still much below the world highest level of 4,051 kg/ha for Uzbekistan in the same period. This indicates that there is sufficient scope to improve the yield level of these agricultural crops. As India has second largest population in the world so it is imperative to enhance yield level to meet food requirement of fast growing population.
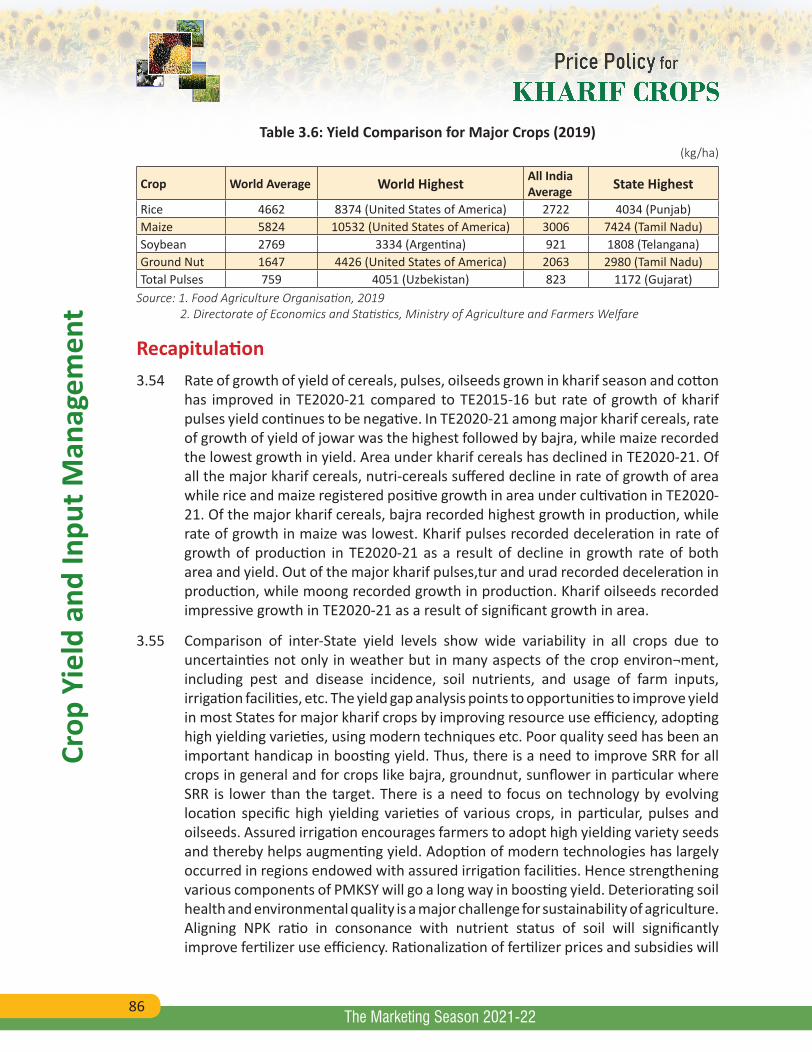
86
Crop
Yie
ld a
nd In
put M
anag
emen
t
The Marketing Season 2021-22
Table 3.6: Yield Comparison for Major Crops (2019)(kg/ha)
Crop World Average World Highest All India Average State Highest
Rice 4662 8374 (United States of America) 2722 4034 (Punjab)Maize 5824 10532 (United States of America) 3006 7424 (Tamil Nadu)Soybean 2769 3334 (Argentina) 921 1808 (Telangana)Ground Nut 1647 4426 (United States of America) 2063 2980 (Tamil Nadu)Total Pulses 759 4051 (Uzbekistan) 823 1172 (Gujarat)
Source: 1. Food Agriculture Organisation, 2019 2. Directorate of Economics and Statistics, Ministry of Agriculture and Farmers Welfare
Recapitulation3.54 Rate of growth of yield of cereals, pulses, oilseeds grown in kharif season and cotton
has improved in TE2020-21 compared to TE2015-16 but rate of growth of kharif pulses yield continues to be negative. In TE2020-21 among major kharif cereals, rate of growth of yield of jowar was the highest followed by bajra, while maize recorded the lowest growth in yield. Area under kharif cereals has declined in TE2020-21. Of all the major kharif cereals, nutri-cereals suffered decline in rate of growth of area while rice and maize registered positive growth in area under cultivation in TE2020-21. Of the major kharif cereals, bajra recorded highest growth in production, while rate of growth in maize was lowest. Kharif pulses recorded deceleration in rate of growth of production in TE2020-21 as a result of decline in growth rate of both area and yield. Out of the major kharif pulses,tur and urad recorded deceleration in production, while moong recorded growth in production. Kharif oilseeds recorded impressive growth in TE2020-21 as a result of significant growth in area.
3.55 Comparison of inter-State yield levels show wide variability in all crops due to uncertainties not only in weather but in many aspects of the crop environ¬ment, including pest and disease incidence, soil nutrients, and usage of farm inputs, irrigation facilities, etc. The yield gap analysis points to opportunities to improve yield in most States for major kharif crops by improving resource use efficiency, adopting high yielding varieties, using modern techniques etc. Poor quality seed has been an important handicap in boosting yield. Thus, there is a need to improve SRR for all crops in general and for crops like bajra, groundnut, sunflower in particular where SRR is lower than the target. There is a need to focus on technology by evolving location specific high yielding varieties of various crops, in particular, pulses and oilseeds. Assured irrigation encourages farmers to adopt high yielding variety seeds and thereby helps augmenting yield. Adoption of modern technologies has largely occurred in regions endowed with assured irrigation facilities. Hence strengthening various components of PMKSY will go a long way in boosting yield. Deteriorating soil health and environmental quality is a major challenge for sustainability of agriculture. Aligning NPK ratio in consonance with nutrient status of soil will significantly improve fertilizer use efficiency. Rationalization of fertilizer prices and subsidies will
87
Crop
Yie
ld a
nd In
put M
anag
emen
t
The Marketing Season 2021-22
encourage farmers to adopt balanced fertilizer use based upon soil fertility, organic content, cropping pattern, etc. resulting in higher efficiency and crop yields. Sub-Mission on Agricultural Mechanization is good initiative to improve the level of farm mechanization in India, especially establishment of CHCs will expand the reach of farm mechanization to small and marginal farmers. As far as agricultural credit is concerned, there is urgent need to lessen the regional disparities for the balanced agricultural growth. Government should ensure timely and sufficient agricultural credit to perform different agricultural operations.
*****
88
Chap
ter 4
Chapter 4
The Marketing Season 2021-22
Trade Competitiveness of Indian Agriculture
4.1 Global economy saw an unprecedented disruption in 2020 owing to COVID-19 pandemic and subsequent lockdown to contain the spread of virus across the countries. As movement of people across the borders was severely curtailed, it led to disruptions in the supply-chains and demand shocks. These disruptions have further dampened the prospects of the global trade in goods and services after an event of trade war and protectionism in 2019. However, after considering the situation and its anticipated repercussion, agricultural trade from India reinforced India’s position as a valued and trusted partner across the globe. This chapter presents a comprehensive analysis of the performance and trends in India’s trade in major Kharif crops besides providing an overview of India’s trade policy and global outlook in agricultural trade.
Global Trade Performance4.2 According to World Trade Statistical Review 2020, world merchandise trade in 2019
registered a value of US$19.05 trillion, a decline of 3 percent over 2018. In the total merchandise exports in 2019, the share of agricultural commodities was 9.7 percent. The world merchandise exports increased on an average by 2.2 percent per year during 2008-2019 as compared to 3.1 percent growth in exports of agricultural products during the same period. The top ten exporters of agricultural products led by the European Union, the United States and Brazil accounted for about 69.5 percent of world exports in 2019. The highest increases in exports of agricultural products among the top ten exporters were recorded by Argentina (15%), and Mexico (3%) while Indonesia experienced the biggest decline (-8%), followed by Canada (-6%) and Brazil (-5%). As per UNCTAD, in 2020, world trade recorded a drop in value of output of about 9 percent, with trade in goods declining by about 6 percent and trade in services falling by about 16.5 percent. The effect of COVID-19 on global trade was most severe in the first half of 2020, with a decline in value of about 15 percent. Global trade recovered in Q3 and Q4 of 2020. While COVID-19 has affected world trade in some sectors significantly, but most of the agri-food sectors (with the exception of tobacco and beverages) have been stable or recorded some increase in Jan-Sep 2020 relative to Jan-Sep 2019.
89
Trad
e Co
mpe
titive
ness
of I
ndia
n Ag
ricul
ture
The Marketing Season 2021-22
India’s Agricultural Trade Performance4.3 India’s share in total world exports was 1.8 percent in 2019, while the share in world
agri-exports was 2.1 percent, valued at US$37.4 billion. The share of India in total world imports was 2.5 percent in 2019, whereas the share in agri-imports was 1.5 percent, valued at US$27.9 billion. India has improved its share in world agricultural exports from 1.7 percent in 2010 to 2.1 percent in 2019 and in world agricultural imports, from 1.3 percent to 1.5 percent during 2010-2019.
4.4 As per the data of Directorate General of Commercial Intelligence and Statistics (DGCIS), India exported agricultural commodities worth ₹262 thousand crore against agricultural imports of ₹169.7 thousand crore in the year 2019-20. While agricultural exports constituted about 11.8 percent of total export earning of the country, agricultural imports accounted for 5 percent of the total import bill of India in 2019-201. However, agricultural exports, which grew at an average annual rate of 8.4 percent during 2016-19, declined in 2019-20 by 7.6 percent over previous year. While the agricultural imports grew at the rate of 4.9 percent in the same year. However, in 2020-21 (Apr-Dec 2020), India’s total merchandise exports declined by about 15.5 percent year-on-year but agricultural exports registered growth of about 15.8 percent during the same period due to steep rise in global commodity prices. In contrast, agricultural imports declined by about 2.6 percent and led to increase in agricultural trade surplus from ₹62.8 thousand crore in Apr-Dec 2019 to ₹96.6 thousand crore in Apr-Dec 2020.
4.5 Chart 4.1 illustrates the composition of India’s agricultural exports and imports in 2019-20. It is seen therein that marine products emerged as the single largest commodity group of agricultural exports from India in 2019-20 with a share of 18.2 percent, followed by rice (17.3%), spices (9.8%) and meat and processed meat (9.1%). In these top four commodity groups, except spices which saw an increase in absolute value of export earnings, total exports earnings fell for rice (-15.8%)and meat (-10.3%) in 2019-20 as compared to previous year. Fall in rice exports in 2019-20 was mainly due to withdrawal of 5 percent tax incentive, provided to non-basmati rice under MEIS (Merchandise Exports from India Scheme) w.e.f 25th March, 2019. Fall in exports of meat and its processed products was mainly on account of sluggish global demand and cancelled orders, in the last quarter of 2019-20, which was due to COVID-19 scare. Sugar alone accounted for 5.3 percent of total agricultural exports and export earnings from sugar increased significantly by 46.8 percent in 2019-20 over the previous year. Among other major commodities in India’s export basket, share of cotton declined from 5.2 percent in 2018-19 to 2.9 percent in 2019-20, as the export value of the commodity nearly halved. Similarly, oil meals exports from India also fell by about 44 percent in 2019-20 over previous year and its share decreased from 3.7 percent in 2018-19 to 2.2 percent in total agri-exports in 2019-20.
1 The composition of agricultural products is as per Chart 4.1.
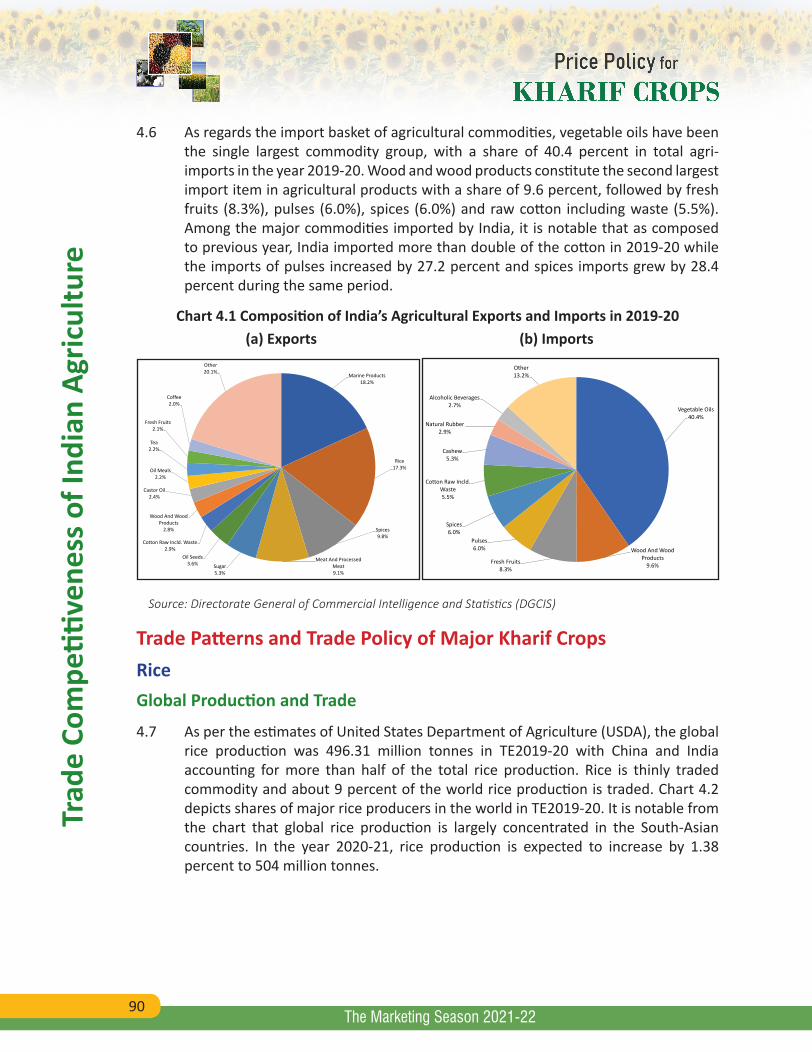
90
Trad
e Co
mpe
titive
ness
of I
ndia
n Ag
ricul
ture
The Marketing Season 2021-22
4.6 As regards the import basket of agricultural commodities, vegetable oils have been the single largest commodity group, with a share of 40.4 percent in total agri-imports in the year 2019-20. Wood and wood products constitute the second largest import item in agricultural products with a share of 9.6 percent, followed by fresh fruits (8.3%), pulses (6.0%), spices (6.0%) and raw cotton including waste (5.5%). Among the major commodities imported by India, it is notable that as composed to previous year, India imported more than double of the cotton in 2019-20 while the imports of pulses increased by 27.2 percent and spices imports grew by 28.4 percent during the same period.
Chart 4.1 Composition of India’s Agricultural Exports and Imports in 2019-20 (a) Exports (b) Imports
Marine Products 18.2%
Rice 17.3%
Spices 9.8%
Meat And Processed Meat 9.1%
Sugar 5.3%
Oil Seeds 3.6%
Cotton Raw Incld. Waste 2.9%
Wood And Wood Products
2.8%
Castor Oil 2.4%
Oil Meals 2.2%
Tea 2.2%
Fresh Fruits 2.1%
Coffee 2.0%
Other 20.1%
Vegetable Oils 40.4%
Wood And Wood Products
9.6% Fresh Fruits 8.3%
Pulses 6.0%
Spices 6.0%
Cotton Raw Incld. Waste 5.5%
Cashew 5.3%
Natural Rubber 2.9%
Alcoholic Beverages 2.7%
Other 13.2%
Source: Directorate General of Commercial Intelligence and Statistics (DGCIS)
Trade Patterns and Trade Policy of Major Kharif CropsRice Global Production and Trade
4.7 As per the estimates of United States Department of Agriculture (USDA), the global rice production was 496.31 million tonnes in TE2019-20 with China and India accounting for more than half of the total rice production. Rice is thinly traded commodity and about 9 percent of the world rice production is traded. Chart 4.2 depicts shares of major rice producers in the world in TE2019-20. It is notable from the chart that global rice production is largely concentrated in the South-Asian countries. In the year 2020-21, rice production is expected to increase by 1.38 percent to 504 million tonnes.
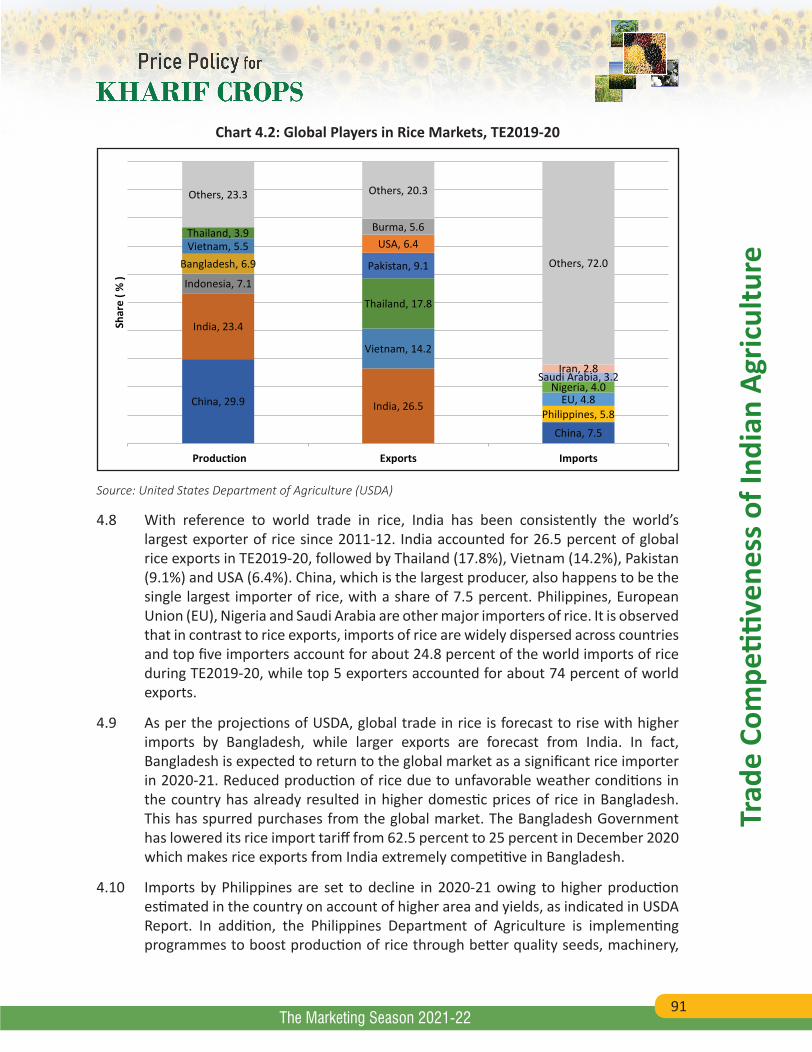
91
Trad
e Co
mpe
titive
ness
of I
ndia
n Ag
ricul
ture
The Marketing Season 2021-22
Chart 4.2: Global Players in Rice Markets, TE2019-20
China, 29.9
China, 7.5
India, 23.4
India, 26.5
Indonesia, 7.1
Bangladesh, 6.9 Vietnam, 5.5
Vietnam, 14.2
Thailand, 3.9
Thailand, 17.8
Pakistan, 9.1
USA, 6.4 Burma, 5.6
Philippines, 5.8 EU, 4.8
Nigeria, 4.0 Saudi Arabia, 3.2
Iran, 2.8
Others, 23.3 Others, 20.3
Others, 72.0
Production Exports Imports
Shar
e ( %
)
Source: United States Department of Agriculture (USDA)
4.8 With reference to world trade in rice, India has been consistently the world’s largest exporter of rice since 2011-12. India accounted for 26.5 percent of global rice exports in TE2019-20, followed by Thailand (17.8%), Vietnam (14.2%), Pakistan (9.1%) and USA (6.4%). China, which is the largest producer, also happens to be the single largest importer of rice, with a share of 7.5 percent. Philippines, European Union (EU), Nigeria and Saudi Arabia are other major importers of rice. It is observed that in contrast to rice exports, imports of rice are widely dispersed across countries and top five importers account for about 24.8 percent of the world imports of rice during TE2019-20, while top 5 exporters accounted for about 74 percent of world exports.
4.9 As per the projections of USDA, global trade in rice is forecast to rise with higher imports by Bangladesh, while larger exports are forecast from India. In fact, Bangladesh is expected to return to the global market as a significant rice importer in 2020-21. Reduced production of rice due to unfavorable weather conditions in the country has already resulted in higher domestic prices of rice in Bangladesh. This has spurred purchases from the global market. The Bangladesh Government has lowered its rice import tariff from 62.5 percent to 25 percent in December 2020 which makes rice exports from India extremely competitive in Bangladesh.
4.10 Imports by Philippines are set to decline in 2020-21 owing to higher production estimated in the country on account of higher area and yields, as indicated in USDA Report. In addition, the Philippines Department of Agriculture is implementing programmes to boost production of rice through better quality seeds, machinery,
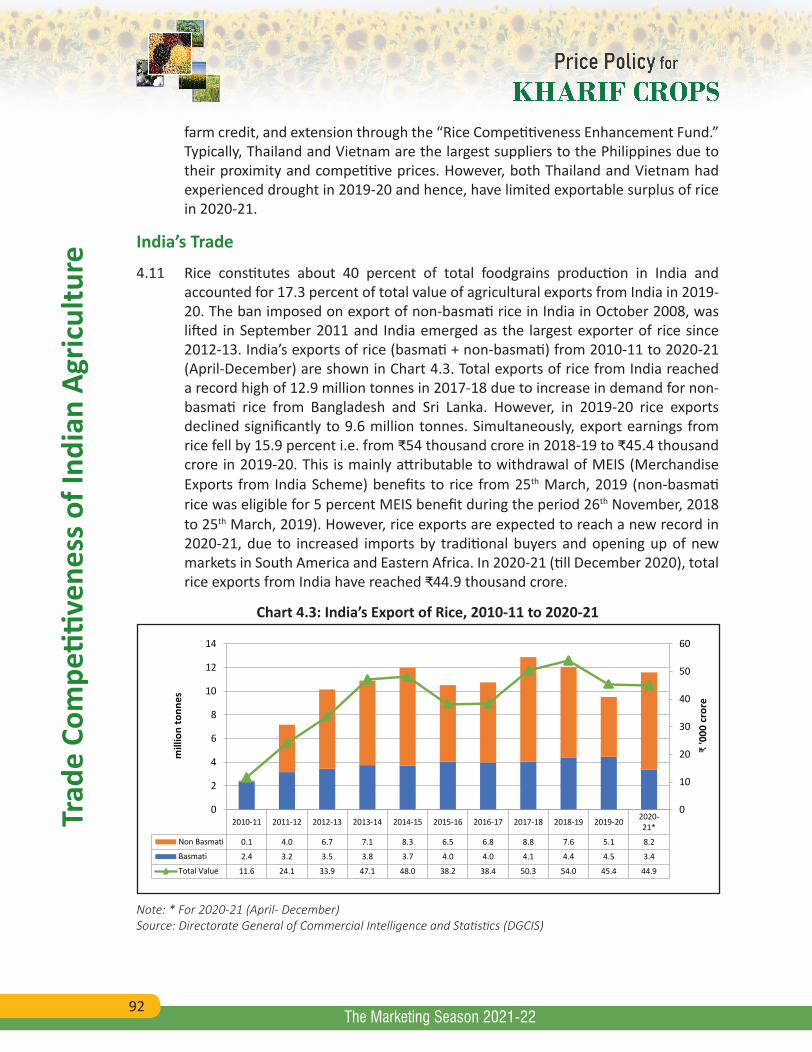
92
Trad
e Co
mpe
titive
ness
of I
ndia
n Ag
ricul
ture
The Marketing Season 2021-22
farm credit, and extension through the “Rice Competitiveness Enhancement Fund.” Typically, Thailand and Vietnam are the largest suppliers to the Philippines due to their proximity and competitive prices. However, both Thailand and Vietnam had experienced drought in 2019-20 and hence, have limited exportable surplus of rice in 2020-21.
India’s Trade
4.11 Rice constitutes about 40 percent of total foodgrains production in India and accounted for 17.3 percent of total value of agricultural exports from India in 2019-20. The ban imposed on export of non-basmati rice in India in October 2008, was lifted in September 2011 and India emerged as the largest exporter of rice since 2012-13. India’s exports of rice (basmati + non-basmati) from 2010-11 to 2020-21 (April-December) are shown in Chart 4.3. Total exports of rice from India reached a record high of 12.9 million tonnes in 2017-18 due to increase in demand for non-basmati rice from Bangladesh and Sri Lanka. However, in 2019-20 rice exports declined significantly to 9.6 million tonnes. Simultaneously, export earnings from rice fell by 15.9 percent i.e. from ₹54 thousand crore in 2018-19 to ₹45.4 thousand crore in 2019-20. This is mainly attributable to withdrawal of MEIS (Merchandise Exports from India Scheme) benefits to rice from 25th March, 2019 (non-basmati rice was eligible for 5 percent MEIS benefit during the period 26th November, 2018 to 25th March, 2019). However, rice exports are expected to reach a new record in 2020-21, due to increased imports by traditional buyers and opening up of new markets in South America and Eastern Africa. In 2020-21 (till December 2020), total rice exports from India have reached ₹44.9 thousand crore.
Chart 4.3: India’s Export of Rice, 2010-11 to 2020-21
2010-11 2011-12 2012-13 2013-14 2014-15 2015-16 2016-17 2017-18 2018-19 2019-20 2020-21*
Non Basmati 0.1 4.0 6.7 7.1 8.3 6.5 6.8 8.8 7.6 5.1 8.2
Basmati 2.4 3.2 3.5 3.8 3.7 4.0 4.0 4.1 4.4 4.5 3.4
Total Value 11.6 24.1 33.9 47.1 48.0 38.2 38.4 50.3 54.0 45.4 44.9
0
10
20
30
40
50
60
0
2
4
6
8
10
12
14
₹ '0
00 c
rore
mill
ion
tonn
es
Note: * For 2020-21 (April- December)Source: Directorate General of Commercial Intelligence and Statistics (DGCIS)
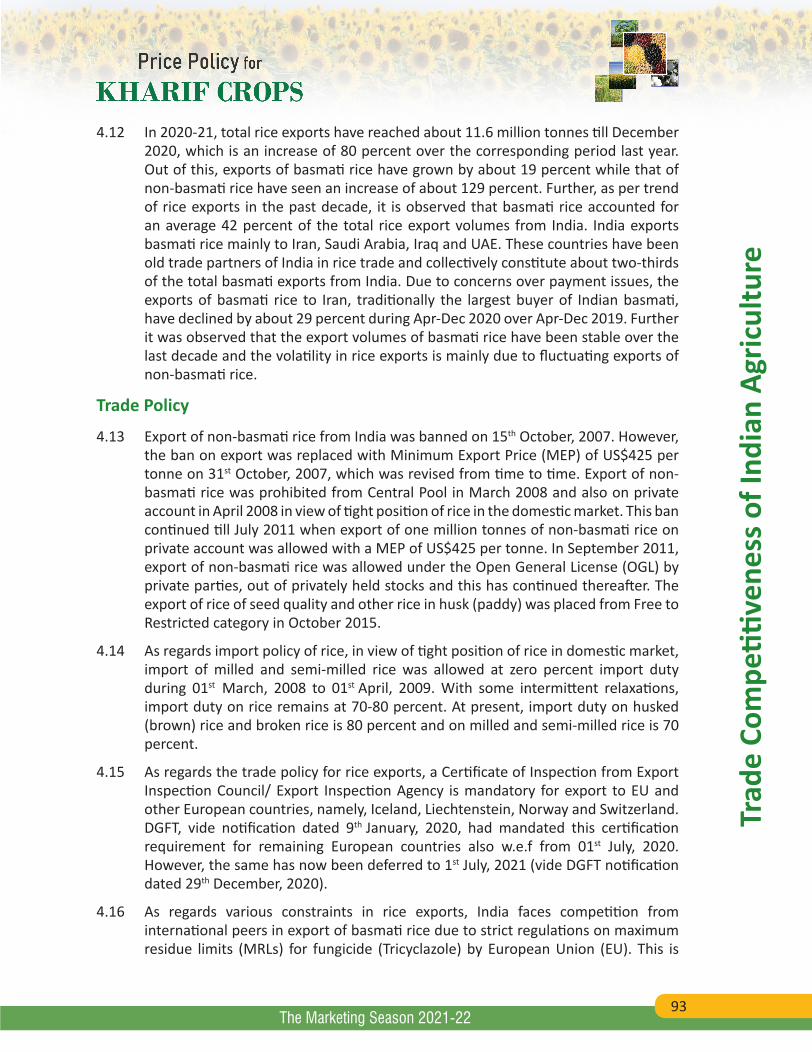
93
Trad
e Co
mpe
titive
ness
of I
ndia
n Ag
ricul
ture
The Marketing Season 2021-22
4.12 In 2020-21, total rice exports have reached about 11.6 million tonnes till December 2020, which is an increase of 80 percent over the corresponding period last year. Out of this, exports of basmati rice have grown by about 19 percent while that of non-basmati rice have seen an increase of about 129 percent. Further, as per trend of rice exports in the past decade, it is observed that basmati rice accounted for an average 42 percent of the total rice export volumes from India. India exports basmati rice mainly to Iran, Saudi Arabia, Iraq and UAE. These countries have been old trade partners of India in rice trade and collectively constitute about two-thirds of the total basmati exports from India. Due to concerns over payment issues, the exports of basmati rice to Iran, traditionally the largest buyer of Indian basmati, have declined by about 29 percent during Apr-Dec 2020 over Apr-Dec 2019. Further it was observed that the export volumes of basmati rice have been stable over the last decade and the volatility in rice exports is mainly due to fluctuating exports of non-basmati rice.
Trade Policy
4.13 Export of non-basmati rice from India was banned on 15th October, 2007. However, the ban on export was replaced with Minimum Export Price (MEP) of US$425 per tonne on 31st October, 2007, which was revised from time to time. Export of non-basmati rice was prohibited from Central Pool in March 2008 and also on private account in April 2008 in view of tight position of rice in the domestic market. This ban continued till July 2011 when export of one million tonnes of non-basmati rice on private account was allowed with a MEP of US$425 per tonne. In September 2011, export of non-basmati rice was allowed under the Open General License (OGL) by private parties, out of privately held stocks and this has continued thereafter. The export of rice of seed quality and other rice in husk (paddy) was placed from Free to Restricted category in October 2015.
4.14 As regards import policy of rice, in view of tight position of rice in domestic market, import of milled and semi-milled rice was allowed at zero percent import duty during 01st March, 2008 to 01st April, 2009. With some intermittent relaxations, import duty on rice remains at 70-80 percent. At present, import duty on husked (brown) rice and broken rice is 80 percent and on milled and semi-milled rice is 70 percent.
4.15 As regards the trade policy for rice exports, a Certificate of Inspection from Export Inspection Council/ Export Inspection Agency is mandatory for export to EU and other European countries, namely, Iceland, Liechtenstein, Norway and Switzerland. DGFT, vide notification dated 9th January, 2020, had mandated this certification requirement for remaining European countries also w.e.f from 01st July, 2020. However, the same has now been deferred to 1st July, 2021 (vide DGFT notification dated 29th December, 2020).
4.16 As regards various constraints in rice exports, India faces competition from international peers in export of basmati rice due to strict regulations on maximum residue limits (MRLs) for fungicide (Tricyclazole) by European Union (EU). This is
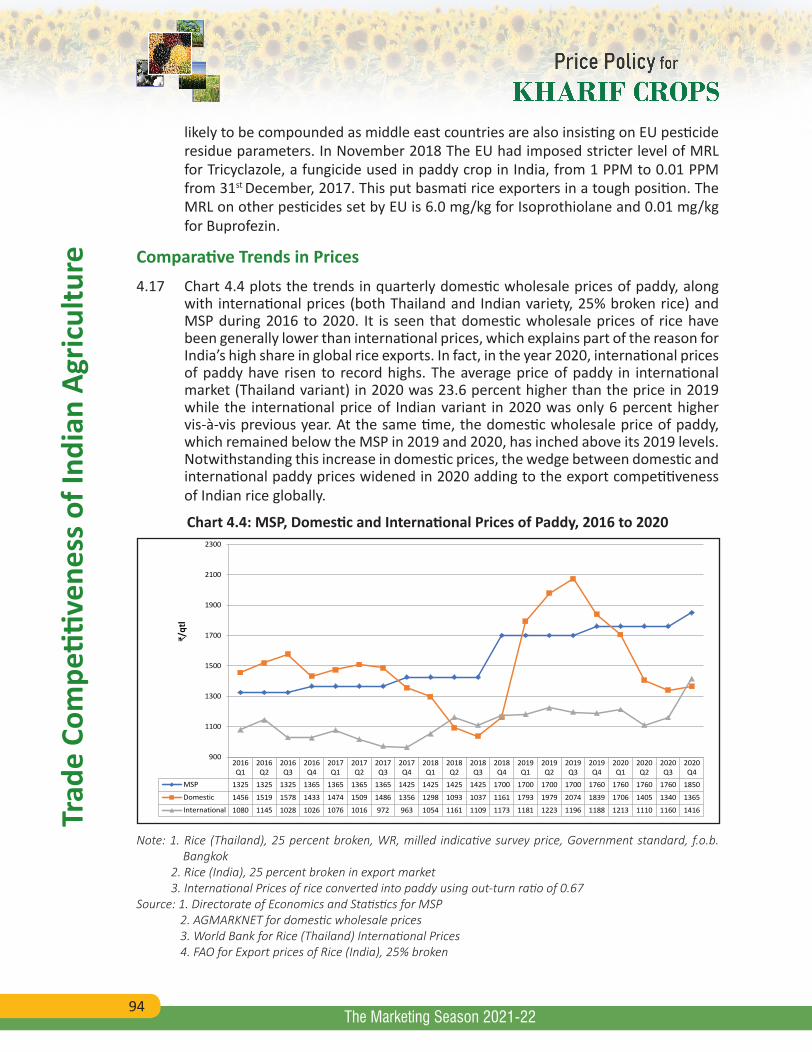
94
Trad
e Co
mpe
titive
ness
of I
ndia
n Ag
ricul
ture
The Marketing Season 2021-22
likely to be compounded as middle east countries are also insisting on EU pesticide residue parameters. In November 2018 The EU had imposed stricter level of MRL for Tricyclazole, a fungicide used in paddy crop in India, from 1 PPM to 0.01 PPM from 31st December, 2017. This put basmati rice exporters in a tough position. The MRL on other pesticides set by EU is 6.0 mg/kg for Isoprothiolane and 0.01 mg/kg for Buprofezin.
Comparative Trends in Prices4.17 Chart 4.4 plots the trends in quarterly domestic wholesale prices of paddy, along
with international prices (both Thailand and Indian variety, 25% broken rice) and MSP during 2016 to 2020. It is seen that domestic wholesale prices of rice have been generally lower than international prices, which explains part of the reason for India’s high share in global rice exports. In fact, in the year 2020, international prices of paddy have risen to record highs. The average price of paddy in international market (Thailand variant) in 2020 was 23.6 percent higher than the price in 2019 while the international price of Indian variant in 2020 was only 6 percent higher vis-à-vis previous year. At the same time, the domestic wholesale price of paddy, which remained below the MSP in 2019 and 2020, has inched above its 2019 levels. Notwithstanding this increase in domestic prices, the wedge between domestic and international paddy prices widened in 2020 adding to the export competitiveness of Indian rice globally.
Chart 4.4: MSP, Domestic and International Prices of Paddy, 2016 to 2020
2016Q1
2016Q2
2016Q3
2016Q4
2017Q1
2017Q2
2017Q3
2017Q4
2018Q1
2018Q2
2018Q3
2018Q4
2019Q1
2019Q2
2019Q3
2019Q4
2020Q1
2020Q2
2020Q3
2020Q4
MSP 1325 1325 1325 1365 1365 1365 1365 1425 1425 1425 1425 1700 1700 1700 1700 1760 1760 1760 1760 1850
Domestic 1456 1519 1578 1433 1474 1509 1486 1356 1298 1093 1037 1161 1793 1979 2074 1839 1706 1405 1340 1365
International 1080 1145 1028 1026 1076 1016 972 963 1054 1161 1109 1173 1181 1223 1196 1188 1213 1110 1160 1416
900
1100
1300
1500
1700
1900
2100
2300
₹/qt
l
Note: 1. Rice (Thailand), 25 percent broken, WR, milled indicative survey price, Government standard, f.o.b. Bangkok
2. Rice (India), 25 percent broken in export market 3. International Prices of rice converted into paddy using out-turn ratio of 0.67Source: 1. Directorate of Economics and Statistics for MSP 2. AGMARKNET for domestic wholesale prices 3. World Bank for Rice (Thailand) International Prices 4. FAO for Export prices of Rice (India), 25% broken
95
Trad
e Co
mpe
titive
ness
of I
ndia
n Ag
ricul
ture
The Marketing Season 2021-22
Maize
Global Production and Trade
4.18 As per USDA, global production of maize was 1,106.3 million tonnes in TE2019-20. USA has been the largest producer of maize (corn) with a share of 32.6 percent in world maize production in TE2019-20, followed by China (23.4%), Brazil (8.6%), EU (5.8%) and Argentina (4%). India (2.6%) was the seventh largest producer globally in TE2019-20 (Chart 4.5).
Chart 4.5: Global Players in Maize Market, TE2019-20
USA, 32.6 USA, 31.9
China, 23.4
China, 3.1
Brazil, 8.6
Brazil, 19.6
EU, 5.8
EU, 12.4
Argentina, 4.0
Argentina, 19.4
Ukraine, 2.9 Ukraine, 15.4 India, 2.6
Mexico, 2.5
Mexico, 9.9
Russia, 2.5
Japan, 9.5
South Korea, 6.5
Vietnam, 6.5
Egypt, 5.8
Iran, 5.0 Colombia, 3.4
Algeria, 2.8 Taiwan, 2.7
Others, 17.6 Others, 11.2
Others, 32.4
Production Exports Imports
Shar
e (%
)
Source: United States Department of Agriculture (USDA)
4.19 About 15 percent of the global maize production was traded in TE2019-20. The exports of maize are highly concentrated and top three exporters of maize, namely, USA (31.9%), Brazil (19.6%) and Argentina (19.4%) account for more than 70 percent of total exports (Chart 4.5). On the other hand, imports of maize are more dispersed. As seen in Chart 4.5, EU was the largest importer of maize in TE2019-20 with a share of 12.4 percent, followed by Mexico (9.9%), Japan (9.5%), Vietnam (6.5%) and South Korea (6.5%).
India’s Trade
4.20 Chart 4.6 shows the exports of maize from India, in value and volume terms, during the period 2010-11 to 2020-21 (till December 2020). Exports of maize from India increased substantially from 2010-11 to 2012-13 and reached an all-time high value of ₹7.1 thousand crore in 2012-13. However, in the second half of the last decade
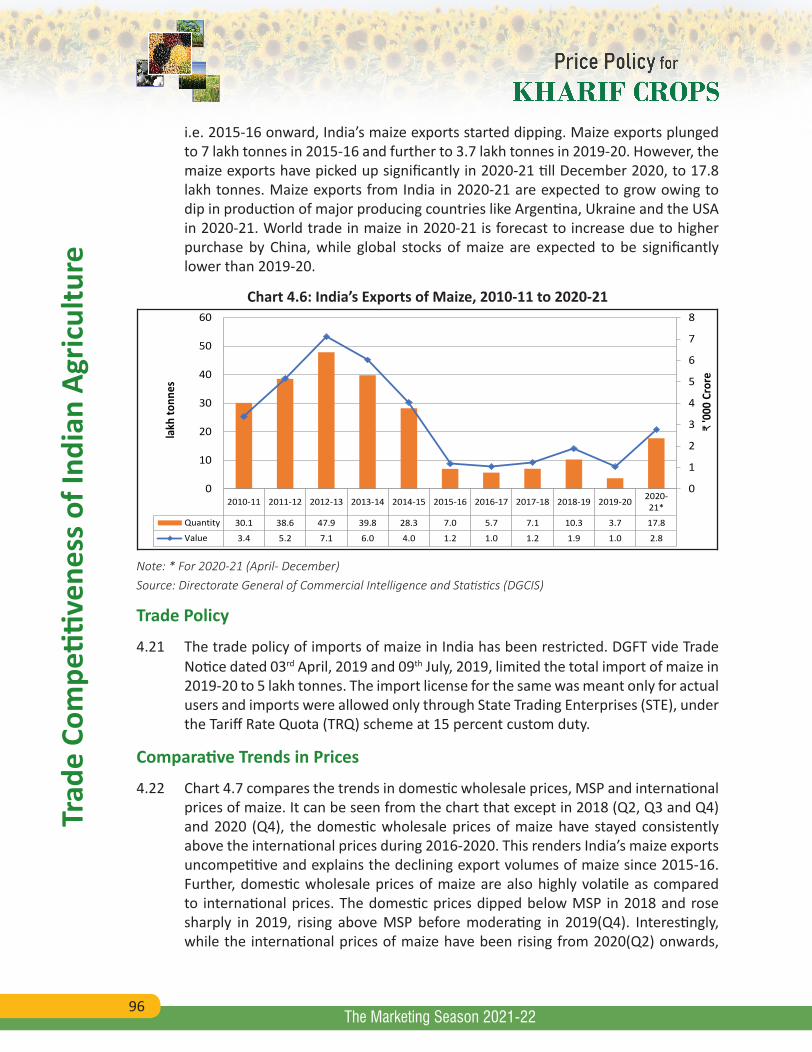
96
Trad
e Co
mpe
titive
ness
of I
ndia
n Ag
ricul
ture
The Marketing Season 2021-22
i.e. 2015-16 onward, India’s maize exports started dipping. Maize exports plunged to 7 lakh tonnes in 2015-16 and further to 3.7 lakh tonnes in 2019-20. However, the maize exports have picked up significantly in 2020-21 till December 2020, to 17.8 lakh tonnes. Maize exports from India in 2020-21 are expected to grow owing to dip in production of major producing countries like Argentina, Ukraine and the USA in 2020-21. World trade in maize in 2020-21 is forecast to increase due to higher purchase by China, while global stocks of maize are expected to be significantly lower than 2019-20.
Chart 4.6: India’s Exports of Maize, 2010-11 to 2020-21
2010-11 2011-12 2012-13 2013-14 2014-15 2015-16 2016-17 2017-18 2018-19 2019-20 2020-21*
Quantity 30.1 38.6 47.9 39.8 28.3 7.0 5.7 7.1 10.3 3.7 17.8
Value 3.4 5.2 7.1 6.0 4.0 1.2 1.0 1.2 1.9 1.0 2.8
0
1
2
3
4
5
6
7
8
0
10
20
30
40
50
60
₹ '0
00 C
rore
lakh
tonn
es
Note: * For 2020-21 (April- December)Source: Directorate General of Commercial Intelligence and Statistics (DGCIS)
Trade Policy
4.21 The trade policy of imports of maize in India has been restricted. DGFT vide Trade Notice dated 03rd April, 2019 and 09th July, 2019, limited the total import of maize in 2019-20 to 5 lakh tonnes. The import license for the same was meant only for actual users and imports were allowed only through State Trading Enterprises (STE), under the Tariff Rate Quota (TRQ) scheme at 15 percent custom duty.
Comparative Trends in Prices
4.22 Chart 4.7 compares the trends in domestic wholesale prices, MSP and international prices of maize. It can be seen from the chart that except in 2018 (Q2, Q3 and Q4) and 2020 (Q4), the domestic wholesale prices of maize have stayed consistently above the international prices during 2016-2020. This renders India’s maize exports uncompetitive and explains the declining export volumes of maize since 2015-16. Further, domestic wholesale prices of maize are also highly volatile as compared to international prices. The domestic prices dipped below MSP in 2018 and rose sharply in 2019, rising above MSP before moderating in 2019(Q4). Interestingly, while the international prices of maize have been rising from 2020(Q2) onwards,
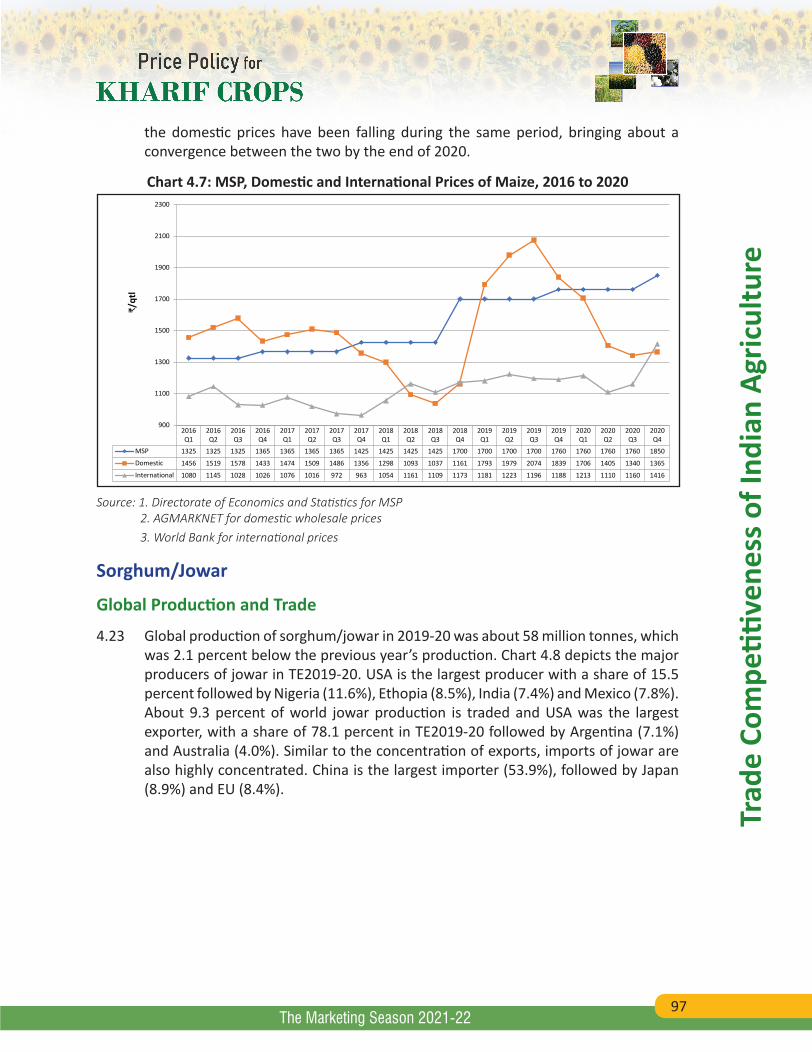
97
Trad
e Co
mpe
titive
ness
of I
ndia
n Ag
ricul
ture
The Marketing Season 2021-22
the domestic prices have been falling during the same period, bringing about a convergence between the two by the end of 2020.
Chart 4.7: MSP, Domestic and International Prices of Maize, 2016 to 2020
2016Q1
2016Q2
2016Q3
2016Q4
2017Q1
2017Q2
2017Q3
2017Q4
2018Q1
2018Q2
2018Q3
2018Q4
2019Q1
2019Q2
2019Q3
2019Q4
2020Q1
2020Q2
2020Q3
2020Q4
MSP 1325 1325 1325 1365 1365 1365 1365 1425 1425 1425 1425 1700 1700 1700 1700 1760 1760 1760 1760 1850
Domestic 1456 1519 1578 1433 1474 1509 1486 1356 1298 1093 1037 1161 1793 1979 2074 1839 1706 1405 1340 1365
International 1080 1145 1028 1026 1076 1016 972 963 1054 1161 1109 1173 1181 1223 1196 1188 1213 1110 1160 1416
900
1100
1300
1500
1700
1900
2100
2300
₹/qt
l
Source: 1. Directorate of Economics and Statistics for MSP 2. AGMARKNET for domestic wholesale prices 3. World Bank for international prices
Sorghum/Jowar
Global Production and Trade
4.23 Global production of sorghum/jowar in 2019-20 was about 58 million tonnes, which was 2.1 percent below the previous year’s production. Chart 4.8 depicts the major producers of jowar in TE2019-20. USA is the largest producer with a share of 15.5 percent followed by Nigeria (11.6%), Ethopia (8.5%), India (7.4%) and Mexico (7.8%). About 9.3 percent of world jowar production is traded and USA was the largest exporter, with a share of 78.1 percent in TE2019-20 followed by Argentina (7.1%) and Australia (4.0%). Similar to the concentration of exports, imports of jowar are also highly concentrated. China is the largest importer (53.9%), followed by Japan (8.9%) and EU (8.4%).
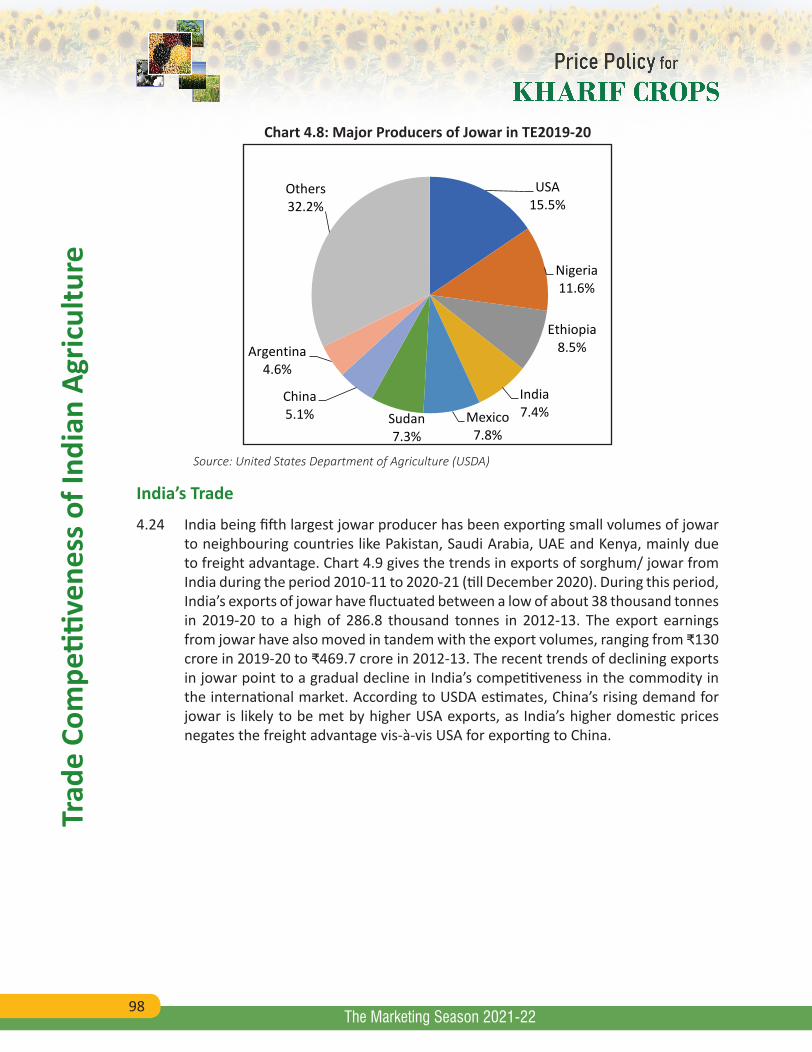
98
Trad
e Co
mpe
titive
ness
of I
ndia
n Ag
ricul
ture
The Marketing Season 2021-22
Chart 4.8: Major Producers of Jowar in TE2019-20
USA 15.5%
Nigeria 11.6%
Ethiopia 8.5%
India 7.4% Mexico
7.8% Sudan 7.3%
China 5.1%
Argentina 4.6%
Others 32.2%
Source: United States Department of Agriculture (USDA)
India’s Trade
4.24 India being fifth largest jowar producer has been exporting small volumes of jowar to neighbouring countries like Pakistan, Saudi Arabia, UAE and Kenya, mainly due to freight advantage. Chart 4.9 gives the trends in exports of sorghum/ jowar from India during the period 2010-11 to 2020-21 (till December 2020). During this period, India’s exports of jowar have fluctuated between a low of about 38 thousand tonnes in 2019-20 to a high of 286.8 thousand tonnes in 2012-13. The export earnings from jowar have also moved in tandem with the export volumes, ranging from ₹130 crore in 2019-20 to ₹469.7 crore in 2012-13. The recent trends of declining exports in jowar point to a gradual decline in India’s competitiveness in the commodity in the international market. According to USDA estimates, China’s rising demand for jowar is likely to be met by higher USA exports, as India’s higher domestic prices negates the freight advantage vis-à-vis USA for exporting to China.
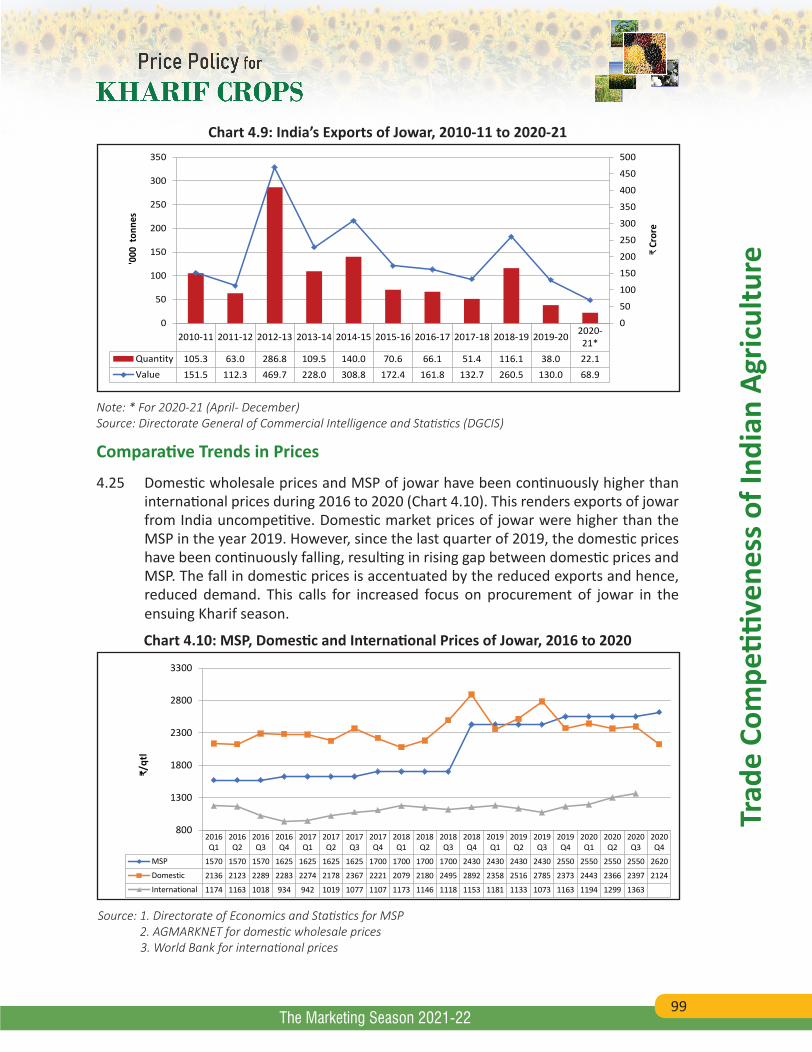
99
Trad
e Co
mpe
titive
ness
of I
ndia
n Ag
ricul
ture
The Marketing Season 2021-22
Chart 4.9: India’s Exports of Jowar, 2010-11 to 2020-21
2010-11 2011-12 2012-13 2013-14 2014-15 2015-16 2016-17 2017-18 2018-19 2019-20 2020-21*
Quantity 105.3 63.0 286.8 109.5 140.0 70.6 66.1 51.4 116.1 38.0 22.1Value 151.5 112.3 469.7 228.0 308.8 172.4 161.8 132.7 260.5 130.0 68.9
0
50
100
150
200
250
300
350
400
450
500
0
50
100
150
200
250
300
350
₹ C
rore
'000
ton
nes
Note: * For 2020-21 (April- December)Source: Directorate General of Commercial Intelligence and Statistics (DGCIS)
Comparative Trends in Prices
4.25 Domestic wholesale prices and MSP of jowar have been continuously higher than international prices during 2016 to 2020 (Chart 4.10). This renders exports of jowar from India uncompetitive. Domestic market prices of jowar were higher than the MSP in the year 2019. However, since the last quarter of 2019, the domestic prices have been continuously falling, resulting in rising gap between domestic prices and MSP. The fall in domestic prices is accentuated by the reduced exports and hence, reduced demand. This calls for increased focus on procurement of jowar in the ensuing Kharif season.
Chart 4.10: MSP, Domestic and International Prices of Jowar, 2016 to 2020
2016Q1
2016Q2
2016Q3
2016Q4
2017Q1
2017Q2
2017Q3
2017Q4
2018Q1
2018Q2
2018Q3
2018Q4
2019Q1
2019Q2
2019Q3
2019Q4
2020Q1
2020Q2
2020Q3
2020Q4
MSP 1570 1570 1570 1625 1625 1625 1625 1700 1700 1700 1700 2430 2430 2430 2430 2550 2550 2550 2550 2620
Domestic 2136 2123 2289 2283 2274 2178 2367 2221 2079 2180 2495 2892 2358 2516 2785 2373 2443 2366 2397 2124
International 1174 1163 1018 934 942 1019 1077 1107 1173 1146 1118 1153 1181 1133 1073 1163 1194 1299 1363
800
1300
1800
2300
2800
3300
₹/qt
l
Source: 1. Directorate of Economics and Statistics for MSP 2. AGMARKNET for domestic wholesale prices 3. World Bank for international prices
100
Trad
e Co
mpe
titive
ness
of I
ndia
n Ag
ricul
ture
The Marketing Season 2021-22
Pulses 4.26 India holds the distinction of being the world’s largest producer, consumer and
importer of pulses. Pulses are a major source of protein for a majority of Indians, particularly the vegetarian population. Promotion of pulses cultivation has been a policy priority in India as it is widely understood that pulses can help India overcome problem of malnutrition, improve soil fertility by nitrogen fixation and provide income support to farmers.
Global Production and Trade
4.27 As per the estimates of Food and Agricultural Organisation (FAO), global production of pulses was 92.13 million tonnes in TE2019. India was the largest producer of pulses, with a share of 25.6 percent, followed by Canada (7.4%), Myanmar (7.3%), China (5.4%), Russian Federation (4.0%) and Nigeria (4.0%). Chart 4.11 gives the shares of major producers of pulses around the world in TE2019. As per FAO- OECD Agricultural Outlook, the Asian market accounts for more than half of the total consumption of pulses, but only about 40 percent of the production, making it the most significant import destination. About 20 percent of global production of pulses is traded. Canada (40% share) is the largest exporter, while India is, the largest importer (30% share) of pulses. Africa has become self-sufficient in pulses during the past decade by further expanding its production.
4.28 The OECD-FAO Agricultural Outlook 2020-2029 has noted that the health benefits of pulses and role of pulses in manufacturing products like artificial meat would propel the growth of the global pulses market. The pulses-producing countries are already providing assistance to farmers, in turn, strengthening the growth of the market. Support to pulses production plays an important role in the Protein Strategy of the European Union. Accordingly, global supply of pulses has been projected to grow by another 16 million tonnes in the coming decade and more than half of this increase is expected to come from Asia, particularly India. This production expansion is expected to be driven by improved yields and area expansion. About 80 percent of the production growth can be attributed to yield improvements while the remaining 20 percent is expected from land use intensification, mainly in Asia and Africa. Sustained yield improvements through high-yielding varieties/hybrids and price support through MSP are expected to raise India’s domestic production.
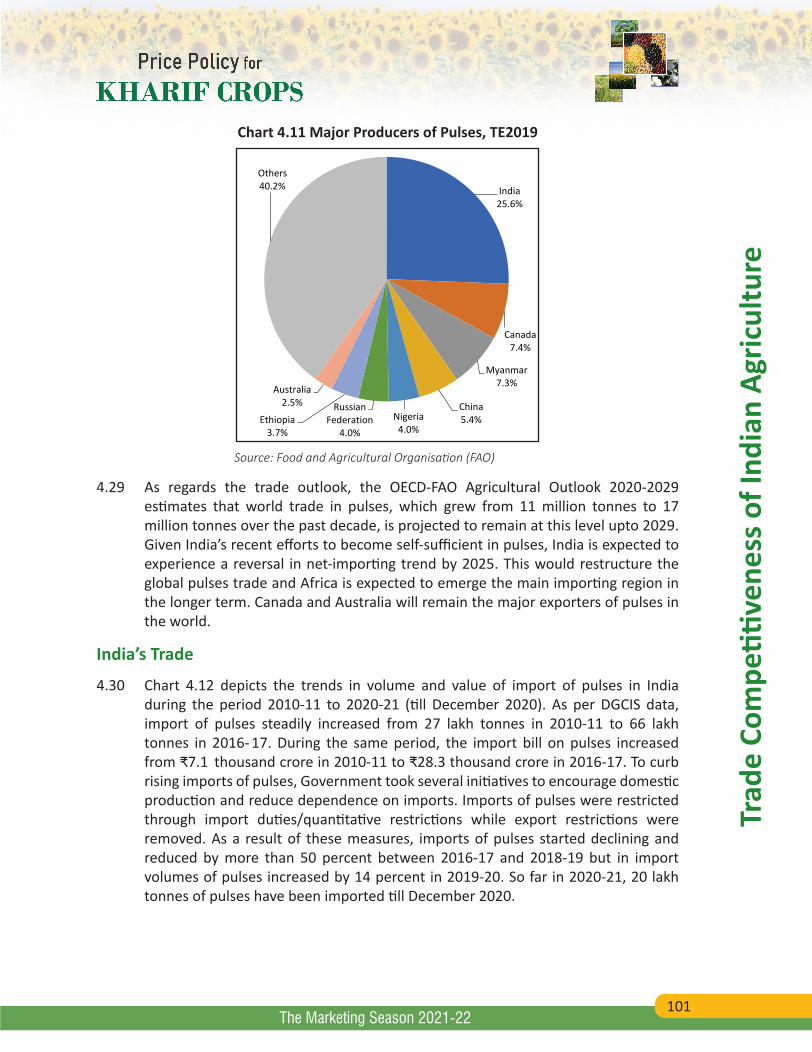
101
Trad
e Co
mpe
titive
ness
of I
ndia
n Ag
ricul
ture
The Marketing Season 2021-22
Chart 4.11 Major Producers of Pulses, TE2019
India 25.6%
Canada 7.4%
Myanmar 7.3%
China 5.4% Nigeria
4.0%
Russian Federation
4.0% Ethiopia
3.7%
Australia 2.5%
Others 40.2%
Source: Food and Agricultural Organisation (FAO)
4.29 As regards the trade outlook, the OECD-FAO Agricultural Outlook 2020-2029 estimates that world trade in pulses, which grew from 11 million tonnes to 17 million tonnes over the past decade, is projected to remain at this level upto 2029. Given India’s recent efforts to become self-sufficient in pulses, India is expected to experience a reversal in net-importing trend by 2025. This would restructure the global pulses trade and Africa is expected to emerge the main importing region in the longer term. Canada and Australia will remain the major exporters of pulses in the world.
India’s Trade
4.30 Chart 4.12 depicts the trends in volume and value of import of pulses in India during the period 2010-11 to 2020-21 (till December 2020). As per DGCIS data, import of pulses steadily increased from 27 lakh tonnes in 2010-11 to 66 lakh tonnes in 2016- 17. During the same period, the import bill on pulses increased from ₹7.1 thousand crore in 2010-11 to ₹28.3 thousand crore in 2016-17. To curb rising imports of pulses, Government took several initiatives to encourage domestic production and reduce dependence on imports. Imports of pulses were restricted through import duties/quantitative restrictions while export restrictions were removed. As a result of these measures, imports of pulses started declining and reduced by more than 50 percent between 2016-17 and 2018-19 but in import volumes of pulses increased by 14 percent in 2019-20. So far in 2020-21, 20 lakh tonnes of pulses have been imported till December 2020.
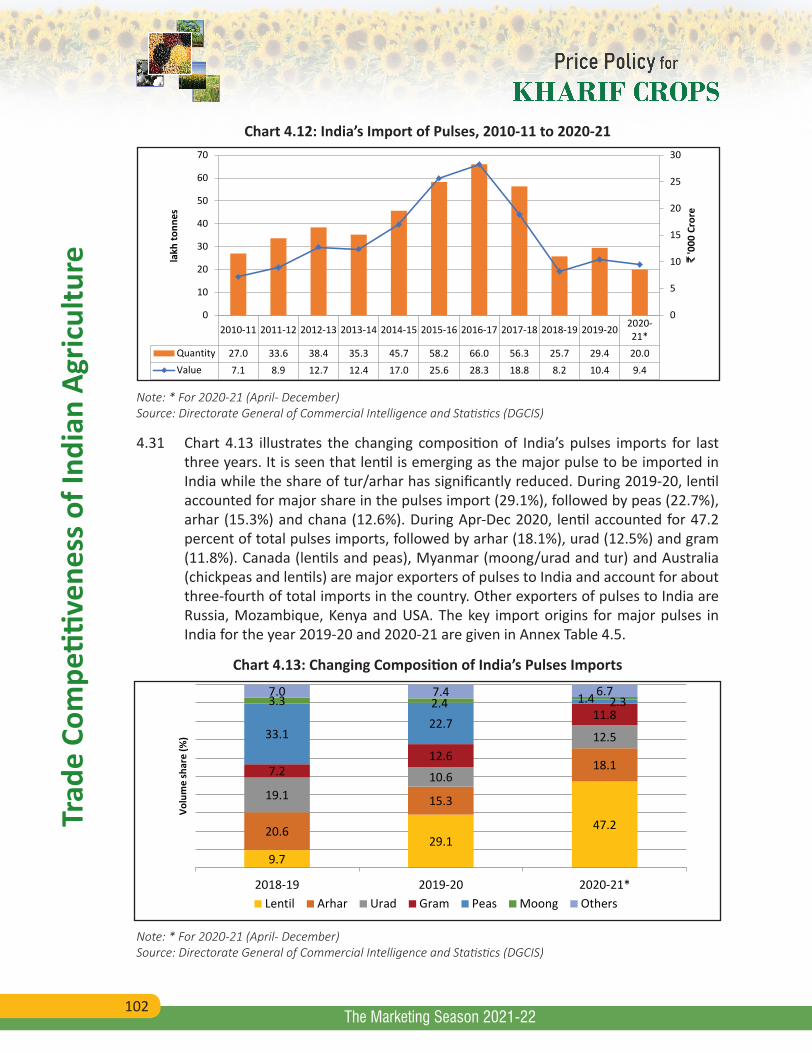
102
Trad
e Co
mpe
titive
ness
of I
ndia
n Ag
ricul
ture
The Marketing Season 2021-22
Chart 4.12: India’s Import of Pulses, 2010-11 to 2020-21
2010-11 2011-12 2012-13 2013-14 2014-15 2015-16 2016-17 2017-18 2018-19 2019-20 2020-21*
Quantity 27.0 33.6 38.4 35.3 45.7 58.2 66.0 56.3 25.7 29.4 20.0Value 7.1 8.9 12.7 12.4 17.0 25.6 28.3 18.8 8.2 10.4 9.4
0
5
10
15
20
25
30
0
10
20
30
40
50
60
70
` '0
00 C
rore
lakh
tonn
es
Note: * For 2020-21 (April- December)Source: Directorate General of Commercial Intelligence and Statistics (DGCIS)
4.31 Chart 4.13 illustrates the changing composition of India’s pulses imports for last three years. It is seen that lentil is emerging as the major pulse to be imported in India while the share of tur/arhar has significantly reduced. During 2019-20, lentil accounted for major share in the pulses import (29.1%), followed by peas (22.7%), arhar (15.3%) and chana (12.6%). During Apr-Dec 2020, lentil accounted for 47.2 percent of total pulses imports, followed by arhar (18.1%), urad (12.5%) and gram (11.8%). Canada (lentils and peas), Myanmar (moong/urad and tur) and Australia (chickpeas and lentils) are major exporters of pulses to India and account for about three-fourth of total imports in the country. Other exporters of pulses to India are Russia, Mozambique, Kenya and USA. The key import origins for major pulses in India for the year 2019-20 and 2020-21 are given in Annex Table 4.5.
Chart 4.13: Changing Composition of India’s Pulses Imports
9.7 29.1
47.2 20.6
15.3
18.1
19.1 10.6
12.5
7.2 12.6
11.8 33.1
22.7
2.3 3.3 2.4 1.4 7.0 7.4 6.7
2018-19 2019-20 2020-21*
Volu
me
shar
e (%
)
Lentil Arhar Urad Gram Peas Moong Others
Note: * For 2020-21 (April- December)Source: Directorate General of Commercial Intelligence and Statistics (DGCIS)
103
Trad
e Co
mpe
titive
ness
of I
ndia
n Ag
ricul
ture
The Marketing Season 2021-22
Trade Policy
4.32 India’s trade policy in pulses was relatively liberal. In 1979, import of pulses was placed under Open General License (OGL) and import duties declined steadily during the 1980s and 1990s. The import duty on pulses which was 10 percent during 1989 to 1994, was later reduced to zero percent in June 2006 but due to steep decline in domestic prices as a result of increased domestic production and higher imports, 10 percent import duty was imposed on tur (arhar) in June 2017. On 21st December 2017, Government imposed 30 percent import duty on chickpeas and lentils, which was further increased to 60 percent on chickpeas in March 2018 due to depressed prices in domestic market. Import duty on gram was raised from zero to 30 percent on 21st December 2017, which was further raised to 40 percent on 6th February, 2018 and 60 percent on 1st March, 2018. The MEIS benefit of 7 percent for bengal gram available up to 20th June, 2018 was extended for exports up to 20th June, 2018 vide DGFT public notice No.22/2015-2020 dated 13th July, 2018. As on 2nd February 2021, import of urad, moong and tur are subject to 30 percent import duty.
4.33 Simultaneously, to protect pulse growers from cheap imports, three pulses viz. tur, urad and moong were brought under quantitative restrictions for imports in 2017. On 5th August, 2017, 2 lakh tonnes annual quota was imposed on tur and on 21st August, 2017, 3 lakh tonnes annual quota each was imposed on urad and moong. Government vide notification dated 25th April, 2018 revised import policy of yellow peas from ‘free’ to ‘restricted’ and imposed quantitative restriction on imports with 1 lakh tonnes for the period 1st April, 2018 to 30th September 2018. Import of peas (including yellow peas, green peas, dun peas and kaspa peas) was restricted till 31st March, 2019 vide Department of Commerce’s notification dated 28th December, 2018. Import of peas were subject to an annual quota of 1.5 lakh tonnes till 31st February, 2020 as per Department of Commerce’s notification dated 16th April, 2019. Later, Department of Commerce imposed an annual quota of 4 lakh tonne on import of urad till 31st March, 2020 vide notification dated 18th December, 2019. Government of India extended quantitative restrictions on peas, moong and tur till 31st March, 2021 vide DGFT notifications dated 28th March, 2020 and 16th April, 2020. For green peas and other categories, quota was fixed at 75,000 tonnes each while for yellow peas, imports were prohibited altogether. For moong, import quota was fixed at 1.5 lakh tonnes and for tur, at 4 lakh tonnes. The import policy conditions such as minimum import price (MIP) of ₹200/kg and port restriction from Kolkata port only, as notified on 18th December 2019, remains unchanged. These quota restrictions do not apply to Government’s import commitments under any bilateral/regional agreement or Memorandum of Understanding. Further, on 3rd March, 2021, Government has notified an annual quota of 4 lakh tonnes for import of urad in fiscal year 2021-22.
4.34 As regards the export policy, Government lifted ban on export of tur, urad and moong in September 2017 but permission from Agricultural and Processed Food Products
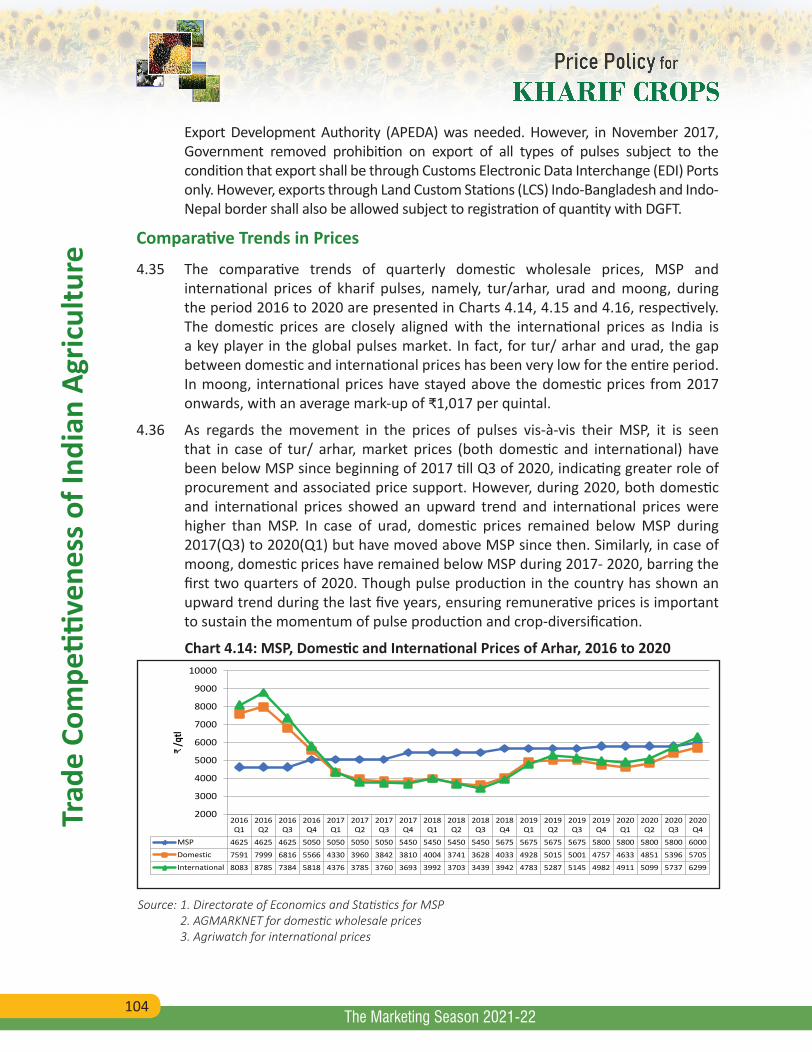
104
Trad
e Co
mpe
titive
ness
of I
ndia
n Ag
ricul
ture
The Marketing Season 2021-22
Export Development Authority (APEDA) was needed. However, in November 2017, Government removed prohibition on export of all types of pulses subject to the condition that export shall be through Customs Electronic Data Interchange (EDI) Ports only. However, exports through Land Custom Stations (LCS) Indo-Bangladesh and Indo-Nepal border shall also be allowed subject to registration of quantity with DGFT.
Comparative Trends in Prices
4.35 The comparative trends of quarterly domestic wholesale prices, MSP and international prices of kharif pulses, namely, tur/arhar, urad and moong, during the period 2016 to 2020 are presented in Charts 4.14, 4.15 and 4.16, respectively. The domestic prices are closely aligned with the international prices as India is a key player in the global pulses market. In fact, for tur/ arhar and urad, the gap between domestic and international prices has been very low for the entire period. In moong, international prices have stayed above the domestic prices from 2017 onwards, with an average mark-up of ₹1,017 per quintal.
4.36 As regards the movement in the prices of pulses vis-à-vis their MSP, it is seen that in case of tur/ arhar, market prices (both domestic and international) have been below MSP since beginning of 2017 till Q3 of 2020, indicating greater role of procurement and associated price support. However, during 2020, both domestic and international prices showed an upward trend and international prices were higher than MSP. In case of urad, domestic prices remained below MSP during 2017(Q3) to 2020(Q1) but have moved above MSP since then. Similarly, in case of moong, domestic prices have remained below MSP during 2017- 2020, barring the first two quarters of 2020. Though pulse production in the country has shown an upward trend during the last five years, ensuring remunerative prices is important to sustain the momentum of pulse production and crop-diversification.
Chart 4.14: MSP, Domestic and International Prices of Arhar, 2016 to 2020
2016Q1
2016Q2
2016Q3
2016Q4
2017Q1
2017Q2
2017Q3
2017Q4
2018Q1
2018Q2
2018Q3
2018Q4
2019Q1
2019Q2
2019Q3
2019Q4
2020Q1
2020Q2
2020Q3
2020Q4
MSP 4625 4625 4625 5050 5050 5050 5050 5450 5450 5450 5450 5675 5675 5675 5675 5800 5800 5800 5800 6000
Domestic 7591 7999 6816 5566 4330 3960 3842 3810 4004 3741 3628 4033 4928 5015 5001 4757 4633 4851 5396 5705
International 8083 8785 7384 5818 4376 3785 3760 3693 3992 3703 3439 3942 4783 5287 5145 4982 4911 5099 5737 6299
2000
3000
4000
5000
6000
7000
8000
9000
10000
₹ /q
tl
Source: 1. Directorate of Economics and Statistics for MSP 2. AGMARKNET for domestic wholesale prices 3. Agriwatch for international prices
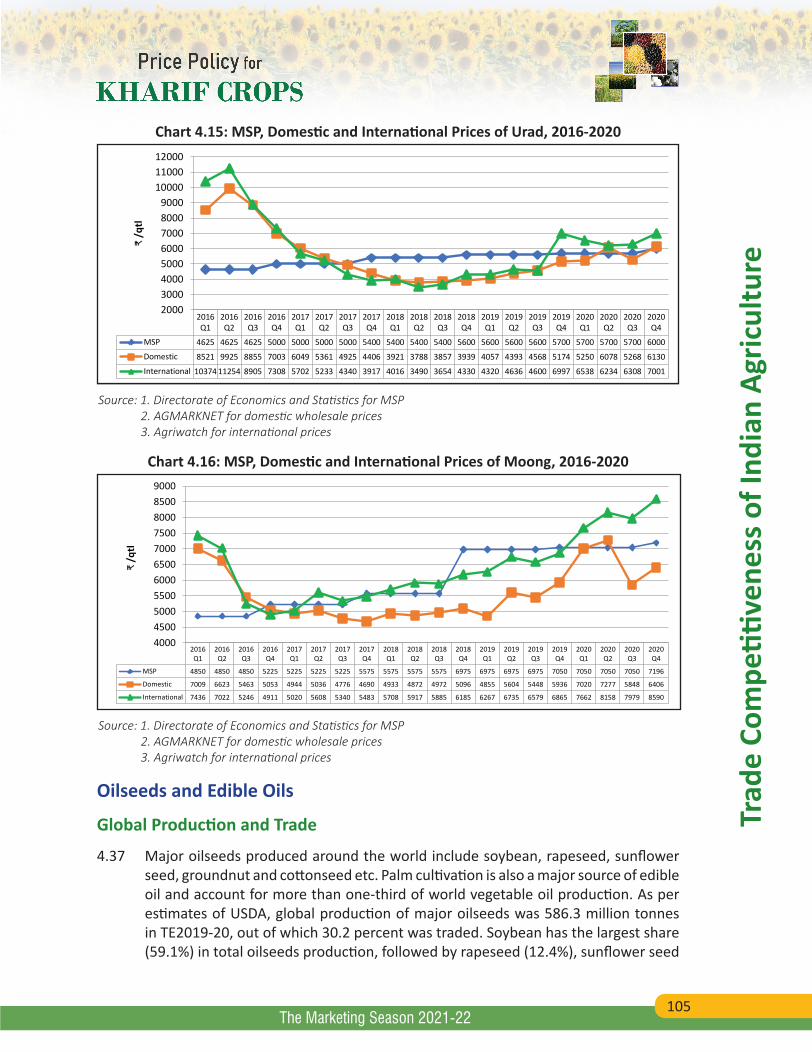
105
Trad
e Co
mpe
titive
ness
of I
ndia
n Ag
ricul
ture
The Marketing Season 2021-22
Chart 4.15: MSP, Domestic and International Prices of Urad, 2016-2020
2016Q1
2016Q2
2016Q3
2016Q4
2017Q1
2017Q2
2017Q3
2017Q4
2018Q1
2018Q2
2018Q3
2018Q4
2019Q1
2019Q2
2019Q3
2019Q4
2020Q1
2020Q2
2020Q3
2020Q4
MSP 4625 4625 4625 5000 5000 5000 5000 5400 5400 5400 5400 5600 5600 5600 5600 5700 5700 5700 5700 6000
Domestic 8521 9925 8855 7003 6049 5361 4925 4406 3921 3788 3857 3939 4057 4393 4568 5174 5250 6078 5268 6130
International 10374 11254 8905 7308 5702 5233 4340 3917 4016 3490 3654 4330 4320 4636 4600 6997 6538 6234 6308 7001
20003000400050006000700080009000
100001100012000
₹ /q
tl
Source: 1. Directorate of Economics and Statistics for MSP 2. AGMARKNET for domestic wholesale prices 3. Agriwatch for international prices
Chart 4.16: MSP, Domestic and International Prices of Moong, 2016-2020
2016Q1
2016Q2
2016Q3
2016Q4
2017Q1
2017Q2
2017Q3
2017Q4
2018Q1
2018Q2
2018Q3
2018Q4
2019Q1
2019Q2
2019Q3
2019Q4
2020Q1
2020Q2
2020Q3
2020Q4
MSP 4850 4850 4850 5225 5225 5225 5225 5575 5575 5575 5575 6975 6975 6975 6975 7050 7050 7050 7050 7196
Domestic 7009 6623 5463 5053 4944 5036 4776 4690 4933 4872 4972 5096 4855 5604 5448 5936 7020 7277 5848 6406
International 7436 7022 5246 4911 5020 5608 5340 5483 5708 5917 5885 6185 6267 6735 6579 6865 7662 8158 7979 8590
40004500500055006000650070007500800085009000
₹ /q
tl
Source: 1. Directorate of Economics and Statistics for MSP 2. AGMARKNET for domestic wholesale prices 3. Agriwatch for international prices
Oilseeds and Edible Oils
Global Production and Trade
4.37 Major oilseeds produced around the world include soybean, rapeseed, sunflower seed, groundnut and cottonseed etc. Palm cultivation is also a major source of edible oil and account for more than one-third of world vegetable oil production. As per estimates of USDA, global production of major oilseeds was 586.3 million tonnes in TE2019-20, out of which 30.2 percent was traded. Soybean has the largest share (59.1%) in total oilseeds production, followed by rapeseed (12.4%), sunflower seed
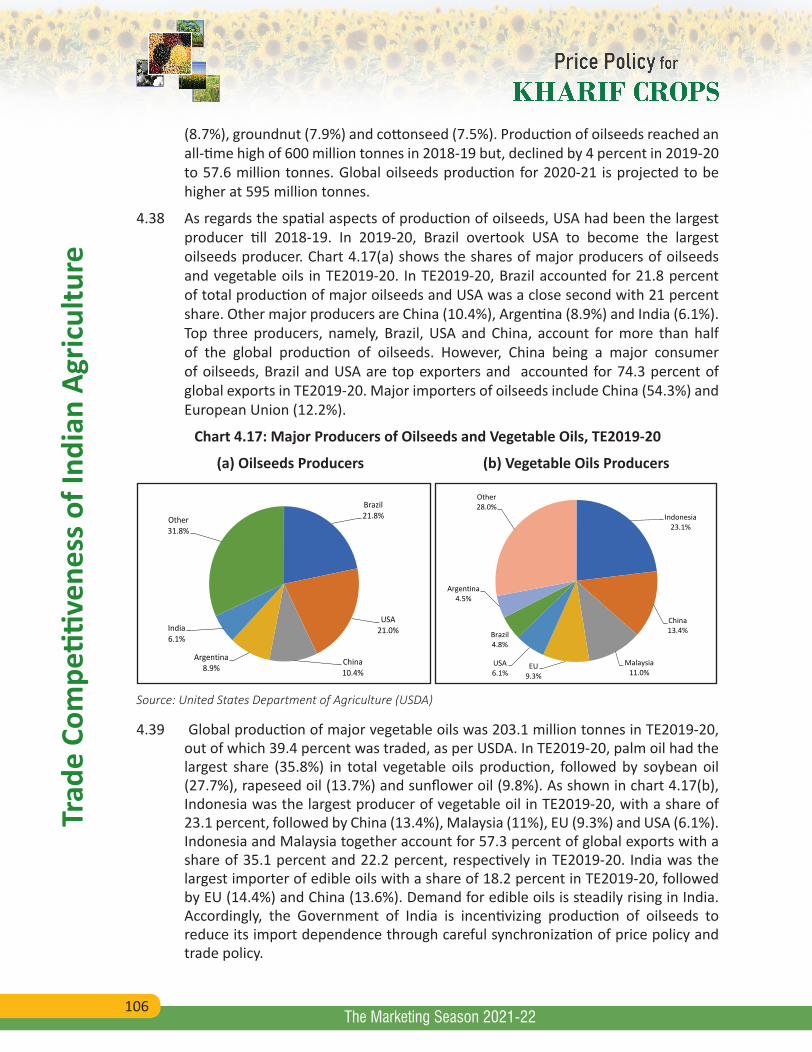
106
Trad
e Co
mpe
titive
ness
of I
ndia
n Ag
ricul
ture
The Marketing Season 2021-22
(8.7%), groundnut (7.9%) and cottonseed (7.5%). Production of oilseeds reached an all-time high of 600 million tonnes in 2018-19 but, declined by 4 percent in 2019-20 to 57.6 million tonnes. Global oilseeds production for 2020-21 is projected to be higher at 595 million tonnes.
4.38 As regards the spatial aspects of production of oilseeds, USA had been the largest producer till 2018-19. In 2019-20, Brazil overtook USA to become the largest oilseeds producer. Chart 4.17(a) shows the shares of major producers of oilseeds and vegetable oils in TE2019-20. In TE2019-20, Brazil accounted for 21.8 percent of total production of major oilseeds and USA was a close second with 21 percent share. Other major producers are China (10.4%), Argentina (8.9%) and India (6.1%). Top three producers, namely, Brazil, USA and China, account for more than half of the global production of oilseeds. However, China being a major consumer of oilseeds, Brazil and USA are top exporters and accounted for 74.3 percent of global exports in TE2019-20. Major importers of oilseeds include China (54.3%) and European Union (12.2%).
Chart 4.17: Major Producers of Oilseeds and Vegetable Oils, TE2019-20
(a) Oilseeds Producers (b) Vegetable Oils Producers
Brazil 21.8%
USA 21.0%
China 10.4%
Argentina 8.9%
India 6.1%
Other 31.8%
Indonesia 23.1%
China 13.4%
Malaysia 11.0%
EU 9.3%
USA 6.1%
Brazil 4.8%
Argentina 4.5%
Other 28.0%
Source: United States Department of Agriculture (USDA)
4.39 Global production of major vegetable oils was 203.1 million tonnes in TE2019-20, out of which 39.4 percent was traded, as per USDA. In TE2019-20, palm oil had the largest share (35.8%) in total vegetable oils production, followed by soybean oil (27.7%), rapeseed oil (13.7%) and sunflower oil (9.8%). As shown in chart 4.17(b), Indonesia was the largest producer of vegetable oil in TE2019-20, with a share of 23.1 percent, followed by China (13.4%), Malaysia (11%), EU (9.3%) and USA (6.1%). Indonesia and Malaysia together account for 57.3 percent of global exports with a share of 35.1 percent and 22.2 percent, respectively in TE2019-20. India was the largest importer of edible oils with a share of 18.2 percent in TE2019-20, followed by EU (14.4%) and China (13.6%). Demand for edible oils is steadily rising in India. Accordingly, the Government of India is incentivizing production of oilseeds to reduce its import dependence through careful synchronization of price policy and trade policy.
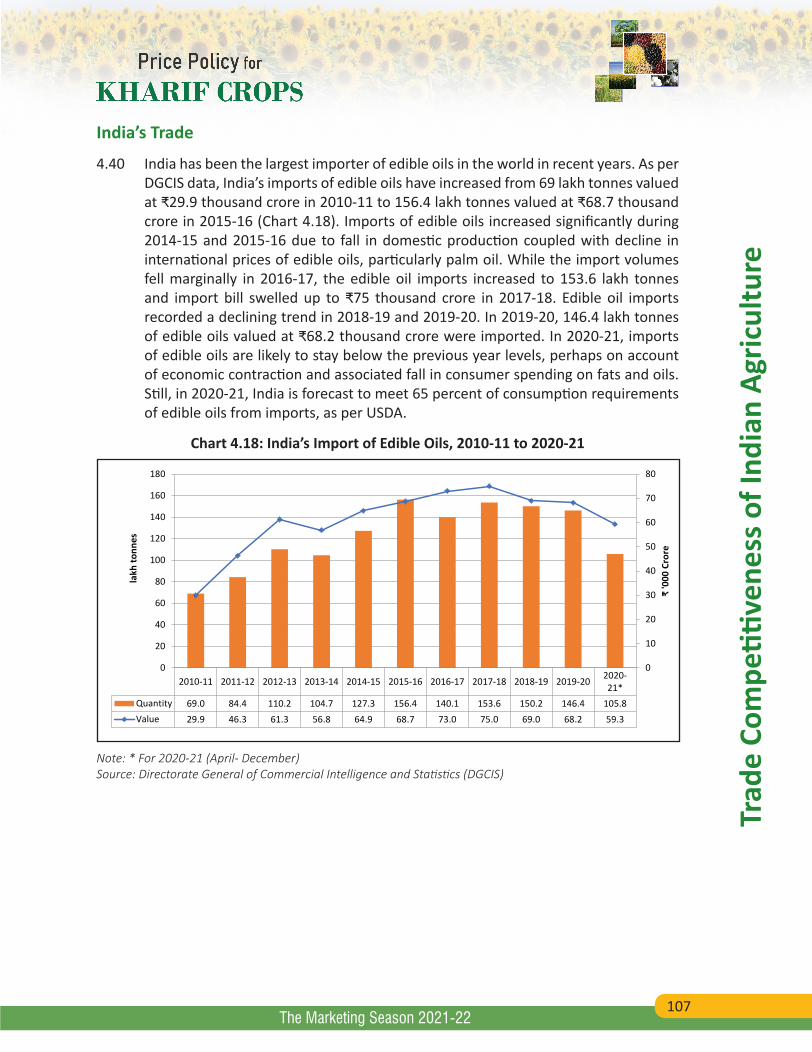
107
Trad
e Co
mpe
titive
ness
of I
ndia
n Ag
ricul
ture
The Marketing Season 2021-22
India’s Trade
4.40 India has been the largest importer of edible oils in the world in recent years. As per DGCIS data, India’s imports of edible oils have increased from 69 lakh tonnes valued at ₹29.9 thousand crore in 2010-11 to 156.4 lakh tonnes valued at ₹68.7 thousand crore in 2015-16 (Chart 4.18). Imports of edible oils increased significantly during 2014-15 and 2015-16 due to fall in domestic production coupled with decline in international prices of edible oils, particularly palm oil. While the import volumes fell marginally in 2016-17, the edible oil imports increased to 153.6 lakh tonnes and import bill swelled up to ₹75 thousand crore in 2017-18. Edible oil imports recorded a declining trend in 2018-19 and 2019-20. In 2019-20, 146.4 lakh tonnes of edible oils valued at ₹68.2 thousand crore were imported. In 2020-21, imports of edible oils are likely to stay below the previous year levels, perhaps on account of economic contraction and associated fall in consumer spending on fats and oils. Still, in 2020-21, India is forecast to meet 65 percent of consumption requirements of edible oils from imports, as per USDA.
Chart 4.18: India’s Import of Edible Oils, 2010-11 to 2020-21
2010-11 2011-12 2012-13 2013-14 2014-15 2015-16 2016-17 2017-18 2018-19 2019-20 2020-21*
Quantity 69.0 84.4 110.2 104.7 127.3 156.4 140.1 153.6 150.2 146.4 105.8Value 29.9 46.3 61.3 56.8 64.9 68.7 73.0 75.0 69.0 68.2 59.3
0
10
20
30
40
50
60
70
80
0
20
40
60
80
100
120
140
160
180
₹ '0
00 C
rore
lakh
tonn
es
Note: * For 2020-21 (April- December)Source: Directorate General of Commercial Intelligence and Statistics (DGCIS)
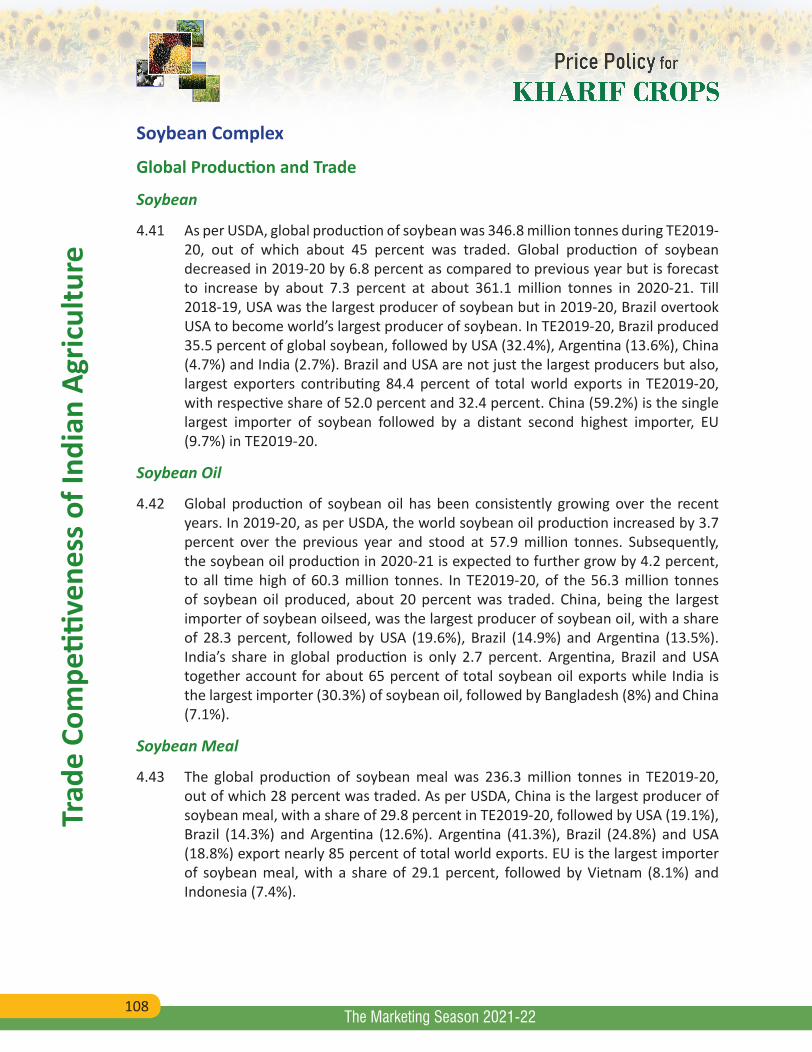
108
Trad
e Co
mpe
titive
ness
of I
ndia
n Ag
ricul
ture
The Marketing Season 2021-22
Soybean Complex
Global Production and Trade
Soybean
4.41 As per USDA, global production of soybean was 346.8 million tonnes during TE2019-20, out of which about 45 percent was traded. Global production of soybean decreased in 2019-20 by 6.8 percent as compared to previous year but is forecast to increase by about 7.3 percent at about 361.1 million tonnes in 2020-21. Till 2018-19, USA was the largest producer of soybean but in 2019-20, Brazil overtook USA to become world’s largest producer of soybean. In TE2019-20, Brazil produced 35.5 percent of global soybean, followed by USA (32.4%), Argentina (13.6%), China (4.7%) and India (2.7%). Brazil and USA are not just the largest producers but also, largest exporters contributing 84.4 percent of total world exports in TE2019-20, with respective share of 52.0 percent and 32.4 percent. China (59.2%) is the single largest importer of soybean followed by a distant second highest importer, EU (9.7%) in TE2019-20.
Soybean Oil
4.42 Global production of soybean oil has been consistently growing over the recent years. In 2019-20, as per USDA, the world soybean oil production increased by 3.7 percent over the previous year and stood at 57.9 million tonnes. Subsequently, the soybean oil production in 2020-21 is expected to further grow by 4.2 percent, to all time high of 60.3 million tonnes. In TE2019-20, of the 56.3 million tonnes of soybean oil produced, about 20 percent was traded. China, being the largest importer of soybean oilseed, was the largest producer of soybean oil, with a share of 28.3 percent, followed by USA (19.6%), Brazil (14.9%) and Argentina (13.5%). India’s share in global production is only 2.7 percent. Argentina, Brazil and USA together account for about 65 percent of total soybean oil exports while India is the largest importer (30.3%) of soybean oil, followed by Bangladesh (8%) and China (7.1%).
Soybean Meal
4.43 The global production of soybean meal was 236.3 million tonnes in TE2019-20, out of which 28 percent was traded. As per USDA, China is the largest producer of soybean meal, with a share of 29.8 percent in TE2019-20, followed by USA (19.1%), Brazil (14.3%) and Argentina (12.6%). Argentina (41.3%), Brazil (24.8%) and USA (18.8%) export nearly 85 percent of total world exports. EU is the largest importer of soybean meal, with a share of 29.1 percent, followed by Vietnam (8.1%) and Indonesia (7.4%).
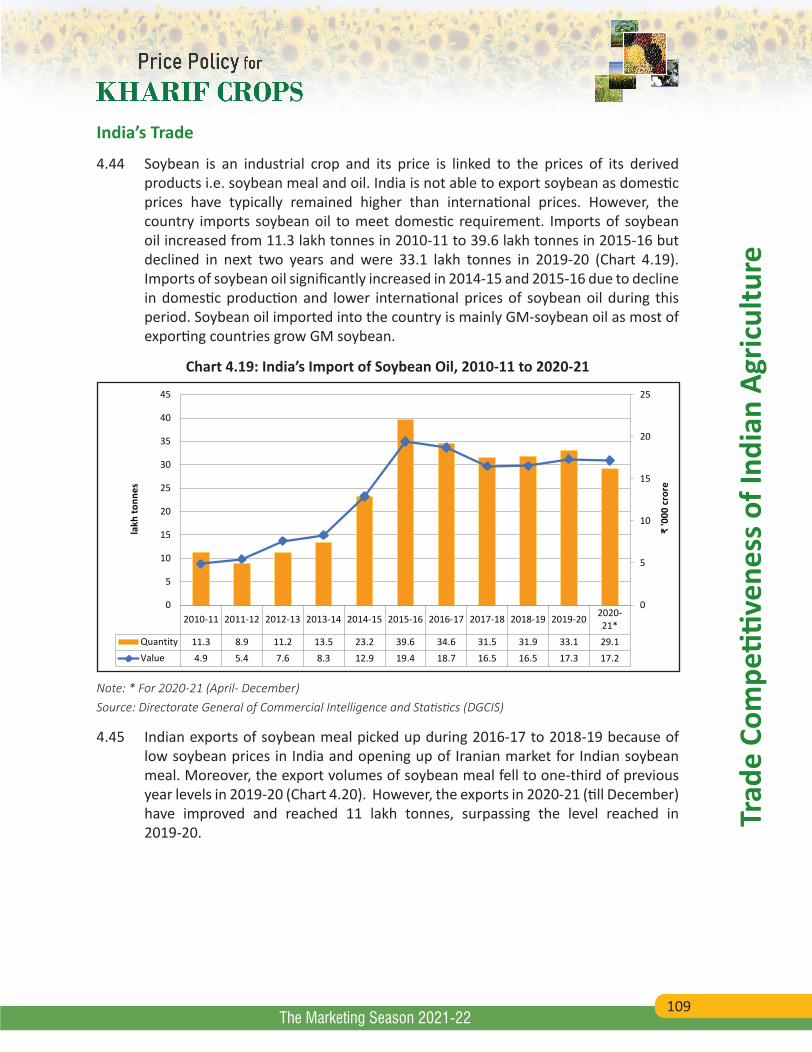
109
Trad
e Co
mpe
titive
ness
of I
ndia
n Ag
ricul
ture
The Marketing Season 2021-22
India’s Trade
4.44 Soybean is an industrial crop and its price is linked to the prices of its derived products i.e. soybean meal and oil. India is not able to export soybean as domestic prices have typically remained higher than international prices. However, the country imports soybean oil to meet domestic requirement. Imports of soybean oil increased from 11.3 lakh tonnes in 2010-11 to 39.6 lakh tonnes in 2015-16 but declined in next two years and were 33.1 lakh tonnes in 2019-20 (Chart 4.19). Imports of soybean oil significantly increased in 2014-15 and 2015-16 due to decline in domestic production and lower international prices of soybean oil during this period. Soybean oil imported into the country is mainly GM-soybean oil as most of exporting countries grow GM soybean.
Chart 4.19: India’s Import of Soybean Oil, 2010-11 to 2020-21
2010-11 2011-12 2012-13 2013-14 2014-15 2015-16 2016-17 2017-18 2018-19 2019-20 2020-21*
Quantity 11.3 8.9 11.2 13.5 23.2 39.6 34.6 31.5 31.9 33.1 29.1Value 4.9 5.4 7.6 8.3 12.9 19.4 18.7 16.5 16.5 17.3 17.2
0
5
10
15
20
25
0
5
10
15
20
25
30
35
40
45
₹ '0
00 c
rore
lakh
tonn
es
Note: * For 2020-21 (April- December)Source: Directorate General of Commercial Intelligence and Statistics (DGCIS)
4.45 Indian exports of soybean meal picked up during 2016-17 to 2018-19 because of low soybean prices in India and opening up of Iranian market for Indian soybean meal. Moreover, the export volumes of soybean meal fell to one-third of previous year levels in 2019-20 (Chart 4.20). However, the exports in 2020-21 (till December) have improved and reached 11 lakh tonnes, surpassing the level reached in 2019-20.
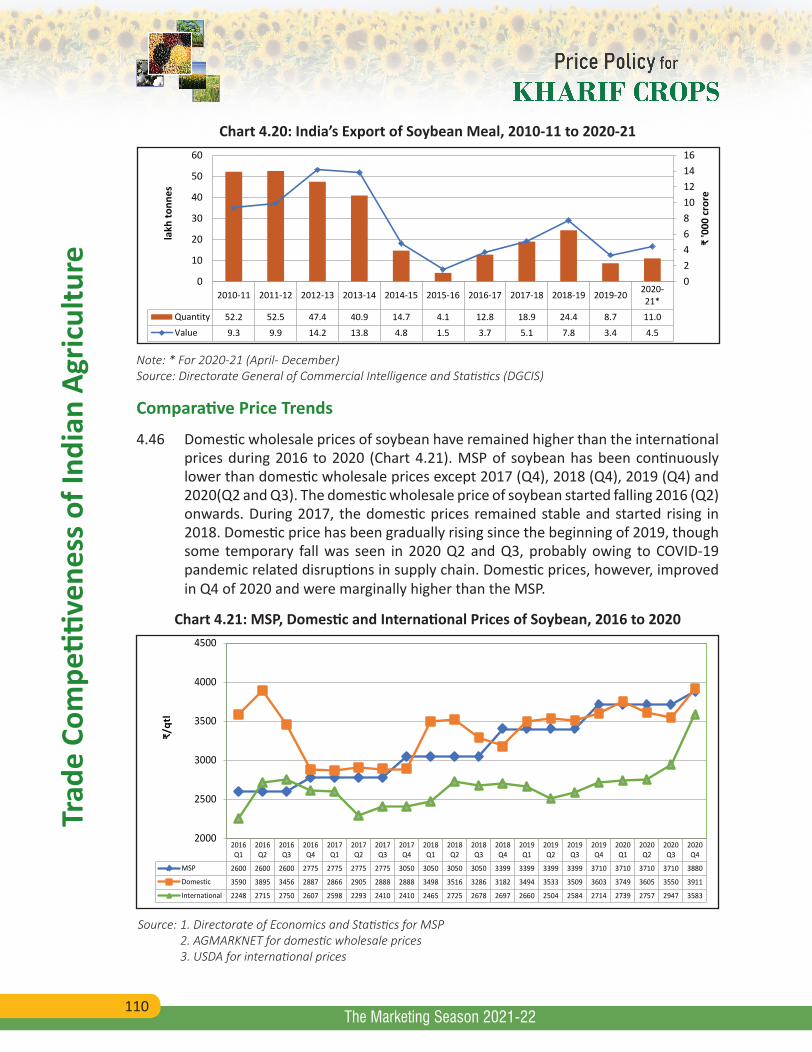
110
Trad
e Co
mpe
titive
ness
of I
ndia
n Ag
ricul
ture
The Marketing Season 2021-22
Chart 4.20: India’s Export of Soybean Meal, 2010-11 to 2020-21
2010-11 2011-12 2012-13 2013-14 2014-15 2015-16 2016-17 2017-18 2018-19 2019-20 2020-21*
Quantity 52.2 52.5 47.4 40.9 14.7 4.1 12.8 18.9 24.4 8.7 11.0Value 9.3 9.9 14.2 13.8 4.8 1.5 3.7 5.1 7.8 3.4 4.5
0246810121416
0
10
20
30
40
50
60
₹ '0
00 c
rore
lakh
tonn
es
Note: * For 2020-21 (April- December)Source: Directorate General of Commercial Intelligence and Statistics (DGCIS)
Comparative Price Trends
4.46 Domestic wholesale prices of soybean have remained higher than the international prices during 2016 to 2020 (Chart 4.21). MSP of soybean has been continuously lower than domestic wholesale prices except 2017 (Q4), 2018 (Q4), 2019 (Q4) and 2020(Q2 and Q3). The domestic wholesale price of soybean started falling 2016 (Q2) onwards. During 2017, the domestic prices remained stable and started rising in 2018. Domestic price has been gradually rising since the beginning of 2019, though some temporary fall was seen in 2020 Q2 and Q3, probably owing to COVID-19 pandemic related disruptions in supply chain. Domestic prices, however, improved in Q4 of 2020 and were marginally higher than the MSP.
Chart 4.21: MSP, Domestic and International Prices of Soybean, 2016 to 2020
2016Q1
2016Q2
2016Q3
2016Q4
2017Q1
2017Q2
2017Q3
2017Q4
2018Q1
2018Q2
2018Q3
2018Q4
2019Q1
2019Q2
2019Q3
2019Q4
2020Q1
2020Q2
2020Q3
2020Q4
MSP 2600 2600 2600 2775 2775 2775 2775 3050 3050 3050 3050 3399 3399 3399 3399 3710 3710 3710 3710 3880
Domestic 3590 3895 3456 2887 2866 2905 2888 2888 3498 3516 3286 3182 3494 3533 3509 3603 3749 3605 3550 3911
International 2248 2715 2750 2607 2598 2293 2410 2410 2465 2725 2678 2697 2660 2504 2584 2714 2739 2757 2947 3583
2000
2500
3000
3500
4000
4500
₹/qt
l
Source: 1. Directorate of Economics and Statistics for MSP 2. AGMARKNET for domestic wholesale prices 3. USDA for international prices
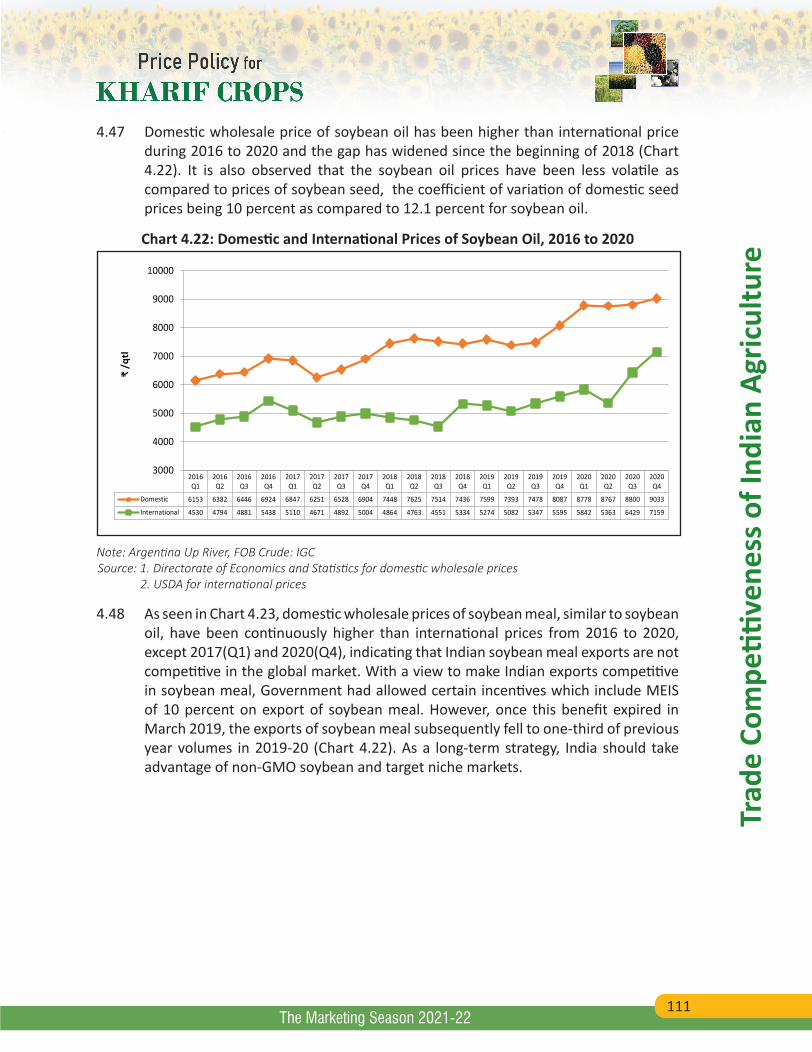
111
Trad
e Co
mpe
titive
ness
of I
ndia
n Ag
ricul
ture
The Marketing Season 2021-22
4.47 Domestic wholesale price of soybean oil has been higher than international price during 2016 to 2020 and the gap has widened since the beginning of 2018 (Chart 4.22). It is also observed that the soybean oil prices have been less volatile as compared to prices of soybean seed, the coefficient of variation of domestic seed prices being 10 percent as compared to 12.1 percent for soybean oil.
Chart 4.22: Domestic and International Prices of Soybean Oil, 2016 to 2020
2016Q1
2016Q2
2016Q3
2016Q4
2017Q1
2017Q2
2017Q3
2017Q4
2018Q1
2018Q2
2018Q3
2018Q4
2019Q1
2019Q2
2019Q3
2019Q4
2020Q1
2020Q2
2020Q3
2020Q4
Domestic 6153 6382 6446 6924 6847 6251 6528 6904 7448 7625 7514 7436 7599 7393 7478 8087 8778 8767 8800 9033
International 4530 4794 4881 5438 5110 4671 4892 5004 4864 4763 4551 5334 5274 5082 5347 5595 5842 5363 6429 7159
3000
4000
5000
6000
7000
8000
9000
10000
₹ /q
tl
Note: Argentina Up River, FOB Crude: IGCSource: 1. Directorate of Economics and Statistics for domestic wholesale prices 2. USDA for international prices
4.48 As seen in Chart 4.23, domestic wholesale prices of soybean meal, similar to soybean oil, have been continuously higher than international prices from 2016 to 2020, except 2017(Q1) and 2020(Q4), indicating that Indian soybean meal exports are not competitive in the global market. With a view to make Indian exports competitive in soybean meal, Government had allowed certain incentives which include MEIS of 10 percent on export of soybean meal. However, once this benefit expired in March 2019, the exports of soybean meal subsequently fell to one-third of previous year volumes in 2019-20 (Chart 4.22). As a long-term strategy, India should take advantage of non-GMO soybean and target niche markets.
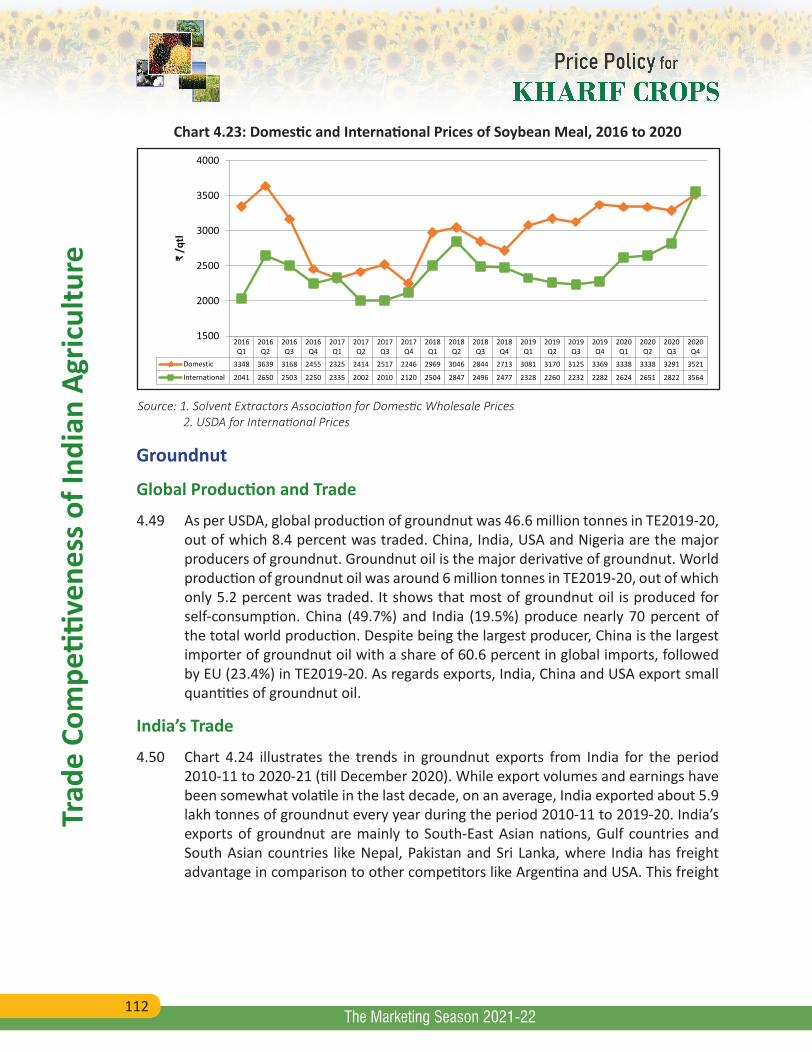
112
Trad
e Co
mpe
titive
ness
of I
ndia
n Ag
ricul
ture
The Marketing Season 2021-22
Chart 4.23: Domestic and International Prices of Soybean Meal, 2016 to 2020
2016Q1
2016Q2
2016Q3
2016Q4
2017Q1
2017Q2
2017Q3
2017Q4
2018Q1
2018Q2
2018Q3
2018Q4
2019Q1
2019Q2
2019Q3
2019Q4
2020Q1
2020Q2
2020Q3
2020Q4
Domestic 3348 3639 3168 2455 2325 2414 2517 2246 2969 3046 2844 2713 3081 3170 3125 3369 3338 3338 3291 3521
International 2041 2650 2503 2250 2335 2002 2010 2120 2504 2847 2496 2477 2328 2260 2232 2282 2624 2651 2822 3564
1500
2000
2500
3000
3500
4000₹
/qtl
Source: 1. Solvent Extractors Association for Domestic Wholesale Prices 2. USDA for International Prices
Groundnut
Global Production and Trade
4.49 As per USDA, global production of groundnut was 46.6 million tonnes in TE2019-20, out of which 8.4 percent was traded. China, India, USA and Nigeria are the major producers of groundnut. Groundnut oil is the major derivative of groundnut. World production of groundnut oil was around 6 million tonnes in TE2019-20, out of which only 5.2 percent was traded. It shows that most of groundnut oil is produced for self-consumption. China (49.7%) and India (19.5%) produce nearly 70 percent of the total world production. Despite being the largest producer, China is the largest importer of groundnut oil with a share of 60.6 percent in global imports, followed by EU (23.4%) in TE2019-20. As regards exports, India, China and USA export small quantities of groundnut oil.
India’s Trade
4.50 Chart 4.24 illustrates the trends in groundnut exports from India for the period 2010-11 to 2020-21 (till December 2020). While export volumes and earnings have been somewhat volatile in the last decade, on an average, India exported about 5.9 lakh tonnes of groundnut every year during the period 2010-11 to 2019-20. India’s exports of groundnut are mainly to South-East Asian nations, Gulf countries and South Asian countries like Nepal, Pakistan and Sri Lanka, where India has freight advantage in comparison to other competitors like Argentina and USA. This freight
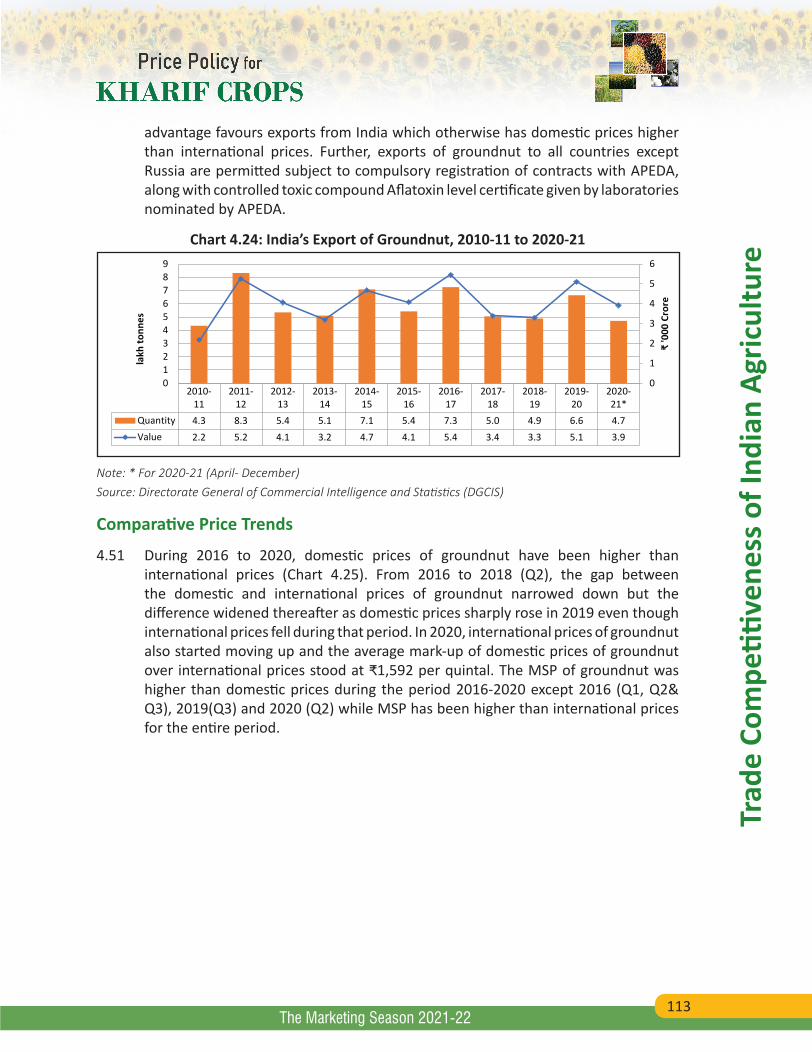
113
Trad
e Co
mpe
titive
ness
of I
ndia
n Ag
ricul
ture
The Marketing Season 2021-22
advantage favours exports from India which otherwise has domestic prices higher than international prices. Further, exports of groundnut to all countries except Russia are permitted subject to compulsory registration of contracts with APEDA, along with controlled toxic compound Aflatoxin level certificate given by laboratories nominated by APEDA.
Chart 4.24: India’s Export of Groundnut, 2010-11 to 2020-21
2010-11
2011-12
2012-13
2013-14
2014-15
2015-16
2016-17
2017-18
2018-19
2019-20
2020-21*
Quantity 4.3 8.3 5.4 5.1 7.1 5.4 7.3 5.0 4.9 6.6 4.7Value 2.2 5.2 4.1 3.2 4.7 4.1 5.4 3.4 3.3 5.1 3.9
0
1
2
3
4
5
6
0123456789
₹ '0
00 C
rore
lakh
tonn
es
Note: * For 2020-21 (April- December)Source: Directorate General of Commercial Intelligence and Statistics (DGCIS)
Comparative Price Trends
4.51 During 2016 to 2020, domestic prices of groundnut have been higher than international prices (Chart 4.25). From 2016 to 2018 (Q2), the gap between the domestic and international prices of groundnut narrowed down but the difference widened thereafter as domestic prices sharply rose in 2019 even though international prices fell during that period. In 2020, international prices of groundnut also started moving up and the average mark-up of domestic prices of groundnut over international prices stood at ₹1,592 per quintal. The MSP of groundnut was higher than domestic prices during the period 2016-2020 except 2016 (Q1, Q2& Q3), 2019(Q3) and 2020 (Q2) while MSP has been higher than international prices for the entire period.
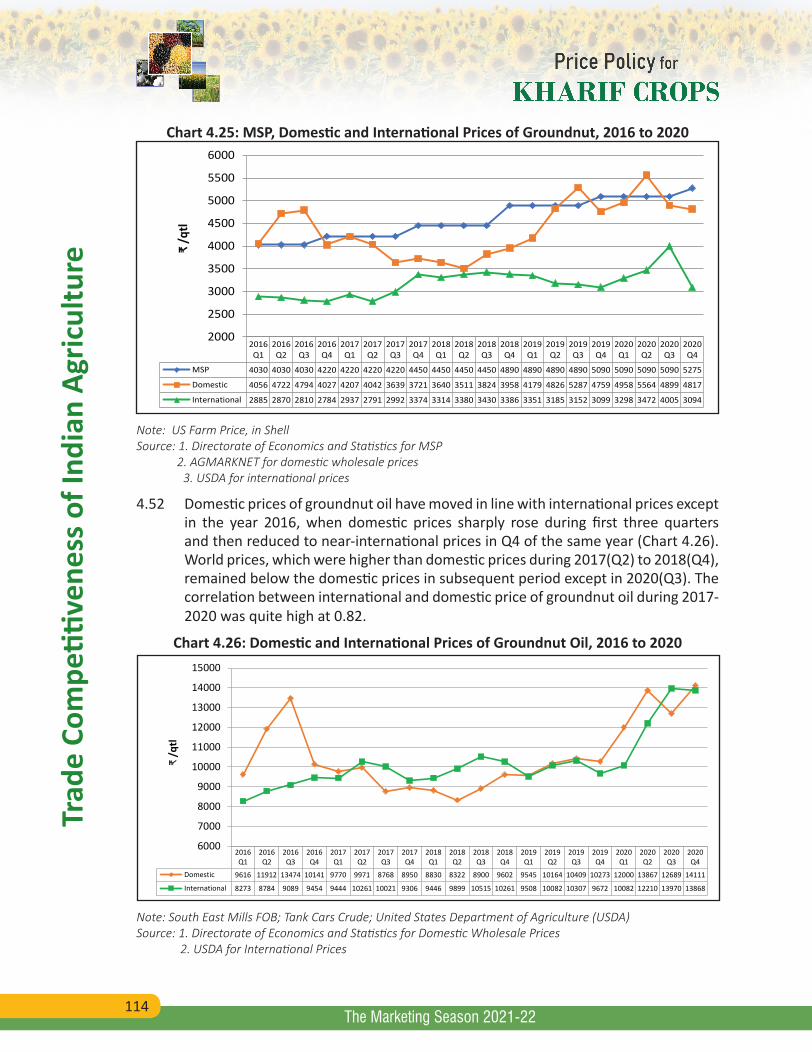
114
Trad
e Co
mpe
titive
ness
of I
ndia
n Ag
ricul
ture
The Marketing Season 2021-22
Chart 4.25: MSP, Domestic and International Prices of Groundnut, 2016 to 2020
2016Q1
2016Q2
2016Q3
2016Q4
2017Q1
2017Q2
2017Q3
2017Q4
2018Q1
2018Q2
2018Q3
2018Q4
2019Q1
2019Q2
2019Q3
2019Q4
2020Q1
2020Q2
2020Q3
2020Q4
MSP 4030 4030 4030 4220 4220 4220 4220 4450 4450 4450 4450 4890 4890 4890 4890 5090 5090 5090 5090 5275
Domestic 4056 4722 4794 4027 4207 4042 3639 3721 3640 3511 3824 3958 4179 4826 5287 4759 4958 5564 4899 4817
International 2885 2870 2810 2784 2937 2791 2992 3374 3314 3380 3430 3386 3351 3185 3152 3099 3298 3472 4005 3094
2000
2500
3000
3500
4000
4500
5000
5500
6000
₹ /q
tl
Note: US Farm Price, in ShellSource: 1. Directorate of Economics and Statistics for MSP 2. AGMARKNET for domestic wholesale prices 3. USDA for international prices
4.52 Domestic prices of groundnut oil have moved in line with international prices except in the year 2016, when domestic prices sharply rose during first three quarters and then reduced to near-international prices in Q4 of the same year (Chart 4.26). World prices, which were higher than domestic prices during 2017(Q2) to 2018(Q4), remained below the domestic prices in subsequent period except in 2020(Q3). The correlation between international and domestic price of groundnut oil during 2017-2020 was quite high at 0.82.
Chart 4.26: Domestic and International Prices of Groundnut Oil, 2016 to 2020
2016Q1
2016Q2
2016Q3
2016Q4
2017Q1
2017Q2
2017Q3
2017Q4
2018Q1
2018Q2
2018Q3
2018Q4
2019Q1
2019Q2
2019Q3
2019Q4
2020Q1
2020Q2
2020Q3
2020Q4
Domestic 9616 11912 13474 10141 9770 9971 8768 8950 8830 8322 8900 9602 9545 10164 10409 10273 12000 13867 12689 14111
International 8273 8784 9089 9454 9444 10261 10021 9306 9446 9899 10515 10261 9508 10082 10307 9672 10082 12210 13970 13868
6000
7000
8000
9000
10000
11000
12000
13000
14000
15000
₹ /q
tl
Note: South East Mills FOB; Tank Cars Crude; United States Department of Agriculture (USDA)Source: 1. Directorate of Economics and Statistics for Domestic Wholesale Prices 2. USDA for International Prices
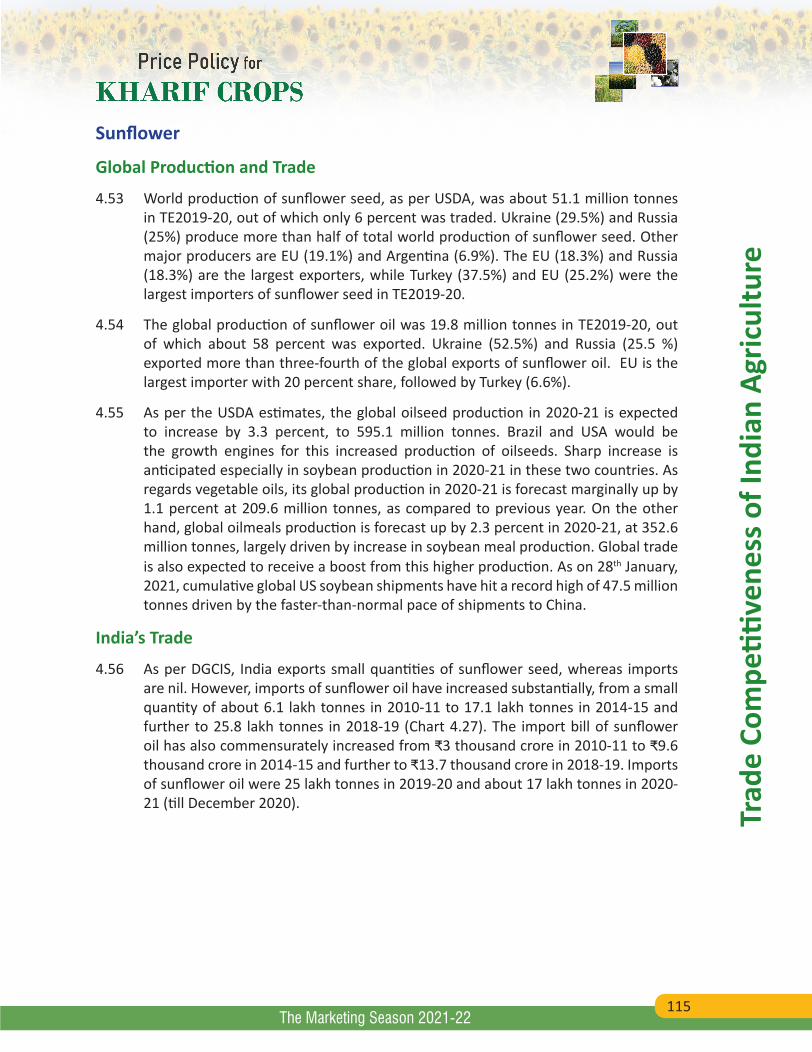
115
Trad
e Co
mpe
titive
ness
of I
ndia
n Ag
ricul
ture
The Marketing Season 2021-22
Sunflower
Global Production and Trade
4.53 World production of sunflower seed, as per USDA, was about 51.1 million tonnes in TE2019-20, out of which only 6 percent was traded. Ukraine (29.5%) and Russia (25%) produce more than half of total world production of sunflower seed. Other major producers are EU (19.1%) and Argentina (6.9%). The EU (18.3%) and Russia (18.3%) are the largest exporters, while Turkey (37.5%) and EU (25.2%) were the largest importers of sunflower seed in TE2019-20.
4.54 The global production of sunflower oil was 19.8 million tonnes in TE2019-20, out of which about 58 percent was exported. Ukraine (52.5%) and Russia (25.5 %) exported more than three-fourth of the global exports of sunflower oil. EU is the largest importer with 20 percent share, followed by Turkey (6.6%).
4.55 As per the USDA estimates, the global oilseed production in 2020-21 is expected to increase by 3.3 percent, to 595.1 million tonnes. Brazil and USA would be the growth engines for this increased production of oilseeds. Sharp increase is anticipated especially in soybean production in 2020-21 in these two countries. As regards vegetable oils, its global production in 2020-21 is forecast marginally up by 1.1 percent at 209.6 million tonnes, as compared to previous year. On the other hand, global oilmeals production is forecast up by 2.3 percent in 2020-21, at 352.6 million tonnes, largely driven by increase in soybean meal production. Global trade is also expected to receive a boost from this higher production. As on 28th January, 2021, cumulative global US soybean shipments have hit a record high of 47.5 million tonnes driven by the faster-than-normal pace of shipments to China.
India’s Trade
4.56 As per DGCIS, India exports small quantities of sunflower seed, whereas imports are nil. However, imports of sunflower oil have increased substantially, from a small quantity of about 6.1 lakh tonnes in 2010-11 to 17.1 lakh tonnes in 2014-15 and further to 25.8 lakh tonnes in 2018-19 (Chart 4.27). The import bill of sunflower oil has also commensurately increased from ₹3 thousand crore in 2010-11 to ₹9.6 thousand crore in 2014-15 and further to ₹13.7 thousand crore in 2018-19. Imports of sunflower oil were 25 lakh tonnes in 2019-20 and about 17 lakh tonnes in 2020-21 (till December 2020).
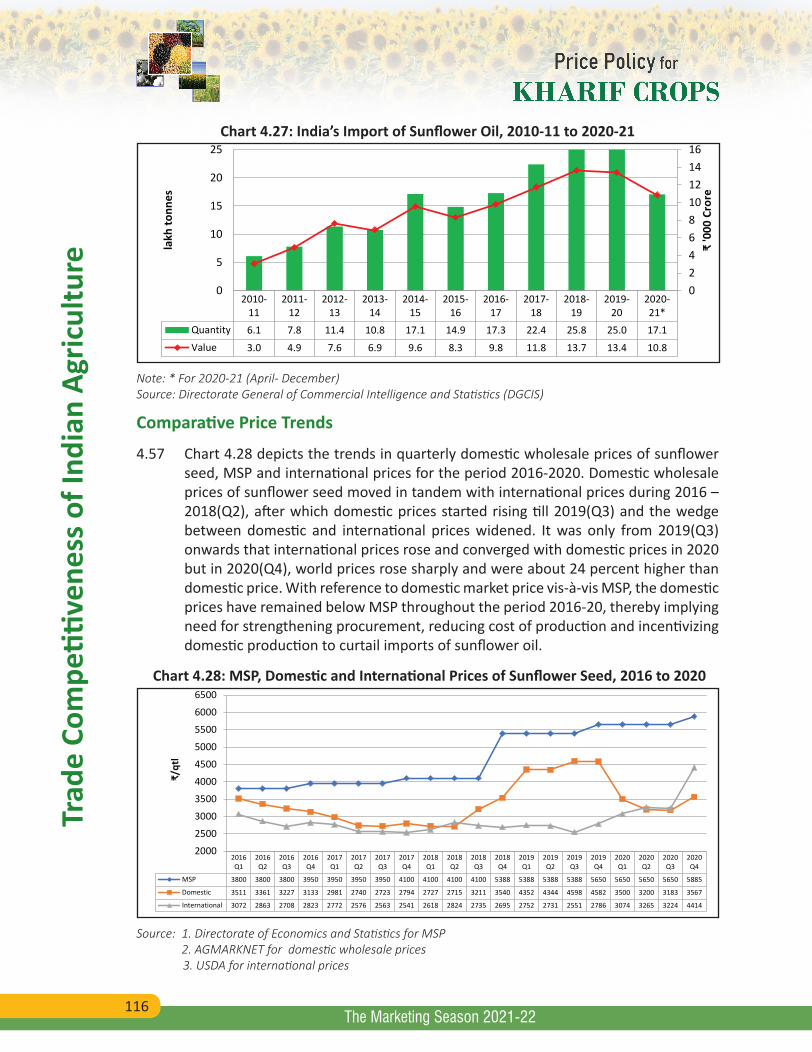
116
Trad
e Co
mpe
titive
ness
of I
ndia
n Ag
ricul
ture
The Marketing Season 2021-22
Chart 4.27: India’s Import of Sunflower Oil, 2010-11 to 2020-21
2010-11
2011-12
2012-13
2013-14
2014-15
2015-16
2016-17
2017-18
2018-19
2019-20
2020-21*
Quantity 6.1 7.8 11.4 10.8 17.1 14.9 17.3 22.4 25.8 25.0 17.1Value 3.0 4.9 7.6 6.9 9.6 8.3 9.8 11.8 13.7 13.4 10.8
0246810121416
0
5
10
15
20
25
₹ '0
00 C
rore
lakh
tonn
es
Note: * For 2020-21 (April- December)Source: Directorate General of Commercial Intelligence and Statistics (DGCIS)
Comparative Price Trends
4.57 Chart 4.28 depicts the trends in quarterly domestic wholesale prices of sunflower seed, MSP and international prices for the period 2016-2020. Domestic wholesale prices of sunflower seed moved in tandem with international prices during 2016 – 2018(Q2), after which domestic prices started rising till 2019(Q3) and the wedge between domestic and international prices widened. It was only from 2019(Q3) onwards that international prices rose and converged with domestic prices in 2020 but in 2020(Q4), world prices rose sharply and were about 24 percent higher than domestic price. With reference to domestic market price vis-à-vis MSP, the domestic prices have remained below MSP throughout the period 2016-20, thereby implying need for strengthening procurement, reducing cost of production and incentivizing domestic production to curtail imports of sunflower oil.
Chart 4.28: MSP, Domestic and International Prices of Sunflower Seed, 2016 to 2020
2016Q1
2016Q2
2016Q3
2016Q4
2017Q1
2017Q2
2017Q3
2017Q4
2018Q1
2018Q2
2018Q3
2018Q4
2019Q1
2019Q2
2019Q3
2019Q4
2020Q1
2020Q2
2020Q3
2020Q4
MSP 3800 3800 3800 3950 3950 3950 3950 4100 4100 4100 4100 5388 5388 5388 5388 5650 5650 5650 5650 5885
Domestic 3511 3361 3227 3133 2981 2740 2723 2794 2727 2715 3211 3540 4352 4344 4598 4582 3500 3200 3183 3567
International 3072 2863 2708 2823 2772 2576 2563 2541 2618 2824 2735 2695 2752 2731 2551 2786 3074 3265 3224 4414
2000
2500
3000
3500
4000
4500
5000
5500
6000
6500
₹/qt
l
Source: 1. Directorate of Economics and Statistics for MSP 2. AGMARKNET for domestic wholesale prices 3. USDA for international prices
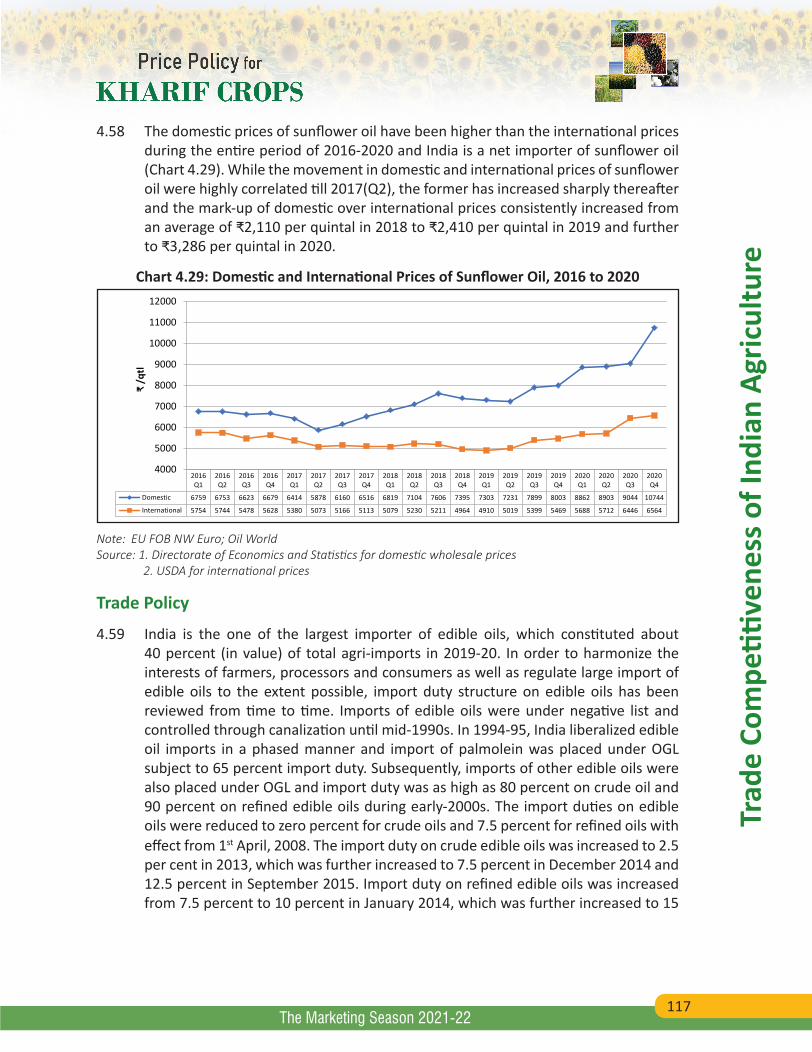
117
Trad
e Co
mpe
titive
ness
of I
ndia
n Ag
ricul
ture
The Marketing Season 2021-22
4.58 The domestic prices of sunflower oil have been higher than the international prices during the entire period of 2016-2020 and India is a net importer of sunflower oil (Chart 4.29). While the movement in domestic and international prices of sunflower oil were highly correlated till 2017(Q2), the former has increased sharply thereafter and the mark-up of domestic over international prices consistently increased from an average of ₹2,110 per quintal in 2018 to ₹2,410 per quintal in 2019 and further to ₹3,286 per quintal in 2020.
Chart 4.29: Domestic and International Prices of Sunflower Oil, 2016 to 2020
2016Q1
2016Q2
2016Q3
2016Q4
2017Q1
2017Q2
2017Q3
2017Q4
2018Q1
2018Q2
2018Q3
2018Q4
2019Q1
2019Q2
2019Q3
2019Q4
2020Q1
2020Q2
2020Q3
2020Q4
Domestic 6759 6753 6623 6679 6414 5878 6160 6516 6819 7104 7606 7395 7303 7231 7899 8003 8862 8903 9044 10744
International 5754 5744 5478 5628 5380 5073 5166 5113 5079 5230 5211 4964 4910 5019 5399 5469 5688 5712 6446 6564
4000
5000
6000
7000
8000
9000
10000
11000
12000
₹ /q
tl
Note: EU FOB NW Euro; Oil WorldSource: 1. Directorate of Economics and Statistics for domestic wholesale prices 2. USDA for international prices
Trade Policy
4.59 India is the one of the largest importer of edible oils, which constituted about 40 percent (in value) of total agri-imports in 2019-20. In order to harmonize the interests of farmers, processors and consumers as well as regulate large import of edible oils to the extent possible, import duty structure on edible oils has been reviewed from time to time. Imports of edible oils were under negative list and controlled through canalization until mid-1990s. In 1994-95, India liberalized edible oil imports in a phased manner and import of palmolein was placed under OGL subject to 65 percent import duty. Subsequently, imports of other edible oils were also placed under OGL and import duty was as high as 80 percent on crude oil and 90 percent on refined edible oils during early-2000s. The import duties on edible oils were reduced to zero percent for crude oils and 7.5 percent for refined oils with effect from 1st April, 2008. The import duty on crude edible oils was increased to 2.5 per cent in 2013, which was further increased to 7.5 percent in December 2014 and 12.5 percent in September 2015. Import duty on refined edible oils was increased from 7.5 percent to 10 percent in January 2014, which was further increased to 15
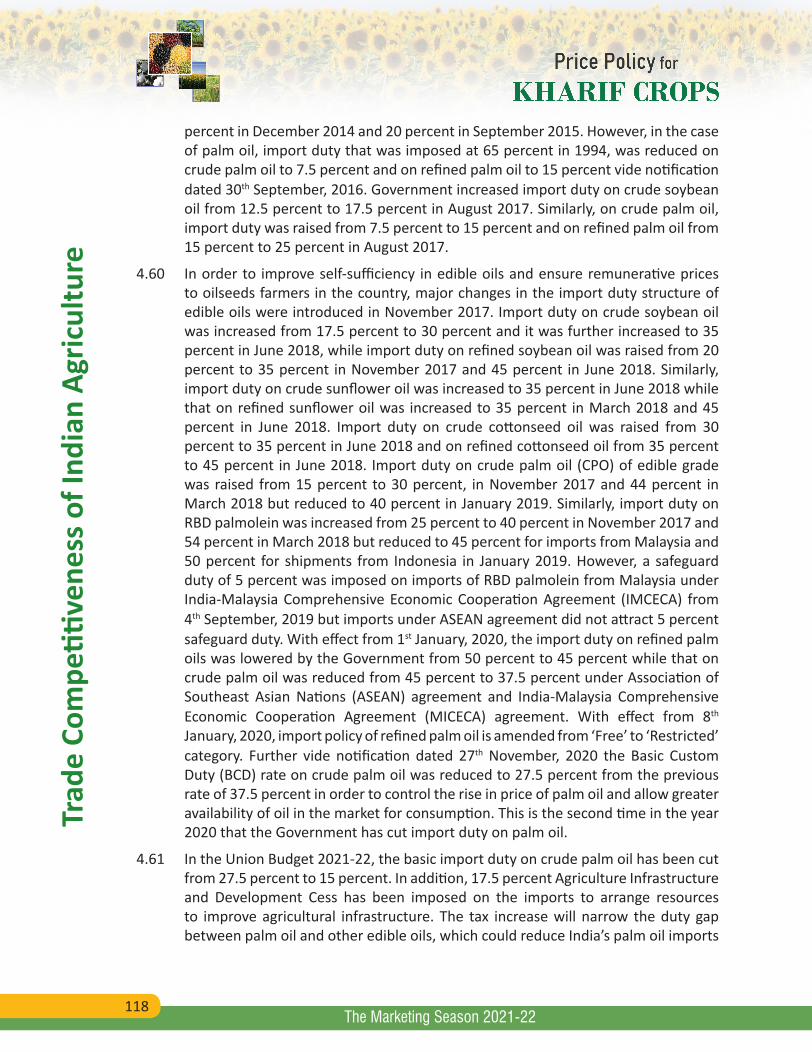
118
Trad
e Co
mpe
titive
ness
of I
ndia
n Ag
ricul
ture
The Marketing Season 2021-22
percent in December 2014 and 20 percent in September 2015. However, in the case of palm oil, import duty that was imposed at 65 percent in 1994, was reduced on crude palm oil to 7.5 percent and on refined palm oil to 15 percent vide notification dated 30th September, 2016. Government increased import duty on crude soybean oil from 12.5 percent to 17.5 percent in August 2017. Similarly, on crude palm oil, import duty was raised from 7.5 percent to 15 percent and on refined palm oil from 15 percent to 25 percent in August 2017.
4.60 In order to improve self-sufficiency in edible oils and ensure remunerative prices to oilseeds farmers in the country, major changes in the import duty structure of edible oils were introduced in November 2017. Import duty on crude soybean oil was increased from 17.5 percent to 30 percent and it was further increased to 35 percent in June 2018, while import duty on refined soybean oil was raised from 20 percent to 35 percent in November 2017 and 45 percent in June 2018. Similarly, import duty on crude sunflower oil was increased to 35 percent in June 2018 while that on refined sunflower oil was increased to 35 percent in March 2018 and 45 percent in June 2018. Import duty on crude cottonseed oil was raised from 30 percent to 35 percent in June 2018 and on refined cottonseed oil from 35 percent to 45 percent in June 2018. Import duty on crude palm oil (CPO) of edible grade was raised from 15 percent to 30 percent, in November 2017 and 44 percent in March 2018 but reduced to 40 percent in January 2019. Similarly, import duty on RBD palmolein was increased from 25 percent to 40 percent in November 2017 and 54 percent in March 2018 but reduced to 45 percent for imports from Malaysia and 50 percent for shipments from Indonesia in January 2019. However, a safeguard duty of 5 percent was imposed on imports of RBD palmolein from Malaysia under India-Malaysia Comprehensive Economic Cooperation Agreement (IMCECA) from 4th September, 2019 but imports under ASEAN agreement did not attract 5 percent safeguard duty. With effect from 1st January, 2020, the import duty on refined palm oils was lowered by the Government from 50 percent to 45 percent while that on crude palm oil was reduced from 45 percent to 37.5 percent under Association of Southeast Asian Nations (ASEAN) agreement and India-Malaysia Comprehensive Economic Cooperation Agreement (MICECA) agreement. With effect from 8th January, 2020, import policy of refined palm oil is amended from ‘Free’ to ‘Restricted’ category. Further vide notification dated 27th November, 2020 the Basic Custom Duty (BCD) rate on crude palm oil was reduced to 27.5 percent from the previous rate of 37.5 percent in order to control the rise in price of palm oil and allow greater availability of oil in the market for consumption. This is the second time in the year 2020 that the Government has cut import duty on palm oil.
4.61 In the Union Budget 2021-22, the basic import duty on crude palm oil has been cut from 27.5 percent to 15 percent. In addition, 17.5 percent Agriculture Infrastructure and Development Cess has been imposed on the imports to arrange resources to improve agricultural infrastructure. The tax increase will narrow the duty gap between palm oil and other edible oils, which could reduce India’s palm oil imports
119
Trad
e Co
mpe
titive
ness
of I
ndia
n Ag
ricul
ture
The Marketing Season 2021-22
and potentially put pressure on world palm oil prices. India also imposed 20 percent cess on crude soybean and sunflower oil imports but reduced basic customs duty on both the commodities from 35 percent to 15 percent, effectively keeping the import duty unchanged. Import duties on major edible and crude oils as on 2nd February, 2021 are listed in Annex Table 4.6.
4.62 Export of edible oils was initially prohibited for a period of one year in March 2008, which was extended from time to time. With effect from 6th February, 2015, export of rice bran oil in bulk has been permitted. With effect from 6th April, 2018, exports of all edible oils except mustard oil were made free without quantitative ceiling; pack size etc, till further orders. Export of mustard oil is permitted in packs of up to 5 kg with a Minimum Export Price (MEP) of US$900 per tonne.
4.63 Oilseed exports continue to be under ‘free category’ except breeder/foundation/wild variety seeds that are not allowed for export from India. As regards tariff rates, import of groundnut and sunflower seed are under OGL with an import duty of 30 percent while import duty on soybean seed is 45 percent.
Cotton
Global Production and Trade
4.64 Global production of cotton has increased from 23 million tonnes in 2016-17 to 26.6 million tonnes in 2019-20. India has been major cotton producer in the world for last few decades and India produced 23.1 percent of the global cotton in TE2019-20, closely followed by China (22.6%), USA (16.2%), Brazil (10%) and Pakistan (6%). Chart 4.30 illustrates the shares of major producers, exporters and importers of cotton in the world in TE2019-20. About 34.2 percent of world cotton production was traded in TE2019-20 and USA was the largest exporter with a share of 37.4 percent, followed by Brazil (15.4%), India (9.6%) and Australia (7.1%). China is the largest importer with a share of 18 percent followed by Bangladesh (17.7%) and Vietnam (16.4%).
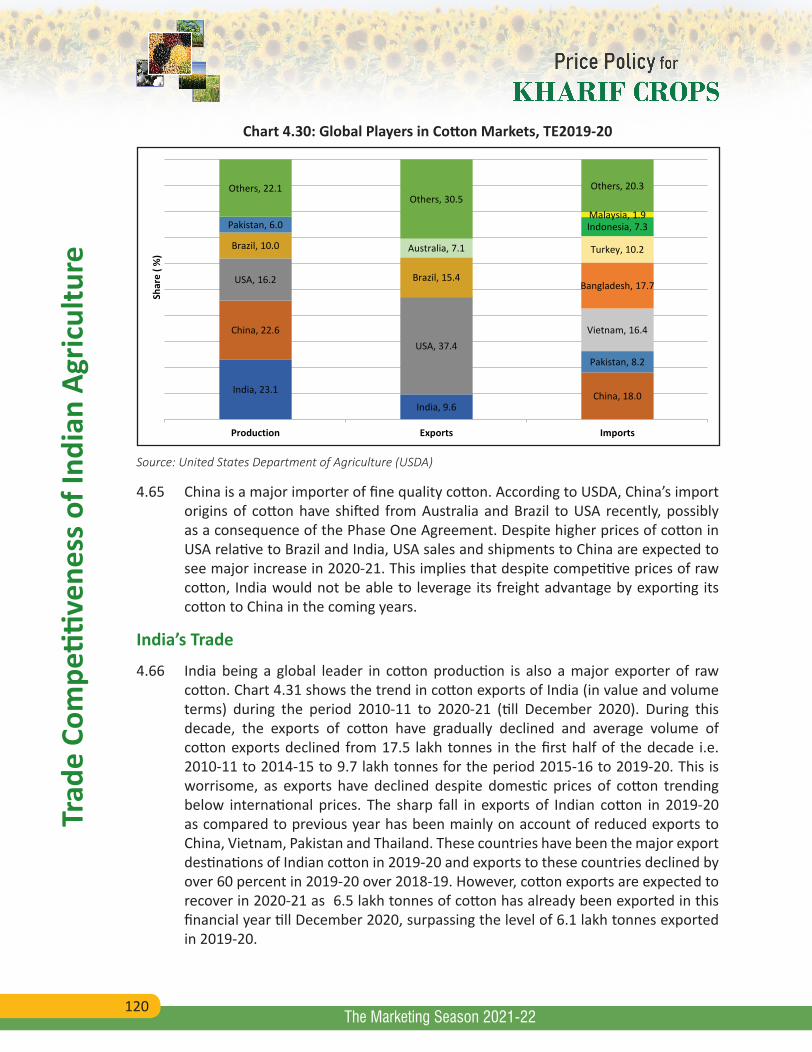
120
Trad
e Co
mpe
titive
ness
of I
ndia
n Ag
ricul
ture
The Marketing Season 2021-22
Chart 4.30: Global Players in Cotton Markets, TE2019-20
India, 23.1
India, 9.6
China, 22.6
China, 18.0
USA, 16.2
USA, 37.4
Brazil, 10.0
Brazil, 15.4
Pakistan, 6.0
Pakistan, 8.2
Australia, 7.1
Vietnam, 16.4
Bangladesh, 17.7
Turkey, 10.2
Indonesia, 7.3 Malaysia, 1.9
Others, 22.1 Others, 30.5
Others, 20.3
Production Exports Imports
Shar
e ( %
)
Source: United States Department of Agriculture (USDA)
4.65 China is a major importer of fine quality cotton. According to USDA, China’s import origins of cotton have shifted from Australia and Brazil to USA recently, possibly as a consequence of the Phase One Agreement. Despite higher prices of cotton in USA relative to Brazil and India, USA sales and shipments to China are expected to see major increase in 2020-21. This implies that despite competitive prices of raw cotton, India would not be able to leverage its freight advantage by exporting its cotton to China in the coming years.
India’s Trade
4.66 India being a global leader in cotton production is also a major exporter of raw cotton. Chart 4.31 shows the trend in cotton exports of India (in value and volume terms) during the period 2010-11 to 2020-21 (till December 2020). During this decade, the exports of cotton have gradually declined and average volume of cotton exports declined from 17.5 lakh tonnes in the first half of the decade i.e. 2010-11 to 2014-15 to 9.7 lakh tonnes for the period 2015-16 to 2019-20. This is worrisome, as exports have declined despite domestic prices of cotton trending below international prices. The sharp fall in exports of Indian cotton in 2019-20 as compared to previous year has been mainly on account of reduced exports to China, Vietnam, Pakistan and Thailand. These countries have been the major export destinations of Indian cotton in 2019-20 and exports to these countries declined by over 60 percent in 2019-20 over 2018-19. However, cotton exports are expected to recover in 2020-21 as 6.5 lakh tonnes of cotton has already been exported in this financial year till December 2020, surpassing the level of 6.1 lakh tonnes exported in 2019-20.
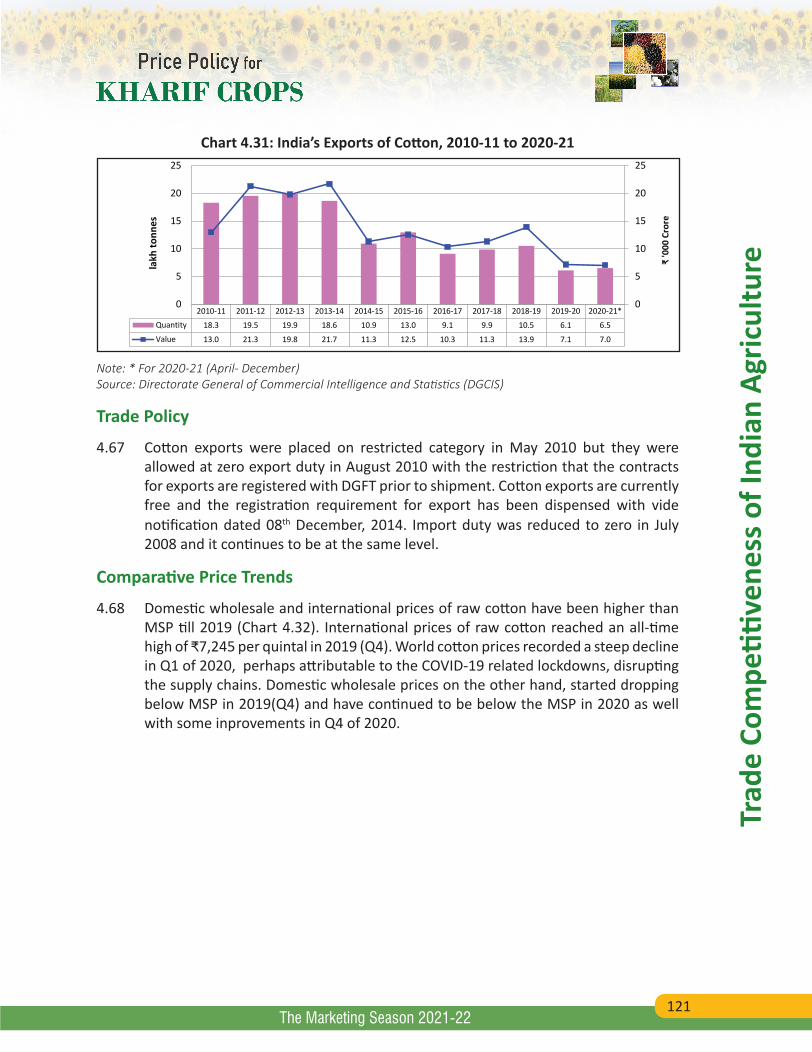
121
Trad
e Co
mpe
titive
ness
of I
ndia
n Ag
ricul
ture
The Marketing Season 2021-22
Chart 4.31: India’s Exports of Cotton, 2010-11 to 2020-21
2010-11 2011-12 2012-13 2013-14 2014-15 2015-16 2016-17 2017-18 2018-19 2019-20 2020-21*
Quantity 18.3 19.5 19.9 18.6 10.9 13.0 9.1 9.9 10.5 6.1 6.5
Value 13.0 21.3 19.8 21.7 11.3 12.5 10.3 11.3 13.9 7.1 7.0
0
5
10
15
20
25
0
5
10
15
20
25la
kh to
nnes
₹ '0
00 C
rore
Note: * For 2020-21 (April- December)Source: Directorate General of Commercial Intelligence and Statistics (DGCIS)
Trade Policy
4.67 Cotton exports were placed on restricted category in May 2010 but they were allowed at zero export duty in August 2010 with the restriction that the contracts for exports are registered with DGFT prior to shipment. Cotton exports are currently free and the registration requirement for export has been dispensed with vide notification dated 08th December, 2014. Import duty was reduced to zero in July 2008 and it continues to be at the same level.
Comparative Price Trends
4.68 Domestic wholesale and international prices of raw cotton have been higher than MSP till 2019 (Chart 4.32). International prices of raw cotton reached an all-time high of ₹7,245 per quintal in 2019 (Q4). World cotton prices recorded a steep decline in Q1 of 2020, perhaps attributable to the COVID-19 related lockdowns, disrupting the supply chains. Domestic wholesale prices on the other hand, started dropping below MSP in 2019(Q4) and have continued to be below the MSP in 2020 as well with some inprovements in Q4 of 2020.
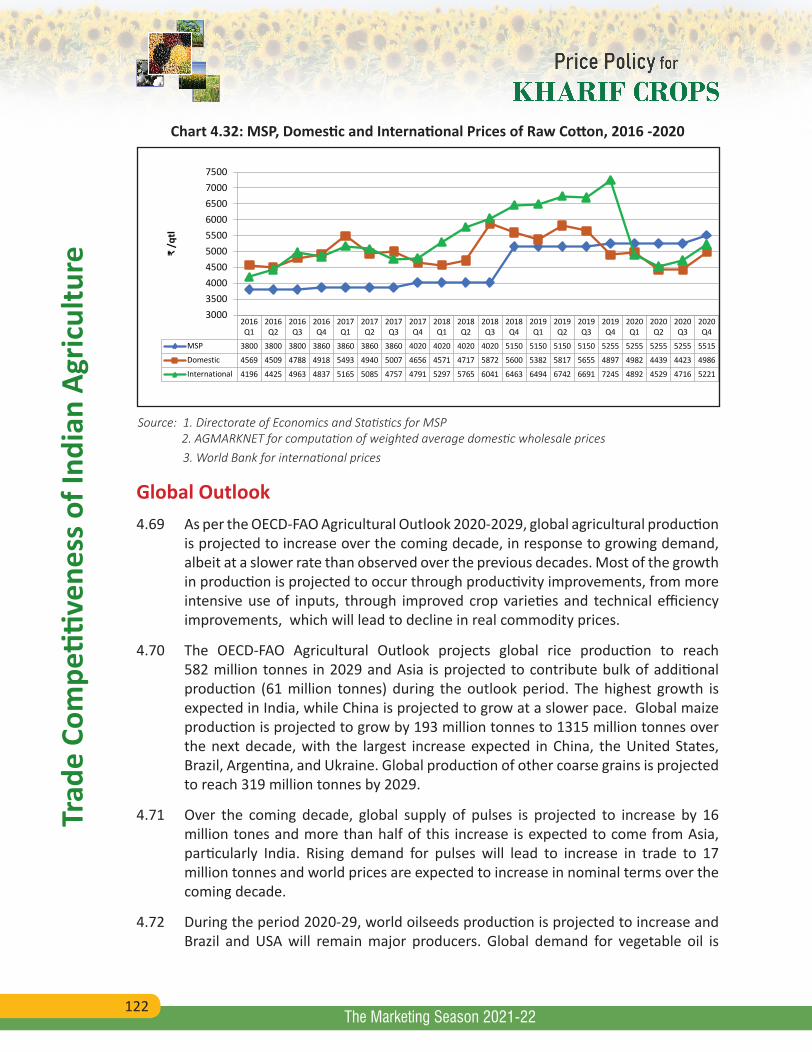
122
Trad
e Co
mpe
titive
ness
of I
ndia
n Ag
ricul
ture
The Marketing Season 2021-22
Chart 4.32: MSP, Domestic and International Prices of Raw Cotton, 2016 -2020
2016Q1
2016Q2
2016Q3
2016Q4
2017Q1
2017Q2
2017Q3
2017Q4
2018Q1
2018Q2
2018Q3
2018Q4
2019Q1
2019Q2
2019Q3
2019Q4
2020Q1
2020Q2
2020Q3
2020Q4
MSP 3800 3800 3800 3860 3860 3860 3860 4020 4020 4020 4020 5150 5150 5150 5150 5255 5255 5255 5255 5515
Domestic 4569 4509 4788 4918 5493 4940 5007 4656 4571 4717 5872 5600 5382 5817 5655 4897 4982 4439 4423 4986
International 4196 4425 4963 4837 5165 5085 4757 4791 5297 5765 6041 6463 6494 6742 6691 7245 4892 4529 4716 5221
3000350040004500500055006000650070007500
₹ /q
tl
Source: 1. Directorate of Economics and Statistics for MSP 2. AGMARKNET for computation of weighted average domestic wholesale prices 3. World Bank for international prices
Global Outlook4.69 As per the OECD-FAO Agricultural Outlook 2020-2029, global agricultural production
is projected to increase over the coming decade, in response to growing demand, albeit at a slower rate than observed over the previous decades. Most of the growth in production is projected to occur through productivity improvements, from more intensive use of inputs, through improved crop varieties and technical efficiency improvements, which will lead to decline in real commodity prices.
4.70 The OECD-FAO Agricultural Outlook projects global rice production to reach 582 million tonnes in 2029 and Asia is projected to contribute bulk of additional production (61 million tonnes) during the outlook period. The highest growth is expected in India, while China is projected to grow at a slower pace. Global maize production is projected to grow by 193 million tonnes to 1315 million tonnes over the next decade, with the largest increase expected in China, the United States, Brazil, Argentina, and Ukraine. Global production of other coarse grains is projected to reach 319 million tonnes by 2029.
4.71 Over the coming decade, global supply of pulses is projected to increase by 16 million tones and more than half of this increase is expected to come from Asia, particularly India. Rising demand for pulses will lead to increase in trade to 17 million tonnes and world prices are expected to increase in nominal terms over the coming decade.
4.72 During the period 2020-29, world oilseeds production is projected to increase and Brazil and USA will remain major producers. Global demand for vegetable oil is
123
Trad
e Co
mpe
titive
ness
of I
ndia
n Ag
ricul
ture
The Marketing Season 2021-22
projected to rise and will put upward pressure on vegetable oil prices. The increase in protein meal utilization is projected to be lower compared to the past decade.
4.73 World cotton production is projected to reach about 30 million tonnes driven by both, area expansion and yield improvement. India will continue to be the largest producer in the world and global players will remain the same. Global cotton prices are expected to increase in nominal terms but are expected to decline in real terms over the projection period due to competition from synthetic fibres.
Recapitulation4.74 Despite COVID-19 pandemic, India’s agricultural exports remained largely unaffected,
registering a growth rate of 15.8 percent in Apr-Dec 2020 over corresponding period last year. The export earnings were buoyant also owing to steep increase in global commodity prices, which is due to steady normalization of demand with most countries unlocking their economies post COVID-19. As a result India had a net trade surplus in agriculture. The OECD outlook also expects India to experience a reversal in net-importing trend of pulses by 2025 and restructure the global pulses trade. However, India needs a long-term strategy to curb high import dependence on edible oils, which presently constitutes about 40 percent of the total agri-import bill. It is of vital importance that there should be synchronization between India’s agricultural trade policy, procurement policy and price policy, which will further incentivize rational cropping patterns and boost agricultural exports of the country.
*****
124
Chap
ter 5
Chapter 5
The Marketing Season 2021-22
Costs, Returns and Inter-Crop Parity
5.1 The Commission considers the cost of production and other important factors such as demand-supply situation and price trends in domestic and world markets, inter-crop price parity, terms of trade between agriculture and non-agriculture sectors, likely impact of MSP on the economy, rational utilization of land, water and other production resources, and a minimum of 50 percent as the margin over cost of production, while recommending MSPs of mandated kharif crops.
5.2 The Commission uses cost estimates provided by the Directorate of Economics and Statistics (DES), Ministry of Agriculture and Farmers Welfare, Government of India compiled under ‘Comprehensive Scheme (CS) for Studying the Cost of Cultivation of Principal Crops in India’. Since CS data is available up to crop season 2018-19, it needs to be projected for crop season 2021-22. Based on CS data, crop-wise and State-wise projections of cost of cultivation (CoC) are made for the ensuing season.
5.3 The projected CoC estimates for kharif crops for the 2021-22 crop season are based on the latest three year actual cost estimates from 2016-17 to 2018-19 for most of the States. However, for paddy, jowar, maize, tur, moong, urad, groundnut and cotton in Andhra Pradesh and Telangana, tur and moong in Bihar, urad in Gujarat and Rajasthan, soybean and sesamum in Karnataka, moong and groundnut in Madhya Pradesh and Uttar Pradesh, ragi in Maharashtra and Odisha, ragi, tur, moong and sesamum in Tamil Nadu, soybean in Telangana and moong in West Bengal, CoC estimates are based on actual cost estimates available for the latest two years viz. 2017-18 and 2018-19, as data for 2016-17 were not available. In case of sunflower in Odisha, CoC estimates are based on actual cost estimates available only for 2018-19. The CoC estimates are not projected for a crop in the State, where either share of the State in all-India production or share of a particular crop in total production of the crop group in the State is negligible or number of sample holdings under CS for the crop is inadequate.
5.4 The estimates of CoC projections capture movement in overall input cost separately for the year 2021-22 over each of three years viz. 2016-17, 2017-18 and 2018-19 where projections are based on three years, two years viz. 2017-18 and 2018-19 where projections are based on these two years, and one year viz. 2018-19 where projections are based on one year for each State.
125
Cost
s, R
etur
ns a
nd In
ter-
Crop
Par
ity
The Marketing Season 2021-22
5.5 An assessment of likely changes in input costs for the crop year 2021-22 with reference to each of the three consecutive years ending with 2018-19 where projections are based on three years, two years ending with 2018-19 where projections are based on two years, and one year viz. 2018-19 for Odisha in sunflower, is made by constructing the Composite Input Price Indices (CIPIs) (base 2011-12=100) for each State. The CIPIs are based on latest prices of different inputs like human labour, bullock labour, machine labour, fertilisers and manures, seeds, pesticides and irrigation as per latest data from Labour Bureau, Ministry of Labour and Employment, State Governments and Office of the Economic Adviser, Ministry of Commerce and Industry. Based on the CIPIs, the Commission projects State-wise CoC A2, A2+FL and C2 for each mandated crop.
5.6 The State-wise cost of production (CoP) A2, A2+FL and C2 estimates for the mandated crops are then derived by using respective projected CoC estimates, ratio of main product (MP) to gross value of output (GVO) and projected yield, for each crop. Subsequently, all-India estimates of CoP A2, A2+FL and C2 are derived based on State-wise CoP of crops and their production shares in total production. These projected all-India CoP estimates are considered by the Commission while formulating price policy recommendations.
5.7 The Commission has undertaken cost projection exercise under certain implicit assumptions. One, it is assumed that fixed cost components would not, in all likelihood, undergo any significant change in the intervening period between 2018-19 for which actual cost estimates are available and the year 2021-22 for which cost projections are made. Two, since yield varies from year to year due to various factors, three-year average yield, where projections are based on three years, and two-year average yield, where projections are based on latest two years, has been taken for smoothing fluctuations in yield and hence in CoP. However, in cases where there are wide fluctuations in the yield, Olympic average yield (Olympic average yield is calculated by dropping the highest and the lowest yield from latest five year yields and calculating the average of the remaining 3-year yield) has been used. Due to inadequate sample size and large variations in CS data, the yield of ragi in Maharashtra has been projected based on time series of yield under Comprehensive Scheme, while yield of jowar, ragi and tur in Tamil Nadu, jowar, moong, tur and urad in Telangana, urad in Chhattisgarh, nigerseed and sunflower in Odisha, and sesamum in Karnataka, has been projected based on yield data published in ‘Agricultural Statistics at a Glance 2019’ by Directorate of Economics and Statistics, Ministry of Agriculture and Farmers Welfare, Government of India.
Costs and Returns of Kharif Crops during TE2018-19 5.8 The all-India average costs, GVO and gross returns during TE2018-19 in respect of
mandated kharif crops have been analysed and are given in Table 5.1 and Chart 5.1. It is pertinent to mention that gross value of output (GVO) is estimated at prevailing market prices of main product and by-products during harvest season in village/
126
Cost
s, R
etur
ns a
nd In
ter-
Crop
Par
ity
The Marketing Season 2021-22
cluster of villages where the crops are grown and harvested. Among all crops, during TE2018-19, per hectare all-India average CoC A2, A2+FL and GVO were the highest for cotton at ₹47,365, ₹58,742 and ₹84,792, respectively, whereas, these were lowest for nigerseed at ₹7162, ₹16,022 and ₹14,236, respectively.
5.9 Per hectare gross returns over A2+FL cost were the highest for cotton at ₹26,050, followed by groundnut (₹22,241), tur (₹21,220), paddy (₹20,973), maize (₹15,219), and lowest for moong at ₹6,262, while nigerseed has a net loss of ₹1,786 per hectare. Per hectare returns over A2 cost were highest for cotton at ₹37,427, followed by paddy (₹32,516), groundnut (₹31,853), tur (₹29,261), maize (₹24,728), and lowest for nigerseed (₹7,074). It can be seen that all-India average gross returns as percentage of CoC A2+FL were highest at 55.6 percent for tur, followed by paddy (44.7%), cotton (44.3%), sunflower (44.3%), and lowest for ragi (17.2%), while it was negative (-)11.1 percent for nigerseed. The average gross returns as percentage of CoC A2 were highest at 122.6 percent in bajra, followed by sesamum (118%), nigerseed (98.8%), tur (97.1%), moong (96.7%), and lowest at 53.5 percent in soybean. Chart 5.1 shows the gross returns over A2 and A2+FL cost for all mandated kharif crops. It is evident that there is a need for enhancing productivity, reducing costs and ensuring better prices to farmers growing nutri-cereals, pulses and oilseeds for improving profitability. The details of State-wise average gross returns over actual CoC A2 and A2+FL of mandated kharif crops during TE2018-19 are given in Annex Table 5.1.
5.10 Among cereals, although maize had lower CoC than paddy, per hectare gross returns over both A2 and A2+FL CoC for paddy were higher than respective returns for maize due to reasonably higher yield and prices of paddy than maize. Nutri-cereals have lower average gross returns largely due to significantly low productivity. Among nutri-cereals, returns over CoC A2+FL were highest for jowar (₹7,896/ha), followed by bajra (₹7,571/ha), and lowest for ragi (₹6,784/ha), whereas, returns over CoC A2 were maximum in bajra (₹19,082/ha), followed by ragi (₹17,319/ha), and minimum in jowar at ₹15,766 per hectare. Having even lowest market price among nutri-cereals, returns as percentage of CoC from bajra were higher than jowar and ragi due to reasonably higher yield of bajra.
5.11 Among pulses, average gross returns per hectare over A2 and A2+FL CoC were highest for tur, followed by urad, and lowest for moong. Urad has significantly lower cost of cultivation than tur but returns from tur were higher than urad due to significantly higher yield in tur. Similarly, moong has significantly lower cost of cultivation than urad, but returns from urad were higher than moong due to reasonably higher yield in urad.
5.12 In case of oilseeds, per hectare gross returns over CoC A2+FL were highest for groundnut (₹22,241), followed by sunflower (₹9,277), soybean (₹8,762), and lowest for sesamum (₹8,452), with negative returns for nigerseed. Returns over CoC A2 were highest for groundnut (₹31,853), followed by sesamum (₹16,750), soybean
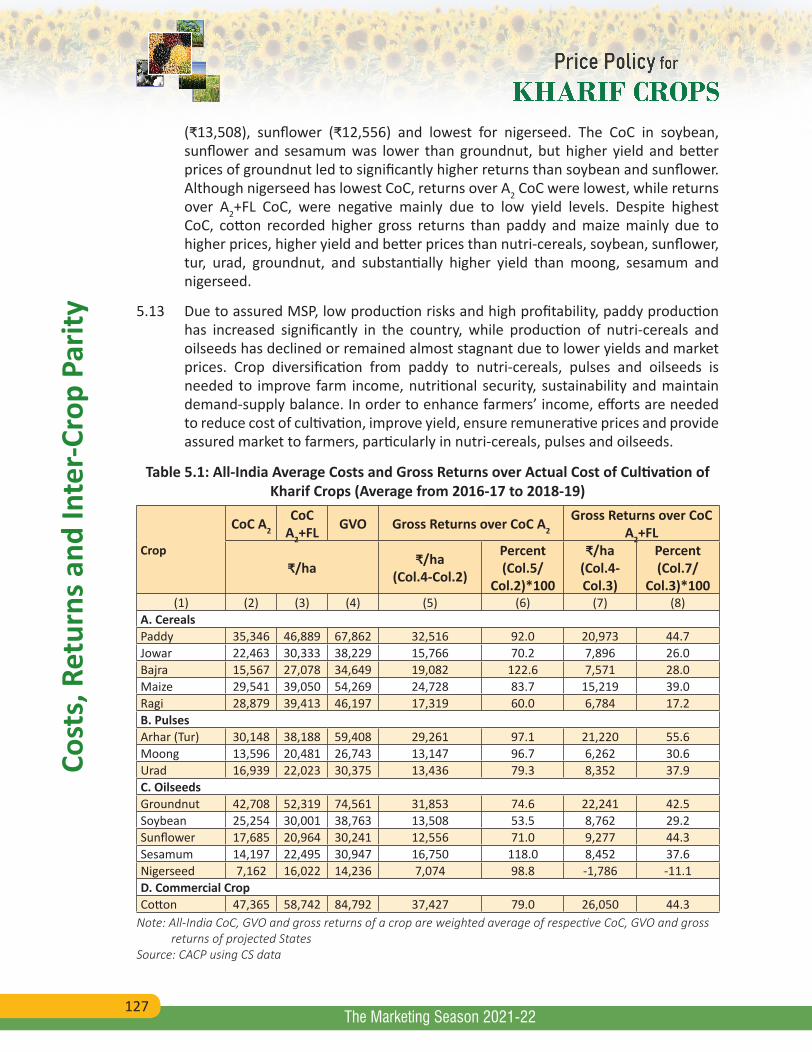
127
Cost
s, R
etur
ns a
nd In
ter-
Crop
Par
ity
The Marketing Season 2021-22
(₹13,508), sunflower (₹12,556) and lowest for nigerseed. The CoC in soybean, sunflower and sesamum was lower than groundnut, but higher yield and better prices of groundnut led to significantly higher returns than soybean and sunflower. Although nigerseed has lowest CoC, returns over A2 CoC were lowest, while returns over A2+FL CoC, were negative mainly due to low yield levels. Despite highest CoC, cotton recorded higher gross returns than paddy and maize mainly due to higher prices, higher yield and better prices than nutri-cereals, soybean, sunflower, tur, urad, groundnut, and substantially higher yield than moong, sesamum and nigerseed.
5.13 Due to assured MSP, low production risks and high profitability, paddy production has increased significantly in the country, while production of nutri-cereals and oilseeds has declined or remained almost stagnant due to lower yields and market prices. Crop diversification from paddy to nutri-cereals, pulses and oilseeds is needed to improve farm income, nutritional security, sustainability and maintain demand-supply balance. In order to enhance farmers’ income, efforts are needed to reduce cost of cultivation, improve yield, ensure remunerative prices and provide assured market to farmers, particularly in nutri-cereals, pulses and oilseeds.
Table 5.1: All-India Average Costs and Gross Returns over Actual Cost of Cultivation of Kharif Crops (Average from 2016-17 to 2018-19)
Crop
CoC A2
CoC A2+FL GVO Gross Returns over CoC A2
Gross Returns over CoC A2+FL
₹/ha ₹/ha (Col.4-Col.2)
Percent (Col.5/
Col.2)*100
₹/ha (Col.4-Col.3)
Percent (Col.7/
Col.3)*100(1) (2) (3) (4) (5) (6) (7) (8)
A. CerealsPaddy 35,346 46,889 67,862 32,516 92.0 20,973 44.7Jowar 22,463 30,333 38,229 15,766 70.2 7,896 26.0Bajra 15,567 27,078 34,649 19,082 122.6 7,571 28.0Maize 29,541 39,050 54,269 24,728 83.7 15,219 39.0Ragi 28,879 39,413 46,197 17,319 60.0 6,784 17.2B. PulsesArhar (Tur) 30,148 38,188 59,408 29,261 97.1 21,220 55.6Moong 13,596 20,481 26,743 13,147 96.7 6,262 30.6Urad 16,939 22,023 30,375 13,436 79.3 8,352 37.9C. OilseedsGroundnut 42,708 52,319 74,561 31,853 74.6 22,241 42.5Soybean 25,254 30,001 38,763 13,508 53.5 8,762 29.2Sunflower 17,685 20,964 30,241 12,556 71.0 9,277 44.3Sesamum 14,197 22,495 30,947 16,750 118.0 8,452 37.6Nigerseed 7,162 16,022 14,236 7,074 98.8 -1,786 -11.1D. Commercial CropCotton 47,365 58,742 84,792 37,427 79.0 26,050 44.3
Note: All-India CoC, GVO and gross returns of a crop are weighted average of respective CoC, GVO and gross returns of projected StatesSource: CACP using CS data
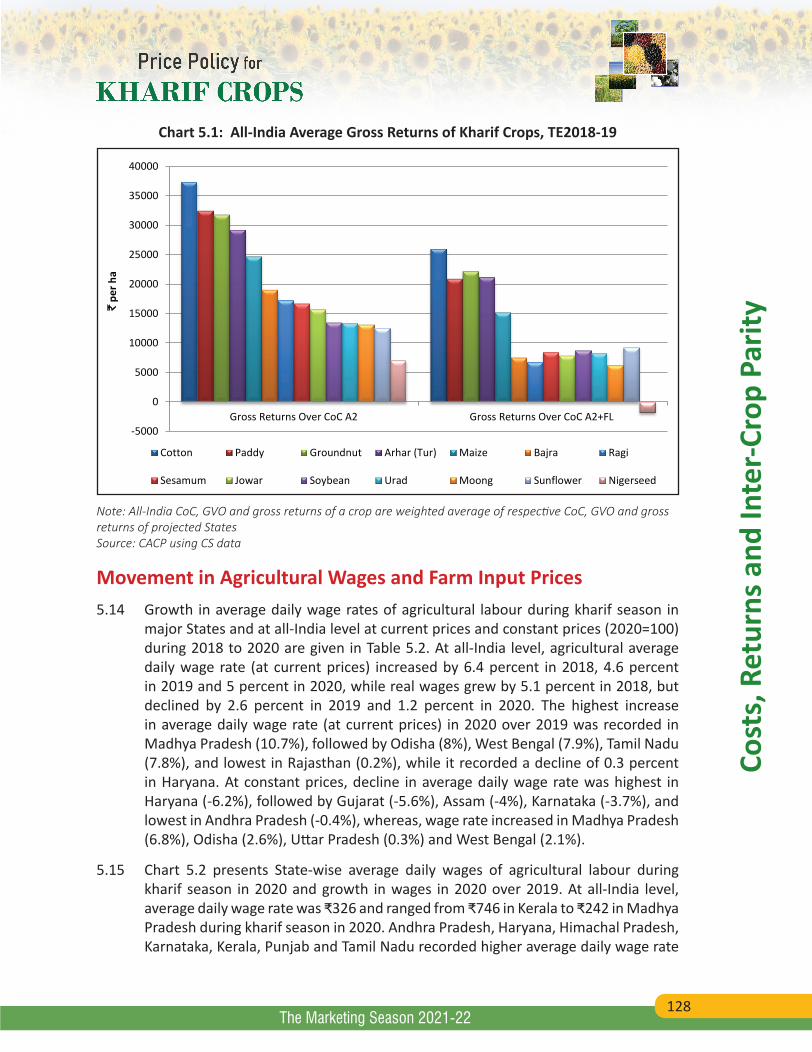
128
Cost
s, R
etur
ns a
nd In
ter-
Crop
Par
ity
The Marketing Season 2021-22
Chart 5.1: All-India Average Gross Returns of Kharif Crops, TE2018-19
-5000
0
5000
10000
15000
20000
25000
30000
35000
40000
Gross Returns Over CoC A2 Gross Returns Over CoC A2+FL
` p
er h
a
Cotton Paddy Groundnut Arhar (Tur) Maize Bajra Ragi
Sesamum Jowar Soybean Urad Moong Sunflower Nigerseed
Note: All-India CoC, GVO and gross returns of a crop are weighted average of respective CoC, GVO and gross returns of projected StatesSource: CACP using CS data
Movement in Agricultural Wages and Farm Input Prices5.14 Growth in average daily wage rates of agricultural labour during kharif season in
major States and at all-India level at current prices and constant prices (2020=100) during 2018 to 2020 are given in Table 5.2. At all-India level, agricultural average daily wage rate (at current prices) increased by 6.4 percent in 2018, 4.6 percent in 2019 and 5 percent in 2020, while real wages grew by 5.1 percent in 2018, but declined by 2.6 percent in 2019 and 1.2 percent in 2020. The highest increase in average daily wage rate (at current prices) in 2020 over 2019 was recorded in Madhya Pradesh (10.7%), followed by Odisha (8%), West Bengal (7.9%), Tamil Nadu (7.8%), and lowest in Rajasthan (0.2%), while it recorded a decline of 0.3 percent in Haryana. At constant prices, decline in average daily wage rate was highest in Haryana (-6.2%), followed by Gujarat (-5.6%), Assam (-4%), Karnataka (-3.7%), and lowest in Andhra Pradesh (-0.4%), whereas, wage rate increased in Madhya Pradesh (6.8%), Odisha (2.6%), Uttar Pradesh (0.3%) and West Bengal (2.1%).
5.15 Chart 5.2 presents State-wise average daily wages of agricultural labour during kharif season in 2020 and growth in wages in 2020 over 2019. At all-India level, average daily wage rate was ₹326 and ranged from ₹746 in Kerala to ₹242 in Madhya Pradesh during kharif season in 2020. Andhra Pradesh, Haryana, Himachal Pradesh, Karnataka, Kerala, Punjab and Tamil Nadu recorded higher average daily wage rate
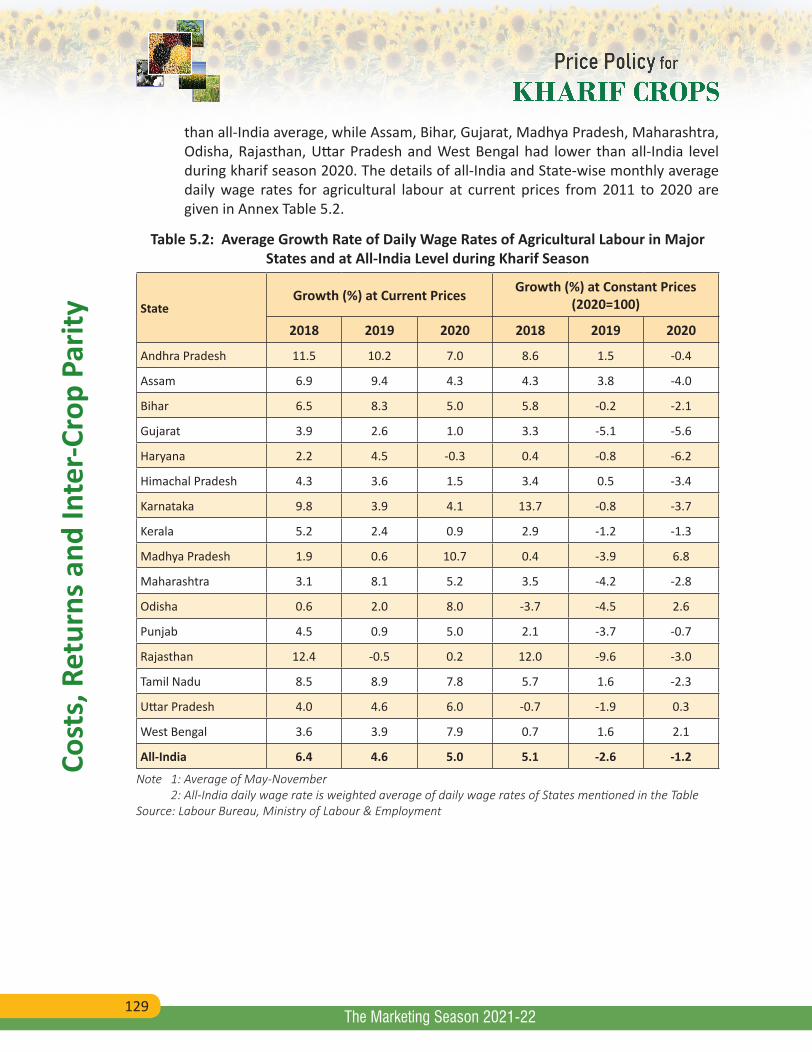
129
Cost
s, R
etur
ns a
nd In
ter-
Crop
Par
ity
The Marketing Season 2021-22
than all-India average, while Assam, Bihar, Gujarat, Madhya Pradesh, Maharashtra, Odisha, Rajasthan, Uttar Pradesh and West Bengal had lower than all-India level during kharif season 2020. The details of all-India and State-wise monthly average daily wage rates for agricultural labour at current prices from 2011 to 2020 are given in Annex Table 5.2.
Table 5.2: Average Growth Rate of Daily Wage Rates of Agricultural Labour in Major States and at All-India Level during Kharif Season
StateGrowth (%) at Current Prices Growth (%) at Constant Prices
(2020=100)
2018 2019 2020 2018 2019 2020
Andhra Pradesh 11.5 10.2 7.0 8.6 1.5 -0.4
Assam 6.9 9.4 4.3 4.3 3.8 -4.0
Bihar 6.5 8.3 5.0 5.8 -0.2 -2.1
Gujarat 3.9 2.6 1.0 3.3 -5.1 -5.6
Haryana 2.2 4.5 -0.3 0.4 -0.8 -6.2
Himachal Pradesh 4.3 3.6 1.5 3.4 0.5 -3.4
Karnataka 9.8 3.9 4.1 13.7 -0.8 -3.7
Kerala 5.2 2.4 0.9 2.9 -1.2 -1.3
Madhya Pradesh 1.9 0.6 10.7 0.4 -3.9 6.8
Maharashtra 3.1 8.1 5.2 3.5 -4.2 -2.8
Odisha 0.6 2.0 8.0 -3.7 -4.5 2.6
Punjab 4.5 0.9 5.0 2.1 -3.7 -0.7
Rajasthan 12.4 -0.5 0.2 12.0 -9.6 -3.0
Tamil Nadu 8.5 8.9 7.8 5.7 1.6 -2.3
Uttar Pradesh 4.0 4.6 6.0 -0.7 -1.9 0.3
West Bengal 3.6 3.9 7.9 0.7 1.6 2.1
All-India 6.4 4.6 5.0 5.1 -2.6 -1.2
Note 1: Average of May-November 2: All-India daily wage rate is weighted average of daily wage rates of States mentioned in the Table Source: Labour Bureau, Ministry of Labour & Employment
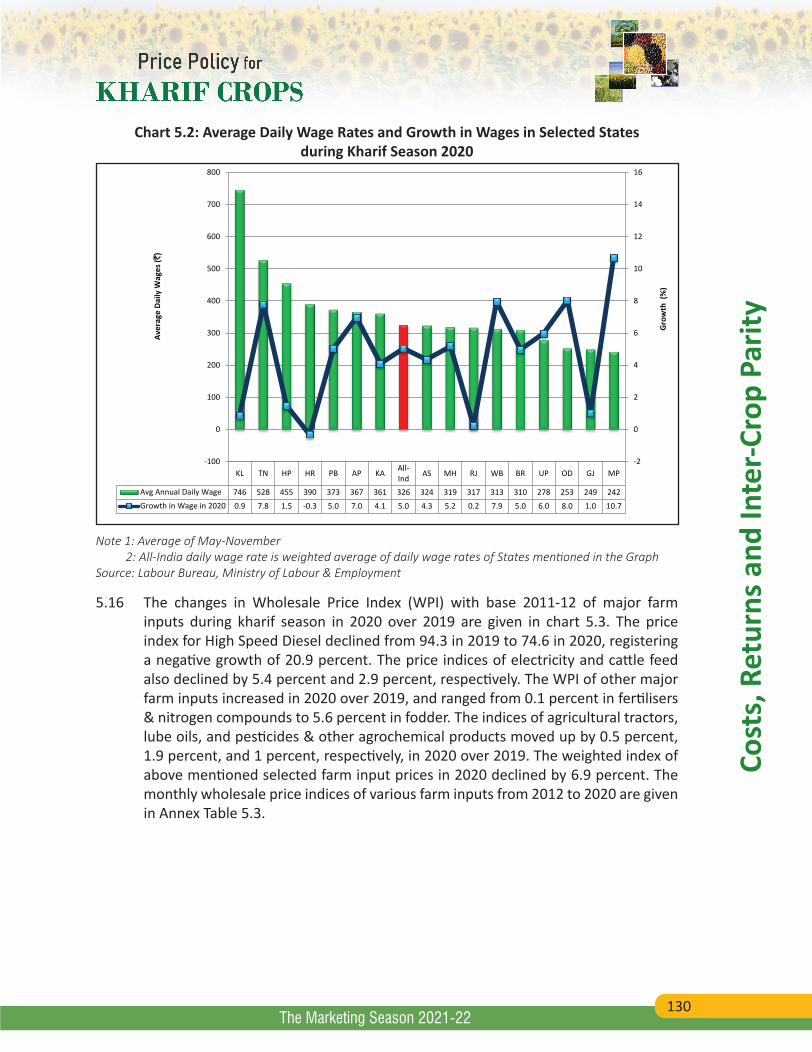
130
Cost
s, R
etur
ns a
nd In
ter-
Crop
Par
ity
The Marketing Season 2021-22
Chart 5.2: Average Daily Wage Rates and Growth in Wages in Selected States during Kharif Season 2020
KL TN HP HR PB AP KA All-Ind AS MH RJ WB BR UP OD GJ MP
Avg Annual Daily Wage 746 528 455 390 373 367 361 326 324 319 317 313 310 278 253 249 242Growth in Wage in 2020 0.9 7.8 1.5 -0.3 5.0 7.0 4.1 5.0 4.3 5.2 0.2 7.9 5.0 6.0 8.0 1.0 10.7
-2
0
2
4
6
8
10
12
14
16
-100
0
100
200
300
400
500
600
700
800
Gro
wth
(%
)
Aver
age
Daily
Wag
es (`
)
Note 1: Average of May-November 2: All-India daily wage rate is weighted average of daily wage rates of States mentioned in the Graph Source: Labour Bureau, Ministry of Labour & Employment
5.16 The changes in Wholesale Price Index (WPI) with base 2011-12 of major farm inputs during kharif season in 2020 over 2019 are given in chart 5.3. The price index for High Speed Diesel declined from 94.3 in 2019 to 74.6 in 2020, registering a negative growth of 20.9 percent. The price indices of electricity and cattle feed also declined by 5.4 percent and 2.9 percent, respectively. The WPI of other major farm inputs increased in 2020 over 2019, and ranged from 0.1 percent in fertilisers & nitrogen compounds to 5.6 percent in fodder. The indices of agricultural tractors, lube oils, and pesticides & other agrochemical products moved up by 0.5 percent, 1.9 percent, and 1 percent, respectively, in 2020 over 2019. The weighted index of above mentioned selected farm input prices in 2020 declined by 6.9 percent. The monthly wholesale price indices of various farm inputs from 2012 to 2020 are given in Annex Table 5.3.
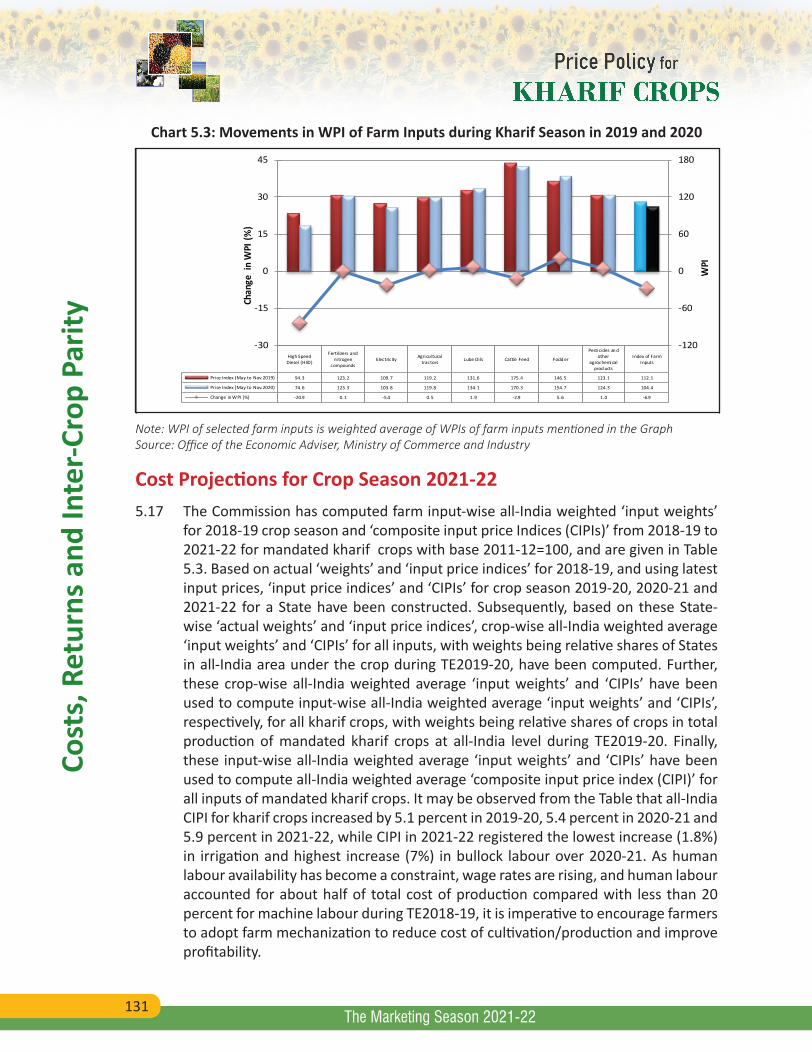
131
Cost
s, R
etur
ns a
nd In
ter-
Crop
Par
ity
The Marketing Season 2021-22
Chart 5.3: Movements in WPI of Farm Inputs during Kharif Season in 2019 and 2020
High SpeedDiesel (HSD)
Fertil izers andnitrogen
compoundsElectricity Agricul tural
tractors Lube Oi ls Cattle Feed Fodd er
Pesticides an dother
agrochemicalprod ucts
Index of FarmInputs
Price Index (May to Nov.2019) 94.3 123.2 109.7 119.2 131.6 175.4 146.5 123.1 112.1
Price Index (May to Nov.2020) 74.6 123.3 103.8 119.8 134.1 170.3 154.7 124.3 104.4
Change in WPI (%) -20.9 0.1 -5.4 0.5 1.9 -2.9 5.6 1.0 -6.9
-120
-60
0
60
120
180
-30
-15
0
15
30
45
Chan
ge i
n W
PI (%
)
WPI
Note: WPI of selected farm inputs is weighted average of WPIs of farm inputs mentioned in the Graph Source: Office of the Economic Adviser, Ministry of Commerce and Industry
Cost Projections for Crop Season 2021-225.17 The Commission has computed farm input-wise all-India weighted ‘input weights’
for 2018-19 crop season and ‘composite input price Indices (CIPIs)’ from 2018-19 to 2021-22 for mandated kharif crops with base 2011-12=100, and are given in Table 5.3. Based on actual ‘weights’ and ‘input price indices’ for 2018-19, and using latest input prices, ‘input price indices’ and ‘CIPIs’ for crop season 2019-20, 2020-21 and 2021-22 for a State have been constructed. Subsequently, based on these State-wise ‘actual weights’ and ‘input price indices’, crop-wise all-India weighted average ‘input weights’ and ‘CIPIs’ for all inputs, with weights being relative shares of States in all-India area under the crop during TE2019-20, have been computed. Further, these crop-wise all-India weighted average ‘input weights’ and ‘CIPIs’ have been used to compute input-wise all-India weighted average ‘input weights’ and ‘CIPIs’, respectively, for all kharif crops, with weights being relative shares of crops in total production of mandated kharif crops at all-India level during TE2019-20. Finally, these input-wise all-India weighted average ‘input weights’ and ‘CIPIs’ have been used to compute all-India weighted average ‘composite input price index (CIPI)’ for all inputs of mandated kharif crops. It may be observed from the Table that all-India CIPI for kharif crops increased by 5.1 percent in 2019-20, 5.4 percent in 2020-21 and 5.9 percent in 2021-22, while CIPI in 2021-22 registered the lowest increase (1.8%) in irrigation and highest increase (7%) in bullock labour over 2020-21. As human labour availability has become a constraint, wage rates are rising, and human labour accounted for about half of total cost of production compared with less than 20 percent for machine labour during TE2018-19, it is imperative to encourage farmers to adopt farm mechanization to reduce cost of cultivation/production and improve profitability.
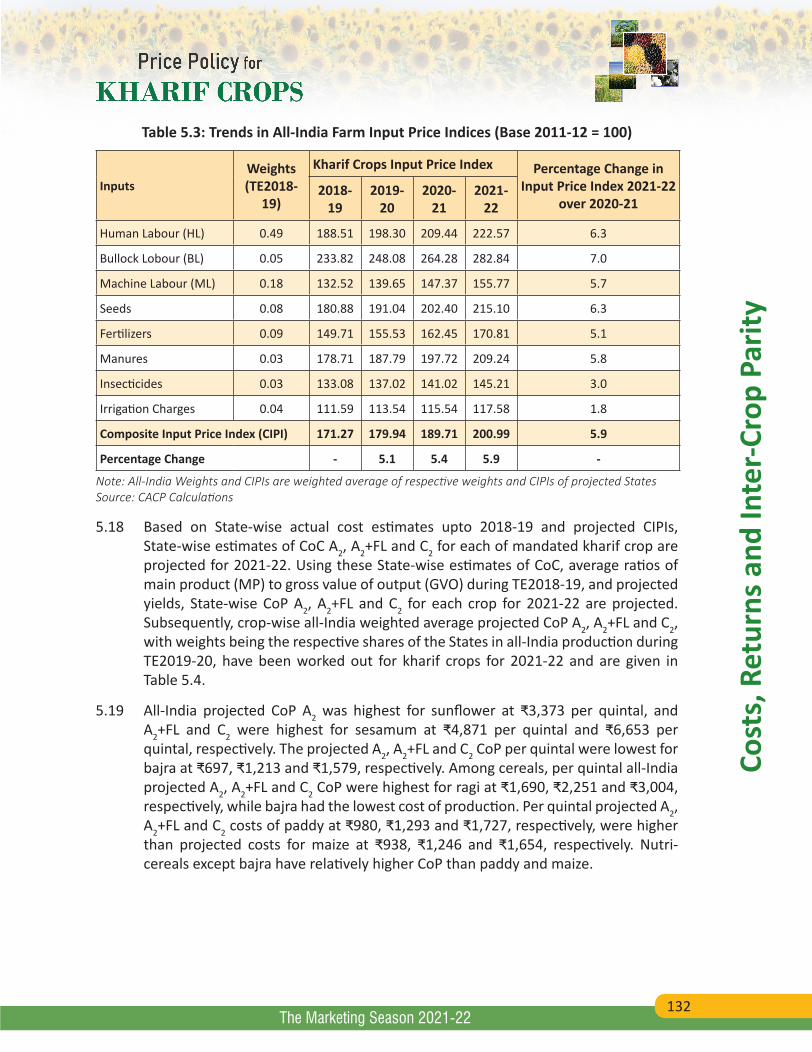
132
Cost
s, R
etur
ns a
nd In
ter-
Crop
Par
ity
The Marketing Season 2021-22
Table 5.3: Trends in All-India Farm Input Price Indices (Base 2011-12 = 100)
InputsWeights(TE2018-
19)
Kharif Crops Input Price Index Percentage Change in Input Price Index 2021-22
over 2020-212018-
192019-
202020-
212021-
22
Human Labour (HL) 0.49 188.51 198.30 209.44 222.57 6.3
Bullock Lobour (BL) 0.05 233.82 248.08 264.28 282.84 7.0
Machine Labour (ML) 0.18 132.52 139.65 147.37 155.77 5.7
Seeds 0.08 180.88 191.04 202.40 215.10 6.3
Fertilizers 0.09 149.71 155.53 162.45 170.81 5.1
Manures 0.03 178.71 187.79 197.72 209.24 5.8
Insecticides 0.03 133.08 137.02 141.02 145.21 3.0
Irrigation Charges 0.04 111.59 113.54 115.54 117.58 1.8
Composite Input Price Index (CIPI) 171.27 179.94 189.71 200.99 5.9
Percentage Change - 5.1 5.4 5.9 -
Note: All-India Weights and CIPIs are weighted average of respective weights and CIPIs of projected StatesSource: CACP Calculations
5.18 Based on State-wise actual cost estimates upto 2018-19 and projected CIPIs, State-wise estimates of CoC A2, A2+FL and C2 for each of mandated kharif crop are projected for 2021-22. Using these State-wise estimates of CoC, average ratios of main product (MP) to gross value of output (GVO) during TE2018-19, and projected yields, State-wise CoP A2, A2+FL and C2 for each crop for 2021-22 are projected. Subsequently, crop-wise all-India weighted average projected CoP A2, A2+FL and C2, with weights being the respective shares of the States in all-India production during TE2019-20, have been worked out for kharif crops for 2021-22 and are given in Table 5.4.
5.19 All-India projected CoP A2 was highest for sunflower at ₹3,373 per quintal, and A2+FL and C2 were highest for sesamum at ₹4,871 per quintal and ₹6,653 per quintal, respectively. The projected A2, A2+FL and C2 CoP per quintal were lowest for bajra at ₹697, ₹1,213 and ₹1,579, respectively. Among cereals, per quintal all-India projected A2, A2+FL and C2 CoP were highest for ragi at ₹1,690, ₹2,251 and ₹3,004, respectively, while bajra had the lowest cost of production. Per quintal projected A2, A2+FL and C2 costs of paddy at ₹980, ₹1,293 and ₹1,727, respectively, were higher than projected costs for maize at ₹938, ₹1,246 and ₹1,654, respectively. Nutri-cereals except bajra have relatively higher CoP than paddy and maize.
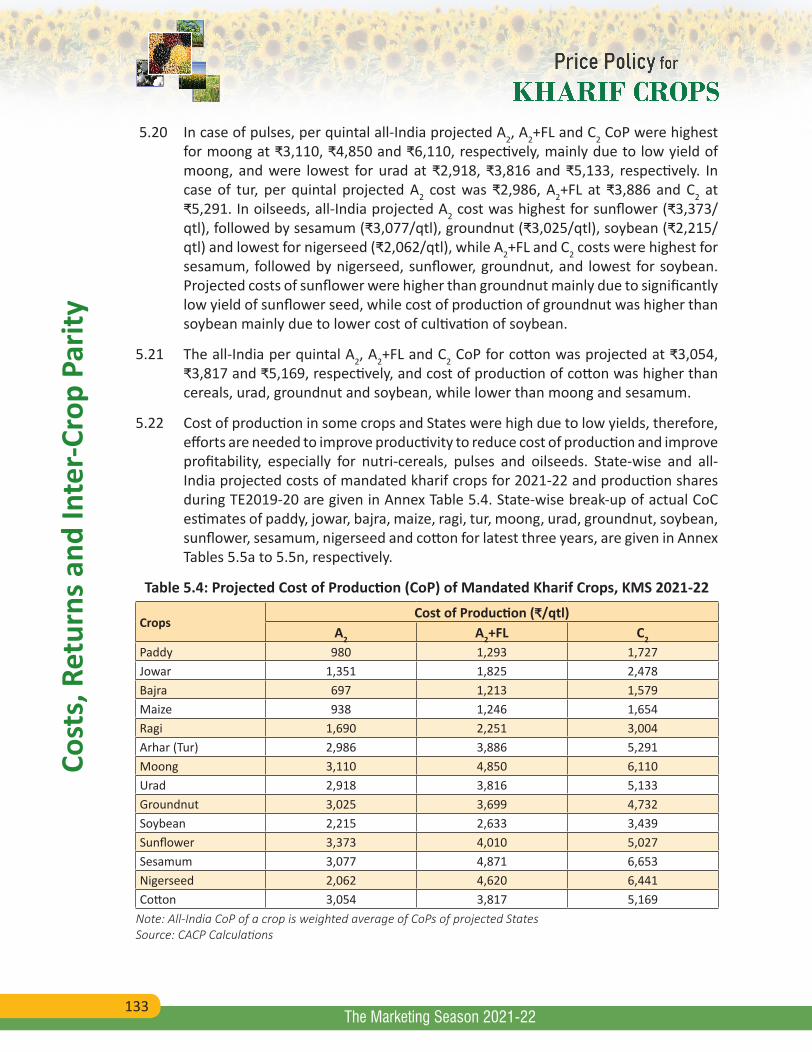
133
Cost
s, R
etur
ns a
nd In
ter-
Crop
Par
ity
The Marketing Season 2021-22
5.20 In case of pulses, per quintal all-India projected A2, A2+FL and C2 CoP were highest for moong at ₹3,110, ₹4,850 and ₹6,110, respectively, mainly due to low yield of moong, and were lowest for urad at ₹2,918, ₹3,816 and ₹5,133, respectively. In case of tur, per quintal projected A2 cost was ₹2,986, A2+FL at ₹3,886 and C2 at ₹5,291. In oilseeds, all-India projected A2 cost was highest for sunflower (₹3,373/qtl), followed by sesamum (₹3,077/qtl), groundnut (₹3,025/qtl), soybean (₹2,215/qtl) and lowest for nigerseed (₹2,062/qtl), while A2+FL and C2 costs were highest for sesamum, followed by nigerseed, sunflower, groundnut, and lowest for soybean. Projected costs of sunflower were higher than groundnut mainly due to significantly low yield of sunflower seed, while cost of production of groundnut was higher than soybean mainly due to lower cost of cultivation of soybean.
5.21 The all-India per quintal A2, A2+FL and C2 CoP for cotton was projected at ₹3,054, ₹3,817 and ₹5,169, respectively, and cost of production of cotton was higher than cereals, urad, groundnut and soybean, while lower than moong and sesamum.
5.22 Cost of production in some crops and States were high due to low yields, therefore, efforts are needed to improve productivity to reduce cost of production and improve profitability, especially for nutri-cereals, pulses and oilseeds. State-wise and all-India projected costs of mandated kharif crops for 2021-22 and production shares during TE2019-20 are given in Annex Table 5.4. State-wise break-up of actual CoC estimates of paddy, jowar, bajra, maize, ragi, tur, moong, urad, groundnut, soybean, sunflower, sesamum, nigerseed and cotton for latest three years, are given in Annex Tables 5.5a to 5.5n, respectively.
Table 5.4: Projected Cost of Production (CoP) of Mandated Kharif Crops, KMS 2021-22
CropsCost of Production (₹/qtl)
A2 A2+FL C2
Paddy 980 1,293 1,727Jowar 1,351 1,825 2,478Bajra 697 1,213 1,579Maize 938 1,246 1,654Ragi 1,690 2,251 3,004Arhar (Tur) 2,986 3,886 5,291Moong 3,110 4,850 6,110Urad 2,918 3,816 5,133Groundnut 3,025 3,699 4,732Soybean 2,215 2,633 3,439Sunflower 3,373 4,010 5,027Sesamum 3,077 4,871 6,653Nigerseed 2,062 4,620 6,441Cotton 3,054 3,817 5,169
Note: All-India CoP of a crop is weighted average of CoPs of projected StatesSource: CACP Calculations
134
Cost
s, R
etur
ns a
nd In
ter-
Crop
Par
ity
The Marketing Season 2021-22
5.23 Charts 5.4 (a) to (m) show crop-wise supply curves of projected A2+FL cost of production by States in ascending order with corresponding shares in all-India production. Supply curves for different crops are graphical presentation of CoP, which represents the quantum of a crop produced at different CoP in various States. The supply curve presented in Chart 5.4 (a) shows that projected A2+FL CoP for paddy was lowest at ₹759 per quintal in Punjab, followed by Andhra Pradesh (₹1,005/qtl), Uttarakhand (₹1,076/qtl), Chhattisgarh (₹1,129/qtl), Haryana (₹1,158/qtl), and highest in Maharashtra (₹2,405/qtl). Among top-five producers of paddy in the country, which account for more than half of total production, Punjab has the lowest A2+FL CoP, while West Bengal has the highest CoP (₹1,584/qtl).
5.24 For other kharif cereals, A2+FL CoP for jowar varied from ₹1,290 per quintal in Andhra Pradesh to ₹2,925 per quintal in Telangana (Chart 5.4 (b)). Among top-three producers of jowar in the country, which account for 71.9 percent production share of projected States, CoP was lowest in Tamil Nadu (₹1,661/qtl) and highest in Karnataka (₹2,165/qtl). In Maharashtra, the largest jowar producing State, the CoP was ₹1,852 per quintal, marginally higher (1.5%) than all-India weighted CoP. Supply curve of bajra presented in Chart 5.4 (c) shows that CoP A2+FL was lowest in Uttar Pradesh (₹881/qtl) and highest in Maharashtra (₹2,335/qtl). Among top-three producers of bajra having more than 80 percent production share, CoP was lowest in Uttar Pradesh, and highest in Rajasthan (₹1250/qtl), the largest bajra producing State. Chart 5.4 (d) shows that in case of maize, A2+FL CoP was lowest in Andhra Pradesh and Bihar at ₹934 per quintal and highest in Gujarat (₹2,061/qtl). Among top-five producers of maize in the country, Bihar has lowest CoP, while Tamil Nadu has highest CoP (₹1330/qtl). In case of ragi, CoP A2+FL was lowest in Tamil Nadu (₹1,576/qtl) and highest in Maharashtra (₹3,080/qtl) (Chart 5.4 (e)). The CoP of ragi in Karnataka, the largest producing State, was ₹2384/qtl, 5.9 percent higher than all-India weighted CoP.
5.25 In case of pulses, A2+FL CoP for tur was lowest in Bihar at ₹2,417 per quintal and highest (₹5,246/qtl) in Odisha (Chart 5.5 (f)). Among top-three producers of tur in the country, which account for 67.3 percent production share of projected States, Madhya Pradesh has the lowest CoP (₹3,226/qtl), while Maharashtra has the highest CoP (₹4,261/qtl). As presented in Chart 5.4 (g), moong has lowest A2+FL CoP in Bihar (₹3,671/qtl) and highest in Maharashtra (₹6,433/qtl). Among top-three producers of moong having 67.5 production share of projected States, CoP was lowest in Madhya Pradesh (₹4,188/qtl) and highest in Maharashtra. In Rajasthan, the largest moong producer, projected cost of production of moong was ₹4,970 per quintal, marginally higher (2.5%) than all-India CoP. In case of urad, A2+FL CoP was the lowest in Andhra Pradesh (₹2,622/qtl ), while Maharashtra had the highest cost at ₹6,496 per quintal (Chart 5.4(h)). Among top-three producers of urad having 66 percent production share of projected States, projected cost was lowest in Andhra Pradesh and highest in Rajasthan (₹3,637/qtl). Madhya Pradesh, the largest urad producing State, has significantly lower CoP (₹3,347/qtl) compared with all-India weighted CoP.
135
Cost
s, R
etur
ns a
nd In
ter-
Crop
Par
ity
The Marketing Season 2021-22
5.26 For kharif oilseeds, projected A2+FL CoP for groundnut ranged from ₹1,824 per quintal in Rajasthan to ₹6,223 per quintal in Maharashtra (Chart 5.4 (i)). Among top-three groundnut producing States, lowest CoP was recorded in Rajasthan and highest in Tamil Nadu (₹4,564/qtl). CoP for groundnut in Gujarat, the largest producer of groundnut, was projected at ₹3,619 per quintal, about 2.2 percent lower than all-India CoP. The supply curve of soybean shows that CoP A2+FL was lowest in Madhya Pradesh (₹2,322/qtl) and highest (₹3,006/qtl) in Maharashtra. Madhya Pradesh and Maharashtra together comprise 86.7 percent production share of soybean of projected States, and projected CoP of Madhya Pradesh was lower (11.8%) than all-India weighted CoP while Maharashtra had higher CoP (14.2%) than all-India weighted CoP (Chart 5.4 (j)). In case of sunflower, Karnataka with 84.2 percent production share of projected States, has marginally higher (2.5%) projected A2+FL CoP (₹4,109/qtl) compared with all-India weighted CoP, and Odisha with 15.8 percent production share has significantly lower projected CoP (₹3,485/qtl) than all-India weighted CoP (Chart 5.4 (k)). In case of sesamum, West Bengal has the lowest A2+FL CoP (₹3,854/qtl), while Rajasthan has the highest CoP (₹6,623/qtl). Among top-two producers of sesamum, which account for 57.3 production share of projected States, CoP in Madhya Pradesh (₹4,560) and West Bengal was lower than all-India CoP (Chart 5.4 (l)). Chart 5.4 (m) shows that A2+FL CoP for cotton was lowest in Rajasthan (₹3,238/qtl), and highest in Tamil Nadu (₹4,916/qtl). Among top-three producers of cotton, lowest CoP was recorded in Gujarat (₹3,279/qtl), and highest in Maharashtra (₹4,323/qtl), while CoP in Telangana was estimated at ₹4,286 per quintal.
5.27 In case of paddy, the projected A2+FL cost of production was lower than all-India weighted CoP A2+FL in 10 out of 19 States, while in jowar 4 out of 7 States, 3 out of 5 States for bajra, 7 out of 13 States for maize and 2 out of 5 States for ragi had lower CoP than all-India average. Among pulses, 4 out of 10 States for tur and urad and 6 out of 12 States for moong had lower CoP, while in case of oilseeds, 5 out of 10 States for groundnut, 2 out of 6 States for soybean, 1 out of 2 States for sunflower, and 4 out of 8 States for sesamum had lower CoP than all-India CoP. For cotton, 6 out of 11 States had CoP lower than all-India average. Therefore, holistic and coordinated efforts are needed to reduce costs and improve productivity in high-cost States to remain competitive and profitable.
5.28 Among cereals, increase in projected A2+FL CoP for crop season 2021-22 over 2020-21 was highest in jowar at 4.5 percent, followed by paddy (3.9%), bajra (3.2%), maize (2.7%) and lowest in ragi (2.6%). In case of pulses, highest increase was registered in urad (4.3%), followed by tur (2.4%), and lowest in moong (1.1%), while in case of oilseeds, sesamum recorded the highest increase (6.6%), followed by groundnut (5.2%), nigerseed (3.5%), sunflower (2.3%), and lowest in soybean (1.8%). In case of cotton, 3.8 percent increase in CoP was recorded in 2021-22 over 2020-21 (details in Annex Table 5.6).
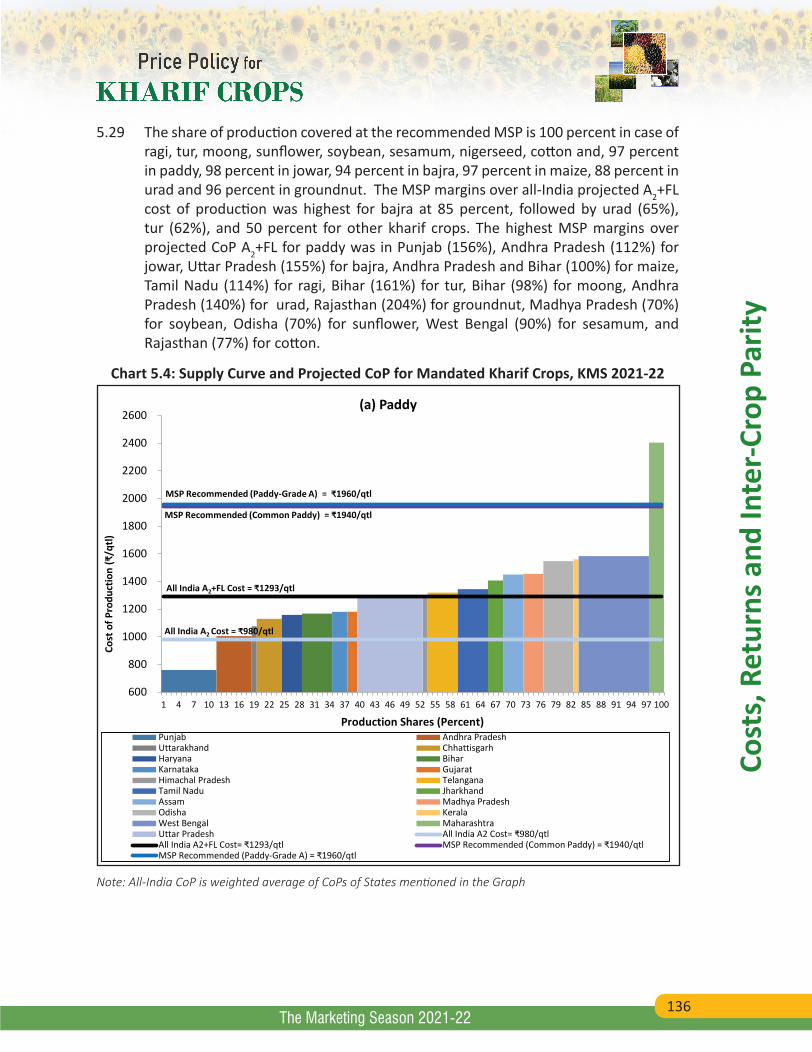
136
Cost
s, R
etur
ns a
nd In
ter-
Crop
Par
ity
The Marketing Season 2021-22
5.29 The share of production covered at the recommended MSP is 100 percent in case of ragi, tur, moong, sunflower, soybean, sesamum, nigerseed, cotton and, 97 percent in paddy, 98 percent in jowar, 94 percent in bajra, 97 percent in maize, 88 percent in urad and 96 percent in groundnut. The MSP margins over all-India projected A2+FL cost of production was highest for bajra at 85 percent, followed by urad (65%), tur (62%), and 50 percent for other kharif crops. The highest MSP margins over projected CoP A2+FL for paddy was in Punjab (156%), Andhra Pradesh (112%) for jowar, Uttar Pradesh (155%) for bajra, Andhra Pradesh and Bihar (100%) for maize, Tamil Nadu (114%) for ragi, Bihar (161%) for tur, Bihar (98%) for moong, Andhra Pradesh (140%) for urad, Rajasthan (204%) for groundnut, Madhya Pradesh (70%) for soybean, Odisha (70%) for sunflower, West Bengal (90%) for sesamum, and Rajasthan (77%) for cotton.
Chart 5.4: Supply Curve and Projected CoP for Mandated Kharif Crops, KMS 2021-22
600
800
1000
1200
1400
1600
1800
2000
2200
2400
2600
1 4 7 10 13 16 19 22 25 28 31 34 37 40 43 46 49 52 55 58 61 64 67 70 73 76 79 82 85 88 91 94 97 100
Cost
of P
rodu
ctio
n (₹
/qtl)
Production Shares (Percent)
(a) Paddy
Punjab Andhra PradeshUttarakhand ChhattisgarhHaryana BiharKarnataka GujaratHimachal Pradesh TelanganaTamil Nadu JharkhandAssam Madhya PradeshOdisha KeralaWest Bengal MaharashtraUttar Pradesh All India A2 Cost= ₹980/qtl All India A2+FL Cost= ₹1293/qtl MSP Recommended (Common Paddy) = ₹1940/qtl MSP Recommended (Paddy-Grade A) = ₹1960/qtl
All India A2 Cost = ₹980/qtl
All India A2+FL Cost = ₹1293/qtl
MSP Recommended (Common Paddy) = ₹1940/qtl
MSP Recommended (Paddy-Grade A) = ₹1960/qtl
Note: All-India CoP is weighted average of CoPs of States mentioned in the Graph
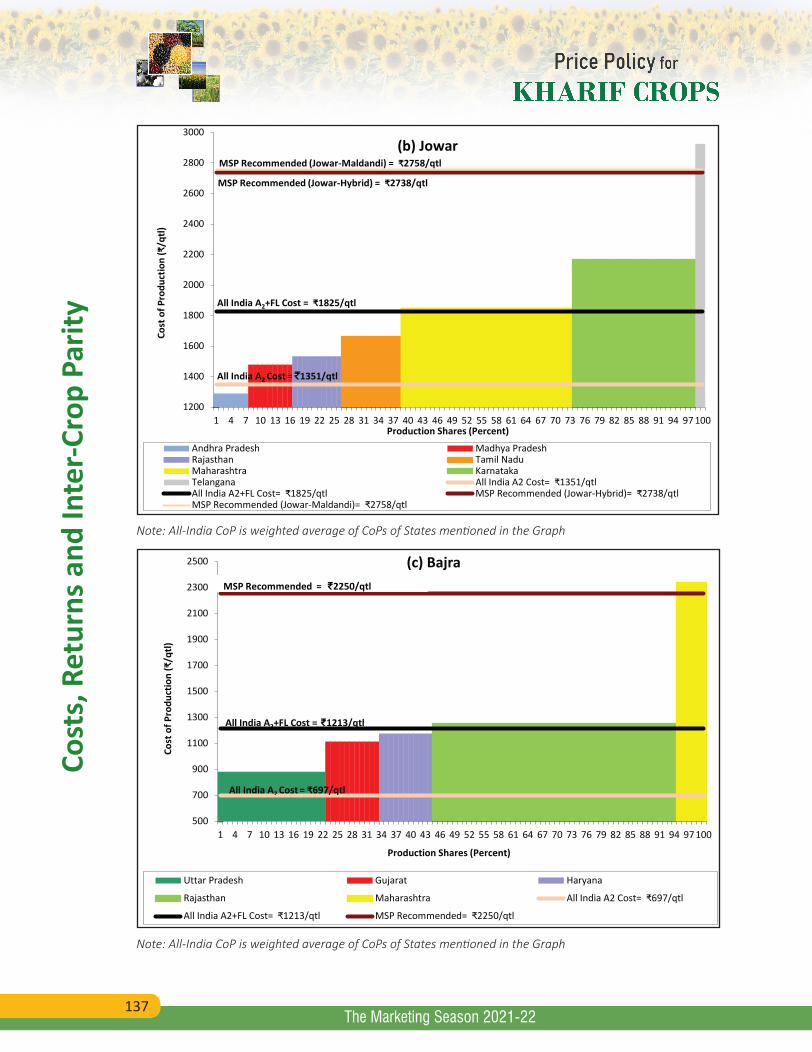
137
Cost
s, R
etur
ns a
nd In
ter-
Crop
Par
ity
The Marketing Season 2021-22
1200
1400
1600
1800
2000
2200
2400
2600
2800
3000
1 4 7 10 13 16 19 22 25 28 31 34 37 40 43 46 49 52 55 58 61 64 67 70 73 76 79 82 85 88 91 94 97 100
Cost
of P
rodu
ctio
n (₹
/qtl)
Production Shares (Percent)
(b) Jowar
Andhra Pradesh Madhya PradeshRajasthan Tamil NaduMaharashtra KarnatakaTelangana All India A2 Cost= ₹1351/qtl All India A2+FL Cost= ₹1825/qtl MSP Recommended (Jowar-Hybrid)= ₹2738/qtl MSP Recommended (Jowar-Maldandi)= ₹2758/qtl
All India A2+FL Cost = ₹1825/qtl
All India A2 Cost = `1351/qtl
MSP Recommended (Jowar-Hybrid) = ₹2738/qtl
MSP Recommended (Jowar-Maldandi) = ₹2758/qtl
Note: All-India CoP is weighted average of CoPs of States mentioned in the Graph
500
700
900
1100
1300
1500
1700
1900
2100
2300
2500
1 4 7 10 13 16 19 22 25 28 31 34 37 40 43 46 49 52 55 58 61 64 67 70 73 76 79 82 85 88 91 94 97 100
Cost
of P
rodu
ctio
n (₹
/qtl)
Production Shares (Percent)
(c) Bajra
Uttar Pradesh Gujarat Haryana
Rajasthan Maharashtra All India A2 Cost= ₹697/qtl
All India A2+FL Cost= ₹1213/qtl MSP Recommended= ₹2250/qtl
All India A2+FL Cost = ₹1213/qtl
MSP Recommended = ₹2250/qtl
All India A2 Cost = ₹697/qtl
Note: All-India CoP is weighted average of CoPs of States mentioned in the Graph
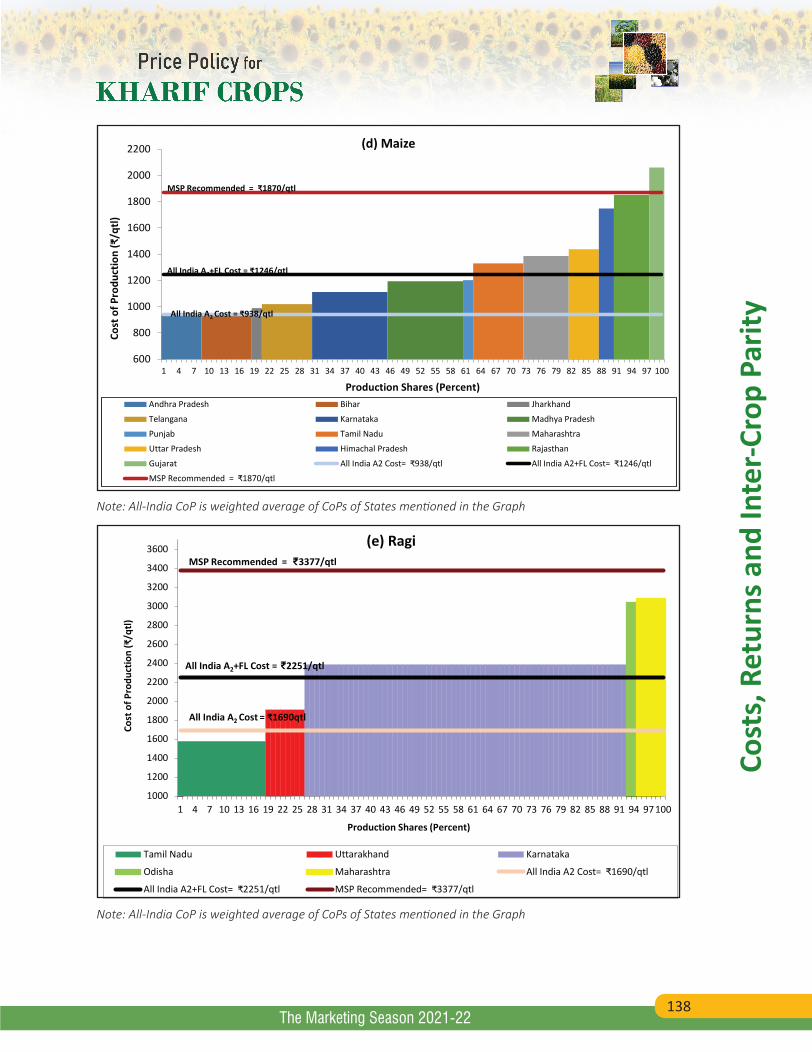
138
Cost
s, R
etur
ns a
nd In
ter-
Crop
Par
ity
The Marketing Season 2021-22
600
800
1000
1200
1400
1600
1800
2000
2200
1 4 7 10 13 16 19 22 25 28 31 34 37 40 43 46 49 52 55 58 61 64 67 70 73 76 79 82 85 88 91 94 97 100
Cost
of P
rodu
ctio
n (₹
/qtl)
Production Shares (Percent)
(d) Maize
Andhra Pradesh Bihar Jharkhand
Telangana Karnataka Madhya Pradesh
Punjab Tamil Nadu Maharashtra
Uttar Pradesh Himachal Pradesh Rajasthan
Gujarat All India A2 Cost= ₹938/qtl All India A2+FL Cost= ₹1246/qtl
MSP Recommended = ₹1870/qtl
All India A2 Cost = ₹938/qtl
All India A2+FL Cost = ₹1246/qtl
MSP Recommended = ₹1870/qtl
Note: All-India CoP is weighted average of CoPs of States mentioned in the Graph
1000
1200
1400
1600
1800
2000
2200
2400
2600
2800
3000
3200
3400
3600
1 4 7 10 13 16 19 22 25 28 31 34 37 40 43 46 49 52 55 58 61 64 67 70 73 76 79 82 85 88 91 94 97 100
Cost
of P
rodu
ctio
n (₹
/qtl)
Production Shares (Percent)
(e) Ragi
Tamil Nadu Uttarakhand Karnataka
Odisha Maharashtra All India A2 Cost= ₹1690/qtl
All India A2+FL Cost= ₹2251/qtl MSP Recommended= ₹3377/qtl
All India A2+FL Cost = ₹2251/qtl
MSP Recommended = ₹3377/qtl
All India A2 Cost = ₹1690qtl
Note: All-India CoP is weighted average of CoPs of States mentioned in the Graph
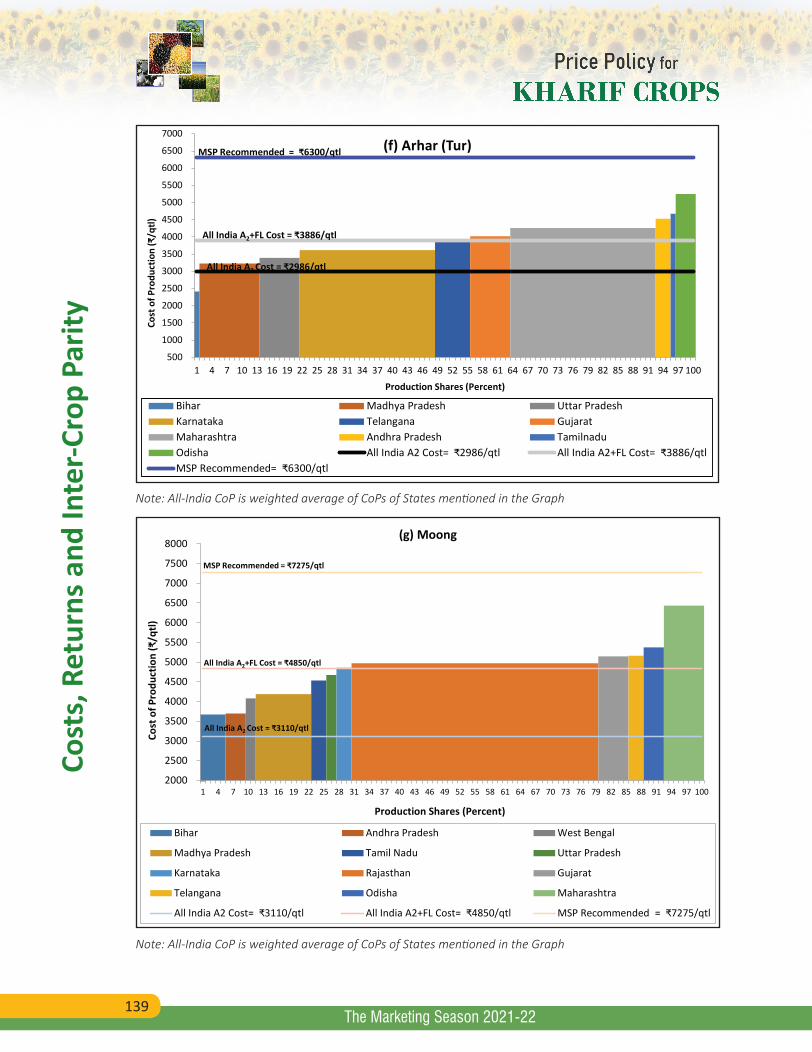
139
Cost
s, R
etur
ns a
nd In
ter-
Crop
Par
ity
The Marketing Season 2021-22
500
1000
1500
2000
2500
3000
3500
4000
4500
5000
5500
6000
6500
7000
1 4 7 10 13 16 19 22 25 28 31 34 37 40 43 46 49 52 55 58 61 64 67 70 73 76 79 82 85 88 91 94 97 100
Cost
of P
rodu
ctio
n (₹
/qtl)
Production Shares (Percent)
(f) Arhar (Tur)
Bihar Madhya Pradesh Uttar PradeshKarnataka Telangana GujaratMaharashtra Andhra Pradesh TamilnaduOdisha All India A2 Cost= ₹2986/qtl All India A2+FL Cost= ₹3886/qtl MSP Recommended= ₹6300/qtl
All India A2+FL Cost = ₹3886/qtl
All India A2 Cost = ₹2986/qtl
MSP Recommended = ₹6300/qtl
Note: All-India CoP is weighted average of CoPs of States mentioned in the Graph
2000
2500
3000
3500
4000
4500
5000
5500
6000
6500
7000
7500
8000
1 4 7 10 13 16 19 22 25 28 31 34 37 40 43 46 49 52 55 58 61 64 67 70 73 76 79 82 85 88 91 94 97 100
Cost
of P
rodu
ctio
n (₹
/qtl)
Production Shares (Percent)
(g) Moong
Bihar Andhra Pradesh West Bengal
Madhya Pradesh Tamil Nadu Uttar Pradesh
Karnataka Rajasthan Gujarat
Telangana Odisha Maharashtra
All India A2 Cost= ₹3110/qtl All India A2+FL Cost= ₹4850/qtl MSP Recommended = ₹7275/qtl
All India A2 Cost = ₹3110/qtl
All India A2+FL Cost = ₹4850/qtl
MSP Recommended = ₹7275/qtl
Note: All-India CoP is weighted average of CoPs of States mentioned in the Graph
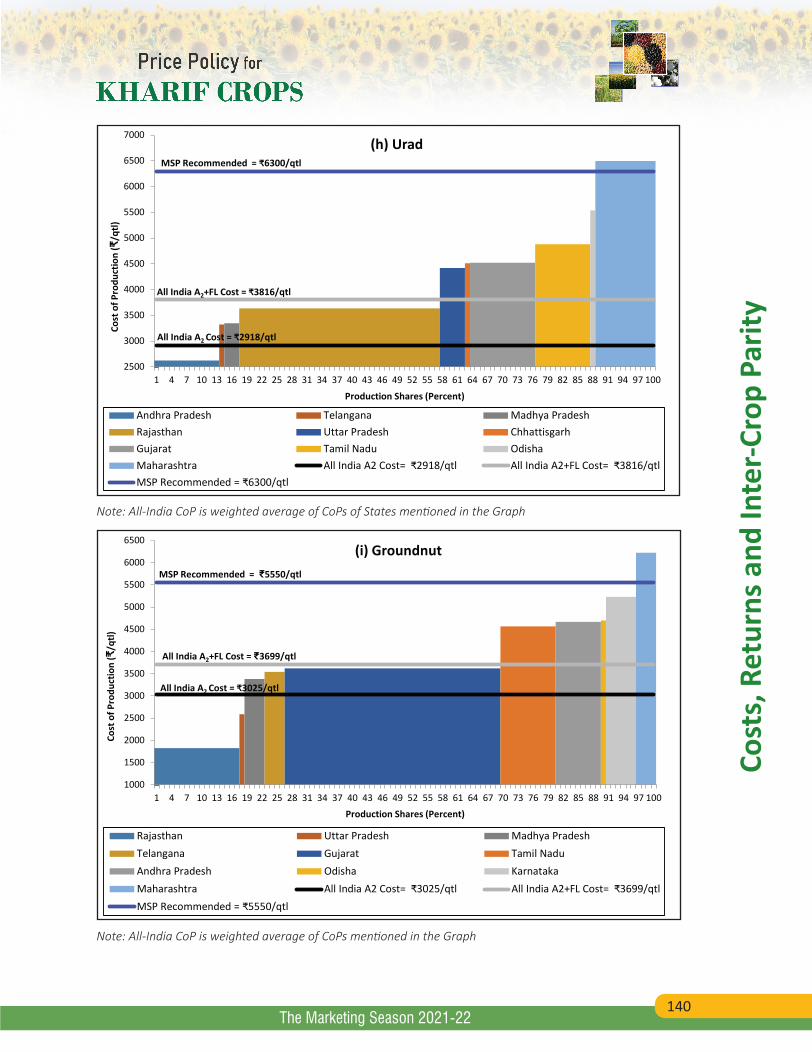
140
Cost
s, R
etur
ns a
nd In
ter-
Crop
Par
ity
The Marketing Season 2021-22
2500
3000
3500
4000
4500
5000
5500
6000
6500
7000
1 4 7 10 13 16 19 22 25 28 31 34 37 40 43 46 49 52 55 58 61 64 67 70 73 76 79 82 85 88 91 94 97 100
Cost
of P
rodu
ctio
n (₹
/qtl)
Production Shares (Percent)
(h) Urad
Andhra Pradesh Telangana Madhya PradeshRajasthan Uttar Pradesh ChhattisgarhGujarat Tamil Nadu OdishaMaharashtra All India A2 Cost= ₹2918/qtl All India A2+FL Cost= ₹3816/qtl MSP Recommended = ₹6300/qtl
All India A2+FL Cost = ₹3816/qtl
All India A2 Cost = ₹2918/qtl
MSP Recommended = ₹6300/qtl
Note: All-India CoP is weighted average of CoPs of States mentioned in the Graph
1000
1500
2000
2500
3000
3500
4000
4500
5000
5500
6000
6500
1 4 7 10 13 16 19 22 25 28 31 34 37 40 43 46 49 52 55 58 61 64 67 70 73 76 79 82 85 88 91 94 97 100
Cost
of P
rodu
ctio
n (₹
/qtl)
Production Shares (Percent)
(i) Groundnut
Rajasthan Uttar Pradesh Madhya PradeshTelangana Gujarat Tamil NaduAndhra Pradesh Odisha KarnatakaMaharashtra All India A2 Cost= ₹3025/qtl All India A2+FL Cost= ₹3699/qtl MSP Recommended = ₹5550/qtl
All India A2+FL Cost = ₹3699/qtl
All India A2 Cost = ₹3025/qtl
MSP Recommended = ₹5550/qtl
Note: All-India CoP is weighted average of CoPs mentioned in the Graph
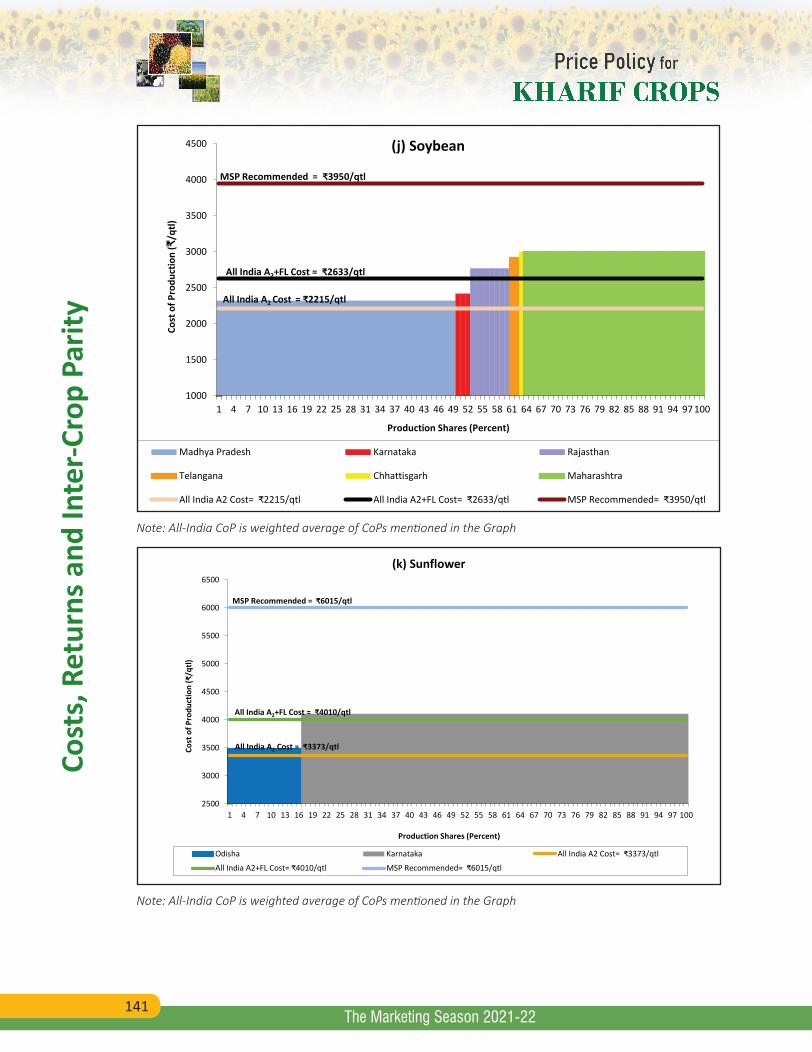
141
Cost
s, R
etur
ns a
nd In
ter-
Crop
Par
ity
The Marketing Season 2021-22
1000
1500
2000
2500
3000
3500
4000
4500
1 4 7 10 13 16 19 22 25 28 31 34 37 40 43 46 49 52 55 58 61 64 67 70 73 76 79 82 85 88 91 94 97 100
Cost
of P
rodu
ctio
n (₹
/qtl)
Production Shares (Percent)
(j) Soybean
Madhya Pradesh Karnataka Rajasthan
Telangana Chhattisgarh Maharashtra
All India A2 Cost= ₹2215/qtl All India A2+FL Cost= ₹2633/qtl MSP Recommended= ₹3950/qtl
All India A2+FL Cost = ₹2633/qtl
All India A2 Cost = ₹2215/qtl
MSP Recommended = ₹3950/qtl
Note: All-India CoP is weighted average of CoPs mentioned in the Graph
2500
3000
3500
4000
4500
5000
5500
6000
6500
1 4 7 10 13 16 19 22 25 28 31 34 37 40 43 46 49 52 55 58 61 64 67 70 73 76 79 82 85 88 91 94 97 100
Cost
of P
rodu
ctio
n (₹
/qtl)
Production Shares (Percent)
(k) Sunflower
Odisha Karnataka All India A2 Cost= ₹3373/qtl
All India A2+FL Cost= ₹4010/qtl MSP Recommended= ₹6015/qtl
All India A2+FL Cost = ₹4010/qtl
MSP Recommended = ₹6015/qtl
All India A2 Cost = ₹3373/qtl
Note: All-India CoP is weighted average of CoPs mentioned in the Graph
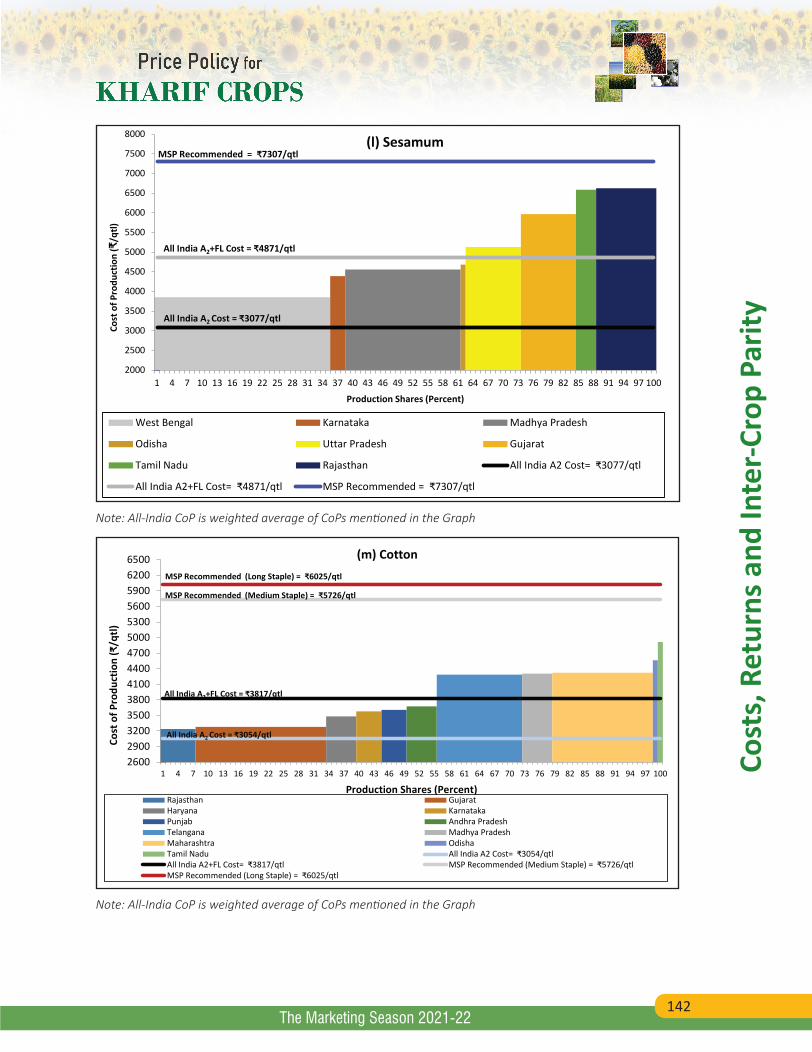
142
Cost
s, R
etur
ns a
nd In
ter-
Crop
Par
ity
The Marketing Season 2021-22
2000
2500
3000
3500
4000
4500
5000
5500
6000
6500
7000
7500
8000
1 4 7 10 13 16 19 22 25 28 31 34 37 40 43 46 49 52 55 58 61 64 67 70 73 76 79 82 85 88 91 94 97 100
Cost
of P
rodu
ctio
n (₹
/qtl)
Production Shares (Percent)
(l) Sesamum
West Bengal Karnataka Madhya Pradesh
Odisha Uttar Pradesh Gujarat
Tamil Nadu Rajasthan All India A2 Cost= ₹3077/qtl
All India A2+FL Cost= ₹4871/qtl MSP Recommended = ₹7307/qtl
All India A2+FL Cost = ₹4871/qtl
All India A2 Cost = ₹3077/qtl
MSP Recommended = ₹7307/qtl
Note: All-India CoP is weighted average of CoPs mentioned in the Graph
26002900320035003800410044004700500053005600590062006500
1 4 7 10 13 16 19 22 25 28 31 34 37 40 43 46 49 52 55 58 61 64 67 70 73 76 79 82 85 88 91 94 97 100
Cost
of P
rodu
ctio
n (₹
/qtl)
Production Shares (Percent)
(m) Cotton
Rajasthan GujaratHaryana KarnatakaPunjab Andhra PradeshTelangana Madhya PradeshMaharashtra OdishaTamil Nadu All India A2 Cost= ₹3054/qtl All India A2+FL Cost= ₹3817/qtl MSP Recommended (Medium Staple) = ₹5726/qtl MSP Recommended (Long Staple) = ₹6025/qtl
All India A2 Cost = ₹3054/qtl
All India A2+FL Cost = ₹3817/qtl
MSP Recommended (Long Staple) = ₹6025/qtl
MSP Recommended (Medium Staple) = ₹5726/qtl
Note: All-India CoP is weighted average of CoPs mentioned in the Graph
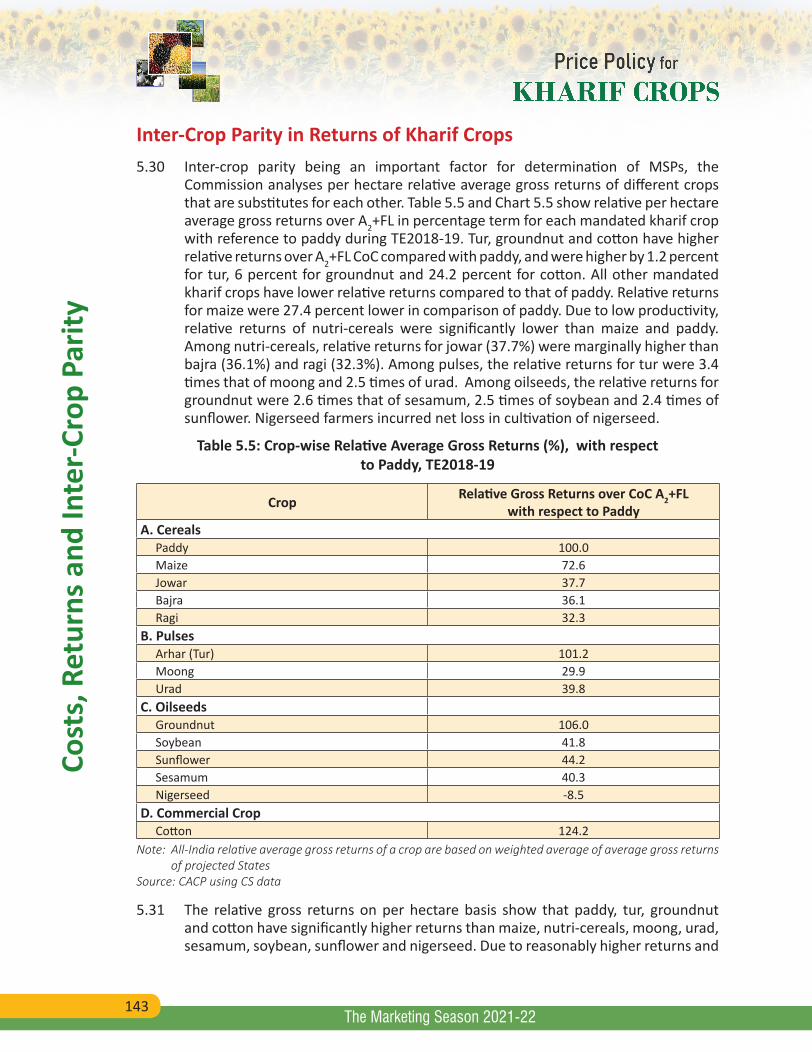
143
Cost
s, R
etur
ns a
nd In
ter-
Crop
Par
ity
The Marketing Season 2021-22
Inter-Crop Parity in Returns of Kharif Crops5.30 Inter-crop parity being an important factor for determination of MSPs, the
Commission analyses per hectare relative average gross returns of different crops that are substitutes for each other. Table 5.5 and Chart 5.5 show relative per hectare average gross returns over A2+FL in percentage term for each mandated kharif crop with reference to paddy during TE2018-19. Tur, groundnut and cotton have higher relative returns over A2+FL CoC compared with paddy, and were higher by 1.2 percent for tur, 6 percent for groundnut and 24.2 percent for cotton. All other mandated kharif crops have lower relative returns compared to that of paddy. Relative returns for maize were 27.4 percent lower in comparison of paddy. Due to low productivity, relative returns of nutri-cereals were significantly lower than maize and paddy. Among nutri-cereals, relative returns for jowar (37.7%) were marginally higher than bajra (36.1%) and ragi (32.3%). Among pulses, the relative returns for tur were 3.4 times that of moong and 2.5 times of urad. Among oilseeds, the relative returns for groundnut were 2.6 times that of sesamum, 2.5 times of soybean and 2.4 times of sunflower. Nigerseed farmers incurred net loss in cultivation of nigerseed.
Table 5.5: Crop-wise Relative Average Gross Returns (%), with respect to Paddy, TE2018-19
Crop Relative Gross Returns over CoC A2+FL with respect to Paddy
A. Cereals Paddy 100.0 Maize 72.6 Jowar 37.7 Bajra 36.1 Ragi 32.3 B. Pulses Arhar (Tur) 101.2 Moong 29.9 Urad 39.8C. Oilseeds Groundnut 106.0 Soybean 41.8 Sunflower 44.2 Sesamum 40.3 Nigerseed -8.5D. Commercial Crop Cotton 124.2
Note: All-India relative average gross returns of a crop are based on weighted average of average gross returns of projected StatesSource: CACP using CS data
5.31 The relative gross returns on per hectare basis show that paddy, tur, groundnut and cotton have significantly higher returns than maize, nutri-cereals, moong, urad, sesamum, soybean, sunflower and nigerseed. Due to reasonably higher returns and
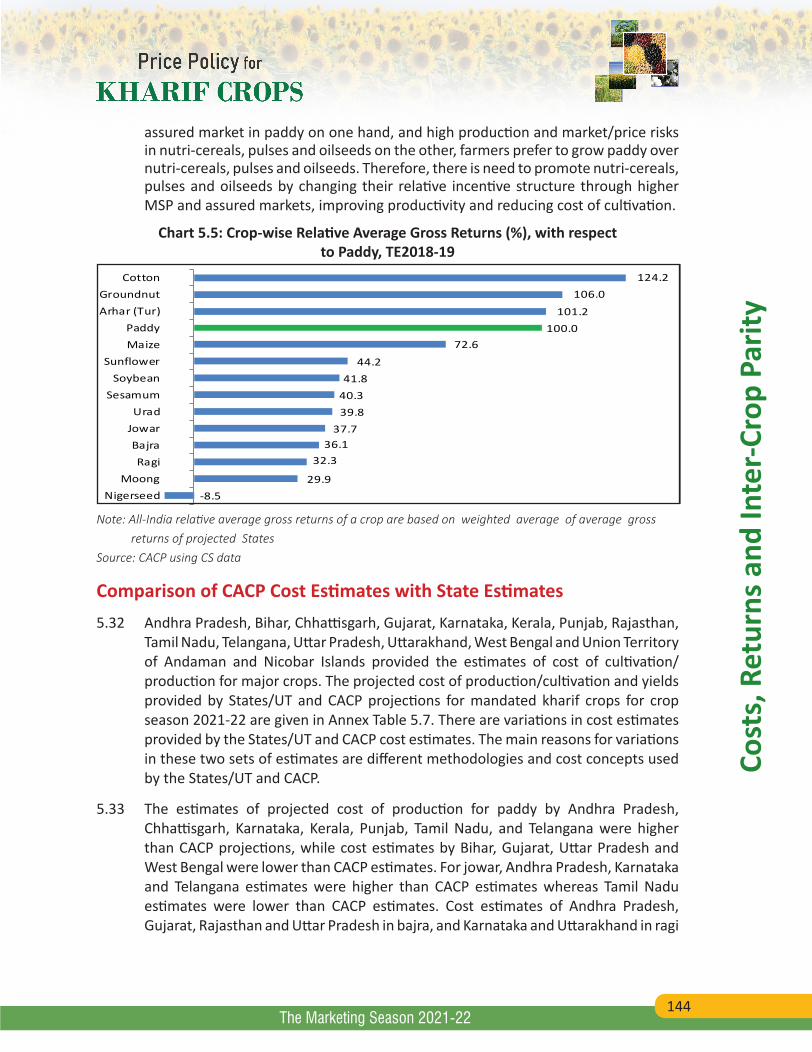
144
Cost
s, R
etur
ns a
nd In
ter-
Crop
Par
ity
The Marketing Season 2021-22
assured market in paddy on one hand, and high production and market/price risks in nutri-cereals, pulses and oilseeds on the other, farmers prefer to grow paddy over nutri-cereals, pulses and oilseeds. Therefore, there is need to promote nutri-cereals, pulses and oilseeds by changing their relative incentive structure through higher MSP and assured markets, improving productivity and reducing cost of cultivation.
Chart 5.5: Crop-wise Relative Average Gross Returns (%), with respect to Paddy, TE2018-19
-8.529.9
32.3 36.1
37.7 39.840.341.8
44.2
72.6 100.0
101.2
106.0124.2
NigerseedMoong
RagiBajra
JowarUrad
SesamumSoybean
SunflowerMaizePaddy
Arhar (Tur)Groundnut
Cotton
Note: All-India relative average gross returns of a crop are based on weighted average of average gross returns of projected StatesSource: CACP using CS data
Comparison of CACP Cost Estimates with State Estimates5.32 Andhra Pradesh, Bihar, Chhattisgarh, Gujarat, Karnataka, Kerala, Punjab, Rajasthan,
Tamil Nadu, Telangana, Uttar Pradesh, Uttarakhand, West Bengal and Union Territory of Andaman and Nicobar Islands provided the estimates of cost of cultivation/production for major crops. The projected cost of production/cultivation and yields provided by States/UT and CACP projections for mandated kharif crops for crop season 2021-22 are given in Annex Table 5.7. There are variations in cost estimates provided by the States/UT and CACP cost estimates. The main reasons for variations in these two sets of estimates are different methodologies and cost concepts used by the States/UT and CACP.
5.33 The estimates of projected cost of production for paddy by Andhra Pradesh, Chhattisgarh, Karnataka, Kerala, Punjab, Tamil Nadu, and Telangana were higher than CACP projections, while cost estimates by Bihar, Gujarat, Uttar Pradesh and West Bengal were lower than CACP estimates. For jowar, Andhra Pradesh, Karnataka and Telangana estimates were higher than CACP estimates whereas Tamil Nadu estimates were lower than CACP estimates. Cost estimates of Andhra Pradesh, Gujarat, Rajasthan and Uttar Pradesh in bajra, and Karnataka and Uttarakhand in ragi
145
Cost
s, R
etur
ns a
nd In
ter-
Crop
Par
ity
The Marketing Season 2021-22
were higher than CACP estimates. In case of maize, Andhra Pradesh, Bihar, Gujarat, Karnataka, Tamil Nadu and Telangana estimates were more than CACP estimates while Rajasthan and Uttar Pradesh costs were lower than CACP estimates. In case of pulses, cost of production estimates of Andhra Pradesh in tur, moong and urad, Karnataka in tur and moong, and Telangana in tur and urad were higher than CACP cost of production projections while cost estimates of Gujarat and Uttar Pradesh for tur, moong and urad, Rajasthan for moong and urad, Telangana for moong, and Chhattisgarh and Tamil Nadu for urad were lower than CACP estimates. For oilseeds, the estimates of cost of production of Karnataka and Telangana in groundnut and soybean, and Karnataka in sunflower were higher than CACP estimates, while Andhra Pradesh, Gujarat, Tamil Nadu and Uttar Pradesh estimates in groundnut, and Chhattisgarh and Rajasthan in soybean were less than CACP costs. In case of sesamum, State estimates of Gujarat, Rajasthan, Tamil Nadu and Uttar Pradesh were lower than CACP cost estimates. The cost estimates of cotton for Andhra Pradesh, Gujarat, Karnataka and Telangana were higher than CACP costs while Punjab, Rajasthan and Tamil Nadu estimates were less than CACP estimates.
5.34 In case of Andhra Pradesh, the projected costs of paddy, jowar, maize, tur, moong, urad, cotton were higher than CACP projections mainly due to inclusion of additional 10 percent management cost. In case of cotton in Andhra Pradesh, besides including ₹5,200 per hectare transportation cost, labour cost (human, bullock, machine) was 29.5 percent higher, seed, fertiliser & manure and insecticides was 71.4 percent higher, and rental value of owned land, rent paid for leased-in land, and interest on fixed capital was 29.2 percent higher than CACP estimates. For Karnataka, cost projections for paddy, jowar, maize, ragi, tur, moong, groundnut, soybean, sunflower, and cotton were higher than CACP estimates as marketing expenses and managerial cost, have been included in the State estimates. The cost estimates of paddy in Karnataka were 43.8 percent higher in labour (human, bullock, machine), 1.2 times higher in fertiliser & manure, 2.1 times higher in insecticides, 3.7 times higher in interest on working capital, 24 percent higher in rental value of owned land, and 1.2 times higher on interest on fixed capital than CACP projections.
5.35 The comparison of cost estimates provided by Andaman and Nicobar Islands for paddy, Gujarat for jowar, Andhra Pradesh and Telangana for bajra, ragi, sunflower and sesamum, Karnataka for bajra and urad, Chhattisgarh for maize, tur and groundnut, Uttarakhand for urad and soybean, and Andhra Pradesh for soybean could not be carried out, as cost projections for these crops and States have not been undertaken by CACP due to non-availability of cost data under the Comprehensive Scheme. The CACP has projected cost of production of paddy for Assam and Uttarakhand; paddy, bajra and cotton for Haryana; paddy and maize for Himachal Pradesh and Jharkhand; paddy, jowar, maize, tur, moong, urad, groundnut, soybean and cotton for Madhya Pradesh and Maharashtra; paddy, ragi, tur, moong, urad, groundnut, sunflower, sesamum, nigerseed and cotton for Odisha; jowar, groundnut for Rajasthan; bajra for Maharashtra; maize for Punjab; ragi for Maharashtra and Tamil
146
Cost
s, R
etur
ns a
nd In
ter-
Crop
Par
ity
The Marketing Season 2021-22
Nadu; tur, moong for Bihar and Tamil Nadu; moong and sesamum for West Bengal, and sesamum for Karnataka and Madhya Pradesh, but cost comparison could not be done as cost estimates for these crops were not provided by the States.
Issues Related to Sample Size under Comprehensive Scheme5.36 Presently, the cost data for kharif crops collected by DES are available with a time lag
of 2 years and due to time lag, the data loses its relevance in cost projection exercise. As online software ‘FARMAP 2.0’ for uploading the cost data by Implementing Agencies (IAs) of Comprehensive Scheme has been successfully executed by DES, therefore, the time lag in providing cost data should be reduced. The Commission recommends that the time lag in furnishing of cost estimates by DES to CACP should be reduced to the extent possible.
5.37 The Commission has analysed the actual cost estimates under Comprehensive Scheme for making projections for 2021-22, and observed that there are certain crops in some States whose shares in the all-India crop area/production as well as in the area and production of crop group in the State are very low. There are also instances, where sample size for certain crops in the State and all-India is inadequate, and may not be a representative sample for cost projection (Annex Table 5.8). The Commission suggests that sample size of paddy in Uttarakhand, maize in Chhattisgarh and Jharkhand, tur in Chhattisgarh and Tamil Nadu, moong in Bihar, urad in Telangana, groundnut in Madhya Pradesh, sunflower in Telangana and sesamum in Karnataka and Telangana may be increased. The sample size of sunflower and nigerseed even at all-India level is too small and can undermine the reliability and representativeness of cost projections, therefore, sample size must be increased for these crops. Since the Commission uses three-year actual cost estimates in forecasting of cost of production, the CS data should be collected every year for sesamum in Andhra Pradesh and nigerseed in Madhya Pradesh for smoothing cost estimates.
5.38 The Commission has analyzed the State-wise area and production of the mandated kharif crops and observed that there are certain crops in States, which occupy reasonable share in the all-India area and production or area and production of a crop group in the State, but CS data for these States are not available (Annex Table 5.9). Inclusion of these States under Comprehensive Scheme for these crops would improve representation and reliability of cost projections at all-India level. Therefore, the Commission recommends inclusion of such States under Comprehensive Scheme. The Commission also suggests that Comprehensive Scheme may be implemented in Jammu & Kashmir for paddy and maize, and Tripura for paddy, as these are important crops in the State/UT .
147
Cost
s, R
etur
ns a
nd In
ter-
Crop
Par
ity
The Marketing Season 2021-22
Recapitulation5.39 Average gross returns over CoC A2+FL per hectare varied from ₹6,784 for ragi to
₹20,973 for paddy in cereals, ₹6,262 for moong to ₹21,220 for tur in pulses, and ₹8,452 for sesamum to ₹22,241 for groundnut in oilseeds, while returns were negative for nigerseed. In case of cotton, gross returns over CoC A2+FL were ₹26,050 per hectare. Efforts should be made to reduce cost, improve crop yields and ensure remunerative prices to farmers, particularly nutri-cereals, pulses and oilseeds growers, to improve income and global competitiveness.
5.40 All-India agricultural average daily wage rate at current prices increased by 5 percent in 2020 over 2019 while weighted index of selected farm input prices declined by 6.9 percent. All-India CIPI for kharif crops registered an increase of 5.9 percent in 2021-22 over 2020-21. As labour availability and rising wages have become a constraint and human labour accounted for nearly 50 percent of cost of cultivation of kharif crops, farmers should be encouraged to adopt farm mechanization to improve profitability.
5.41 The all-India projected CoP A2+FL per quintal is ₹1,293 for paddy, ₹1,825 for jowar, ₹1,213 for bajra, ₹1,246 for maize, ₹2,251 for ragi, ₹3,886 for tur, ₹4,850 for moong, ₹3,816 for urad, ₹3,699 for groundnut, ₹2,633 for soybean, ₹4,010 for sunflower, ₹4,871 for sesamum, ₹4,620 for nigerseed, and ₹3,817 for cotton, for KMS 2021-22. The increase in projected CoP varied from 1.1 percent for moong to 6.6 percent for sesamum in KMS 2021-22 over KMS 2020-21. Relative average gross returns for tur, groundnut and cotton were higher than paddy, while gross returns for paddy were higher than other mandated kharif crops.
5.42 Per quintal MSP recommended at ₹1,940 for paddy, ₹2,738 for jowar, ₹2,250 for bajra, ₹1,870 for maize, ₹3,377 for ragi, ₹6,300 for tur, ₹7,275 for moong, ₹6,300 for urad, ₹5,550 for groundnut, ₹3,950 for soybean, ₹6,015 for sunflower, ₹7,307 for sesamum, ₹6,930 for nigerseed, and ₹5,726 for cotton would cover projected A2+FL CoP for all States for ragi, tur, moong, soybean, sunflower, sesamum, cotton; and 18 out of 19 States for paddy, 6 out of 7 States for jowar, 4 out 5 States for bajra, 12 out of 13 States for maize, and 9 out of 10 States for urad and groundnut.
*****
148
Chap
ter 6
Chapter 6
The Marketing Season 2021-22
Considerations and Recommendations for Price Policy
6.1. While recommending Minimum Support Price (MSP), the Commission considers important factors like cost of production, overall demand supply scenario, trends in domestic and global prices, inter-crop price parity, terms of trade between agriculture and non-agriculture sectors, minimum of 50 percent as the margin over the cost of production and the likely impact of the price policy on the rest of the economy. Besides these factors, the price policy is expected to promote rational utilization of land, water and other production resources. The Commission uses the cost estimates furnished by the DES, Ministry of Agriculture and Farmers Welfare under “Comprehensive Scheme for Studying the Cost of Cultivation of Principal Crops in India”. The Commission organizes regional meetings and stakeholder’s consultations to seek suggestions from State Governments, Central Ministries/Departments, farmers/farmers associations, research institutions, industry representatives/associations and other stakeholders before finalizing its recommendations.
Considerations
Domestic Demand-Supply Scenario 6.2. In 2020-21, India is expected to achieve record foodgrains production crossing 303
million tonnes driven by higher production of rice, wheat, maize and pulses. Grain stocks in central pool are estimated at 58.2 million tonnes as on 28th February 2021, 2.8 times higher than foodgrains stocking norms as on 1st April.
6.3. Domestic rice production in 2020-21 is likely to increase by 1.6 percent, exports are estimated to be higher and stocks lower in 2020-21 than last year. With marginally higher production, lower stocks and increased exports in 2020-21 prices are projected to remain firm in 2021-22. Total pulses production is expected to reach 24.4 million tonnes, 6 percent more than in 2019-20. Urad and moong production is estimated to rise significantly in 2020-21 but production of tur/arhar is expected to remain almost at the same level as in 2019-20.
6.4. Nutri-cereals production is estimated at 17.22 million tonnes in 2020-21, marginally lower than 2019-20 due to lower production of jowar and bajra. Maize production is estimated to increase by 4.8 percent, while production of oilseeds is estimated to show an impressive growth of 12.3 percent. Cotton production is estimated to increase by 1.6 percent in 2020-21 and reach a record level of about 37.1 million bales in 2020-21.
149
Cons
ider
ation
s and
Rec
omm
enda
tions
for P
rice
Polic
y
The Marketing Season 2021-22
Price Trends6.5. All-India average market price of paddy remained below MSP during the last five
marketing seasons but showed rising trend and gap between market price and MSP has reduced during last three seasons. The market prices of maize improved during KMS 2019-20 and were higher than MSP but this trend reversed in 2020-21 and average market price was 26.4 percent below the MSP. Domestic maize prices showed a declining trend during the last three months in contrast to significant increase in world prices. Domestic prices of major kharif pulses, namely, tur, moong and urad improved during KMS 2020-21. Urad prices were higher than MSP due to lower production, while tur prices were marginally lower than MSP. Moong prices were about 10.8 percent below the MSP. In case of oilseeds, soybean prices improved in 2020-21 and were above the MSP while groundnut prices remained below the MSP. Cotton prices showed substantial improvement in 2020-21 as CCI procured about 9.2 million bales of cotton.
6.6. According to the latest Food Prices Monitoring and Analysis (FPMA) bulletin (10th March 2021) from the FAO, international prices of rice, maize and sorghum continue to increase. The FAO All Rice price index in February 2021 was 11.4 percent higher than February 2020 level and world maize prices were also substantially higher than the last year. FAO’s price index for oilseeds and vegetable oils showed an increasing trend during the last 8-9 months and palm oil and sunflower oil prices recorded sharp increase.
Global Scenario6.7. According to FAO-AMIS, world rice production in 2020-21 is set to reach 513.2
million tonnes, up 1.8 percent from 2019-20, and utilization is forecast to expand at fastest rate in the last seven years to reach 514.4 million tonnes in 2020-21. Global ending stocks in 2020-21 are forecast at 80.3 million tonnes, higher than the 2019-20. World rice trade is expected to expand by 6.9 percent in 2020-21. World maize production is estimated to increase by 1.3 percent in 2020-21 to 1,152.8 million tonnes and maize utilization is forecast to increase by 1.9 percent. Maize trade is expected to grow at 7.3 percent in 2020-21, while ending stocks are forecast to be significantly lower than previous season. Global coarse grains production is expected to increase by 1.9 percent in 2020-21, but global stocks are anticipated to contract by (-)4.6 percent. Global oilseeds production is forecast to increase by 3.3 percent in 2020-21 at 595.1 million tonnes but global stocks are forecast to fall by (-)13.4 percent. Soybean production is forecast to expand by 9.5 percent in 2020-21 but ending stocks are expected to be much lower at 22 million tonnes in 2020-21 compared with 35.4 million tonnes in 2019-20.
150
Cons
ider
ation
s and
Rec
omm
enda
tions
for P
rice
Polic
y
The Marketing Season 2021-22
6.8. According to International Cotton Advisory Committee, world cotton production is forecast to fall by about 2 million tonnes, while consumption is forecast to increase by nearly 2 million tonnes and as a result, ending stocks are forecast to decrease by about 1.4 percent in 2020-21.
Trade Performance6.9. India has improved its share in world agricultural exports from 1.7 percent in
2010 to 2.1 percent in 2019 and in world agricultural imports from 1.3 percent in 2010 to 1.5 percent in 2019. India’s agricultural exports, which grew at an average annual rate of 8.4 percent during 2016-19, declined in 2019-20 by 7.6 percent over previous year, while agricultural imports increased by 4.9 percent in 2019-20. However, in 2020-21 (April-January), India’s total merchandise exports declined by about 13.6 percent year-on-year but agricultural exports registered growth of about 16.8 percent during the same period due to steep rise in global commodity prices. In contrast, agricultural imports remained virtually unchanged during the period and led to increase in agricultural trade surplus from ₹71 thousand crore in April-January 2019-20 to ₹107 thousand crore in April-January 2020-21.
6.10. Global trade was severely affected by COVID-19 in the first half of 2020, but recovered in Q3 and Q4 of 2020. According to UNCTAD, value of global merchandise trade is predicted to fall by 5.6 percent compared with last year and the largest fall in merchandise trade since 2009. The share of agricultural commodities in the total merchandise exports was 9.7 percent in 2019. The world merchandise exports increased by 2.2 percent per year during 2008-2019, while, exports of agricultural products increased by 3.1 percent during the same period. The highest increase in exports of agricultural products among the top ten exporters was recorded by Argentina (15%), and Mexico (3%) while Indonesia experienced the biggest decline (-8%), followed by Canada (-6%) and Brazil (-5%). While COVID-19 has affected world trade in some sectors significantly, but most of the agri-food sectors (with the exception of tobacco and beverages) have been stable or recorded some increase in Jan-Sep 2020 relative to Jan-Sep 2019.
Procurement Operations and Efficacy 6.11. Procurement of rice increased significantly from 44.4 million tonnes in 2018-19 to
52 million tonnes in 2019-20, an increase of 17.1 percent. The increase is attributed to higher procurement in Telangana, Chhattisgarh, Andhra Pradesh, Odisha, Haryana, Uttar Pradesh and Tamil Nadu. Rice procurement during KMS 2020-21 was significantly higher than KMS 2019-20. The share of rice procured as percent of total production varied widely across major rice producing States ranging from a high of 89.6 percent in Punjab to 11.7 percent in West Bengal. The number of farmers benefited from rice procurement operations increased from 72.3 lakh in 2017-18 to about 1.25 crore in 2019-20.
151
Cons
ider
ation
s and
Rec
omm
enda
tions
for P
rice
Polic
y
The Marketing Season 2021-22
6.12. Rice and wheat stocks in central pool as on 28th February 2021 were about 57.8 million tonnes, which were marginally lower than the last year stock, but significantly higher than stocking norms as on 1st April. The rice stocks were 8.8 percent lower than the previous year stocks but more than double the stocking norms. However stocks of the wheat were of 7.3 percent higher than the previous year stocks and 3.7 times more than the stocking norms. Procurement of pulses has increased significantly from about 4.6 lakh tonnes in 2010-11 to 2014-15 to nearly 73 lakh tonnes during 2015-16 to 2019-20. During 2018-19, a record quantity of about 41.9 lakh tonnes of pulses was procured by NAFED under the PSS. Due to improvement in prices, procurement was low in 2019-20. In case of oilseeds, procurement under PSS increased from about 9 lakh tonnes in 2010-11 to 2014-15 to about 48.3 lakh tonnes during 2015-16 to 2019-20. During 2019-20, procurement of oilseeds under PSS was 18.2 lakh tonnes against 16.1 lakh tonnes in the preceding year. Since procurement under PSS is undertaken at the request of the State Government, their effective participation is needed to make the Scheme successful.
Drivers of Productivity 6.13. In the face of declining land availability for agriculture, improving crop productivity
is the only solution for uninterrupted supply of food and enduring farm profitability. The productivity levels of various crops in India are lower than world average yields and benchmark countries. Investment in technology, irrigation, agriculture R&D and infrastructure and improved access to extension and other services are crucial in increasing crop productivity and profitability. Large yield gaps exist in almost all the crops and there is considerable scope to raise yields to meet rising demand.
Terms of Trade 6.14. The farmers’ terms of trade index (FToT), which increased from 87.8 in 2004-05
to about approximately 103 in 2010-11, remained around 98 during the current decade and was recorded at 100.28 in 2019-20. Increase in minimum support prices, rise in global agricultural prices and high food inflation were responsible for improvement in FToT during the period 2004-05 to 2010-11. On the other hand, low global commodity prices and steep rise in agricultural wages, diesel and other farm inputs have led to lower FToT index during the curent decade.
152
Cons
ider
ation
s and
Rec
omm
enda
tions
for P
rice
Polic
y
The Marketing Season 2021-22
Cost of Production and Profitability 6.15. The A2+FL CoC was highest in paddy (₹46,889/ha) among cereals, in tur/arhar
(₹38,188/ha) among pulses and groundnut (₹52,319/ha) in oilseeds. Cotton has the highest CoC A2+FL (₹58,742/ha) among all mandated kharif crops. The gross returns over A2+FL are maximum for cotton at ₹26,050 per hectare, followed by groundnut (₹22,241/ha), tur (₹21,220/ha), paddy (₹20,973/ha), maize (₹15,219/ha), and lowest for moong at ₹6,262 per hectare while nigerseed has negative returns. All-India average gross returns as percentage of CoC A2+FL were highest at 55.6 percent for tur, followed by paddy (44.7%), cotton (44.3%), sunflower (44.3%), and lowest for ragi (17.2%). Analysis of inter-crop parity reveals that paddy has highest profitability among all cereals, while cotton, groundnut and tur/arhar are more profitable than paddy and all other crops are losing out in relation to paddy. The projected A2+FL CoP of mandated kharif crops for 2021-22 season are estimated to be ₹1,293/qtl for paddy, ₹1,825/qtl for jowar, ₹1,213/qtl for bajra, ₹1,246/qtl for maize, ₹2,251/qtl for ragi, ₹3,886/qtl for tur/arhar, ₹4,850/qtl for moong, ₹3,816/qtl for urad, ₹3,699/qtl for groundnut, ₹2,633/qtl for soybean, ₹4,010/qtl for sunflower, ₹4,871/qtl for sesamum, ₹4,620/qtl for nigerseed and ₹3,817/qtl for cotton.
6.16. Keeping all these factors in mind, the Commission recommends the following non-price policy measures and MSPs of mandated kharif crops.
Non-Price Policy Recommendations
Review Open Ended-Procurement Policy 6.17. The open-ended procurement policy has led to consistently excessive stocks of
rice and wheat with Government agencies and over-exploitation of groundwater resources and distorted cropping pattern in the Indo-Gangetic plains. For example, about 79 percent blocks in Punjab and 61 percent blocks in Haryana were in over-exploited category with stage of groundwater extraction to the level of 166 percent in Punjab and 137 percent in Haryana in 2017. As against less than 7 percent share of paddy in total cropped area in Punjab in 1970-71, about 39.6 percent area was under paddy cultivation in the State in 2018-19, while in Haryana, area under paddy cultivation has increased from 5.4 percent to 22.1 percent during the same period. On the other hand, the share of pulses, oilseeds, maize and other crops has significantly declined.
6.18. The Commission recommends that Central Government should review open-ended procurement policy for rice and wheat and take a policy decision to procure total marketed surplus from small and marginal farmers, who constitute 86 percent of total operational holding and a fixed quantity from farmers having more than two hectare farm size. The Commission also suggests that the Central and State Governments should prepare a special programme for promoting crop diversification in Punjab, Haryana and western Uttar Pradesh. Efforts should be made to strengthen
153
Cons
ider
ation
s and
Rec
omm
enda
tions
for P
rice
Polic
y
The Marketing Season 2021-22
rice procurement operations in other major rice producing States like West Bengal, Uttar Pradesh, Assam, Bihar, etc. to meet at least the State requirements under NFSA and other Welfare Schemes.
Special Scheme for Crop Diversification in Indo-Gangetic Plains6.19. There is a need to reorient policy direction and adopt measures that reduce
distortions and encourage demand-driven sustainable crop diversification. Maize, pulses and oilseeds have great potential for crop diversification in rice-wheat cropping system areas of Indo-Gangetic plains. However, due to low profitability, high risks and lack of effective procurement system in these crops compared to competing crop like rice, farmers do not adopt crop diversification. Therefore, concerted efforts should be made to provide better prices, appropriate incentives, supportive marketing, and procurement mechanism to farmers for other crops. The Commission has made conscious efforts over last few years to realign the MSPs in favour of oilseeds, pulses and nutri-cereals to encourage farmers shift larger area under these crops. However, there is a need to strengthen procurement system for such crops by strengthening Price Support Scheme (PSS) and promoting Price Deficiency Payment Scheme (PDPS) and Private Procurement and Stockist Scheme (PPSS) under PM-AASHA.
6.20. Government of India is implementing Crop Diversification Programme (CDP), a sub scheme of Rashtriya Krishi Vikas Yojana (RKVY), in Punjab, Haryana and western Uttar Pradesh to diversify paddy area towards alternative crops since 2013-14. Similarly, Punjab and Haryana Goverments have also launched various Schemes for crop diversification in the State. The Commission suggests that a comprehensive programme should be prepared for crop diversification in Punjab, Haryana and western Uttar Pradesh and both the Central and State Governments should fund the programme for minimum five years and incentivize farmers for crop diversification.
Review and Strengthen PM-AASHA 6.21. Pradhan Mantri Annadata Aay SanraksHan Abhiyan (PM-AASHA) comprising of
Price Support Scheme (PSS), Price Deficiency Payment Scheme (PDPS) and Private Procurement and Stockist Scheme (PPSS) was launched in 2018 to ensure Minimum Support Price (MSP) to farmers. Under PDPS and PPSS components, all oilseeds under the MSP are covered. However, performance of the Scheme has remained far from satisfactory. For example, allocation to PM-AASHA has significantly declined during the last three years, from ₹1,500 crore in 2019-20 to ₹500 crore in 2020-21 and ₹400 crore in 2021-22. The expenditure under the Scheme was ₹313.18 crore in 2019-20 (20% of allocation) and no expenditure has been incurred up to 12th March 2021 during 2020-21. The Scheme has the potential of benefiting the farmers but there is an urgent need to review PM-AASHA and address implementation issues. The Commission suggests that a committee comprising of representatives from Central and State Government and private sector should be constituted to review
154
Cons
ider
ation
s and
Rec
omm
enda
tions
for P
rice
Polic
y
The Marketing Season 2021-22
the Scheme and recommend changes to make it effective. The Commission also recommends that maize should be included under the PDPS and PPSS.
Effective Participation of States in Price Support Scheme (PSS) 6.22. Pulses are procured under PSS, while States/UTs can choose either PSS or PDPS
for a particular oilseed in a given procurement season for the entire State. The PSS is implemented at the request of the concerned State/UT Government subject to certain conditions. Under the Scheme, Central Government can procure 25 percent of production of the commodity and in case State/UT Government intends to procure over 25 percent of production, the State Governments can procure at their own cost and through own agencies. In case the State Government intends to procure quantities beyond 25 percent and up to 40 percent of production through Central Agencies, then the State Government will use it for PDS and other Welfare Schemes, at own cost.
6.23. Although there has been a significant increase in procurement of pulses and oilseeds during the last few years but market prices of some crops in some States remained below the MSP. Despite low market prices during 2018-19 and 2019-20, sanctioned quantity was lower than procurement limit of 25 percent production in both oilseeds and pulses during the last two seasons and even the actual procurement was much less than the sanctioned quantity in most of the States. Therefore, as procurement under PSS is done at the request of the State Governments/UTs, State Governments should take pro-active measures to strengthen procurement operations under PSS. In addition, private sector needs to be encouraged and supported to participate in procurement operations and create better market linkages. The Commission is of the view that PDPS and PPSS are better options than physical procurement in case of oilseeds.
Promotion of Nutri-cereals as Healthy Foods6.24. Nutri-cereals, which have high nutrient content such as protein, essential fatty
acids, dietary fibre, vitamins, minerals, etc., were a traditional staple food of the dryland regions in the country but their consumption has significantly declined over the past few decades. However, people’s eating and dietary patterns are changing and demand for healthy and local foods is increasing. Thus, it is best opportunity to promote nutri-cereals, as there exists considerable market potential. One of the key drivers to create demand for the nutri-cereals is inclusion of nutri-cereals in PDS and other Welfare Schemes, which can lead to positive nutritional and health outcomes. Government of Odisha has launched a “Special Programme for Promotion of Millets in Tribal Areas” to revive millets in rainfed areas and promote procurement and household consumption through inclusion of millets in PDS and other welfare schemes. The Commission recommends that nutri-cereals growing States should develop effective mechanism of procurement and distribution of these cereals under NFSA and other welfare schemes to ensure remunerative prices to farmers and better nutrition to consumers.
155
Cons
ider
ation
s and
Rec
omm
enda
tions
for P
rice
Polic
y
The Marketing Season 2021-22
6.25. It is necessary to reorient research efforts to develop appropriate technologies for value-addition and health food-products, which will help in boosting demand for nutri-cereals from urban population. There is need to create awareness on nutritional aspects of nutri-cereals, improve productivity and ensure better prices to farmers.
Improve Crop Productivity6.26. Given rising food demand due to burgeoning population and depleting land
resources, raising productivity of crops need to be accorded a high priority. However, Indian yields are much lower than benchmark countries and world average. The relative stagnation in yields in recent decades in some high-productivity regions underscores the need for more investment in new technologies. The key drivers for increasing agricultural productivity include quality seed and other inputs, irrigation, improved access to extension and credit, investment in productivity enhancing technologies and adoption of innovative technologies and practices by farmers. Stable and supportive policy and regulatory environment to increase private sector participation and encourage entrepreneurship and innovations will help in improving crop productivity. Recent farm sector reforms will attract private investment and access to improved technology and quality inputs, which will help in improving productivity and farm incomes.
Bridging Yield Gaps6.27. Large gaps exist between the average farmer yield and potential yield in most crops
with wide spatial variation in India. Bridging yield-gap by accelerating technological dissemination and its adoption by the farmers is one of the major sources of raising yield. Although productivity level of kharif crops has improved, still significant yield gaps exist in cereals, pulses and oilseeds in almost all the States of the country. It is imperative to narrow or bridge these wide gaps to enhance productivity and production to meet growing requirements. The policy discourse involving integrated and holistic approaches should be reoriented from input-intensive to knowledge-intensive agriculture to bridge these yield gaps.
Promote Balanced Use of Fertilizers6.28. Fertilizer pricing has led to imbalanced use of N, P and K as price of urea has
remained fixed while prices of P and K fertilizers have increased significantly leading to widening differential between prices of urea and P&K fertilizers leading to excess use of N at the expense of P&K fertilizers. This has distorted the NPK ratio and has led to imbalanced use of nutrients.
156
Cons
ider
ation
s and
Rec
omm
enda
tions
for P
rice
Polic
y
The Marketing Season 2021-22
6.29. The Commission recommends that price of urea should be increased in phased manner and the quantity of subsidized urea per hectare should be fixed based on information from soil health card, extent of irrigation, etc. On the other hand, subsidy on P and K fertilizers should be increased to contain prices of potassic and phosphatic fertilisers to promote balanced use of nutrients without putting any additional burden on farmers and the Government. Efforts should be made to create awareness about balanced use of fertilizers among farmers, encourage manufacturing of customized and value-added fertilizer products and making them available to farmers.
Farm Mechanization 6.30. In order to address the issue of labour scarcity and rising wages, particularly during
peak agricultural season, there is a need to promote farm mechanization on a mission mode. This will enhance competitiveness as well as farm profitability. Since majority of Indian farms are small and fragmented, investment in large machinery is not a viable option. Therefore, expansion of agricultural machinery services through Custom Hiring Centres (CHCs) offers the possibility of increased mechanization on such farms. There is a need to develop sustainable agricultural mechanization strategies and supportive policies that can promote agricultural mechanization practices and technologies among farmers. Both public and private sector should work together to support innovations in mechanization and disseminate knowledge on agricultural mechanization to promote mechanization initiatives at the field level
Agricultural Credit 6.31. The concerted efforts to increase flow of credit to agriculture have resulted in more
than three times increase in volume of agricultural credit during the last decade.However, there are several challenges of accessibility in credit to small and marginal farmers/tenant farmers/share croppers/oral lessees/landless labourers, regional disparity in distribution of agricultural credit, presence of non-institutional sources, etc. For example, the ratio of agricultural credit to gross value added from crop sector is more than 214 percent in Tamil Nadu and 102 percent in Punjab, while it is very low in States like West Bengal (32%), Madhya Pradesh (24%) and Jharkhand (22%). Therefore, appropriate policy initiatives should be taken for improving the credit off-take by small and marginal farmers, in Central, Eastern and North-eastern States and address issue of over-borrowing in some States.
6.32. It is worth mentioning that Government of India has launched Kisan Credit Card (KCC) saturation drive to provide universal access to institutional concessional credit to all farmers with special focus on coverage of PM-KISAN beneficiaries and banks have so far issued KCCs to about 1.8 crore farmers against the target of 2.5 crore. The Commission believes that these initiatives will help in facilitating easy access to institutional credit.
157
Cons
ider
ation
s and
Rec
omm
enda
tions
for P
rice
Polic
y
The Marketing Season 2021-22
Strengthen Market Infrastructure and Institutions6.33. Poor and fragmented market infrastructure and weak institutions are major
constraints in India’s agricultural marketing system in rapidly evolving domestic and international markets. The Central Government has introduced far-reaching reforms in agricultural marketing to provide more choices and freedom to both farmers and buyers and create competition. This would help in building more efficient infrastructure and value-chains, and better price discovery.
6.34. Agriculture Infrastructure Fund of ₹ one lakh crore under Aatmanirbhar Bharat Abhiyan will help in creation of post-harvest management infrastructure at farm gate and strengthening APMCs. Development and upgradation of 22,000 rural haats into Gramin Agricultural Markets (GrAMs) through ₹2,000 crore Agri-Market Infrastructure Fund (AMIF) will help in improving farmers’ market access. The National Agriculture Market (e-NAM) has made impressive progress as about 1.7 crore farmers are registered and ₹1.22 lakh crore of trade value has been carried out through e-NAMs but there is a need to integrate more markets with e-NAM and establish assaying facilities and other support services.
6.35. The budgetary provision of ₹665 crore for 5 years has been made for Formation and Promotion of 10,000 Farmer Producer Organizations (FPOs)” to strengthen market linkages. However, there is a need to provide professional managerial support and adequate access to capital and infrastructure facilities for strengthening market linkages and sustaining business operations of FPOs. The Commission believes that these initiatives will help in strengthening post-harvest management and market infrastructure as well as marketing institutions.
Storage and Warehousing 6.36. During last decade, there has been a good progress in storage and warehousing
infrastructure in the country but there is huge gap in demand and availability of quality storage facilities. Moreover, existing open-ended procurement system is putting additional burden on available storage and warehousing infrastructure. The Negotiable Warehousing Receipts (NWRs) system, which was launched in 2011 to provide loan to farmers against the warehouse receipts to prevent distress sale by farmers, has not witnessed substantial growth and limited popularity owing to the physical availability of warehouses, complicated procedure and poor awareness level that limit the use of loan against a negotiable warehouse receipt (NWR). The Commission recommends that additional storage and warehousing facilities should be created in private and public sector and existing storage systems be upgraded. Special efforts should be made to create awareness, popularize and incentivize negotiable warehouse receipt for promoting pledge finance scheme.
158
Cons
ider
ation
s and
Rec
omm
enda
tions
for P
rice
Polic
y
The Marketing Season 2021-22
Direct Income Support: PM-KISAN 6.37. Pradhan Mantri KIsan SAmman Nidhi (PM-KISAN), which was launched to provide
direct income support to farmers, has made good progress and more than ₹1.15 lakh crore (up to 24th February 2021) has been disbursed to 10.75 crore farmer families since the inception of the Scheme. The Scheme has been able to create reliable database of farmers, which will help in effective implementation of other Schemes. Several State Governments have also implemented similar Schemes. On the other hand, performance of Pradhan Mantri Kisan Maandhan Yojana (PM-KMY), social security Scheme, has been slow and concerted efforts are needed to raise awareness among farmers and increase participation of eligible farmers in the Scheme.
Commodity Markets Outlook and Regional Crop Planning6.38. With rising income and demographic changes, food habits of Indian households
are changing from staple food such as cereals to high-value food commodities such as milk, meat, eggs, fish, fruits, vegetables, etc. At aggregate level, total food production is adequate to meet the domestic demand and sustaining food security. However, at disaggregated level, there exists a mismatch between demand and supply. Production of commodities like paddy and sugar is surplus over the domestic demand, whereas commodities like pulses, edible oils, etc. are deficit. Further, existing cropping patterns in many regions are not compatible with the resources endowments, e.g. paddy in Punjab, Haryana and western Uttar Pradesh, sugarcane in Maharashtra. Therefore, it is warranted to identify optimum crop plan at regional level, which is compatible with available natural resources and demand conditions. In this context, the Commission recommends to prepare commodity markets outlook to provide necessary information for developing efficient regional optimum crop plans.
Distortions in Agricultural Markets 6.39. Agricultural markets in India are subjected to various distortions ranging from
domestic marketing to restrictions on stockholding, high fees/charges, bonus on MSP, trade restrictions, etc. Government of India has taken several initiatives to remove some of these distortions by making amendments in Essential Commodities Act (ECA) and introduced reforms in agricultural marketing system. Some State Governments impose high market fee, rural development fee and other charges and pay additional bonus over MSP announced by the Central Government, which distort agricultural markets and crowd out private trade. Bonus on selected crop(s) affects inter-crop parity and discourage farmers from crop diversification. High fees/taxes/charges result in higher procurement incidentals leading to high economic cost of grains. The Commission has taken note of the fact that Arhtiyas charges in
159
Cons
ider
ation
s and
Rec
omm
enda
tions
for P
rice
Polic
y
The Marketing Season 2021-22
Punjab and Haryana have been delinked from MSP (ad valorem rate) and charges have been provided based on rupees per quintal (specific rate), which is a welcome step. It would help in containing procurement incidentals and reduce subsidy burden. The Commission recommends that States should be persuaded to reduce such charges and procurement should be restricted in States which levy high fees/incidental charges and/or pay bonus.
MSP Awareness and Publicity 6.40. Several studies have revealed that there is lack of awareness among farmers
about MSP and procurement operations. The Commission strongly recommends that coordinated efforts should be made to give wide publicity of MSP and various components of PM-ASHAA, details of procurement centers, procurement period, registration/documents requirements, information about procurement agencies as well as Fair Average Quality (FAQ) specifications of grains.
Issues Related to Sample Size in Cost Estimation6.41. In certain crops and States, the sample size under the ‘Comprehensive Scheme for
Studying the Cost of Cultivation of Principal Crops in India’ is inadequate, which can adversely affect the reliability of cost estimates. The Commission, therefore, reiterates its earlier recommendation of increasing sample size to have more reliable cost estimates.
Price Policy Recommendations 6.42. Considering all these factors, the Commission recommends the following MSPs of
different kharif crops: Paddy (Common) `1,940 per quintal; Paddy (Grade A) `1,960 per quintal; Jowar (Hybrid) ̀ 2,738 per quintal; Jowar (Maldandi) ̀ 2,758 per quintal; Bajra `2,250 per quintal; Ragi `3,377 per quintal; Maize `1,870 per quintal; Tur `6,300 per quintal; Moong `7,275 per quintal; Urad `6,300 per quintal; Groundnut `5,550 per quintal; Sunflower Seed ̀ 6,015 per quintal; Soybean (Yellow) ̀ 3,950 per quintal; Sesamum `7,307 per quintal; Nigerseed `6,930 per quintal; Cotton `5,726 per quintal for medium staple and `6,025 per quintal for long staple (Table 6.1).
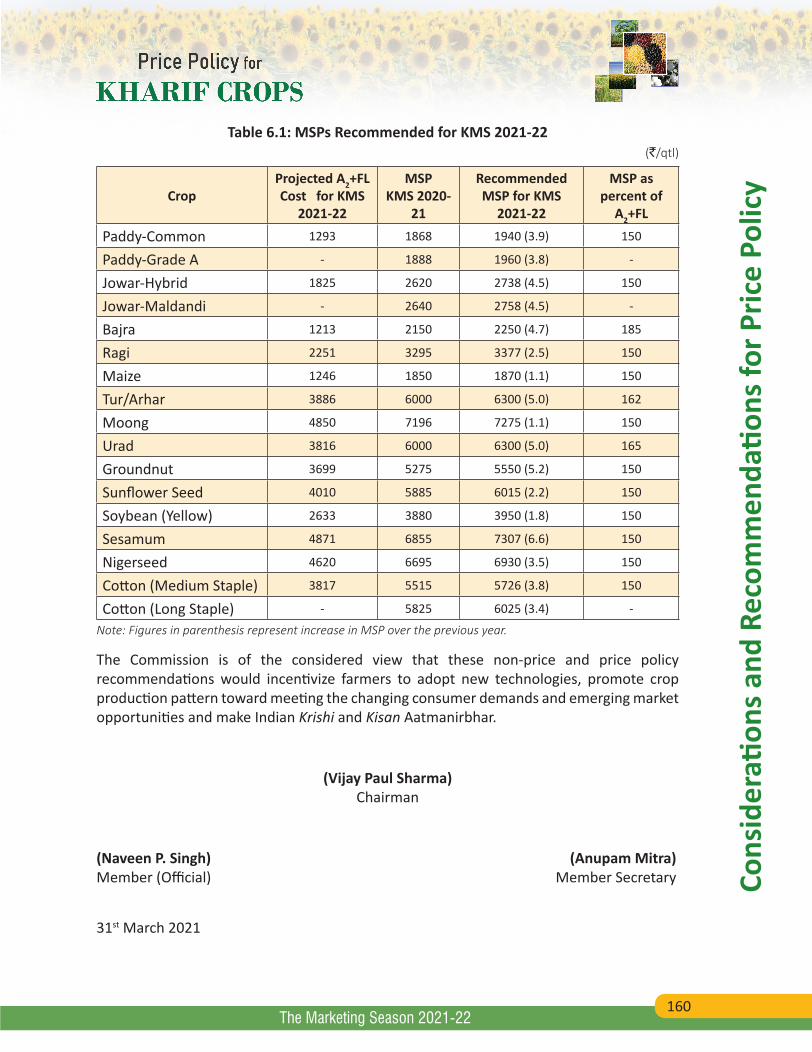
160
Cons
ider
ation
s and
Rec
omm
enda
tions
for P
rice
Polic
y
The Marketing Season 2021-22
Table 6.1: MSPs Recommended for KMS 2021-22(`/qtl)
CropProjected A2+FL Cost for KMS
2021-22
MSPKMS 2020-
21
Recommended MSP for KMS
2021-22
MSP as percent of
A2+FL
Paddy-Common 1293 1868 1940 (3.9) 150
Paddy-Grade A - 1888 1960 (3.8) -
Jowar-Hybrid 1825 2620 2738 (4.5) 150
Jowar-Maldandi - 2640 2758 (4.5) -
Bajra 1213 2150 2250 (4.7) 185
Ragi 2251 3295 3377 (2.5) 150
Maize 1246 1850 1870 (1.1) 150
Tur/Arhar 3886 6000 6300 (5.0) 162
Moong 4850 7196 7275 (1.1) 150
Urad 3816 6000 6300 (5.0) 165
Groundnut 3699 5275 5550 (5.2) 150
Sunflower Seed 4010 5885 6015 (2.2) 150
Soybean (Yellow) 2633 3880 3950 (1.8) 150
Sesamum 4871 6855 7307 (6.6) 150
Nigerseed 4620 6695 6930 (3.5) 150
Cotton (Medium Staple) 3817 5515 5726 (3.8) 150
Cotton (Long Staple) - 5825 6025 (3.4) -
Note: Figures in parenthesis represent increase in MSP over the previous year.
The Commission is of the considered view that these non-price and price policy recommendations would incentivize farmers to adopt new technologies, promote crop production pattern toward meeting the changing consumer demands and emerging market opportunities and make Indian Krishi and Kisan Aatmanirbhar.
(Vijay Paul Sharma)Chairman
(Naveen P. Singh) (Anupam Mitra)Member (Official) Member Secretary
31st March 2021
161
Anne
xure
s
The Marketing Season 2021-22
Annexures
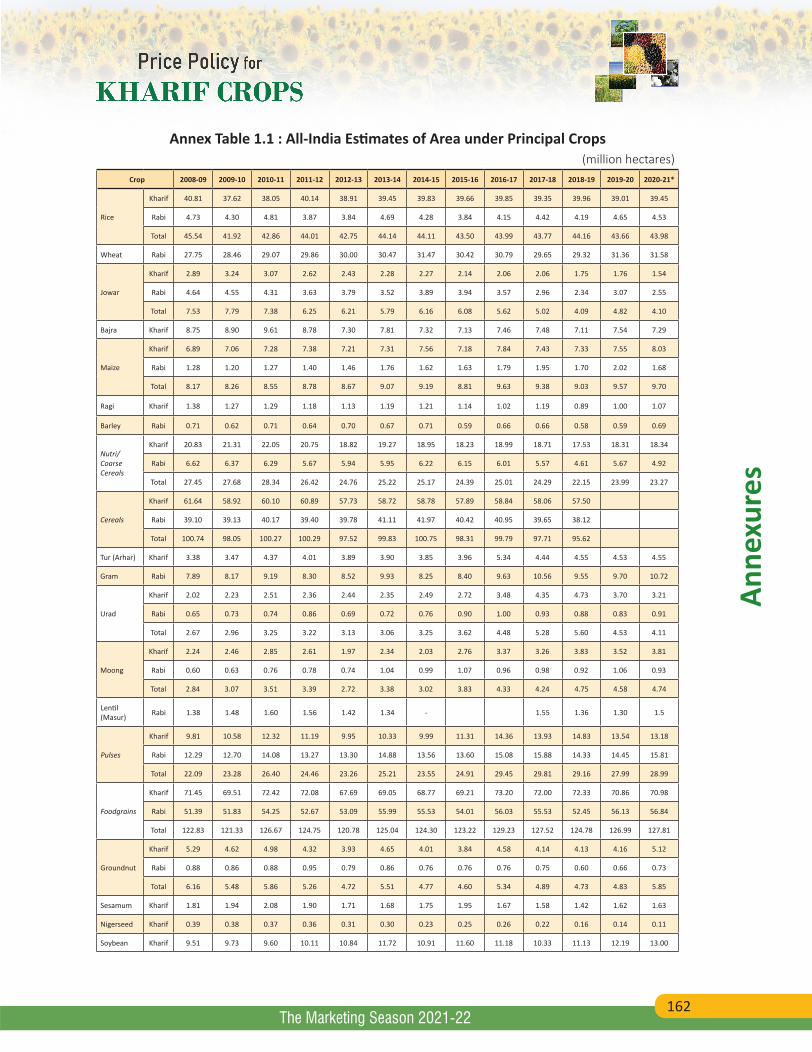
162
Anne
xure
s
The Marketing Season 2021-22
Annex Table 1.1 : All-India Estimates of Area under Principal Crops (million hectares)
Crop 2008-09 2009-10 2010-11 2011-12 2012-13 2013-14 2014-15 2015-16 2016-17 2017-18 2018-19 2019-20 2020-21*
Rice
Kharif 40.81 37.62 38.05 40.14 38.91 39.45 39.83 39.66 39.85 39.35 39.96 39.01 39.45
Rabi 4.73 4.30 4.81 3.87 3.84 4.69 4.28 3.84 4.15 4.42 4.19 4.65 4.53
Total 45.54 41.92 42.86 44.01 42.75 44.14 44.11 43.50 43.99 43.77 44.16 43.66 43.98
Wheat Rabi 27.75 28.46 29.07 29.86 30.00 30.47 31.47 30.42 30.79 29.65 29.32 31.36 31.58
Jowar
Kharif 2.89 3.24 3.07 2.62 2.43 2.28 2.27 2.14 2.06 2.06 1.75 1.76 1.54
Rabi 4.64 4.55 4.31 3.63 3.79 3.52 3.89 3.94 3.57 2.96 2.34 3.07 2.55
Total 7.53 7.79 7.38 6.25 6.21 5.79 6.16 6.08 5.62 5.02 4.09 4.82 4.10
Bajra Kharif 8.75 8.90 9.61 8.78 7.30 7.81 7.32 7.13 7.46 7.48 7.11 7.54 7.29
Maize
Kharif 6.89 7.06 7.28 7.38 7.21 7.31 7.56 7.18 7.84 7.43 7.33 7.55 8.03
Rabi 1.28 1.20 1.27 1.40 1.46 1.76 1.62 1.63 1.79 1.95 1.70 2.02 1.68
Total 8.17 8.26 8.55 8.78 8.67 9.07 9.19 8.81 9.63 9.38 9.03 9.57 9.70
Ragi Kharif 1.38 1.27 1.29 1.18 1.13 1.19 1.21 1.14 1.02 1.19 0.89 1.00 1.07
Barley Rabi 0.71 0.62 0.71 0.64 0.70 0.67 0.71 0.59 0.66 0.66 0.58 0.59 0.69
Nutri/Coarse Cereals
Kharif 20.83 21.31 22.05 20.75 18.82 19.27 18.95 18.23 18.99 18.71 17.53 18.31 18.34
Rabi 6.62 6.37 6.29 5.67 5.94 5.95 6.22 6.15 6.01 5.57 4.61 5.67 4.92
Total 27.45 27.68 28.34 26.42 24.76 25.22 25.17 24.39 25.01 24.29 22.15 23.99 23.27
Cereals
Kharif 61.64 58.92 60.10 60.89 57.73 58.72 58.78 57.89 58.84 58.06 57.50
Rabi 39.10 39.13 40.17 39.40 39.78 41.11 41.97 40.42 40.95 39.65 38.12
Total 100.74 98.05 100.27 100.29 97.52 99.83 100.75 98.31 99.79 97.71 95.62
Tur (Arhar) Kharif 3.38 3.47 4.37 4.01 3.89 3.90 3.85 3.96 5.34 4.44 4.55 4.53 4.55
Gram Rabi 7.89 8.17 9.19 8.30 8.52 9.93 8.25 8.40 9.63 10.56 9.55 9.70 10.72
Urad
Kharif 2.02 2.23 2.51 2.36 2.44 2.35 2.49 2.72 3.48 4.35 4.73 3.70 3.21
Rabi 0.65 0.73 0.74 0.86 0.69 0.72 0.76 0.90 1.00 0.93 0.88 0.83 0.91
Total 2.67 2.96 3.25 3.22 3.13 3.06 3.25 3.62 4.48 5.28 5.60 4.53 4.11
Moong
Kharif 2.24 2.46 2.85 2.61 1.97 2.34 2.03 2.76 3.37 3.26 3.83 3.52 3.81
Rabi 0.60 0.63 0.76 0.78 0.74 1.04 0.99 1.07 0.96 0.98 0.92 1.06 0.93
Total 2.84 3.07 3.51 3.39 2.72 3.38 3.02 3.83 4.33 4.24 4.75 4.58 4.74
Lentil (Masur) Rabi 1.38 1.48 1.60 1.56 1.42 1.34 - 1.55 1.36 1.30 1.5
Pulses
Kharif 9.81 10.58 12.32 11.19 9.95 10.33 9.99 11.31 14.36 13.93 14.83 13.54 13.18
Rabi 12.29 12.70 14.08 13.27 13.30 14.88 13.56 13.60 15.08 15.88 14.33 14.45 15.81
Total 22.09 23.28 26.40 24.46 23.26 25.21 23.55 24.91 29.45 29.81 29.16 27.99 28.99
Foodgrains
Kharif 71.45 69.51 72.42 72.08 67.69 69.05 68.77 69.21 73.20 72.00 72.33 70.86 70.98
Rabi 51.39 51.83 54.25 52.67 53.09 55.99 55.53 54.01 56.03 55.53 52.45 56.13 56.84
Total 122.83 121.33 126.67 124.75 120.78 125.04 124.30 123.22 129.23 127.52 124.78 126.99 127.81
Groundnut
Kharif 5.29 4.62 4.98 4.32 3.93 4.65 4.01 3.84 4.58 4.14 4.13 4.16 5.12
Rabi 0.88 0.86 0.88 0.95 0.79 0.86 0.76 0.76 0.76 0.75 0.60 0.66 0.73
Total 6.16 5.48 5.86 5.26 4.72 5.51 4.77 4.60 5.34 4.89 4.73 4.83 5.85
Sesamum Kharif 1.81 1.94 2.08 1.90 1.71 1.68 1.75 1.95 1.67 1.58 1.42 1.62 1.63
Nigerseed Kharif 0.39 0.38 0.37 0.36 0.31 0.30 0.23 0.25 0.26 0.22 0.16 0.14 0.11
Soybean Kharif 9.51 9.73 9.60 10.11 10.84 11.72 10.91 11.60 11.18 10.33 11.13 12.19 13.00
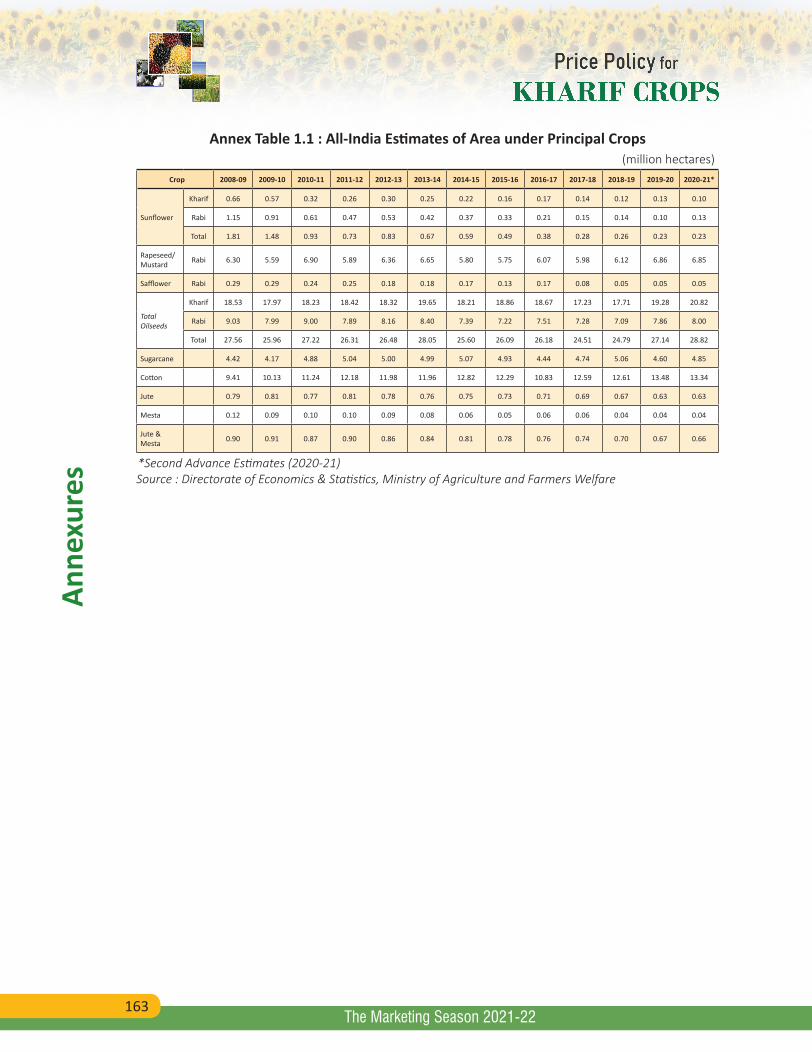
163
Anne
xure
s
The Marketing Season 2021-22
Annex Table 1.1 : All-India Estimates of Area under Principal Crops (million hectares)
Crop 2008-09 2009-10 2010-11 2011-12 2012-13 2013-14 2014-15 2015-16 2016-17 2017-18 2018-19 2019-20 2020-21*
Sunflower
Kharif 0.66 0.57 0.32 0.26 0.30 0.25 0.22 0.16 0.17 0.14 0.12 0.13 0.10
Rabi 1.15 0.91 0.61 0.47 0.53 0.42 0.37 0.33 0.21 0.15 0.14 0.10 0.13
Total 1.81 1.48 0.93 0.73 0.83 0.67 0.59 0.49 0.38 0.28 0.26 0.23 0.23
Rapeseed/ Mustard Rabi 6.30 5.59 6.90 5.89 6.36 6.65 5.80 5.75 6.07 5.98 6.12 6.86 6.85
Safflower Rabi 0.29 0.29 0.24 0.25 0.18 0.18 0.17 0.13 0.17 0.08 0.05 0.05 0.05
Total Oilseeds
Kharif 18.53 17.97 18.23 18.42 18.32 19.65 18.21 18.86 18.67 17.23 17.71 19.28 20.82
Rabi 9.03 7.99 9.00 7.89 8.16 8.40 7.39 7.22 7.51 7.28 7.09 7.86 8.00
Total 27.56 25.96 27.22 26.31 26.48 28.05 25.60 26.09 26.18 24.51 24.79 27.14 28.82
Sugarcane 4.42 4.17 4.88 5.04 5.00 4.99 5.07 4.93 4.44 4.74 5.06 4.60 4.85
Cotton 9.41 10.13 11.24 12.18 11.98 11.96 12.82 12.29 10.83 12.59 12.61 13.48 13.34
Jute 0.79 0.81 0.77 0.81 0.78 0.76 0.75 0.73 0.71 0.69 0.67 0.63 0.63
Mesta 0.12 0.09 0.10 0.10 0.09 0.08 0.06 0.05 0.06 0.06 0.04 0.04 0.04
Jute & Mesta 0.90 0.91 0.87 0.90 0.86 0.84 0.81 0.78 0.76 0.74 0.70 0.67 0.66
*Second Advance Estimates (2020-21)Source : Directorate of Economics & Statistics, Ministry of Agriculture and Farmers Welfare
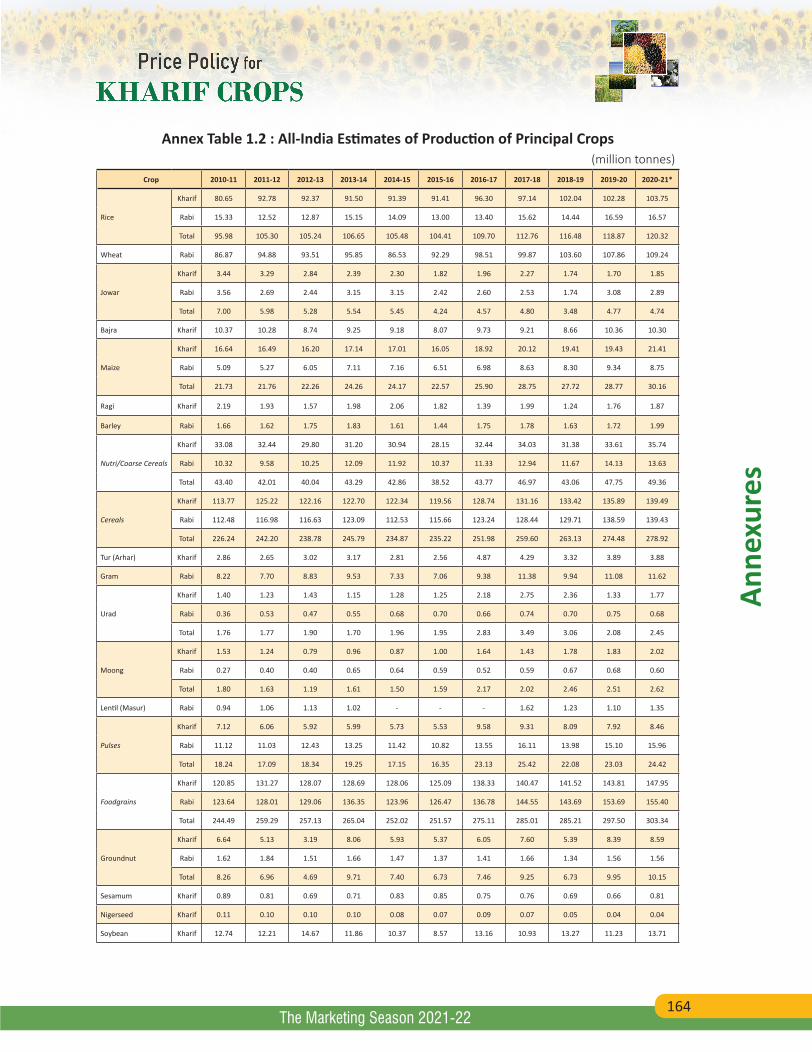
164
Anne
xure
s
The Marketing Season 2021-22
Annex Table 1.2 : All-India Estimates of Production of Principal Crops(million tonnes)
Crop 2010-11 2011-12 2012-13 2013-14 2014-15 2015-16 2016-17 2017-18 2018-19 2019-20 2020-21*
Rice
Kharif 80.65 92.78 92.37 91.50 91.39 91.41 96.30 97.14 102.04 102.28 103.75
Rabi 15.33 12.52 12.87 15.15 14.09 13.00 13.40 15.62 14.44 16.59 16.57
Total 95.98 105.30 105.24 106.65 105.48 104.41 109.70 112.76 116.48 118.87 120.32
Wheat Rabi 86.87 94.88 93.51 95.85 86.53 92.29 98.51 99.87 103.60 107.86 109.24
Jowar
Kharif 3.44 3.29 2.84 2.39 2.30 1.82 1.96 2.27 1.74 1.70 1.85
Rabi 3.56 2.69 2.44 3.15 3.15 2.42 2.60 2.53 1.74 3.08 2.89
Total 7.00 5.98 5.28 5.54 5.45 4.24 4.57 4.80 3.48 4.77 4.74
Bajra Kharif 10.37 10.28 8.74 9.25 9.18 8.07 9.73 9.21 8.66 10.36 10.30
Maize
Kharif 16.64 16.49 16.20 17.14 17.01 16.05 18.92 20.12 19.41 19.43 21.41
Rabi 5.09 5.27 6.05 7.11 7.16 6.51 6.98 8.63 8.30 9.34 8.75
Total 21.73 21.76 22.26 24.26 24.17 22.57 25.90 28.75 27.72 28.77 30.16
Ragi Kharif 2.19 1.93 1.57 1.98 2.06 1.82 1.39 1.99 1.24 1.76 1.87
Barley Rabi 1.66 1.62 1.75 1.83 1.61 1.44 1.75 1.78 1.63 1.72 1.99
Nutri/Coarse Cereals
Kharif 33.08 32.44 29.80 31.20 30.94 28.15 32.44 34.03 31.38 33.61 35.74
Rabi 10.32 9.58 10.25 12.09 11.92 10.37 11.33 12.94 11.67 14.13 13.63
Total 43.40 42.01 40.04 43.29 42.86 38.52 43.77 46.97 43.06 47.75 49.36
Cereals
Kharif 113.77 125.22 122.16 122.70 122.34 119.56 128.74 131.16 133.42 135.89 139.49
Rabi 112.48 116.98 116.63 123.09 112.53 115.66 123.24 128.44 129.71 138.59 139.43
Total 226.24 242.20 238.78 245.79 234.87 235.22 251.98 259.60 263.13 274.48 278.92
Tur (Arhar) Kharif 2.86 2.65 3.02 3.17 2.81 2.56 4.87 4.29 3.32 3.89 3.88
Gram Rabi 8.22 7.70 8.83 9.53 7.33 7.06 9.38 11.38 9.94 11.08 11.62
Urad
Kharif 1.40 1.23 1.43 1.15 1.28 1.25 2.18 2.75 2.36 1.33 1.77
Rabi 0.36 0.53 0.47 0.55 0.68 0.70 0.66 0.74 0.70 0.75 0.68
Total 1.76 1.77 1.90 1.70 1.96 1.95 2.83 3.49 3.06 2.08 2.45
Moong
Kharif 1.53 1.24 0.79 0.96 0.87 1.00 1.64 1.43 1.78 1.83 2.02
Rabi 0.27 0.40 0.40 0.65 0.64 0.59 0.52 0.59 0.67 0.68 0.60
Total 1.80 1.63 1.19 1.61 1.50 1.59 2.17 2.02 2.46 2.51 2.62
Lentil (Masur) Rabi 0.94 1.06 1.13 1.02 - - - 1.62 1.23 1.10 1.35
Pulses
Kharif 7.12 6.06 5.92 5.99 5.73 5.53 9.58 9.31 8.09 7.92 8.46
Rabi 11.12 11.03 12.43 13.25 11.42 10.82 13.55 16.11 13.98 15.10 15.96
Total 18.24 17.09 18.34 19.25 17.15 16.35 23.13 25.42 22.08 23.03 24.42
Foodgrains
Kharif 120.85 131.27 128.07 128.69 128.06 125.09 138.33 140.47 141.52 143.81 147.95
Rabi 123.64 128.01 129.06 136.35 123.96 126.47 136.78 144.55 143.69 153.69 155.40
Total 244.49 259.29 257.13 265.04 252.02 251.57 275.11 285.01 285.21 297.50 303.34
Groundnut
Kharif 6.64 5.13 3.19 8.06 5.93 5.37 6.05 7.60 5.39 8.39 8.59
Rabi 1.62 1.84 1.51 1.66 1.47 1.37 1.41 1.66 1.34 1.56 1.56
Total 8.26 6.96 4.69 9.71 7.40 6.73 7.46 9.25 6.73 9.95 10.15
Sesamum Kharif 0.89 0.81 0.69 0.71 0.83 0.85 0.75 0.76 0.69 0.66 0.81
Nigerseed Kharif 0.11 0.10 0.10 0.10 0.08 0.07 0.09 0.07 0.05 0.04 0.04
Soybean Kharif 12.74 12.21 14.67 11.86 10.37 8.57 13.16 10.93 13.27 11.23 13.71
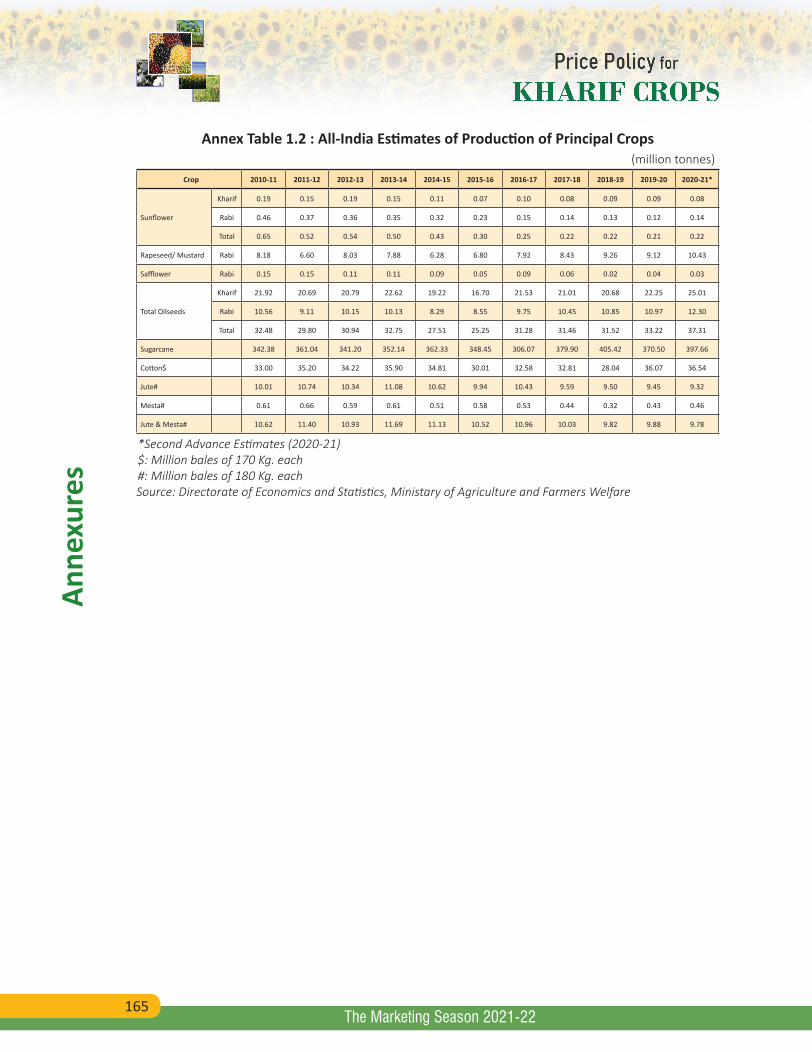
165
Anne
xure
s
The Marketing Season 2021-22
Annex Table 1.2 : All-India Estimates of Production of Principal Crops(million tonnes)
Crop 2010-11 2011-12 2012-13 2013-14 2014-15 2015-16 2016-17 2017-18 2018-19 2019-20 2020-21*
Sunflower
Kharif 0.19 0.15 0.19 0.15 0.11 0.07 0.10 0.08 0.09 0.09 0.08
Rabi 0.46 0.37 0.36 0.35 0.32 0.23 0.15 0.14 0.13 0.12 0.14
Total 0.65 0.52 0.54 0.50 0.43 0.30 0.25 0.22 0.22 0.21 0.22
Rapeseed/ Mustard Rabi 8.18 6.60 8.03 7.88 6.28 6.80 7.92 8.43 9.26 9.12 10.43
Safflower Rabi 0.15 0.15 0.11 0.11 0.09 0.05 0.09 0.06 0.02 0.04 0.03
Total Oilseeds
Kharif 21.92 20.69 20.79 22.62 19.22 16.70 21.53 21.01 20.68 22.25 25.01
Rabi 10.56 9.11 10.15 10.13 8.29 8.55 9.75 10.45 10.85 10.97 12.30
Total 32.48 29.80 30.94 32.75 27.51 25.25 31.28 31.46 31.52 33.22 37.31
Sugarcane 342.38 361.04 341.20 352.14 362.33 348.45 306.07 379.90 405.42 370.50 397.66
Cotton$ 33.00 35.20 34.22 35.90 34.81 30.01 32.58 32.81 28.04 36.07 36.54
Jute# 10.01 10.74 10.34 11.08 10.62 9.94 10.43 9.59 9.50 9.45 9.32
Mesta# 0.61 0.66 0.59 0.61 0.51 0.58 0.53 0.44 0.32 0.43 0.46
Jute & Mesta# 10.62 11.40 10.93 11.69 11.13 10.52 10.96 10.03 9.82 9.88 9.78
*Second Advance Estimates (2020-21)$: Million bales of 170 Kg. each#: Million bales of 180 Kg. eachSource: Directorate of Economics and Statistics, Ministary of Agriculture and Farmers Welfare
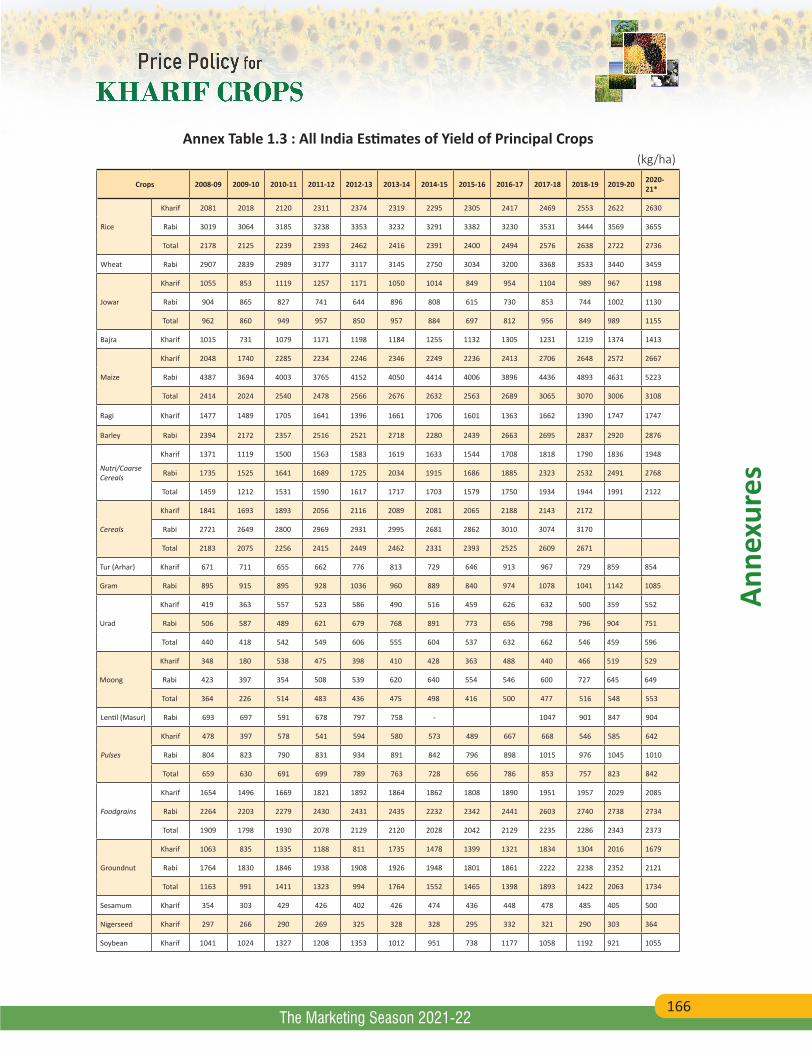
166
Anne
xure
s
The Marketing Season 2021-22
Annex Table 1.3 : All India Estimates of Yield of Principal Crops(kg/ha)
Crops 2008-09 2009-10 2010-11 2011-12 2012-13 2013-14 2014-15 2015-16 2016-17 2017-18 2018-19 2019-20 2020-21*
Rice
Kharif 2081 2018 2120 2311 2374 2319 2295 2305 2417 2469 2553 2622 2630
Rabi 3019 3064 3185 3238 3353 3232 3291 3382 3230 3531 3444 3569 3655
Total 2178 2125 2239 2393 2462 2416 2391 2400 2494 2576 2638 2722 2736
Wheat Rabi 2907 2839 2989 3177 3117 3145 2750 3034 3200 3368 3533 3440 3459
Jowar
Kharif 1055 853 1119 1257 1171 1050 1014 849 954 1104 989 967 1198
Rabi 904 865 827 741 644 896 808 615 730 853 744 1002 1130
Total 962 860 949 957 850 957 884 697 812 956 849 989 1155
Bajra Kharif 1015 731 1079 1171 1198 1184 1255 1132 1305 1231 1219 1374 1413
Maize
Kharif 2048 1740 2285 2234 2246 2346 2249 2236 2413 2706 2648 2572 2667
Rabi 4387 3694 4003 3765 4152 4050 4414 4006 3896 4436 4893 4631 5223
Total 2414 2024 2540 2478 2566 2676 2632 2563 2689 3065 3070 3006 3108
Ragi Kharif 1477 1489 1705 1641 1396 1661 1706 1601 1363 1662 1390 1747 1747
Barley Rabi 2394 2172 2357 2516 2521 2718 2280 2439 2663 2695 2837 2920 2876
Nutri/Coarse Cereals
Kharif 1371 1119 1500 1563 1583 1619 1633 1544 1708 1818 1790 1836 1948
Rabi 1735 1525 1641 1689 1725 2034 1915 1686 1885 2323 2532 2491 2768
Total 1459 1212 1531 1590 1617 1717 1703 1579 1750 1934 1944 1991 2122
Cereals
Kharif 1841 1693 1893 2056 2116 2089 2081 2065 2188 2143 2172
Rabi 2721 2649 2800 2969 2931 2995 2681 2862 3010 3074 3170
Total 2183 2075 2256 2415 2449 2462 2331 2393 2525 2609 2671
Tur (Arhar) Kharif 671 711 655 662 776 813 729 646 913 967 729 859 854
Gram Rabi 895 915 895 928 1036 960 889 840 974 1078 1041 1142 1085
Urad
Kharif 419 363 557 523 586 490 516 459 626 632 500 359 552
Rabi 506 587 489 621 679 768 891 773 656 798 796 904 751
Total 440 418 542 549 606 555 604 537 632 662 546 459 596
Moong
Kharif 348 180 538 475 398 410 428 363 488 440 466 519 529
Rabi 423 397 354 508 539 620 640 554 546 600 727 645 649
Total 364 226 514 483 436 475 498 416 500 477 516 548 553
Lentil (Masur) Rabi 693 697 591 678 797 758 - 1047 901 847 904
Pulses
Kharif 478 397 578 541 594 580 573 489 667 668 546 585 642
Rabi 804 823 790 831 934 891 842 796 898 1015 976 1045 1010
Total 659 630 691 699 789 763 728 656 786 853 757 823 842
Foodgrains
Kharif 1654 1496 1669 1821 1892 1864 1862 1808 1890 1951 1957 2029 2085
Rabi 2264 2203 2279 2430 2431 2435 2232 2342 2441 2603 2740 2738 2734
Total 1909 1798 1930 2078 2129 2120 2028 2042 2129 2235 2286 2343 2373
Groundnut
Kharif 1063 835 1335 1188 811 1735 1478 1399 1321 1834 1304 2016 1679
Rabi 1764 1830 1846 1938 1908 1926 1948 1801 1861 2222 2238 2352 2121
Total 1163 991 1411 1323 994 1764 1552 1465 1398 1893 1422 2063 1734
Sesamum Kharif 354 303 429 426 402 426 474 436 448 478 485 405 500
Nigerseed Kharif 297 266 290 269 325 328 328 295 332 321 290 303 364
Soybean Kharif 1041 1024 1327 1208 1353 1012 951 738 1177 1058 1192 921 1055
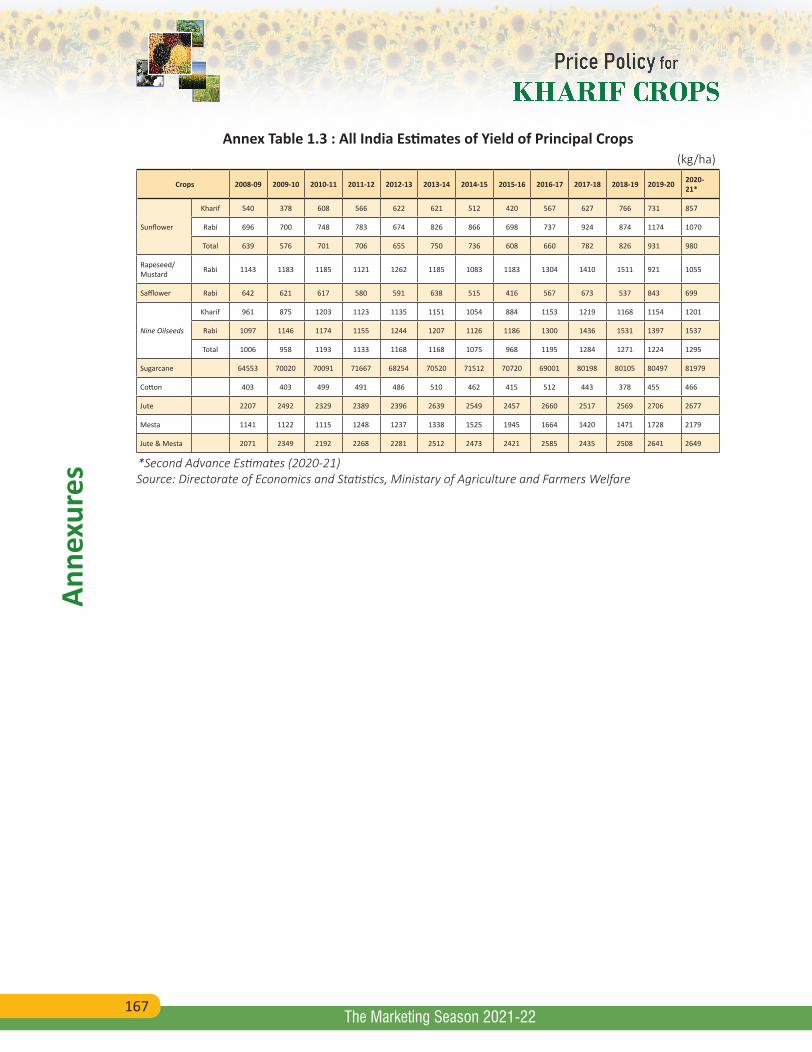
167
Anne
xure
s
The Marketing Season 2021-22
Annex Table 1.3 : All India Estimates of Yield of Principal Crops(kg/ha)
Crops 2008-09 2009-10 2010-11 2011-12 2012-13 2013-14 2014-15 2015-16 2016-17 2017-18 2018-19 2019-20 2020-21*
Sunflower
Kharif 540 378 608 566 622 621 512 420 567 627 766 731 857
Rabi 696 700 748 783 674 826 866 698 737 924 874 1174 1070
Total 639 576 701 706 655 750 736 608 660 782 826 931 980
Rapeseed/ Mustard Rabi 1143 1183 1185 1121 1262 1185 1083 1183 1304 1410 1511 921 1055
Safflower Rabi 642 621 617 580 591 638 515 416 567 673 537 843 699
Nine Oilseeds
Kharif 961 875 1203 1123 1135 1151 1054 884 1153 1219 1168 1154 1201
Rabi 1097 1146 1174 1155 1244 1207 1126 1186 1300 1436 1531 1397 1537
Total 1006 958 1193 1133 1168 1168 1075 968 1195 1284 1271 1224 1295
Sugarcane 64553 70020 70091 71667 68254 70520 71512 70720 69001 80198 80105 80497 81979
Cotton 403 403 499 491 486 510 462 415 512 443 378 455 466
Jute 2207 2492 2329 2389 2396 2639 2549 2457 2660 2517 2569 2706 2677
Mesta 1141 1122 1115 1248 1237 1338 1525 1945 1664 1420 1471 1728 2179
Jute & Mesta 2071 2349 2192 2268 2281 2512 2473 2421 2585 2435 2508 2641 2649
*Second Advance Estimates (2020-21)Source: Directorate of Economics and Statistics, Ministary of Agriculture and Farmers Welfare
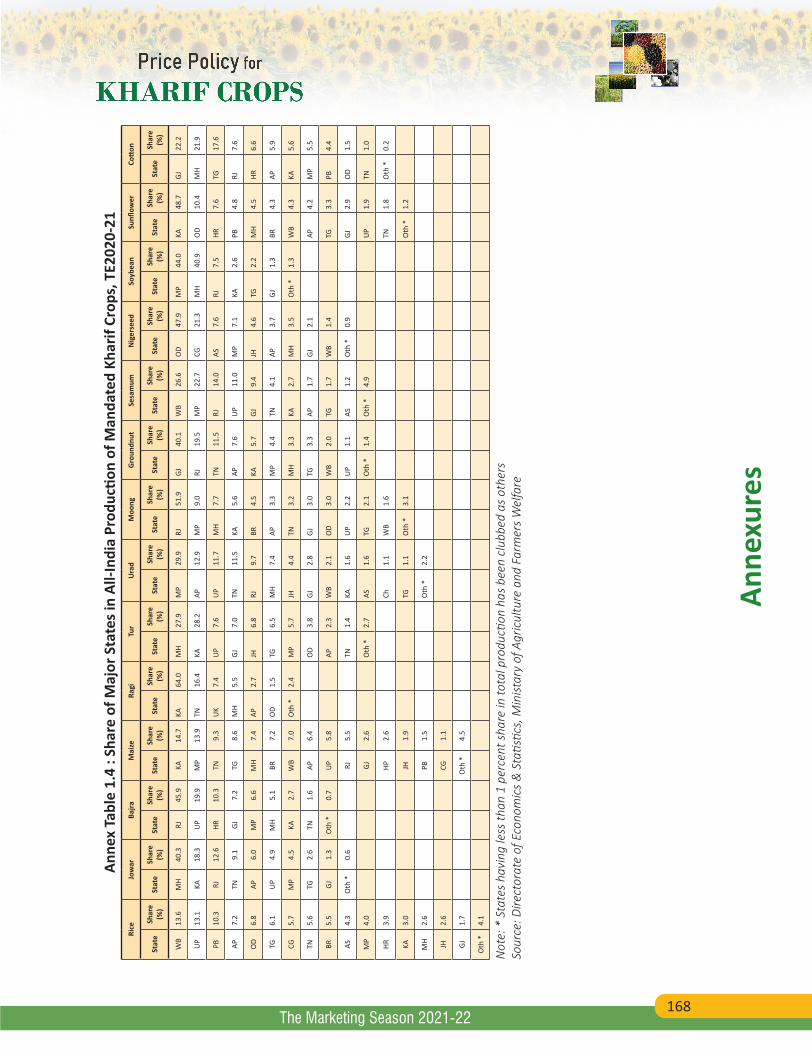
168
Anne
xure
s
The Marketing Season 2021-22
Anne
x Ta
ble
1.4
: Sha
re o
f Maj
or S
tate
s in
All-I
ndia
Pro
ducti
on o
f Man
date
d Kh
arif
Crop
s, T
E202
0-21
Ri
ceJo
war
Bajra
Mai
zeRa
giTu
rU
rad
Moo
ngG
roun
dnut
Sesa
mum
Nig
erse
edSo
ybea
nSu
nflow
erCo
tton
Stat
eSh
are
(%)
Stat
eSh
are
(%)
Stat
eSh
are
(%)
Stat
eSh
are
(%)
Stat
eSh
are
(%)
Stat
eSh
are
(%)
Stat
eSh
are
(%)
Stat
eSh
are
(%)
Stat
eSh
are
(%)
Stat
eSh
are
(%)
Stat
eSh
are
(%)
Stat
eSh
are
(%)
Stat
eSh
are
(%)
Stat
eSh
are
(%)
WB
13.6
MH
40.3
RJ45
.9KA
14.7
KA64
.0M
H27
.9M
P29
.9RJ
51.9
GJ40
.1W
B26
.6O
D47
.9M
P44
.0KA
48.7
GJ22
.2
UP
13.1
KA18
.3U
P19
.9M
P13
.9TN
16.4
KA28
.2AP
12.9
MP
9.0
RJ19
.5M
P22
.7CG
21.3
MH
40.9
OD
10.4
MH
21.9
PB10
.3RJ
12.6
HR10
.3TN
9.3
UK
7.4
UP
7.6
UP
11.7
MH
7.7
TN11
.5RJ
14.0
AS7.
6RJ
7.5
HR7.
6TG
17.6
AP7.
2TN
9.1
GJ7.
2TG
8.6
MH
5.5
GJ7.
0TN
11.5
KA5.
6AP
7.6
UP
11.0
MP
7.1
KA2.
6PB
4.8
RJ7.
6
OD
6.8
AP6.
0M
P6.
6M
H7.
4AP
2.7
JH6.
8RJ
9.7
BR4.
5KA
5.7
GJ9.
4JH
4.6
TG2.
2M
H4.
5HR
6.6
TG6.
1U
P4.
9M
H5.
1BR
7.2
OD
1.5
TG6.
5M
H7.
4AP
3.3
MP
4.4
TN4.
1AP
3.7
GJ1.
3BR
4.3
AP5.
9
CG5.
7M
P4.
5KA
2.7
WB
7.0
Oth
*2.
4M
P5.
7JH
4.4
TN3.
2M
H3.
3KA
2.7
MH
3.5
Oth
*1.
3W
B4.
3KA
5.6
TN5.
6TG
2.6
TN1.
6AP
6.4
OD
3.8
GJ2.
8GJ
3.0
TG3.
3AP
1.7
GJ2.
1AP
4.2
MP
5.5
BR5.
5GJ
1.3
Oth
*0.
7U
P5.
8AP
2.3
WB
2.1
OD
3.0
WB
2.0
TG1.
7W
B1.
4TG
3.3
PB4.
4
AS4.
3O
th *
0.6
RJ5.
5TN
1.4
KA1.
6U
P2.
2U
P1.
1AS
1.2
Oth
*0.
9GJ
2.9
OD
1.5
MP
4.0
GJ2.
6O
th *
2.7
AS1.
6TG
2.1
Oth
*1.
4O
th *
4.9
UP
1.9
TN1.
0
HR3.
9HP
2.6
Ch1.
1W
B1.
6TN
1.8
Oth
*0.
2
KA3.
0JH
1.9
TG1.
1O
th *
3.1
Oth
*1.
2
MH
2.6
PB1.
5O
th *
2.2
JH2.
6CG
1.1
GJ1.
7O
th *
4.5
Oth
*4.
1
Not
e: *
Sta
tes
havi
ng le
ss th
an 1
per
cent
sha
re in
tota
l pro
ducti
on h
as b
een
club
bed
as o
ther
sSo
urce
: Dire
ctor
ate
of E
cono
mic
s &
Sta
tistic
s, M
inist
ary
of A
gric
ultu
re a
nd F
arm
ers
Wel
fare
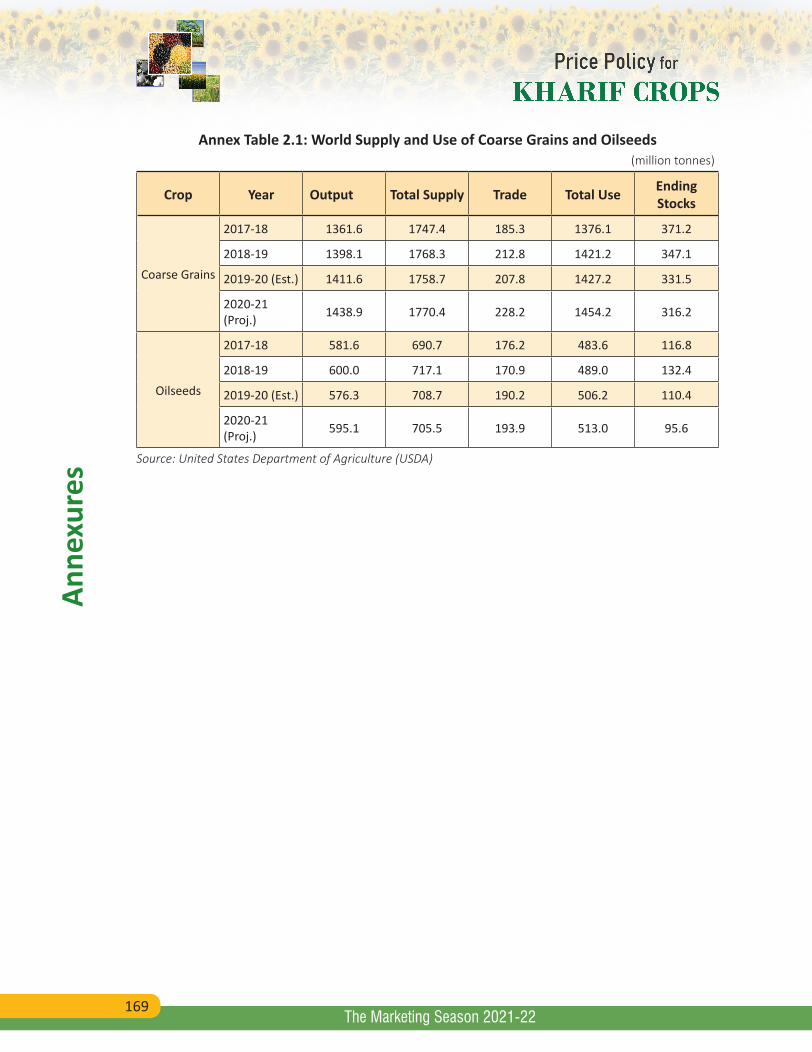
169
Anne
xure
s
The Marketing Season 2021-22
Annex Table 2.1: World Supply and Use of Coarse Grains and Oilseeds(million tonnes)
Crop Year Output Total Supply Trade Total Use Ending Stocks
Coarse Grains
2017-18 1361.6 1747.4 185.3 1376.1 371.2
2018-19 1398.1 1768.3 212.8 1421.2 347.1
2019-20 (Est.) 1411.6 1758.7 207.8 1427.2 331.5
2020-21 (Proj.) 1438.9 1770.4 228.2 1454.2 316.2
Oilseeds
2017-18 581.6 690.7 176.2 483.6 116.8
2018-19 600.0 717.1 170.9 489.0 132.4
2019-20 (Est.) 576.3 708.7 190.2 506.2 110.4
2020-21 (Proj.) 595.1 705.5 193.9 513.0 95.6
Source: United States Department of Agriculture (USDA)
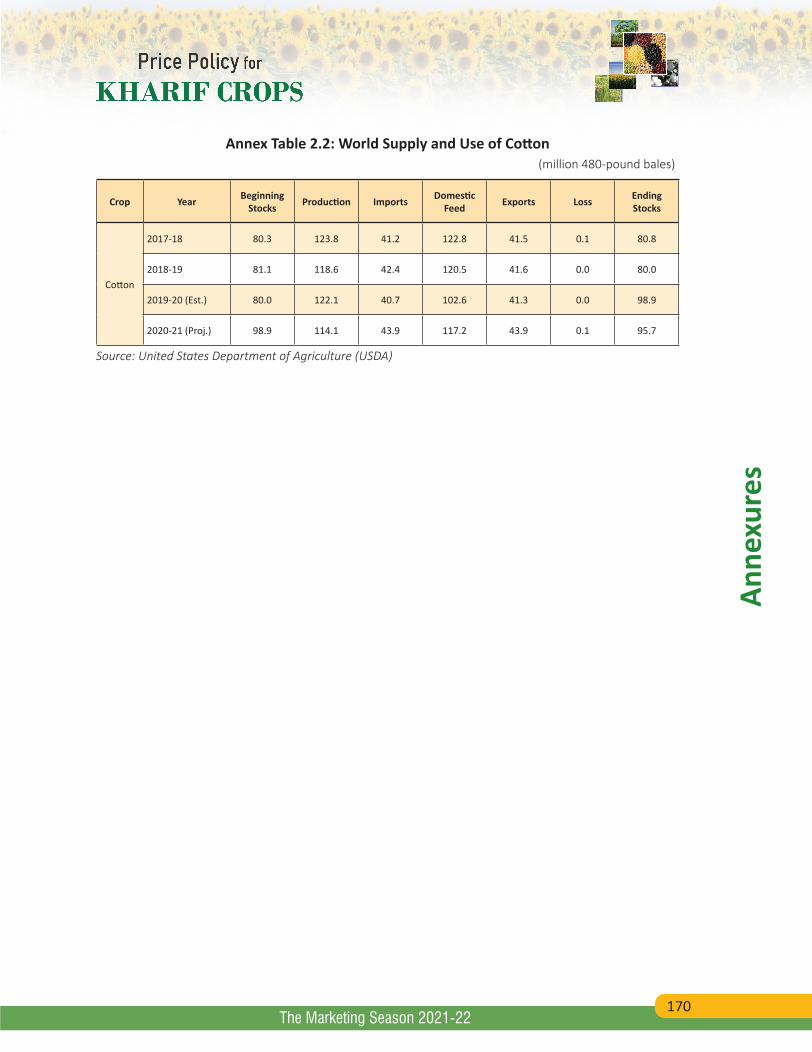
170
Anne
xure
s
The Marketing Season 2021-22
Annex Table 2.2: World Supply and Use of Cotton(million 480-pound bales)
Crop Year Beginning Stocks Production Imports Domestic
Feed Exports Loss Ending Stocks
Cotton
2017-18 80.3 123.8 41.2 122.8 41.5 0.1 80.8
2018-19 81.1 118.6 42.4 120.5 41.6 0.0 80.0
2019-20 (Est.) 80.0 122.1 40.7 102.6 41.3 0.0 98.9
2020-21 (Proj.) 98.9 114.1 43.9 117.2 43.9 0.1 95.7
Source: United States Department of Agriculture (USDA)
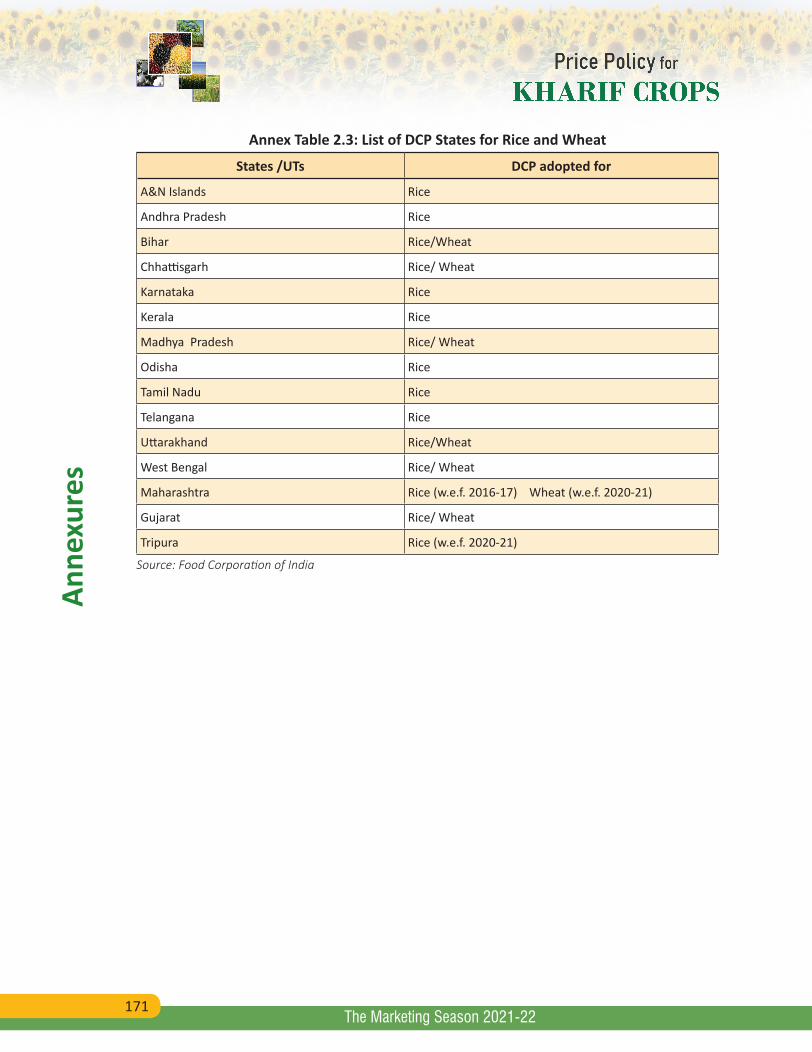
171
Anne
xure
s
The Marketing Season 2021-22
Annex Table 2.3: List of DCP States for Rice and Wheat
States /UTs DCP adopted for
A&N Islands Rice
Andhra Pradesh Rice
Bihar Rice/Wheat
Chhattisgarh Rice/ Wheat
Karnataka Rice
Kerala Rice
Madhya Pradesh Rice/ Wheat
Odisha Rice
Tamil Nadu Rice
Telangana Rice
Uttarakhand Rice/Wheat
West Bengal Rice/ Wheat
Maharashtra Rice (w.e.f. 2016-17) Wheat (w.e.f. 2020-21)
Gujarat Rice/ Wheat
Tripura Rice (w.e.f. 2020-21)
Source: Food Corporation of India
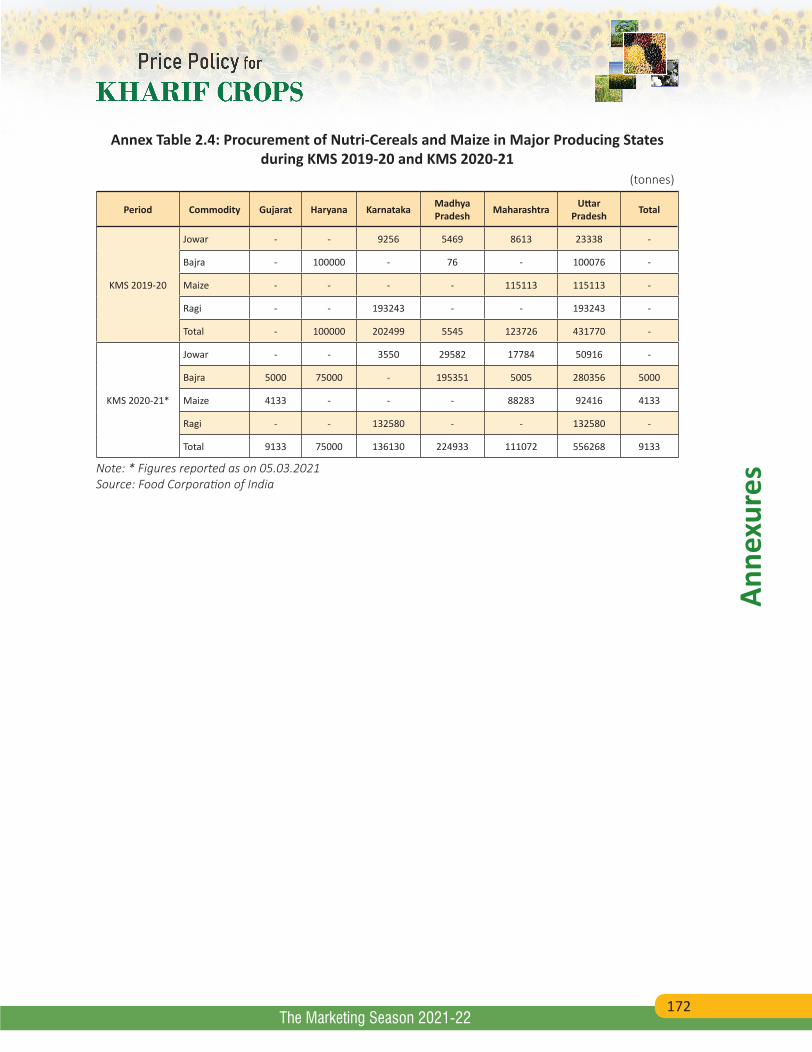
172
Anne
xure
s
The Marketing Season 2021-22
Annex Table 2.4: Procurement of Nutri-Cereals and Maize in Major Producing States during KMS 2019-20 and KMS 2020-21
(tonnes)
Period Commodity Gujarat Haryana Karnataka Madhya Pradesh Maharashtra Uttar
Pradesh Total
KMS 2019-20
Jowar - - 9256 5469 8613 23338 -
Bajra - 100000 - 76 - 100076 -
Maize - - - - 115113 115113 -
Ragi - - 193243 - - 193243 -
Total - 100000 202499 5545 123726 431770 -
KMS 2020-21*
Jowar - - 3550 29582 17784 50916 -
Bajra 5000 75000 - 195351 5005 280356 5000
Maize 4133 - - - 88283 92416 4133
Ragi - - 132580 - - 132580 -
Total 9133 75000 136130 224933 111072 556268 9133
Note: * Figures reported as on 05.03.2021Source: Food Corporation of India
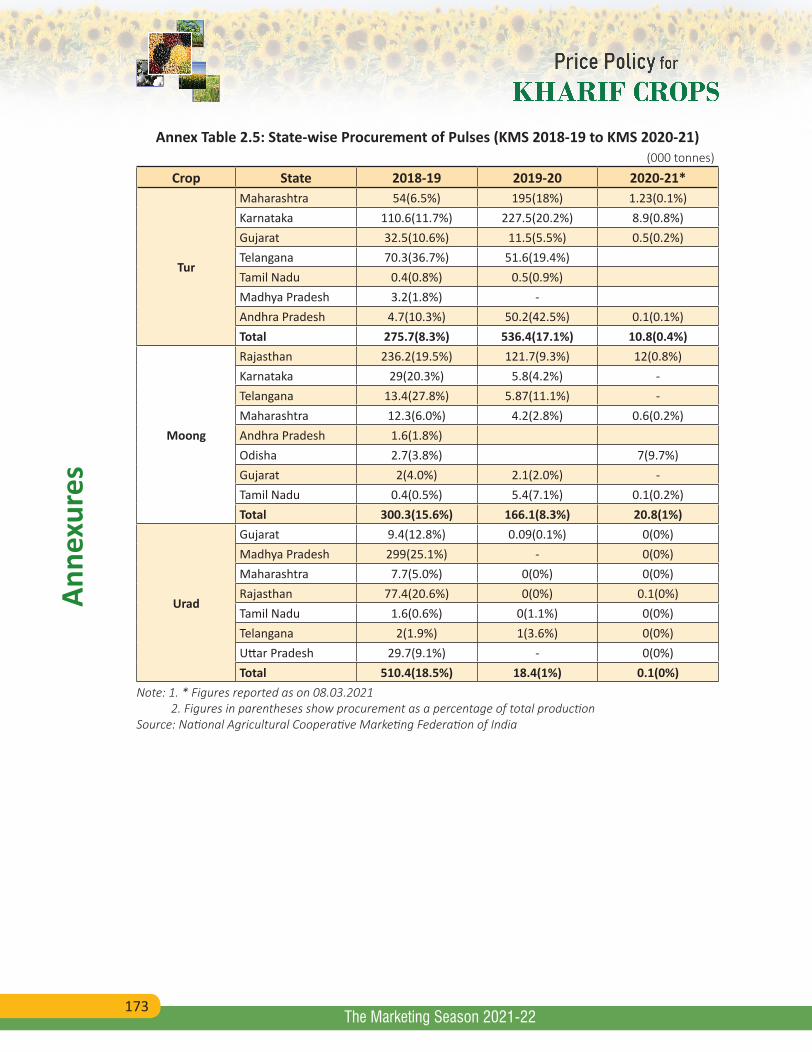
173
Anne
xure
s
The Marketing Season 2021-22
Annex Table 2.5: State-wise Procurement of Pulses (KMS 2018-19 to KMS 2020-21)(000 tonnes)
Crop State 2018-19 2019-20 2020-21*
Tur
Maharashtra 54(6.5%) 195(18%) 1.23(0.1%)Karnataka 110.6(11.7%) 227.5(20.2%) 8.9(0.8%)Gujarat 32.5(10.6%) 11.5(5.5%) 0.5(0.2%) Telangana 70.3(36.7%) 51.6(19.4%)Tamil Nadu 0.4(0.8%) 0.5(0.9%)Madhya Pradesh 3.2(1.8%) -Andhra Pradesh 4.7(10.3%) 50.2(42.5%) 0.1(0.1%) Total 275.7(8.3%) 536.4(17.1%) 10.8(0.4%)
Moong
Rajasthan 236.2(19.5%) 121.7(9.3%) 12(0.8%)Karnataka 29(20.3%) 5.8(4.2%) -Telangana 13.4(27.8%) 5.87(11.1%) -Maharashtra 12.3(6.0%) 4.2(2.8%) 0.6(0.2%)Andhra Pradesh 1.6(1.8%)Odisha 2.7(3.8%) 7(9.7%) Gujarat 2(4.0%) 2.1(2.0%) -Tamil Nadu 0.4(0.5%) 5.4(7.1%) 0.1(0.2%)Total 300.3(15.6%) 166.1(8.3%) 20.8(1%)
Urad
Gujarat 9.4(12.8%) 0.09(0.1%) 0(0%)Madhya Pradesh 299(25.1%) - 0(0%)Maharashtra 7.7(5.0%) 0(0%) 0(0%)Rajasthan 77.4(20.6%) 0(0%) 0.1(0%)Tamil Nadu 1.6(0.6%) 0(1.1%) 0(0%)Telangana 2(1.9%) 1(3.6%) 0(0%)Uttar Pradesh 29.7(9.1%) - 0(0%)Total 510.4(18.5%) 18.4(1%) 0.1(0%)
Note: 1. * Figures reported as on 08.03.2021 2. Figures in parentheses show procurement as a percentage of total productionSource: National Agricultural Cooperative Marketing Federation of India
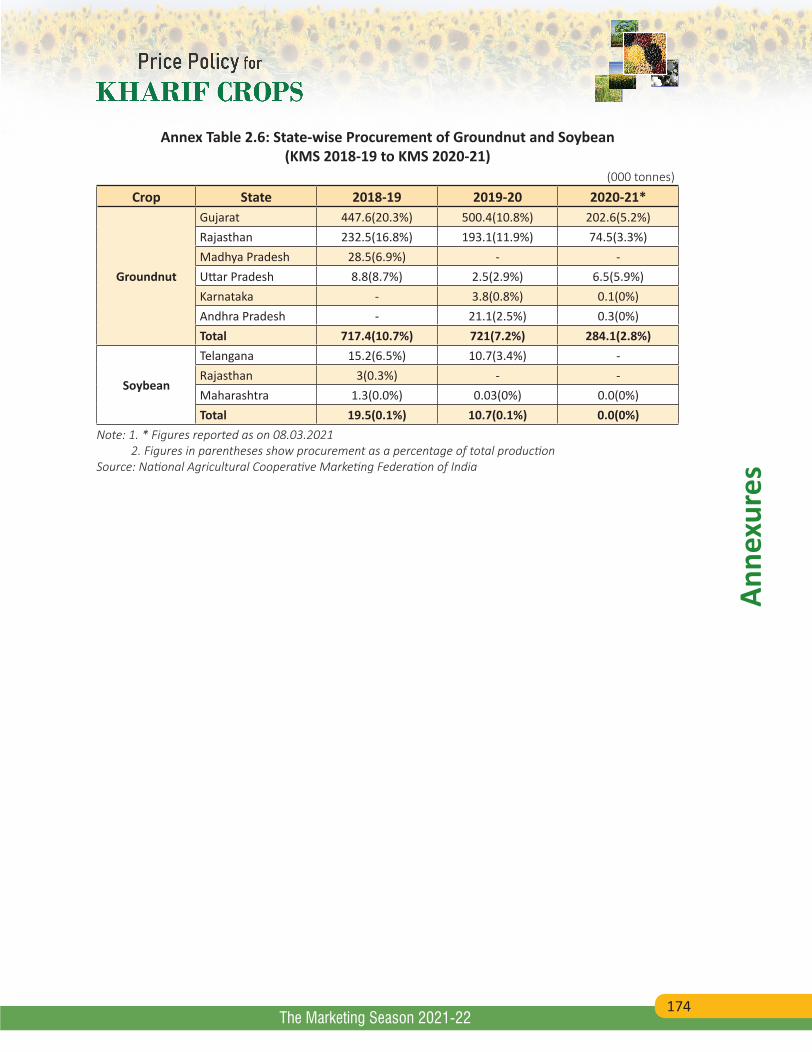
174
Anne
xure
s
The Marketing Season 2021-22
Annex Table 2.6: State-wise Procurement of Groundnut and Soybean (KMS 2018-19 to KMS 2020-21)
(000 tonnes)
Crop State 2018-19 2019-20 2020-21*
Groundnut
Gujarat 447.6(20.3%) 500.4(10.8%) 202.6(5.2%)Rajasthan 232.5(16.8%) 193.1(11.9%) 74.5(3.3%)Madhya Pradesh 28.5(6.9%) - -Uttar Pradesh 8.8(8.7%) 2.5(2.9%) 6.5(5.9%)Karnataka - 3.8(0.8%) 0.1(0%)Andhra Pradesh - 21.1(2.5%) 0.3(0%)Total 717.4(10.7%) 721(7.2%) 284.1(2.8%)
Soybean
Telangana 15.2(6.5%) 10.7(3.4%) -Rajasthan 3(0.3%) - -Maharashtra 1.3(0.0%) 0.03(0%) 0.0(0%)Total 19.5(0.1%) 10.7(0.1%) 0.0(0%)
Note: 1. * Figures reported as on 08.03.2021 2. Figures in parentheses show procurement as a percentage of total productionSource: National Agricultural Cooperative Marketing Federation of India
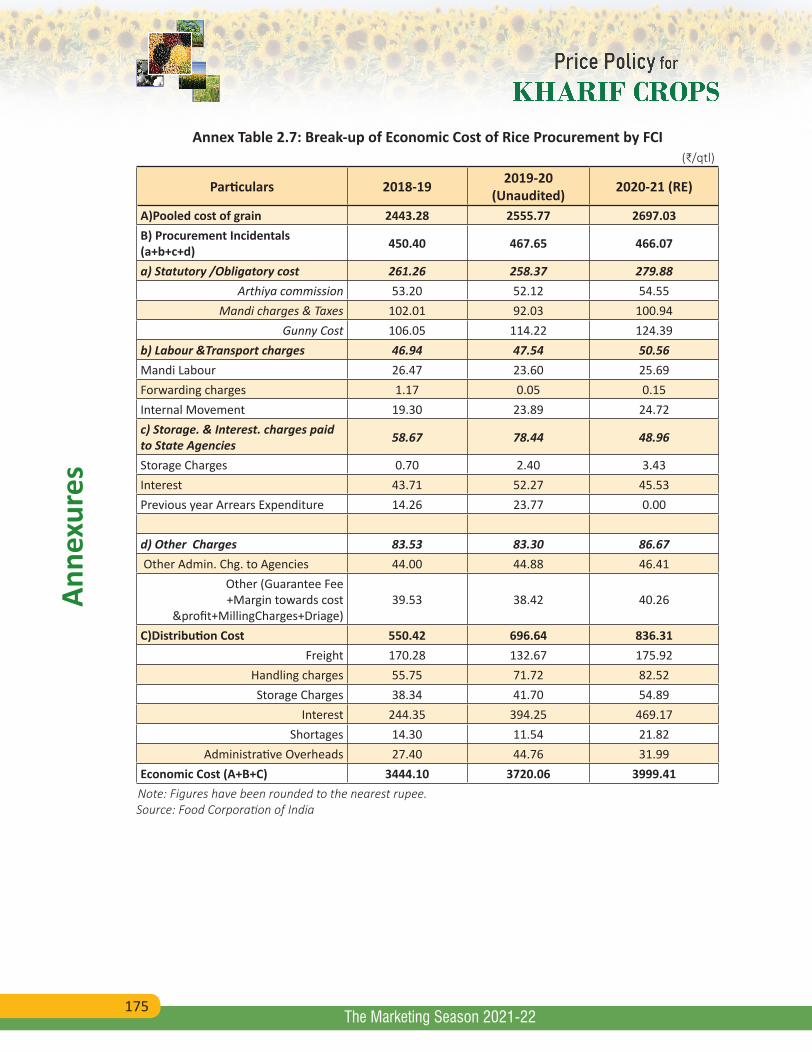
175
Anne
xure
s
The Marketing Season 2021-22
Annex Table 2.7: Break-up of Economic Cost of Rice Procurement by FCI(₹/qtl)
Particulars 2018-19 2019-20(Unaudited) 2020-21 (RE)
A)Pooled cost of grain 2443.28 2555.77 2697.03B) Procurement Incidentals (a+b+c+d) 450.40 467.65 466.07
a) Statutory /Obligatory cost 261.26 258.37 279.88Arthiya commission 53.20 52.12 54.55
Mandi charges & Taxes 102.01 92.03 100.94Gunny Cost 106.05 114.22 124.39
b) Labour &Transport charges 46.94 47.54 50.56Mandi Labour 26.47 23.60 25.69Forwarding charges 1.17 0.05 0.15Internal Movement 19.30 23.89 24.72c) Storage. & Interest. charges paid to State Agencies 58.67 78.44 48.96
Storage Charges 0.70 2.40 3.43Interest 43.71 52.27 45.53Previous year Arrears Expenditure 14.26 23.77 0.00
d) Other Charges 83.53 83.30 86.67 Other Admin. Chg. to Agencies 44.00 44.88 46.41
Other (Guarantee Fee +Margin towards cost
&profit+MillingCharges+Driage)39.53 38.42 40.26
C)Distribution Cost 550.42 696.64 836.31Freight 170.28 132.67 175.92
Handling charges 55.75 71.72 82.52Storage Charges 38.34 41.70 54.89
Interest 244.35 394.25 469.17Shortages 14.30 11.54 21.82
Administrative Overheads 27.40 44.76 31.99Economic Cost (A+B+C) 3444.10 3720.06 3999.41Note: Figures have been rounded to the nearest rupee.Source: Food Corporation of India
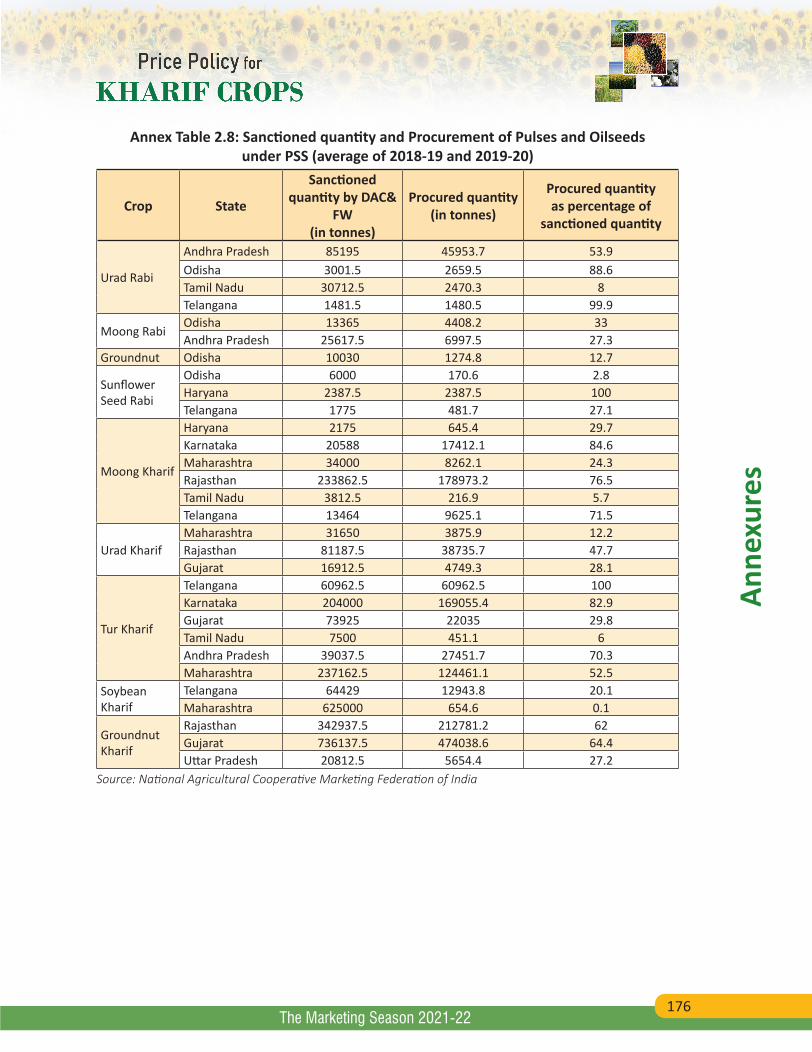
176
Anne
xure
s
The Marketing Season 2021-22
Annex Table 2.8: Sanctioned quantity and Procurement of Pulses and Oilseeds under PSS (average of 2018-19 and 2019-20)
Crop State
Sanctioned quantity by DAC&
FW (in tonnes)
Procured quantity (in tonnes)
Procured quantity as percentage of
sanctioned quantity
Urad Rabi
Andhra Pradesh 85195 45953.7 53.9Odisha 3001.5 2659.5 88.6Tamil Nadu 30712.5 2470.3 8Telangana 1481.5 1480.5 99.9
Moong RabiOdisha 13365 4408.2 33Andhra Pradesh 25617.5 6997.5 27.3
Groundnut Odisha 10030 1274.8 12.7
Sunflower Seed Rabi
Odisha 6000 170.6 2.8Haryana 2387.5 2387.5 100Telangana 1775 481.7 27.1
Moong Kharif
Haryana 2175 645.4 29.7Karnataka 20588 17412.1 84.6Maharashtra 34000 8262.1 24.3Rajasthan 233862.5 178973.2 76.5Tamil Nadu 3812.5 216.9 5.7Telangana 13464 9625.1 71.5
Urad KharifMaharashtra 31650 3875.9 12.2Rajasthan 81187.5 38735.7 47.7Gujarat 16912.5 4749.3 28.1
Tur Kharif
Telangana 60962.5 60962.5 100Karnataka 204000 169055.4 82.9Gujarat 73925 22035 29.8Tamil Nadu 7500 451.1 6Andhra Pradesh 39037.5 27451.7 70.3Maharashtra 237162.5 124461.1 52.5
Soybean Kharif
Telangana 64429 12943.8 20.1Maharashtra 625000 654.6 0.1
Groundnut Kharif
Rajasthan 342937.5 212781.2 62Gujarat 736137.5 474038.6 64.4Uttar Pradesh 20812.5 5654.4 27.2
Source: National Agricultural Cooperative Marketing Federation of India
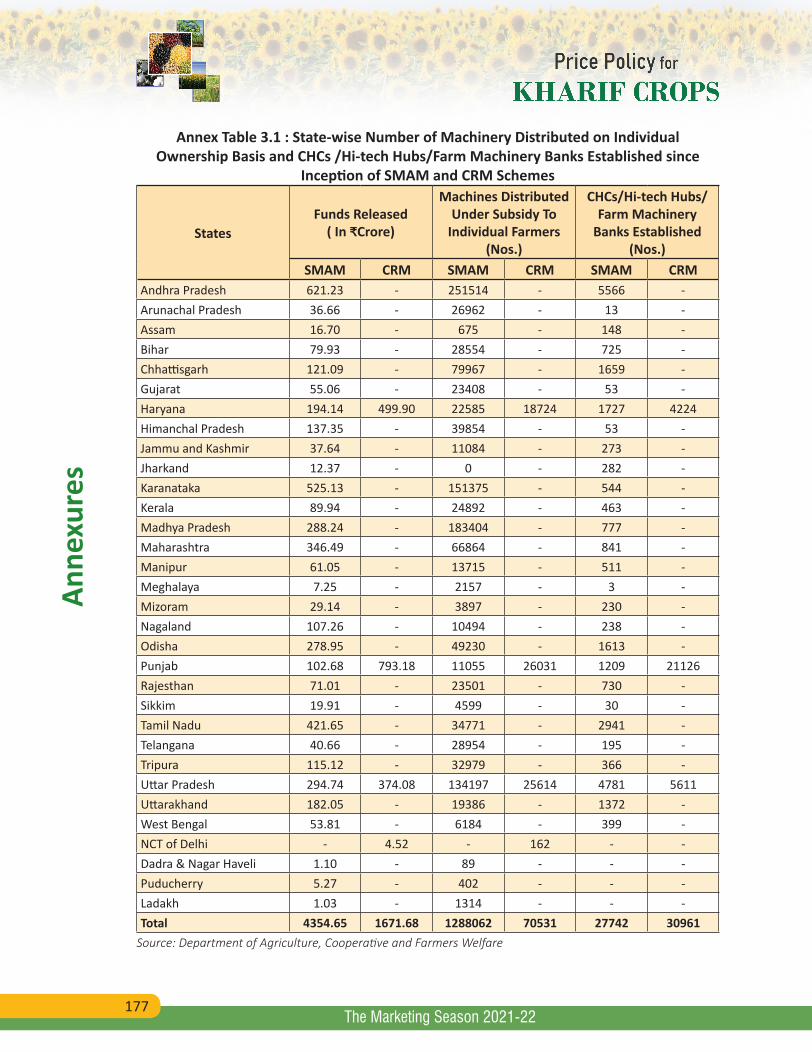
177
Anne
xure
s
The Marketing Season 2021-22
Annex Table 3.1 : State-wise Number of Machinery Distributed on Individual Ownership Basis and CHCs /Hi-tech Hubs/Farm Machinery Banks Established since
Inception of SMAM and CRM Schemes
StatesFunds Released
( In ₹Crore)
Machines Distributed Under Subsidy To
Individual Farmers (Nos.)
CHCs/Hi-tech Hubs/Farm Machinery
Banks Established (Nos.)
SMAM CRM SMAM CRM SMAM CRMAndhra Pradesh 621.23 - 251514 - 5566 -Arunachal Pradesh 36.66 - 26962 - 13 -Assam 16.70 - 675 - 148 -Bihar 79.93 - 28554 - 725 -Chhattisgarh 121.09 - 79967 - 1659 -Gujarat 55.06 - 23408 - 53 -Haryana 194.14 499.90 22585 18724 1727 4224Himanchal Pradesh 137.35 - 39854 - 53 -Jammu and Kashmir 37.64 - 11084 - 273 -Jharkand 12.37 - 0 - 282 -Karanataka 525.13 - 151375 - 544 -Kerala 89.94 - 24892 - 463 -Madhya Pradesh 288.24 - 183404 - 777 -Maharashtra 346.49 - 66864 - 841 -Manipur 61.05 - 13715 - 511 -Meghalaya 7.25 - 2157 - 3 -Mizoram 29.14 - 3897 - 230 -Nagaland 107.26 - 10494 - 238 -Odisha 278.95 - 49230 - 1613 -Punjab 102.68 793.18 11055 26031 1209 21126Rajesthan 71.01 - 23501 - 730 -Sikkim 19.91 - 4599 - 30 -Tamil Nadu 421.65 - 34771 - 2941 -Telangana 40.66 - 28954 - 195 -Tripura 115.12 - 32979 - 366 -Uttar Pradesh 294.74 374.08 134197 25614 4781 5611Uttarakhand 182.05 - 19386 - 1372 -West Bengal 53.81 - 6184 - 399 -NCT of Delhi - 4.52 - 162 - -Dadra & Nagar Haveli 1.10 - 89 - - -Puducherry 5.27 - 402 - - -Ladakh 1.03 - 1314 - - -Total 4354.65 1671.68 1288062 70531 27742 30961
Source: Department of Agriculture, Cooperative and Farmers Welfare
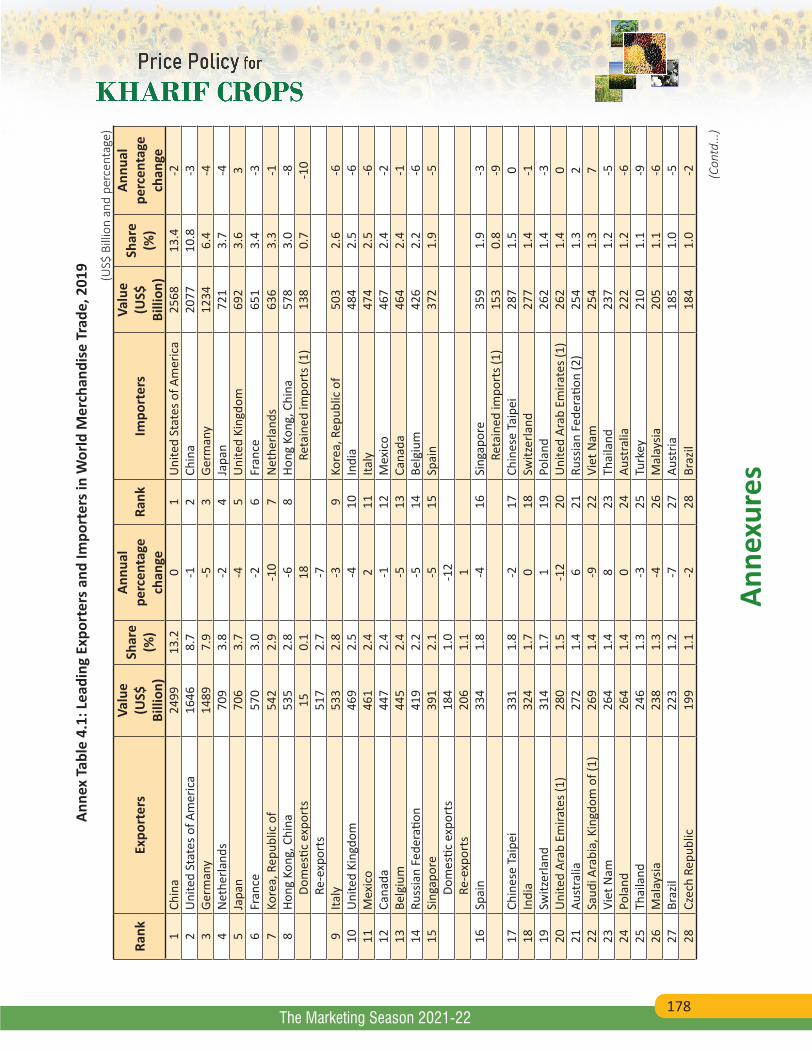
178
Anne
xure
s
The Marketing Season 2021-22
Anne
x Ta
ble
4.1:
Lea
ding
Exp
orte
rs a
nd Im
port
ers i
n W
orld
Mer
chan
dise
Tra
de, 2
019
(US$
Bill
ion
and
perc
enta
ge)
Rank
Expo
rter
sVa
lue
(US$
Bi
llion
)
Shar
e (%
)
Annu
al
perc
enta
ge
chan
geRa
nkIm
port
ers
Valu
e (U
S$
Billi
on)
Shar
e (%
)
Annu
al
perc
enta
ge
chan
ge1
Chin
a 24
9913
.20
1U
nite
d St
ates
of A
mer
ica
2568
13.4
-22
Uni
ted
Stat
es o
f Am
eric
a 16
468.
7-1
2Ch
ina
2077
10.8
-33
Germ
any
1489
7.9
-53
Germ
any
1234
6.4
-44
Net
herla
nds
709
3.8
-24
Japa
n 72
13.
7-4
5Ja
pan
706
3.7
-45
Uni
ted
King
dom
69
23.
63
6Fr
ance
57
03.
0-2
6Fr
ance
65
13.
4-3
7Ko
rea,
Rep
ublic
of
542
2.9
-10
7N
ethe
rland
s 63
63.
3-1
8Ho
ng K
ong,
Chi
na
535
2.8
-68
Hong
Kon
g, C
hina
57
83.
0-8
D
omes
tic e
xpor
ts
150.
118
R
etai
ned
impo
rts (
1)13
80.
7-1
0
Re-
expo
rts
517
2.7
-7
9Ita
ly
533
2.8
-39
Kore
a, R
epub
lic o
f 50
32.
6-6
10U
nite
d Ki
ngdo
m
469
2.5
-410
Indi
a 48
42.
5-6
11M
exic
o 46
12.
42
11Ita
ly
474
2.5
-612
Cana
da
447
2.4
-112
Mex
ico
467
2.4
-213
Belg
ium
44
52.
4-5
13Ca
nada
46
42.
4-1
14Ru
ssia
n Fe
dera
tion
419
2.2
-514
Belg
ium
42
62.
2-6
15Si
ngap
ore
391
2.1
-515
Spai
n 37
21.
9-5
D
omes
tic e
xpor
ts
184
1.0
-12
Re-
expo
rts
206
1.1
1
16Sp
ain
334
1.8
-416
Sing
apor
e 35
91.
9-3
Ret
aine
d im
port
s (1)
153
0.8
-917
Chin
ese
Taip
ei
331
1.8
-217
Chin
ese
Taip
ei
287
1.5
018
Indi
a 32
41.
70
18Sw
itzer
land
27
71.
4-1
19Sw
itzer
land
31
41.
71
19Po
land
26
21.
4-3
20U
nite
d Ar
ab E
mira
tes (
1)28
01.
5-1
220
Uni
ted
Arab
Em
irate
s (1)
262
1.4
021
Aust
ralia
27
21.
46
21Ru
ssia
n Fe
dera
tion
(2)
254
1.3
222
Saud
i Ara
bia,
Kin
gdom
of (
1)26
91.
4-9
22Vi
et N
am
254
1.3
723
Viet
Nam
26
41.
48
23Th
aila
nd
237
1.2
-524
Pola
nd
264
1.4
024
Aust
ralia
22
21.
2-6
25Th
aila
nd
246
1.3
-325
Turk
ey
210
1.1
-926
Mal
aysia
23
81.
3-4
26M
alay
sia
205
1.1
-627
Braz
il 22
31.
2-7
27Au
stria
18
51.
0-5
28Cz
ech
Repu
blic
19
91.
1-2
28Br
azil
184
1.0
-2 (Con
td...
)
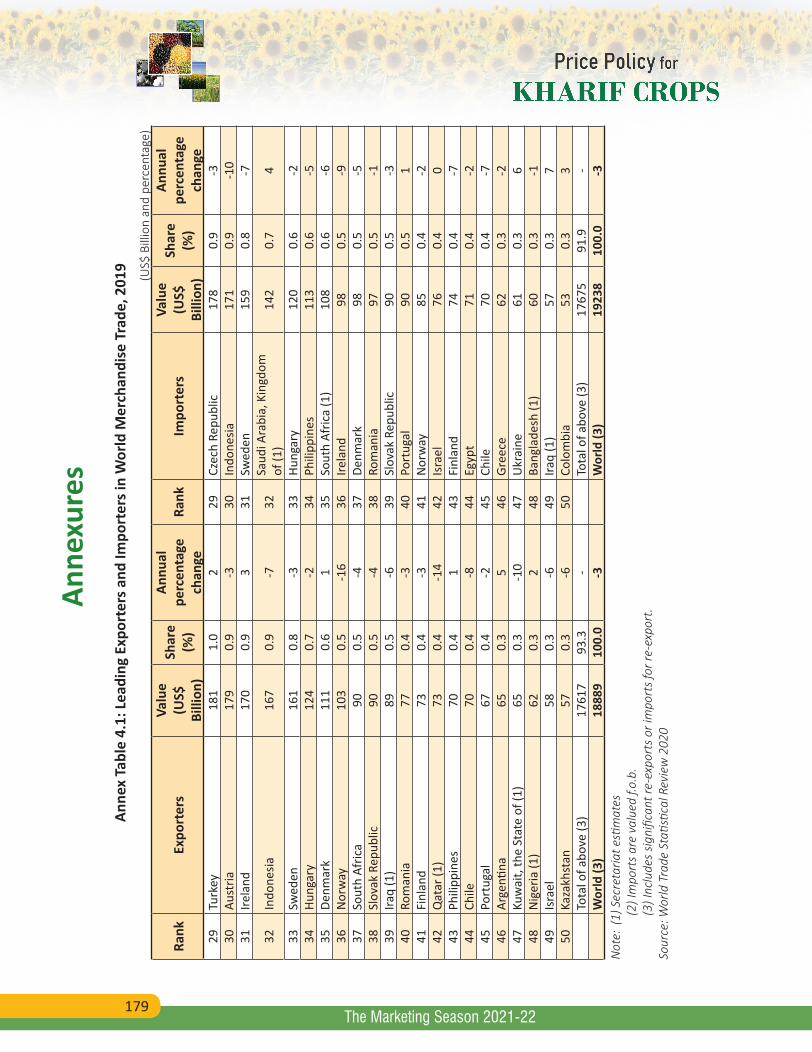
179
Anne
xure
s
The Marketing Season 2021-22
Anne
x Ta
ble
4.1:
Lea
ding
Exp
orte
rs a
nd Im
port
ers i
n W
orld
Mer
chan
dise
Tra
de, 2
019
(US$
Bill
ion
and
perc
enta
ge)
Rank
Expo
rter
sVa
lue
(US$
Bi
llion
)
Shar
e (%
)
Annu
al
perc
enta
ge
chan
geRa
nkIm
port
ers
Valu
e (U
S$
Billi
on)
Shar
e (%
)
Annu
al
perc
enta
ge
chan
ge29
Turk
ey
181
1.0
229
Czec
h Re
publ
ic
178
0.9
-330
Aust
ria
179
0.9
-330
Indo
nesia
17
10.
9-1
031
Irela
nd
170
0.9
331
Swed
en
159
0.8
-7
32In
done
sia
167
0.9
-732
Saud
i Ara
bia,
Kin
gdom
of
(1)
142
0.7
4
33Sw
eden
16
10.
8-3
33Hu
ngar
y 12
00.
6-2
34Hu
ngar
y 12
40.
7-2
34Ph
ilipp
ines
11
30.
6-5
35De
nmar
k 11
10.
61
35So
uth
Afric
a (1
)10
80.
6-6
36N
orw
ay
103
0.5
-16
36Ire
land
98
0.5
-937
Sout
h Af
rica
900.
5-4
37De
nmar
k 98
0.5
-538
Slov
ak R
epub
lic
900.
5-4
38Ro
man
ia
970.
5-1
39Ira
q (1
)89
0.5
-639
Slov
ak R
epub
lic
900.
5-3
40Ro
man
ia
770.
4-3
40Po
rtug
al
900.
51
41Fi
nlan
d 73
0.4
-341
Nor
way
85
0.4
-242
Qat
ar (1
)73
0.4
-14
42Is
rael
76
0.4
043
Phili
ppin
es
700.
41
43Fi
nlan
d 74
0.4
-744
Chile
70
0.4
-844
Egyp
t 71
0.4
-245
Port
ugal
67
0.4
-245
Chile
70
0.4
-746
Arge
ntina
65
0.3
546
Gree
ce
620.
3-2
47Ku
wai
t, th
e St
ate
of (1
)65
0.3
-10
47U
krai
ne
610.
36
48N
iger
ia (1
)62
0.3
248
Bang
lade
sh (1
)60
0.3
-149
Isra
el
580.
3-6
49Ira
q (1
)57
0.3
750
Kaza
khst
an
570.
3-6
50Co
lom
bia
530.
33
Tota
l of a
bove
(3)
1761
793
.3-
Tota
l of a
bove
(3)
1767
591
.9-
Wor
ld (3
)18
889
100.
0-3
Wor
ld (3
)19
238
100.
0-3
Not
e: (
1) S
ecre
taria
t esti
mat
es
(2) I
mpo
rts
are
valu
ed f.
o.b.
(3
) Inc
lude
s sig
nific
ant r
e-ex
port
s or
impo
rts
for r
e-ex
port
.So
urce
: Wor
ld T
rade
Sta
tistic
al R
evie
w 2
020
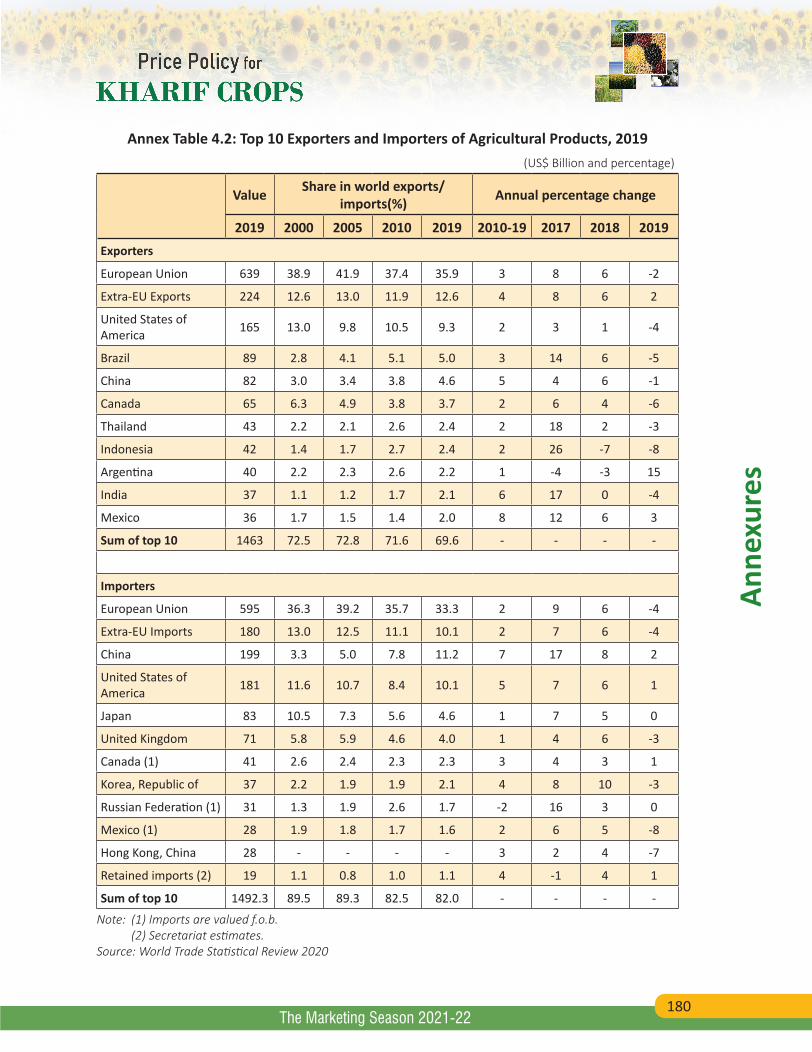
180
Anne
xure
s
The Marketing Season 2021-22
Annex Table 4.2: Top 10 Exporters and Importers of Agricultural Products, 2019(US$ Billion and percentage)
Value Share in world exports/imports(%) Annual percentage change
2019 2000 2005 2010 2019 2010-19 2017 2018 2019Exporters
European Union 639 38.9 41.9 37.4 35.9 3 8 6 -2
Extra-EU Exports 224 12.6 13.0 11.9 12.6 4 8 6 2
United States of America 165 13.0 9.8 10.5 9.3 2 3 1 -4
Brazil 89 2.8 4.1 5.1 5.0 3 14 6 -5
China 82 3.0 3.4 3.8 4.6 5 4 6 -1
Canada 65 6.3 4.9 3.8 3.7 2 6 4 -6
Thailand 43 2.2 2.1 2.6 2.4 2 18 2 -3
Indonesia 42 1.4 1.7 2.7 2.4 2 26 -7 -8
Argentina 40 2.2 2.3 2.6 2.2 1 -4 -3 15
India 37 1.1 1.2 1.7 2.1 6 17 0 -4
Mexico 36 1.7 1.5 1.4 2.0 8 12 6 3
Sum of top 10 1463 72.5 72.8 71.6 69.6 - - - -
Importers
European Union 595 36.3 39.2 35.7 33.3 2 9 6 -4
Extra-EU Imports 180 13.0 12.5 11.1 10.1 2 7 6 -4
China 199 3.3 5.0 7.8 11.2 7 17 8 2
United States of America 181 11.6 10.7 8.4 10.1 5 7 6 1
Japan 83 10.5 7.3 5.6 4.6 1 7 5 0
United Kingdom 71 5.8 5.9 4.6 4.0 1 4 6 -3
Canada (1) 41 2.6 2.4 2.3 2.3 3 4 3 1
Korea, Republic of 37 2.2 1.9 1.9 2.1 4 8 10 -3
Russian Federation (1) 31 1.3 1.9 2.6 1.7 -2 16 3 0
Mexico (1) 28 1.9 1.8 1.7 1.6 2 6 5 -8
Hong Kong, China 28 - - - - 3 2 4 -7
Retained imports (2) 19 1.1 0.8 1.0 1.1 4 -1 4 1
Sum of top 10 1492.3 89.5 89.3 82.5 82.0 - - - -
Note: (1) Imports are valued f.o.b. (2) Secretariat estimates.Source: World Trade Statistical Review 2020
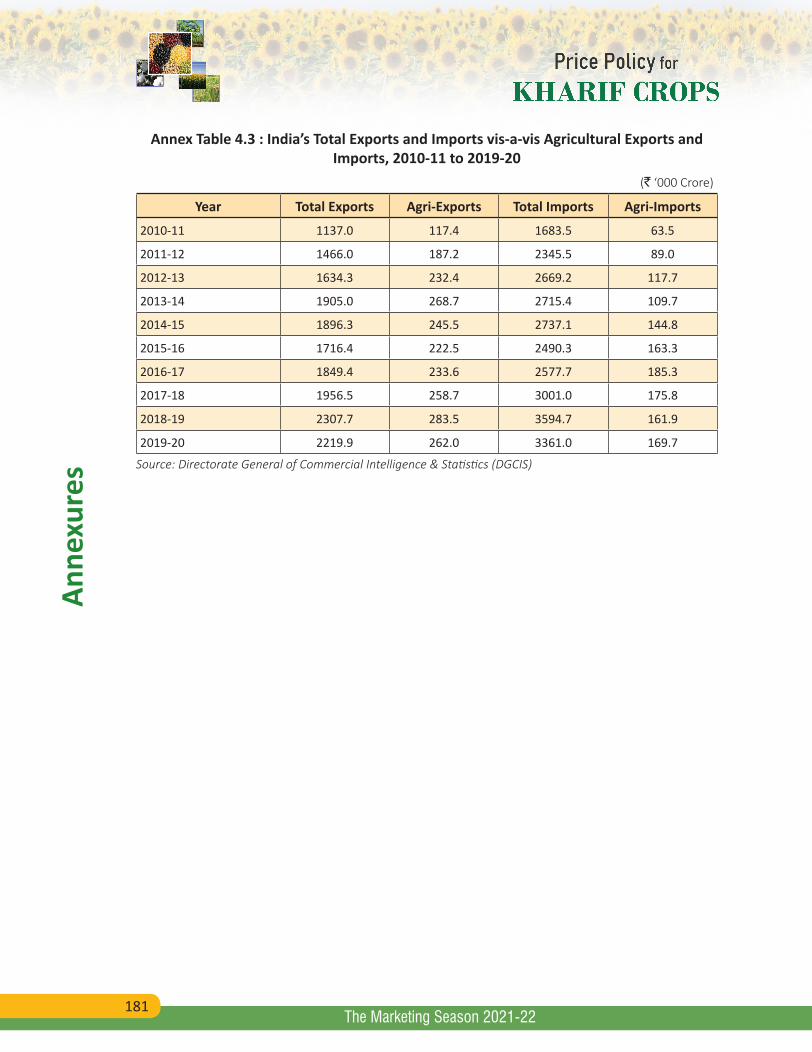
181
Anne
xure
s
The Marketing Season 2021-22
Annex Table 4.3 : India’s Total Exports and Imports vis-a-vis Agricultural Exports and Imports, 2010-11 to 2019-20
(` ‘000 Crore)
Year Total Exports Agri-Exports Total Imports Agri-Imports
2010-11 1137.0 117.4 1683.5 63.5
2011-12 1466.0 187.2 2345.5 89.0
2012-13 1634.3 232.4 2669.2 117.7
2013-14 1905.0 268.7 2715.4 109.7
2014-15 1896.3 245.5 2737.1 144.8
2015-16 1716.4 222.5 2490.3 163.3
2016-17 1849.4 233.6 2577.7 185.3
2017-18 1956.5 258.7 3001.0 175.8
2018-19 2307.7 283.5 3594.7 161.9
2019-20 2219.9 262.0 3361.0 169.7
Source: Directorate General of Commercial Intelligence & Statistics (DGCIS)
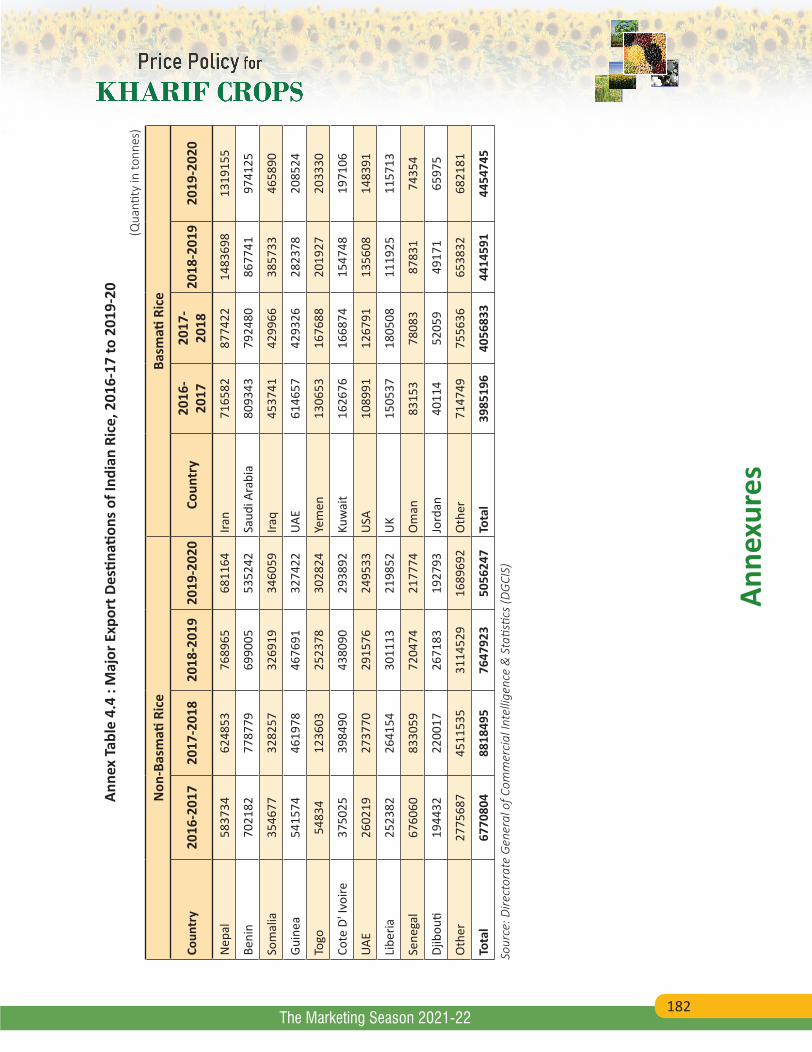
182
Anne
xure
s
The Marketing Season 2021-22
Anne
x Ta
ble
4.4
: Maj
or E
xpor
t Des
tinati
ons o
f Ind
ian
Rice
, 201
6-17
to 2
019-
20 (Q
uanti
ty in
tonn
es)
Non
-Bas
mati
Ric
eBa
smati
Ric
e
Coun
try
2016
-201
720
17-2
018
2018
-201
920
19-2
020
Coun
try
2016
-20
1720
17-
2018
2018
-201
920
19-2
020
Nep
al58
3734
6248
5376
8965
6811
64Ira
n71
6582
8774
2214
8369
813
1915
5
Beni
n70
2182
7787
7969
9005
5352
42Sa
udi A
rabi
a80
9343
7924
8086
7741
9741
25
Som
alia
3546
7732
8257
3269
1934
6059
Iraq
4537
4142
9966
3857
3346
5890
Guin
ea54
1574
4619
7846
7691
3274
22UA
E61
4657
4293
2628
2378
2085
24
Togo
5483
412
3603
2523
7830
2824
Yem
en
1306
5316
7688
2019
2720
3330
Cote
D' I
voire
3750
2539
8490
4380
9029
3892
Kuw
ait
1626
7616
6874
1547
4819
7106
UAE
2602
1927
3770
2915
7624
9533
USA
1089
9112
6791
1356
0814
8391
Libe
ria25
2382
2641
5430
1113
2198
52U
K15
0537
1805
0811
1925
1157
13
Sene
gal
6760
6083
3059
7204
7421
7774
Om
an83
153
7808
387
831
7435
4
Djib
outi
1944
3222
0017
2671
8319
2793
Jord
an40
114
5205
949
171
6597
5
Oth
er27
7568
745
1153
531
1452
916
8969
2O
ther
7147
4975
5636
6538
3268
2181
Tota
l67
7080
488
1849
576
4792
350
5624
7To
tal
3985
196
4056
833
4414
591
4454
745
Sour
ce: D
irect
orat
e G
ener
al o
f Com
mer
cial
Inte
llige
nce
& S
tatis
tics
(DG
CIS)
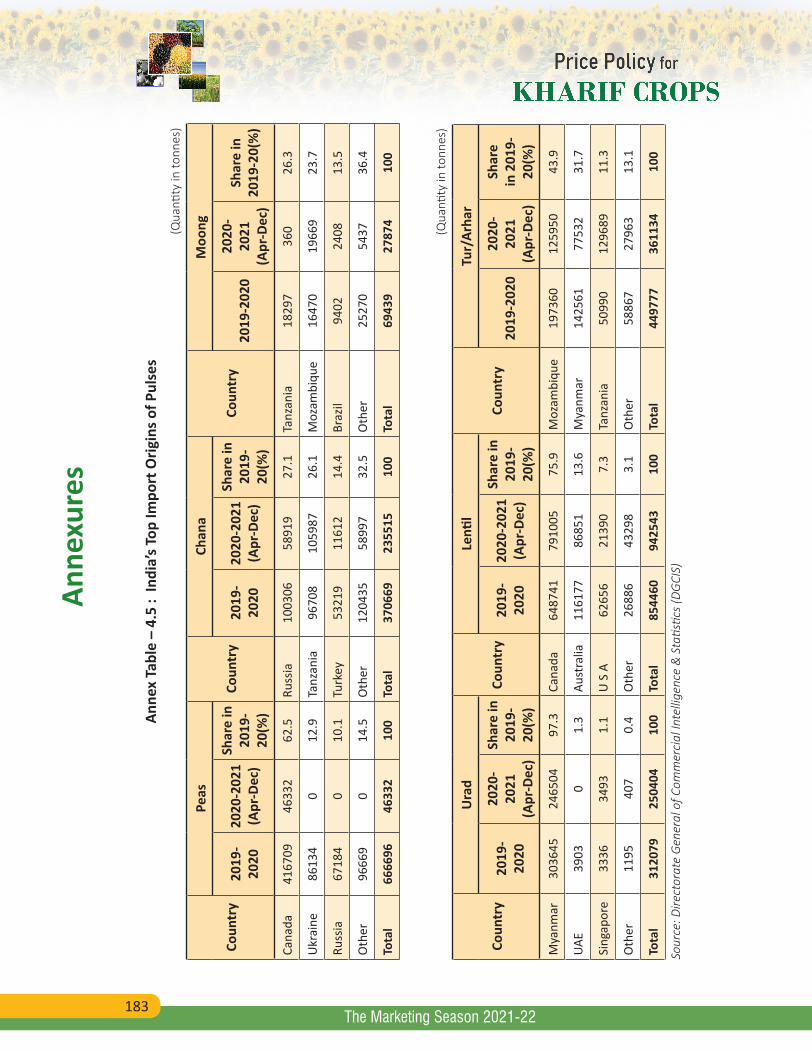
183
Anne
xure
s
The Marketing Season 2021-22
Anne
x Ta
ble
– 4.
5 :
Indi
a’s T
op Im
port
Orig
ins o
f Pul
ses
(Qua
ntity
in to
nnes
)
Coun
try
Peas
Coun
try
Chan
a
Coun
try
Moo
ng
2019
-20
2020
20-2
021
(Apr
-Dec
)
Shar
e in
20
19-
20(%
)
2019
-20
2020
20-2
021
(Apr
-Dec
)
Shar
e in
20
19-
20(%
)20
19-2
020
2020
-20
21
(Apr
-Dec
)
Shar
e in
20
19-2
0(%
)
Cana
da41
6709
4633
262
.5Ru
ssia
1003
0658
919
27.1
Tanz
ania
1829
736
026
.3
Ukr
aine
8613
40
12.9
Tanz
ania
9670
810
5987
26.1
Moz
ambi
que
1647
019
669
23.7
Russ
ia67
184
010
.1Tu
rkey
5321
911
612
14.4
Braz
il94
0224
0813
.5
Oth
er96
669
014
.5O
ther
1204
3558
997
32.5
Oth
er25
270
5437
36.4
Tota
l66
6696
4633
210
0To
tal
3706
6923
5515
100
Tota
l69
439
2787
410
0
(Qua
ntity
in to
nnes
)
Coun
try
Ura
d
Coun
try
Lenti
l
Coun
try
Tur/
Arha
r
2019
-20
20
2020
-20
21
(Apr
-Dec
)
Shar
e in
20
19-
20(%
)
2019
-20
2020
20-2
021
(Apr
-Dec
)
Shar
e in
20
19-
20(%
)20
19-2
020
2020
-20
21
(Apr
-Dec
)
Shar
e in
201
9-20
(%)
Mya
nmar
3036
4524
6504
97.3
Cana
da64
8741
7910
0575
.9M
ozam
biqu
e19
7360
1259
5043
.9
UAE
3903
0 1.
3Au
stra
lia11
6177
8685
113
.6M
yanm
ar14
2561
7753
231
.7
Sing
apor
e33
3634
931.
1U
S A
6265
621
390
7.3
Tanz
ania
5099
012
9689
11.3
Oth
er11
9540
70.
4O
ther
2688
643
298
3.1
Oth
er58
867
2796
313
.1
Tota
l31
2079
2504
0410
0To
tal
8544
6094
2543
100
Tota
l44
9777
3611
3410
0
Sour
ce: D
irect
orat
e G
ener
al o
f Com
mer
cial
Inte
llige
nce
& S
tatis
tics
(DG
CIS)
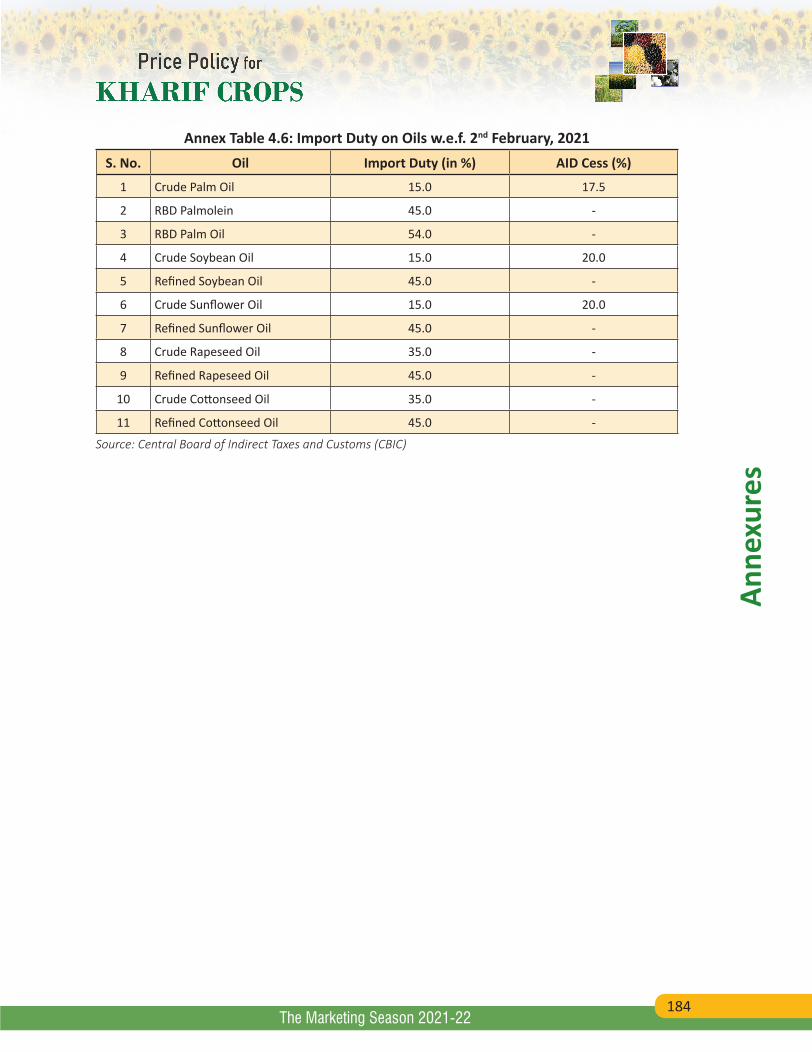
184
Anne
xure
s
The Marketing Season 2021-22
Annex Table 4.6: Import Duty on Oils w.e.f. 2nd February, 2021S. No. Oil Import Duty (in %) AID Cess (%)
1 Crude Palm Oil 15.0 17.5
2 RBD Palmolein 45.0 -
3 RBD Palm Oil 54.0 -
4 Crude Soybean Oil 15.0 20.0
5 Refined Soybean Oil 45.0 -
6 Crude Sunflower Oil 15.0 20.0
7 Refined Sunflower Oil 45.0 -
8 Crude Rapeseed Oil 35.0 -
9 Refined Rapeseed Oil 45.0 -
10 Crude Cottonseed Oil 35.0 -
11 Refined Cottonseed Oil 45.0 -
Source: Central Board of Indirect Taxes and Customs (CBIC)
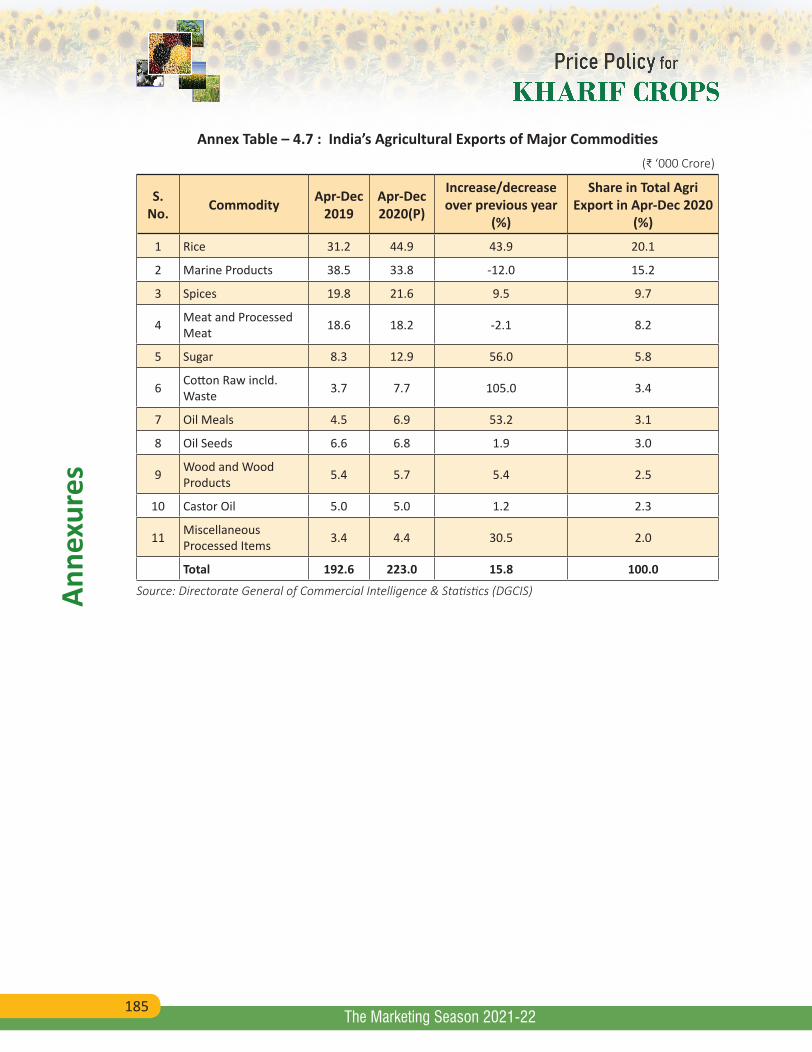
185
Anne
xure
s
The Marketing Season 2021-22
Annex Table – 4.7 : India’s Agricultural Exports of Major Commodities(₹ ‘000 Crore)
S. No. Commodity Apr-Dec
2019Apr-Dec 2020(P)
Increase/decrease over previous year
(%)
Share in Total Agri Export in Apr-Dec 2020
(%)
1 Rice 31.2 44.9 43.9 20.1
2 Marine Products 38.5 33.8 -12.0 15.2
3 Spices 19.8 21.6 9.5 9.7
4 Meat and Processed Meat 18.6 18.2 -2.1 8.2
5 Sugar 8.3 12.9 56.0 5.8
6 Cotton Raw incld. Waste 3.7 7.7 105.0 3.4
7 Oil Meals 4.5 6.9 53.2 3.1
8 Oil Seeds 6.6 6.8 1.9 3.0
9 Wood and Wood Products 5.4 5.7 5.4 2.5
10 Castor Oil 5.0 5.0 1.2 2.3
11 Miscellaneous Processed Items 3.4 4.4 30.5 2.0
Total 192.6 223.0 15.8 100.0
Source: Directorate General of Commercial Intelligence & Statistics (DGCIS)
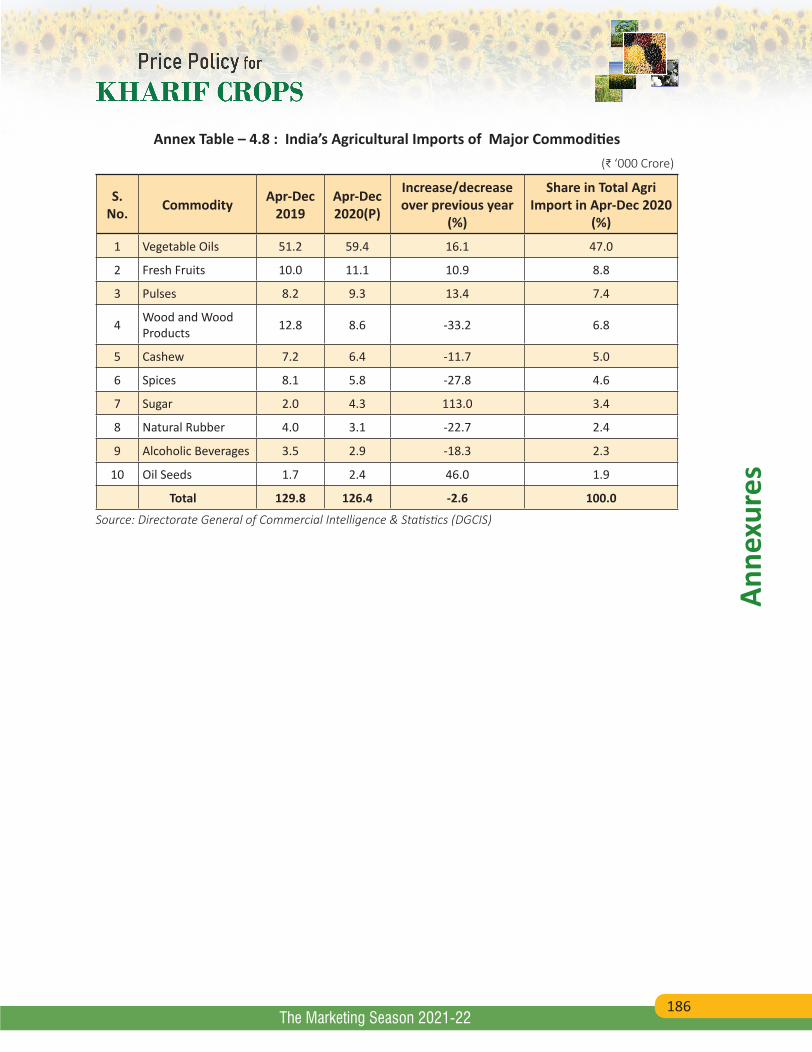
186
Anne
xure
s
The Marketing Season 2021-22
Annex Table – 4.8 : India’s Agricultural Imports of Major Commodities(₹ ‘000 Crore)
S. No. Commodity Apr-Dec
2019Apr-Dec 2020(P)
Increase/decrease over previous year
(%)
Share in Total Agri Import in Apr-Dec 2020
(%)
1 Vegetable Oils 51.2 59.4 16.1 47.0
2 Fresh Fruits 10.0 11.1 10.9 8.8
3 Pulses 8.2 9.3 13.4 7.4
4 Wood and Wood Products 12.8 8.6 -33.2 6.8
5 Cashew 7.2 6.4 -11.7 5.0
6 Spices 8.1 5.8 -27.8 4.6
7 Sugar 2.0 4.3 113.0 3.4
8 Natural Rubber 4.0 3.1 -22.7 2.4
9 Alcoholic Beverages 3.5 2.9 -18.3 2.3
10 Oil Seeds 1.7 2.4 46.0 1.9
Total 129.8 126.4 -2.6 100.0
Source: Directorate General of Commercial Intelligence & Statistics (DGCIS)
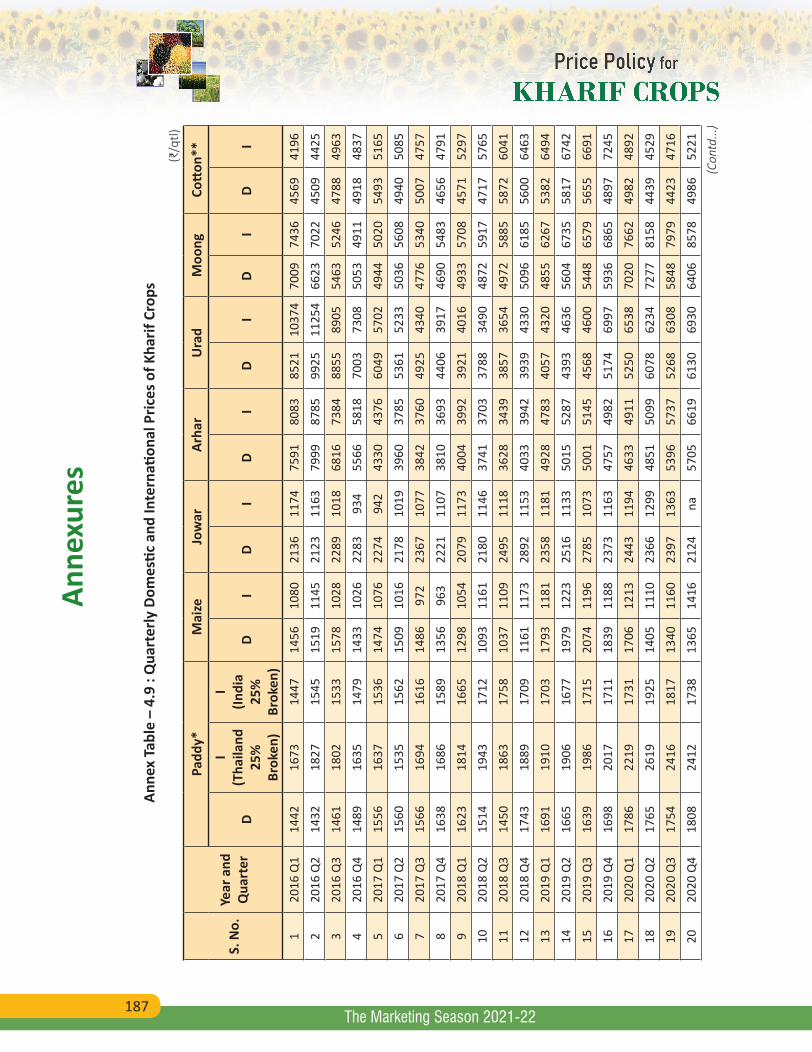
187
Anne
xure
s
The Marketing Season 2021-22
Anne
x Ta
ble
– 4.
9 : Q
uart
erly
Dom
estic
and
Inte
rnati
onal
Pric
es o
f Kha
rif C
rops
(₹/q
tl)
S. N
o.Ye
ar a
nd
Qua
rter
Padd
y*M
aize
Jow
arAr
har
Ura
dM
oong
Cott
on**
D
I (T
haila
nd
25%
Br
oken
)
I
(In
dia
25%
Br
oken
)
DI
DI
DI
DI
DI
DI
120
16 Q
114
4216
7314
4714
5610
8021
3611
7475
9180
8385
2110
374
7009
7436
4569
4196
220
16 Q
214
3218
2715
4515
1911
4521
2311
6379
9987
8599
2511
254
6623
7022
4509
4425
320
16 Q
314
6118
0215
3315
7810
2822
8910
1868
1673
8488
5589
0554
6352
4647
8849
634
2016
Q4
1489
1635
1479
1433
1026
2283
934
5566
5818
7003
7308
5053
4911
4918
4837
520
17 Q
115
5616
3715
3614
7410
7622
7494
243
3043
7660
4957
0249
4450
2054
9351
656
2017
Q2
1560
1535
1562
1509
1016
2178
1019
3960
3785
5361
5233
5036
5608
4940
5085
720
17 Q
315
6616
9416
1614
8697
223
6710
7738
4237
6049
2543
4047
7653
4050
0747
578
2017
Q4
1638
1686
1589
1356
963
2221
1107
3810
3693
4406
3917
4690
5483
4656
4791
920
18 Q
116
2318
1416
6512
9810
5420
7911
7340
0439
9239
2140
1649
3357
0845
7152
9710
2018
Q2
1514
1943
1712
1093
1161
2180
1146
3741
3703
3788
3490
4872
5917
4717
5765
1120
18 Q
314
5018
6317
5810
3711
0924
9511
1836
2834
3938
5736
5449
7258
8558
7260
4112
2018
Q4
1743
1889
1709
1161
1173
2892
1153
4033
3942
3939
4330
5096
6185
5600
6463
1320
19 Q
116
9119
1017
0317
9311
8123
5811
8149
2847
8340
5743
2048
5562
6753
8264
9414
2019
Q2
1665
1906
1677
1979
1223
2516
1133
5015
5287
4393
4636
5604
6735
5817
6742
1520
19 Q
316
3919
8617
1520
7411
9627
8510
7350
0151
4545
6846
0054
4865
7956
5566
9116
2019
Q4
1698
2017
1711
1839
1188
2373
1163
4757
4982
5174
6997
5936
6865
4897
7245
1720
20 Q
117
8622
1917
3117
0612
1324
4311
9446
3349
1152
5065
3870
2076
6249
8248
9218
2020
Q2
1765
2619
1925
1405
1110
2366
1299
4851
5099
6078
6234
7277
8158
4439
4529
1920
20 Q
317
5424
1618
1713
4011
6023
9713
6353
9657
3752
6863
0858
4879
7944
2347
1620
2020
Q4
1808
2412
1738
1365
1416
2124
na57
0566
1961
3069
3064
0685
7849
8652
21(C
ontd
...)
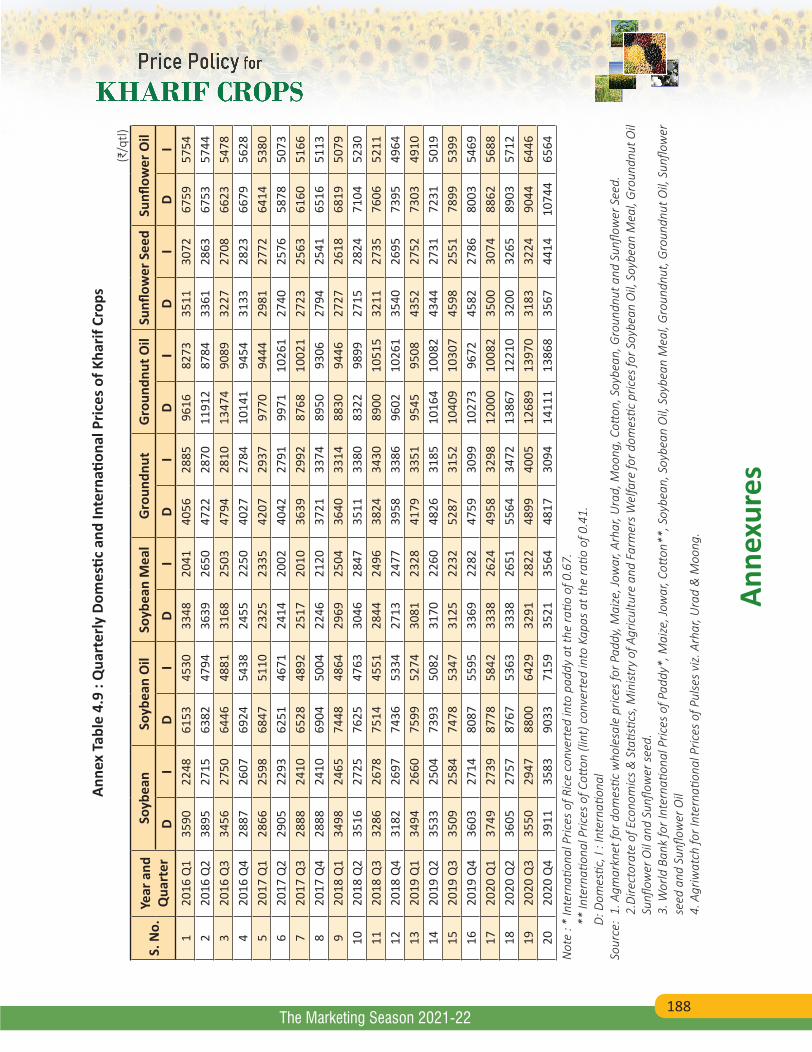
188
Anne
xure
s
The Marketing Season 2021-22
Anne
x Ta
ble
4.9
: Qua
rter
ly D
omes
tic a
nd In
tern
ation
al P
rices
of K
harif
Cro
ps (₹
/qtl)
S. N
o.Ye
ar a
nd
Qua
rter
Soyb
ean
Soyb
ean
Oil
Soyb
ean
Mea
lG
roun
dnut
Gro
undn
ut O
ilSu
nflow
er S
eed
Sunfl
ower
Oil
DI
DI
DI
DI
DI
DI
DI
120
16 Q
135
9022
4861
5345
3033
4820
4140
5628
8596
1682
7335
1130
7267
5957
542
2016
Q2
3895
2715
6382
4794
3639
2650
4722
2870
1191
287
8433
6128
6367
5357
443
2016
Q3
3456
2750
6446
4881
3168
2503
4794
2810
1347
490
8932
2727
0866
2354
784
2016
Q4
2887
2607
6924
5438
2455
2250
4027
2784
1014
194
5431
3328
2366
7956
285
2017
Q1
2866
2598
6847
5110
2325
2335
4207
2937
9770
9444
2981
2772
6414
5380
620
17 Q
229
0522
9362
5146
7124
1420
0240
4227
9199
7110
261
2740
2576
5878
5073
720
17 Q
328
8824
1065
2848
9225
1720
1036
3929
9287
6810
021
2723
2563
6160
5166
820
17 Q
428
8824
1069
0450
0422
4621
2037
2133
7489
5093
0627
9425
4165
1651
139
2018
Q1
3498
2465
7448
4864
2969
2504
3640
3314
8830
9446
2727
2618
6819
5079
1020
18 Q
235
1627
2576
2547
6330
4628
4735
1133
8083
2298
9927
1528
2471
0452
3011
2018
Q3
3286
2678
7514
4551
2844
2496
3824
3430
8900
1051
532
1127
3576
0652
1112
2018
Q4
3182
2697
7436
5334
2713
2477
3958
3386
9602
1026
135
4026
9573
9549
6413
2019
Q1
3494
2660
7599
5274
3081
2328
4179
3351
9545
9508
4352
2752
7303
4910
1420
19 Q
235
3325
0473
9350
8231
7022
6048
2631
8510
164
1008
243
4427
3172
3150
1915
2019
Q3
3509
2584
7478
5347
3125
2232
5287
3152
1040
910
307
4598
2551
7899
5399
1620
19 Q
436
0327
1480
8755
9533
6922
8247
5930
9910
273
9672
4582
2786
8003
5469
1720
20 Q
137
4927
3987
7858
4233
3826
2449
5832
9812
000
1008
235
0030
7488
6256
8818
2020
Q2
3605
2757
8767
5363
3338
2651
5564
3472
1386
712
210
3200
3265
8903
5712
1920
20 Q
335
5029
4788
0064
2932
9128
2248
9940
0512
689
1397
031
8332
2490
4464
4620
2020
Q4
3911
3583
9033
7159
3521
3564
4817
3094
1411
113
868
3567
4414
1074
465
64N
ote
: * In
tern
ation
al P
rices
of R
ice
conv
erte
d in
to p
addy
at t
he ra
tio o
f 0.6
7.
** In
tern
ation
al P
rices
of C
otton
(lin
t) c
onve
rted
into
Kap
as a
t the
ratio
of 0
.41.
D:
Dom
estic
, I :
Inte
rnati
onal
Sour
ce:
1. A
gmar
knet
for d
omes
tic w
hole
sale
pric
es fo
r Pad
dy, M
aize
, Jow
ar, A
rhar
, Ura
d, M
oong
, Cott
on, S
oybe
an, G
roun
dnut
and
Sun
flow
er S
eed.
2.Di
rect
orat
e of
Eco
nom
ics &
Sta
tistic
s, M
inist
ry o
f Agr
icul
ture
and
Far
mer
s Wel
fare
for d
omes
tic p
rices
for S
oybe
an O
il, S
oybe
an M
eal,
Gro
undn
ut O
il Su
nflow
er O
il an
d Su
nflow
er s
eed.
3. W
orld
Ban
k fo
r Int
erna
tiona
l Pric
es o
f Pad
dy*,
Mai
ze, J
owar
, Cott
on**
, Soy
bean
, Soy
bean
Oil,
Soy
bean
Mea
l, G
roun
dnut
, Gro
undn
ut O
il, S
unflo
wer
se
ed a
nd S
unflo
wer
Oil
4. A
griw
atch
for I
nter
natio
nal P
rices
of P
ulse
s vi
z. A
rhar
, Ura
d &
Moo
ng.
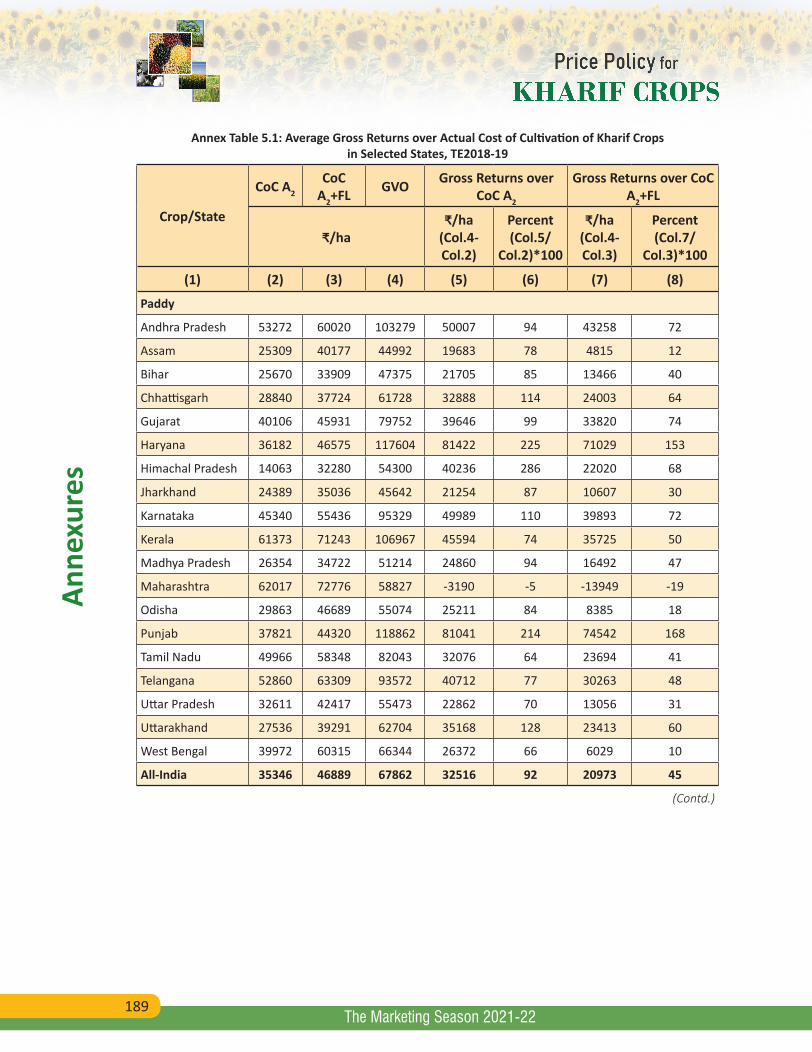
189
Anne
xure
s
The Marketing Season 2021-22
Annex Table 5.1: Average Gross Returns over Actual Cost of Cultivation of Kharif Crops in Selected States, TE2018-19
Crop/State
CoC A2
CoC A2+FL GVO Gross Returns over
CoC A2
Gross Returns over CoC A2+FL
₹/ha₹/ha
(Col.4-Col.2)
Percent (Col.5/
Col.2)*100
₹/ha (Col.4-Col.3)
Percent (Col.7/
Col.3)*100
(1) (2) (3) (4) (5) (6) (7) (8)
Paddy
Andhra Pradesh 53272 60020 103279 50007 94 43258 72
Assam 25309 40177 44992 19683 78 4815 12
Bihar 25670 33909 47375 21705 85 13466 40
Chhattisgarh 28840 37724 61728 32888 114 24003 64
Gujarat 40106 45931 79752 39646 99 33820 74
Haryana 36182 46575 117604 81422 225 71029 153
Himachal Pradesh 14063 32280 54300 40236 286 22020 68
Jharkhand 24389 35036 45642 21254 87 10607 30
Karnataka 45340 55436 95329 49989 110 39893 72
Kerala 61373 71243 106967 45594 74 35725 50
Madhya Pradesh 26354 34722 51214 24860 94 16492 47
Maharashtra 62017 72776 58827 -3190 -5 -13949 -19
Odisha 29863 46689 55074 25211 84 8385 18
Punjab 37821 44320 118862 81041 214 74542 168
Tamil Nadu 49966 58348 82043 32076 64 23694 41
Telangana 52860 63309 93572 40712 77 30263 48
Uttar Pradesh 32611 42417 55473 22862 70 13056 31
Uttarakhand 27536 39291 62704 35168 128 23413 60
West Bengal 39972 60315 66344 26372 66 6029 10
All-India 35346 46889 67862 32516 92 20973 45
(Contd.)
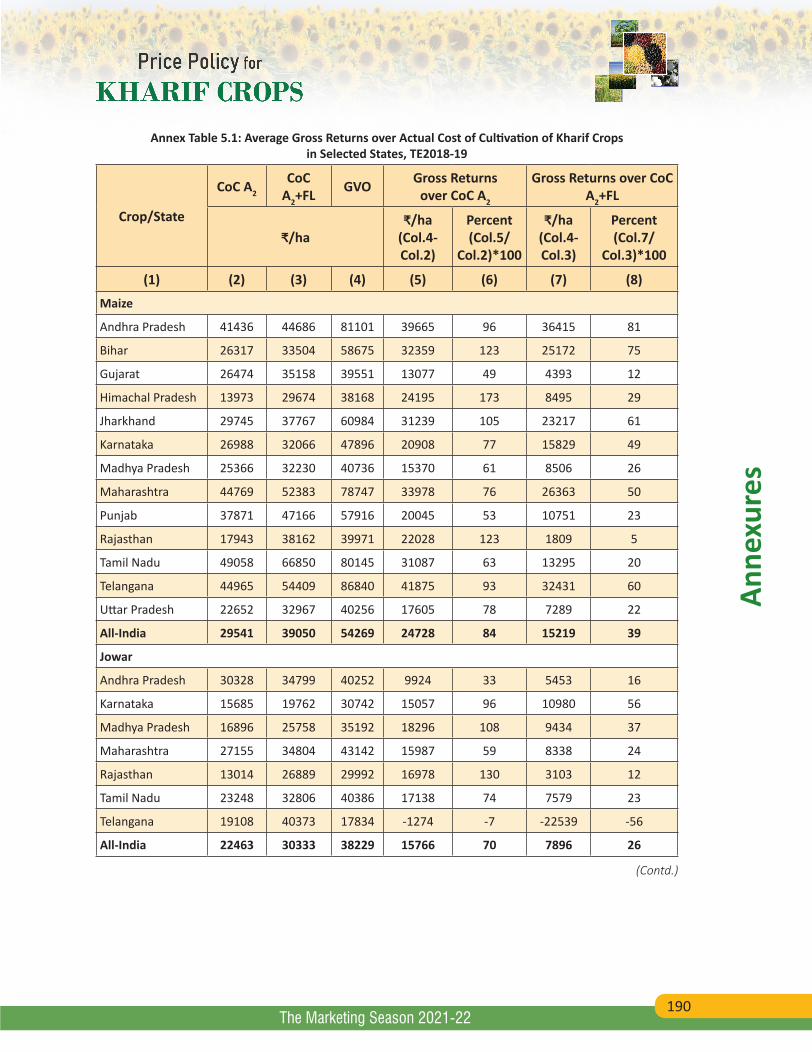
190
Anne
xure
s
The Marketing Season 2021-22
Annex Table 5.1: Average Gross Returns over Actual Cost of Cultivation of Kharif Crops in Selected States, TE2018-19
Crop/State
CoC A2
CoC A2+FL GVO Gross Returns
over CoC A2
Gross Returns over CoC A2+FL
₹/ha₹/ha
(Col.4-Col.2)
Percent (Col.5/
Col.2)*100
₹/ha (Col.4-Col.3)
Percent (Col.7/
Col.3)*100
(1) (2) (3) (4) (5) (6) (7) (8)
Maize
Andhra Pradesh 41436 44686 81101 39665 96 36415 81
Bihar 26317 33504 58675 32359 123 25172 75
Gujarat 26474 35158 39551 13077 49 4393 12
Himachal Pradesh 13973 29674 38168 24195 173 8495 29
Jharkhand 29745 37767 60984 31239 105 23217 61
Karnataka 26988 32066 47896 20908 77 15829 49
Madhya Pradesh 25366 32230 40736 15370 61 8506 26
Maharashtra 44769 52383 78747 33978 76 26363 50
Punjab 37871 47166 57916 20045 53 10751 23
Rajasthan 17943 38162 39971 22028 123 1809 5
Tamil Nadu 49058 66850 80145 31087 63 13295 20
Telangana 44965 54409 86840 41875 93 32431 60
Uttar Pradesh 22652 32967 40256 17605 78 7289 22
All-India 29541 39050 54269 24728 84 15219 39
Jowar
Andhra Pradesh 30328 34799 40252 9924 33 5453 16
Karnataka 15685 19762 30742 15057 96 10980 56
Madhya Pradesh 16896 25758 35192 18296 108 9434 37
Maharashtra 27155 34804 43142 15987 59 8338 24
Rajasthan 13014 26889 29992 16978 130 3103 12
Tamil Nadu 23248 32806 40386 17138 74 7579 23
Telangana 19108 40373 17834 -1274 -7 -22539 -56
All-India 22463 30333 38229 15766 70 7896 26
(Contd.)
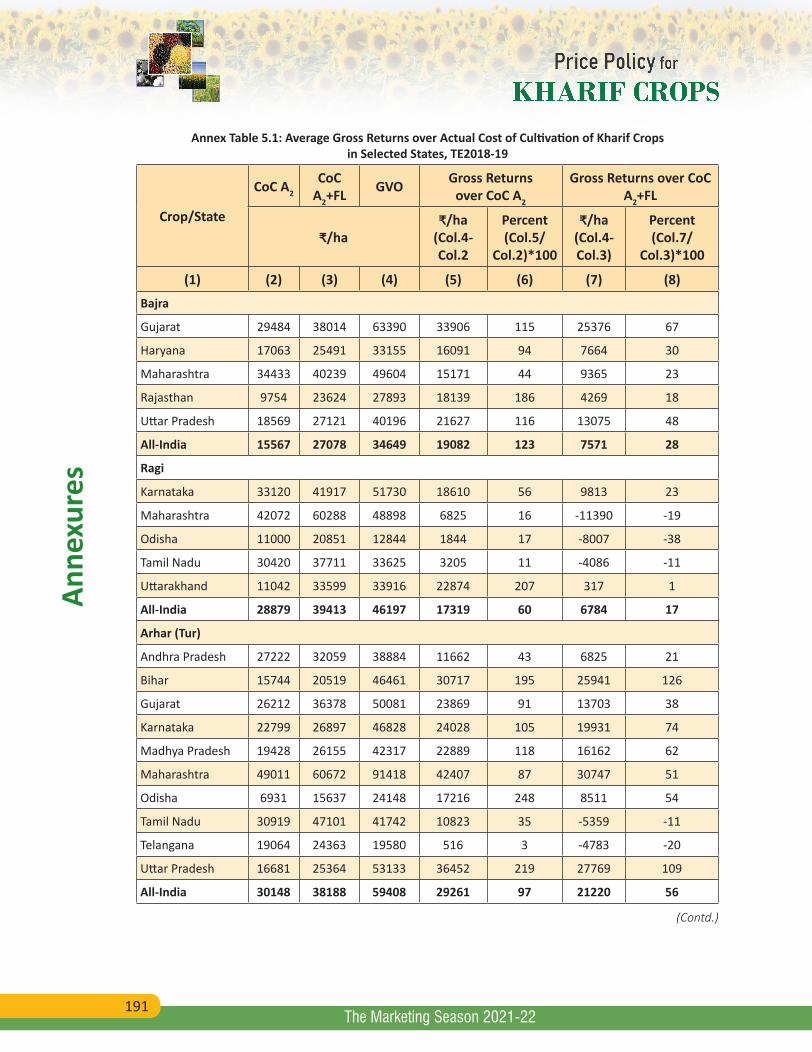
191
Anne
xure
s
The Marketing Season 2021-22
Annex Table 5.1: Average Gross Returns over Actual Cost of Cultivation of Kharif Crops in Selected States, TE2018-19
Crop/State
CoC A2
CoC A2+FL GVO Gross Returns
over CoC A2
Gross Returns over CoC A2+FL
₹/ha₹/ha
(Col.4-Col.2
Percent (Col.5/
Col.2)*100
₹/ha (Col.4-Col.3)
Percent (Col.7/
Col.3)*100
(1) (2) (3) (4) (5) (6) (7) (8)
Bajra
Gujarat 29484 38014 63390 33906 115 25376 67
Haryana 17063 25491 33155 16091 94 7664 30
Maharashtra 34433 40239 49604 15171 44 9365 23
Rajasthan 9754 23624 27893 18139 186 4269 18
Uttar Pradesh 18569 27121 40196 21627 116 13075 48
All-India 15567 27078 34649 19082 123 7571 28
Ragi
Karnataka 33120 41917 51730 18610 56 9813 23
Maharashtra 42072 60288 48898 6825 16 -11390 -19
Odisha 11000 20851 12844 1844 17 -8007 -38
Tamil Nadu 30420 37711 33625 3205 11 -4086 -11
Uttarakhand 11042 33599 33916 22874 207 317 1
All-India 28879 39413 46197 17319 60 6784 17
Arhar (Tur)
Andhra Pradesh 27222 32059 38884 11662 43 6825 21
Bihar 15744 20519 46461 30717 195 25941 126
Gujarat 26212 36378 50081 23869 91 13703 38
Karnataka 22799 26897 46828 24028 105 19931 74
Madhya Pradesh 19428 26155 42317 22889 118 16162 62
Maharashtra 49011 60672 91418 42407 87 30747 51
Odisha 6931 15637 24148 17216 248 8511 54
Tamil Nadu 30919 47101 41742 10823 35 -5359 -11
Telangana 19064 24363 19580 516 3 -4783 -20
Uttar Pradesh 16681 25364 53133 36452 219 27769 109
All-India 30148 38188 59408 29261 97 21220 56
(Contd.)
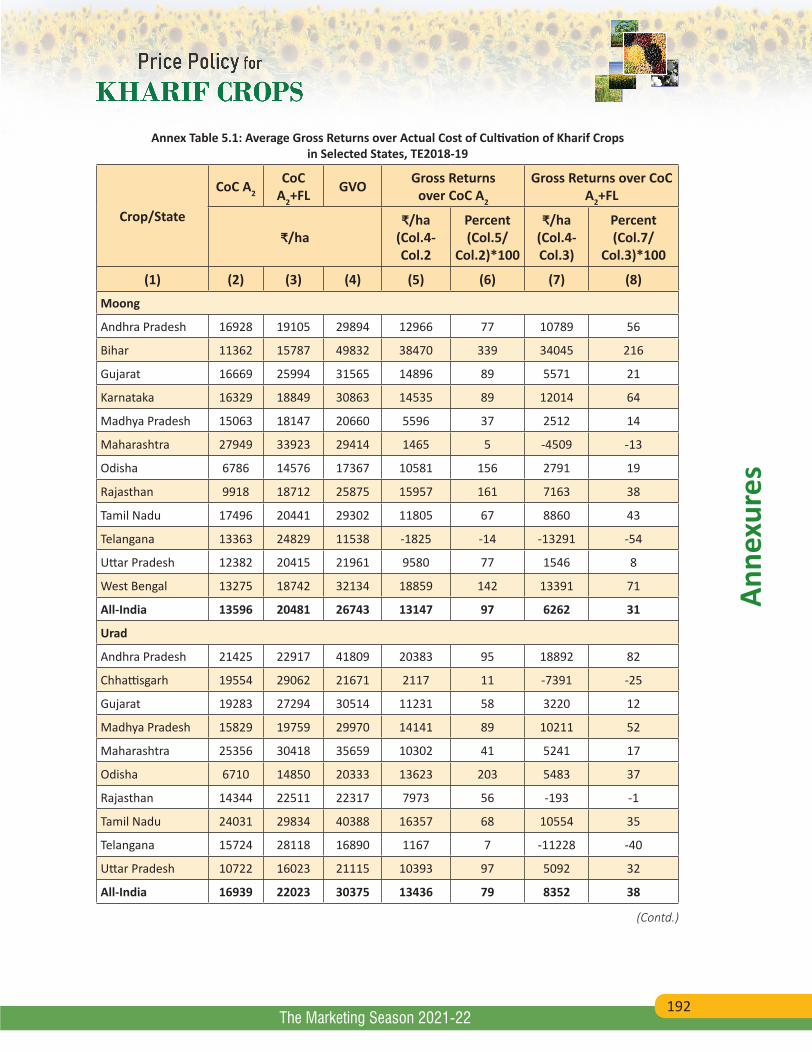
192
Anne
xure
s
The Marketing Season 2021-22
Annex Table 5.1: Average Gross Returns over Actual Cost of Cultivation of Kharif Crops in Selected States, TE2018-19
Crop/State
CoC A2
CoC A2+FL GVO Gross Returns
over CoC A2
Gross Returns over CoC A2+FL
₹/ha₹/ha
(Col.4-Col.2
Percent (Col.5/
Col.2)*100
₹/ha (Col.4-Col.3)
Percent (Col.7/
Col.3)*100
(1) (2) (3) (4) (5) (6) (7) (8)
Moong
Andhra Pradesh 16928 19105 29894 12966 77 10789 56
Bihar 11362 15787 49832 38470 339 34045 216
Gujarat 16669 25994 31565 14896 89 5571 21
Karnataka 16329 18849 30863 14535 89 12014 64
Madhya Pradesh 15063 18147 20660 5596 37 2512 14
Maharashtra 27949 33923 29414 1465 5 -4509 -13
Odisha 6786 14576 17367 10581 156 2791 19
Rajasthan 9918 18712 25875 15957 161 7163 38
Tamil Nadu 17496 20441 29302 11805 67 8860 43
Telangana 13363 24829 11538 -1825 -14 -13291 -54
Uttar Pradesh 12382 20415 21961 9580 77 1546 8
West Bengal 13275 18742 32134 18859 142 13391 71
All-India 13596 20481 26743 13147 97 6262 31
Urad
Andhra Pradesh 21425 22917 41809 20383 95 18892 82
Chhattisgarh 19554 29062 21671 2117 11 -7391 -25
Gujarat 19283 27294 30514 11231 58 3220 12
Madhya Pradesh 15829 19759 29970 14141 89 10211 52
Maharashtra 25356 30418 35659 10302 41 5241 17
Odisha 6710 14850 20333 13623 203 5483 37
Rajasthan 14344 22511 22317 7973 56 -193 -1
Tamil Nadu 24031 29834 40388 16357 68 10554 35
Telangana 15724 28118 16890 1167 7 -11228 -40
Uttar Pradesh 10722 16023 21115 10393 97 5092 32
All-India 16939 22023 30375 13436 79 8352 38
(Contd.)
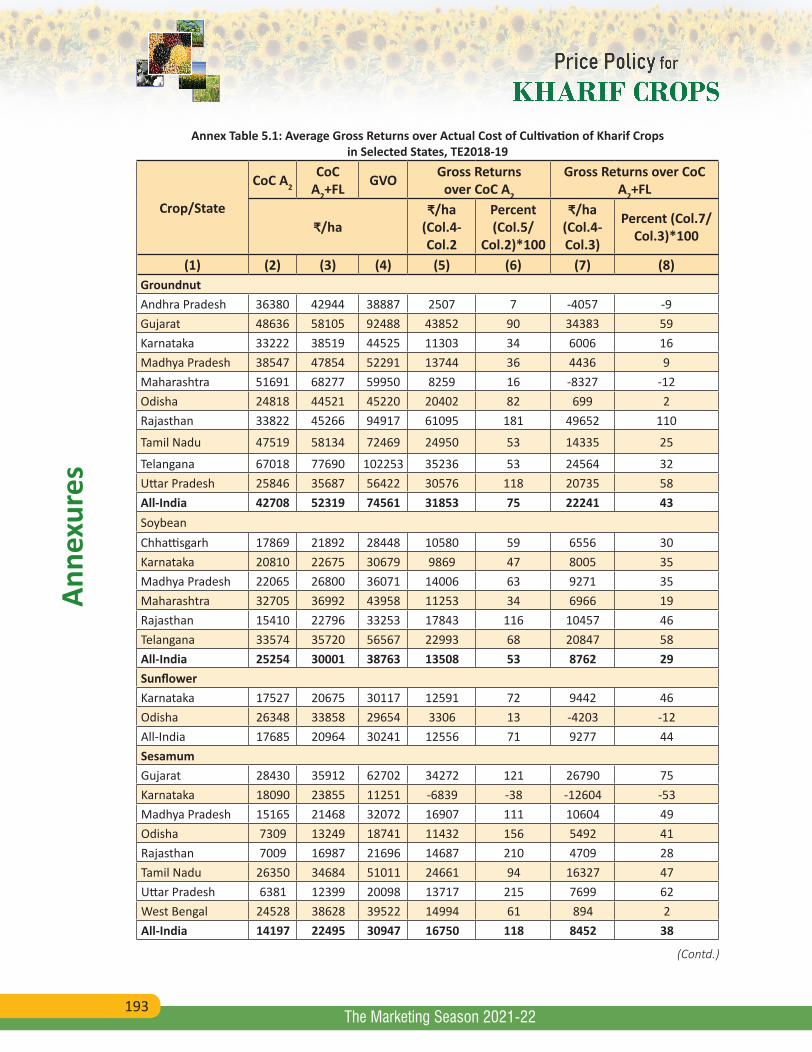
193
Anne
xure
s
The Marketing Season 2021-22
Annex Table 5.1: Average Gross Returns over Actual Cost of Cultivation of Kharif Crops in Selected States, TE2018-19
Crop/State
CoC A2
CoC A2+FL GVO Gross Returns
over CoC A2
Gross Returns over CoC A2+FL
₹/ha₹/ha
(Col.4-Col.2
Percent (Col.5/
Col.2)*100
₹/ha (Col.4-Col.3)
Percent (Col.7/Col.3)*100
(1) (2) (3) (4) (5) (6) (7) (8)GroundnutAndhra Pradesh 36380 42944 38887 2507 7 -4057 -9 Gujarat 48636 58105 92488 43852 90 34383 59 Karnataka 33222 38519 44525 11303 34 6006 16 Madhya Pradesh 38547 47854 52291 13744 36 4436 9 Maharashtra 51691 68277 59950 8259 16 -8327 -12 Odisha 24818 44521 45220 20402 82 699 2 Rajasthan 33822 45266 94917 61095 181 49652 110
Tamil Nadu 47519 58134 72469 24950 53 14335 25
Telangana 67018 77690 102253 35236 53 24564 32 Uttar Pradesh 25846 35687 56422 30576 118 20735 58 All-India 42708 52319 74561 31853 75 22241 43 SoybeanChhattisgarh 17869 21892 28448 10580 59 6556 30 Karnataka 20810 22675 30679 9869 47 8005 35 Madhya Pradesh 22065 26800 36071 14006 63 9271 35 Maharashtra 32705 36992 43958 11253 34 6966 19 Rajasthan 15410 22796 33253 17843 116 10457 46 Telangana 33574 35720 56567 22993 68 20847 58 All-India 25254 30001 38763 13508 53 8762 29 SunflowerKarnataka 17527 20675 30117 12591 72 9442 46Odisha 26348 33858 29654 3306 13 -4203 -12All-India 17685 20964 30241 12556 71 9277 44SesamumGujarat 28430 35912 62702 34272 121 26790 75 Karnataka 18090 23855 11251 -6839 -38 -12604 -53 Madhya Pradesh 15165 21468 32072 16907 111 10604 49 Odisha 7309 13249 18741 11432 156 5492 41 Rajasthan 7009 16987 21696 14687 210 4709 28 Tamil Nadu 26350 34684 51011 24661 94 16327 47 Uttar Pradesh 6381 12399 20098 13717 215 7699 62 West Bengal 24528 38628 39522 14994 61 894 2 All-India 14197 22495 30947 16750 118 8452 38
(Contd.)
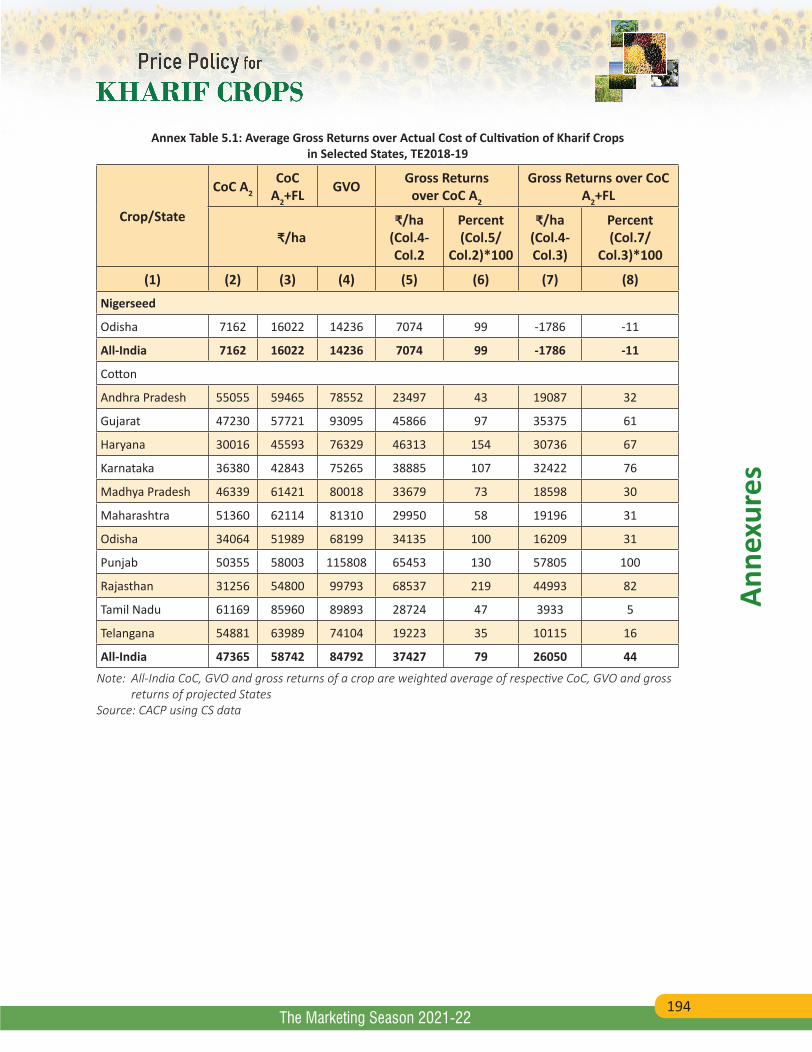
194
Anne
xure
s
The Marketing Season 2021-22
Annex Table 5.1: Average Gross Returns over Actual Cost of Cultivation of Kharif Crops in Selected States, TE2018-19
Crop/State
CoC A2
CoC A2+FL GVO Gross Returns
over CoC A2
Gross Returns over CoC A2+FL
₹/ha₹/ha
(Col.4-Col.2
Percent (Col.5/
Col.2)*100
₹/ha (Col.4-Col.3)
Percent (Col.7/
Col.3)*100
(1) (2) (3) (4) (5) (6) (7) (8)
Nigerseed
Odisha 7162 16022 14236 7074 99 -1786 -11
All-India 7162 16022 14236 7074 99 -1786 -11
Cotton
Andhra Pradesh 55055 59465 78552 23497 43 19087 32
Gujarat 47230 57721 93095 45866 97 35375 61
Haryana 30016 45593 76329 46313 154 30736 67
Karnataka 36380 42843 75265 38885 107 32422 76
Madhya Pradesh 46339 61421 80018 33679 73 18598 30
Maharashtra 51360 62114 81310 29950 58 19196 31
Odisha 34064 51989 68199 34135 100 16209 31
Punjab 50355 58003 115808 65453 130 57805 100
Rajasthan 31256 54800 99793 68537 219 44993 82
Tamil Nadu 61169 85960 89893 28724 47 3933 5
Telangana 54881 63989 74104 19223 35 10115 16
All-India 47365 58742 84792 37427 79 26050 44
Note: All-India CoC, GVO and gross returns of a crop are weighted average of respective CoC, GVO and gross returns of projected StatesSource: CACP using CS data
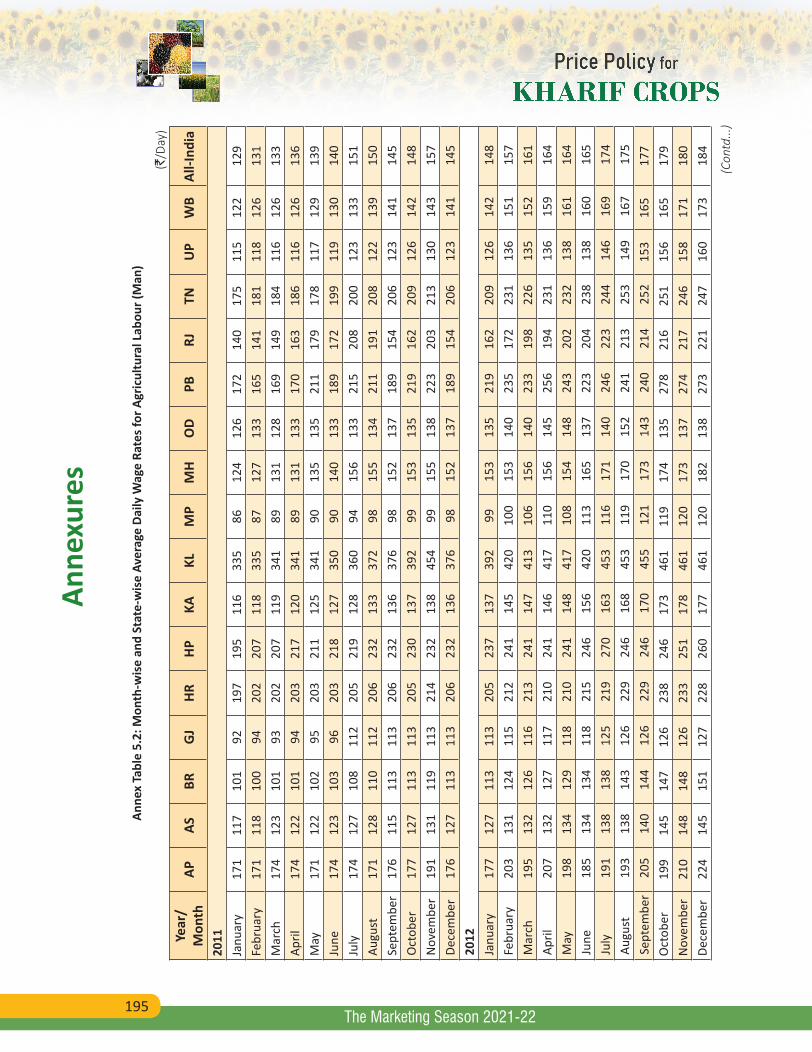
195
Anne
xure
s
The Marketing Season 2021-22
Anne
x Ta
ble
5.2:
Mon
th-w
ise
and
Stat
e-w
ise
Aver
age
Daily
Wag
e Ra
tes f
or A
gric
ultu
ral L
abou
r (M
an)
(`/D
ay)
Year
/M
onth
APAS
BRG
JHR
HPKA
KLM
PM
HO
DPB
RJTN
UP
WB
All-I
ndia
2011
Janu
ary
171
117
101
9219
719
511
633
586
124
126
172
140
175
115
122
129
Febr
uary
171
118
100
9420
220
711
833
587
127
133
165
141
181
118
126
131
Mar
ch
174
123
101
9320
220
711
934
189
131
128
169
149
184
116
126
133
April
174
122
101
9420
321
712
034
189
131
133
170
163
186
116
126
136
May
171
122
102
9520
321
112
534
190
135
135
211
179
178
117
129
139
June
174
123
103
9620
321
812
735
090
140
133
189
172
199
119
130
140
July
174
127
108
112
205
219
128
360
9415
613
321
520
820
012
313
315
1Au
gust
171
128
110
112
206
232
133
372
9815
513
421
119
120
812
213
915
0Se
ptem
ber
176
115
113
113
206
232
136
376
9815
213
718
915
420
612
314
114
5O
ctob
er17
712
711
311
320
523
013
739
299
153
135
219
162
209
126
142
148
Nov
embe
r19
113
111
911
321
423
213
845
499
155
138
223
203
213
130
143
157
Dece
mbe
r17
612
711
311
320
623
213
637
698
152
137
189
154
206
123
141
145
2012
Janu
ary
177
127
113
113
205
237
137
392
9915
313
521
916
220
912
614
214
8Fe
brua
ry20
313
112
411
521
224
114
542
010
015
314
023
517
223
113
615
115
7M
arch
19
513
212
611
621
324
114
741
310
615
614
023
319
822
613
515
216
1Ap
ril20
713
212
711
721
024
114
641
711
015
614
525
619
423
113
615
916
4M
ay19
813
412
911
821
024
114
841
710
815
414
824
320
223
213
816
116
4Ju
ne18
513
413
411
821
524
615
642
011
316
513
722
320
423
813
816
016
5Ju
ly19
113
813
812
521
927
016
345
311
617
114
024
622
324
414
616
917
4Au
gust
193
138
143
126
229
246
168
453
119
170
152
241
213
253
149
167
175
Sept
embe
r20
514
014
412
622
924
617
045
512
117
314
324
021
425
215
316
517
7O
ctob
er19
914
514
712
623
824
617
346
111
917
413
527
821
625
115
616
517
9N
ovem
ber
210
148
148
126
233
251
178
461
120
173
137
274
217
246
158
171
180
Dece
mbe
r22
414
515
112
722
826
017
746
112
018
213
827
322
124
716
017
318
4
(Con
td...
)
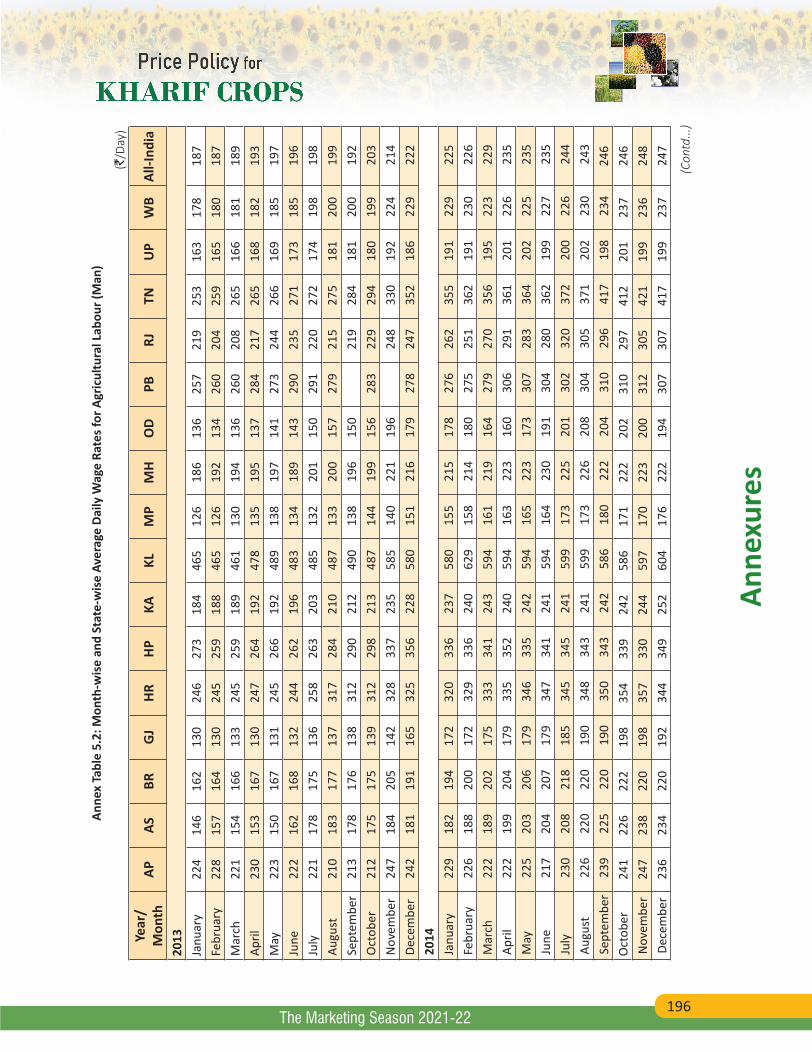
196
Anne
xure
s
The Marketing Season 2021-22
Anne
x Ta
ble
5.2:
Mon
th-w
ise
and
Stat
e-w
ise
Aver
age
Daily
Wag
e Ra
tes f
or A
gric
ultu
ral L
abou
r (M
an)
(`/D
ay)
Year
/M
onth
APAS
BRG
JHR
HPKA
KLM
PM
HO
DPB
RJTN
UP
WB
All-I
ndia
2013
Janu
ary
224
146
162
130
246
273
184
465
126
186
136
257
219
253
163
178
187
Febr
uary
228
157
164
130
245
259
188
465
126
192
134
260
204
259
165
180
187
Mar
ch
221
154
166
133
245
259
189
461
130
194
136
260
208
265
166
181
189
April
230
153
167
130
247
264
192
478
135
195
137
284
217
265
168
182
193
May
223
150
167
131
245
266
192
489
138
197
141
273
244
266
169
185
197
June
222
162
168
132
244
262
196
483
134
189
143
290
235
271
173
185
196
July
221
178
175
136
258
263
203
485
132
201
150
291
220
272
174
198
198
Augu
st21
018
317
713
731
728
421
048
713
320
015
727
921
527
518
120
019
9Se
ptem
ber
213
178
176
138
312
290
212
490
138
196
150
219
284
181
200
192
Oct
ober
212
175
175
139
312
298
213
487
144
199
156
283
229
294
180
199
203
Nov
embe
r24
718
420
514
232
833
723
558
514
022
119
624
833
019
222
421
4De
cem
ber
242
181
191
165
325
356
228
580
151
216
179
278
247
352
186
229
222
2014
Janu
ary
229
182
194
172
320
336
237
580
155
215
178
276
262
355
191
229
225
Febr
uary
226
188
200
172
329
336
240
629
158
214
180
275
251
362
191
230
226
Mar
ch
222
189
202
175
333
341
243
594
161
219
164
279
270
356
195
223
229
April
222
199
204
179
335
352
240
594
163
223
160
306
291
361
201
226
235
May
225
203
206
179
346
335
242
594
165
223
173
307
283
364
202
225
235
June
217
204
207
179
347
341
241
594
164
230
191
304
280
362
199
227
235
July
230
208
218
185
345
345
241
599
173
225
201
302
320
372
200
226
244
Augu
st22
622
022
019
034
834
324
159
917
322
620
830
430
537
120
223
024
3Se
ptem
ber
239
225
220
190
350
343
242
586
180
222
204
310
296
417
198
234
246
Oct
ober
241
226
222
198
354
339
242
586
171
222
202
310
297
412
201
237
246
Nov
embe
r24
723
822
019
835
733
024
459
717
022
320
031
230
542
119
923
624
8De
cem
ber
236
234
220
192
344
349
252
604
176
222
194
307
307
417
199
237
247
(Con
td...
)

197
Anne
xure
s
The Marketing Season 2021-22
Anne
x Ta
ble
5.2:
Mon
th-w
ise
and
Stat
e-w
ise
Aver
age
Daily
Wag
e Ra
tes f
or A
gric
ultu
ral L
abou
r (M
an)
(`/D
ay)
Year
/M
onth
APAS
BRG
JHR
HPKA
KLM
PM
HO
DPB
RJTN
UP
WB
All-I
ndia
2015
Janu
ary
246
235
219
194
338
363
254
643
178
225
201
286
298
430
200
241
249
Febr
uary
250
234
221
194
335
363
252
643
179
225
202
290
287
440
202
241
249
Mar
ch
245
226
228
194
341
363
253
642
179
226
202
281
284
429
205
242
248
April
245
225
230
195
340
363
253
652
182
231
201
277
291
403
209
242
249
May
235
231
231
196
345
362
260
652
183
232
200
292
279
405
208
242
249
June
239
239
237
196
346
351
260
664
188
228
203
311
282
399
207
240
250
July
229
236
242
203
350
361
269
664
186
234
206
311
295
393
211
240
253
Augu
st24
123
824
620
335
536
627
765
318
823
320
230
430
040
421
423
925
7Se
ptem
ber
241
239
246
203
354
372
278
656
190
228
196
303
304
394
214
241
256
Oct
ober
240
236
244
203
354
367
279
656
189
233
200
298
298
392
215
237
256
Nov
embe
r27
624
324
320
335
137
428
565
718
222
820
430
130
338
221
623
725
9De
cem
ber
278
241
245
203
361
379
286
657
180
229
200
301
302
383
219
248
260
2016
Janu
ary
276
235
248
206
354
371
285
664
183
231
199
288
276
381
218
251
256
Febr
uary
254
233
248
206
359
371
281
666
182
229
195
300
270
383
217
252
253
Mar
ch25
023
424
621
335
937
128
067
018
623
120
629
227
740
621
725
425
6Ap
ril27
224
024
621
436
239
527
867
018
823
219
831
026
040
622
325
425
7M
ay25
624
124
821
436
836
928
366
518
624
719
931
226
640
022
325
625
8Ju
ne25
425
524
921
436
837
028
866
519
024
921
032
126
539
622
225
926
0Ju
ly25
725
525
121
936
837
329
566
518
923
820
731
328
940
822
525
926
4Au
gust
262
253
252
219
368
379
293
665
188
246
213
296
283
411
225
258
264
Sept
embe
r26
325
424
721
936
837
929
366
519
224
820
928
828
441
222
125
426
3O
ctob
er26
325
424
721
936
839
129
066
519
924
920
330
628
440
922
125
726
5N
ovem
ber
271
254
247
219
368
387
297
665
199
255
207
307
281
406
227
260
267
Dece
mbe
r28
425
924
721
936
838
729
866
520
125
521
730
527
940
622
526
326
9
(Con
td...
)
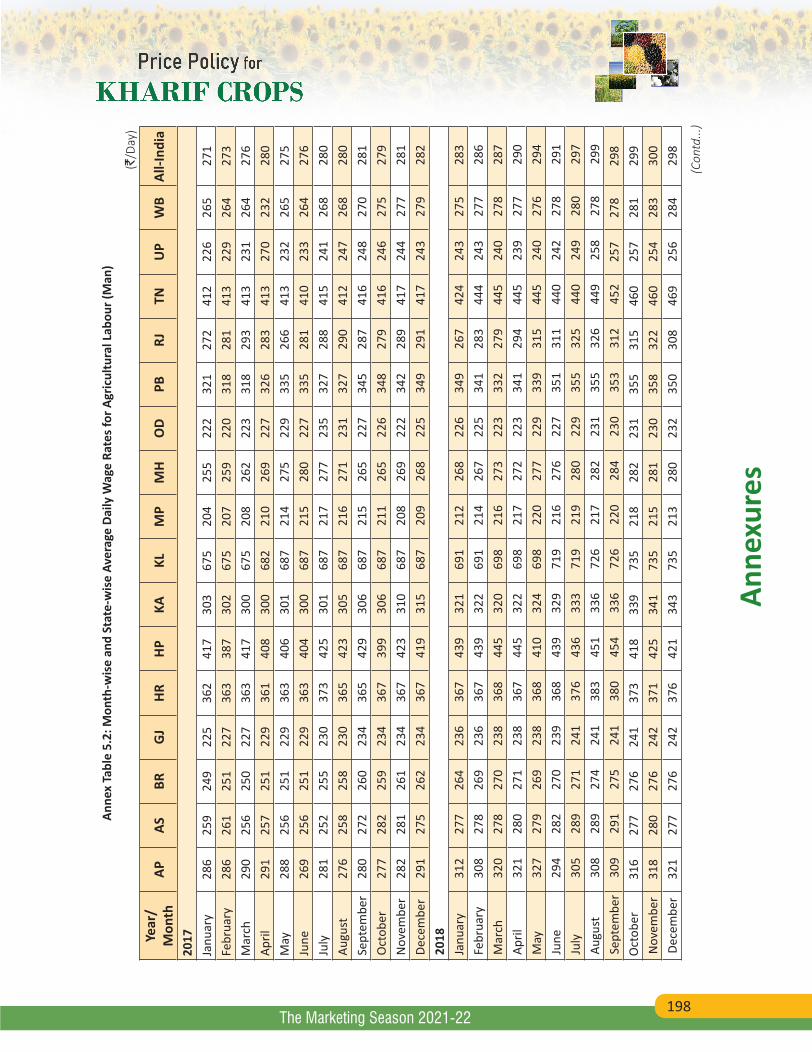
198
Anne
xure
s
The Marketing Season 2021-22
Anne
x Ta
ble
5.2:
Mon
th-w
ise
and
Stat
e-w
ise
Aver
age
Daily
Wag
e Ra
tes f
or A
gric
ultu
ral L
abou
r (M
an)
(`/D
ay)
Year
/M
onth
APAS
BRG
JHR
HPKA
KLM
PM
HO
DPB
RJTN
UP
WB
All-I
ndia
2017
Janu
ary
286
259
249
225
362
417
303
675
204
255
222
321
272
412
226
265
271
Febr
uary
286
261
251
227
363
387
302
675
207
259
220
318
281
413
229
264
273
Mar
ch29
025
625
022
736
341
730
067
520
826
222
331
829
341
323
126
427
6Ap
ril29
125
725
122
936
140
830
068
221
026
922
732
628
341
327
023
228
0M
ay28
825
625
122
936
340
630
168
721
427
522
933
526
641
323
226
527
5Ju
ne26
925
625
122
936
340
430
068
721
528
022
733
528
141
023
326
427
6Ju
ly28
125
225
523
037
342
530
168
721
727
723
532
728
841
524
126
828
0Au
gust
276
258
258
230
365
423
305
687
216
271
231
327
290
412
247
268
280
Sept
embe
r28
027
226
023
436
542
930
668
721
526
522
734
528
741
624
827
028
1O
ctob
er27
728
225
923
436
739
930
668
721
126
522
634
827
941
624
627
527
9N
ovem
ber
282
281
261
234
367
423
310
687
208
269
222
342
289
417
244
277
281
Dece
mbe
r29
127
526
223
436
741
931
568
720
926
822
534
929
141
724
327
928
220
18Ja
nuar
y31
227
726
423
636
743
932
169
121
226
822
634
926
742
424
327
528
3Fe
brua
ry30
827
826
923
636
743
932
269
121
426
722
534
128
344
424
327
728
6M
arch
320
278
270
238
368
445
320
698
216
273
223
332
279
445
240
278
287
April
321
280
271
238
367
445
322
698
217
272
223
341
294
445
239
277
290
May
327
279
269
238
368
410
324
698
220
277
229
339
315
445
240
276
294
June
294
282
270
239
368
439
329
719
216
276
227
351
311
440
242
278
291
July
305
289
271
241
376
436
333
719
219
280
229
355
325
440
249
280
297
Augu
st30
828
927
424
138
345
133
672
621
728
223
135
532
644
925
827
829
9Se
ptem
ber
309
291
275
241
380
454
336
726
220
284
230
353
312
452
257
278
298
Oct
ober
316
277
276
241
373
418
339
735
218
282
231
355
315
460
257
281
299
Nov
embe
r31
828
027
624
237
142
534
173
521
528
123
035
832
246
025
428
330
0De
cem
ber
321
277
276
242
376
421
343
735
213
280
232
350
308
469
256
284
298
(Con
td...
)
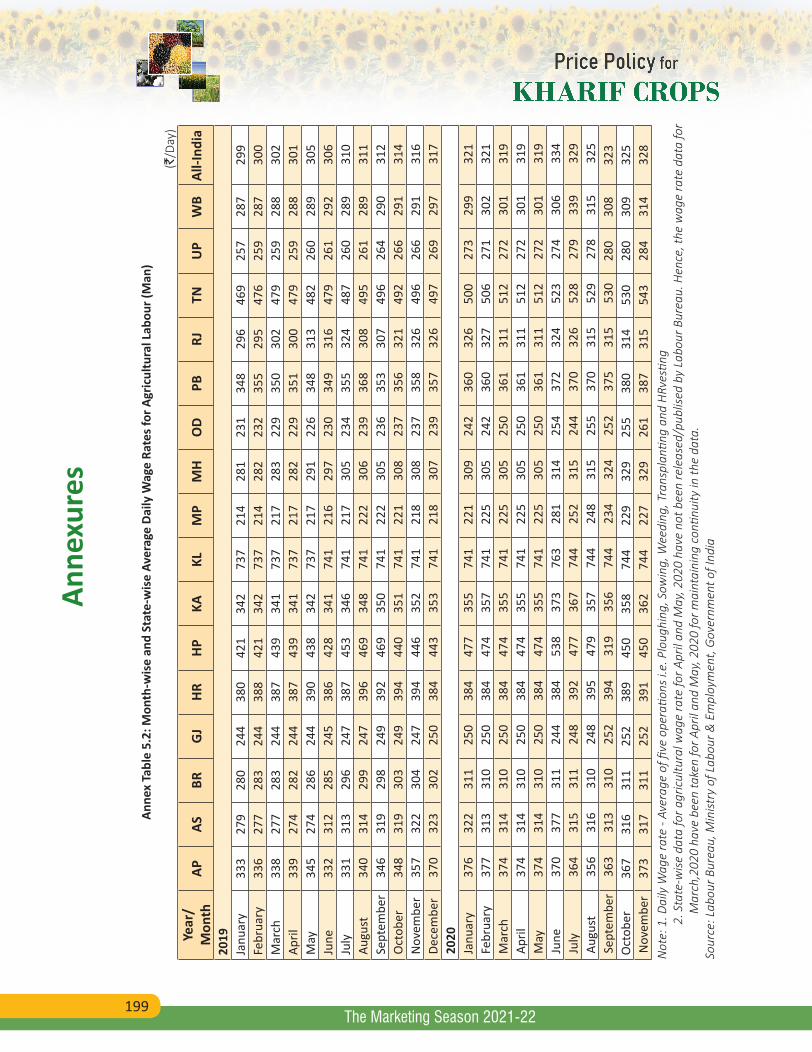
199
Anne
xure
s
The Marketing Season 2021-22
Anne
x Ta
ble
5.2:
Mon
th-w
ise
and
Stat
e-w
ise
Aver
age
Daily
Wag
e Ra
tes f
or A
gric
ultu
ral L
abou
r (M
an)
(`/D
ay)
Year
/M
onth
APAS
BRG
JHR
HPKA
KLM
PM
HO
DPB
RJTN
UP
WB
All-I
ndia
2019
Janu
ary
333
279
280
244
380
421
342
737
214
281
231
348
296
469
257
287
299
Febr
uary
336
277
283
244
388
421
342
737
214
282
232
355
295
476
259
287
300
Mar
ch33
827
728
324
438
743
934
173
721
728
322
935
030
247
925
928
830
2Ap
ril33
927
428
224
438
743
934
173
721
728
222
935
130
047
925
928
830
1M
ay34
527
428
624
439
043
834
273
721
729
122
634
831
348
226
028
930
5Ju
ne33
231
228
524
538
642
834
174
121
629
723
034
931
647
926
129
230
6Ju
ly33
131
329
624
738
745
334
674
121
730
523
435
532
448
726
028
931
0Au
gust
340
314
299
247
396
469
348
741
222
306
239
368
308
495
261
289
311
Sept
embe
r34
631
929
824
939
246
935
074
122
230
523
635
330
749
626
429
031
2O
ctob
er34
831
930
324
939
444
035
174
122
130
823
735
632
149
226
629
131
4N
ovem
ber
357
322
304
247
394
446
352
741
218
308
237
358
326
496
266
291
316
Dece
mbe
r37
032
330
225
038
444
335
374
121
830
723
935
732
649
726
929
731
720
20Ja
nuar
y37
632
231
125
038
447
735
574
122
130
924
236
032
650
027
329
932
1Fe
brua
ry37
731
331
025
038
447
435
774
122
530
524
236
032
750
627
130
232
1M
arch
374
314
310
250
384
474
355
741
225
305
250
361
311
512
272
301
319
April
374
314
310
250
384
474
355
741
225
305
250
361
311
512
272
301
319
May
374
314
310
250
384
474
355
741
225
305
250
361
311
512
272
301
319
June
370
377
311
244
384
538
373
763
281
314
254
372
324
523
274
306
334
July
364
315
311
248
392
477
367
744
252
315
244
370
326
528
279
339
329
Augu
st35
631
631
024
839
547
935
774
424
831
525
537
031
552
927
831
532
5Se
ptem
ber
363
313
310
252
394
319
356
744
234
324
252
375
315
530
280
308
323
Oct
ober
367
316
311
252
389
450
358
744
229
329
255
380
314
530
280
309
325
Nov
embe
r37
331
731
125
239
145
036
274
422
732
926
138
731
554
328
431
432
8N
ote:
1. D
aily
Wag
e ra
te -
Aver
age
of fi
ve o
pera
tions
i.e.
Plo
ughi
ng, S
owin
g, W
eedi
ng, T
rans
plan
ting
and
HRv
estin
g
2. S
tate
-wise
dat
a fo
r agr
icul
tura
l wag
e ra
te fo
r Apr
il an
d M
ay, 2
020
have
not
bee
n re
leas
ed/p
ublis
ed b
y La
bour
Bur
eau.
Hen
ce, t
he w
age
rate
dat
a fo
r M
arch
,202
0 ha
ve b
een
take
n fo
r Apr
il an
d M
ay, 2
020
for m
aint
aini
ng c
ontin
uity
in th
e da
ta.
Sour
ce: L
abou
r Bur
eau,
Min
istry
of L
abou
r & E
mpl
oym
ent,
Gov
ernm
ent o
f Ind
ia
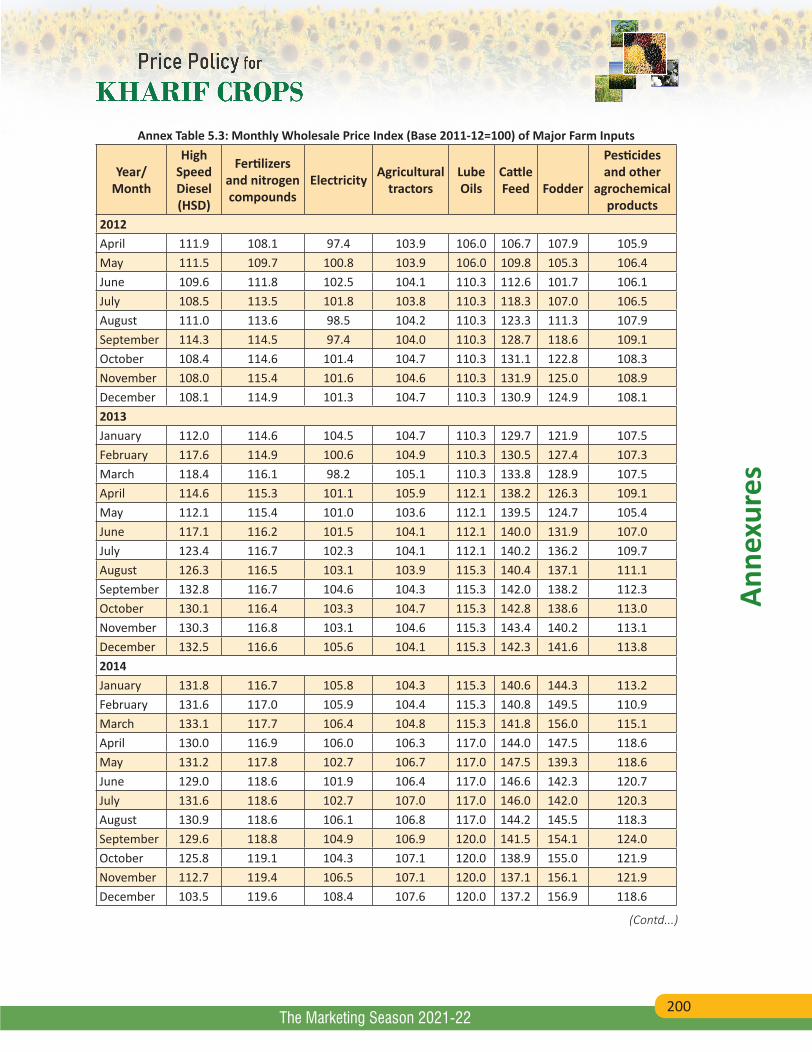
200
Anne
xure
s
The Marketing Season 2021-22
Annex Table 5.3: Monthly Wholesale Price Index (Base 2011-12=100) of Major Farm Inputs
Year/Month
High Speed Diesel (HSD)
Fertilizers and nitrogen compounds
Electricity Agricultural tractors
Lube Oils
Cattle Feed
Fodder
Pesticides and other
agrochemical products
2012April 111.9 108.1 97.4 103.9 106.0 106.7 107.9 105.9May 111.5 109.7 100.8 103.9 106.0 109.8 105.3 106.4June 109.6 111.8 102.5 104.1 110.3 112.6 101.7 106.1July 108.5 113.5 101.8 103.8 110.3 118.3 107.0 106.5August 111.0 113.6 98.5 104.2 110.3 123.3 111.3 107.9September 114.3 114.5 97.4 104.0 110.3 128.7 118.6 109.1October 108.4 114.6 101.4 104.7 110.3 131.1 122.8 108.3November 108.0 115.4 101.6 104.6 110.3 131.9 125.0 108.9December 108.1 114.9 101.3 104.7 110.3 130.9 124.9 108.12013January 112.0 114.6 104.5 104.7 110.3 129.7 121.9 107.5February 117.6 114.9 100.6 104.9 110.3 130.5 127.4 107.3March 118.4 116.1 98.2 105.1 110.3 133.8 128.9 107.5April 114.6 115.3 101.1 105.9 112.1 138.2 126.3 109.1May 112.1 115.4 101.0 103.6 112.1 139.5 124.7 105.4June 117.1 116.2 101.5 104.1 112.1 140.0 131.9 107.0July 123.4 116.7 102.3 104.1 112.1 140.2 136.2 109.7August 126.3 116.5 103.1 103.9 115.3 140.4 137.1 111.1September 132.8 116.7 104.6 104.3 115.3 142.0 138.2 112.3October 130.1 116.4 103.3 104.7 115.3 142.8 138.6 113.0November 130.3 116.8 103.1 104.6 115.3 143.4 140.2 113.1December 132.5 116.6 105.6 104.1 115.3 142.3 141.6 113.82014January 131.8 116.7 105.8 104.3 115.3 140.6 144.3 113.2February 131.6 117.0 105.9 104.4 115.3 140.8 149.5 110.9March 133.1 117.7 106.4 104.8 115.3 141.8 156.0 115.1April 130.0 116.9 106.0 106.3 117.0 144.0 147.5 118.6May 131.2 117.8 102.7 106.7 117.0 147.5 139.3 118.6June 129.0 118.6 101.9 106.4 117.0 146.6 142.3 120.7July 131.6 118.6 102.7 107.0 117.0 146.0 142.0 120.3August 130.9 118.6 106.1 106.8 117.0 144.2 145.5 118.3September 129.6 118.8 104.9 106.9 120.0 141.5 154.1 124.0October 125.8 119.1 104.3 107.1 120.0 138.9 155.0 121.9November 112.7 119.4 106.5 107.1 120.0 137.1 156.1 121.9December 103.5 119.6 108.4 107.6 120.0 137.2 156.9 118.6
(Contd...)
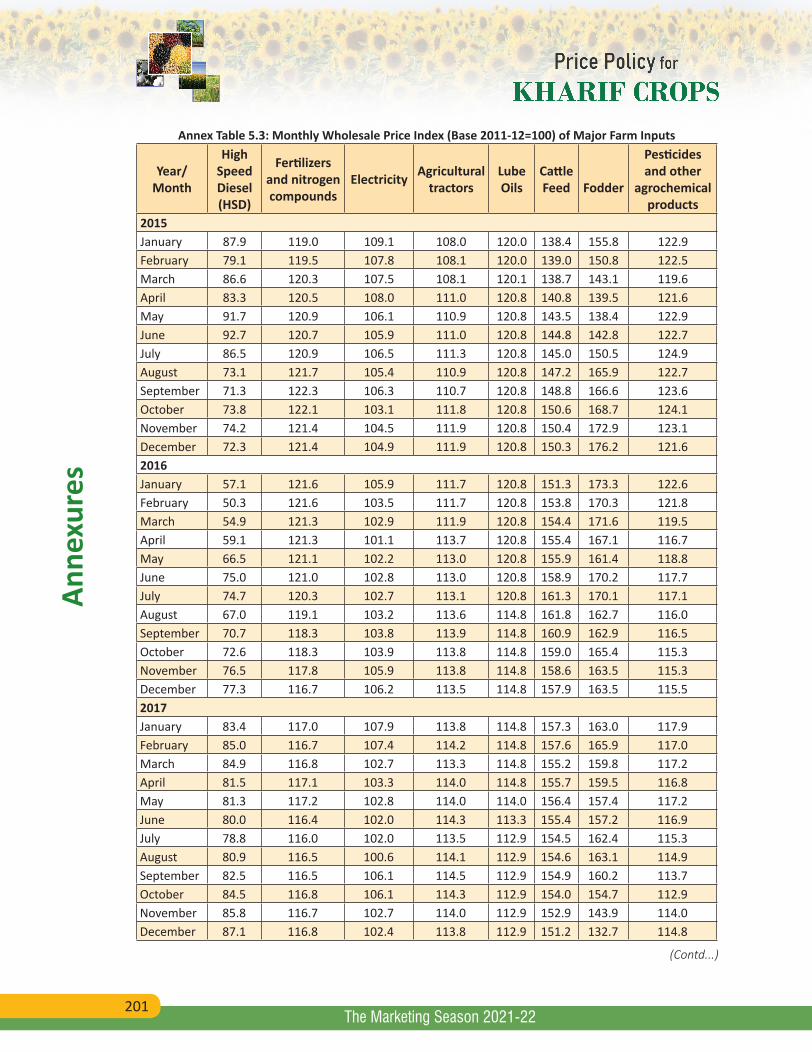
201
Anne
xure
s
The Marketing Season 2021-22
Annex Table 5.3: Monthly Wholesale Price Index (Base 2011-12=100) of Major Farm Inputs
Year/Month
High Speed Diesel (HSD)
Fertilizers and nitrogen compounds
Electricity Agricultural tractors
Lube Oils
Cattle Feed
Fodder
Pesticides and other
agrochemical products
2015January 87.9 119.0 109.1 108.0 120.0 138.4 155.8 122.9February 79.1 119.5 107.8 108.1 120.0 139.0 150.8 122.5March 86.6 120.3 107.5 108.1 120.1 138.7 143.1 119.6April 83.3 120.5 108.0 111.0 120.8 140.8 139.5 121.6May 91.7 120.9 106.1 110.9 120.8 143.5 138.4 122.9June 92.7 120.7 105.9 111.0 120.8 144.8 142.8 122.7July 86.5 120.9 106.5 111.3 120.8 145.0 150.5 124.9August 73.1 121.7 105.4 110.9 120.8 147.2 165.9 122.7September 71.3 122.3 106.3 110.7 120.8 148.8 166.6 123.6October 73.8 122.1 103.1 111.8 120.8 150.6 168.7 124.1November 74.2 121.4 104.5 111.9 120.8 150.4 172.9 123.1December 72.3 121.4 104.9 111.9 120.8 150.3 176.2 121.62016January 57.1 121.6 105.9 111.7 120.8 151.3 173.3 122.6February 50.3 121.6 103.5 111.7 120.8 153.8 170.3 121.8March 54.9 121.3 102.9 111.9 120.8 154.4 171.6 119.5April 59.1 121.3 101.1 113.7 120.8 155.4 167.1 116.7May 66.5 121.1 102.2 113.0 120.8 155.9 161.4 118.8June 75.0 121.0 102.8 113.0 120.8 158.9 170.2 117.7July 74.7 120.3 102.7 113.1 120.8 161.3 170.1 117.1August 67.0 119.1 103.2 113.6 114.8 161.8 162.7 116.0September 70.7 118.3 103.8 113.9 114.8 160.9 162.9 116.5October 72.6 118.3 103.9 113.8 114.8 159.0 165.4 115.3November 76.5 117.8 105.9 113.8 114.8 158.6 163.5 115.3December 77.3 116.7 106.2 113.5 114.8 157.9 163.5 115.52017January 83.4 117.0 107.9 113.8 114.8 157.3 163.0 117.9February 85.0 116.7 107.4 114.2 114.8 157.6 165.9 117.0March 84.9 116.8 102.7 113.3 114.8 155.2 159.8 117.2April 81.5 117.1 103.3 114.0 114.8 155.7 159.5 116.8May 81.3 117.2 102.8 114.0 114.0 156.4 157.4 117.2June 80.0 116.4 102.0 114.3 113.3 155.4 157.2 116.9July 78.8 116.0 102.0 113.5 112.9 154.5 162.4 115.3August 80.9 116.5 100.6 114.1 112.9 154.6 163.1 114.9September 82.5 116.5 106.1 114.5 112.9 154.9 160.2 113.7October 84.5 116.8 106.1 114.3 112.9 154.0 154.7 112.9November 85.8 116.7 102.7 114.0 112.9 152.9 143.9 114.0December 87.1 116.8 102.4 113.8 112.9 151.2 132.7 114.8
(Contd...)
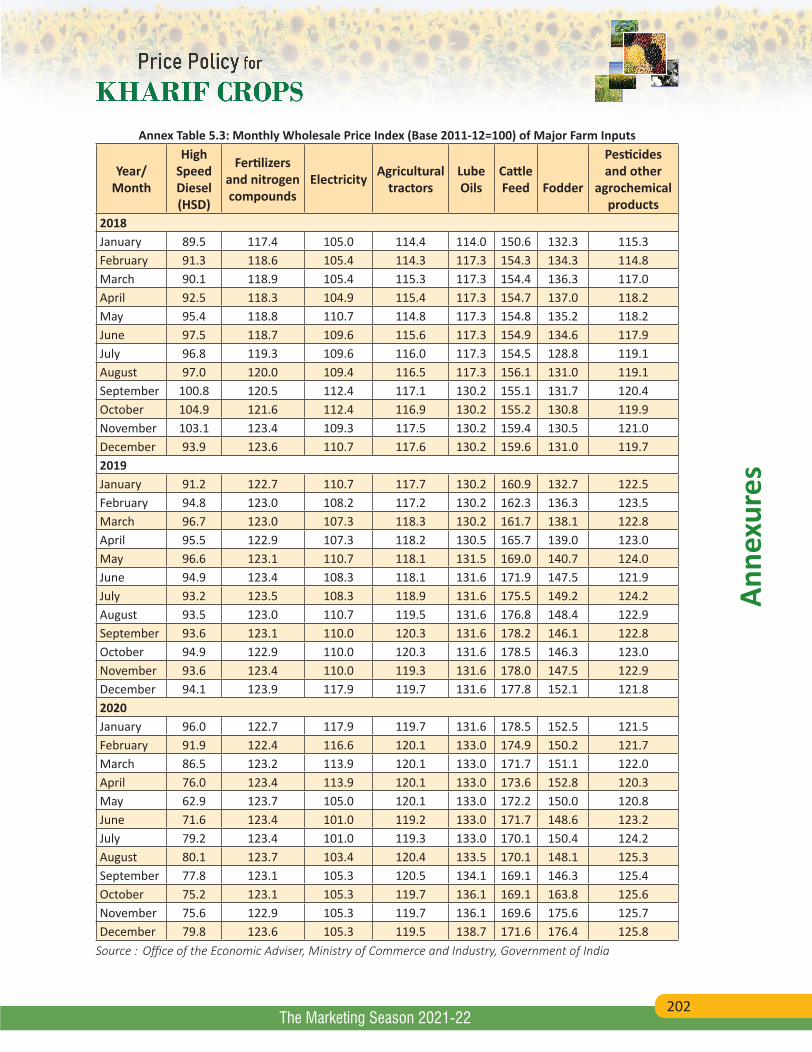
202
Anne
xure
s
The Marketing Season 2021-22
Annex Table 5.3: Monthly Wholesale Price Index (Base 2011-12=100) of Major Farm Inputs
Year/Month
High Speed Diesel (HSD)
Fertilizers and nitrogen compounds
Electricity Agricultural tractors
Lube Oils
Cattle Feed
Fodder
Pesticides and other
agrochemical products
2018January 89.5 117.4 105.0 114.4 114.0 150.6 132.3 115.3February 91.3 118.6 105.4 114.3 117.3 154.3 134.3 114.8March 90.1 118.9 105.4 115.3 117.3 154.4 136.3 117.0April 92.5 118.3 104.9 115.4 117.3 154.7 137.0 118.2May 95.4 118.8 110.7 114.8 117.3 154.8 135.2 118.2June 97.5 118.7 109.6 115.6 117.3 154.9 134.6 117.9July 96.8 119.3 109.6 116.0 117.3 154.5 128.8 119.1August 97.0 120.0 109.4 116.5 117.3 156.1 131.0 119.1September 100.8 120.5 112.4 117.1 130.2 155.1 131.7 120.4October 104.9 121.6 112.4 116.9 130.2 155.2 130.8 119.9November 103.1 123.4 109.3 117.5 130.2 159.4 130.5 121.0December 93.9 123.6 110.7 117.6 130.2 159.6 131.0 119.72019January 91.2 122.7 110.7 117.7 130.2 160.9 132.7 122.5February 94.8 123.0 108.2 117.2 130.2 162.3 136.3 123.5March 96.7 123.0 107.3 118.3 130.2 161.7 138.1 122.8April 95.5 122.9 107.3 118.2 130.5 165.7 139.0 123.0May 96.6 123.1 110.7 118.1 131.5 169.0 140.7 124.0June 94.9 123.4 108.3 118.1 131.6 171.9 147.5 121.9July 93.2 123.5 108.3 118.9 131.6 175.5 149.2 124.2August 93.5 123.0 110.7 119.5 131.6 176.8 148.4 122.9September 93.6 123.1 110.0 120.3 131.6 178.2 146.1 122.8October 94.9 122.9 110.0 120.3 131.6 178.5 146.3 123.0November 93.6 123.4 110.0 119.3 131.6 178.0 147.5 122.9December 94.1 123.9 117.9 119.7 131.6 177.8 152.1 121.82020January 96.0 122.7 117.9 119.7 131.6 178.5 152.5 121.5February 91.9 122.4 116.6 120.1 133.0 174.9 150.2 121.7March 86.5 123.2 113.9 120.1 133.0 171.7 151.1 122.0April 76.0 123.4 113.9 120.1 133.0 173.6 152.8 120.3May 62.9 123.7 105.0 120.1 133.0 172.2 150.0 120.8June 71.6 123.4 101.0 119.2 133.0 171.7 148.6 123.2July 79.2 123.4 101.0 119.3 133.0 170.1 150.4 124.2August 80.1 123.7 103.4 120.4 133.5 170.1 148.1 125.3September 77.8 123.1 105.3 120.5 134.1 169.1 146.3 125.4October 75.2 123.1 105.3 119.7 136.1 169.1 163.8 125.6November 75.6 122.9 105.3 119.7 136.1 169.6 175.6 125.7December 79.8 123.6 105.3 119.5 138.7 171.6 176.4 125.8
Source : Office of the Economic Adviser, Ministry of Commerce and Industry, Government of India
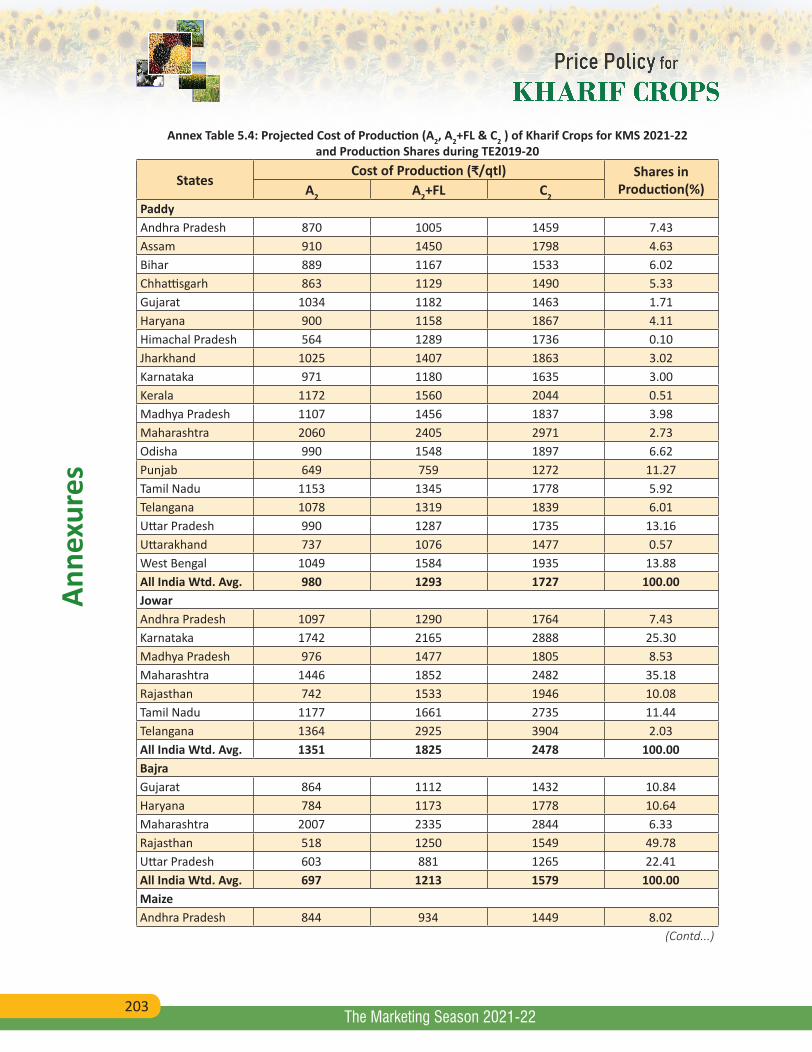
203
Anne
xure
s
The Marketing Season 2021-22
Annex Table 5.4: Projected Cost of Production (A2, A2+FL & C2 ) of Kharif Crops for KMS 2021-22 and Production Shares during TE2019-20
StatesCost of Production (₹/qtl) Shares in
Production(%)A2 A2+FL C2PaddyAndhra Pradesh 870 1005 1459 7.43Assam 910 1450 1798 4.63Bihar 889 1167 1533 6.02Chhattisgarh 863 1129 1490 5.33Gujarat 1034 1182 1463 1.71Haryana 900 1158 1867 4.11Himachal Pradesh 564 1289 1736 0.10Jharkhand 1025 1407 1863 3.02Karnataka 971 1180 1635 3.00Kerala 1172 1560 2044 0.51Madhya Pradesh 1107 1456 1837 3.98Maharashtra 2060 2405 2971 2.73Odisha 990 1548 1897 6.62Punjab 649 759 1272 11.27Tamil Nadu 1153 1345 1778 5.92Telangana 1078 1319 1839 6.01Uttar Pradesh 990 1287 1735 13.16Uttarakhand 737 1076 1477 0.57West Bengal 1049 1584 1935 13.88All India Wtd. Avg. 980 1293 1727 100.00JowarAndhra Pradesh 1097 1290 1764 7.43Karnataka 1742 2165 2888 25.30Madhya Pradesh 976 1477 1805 8.53Maharashtra 1446 1852 2482 35.18Rajasthan 742 1533 1946 10.08Tamil Nadu 1177 1661 2735 11.44Telangana 1364 2925 3904 2.03All India Wtd. Avg. 1351 1825 2478 100.00BajraGujarat 864 1112 1432 10.84Haryana 784 1173 1778 10.64Maharashtra 2007 2335 2844 6.33Rajasthan 518 1250 1549 49.78Uttar Pradesh 603 881 1265 22.41All India Wtd. Avg. 697 1213 1579 100.00MaizeAndhra Pradesh 844 934 1449 8.02
(Contd...)
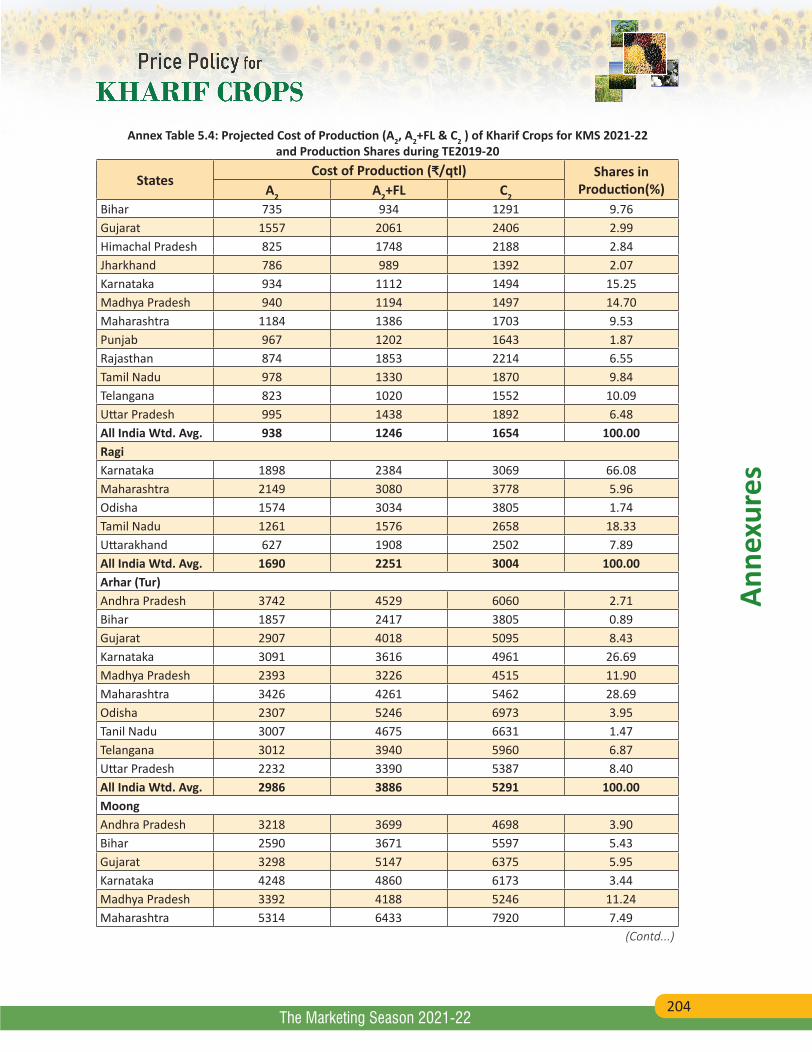
204
Anne
xure
s
The Marketing Season 2021-22
Annex Table 5.4: Projected Cost of Production (A2, A2+FL & C2 ) of Kharif Crops for KMS 2021-22 and Production Shares during TE2019-20
StatesCost of Production (₹/qtl) Shares in
Production(%)A2 A2+FL C2
Bihar 735 934 1291 9.76Gujarat 1557 2061 2406 2.99Himachal Pradesh 825 1748 2188 2.84Jharkhand 786 989 1392 2.07Karnataka 934 1112 1494 15.25Madhya Pradesh 940 1194 1497 14.70Maharashtra 1184 1386 1703 9.53Punjab 967 1202 1643 1.87Rajasthan 874 1853 2214 6.55Tamil Nadu 978 1330 1870 9.84Telangana 823 1020 1552 10.09Uttar Pradesh 995 1438 1892 6.48All India Wtd. Avg. 938 1246 1654 100.00RagiKarnataka 1898 2384 3069 66.08Maharashtra 2149 3080 3778 5.96Odisha 1574 3034 3805 1.74Tamil Nadu 1261 1576 2658 18.33Uttarakhand 627 1908 2502 7.89All India Wtd. Avg. 1690 2251 3004 100.00Arhar (Tur)Andhra Pradesh 3742 4529 6060 2.71Bihar 1857 2417 3805 0.89Gujarat 2907 4018 5095 8.43Karnataka 3091 3616 4961 26.69Madhya Pradesh 2393 3226 4515 11.90Maharashtra 3426 4261 5462 28.69Odisha 2307 5246 6973 3.95Tanil Nadu 3007 4675 6631 1.47Telangana 3012 3940 5960 6.87Uttar Pradesh 2232 3390 5387 8.40All India Wtd. Avg. 2986 3886 5291 100.00MoongAndhra Pradesh 3218 3699 4698 3.90Bihar 2590 3671 5597 5.43Gujarat 3298 5147 6375 5.95Karnataka 4248 4860 6173 3.44Madhya Pradesh 3392 4188 5246 11.24Maharashtra 5314 6433 7920 7.49
(Contd...)
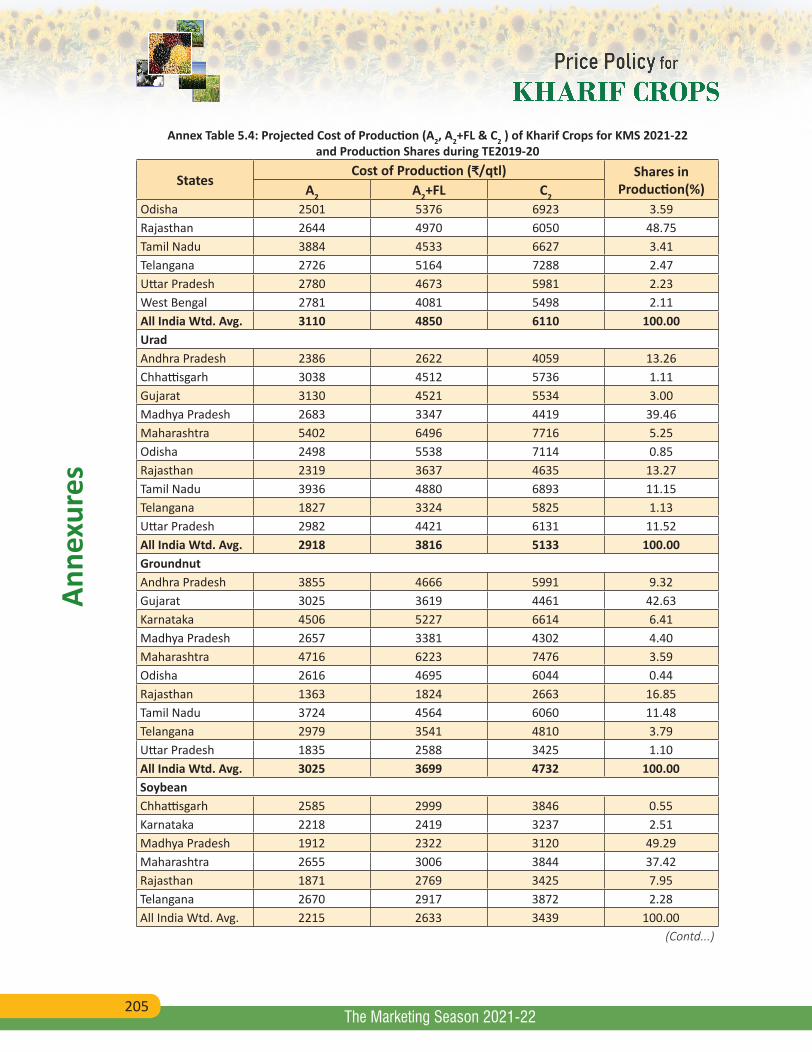
205
Anne
xure
s
The Marketing Season 2021-22
Annex Table 5.4: Projected Cost of Production (A2, A2+FL & C2 ) of Kharif Crops for KMS 2021-22 and Production Shares during TE2019-20
StatesCost of Production (₹/qtl) Shares in
Production(%)A2 A2+FL C2
Odisha 2501 5376 6923 3.59Rajasthan 2644 4970 6050 48.75Tamil Nadu 3884 4533 6627 3.41Telangana 2726 5164 7288 2.47Uttar Pradesh 2780 4673 5981 2.23West Bengal 2781 4081 5498 2.11All India Wtd. Avg. 3110 4850 6110 100.00UradAndhra Pradesh 2386 2622 4059 13.26Chhattisgarh 3038 4512 5736 1.11Gujarat 3130 4521 5534 3.00Madhya Pradesh 2683 3347 4419 39.46Maharashtra 5402 6496 7716 5.25Odisha 2498 5538 7114 0.85Rajasthan 2319 3637 4635 13.27Tamil Nadu 3936 4880 6893 11.15Telangana 1827 3324 5825 1.13Uttar Pradesh 2982 4421 6131 11.52All India Wtd. Avg. 2918 3816 5133 100.00GroundnutAndhra Pradesh 3855 4666 5991 9.32Gujarat 3025 3619 4461 42.63Karnataka 4506 5227 6614 6.41Madhya Pradesh 2657 3381 4302 4.40Maharashtra 4716 6223 7476 3.59Odisha 2616 4695 6044 0.44Rajasthan 1363 1824 2663 16.85Tamil Nadu 3724 4564 6060 11.48Telangana 2979 3541 4810 3.79Uttar Pradesh 1835 2588 3425 1.10All India Wtd. Avg. 3025 3699 4732 100.00SoybeanChhattisgarh 2585 2999 3846 0.55Karnataka 2218 2419 3237 2.51Madhya Pradesh 1912 2322 3120 49.29Maharashtra 2655 3006 3844 37.42Rajasthan 1871 2769 3425 7.95Telangana 2670 2917 3872 2.28All India Wtd. Avg. 2215 2633 3439 100.00
(Contd...)
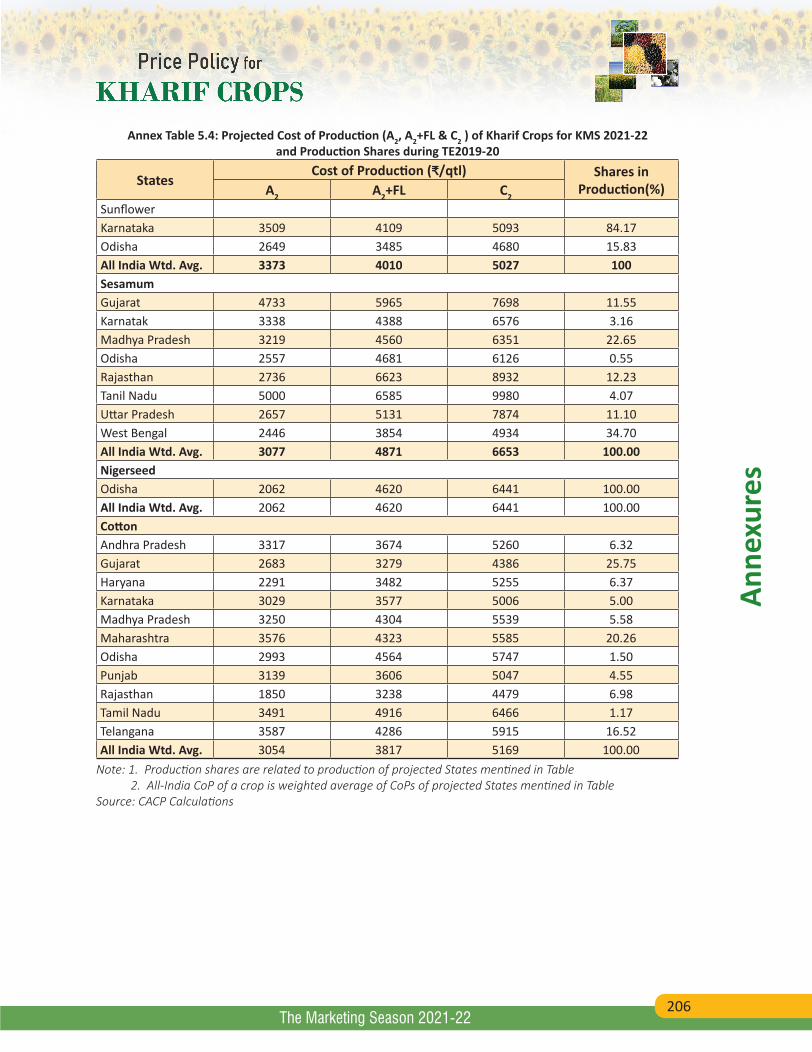
206
Anne
xure
s
The Marketing Season 2021-22
Annex Table 5.4: Projected Cost of Production (A2, A2+FL & C2 ) of Kharif Crops for KMS 2021-22 and Production Shares during TE2019-20
StatesCost of Production (₹/qtl) Shares in
Production(%)A2 A2+FL C2
SunflowerKarnataka 3509 4109 5093 84.17Odisha 2649 3485 4680 15.83All India Wtd. Avg. 3373 4010 5027 100SesamumGujarat 4733 5965 7698 11.55Karnatak 3338 4388 6576 3.16Madhya Pradesh 3219 4560 6351 22.65Odisha 2557 4681 6126 0.55Rajasthan 2736 6623 8932 12.23Tanil Nadu 5000 6585 9980 4.07Uttar Pradesh 2657 5131 7874 11.10West Bengal 2446 3854 4934 34.70All India Wtd. Avg. 3077 4871 6653 100.00NigerseedOdisha 2062 4620 6441 100.00All India Wtd. Avg. 2062 4620 6441 100.00CottonAndhra Pradesh 3317 3674 5260 6.32Gujarat 2683 3279 4386 25.75Haryana 2291 3482 5255 6.37Karnataka 3029 3577 5006 5.00Madhya Pradesh 3250 4304 5539 5.58Maharashtra 3576 4323 5585 20.26Odisha 2993 4564 5747 1.50Punjab 3139 3606 5047 4.55Rajasthan 1850 3238 4479 6.98Tamil Nadu 3491 4916 6466 1.17Telangana 3587 4286 5915 16.52All India Wtd. Avg. 3054 3817 5169 100.00
Note: 1. Production shares are related to production of projected States mentined in Table 2. All-India CoP of a crop is weighted average of CoPs of projected States mentined in TableSource: CACP Calculations
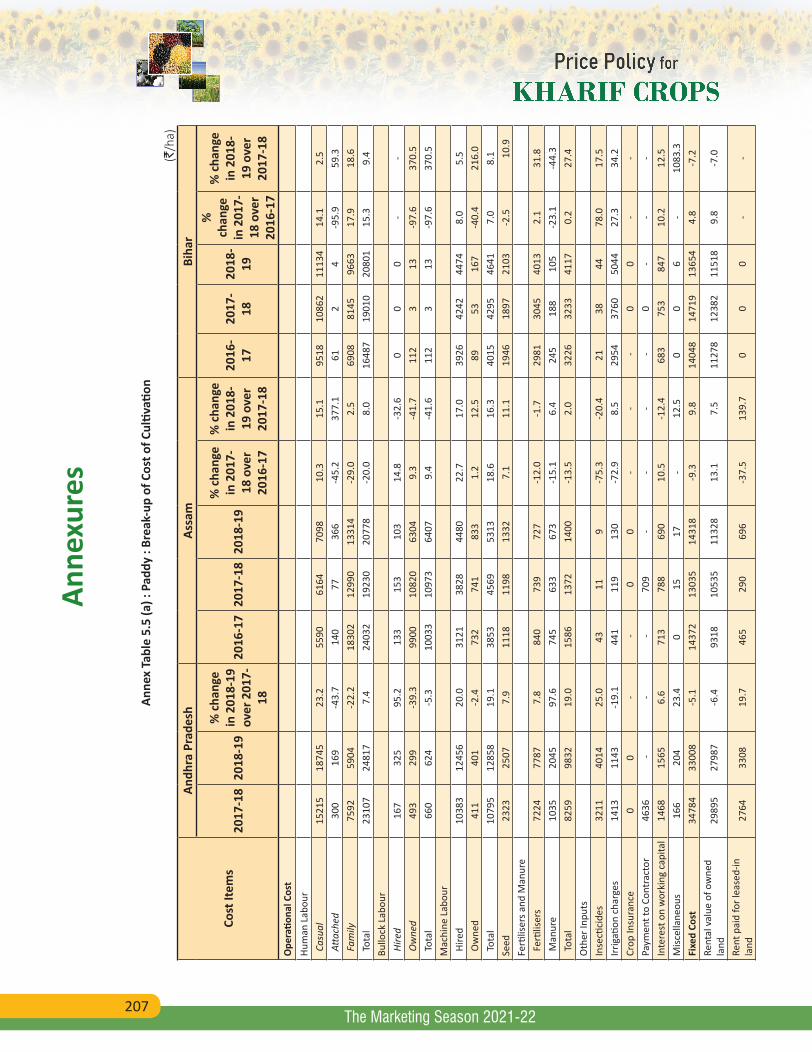
207
Anne
xure
s
The Marketing Season 2021-22
Anne
x Ta
ble
5.5
(a) :
Pad
dy :
Brea
k-up
of C
ost o
f Cul
tivati
on
(`/h
a)
Cost
Item
s
Andh
ra P
rade
shAs
sam
Biha
r
2017
-18
2018
-19
% c
hang
e in
201
8-19
ov
er 2
017-
18
2016
-17
2017
-18
2018
-19
% c
hang
e in
201
7-18
ove
r 20
16-1
7
% c
hang
e in
201
8-19
ove
r 20
17-1
8
2016
-17
2017
-18
2018
-19
%
chan
ge
in 2
017-
18 o
ver
2016
-17
% c
hang
e in
201
8-19
ove
r 20
17-1
8
Ope
ratio
nal C
ost
Hum
an L
abou
r C
asua
l 15
215
1874
523
.255
9061
6470
9810
.315
.195
1810
862
1113
414
.12.
5 A
ttach
ed30
016
9-4
3.7
140
7736
6-4
5.2
377.
161
24
-95.
959
.3 F
amily
7592
5904
-22.
218
302
1299
013
314
-29.
02.
569
0881
4596
6317
.918
.6 T
otal
2310
724
817
7.4
2403
219
230
2077
8-2
0.0
8.0
1648
719
010
2080
115
.39.
4Bu
llock
Lab
our
Hire
d16
732
595
.213
315
310
314
.8-3
2.6
00
0-
- O
wne
d49
329
9-3
9.3
9900
1082
063
049.
3-4
1.7
112
313
-97.
637
0.5
Tot
al66
062
4-5
.310
033
1097
364
079.
4-4
1.6
112
313
-97.
637
0.5
Mac
hine
Lab
our
Hire
d10
383
1245
620
.031
2138
2844
8022
.717
.039
2642
4244
748.
05.
5 O
wne
d41
140
1-2
.473
274
183
31.
212
.589
5316
7-4
0.4
216.
0 T
otal
1079
512
858
19.1
3853
4569
5313
18.6
16.3
4015
4295
4641
7.0
8.1
Seed
2323
2507
7.9
1118
1198
1332
7.1
11.1
1946
1897
2103
-2.5
10.
9Fe
rtilis
ers a
nd M
anur
e F
ertil
isers
7224
7787
7.8
840
739
727
-12.
0-1
.729
8130
4540
132.
131
.8 M
anur
e10
3520
4597
.674
563
367
3-1
5.1
6.4
245
188
105
-23.
1-4
4.3
Tot
al82
5998
3219
.015
8613
7214
00-1
3.5
2.0
3226
3233
4117
0.2
27.4
Oth
er In
puts
Inse
ctici
des
3211
4014
25.0
4311
9-7
5.3
-20.
421
3844
78.0
17.5
Irrig
ation
cha
rges
1413
1143
-19.
144
111
913
0-7
2.9
8.5
2954
3760
5044
27.3
34.2
Crop
Insu
ranc
e0
0-
-0
0-
- -
00
--
Paym
ent t
o Co
ntra
ctor
4636
--
-70
9-
--
-0
--
-In
tere
st o
n w
orki
ng c
apita
l14
6815
656.
671
378
869
010
.5-1
2.4
683
753
847
10.2
12.5
Misc
ella
neou
s16
620
423
.40
1517
-12
.50
06
-10
83.3
Fixe
d Co
st34
784
3300
8-5
.114
372
1303
514
318
-9.3
9.8
1404
814
719
1365
44.
8-7
.2Re
ntal
val
ue o
f ow
ned
land
2989
527
987
-6.4
9318
1053
511
328
13.1
7.5
1127
812
382
1151
89.
8-7
.0
Rent
pai
d fo
r lea
sed-
in
land
2764
3308
19.7
465
290
696
-37.
513
9.7
00
0-
-
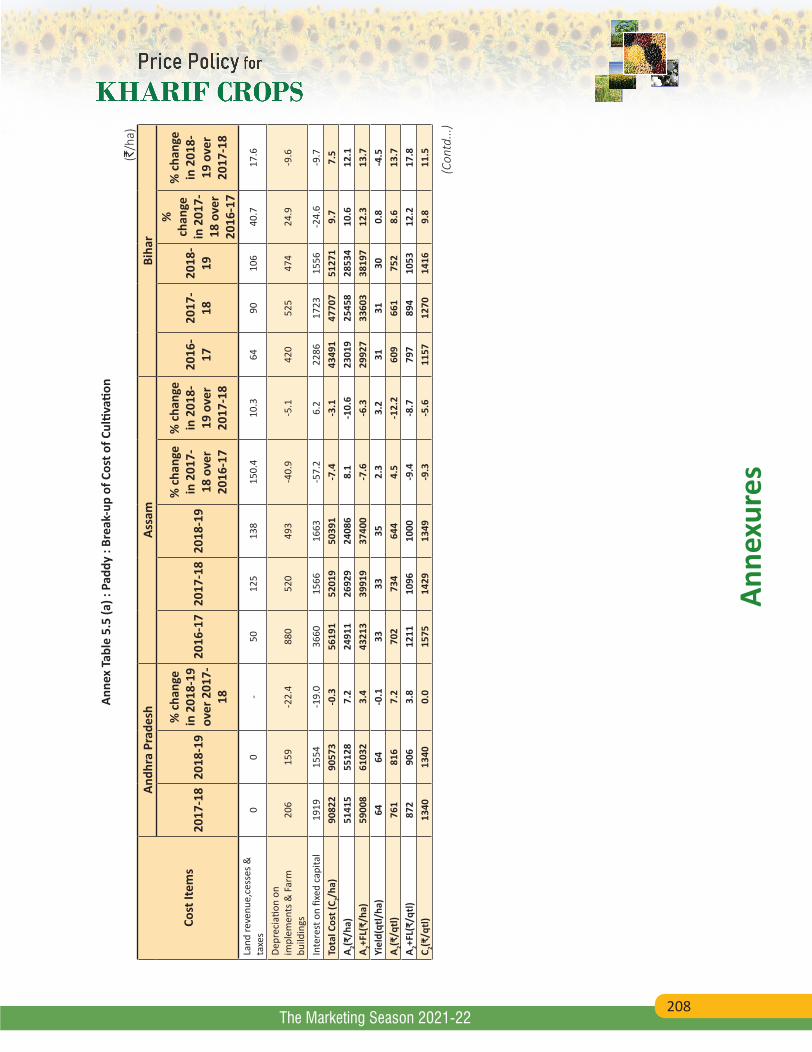
208
Anne
xure
s
The Marketing Season 2021-22
Anne
x Ta
ble
5.5
(a) :
Pad
dy :
Brea
k-up
of C
ost o
f Cul
tivati
on
(`/h
a)
Cost
Item
s
Andh
ra P
rade
shAs
sam
Biha
r
2017
-18
2018
-19
% c
hang
e in
201
8-19
ov
er 2
017-
18
2016
-17
2017
-18
2018
-19
% c
hang
e in
201
7-18
ove
r 20
16-1
7
% c
hang
e in
201
8-19
ove
r 20
17-1
8
2016
-17
2017
-18
2018
-19
%
chan
ge
in 2
017-
18 o
ver
2016
-17
% c
hang
e in
201
8-19
ove
r 20
17-1
8
Land
reve
nue,
cess
es &
ta
xes
00
-50
125
138
150.
410
.364
9010
640
.717
.6
Depr
ecia
tion
on
impl
emen
ts &
Far
m
build
ings
206
159
-22.
488
052
049
3-4
0.9
-5.1
420
525
474
24.9
-9.6
Inte
rest
on
fixed
cap
ital
1919
1554
-19.
036
6015
6616
63-5
7.2
6.2
2286
1723
1556
-24.
6-9
.7To
tal C
ost (
C 2/ha)
9082
290
573
-0.3
5619
152
019
5039
1-7
.4-3
.143
491
4770
751
271
9.7
7.5
A 2(₹/h
a)51
415
5512
87.
224
911
2692
924
086
8.1
-10.
623
019
2545
828
534
10.6
12.1
A 2+FL(
₹/ha
)59
008
6103
23.
443
213
3991
937
400
-7.6
-6.3
2992
733
603
3819
712
.313
.7Yi
eld(
qtl/
ha)
6464
-0.1
3333
352.
33.
231
3130
0.8
-4.5
A 2(₹/q
tl)76
181
67.
270
273
464
44.
5-1
2.2
609
661
752
8.6
13.7
A 2+FL(
₹/qt
l)87
290
63.
812
1110
9610
00-9
.4-8
.779
789
410
5312
.217
.8C 2(₹
/qtl)
1340
1340
0.0
1575
1429
1349
-9.3
-5.6
1157
1270
1416
9.8
11.5
(Con
td...
)
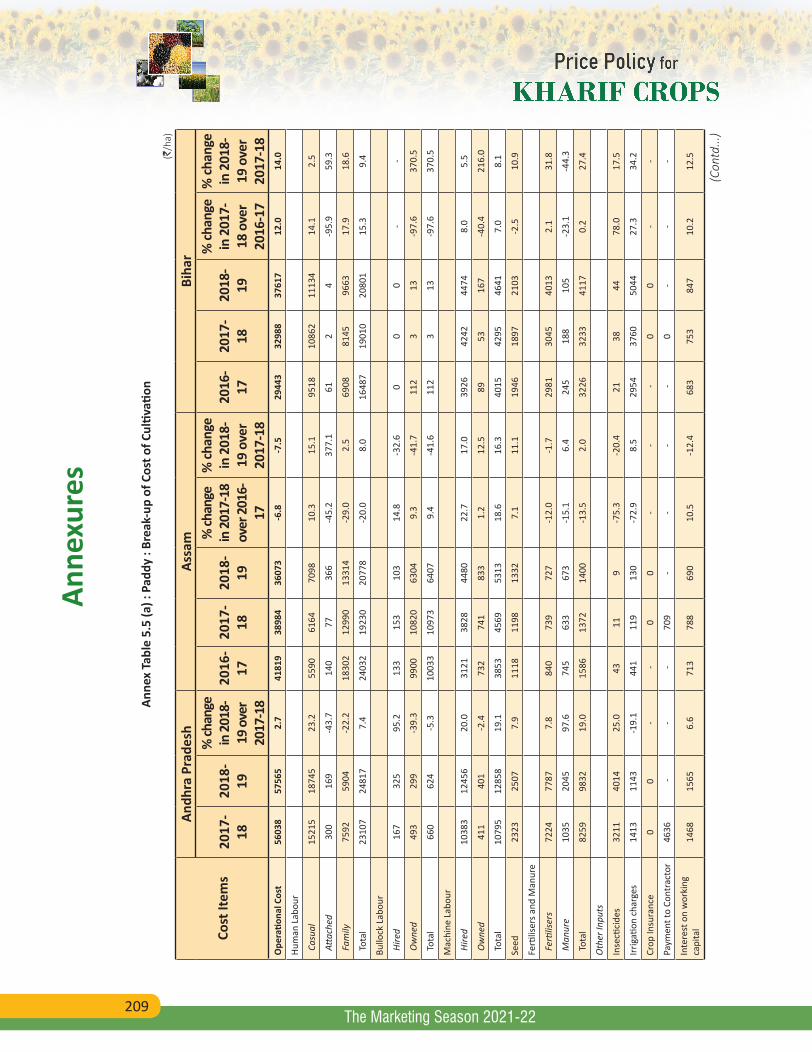
209
Anne
xure
s
The Marketing Season 2021-22
Anne
x Ta
ble
5.5
(a) :
Pad
dy :
Brea
k-up
of C
ost o
f Cul
tivati
on
(`/h
a)
Cost
Item
s
Andh
ra P
rade
shAs
sam
Biha
r
2017
-18
2018
-19
% ch
ange
in
201
8-19
ove
r 20
17-1
8
2016
-17
2017
-18
2018
-19
% ch
ange
in
201
7-18
ov
er 2
016-
17
% ch
ange
in
201
8-19
ove
r 20
17-1
8
2016
-17
2017
-18
2018
-19
% ch
ange
in
201
7-18
ove
r 20
16-1
7
% ch
ange
in
201
8-19
ove
r 20
17-1
8O
pera
tiona
l Cos
t56
038
5756
52.
741
819
3898
436
073
-6.8
-7.5
2944
332
988
3761
712
.014
.0
Hum
an L
abou
r
Cas
ual
1521
518
745
23.2
5590
6164
7098
10.3
15.1
9518
1086
211
134
14.1
2.5
Atta
ched
300
169
-43.
714
077
366
-45.
237
7.1
612
4-9
5.9
59.3
Fam
ily75
9259
04-2
2.2
1830
212
990
1331
4-2
9.0
2.5
6908
8145
9663
17.9
18.6
Tot
al23
107
2481
77.
424
032
1923
020
778
-20.
08.
016
487
1901
020
801
15.3
9.4
Bullo
ck L
abou
r
Hire
d16
732
595
.213
315
310
314
.8-3
2.6
00
0-
-
Ow
ned
493
299
-39.
399
0010
820
6304
9.3
-41.
711
23
13-9
7.6
370.
5
Tot
al66
062
4-5
.310
033
1097
364
079.
4-4
1.6
112
313
-97.
637
0.5
Mac
hine
Lab
our
Hire
d10
383
1245
620
.031
2138
2844
8022
.717
.039
2642
4244
748.
05.
5
Ow
ned
411
401
-2.4
732
741
833
1.2
12.5
8953
167
-40.
421
6.0
Tot
al10
795
1285
819
.138
5345
6953
1318
.616
.340
1542
9546
417.
08.
1
Seed
2323
2507
7.9
1118
1198
1332
7.1
11.1
1946
1897
2103
-2.5
10.9
Ferti
liser
s and
Man
ure
Fer
tilise
rs72
2477
877.
884
073
972
7-1
2.0
-1.7
2981
3045
4013
2.1
31.8
Man
ure
1035
2045
97.6
745
633
673
-15.
16.
424
518
810
5-2
3.1
-44.
3
Tot
al82
5998
3219
.015
8613
7214
00-1
3.5
2.0
3226
3233
4117
0.2
27.4
Oth
er In
puts
Inse
ctici
des
3211
4014
25.0
4311
9-7
5.3
-20.
421
3844
78.0
17.5
Irrig
ation
cha
rges
1413
1143
-19.
144
111
913
0-7
2.9
8.5
2954
3760
5044
27.3
34.2
Crop
Insu
ranc
e0
0-
-0
0-
- -
00
--
Paym
ent t
o Co
ntra
ctor
4636
--
-70
9-
--
-0
--
-
Inte
rest
on
wor
king
ca
pita
l14
6815
656.
671
378
869
010
.5-1
2.4
683
753
847
10.2
12.5
(Con
td...
)
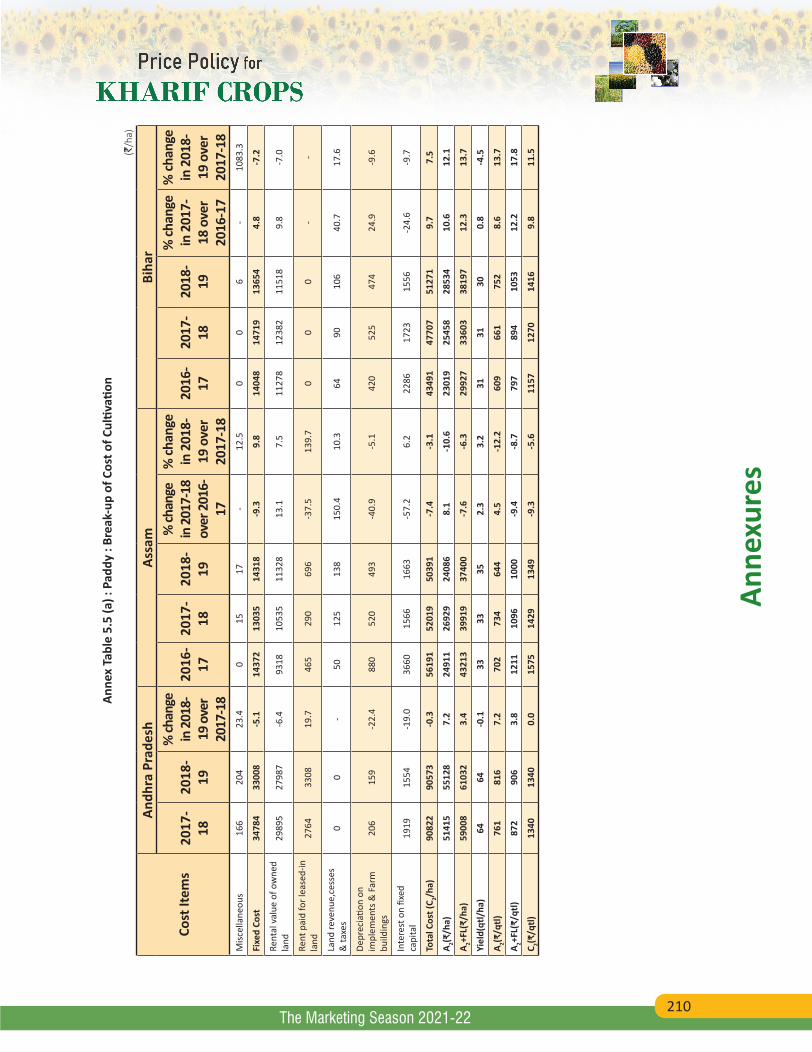
210
Anne
xure
s
The Marketing Season 2021-22
Anne
x Ta
ble
5.5
(a) :
Pad
dy :
Brea
k-up
of C
ost o
f Cul
tivati
on
(`/h
a)
Cost
Item
s
Andh
ra P
rade
shAs
sam
Biha
r
2017
-18
2018
-19
% ch
ange
in
201
8-19
ove
r 20
17-1
8
2016
-17
2017
-18
2018
-19
% ch
ange
in
201
7-18
ov
er 2
016-
17
% ch
ange
in
201
8-19
ove
r 20
17-1
8
2016
-17
2017
-18
2018
-19
% ch
ange
in
201
7-18
ove
r 20
16-1
7
% ch
ange
in
201
8-19
ove
r 20
17-1
8M
iscel
lane
ous
166
204
23.4
015
17-
12.5
00
6-
1083
.3
Fixe
d Co
st34
784
3300
8-5
.114
372
1303
514
318
-9.3
9.8
1404
814
719
1365
44.
8-7
.2
Rent
al v
alue
of o
wne
d la
nd29
895
2798
7-6
.493
1810
535
1132
813
.17.
511
278
1238
211
518
9.8
-7.0
Rent
pai
d fo
r lea
sed-
in
land
2764
3308
19.7
465
290
696
-37.
513
9.7
00
0-
-
Land
reve
nue,
cess
es
& ta
xes
00
-50
125
138
150.
410
.364
9010
640
.717
.6
Depr
ecia
tion
on
impl
emen
ts &
Far
m
build
ings
206
159
-22.
488
052
049
3-4
0.9
-5.1
420
525
474
24.9
-9.6
Inte
rest
on
fixed
ca
pita
l19
1915
54-1
9.0
3660
1566
1663
-57.
26.
222
8617
2315
56-2
4.6
-9.7
Tota
l Cos
t (C 2/h
a)90
822
9057
3-0
.356
191
5201
950
391
-7.4
-3.1
4349
147
707
5127
19.
77.
5
A 2(₹/h
a)51
415
5512
87.
224
911
2692
924
086
8.1
-10.
623
019
2545
828
534
10.6
12.1
A 2+FL(
₹/ha
)59
008
6103
23.
443
213
3991
937
400
-7.6
-6.3
2992
733
603
3819
712
.313
.7
Yiel
d(qt
l/ha
)64
64-0
.133
3335
2.3
3.2
3131
300.
8-4
.5
A 2(₹/q
tl)76
181
67.
270
273
464
44.
5-1
2.2
609
661
752
8.6
13.7
A 2+FL(
₹/qt
l)87
290
63.
812
1110
9610
00-9
.4-8
.779
789
410
5312
.217
.8
C 2(₹/q
tl)13
4013
400.
015
7514
2913
49-9
.3-5
.611
5712
7014
169.
811
.5
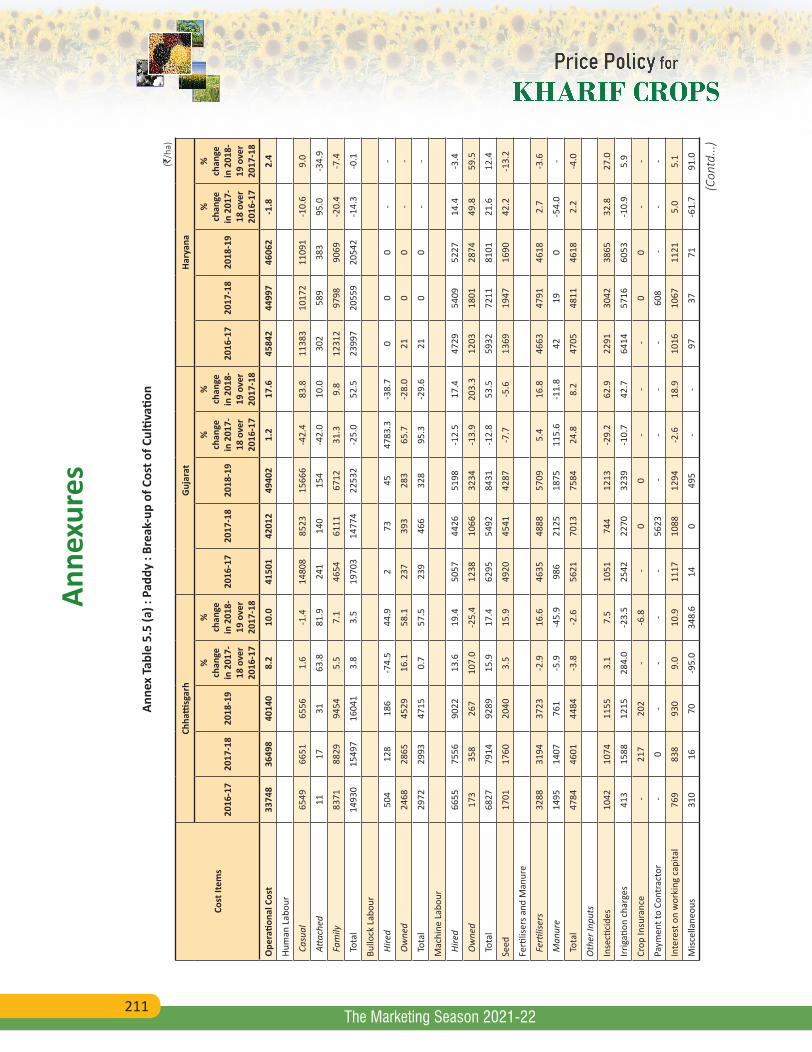
211
Anne
xure
s
The Marketing Season 2021-22
Anne
x Ta
ble
5.5
(a) :
Pad
dy :
Brea
k-up
of C
ost o
f Cul
tivati
on
(`/h
a)
Cost
Item
s
Chha
ttisg
arh
Guj
arat
Hary
ana
2016
-17
2017
-18
2018
-19
%
chan
ge
in 2
017-
18 o
ver
2016
-17
%
chan
ge
in 2
018-
19 o
ver
2017
-18
2016
-17
2017
-18
2018
-19
%
chan
ge
in 2
017-
18 o
ver
2016
-17
%
chan
ge
in 2
018-
19 o
ver
2017
-18
2016
-17
2017
-18
2018
-19
%
chan
ge
in 2
017-
18 o
ver
2016
-17
%
chan
ge
in 2
018-
19 o
ver
2017
-18
Ope
ratio
nal C
ost
3374
836
498
4014
08.
210
.041
501
4201
249
402
1.2
17.6
4584
244
997
4606
2-1
.82.
4
Hum
an L
abou
r
Cas
ual
6549
6651
6556
1.6
-1.4
1480
885
2315
666
-42.
483
.811
383
1017
211
091
-10.
69.
0
Atta
ched
1117
3163
.881
.924
114
015
4-4
2.0
10.0
302
589
383
95.0
-34.
9
Fam
ily83
7188
2994
545.
57.
146
5461
1167
1231
.39.
812
312
9798
9069
-20.
4-7
.4
Tot
al14
930
1549
716
041
3.8
3.5
1970
314
774
2253
2-2
5.0
52.5
2399
720
559
2054
2-1
4.3
-0.1
Bullo
ck L
abou
r
Hire
d50
412
818
6-7
4.5
44.9
273
4547
83.3
-38.
70
00
--
Ow
ned
2468
2865
4529
16.1
58.1
237
393
283
65.7
-28.
021
00
--
Tot
al29
7229
9347
150.
757
.523
946
632
895
.3-2
9.6
210
0-
-
Mac
hine
Lab
our
Hire
d66
5575
5690
2213
.619
.450
5744
2651
98-1
2.5
17.4
4729
5409
5227
14.4
-3.4
Ow
ned
173
358
267
107.
0-2
5.4
1238
1066
3234
-13.
920
3.3
1203
1801
2874
49.8
59.5
Tot
al68
2779
1492
8915
.917
.462
9554
9284
31-1
2.8
53.5
5932
7211
8101
21.6
12.4
Seed
1701
1760
2040
3.5
15.9
4920
4541
4287
-7.7
-5.6
1369
1947
1690
42.2
-13.
2
Ferti
liser
s and
Man
ure
Fer
tilise
rs32
8831
9437
23-2
.916
.646
3548
8857
095.
416
.846
6347
9146
182.
7-3
.6
Man
ure
1495
1407
761
-5.9
-45.
998
621
2518
7511
5.6
-11.
842
190
-54.
0-
Tot
al47
8446
0144
84-3
.8-2
.656
2170
1375
8424
.88.
247
0548
1146
182.
2-4
.0
Oth
er In
puts
Inse
ctici
des
1042
1074
1155
3.1
7.5
1051
744
1213
-29.
262
.922
9130
4238
6532
.827
.0
Irrig
ation
cha
rges
413
1588
1215
284.
0-2
3.5
2542
2270
3239
-10.
742
.764
1457
1660
53-1
0.9
5.9
Crop
Insu
ranc
e -
217
202
--6
.8 -
00
--
-0
0-
-
Paym
ent t
o Co
ntra
ctor
-0
--
- -
5623
--
- -
608
--
-
Inte
rest
on
wor
king
cap
ital
769
838
930
9.0
10.9
1117
1088
1294
-2.6
18.9
1016
1067
1121
5.0
5.1
Misc
ella
neou
s31
016
70-9
5.0
348.
614
049
5-
-97
3771
-61.
791
.0
(Con
td...
)
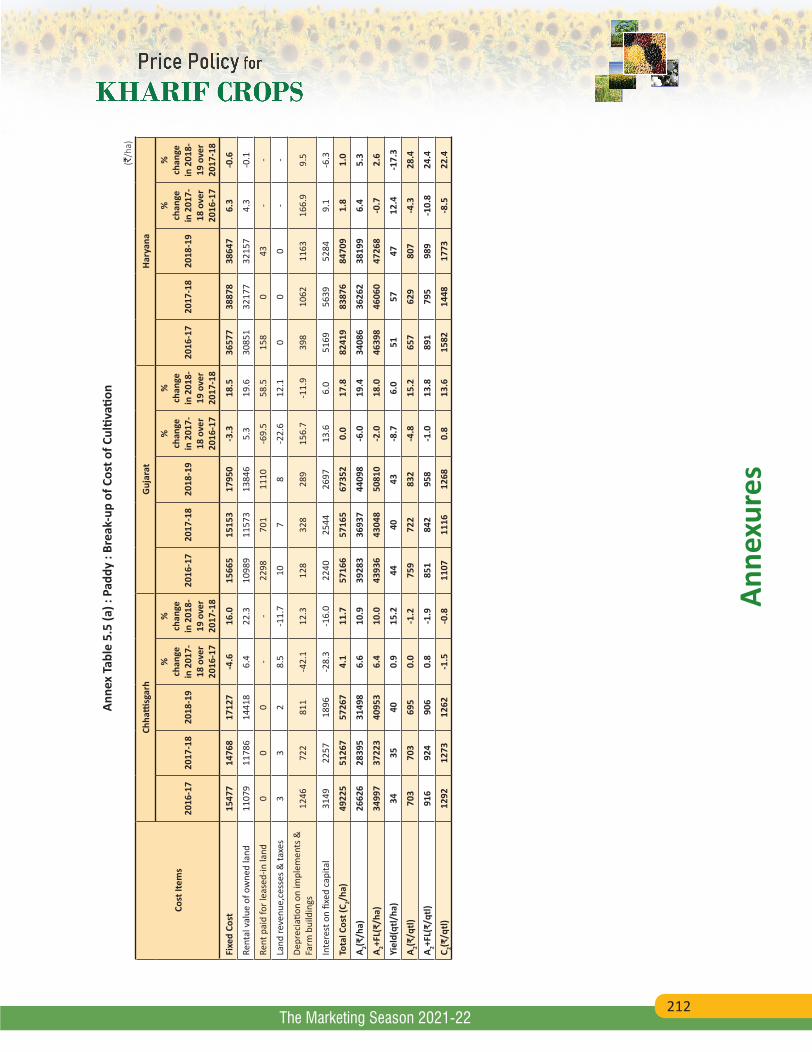
212
Anne
xure
s
The Marketing Season 2021-22
Anne
x Ta
ble
5.5
(a) :
Pad
dy :
Brea
k-up
of C
ost o
f Cul
tivati
on
(`/h
a)
Cost
Item
s
Chha
ttisg
arh
Guj
arat
Hary
ana
2016
-17
2017
-18
2018
-19
%
chan
ge
in 2
017-
18 o
ver
2016
-17
%
chan
ge
in 2
018-
19 o
ver
2017
-18
2016
-17
2017
-18
2018
-19
%
chan
ge
in 2
017-
18 o
ver
2016
-17
%
chan
ge
in 2
018-
19 o
ver
2017
-18
2016
-17
2017
-18
2018
-19
%
chan
ge
in 2
017-
18 o
ver
2016
-17
%
chan
ge
in 2
018-
19 o
ver
2017
-18
Fixe
d Co
st15
477
1476
817
127
-4.6
16.0
1566
515
153
1795
0-3
.318
.536
577
3887
838
647
6.3
-0.6
Rent
al v
alue
of o
wne
d la
nd11
079
1178
614
418
6.4
22.3
1098
911
573
1384
65.
319
.630
851
3217
732
157
4.3
-0.1
Rent
pai
d fo
r lea
sed-
in la
nd0
00
--
2298
701
1110
-69.
558
.515
80
43-
-
Land
reve
nue,
cess
es &
taxe
s3
32
8.5
-11.
710
78
-22.
612
.10
00
--
Depr
ecia
tion
on im
plem
ents
&
Farm
bui
ldin
gs12
4672
281
1-4
2.1
12.3
128
328
289
156.
7-1
1.9
398
1062
1163
166.
99.
5
Inte
rest
on
fixed
cap
ital
3149
2257
1896
-28.
3-1
6.0
2240
2544
2697
13.6
6.0
5169
5639
5284
9.1
-6.3
Tota
l Cos
t (C 2/h
a)49
225
5126
757
267
4.1
11.7
5716
657
165
6735
20.
017
.882
419
8387
684
709
1.8
1.0
A 2(₹/h
a)26
626
2839
531
498
6.6
10.9
3928
336
937
4409
8-6
.019
.434
086
3626
238
199
6.4
5.3
A 2+FL(
₹/ha
)34
997
3722
340
953
6.4
10.0
4393
643
048
5081
0-2
.018
.046
398
4606
047
268
-0.7
2.6
Yiel
d(qt
l/ha
)34
3540
0.9
15.2
4440
43-8
.76.
051
5747
12.4
-17.
3
A 2(₹/q
tl)70
370
369
50.
0-1
.275
972
283
2-4
.815
.265
762
980
7-4
.328
.4
A 2+FL(
₹/qt
l)91
692
490
60.
8-1
.985
184
295
8-1
.013
.889
179
598
9-1
0.8
24.4
C 2(₹/q
tl)12
9212
7312
62-1
.5-0
.811
0711
1612
680.
813
.615
8214
4817
73-8
.522
.4
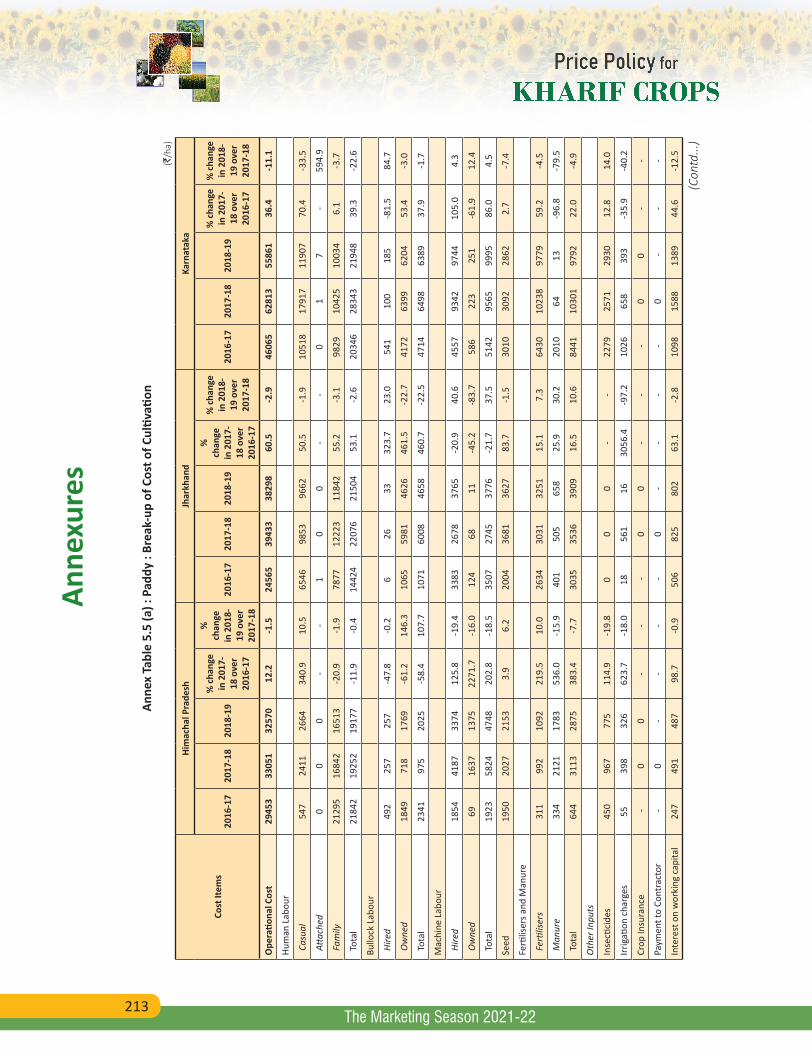
213
Anne
xure
s
The Marketing Season 2021-22
Anne
x Ta
ble
5.5
(a) :
Pad
dy :
Brea
k-up
of C
ost o
f Cul
tivati
on
(`/h
a)
Cost
Item
s
Him
acha
l Pra
desh
Jhar
khan
dKa
rnat
aka
2016
-17
2017
-18
2018
-19
% c
hang
e in
201
7-18
ove
r 20
16-1
7
%
chan
ge
in 2
018-
19 o
ver
2017
-18
2016
-17
2017
-18
2018
-19
%
chan
ge
in 2
017-
18 o
ver
2016
-17
% c
hang
e in
201
8-19
ove
r 20
17-1
8
2016
-17
2017
-18
2018
-19
% c
hang
e in
201
7-18
ove
r 20
16-1
7
% c
hang
e in
201
8-19
ove
r 20
17-1
8
Ope
ratio
nal C
ost
2945
333
051
3257
012
.2-1
.524
565
3943
338
298
60.5
-2.9
4606
562
813
5586
136
.4-1
1.1
Hum
an L
abou
r
Cas
ual
547
2411
2664
340.
910
.565
4698
5396
6250
.5-1
.910
518
1791
711
907
70.4
-33.
5
Atta
ched
00
0-
-1
00
--
01
7-
594.
9
Fam
ily21
295
1684
216
513
-20.
9-1
.978
7712
223
1184
255
.2-3
.198
2910
425
1003
46.
1-3
.7
Tot
al21
842
1925
219
177
-11.
9-0
.414
424
2207
621
504
53.1
-2.6
2034
628
343
2194
839
.3-2
2.6
Bullo
ck L
abou
r
Hire
d49
225
725
7-4
7.8
-0.2
626
3332
3.7
23.0
541
100
185
-81.
584
.7
Ow
ned
1849
718
1769
-61.
214
6.3
1065
5981
4626
461.
5-2
2.7
4172
6399
6204
53.4
-3.0
Tot
al23
4197
520
25-5
8.4
107.
710
7160
0846
5846
0.7
-22.
547
1464
9863
8937
.9-1
.7
Mac
hine
Lab
our
Hire
d18
5441
8733
7412
5.8
-19.
433
8326
7837
65-2
0.9
40.6
4557
9342
9744
105.
04.
3
Ow
ned
6916
3713
7522
71.7
-16.
012
468
11-4
5.2
-83.
758
622
325
1-6
1.9
12.4
Tot
al19
2358
2447
4820
2.8
-18.
535
0727
4537
76-2
1.7
37.5
5142
9565
9995
86.0
4.5
Seed
1950
2027
2153
3.9
6.2
2004
3681
3627
83.7
-1.5
3010
3092
2862
2.7
-7.4
Ferti
liser
s and
Man
ure
Fer
tilise
rs31
199
210
9221
9.5
10.0
2634
3031
3251
15.1
7.3
6430
1023
897
7959
.2-4
.5
Man
ure
334
2121
1783
536.
0-1
5.9
401
505
658
25.9
30.2
2010
6413
-96.
8-7
9.5
Tot
al64
431
1328
7538
3.4
-7.7
3035
3536
3909
16.5
10.6
8441
1030
197
9222
.0-4
.9
Oth
er In
puts
Inse
ctici
des
450
967
775
114.
9-1
9.8
00
0-
-22
7925
7129
3012
.814
.0
Irrig
ation
cha
rges
5539
832
662
3.7
-18.
018
561
1630
56.4
-97.
210
2665
839
3-3
5.9
-40.
2
Crop
Insu
ranc
e -
00
--
-0
0-
- -
00
--
Paym
ent t
o Co
ntra
ctor
-0
--
- -
0-
--
-0
--
-
Inte
rest
on
wor
king
cap
ital
247
491
487
98.7
-0.9
506
825
802
63.1
-2.8
1098
1588
1389
44.6
-12.
5
(Con
td...
)
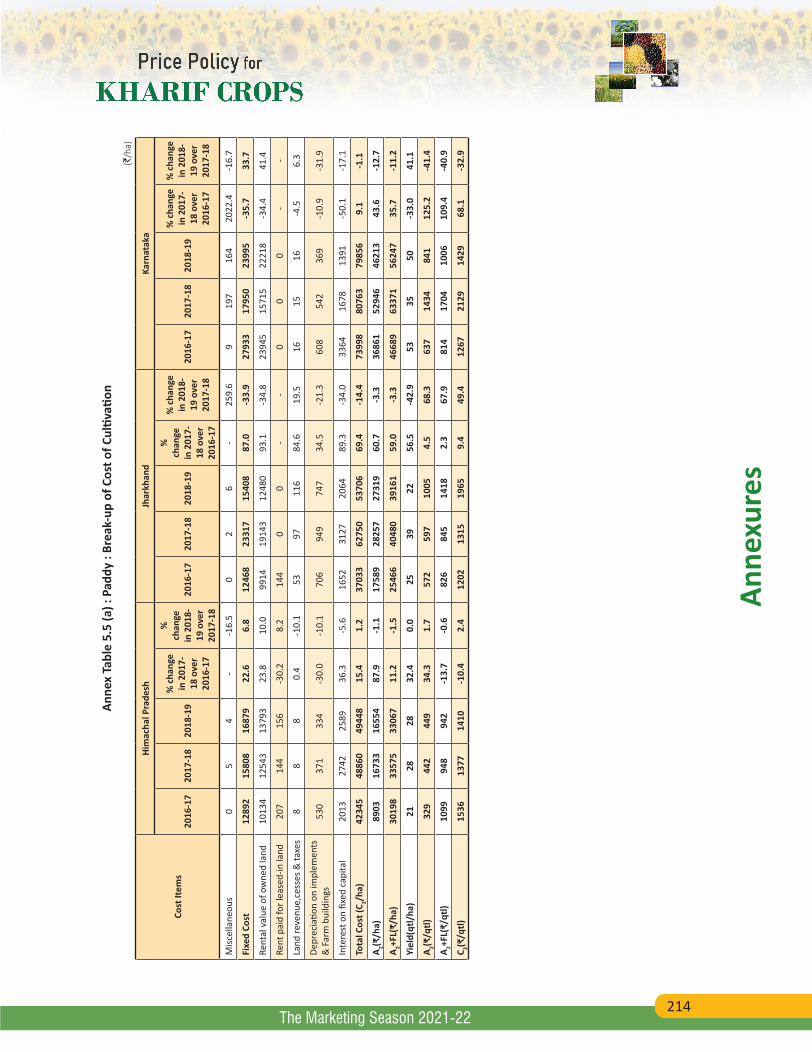
214
Anne
xure
s
The Marketing Season 2021-22
Anne
x Ta
ble
5.5
(a) :
Pad
dy :
Brea
k-up
of C
ost o
f Cul
tivati
on
(`/h
a)
Cost
Item
s
Him
acha
l Pra
desh
Jhar
khan
dKa
rnat
aka
2016
-17
2017
-18
2018
-19
% c
hang
e in
201
7-18
ove
r 20
16-1
7
%
chan
ge
in 2
018-
19 o
ver
2017
-18
2016
-17
2017
-18
2018
-19
%
chan
ge
in 2
017-
18 o
ver
2016
-17
% c
hang
e in
201
8-19
ove
r 20
17-1
8
2016
-17
2017
-18
2018
-19
% c
hang
e in
201
7-18
ove
r 20
16-1
7
% c
hang
e in
201
8-19
ove
r 20
17-1
8
Misc
ella
neou
s0
54
--1
6.5
02
6-
259.
69
197
164
2022
.4-1
6.7
Fixe
d Co
st12
892
1580
816
879
22.6
6.8
1246
823
317
1540
887
.0-3
3.9
2793
317
950
2399
5-3
5.7
33.7
Rent
al v
alue
of o
wne
d la
nd10
134
1254
313
793
23.8
10.0
9914
1914
312
480
93.1
-34.
823
945
1571
522
218
-34.
441
.4
Rent
pai
d fo
r lea
sed-
in la
nd20
714
415
6-3
0.2
8.2
144
00
--
00
0-
-
Land
reve
nue,
cess
es &
taxe
s8
88
0.4
-10.
153
9711
684
.619
.516
1516
-4.5
6.3
Depr
ecia
tion
on im
plem
ents
&
Far
m b
uild
ings
530
371
334
-30.
0-1
0.1
706
949
747
34.5
-21.
360
854
236
9-1
0.9
-31.
9
Inte
rest
on
fixed
cap
ital
2013
2742
2589
36.3
-5.6
1652
3127
2064
89.3
-34.
033
6416
7813
91-5
0.1
-17.
1
Tota
l Cos
t (C 2/h
a)42
345
4886
049
448
15.4
1.2
3703
362
750
5370
669
.4-1
4.4
7399
880
763
7985
69.
1-1
.1
A 2(₹/h
a)89
0316
733
1655
487
.9-1
.117
589
2825
727
319
60.7
-3.3
3686
152
946
4621
343
.6-1
2.7
A 2+FL(
₹/ha
)30
198
3357
533
067
11.2
-1.5
2546
640
480
3916
159
.0-3
.346
689
6337
156
247
35.7
-11.
2
Yiel
d(qt
l/ha
)21
2828
32.4
0.0
2539
2256
.5-4
2.9
5335
50-3
3.0
41.1
A 2(₹/q
tl)32
944
244
934
.31.
757
259
710
054.
568
.363
714
3484
112
5.2
-41.
4
A 2+FL(
₹/qt
l)10
9994
894
2-1
3.7
-0.6
826
845
1418
2.3
67.9
814
1704
1006
109.
4-4
0.9
C 2(₹/q
tl)15
3613
7714
10-1
0.4
2.4
1202
1315
1965
9.4
49.4
1267
2129
1429
68.1
-32.
9
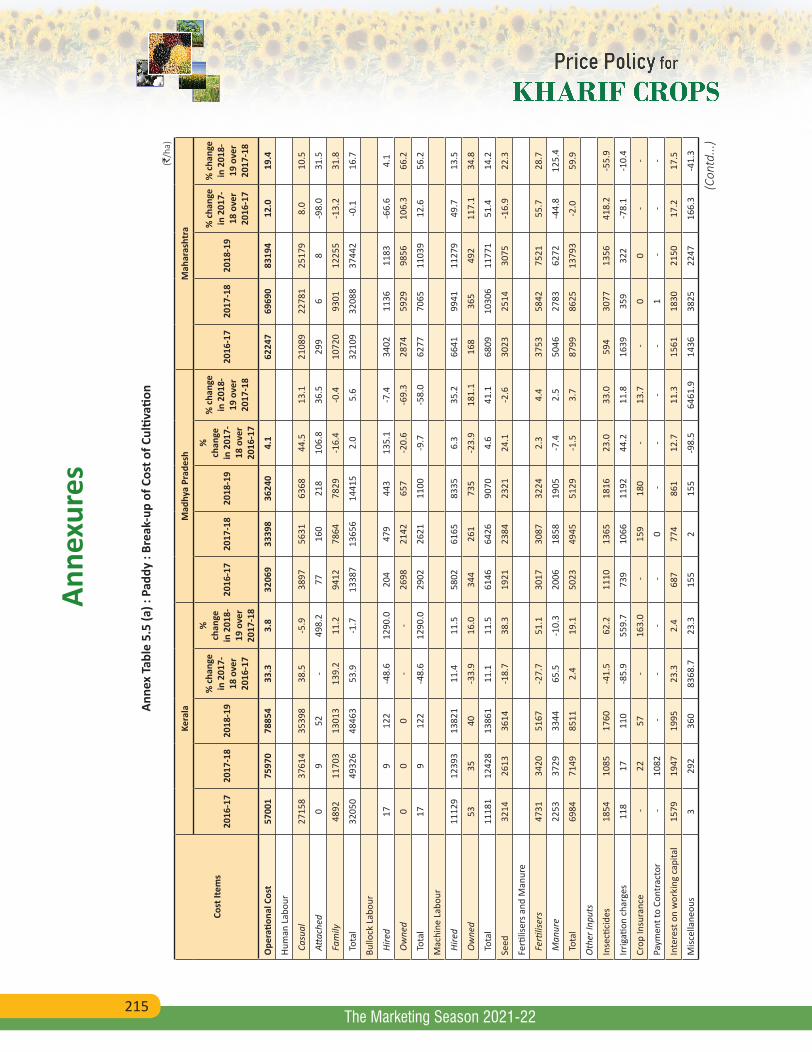
215
Anne
xure
s
The Marketing Season 2021-22
Anne
x Ta
ble
5.5
(a) :
Pad
dy :
Brea
k-up
of C
ost o
f Cul
tivati
on
(`/h
a)
Cost
Item
s
Kera
laM
adhy
a Pr
ades
hM
ahar
asht
ra
2016
-17
2017
-18
2018
-19
% c
hang
e in
201
7-18
ove
r 20
16-1
7
%
chan
ge
in 2
018-
19 o
ver
2017
-18
2016
-17
2017
-18
2018
-19
%
chan
ge
in 2
017-
18 o
ver
2016
-17
% c
hang
e in
201
8-19
ove
r 20
17-1
8
2016
-17
2017
-18
2018
-19
% c
hang
e in
201
7-18
ove
r 20
16-1
7
% c
hang
e in
201
8-19
ove
r 20
17-1
8
Ope
ratio
nal C
ost
5700
175
970
7885
433
.33.
832
069
3339
836
240
4.1
6224
769
690
8319
412
.019
.4
Hum
an L
abou
r
Cas
ual
2715
837
614
3539
838
.5-5
.938
9756
3163
6844
.513
.121
089
2278
125
179
8.0
10.5
Atta
ched
09
52-
498.
277
160
218
106.
836
.529
96
8-9
8.0
31.5
Fam
ily48
9211
703
1301
313
9.2
11.2
9412
7864
7829
-16.
4-0
.410
720
9301
1225
5-1
3.2
31.8
Tot
al32
050
4932
648
463
53.9
-1.7
1338
713
656
1441
52.
05.
632
109
3208
837
442
-0.1
16.7
Bullo
ck L
abou
r
Hire
d17
912
2-4
8.6
1290
.020
447
944
313
5.1
-7.4
3402
1136
1183
-66.
64.
1
Ow
ned
00
0-
-26
9821
4265
7-2
0.6
-69.
328
7459
2998
5610
6.3
66.2
Tot
al17
912
2-4
8.6
1290
.029
0226
2111
00-9
.7-5
8.0
6277
7065
1103
912
.656
.2
Mac
hine
Lab
our
Hire
d11
129
1239
313
821
11.4
11.5
5802
6165
8335
6.3
35.2
6641
9941
1127
949
.713
.5
Ow
ned
5335
40-3
3.9
16.0
344
261
735
-23.
918
1.1
168
365
492
117.
134
.8
Tot
al11
181
1242
813
861
11.1
11.5
6146
6426
9070
4.6
41.1
6809
1030
611
771
51.4
14.2
Seed
3214
2613
3614
-18.
738
.319
2123
8423
2124
.1-2
.630
2325
1430
75-1
6.9
22.3
Ferti
liser
s and
Man
ure
Fer
tilise
rs47
3134
2051
67-2
7.7
51.1
3017
3087
3224
2.3
4.4
3753
5842
7521
55.7
28.7
Man
ure
2253
3729
3344
65.5
-10.
320
0618
5819
05-7
.42.
550
4627
8362
72-4
4.8
125.
4
Tot
al69
8471
4985
112.
419
.150
2349
4551
29-1
.53.
787
9986
2513
793
-2.0
59.9
Oth
er In
puts
Inse
ctici
des
1854
1085
1760
-41.
562
.211
1013
6518
1623
.033
.059
430
7713
5641
8.2
-55.
9
Irrig
ation
cha
rges
118
1711
0-8
5.9
559.
773
910
6611
9244
.211
.816
3935
932
2-7
8.1
-10.
4
Crop
Insu
ranc
e -
2257
-16
3.0
-15
918
0-
13.7
-0
0-
-
Paym
ent t
o Co
ntra
ctor
-10
82 -
--
-0
--
- -
1 -
--
Inte
rest
on
wor
king
cap
ital
1579
1947
1995
23.3
2.4
687
774
861
12.7
11.3
1561
1830
2150
17.2
17.5
Misc
ella
neou
s3
292
360
8368
.723
.315
52
155
-98.
564
61.9
1436
3825
2247
166.
3-4
1.3
(Con
td...
)
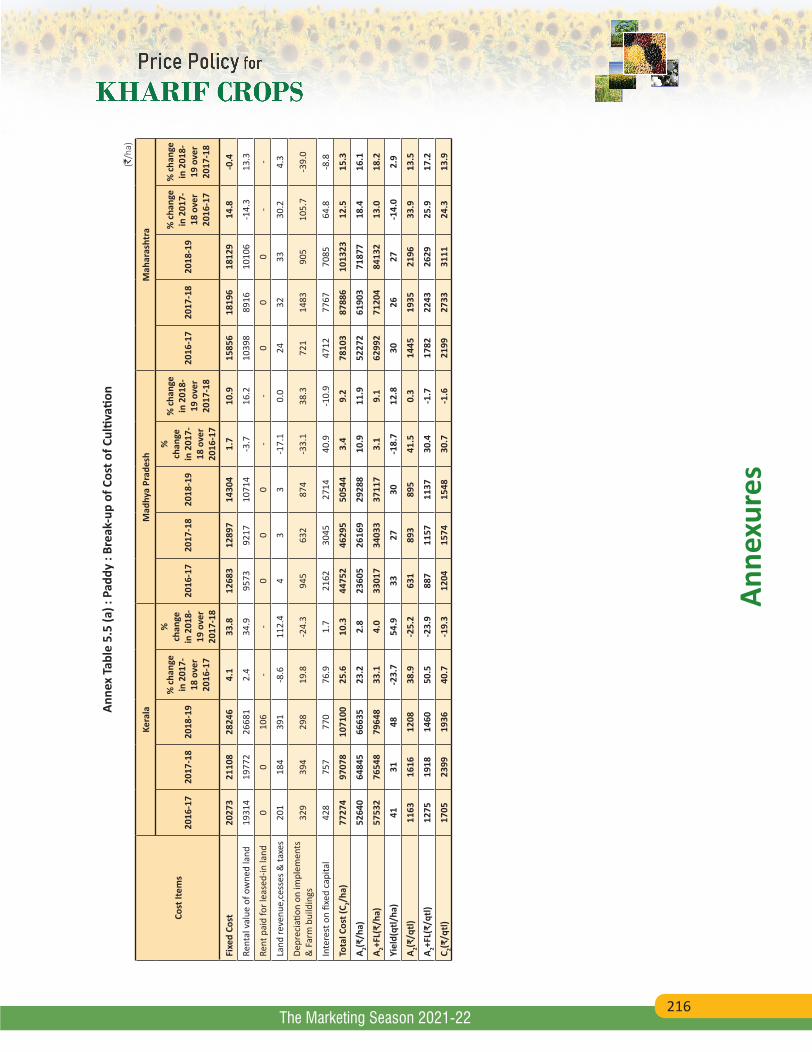
216
Anne
xure
s
The Marketing Season 2021-22
Anne
x Ta
ble
5.5
(a) :
Pad
dy :
Brea
k-up
of C
ost o
f Cul
tivati
on
(`/h
a)
Cost
Item
s
Kera
laM
adhy
a Pr
ades
hM
ahar
asht
ra
2016
-17
2017
-18
2018
-19
% c
hang
e in
201
7-18
ove
r 20
16-1
7
%
chan
ge
in 2
018-
19 o
ver
2017
-18
2016
-17
2017
-18
2018
-19
%
chan
ge
in 2
017-
18 o
ver
2016
-17
% c
hang
e in
201
8-19
ove
r 20
17-1
8
2016
-17
2017
-18
2018
-19
% c
hang
e in
201
7-18
ove
r 20
16-1
7
% c
hang
e in
201
8-19
ove
r 20
17-1
8
Fixe
d Co
st20
273
2110
828
246
4.1
33.8
1268
312
897
1430
41.
710
.915
856
1819
618
129
14.8
-0.4
Rent
al v
alue
of o
wne
d la
nd19
314
1977
226
681
2.4
34.9
9573
9217
1071
4-3
.716
.210
398
8916
1010
6-1
4.3
13.3
Rent
pai
d fo
r lea
sed-
in la
nd0
010
6-
-0
00
--
00
0-
-
Land
reve
nue,
cess
es &
taxe
s20
118
439
1-8
.611
2.4
43
3-1
7.1
0.0
2432
3330
.24.
3
Depr
ecia
tion
on im
plem
ents
&
Far
m b
uild
ings
329
394
298
19.8
-24.
394
563
287
4-3
3.1
38.3
721
1483
905
105.
7-3
9.0
Inte
rest
on
fixed
cap
ital
428
757
770
76.9
1.7
2162
3045
2714
40.9
-10.
947
1277
6770
8564
.8-8
.8
Tota
l Cos
t (C 2/h
a)77
274
9707
810
7100
25.6
10.3
4475
246
295
5054
43.
49.
278
103
8788
610
1323
12.5
15.3
A 2(₹/h
a)52
640
6484
566
635
23.2
2.8
2360
526
169
2928
810
.911
.952
272
6190
371
877
18.4
16.1
A 2+FL(
₹/ha
)57
532
7654
879
648
33.1
4.0
3301
734
033
3711
73.
19.
162
992
7120
484
132
13.0
18.2
Yiel
d(qt
l/ha
)41
3148
-23.
754
.933
2730
-18.
712
.830
2627
-14.
02.
9
A 2(₹/q
tl)11
6316
1612
0838
.9-2
5.2
631
893
895
41.5
0.3
1445
1935
2196
33.9
13.5
A 2+FL(
₹/qt
l)12
7519
1814
6050
.5-2
3.9
887
1157
1137
30.4
-1.7
1782
2243
2629
25.9
17.2
C 2(₹/q
tl)17
0523
9919
3640
.7-1
9.3
1204
1574
1548
30.7
-1.6
2199
2733
3111
24.3
13.9
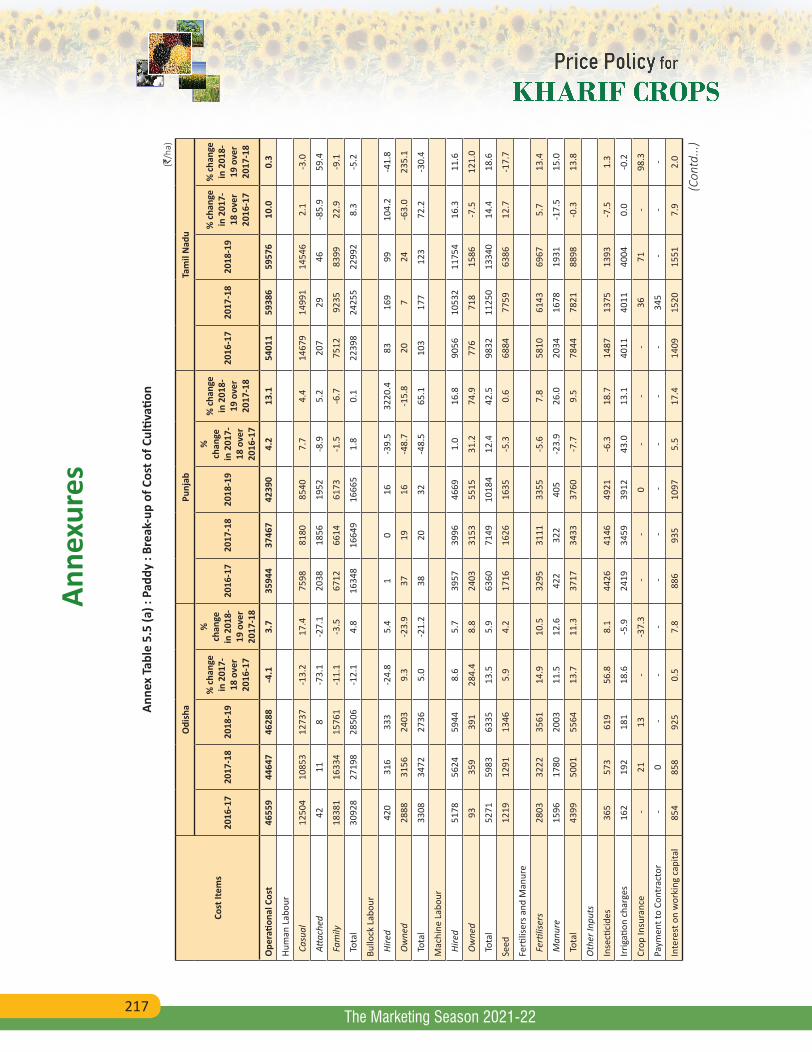
217
Anne
xure
s
The Marketing Season 2021-22
Anne
x Ta
ble
5.5
(a) :
Pad
dy :
Brea
k-up
of C
ost o
f Cul
tivati
on
(`/h
a)
Cost
Item
s
Odi
sha
Punj
abTa
mil
Nad
u
2016
-17
2017
-18
2018
-19
% c
hang
e in
201
7-18
ove
r 20
16-1
7
%
chan
ge
in 2
018-
19 o
ver
2017
-18
2016
-17
2017
-18
2018
-19
%
chan
ge
in 2
017-
18 o
ver
2016
-17
% c
hang
e in
201
8-19
ove
r 20
17-1
8
2016
-17
2017
-18
2018
-19
% c
hang
e in
201
7-18
ove
r 20
16-1
7
% c
hang
e in
201
8-19
ove
r 20
17-1
8
Ope
ratio
nal C
ost
4655
944
647
4628
8-4
.13.
735
944
3746
742
390
4.2
13.1
5401
159
386
5957
610
.00.
3
Hum
an L
abou
r
Cas
ual
1250
410
853
1273
7-1
3.2
17.4
7598
8180
8540
7.7
4.4
1467
914
991
1454
62.
1-3
.0
Atta
ched
4211
8-7
3.1
-27.
120
3818
5619
52-8
.95.
220
729
46-8
5.9
59.4
Fam
ily18
381
1633
415
761
-11.
1-3
.567
1266
1461
73-1
.5-6
.775
1292
3583
9922
.9-9
.1
Tot
al30
928
2719
828
506
-12.
14.
816
348
1664
916
665
1.8
0.1
2239
824
255
2299
28.
3-5
.2
Bullo
ck L
abou
r
Hire
d42
031
633
3-2
4.8
5.4
10
16-3
9.5
3220
.483
169
9910
4.2
-41.
8
Ow
ned
2888
3156
2403
9.3
-23.
937
1916
-48.
7-1
5.8
207
24-6
3.0
235.
1
Tot
al33
0834
7227
365.
0-2
1.2
3820
32-4
8.5
65.1
103
177
123
72.2
-30.
4
Mac
hine
Lab
our
Hire
d51
7856
2459
448.
65.
739
5739
9646
691.
016
.890
5610
532
1175
416
.311
.6
Ow
ned
9335
939
128
4.4
8.8
2403
3153
5515
31.2
74.9
776
718
1586
-7.5
121.
0
Tot
al52
7159
8363
3513
.55.
963
6071
4910
184
12.4
42.5
9832
1125
013
340
14.4
18.6
Seed
1219
1291
1346
5.9
4.2
1716
1626
1635
-5.3
0.6
6884
7759
6386
12.7
-17.
7
Ferti
liser
s and
Man
ure
Fer
tilise
rs28
0332
2235
6114
.910
.532
9531
1133
55-5
.67.
858
1061
4369
675.
713
.4
Man
ure
1596
1780
2003
11.5
12.6
422
322
405
-23.
926
.020
3416
7819
31-1
7.5
15.0
Tot
al43
9950
0155
6413
.711
.337
1734
3337
60-7
.79.
578
4478
2188
98-0
.313
.8
Oth
er In
puts
Inse
ctici
des
365
573
619
56.8
8.1
4426
4146
4921
-6.3
18.7
1487
1375
1393
-7.5
1.3
Irrig
ation
cha
rges
162
192
181
18.6
-5.9
2419
3459
3912
43.0
13.1
4011
4011
4004
0.0
-0.2
Crop
Insu
ranc
e -
2113
--3
7.3
- -
0-
- -
3671
-98
.3
Paym
ent t
o Co
ntra
ctor
-0
--
- -
- -
--
-34
5 -
--
Inte
rest
on
wor
king
cap
ital
854
858
925
0.5
7.8
886
935
1097
5.5
17.4
1409
1520
1551
7.9
2.0
(Con
td...
)
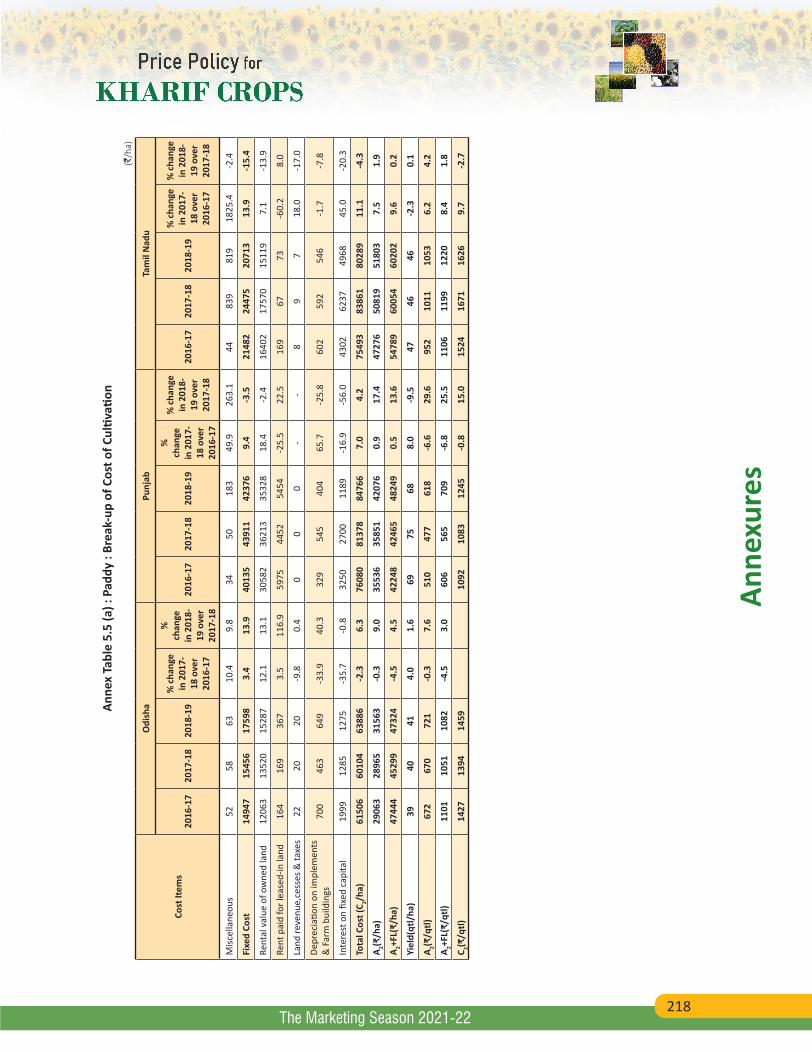
218
Anne
xure
s
The Marketing Season 2021-22
Anne
x Ta
ble
5.5
(a) :
Pad
dy :
Brea
k-up
of C
ost o
f Cul
tivati
on
(`/h
a)
Cost
Item
s
Odi
sha
Punj
abTa
mil
Nad
u
2016
-17
2017
-18
2018
-19
% c
hang
e in
201
7-18
ove
r 20
16-1
7
%
chan
ge
in 2
018-
19 o
ver
2017
-18
2016
-17
2017
-18
2018
-19
%
chan
ge
in 2
017-
18 o
ver
2016
-17
% c
hang
e in
201
8-19
ove
r 20
17-1
8
2016
-17
2017
-18
2018
-19
% c
hang
e in
201
7-18
ove
r 20
16-1
7
% c
hang
e in
201
8-19
ove
r 20
17-1
8
Misc
ella
neou
s52
5863
10.4
9.8
3450
183
49.9
263.
144
839
819
1825
.4-2
.4
Fixe
d Co
st14
947
1545
617
598
3.4
13.9
4013
543
911
4237
69.
4-3
.521
482
2447
520
713
13.9
-15.
4
Rent
al v
alue
of o
wne
d la
nd12
063
1352
015
287
12.1
13.1
3058
236
213
3532
818
.4-2
.416
402
1757
015
119
7.1
-13.
9
Rent
pai
d fo
r lea
sed-
in la
nd16
416
936
73.
511
6.9
5975
4452
5454
-25.
522
.516
967
73-6
0.2
8.0
Land
reve
nue,
cess
es &
taxe
s22
2020
-9.8
0.4
00
0-
-8
97
18.0
-17.
0
Depr
ecia
tion
on im
plem
ents
&
Far
m b
uild
ings
700
463
649
-33.
940
.332
954
540
465
.7-2
5.8
602
592
546
-1.7
-7.8
Inte
rest
on
fixed
cap
ital
1999
1285
1275
-35.
7-0
.832
5027
0011
89-1
6.9
-56.
043
0262
3749
6845
.0-2
0.3
Tota
l Cos
t (C 2/h
a)61
506
6010
463
886
-2.3
6.3
7608
081
378
8476
67.
04.
275
493
8386
180
289
11.1
-4.3
A 2(₹/h
a)29
063
2896
531
563
-0.3
9.0
3553
635
851
4207
60.
917
.447
276
5081
951
803
7.5
1.9
A 2+FL(
₹/ha
)47
444
4529
947
324
-4.5
4.5
4224
842
465
4824
90.
513
.654
789
6005
460
202
9.6
0.2
Yiel
d(qt
l/ha
)39
4041
4.0
1.6
6975
688.
0-9
.547
4646
-2.3
0.1
A 2(₹/q
tl)67
267
072
1-0
.37.
651
047
761
8-6
.629
.695
210
1110
536.
24.
2
A 2+FL(
₹/qt
l)11
0110
5110
82-4
.53.
060
656
570
9-6
.825
.511
0611
9912
208.
41.
8
C 2(₹/q
tl)14
2713
9414
5910
9210
8312
45-0
.815
.015
2416
7116
269.
7-2
.7

219
Anne
xure
s
The Marketing Season 2021-22
Anne
x Ta
ble
5.5
(a) :
Pad
dy :
Brea
k-up
of C
ost o
f Cul
tivati
on
(`/h
a)
Cost
Item
s
Tela
ngan
aU
ttar
Pra
desh
Utt
arak
hand
2017
-18
2018
-19
% c
hang
e in
201
8-19
ov
er 2
017-
18
2016
-17
2017
-18
2018
-19
% c
hang
e in
201
7-18
ov
er 2
016-
17
% c
hang
e in
201
8-19
ov
er 2
017-
18
2016
-17
2017
-18
2018
-19
% c
hang
e in
201
7-18
ov
er 2
016-
17
% c
hang
e in
201
8-19
ov
er 2
017-
18
Ope
ratio
nal C
ost
5666
256
116
-1.0
3902
343
329
4197
311
.0-3
.133
805
3789
745
559
12.1
20.2
Hum
an L
abou
r
Cas
ual
1076
215
963
48.3
7853
1185
612
389
51.0
4.5
5631
6863
1359
621
.998
.1
Atta
ched
229
258
12.5
1258
1938
9.0
-67.
931
8997
184.
58.
9
Fam
ily12
290
8608
-30.
011
421
9428
8568
-17.
4-9
.199
4113
717
1160
738
.0-1
5.4
Tot
al23
281
2482
96.
619
285
2134
320
976
10.7
-1.7
1560
320
669
2530
032
.522
.4
Bullo
ck L
abou
r
Hire
d33
323
0-3
1.0
5020
0-5
9.0
-0
4159
7551
-81
.5
Ow
ned
835
437
-47.
759
235
8-9
4.1
-77.
035
901
71-1
00.0
1372
3.5
Tot
al11
6766
6-4
2.9
642
558
-91.
4-8
5.5
3590
4160
7621
15.9
83.2
Mac
hine
Lab
our
Hire
d89
9412
162
35.2
4172
4715
5154
13.0
9.3
3524
1852
2342
-47.
526
.5
Ow
ned
513
752
46.5
297
755
628
154.
4-1
6.8
1379
1679
1837
21.8
9.4
Tot
al95
0712
913
35.8
4469
5470
5783
22.4
5.7
4903
3531
4179
-28.
018
.4
Seed
2041
2610
27.9
4071
4372
4636
7.4
6.0
3711
3694
2726
-0.5
-26.
2
Ferti
liser
s and
Man
ure
Fer
tilise
rs77
5382
456.
444
9941
3837
95-8
.0-8
.333
8524
5025
70-2
7.6
4.9
Man
ure
429
431
0.3
7163
16-1
1.1
-75.
145
80
0-
-
Tot
al81
8286
766.
045
7042
0238
11-8
.1-9
.338
4324
5025
70-3
6.3
4.9
Oth
er In
puts
Inse
ctici
des
4136
3586
-13.
335
023
649
8-3
2.5
110.
779
510
5590
232
.7-1
4.5
Irrig
ation
cha
rges
870
1265
45.3
4798
6615
5245
37.9
-20.
763
616
0612
0415
2.6
-25.
0
Crop
Insu
ranc
e0
0-
-0
0-
- -
00
--
Paym
ent t
o Co
ntra
ctor
5999
--
-6
--
- -
0 -
--
Inte
rest
on
wor
king
cap
ital
1345
1440
7.1
836
1027
1012
22.8
-1.5
723
733
1029
1.3
40.4
Misc
ella
neou
s13
413
2-1
.51
43
247.
7-7
.00
028
--
(Con
td...
)

220
Anne
xure
s
The Marketing Season 2021-22
Anne
x Ta
ble
5.5
(a) :
Pad
dy :
Brea
k-up
of C
ost o
f Cul
tivati
on
(`/h
a)
Cost
Item
s
Tela
ngan
aU
ttar
Pra
desh
Utt
arak
hand
2017
-18
2018
-19
% c
hang
e in
201
8-19
ov
er 2
017-
18
2016
-17
2017
-18
2018
-19
% c
hang
e in
201
7-18
ov
er 2
016-
17
% c
hang
e in
201
8-19
ov
er 2
017-
18
2016
-17
2017
-18
2018
-19
% c
hang
e in
201
7-18
ov
er 2
016-
17
% c
hang
e in
201
8-19
ov
er 2
017-
18
Fixe
d Co
st35
061
3440
5-1
.919
406
1805
317
800
-7.0
-1.4
1599
018
719
1837
117
.1-1
.9
Rent
al v
alue
of o
wne
d la
nd25
003
2241
6-1
0.3
1338
513
332
1337
4-0
.40.
314
392
1708
917
988
18.7
5.3
Rent
pai
d fo
r lea
sed-
in la
nd56
0073
5331
.349
96
73-9
8.8
1152
.70
00
--
Land
reve
nue,
cess
es &
taxe
s0
0-
24
551
.423
.93
10
-69.
0-7
0.4
Depr
ecia
tion
on im
plem
ents
&
Farm
bui
ldin
gs66
122
6-6
5.8
878
744
716
-15.
3-3
.817
822
920
028
.6-1
2.7
Inte
rest
on
fixed
cap
ital
3797
4411
16.2
4642
3967
3632
-14.
5-8
.414
1714
0018
3-1
.1-8
6.9
Tota
l Cos
t (C 2/h
a)91
723
9052
1-1
.358
429
6138
259
773
5.1
-2.6
4979
556
617
6393
013
.712
.9
A 2(₹/h
a)50
633
5508
68.
828
982
3465
434
198
19.6
-1.3
2404
524
410
3415
21.
539
.9
A 2+FL(
₹/ha
)62
923
6369
51.
240
403
4408
342
766
9.1
-3.0
3398
638
127
4575
912
.220
.0
Yiel
d(qt
l/ha
)47
5518
.237
3736
-0.7
-3.5
4631
37-3
2.9
20.1
A 2(₹/q
tl)10
1995
5-6
.273
488
290
420
.22.
549
568
385
538
.025
.3
A 2+FL(
₹/qt
l)12
6610
91-1
3.8
1018
1122
1133
10.2
1.0
690
1155
1164
67.3
0.8
C 2(₹/q
tl)18
4615
51-1
6.0
1476
1563
1583
5.9
1.3
1013
1695
1605
67.3
-5.3

221
Anne
xure
s
The Marketing Season 2021-22
Anne
x Ta
ble
5.5
(a) :
Pad
dy :
Brea
k-up
of C
ost o
f Cul
tivati
on
(`/h
a)
Cost
Item
sW
est B
enga
l
2016
-17
2017
-18
2018
-19
% c
hang
e in
201
7-18
ove
r 20
16-1
7%
cha
nge
in 2
018-
19 o
ver
2017
-18
Ope
ratio
nal C
ost
5845
659
867
5852
52.
4-2
.2
Hum
an L
abou
r
Cas
ual
1784
516
374
1821
9-8
.211
.3
Atta
ched
14
057
0.8
-
Fam
ily19
549
2084
620
636
6.6
-1.0
Tot
al37
394
3722
538
855
-0.5
4.4
Bullo
ck L
abou
r
Hire
d41
333
938
7-1
8.0
14.3
Ow
ned
1145
983
1082
-14.
110
.1
Tot
al15
5813
2214
69-1
5.2
11.2
Mac
hine
Lab
our
Hire
d45
0843
5147
88-3
.510
.1
Ow
ned
402
6214
0-8
4.7
127.
9
Tot
al49
1044
1349
29-1
0.1
11.7
Seed
2021
2243
2335
11.0
4.1
Ferti
liser
s and
Man
ure
Fer
tilise
rs52
0450
0652
61-3
.85.
1
Man
ure
1456
1094
1085
-24.
8-0
.9
Tot
al66
6061
0163
46-8
.44.
0
Oth
er In
puts
Inse
ctici
des
1686
1170
1290
-30.
610
.3
Irrig
ation
cha
rges
2985
1019
2078
-65.
910
4.0
Crop
Insu
ranc
e -
00
--
Paym
ent t
o Co
ntra
ctor
-50
55-
--
Inte
rest
on
wor
king
cap
ital
1179
1182
1148
0.3
-2.9
Misc
ella
neou
s63
139
7511
9.8
-46.
0
Fixe
d Co
st19
171
1819
019
082
-5.1
4.9
Rent
al v
alue
of o
wne
d la
nd15
758
1582
516
376
0.4
3.5
(Con
td...
)
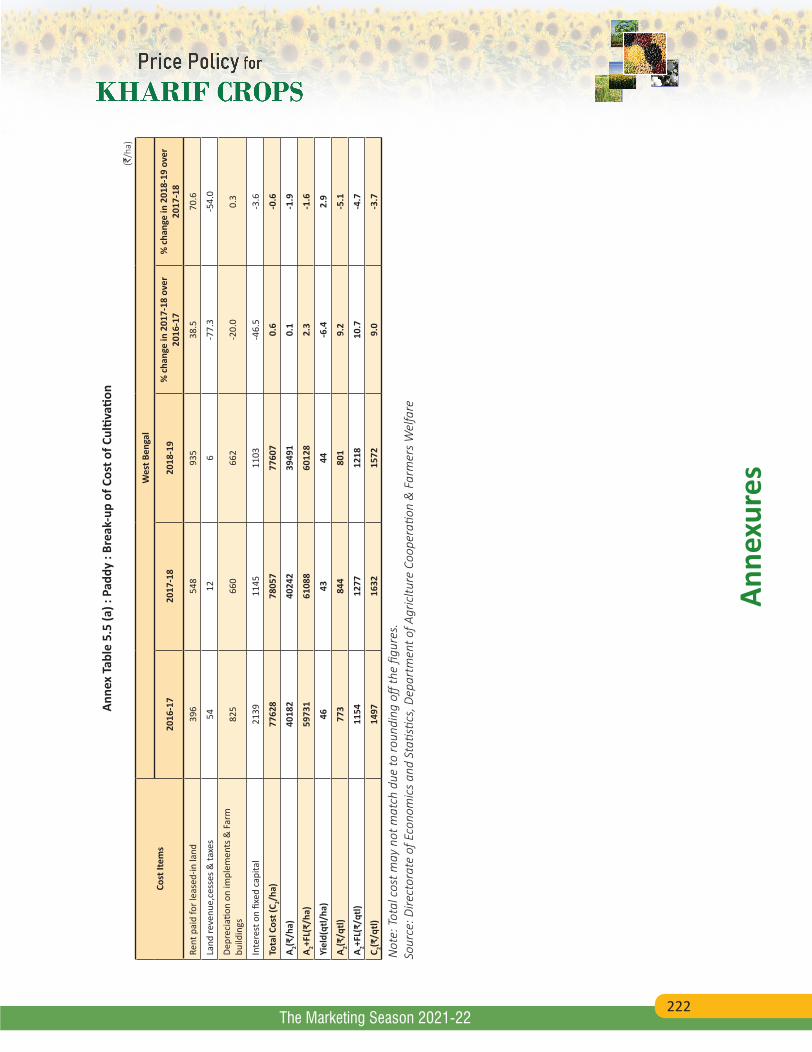
222
Anne
xure
s
The Marketing Season 2021-22
Anne
x Ta
ble
5.5
(a) :
Pad
dy :
Brea
k-up
of C
ost o
f Cul
tivati
on
(`/h
a)
Cost
Item
sW
est B
enga
l
2016
-17
2017
-18
2018
-19
% c
hang
e in
201
7-18
ove
r 20
16-1
7%
cha
nge
in 2
018-
19 o
ver
2017
-18
Rent
pai
d fo
r lea
sed-
in la
nd39
654
893
538
.570
.6
Land
reve
nue,
cess
es &
taxe
s54
126
-77.
3-5
4.0
Depr
ecia
tion
on im
plem
ents
& F
arm
bu
ildin
gs82
566
066
2-2
0.0
0.3
Inte
rest
on
fixed
cap
ital
2139
1145
1103
-46.
5-3
.6
Tota
l Cos
t (C 2/h
a)77
628
7805
777
607
0.6
-0.6
A 2(₹/h
a)40
182
4024
239
491
0.1
-1.9
A 2+FL(
₹/ha
)59
731
6108
860
128
2.3
-1.6
Yiel
d(qt
l/ha
)46
4344
-6.4
2.9
A 2(₹/q
tl)77
384
480
19.
2-5
.1
A 2+FL(
₹/qt
l)11
5412
7712
1810
.7-4
.7
C 2(₹/q
tl)14
9716
3215
729.
0-3
.7
Not
e: T
otal
cos
t may
not
mat
ch d
ue to
roun
ding
off
the
figur
es.
Sour
ce: D
irect
orat
e of
Eco
nom
ics
and
Stati
stics
, Dep
artm
ent o
f Agr
icltu
re C
oope
ratio
n &
Far
mer
s W
elfa
re
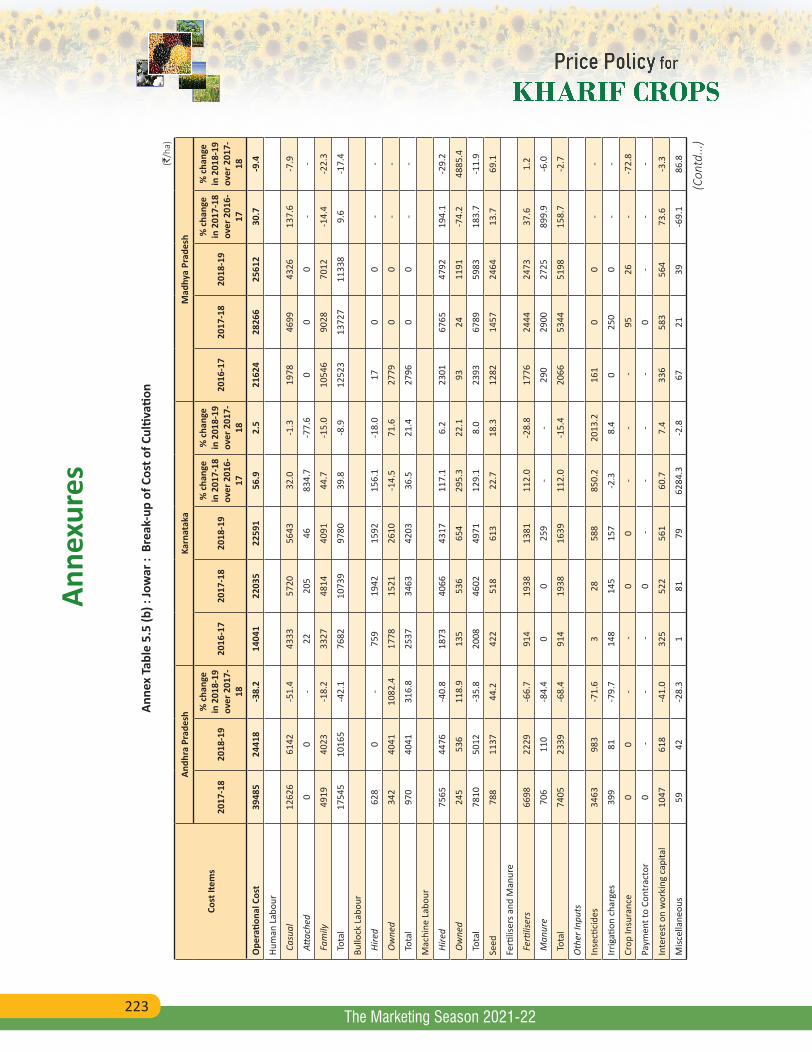
223
Anne
xure
s
The Marketing Season 2021-22
Anne
x Ta
ble
5.5
(b) :
Jow
ar :
Bre
ak-u
p of
Cos
t of C
ultiv
ation
(`/h
a)
Cost
Item
s
Andh
ra P
rade
shKa
rnat
aka
Mad
hya
Prad
esh
2017
-18
2018
-19
% c
hang
e in
201
8-19
ov
er 2
017-
18
2016
-17
2017
-18
2018
-19
% c
hang
e in
201
7-18
ov
er 2
016-
17
% c
hang
e in
201
8-19
ov
er 2
017-
18
2016
-17
2017
-18
2018
-19
% c
hang
e in
201
7-18
ov
er 2
016-
17
% c
hang
e in
201
8-19
ov
er 2
017-
18
Ope
ratio
nal C
ost
3948
524
418
-38.
214
041
2203
522
591
56.9
2.5
2162
428
266
2561
230
.7-9
.4
Hum
an L
abou
r
Cas
ual
1262
661
42-5
1.4
4333
5720
5643
32.0
-1.3
1978
4699
4326
137.
6-7
.9
Atta
ched
00
-22
205
4683
4.7
-77.
60
00
--
Fam
ily49
1940
23-1
8.2
3327
4814
4091
44.7
-15.
010
546
9028
7012
-14.
4-2
2.3
Tot
al17
545
1016
5-4
2.1
7682
1073
997
8039
.8-8
.912
523
1372
711
338
9.6
-17.
4
Bullo
ck L
abou
r
Hire
d62
80
-75
919
4215
9215
6.1
-18.
017
00
--
Ow
ned
342
4041
1082
.417
7815
2126
10-1
4.5
71.6
2779
00
--
Tot
al97
040
4131
6.8
2537
3463
4203
36.5
21.4
2796
00
--
Mac
hine
Lab
our
Hire
d75
6544
76-4
0.8
1873
4066
4317
117.
16.
223
0167
6547
9219
4.1
-29.
2
Ow
ned
245
536
118.
913
553
665
429
5.3
22.1
9324
1191
-74.
248
85.4
Tot
al78
1050
12-3
5.8
2008
4602
4971
129.
18.
023
9367
8959
8318
3.7
-11.
9
Seed
788
1137
44.2
422
518
613
22.7
18.3
1282
1457
2464
13.7
69.1
Ferti
liser
s and
Man
ure
Fer
tilise
rs66
9822
29-6
6.7
914
1938
1381
112.
0-2
8.8
1776
2444
2473
37.6
1.2
Man
ure
706
110
-84.
40
025
9-
-29
029
0027
2589
9.9
-6.0
Tot
al74
0523
39-6
8.4
914
1938
1639
112.
0-1
5.4
2066
5344
5198
158.
7-2
.7
Oth
er In
puts
Inse
ctici
des
3463
983
-71.
63
2858
885
0.2
2013
.216
10
0-
-
Irrig
ation
cha
rges
399
81-7
9.7
148
145
157
-2.3
8.4
025
00
--
Crop
Insu
ranc
e0
0-
-0
0-
- -
9526
--7
2.8
Paym
ent t
o Co
ntra
ctor
0 -
- -
0 -
--
-0
--
-
Inte
rest
on
wor
king
cap
ital
1047
618
-41.
032
552
256
160
.77.
433
658
356
473
.6-3
.3
Misc
ella
neou
s59
42-2
8.3
181
7962
84.3
-2.8
6721
39-6
9.1
86.8
(Con
td...
)
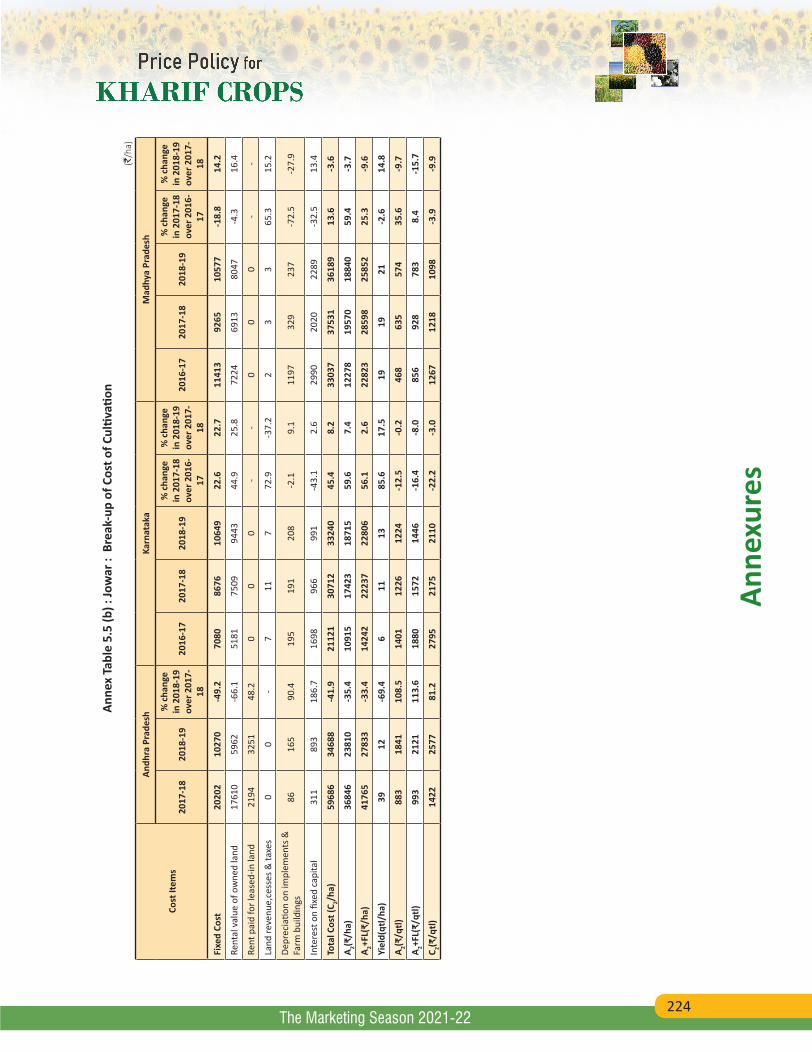
224
Anne
xure
s
The Marketing Season 2021-22
Anne
x Ta
ble
5.5
(b) :
Jow
ar :
Bre
ak-u
p of
Cos
t of C
ultiv
ation
(`/h
a)
Cost
Item
s
Andh
ra P
rade
shKa
rnat
aka
Mad
hya
Prad
esh
2017
-18
2018
-19
% c
hang
e in
201
8-19
ov
er 2
017-
18
2016
-17
2017
-18
2018
-19
% c
hang
e in
201
7-18
ov
er 2
016-
17
% c
hang
e in
201
8-19
ov
er 2
017-
18
2016
-17
2017
-18
2018
-19
% c
hang
e in
201
7-18
ov
er 2
016-
17
% c
hang
e in
201
8-19
ov
er 2
017-
18
Fixe
d Co
st20
202
1027
0-4
9.2
7080
8676
1064
922
.622
.711
413
9265
1057
7-1
8.8
14.2
Rent
al v
alue
of o
wne
d la
nd17
610
5962
-66.
151
8175
0994
4344
.925
.872
2469
1380
47-4
.316
.4
Rent
pai
d fo
r lea
sed-
in la
nd21
9432
5148
.20
00
--
00
0-
-
Land
reve
nue,
cess
es &
taxe
s0
0-
711
772
.9-3
7.2
23
365
.315
.2
Depr
ecia
tion
on im
plem
ents
&
Farm
bui
ldin
gs86
165
90.4
195
191
208
-2.1
9.1
1197
329
237
-72.
5-2
7.9
Inte
rest
on
fixed
cap
ital
311
893
186.
716
9896
699
1-4
3.1
2.6
2990
2020
2289
-32.
513
.4
Tota
l Cos
t (C 2/h
a)59
686
3468
8-4
1.9
2112
130
712
3324
045
.48.
233
037
3753
136
189
13.6
-3.6
A 2(₹/h
a)36
846
2381
0-3
5.4
1091
517
423
1871
559
.67.
412
278
1957
018
840
59.4
-3.7
A 2+FL(
₹/ha
)41
765
2783
3-3
3.4
1424
222
237
2280
656
.12.
622
823
2859
825
852
25.3
-9.6
Yiel
d(qt
l/ha
)39
12-6
9.4
611
1385
.617
.519
1921
-2.6
14.8
A 2(₹/q
tl)88
318
4110
8.5
1401
1226
1224
-12.
5-0
.246
863
557
435
.6-9
.7
A 2+FL(
₹/qt
l)99
321
2111
3.6
1880
1572
1446
-16.
4-8
.085
692
878
38.
4-1
5.7
C 2(₹/q
tl)14
2225
7781
.227
9521
7521
10-2
2.2
-3.0
1267
1218
1098
-3.9
-9.9
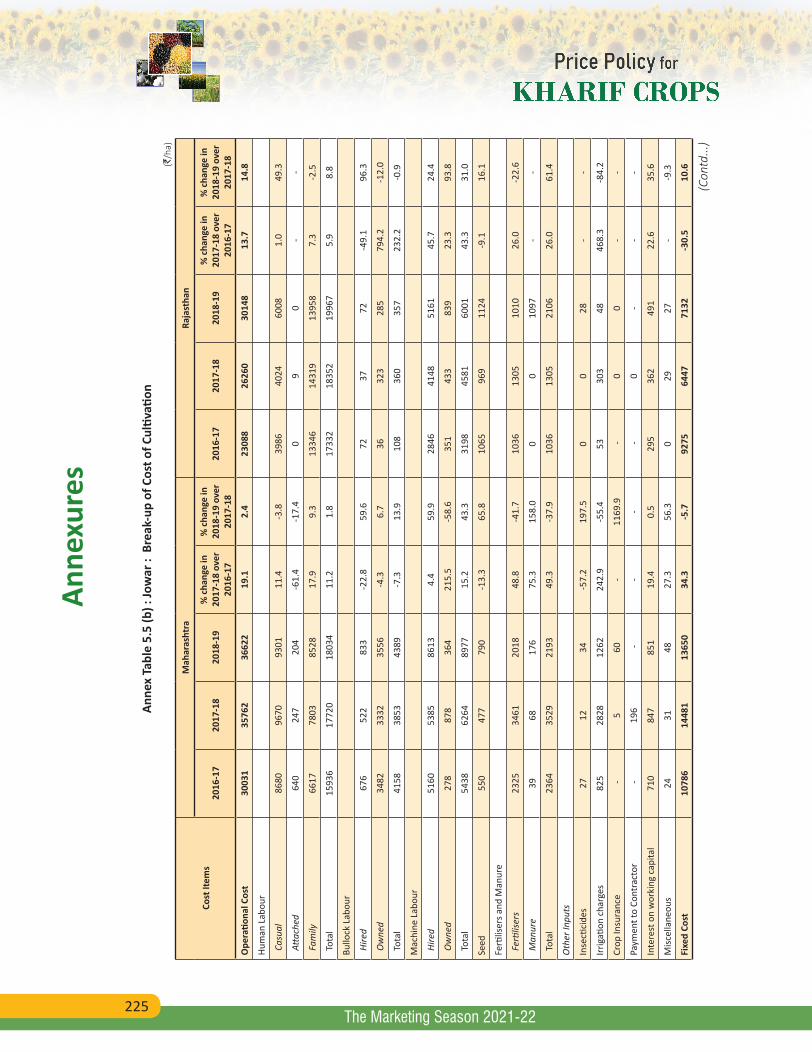
225
Anne
xure
s
The Marketing Season 2021-22
Anne
x Ta
ble
5.5
(b) :
Jow
ar :
Bre
ak-u
p of
Cos
t of C
ultiv
ation
(`/h
a)
Cost
Item
s
Mah
aras
htra
Raja
stha
n
2016
-17
2017
-18
2018
-19
% c
hang
e in
20
17-1
8 ov
er
2016
-17
% c
hang
e in
20
18-1
9 ov
er
2017
-18
2016
-17
2017
-18
2018
-19
% c
hang
e in
20
17-1
8 ov
er
2016
-17
% c
hang
e in
20
18-1
9 ov
er
2017
-18
Ope
ratio
nal C
ost
3003
135
762
3662
219
.12.
423
088
2626
030
148
13.7
14.8
Hum
an L
abou
r
Cas
ual
8680
9670
9301
11.4
-3.8
3986
4024
6008
1.0
49.3
Atta
ched
640
247
204
-61.
4-1
7.4
09
0-
-
Fam
ily66
1778
0385
2817
.99.
313
346
1431
913
958
7.3
-2.5
Tot
al15
936
1772
018
034
11.2
1.8
1733
218
352
1996
75.
98.
8
Bullo
ck L
abou
r
Hire
d67
652
283
3-2
2.8
59.6
7237
72-4
9.1
96.3
Ow
ned
3482
3332
3556
-4.3
6.7
3632
328
579
4.2
-12.
0
Tot
al41
5838
5343
89-7
.313
.910
836
035
723
2.2
-0.9
Mac
hine
Lab
our
Hire
d51
6053
8586
134.
459
.928
4641
4851
6145
.724
.4
Ow
ned
278
878
364
215.
5-5
8.6
351
433
839
23.3
93.8
Tot
al54
3862
6489
7715
.243
.331
9845
8160
0143
.331
.0
Seed
550
477
790
-13.
365
.810
6596
911
24-9
.116
.1
Ferti
liser
s and
Man
ure
Fer
tilise
rs23
2534
6120
1848
.8-4
1.7
1036
1305
1010
26.0
-22.
6
Man
ure
3968
176
75.3
158.
00
010
97-
-
Tot
al23
6435
2921
9349
.3-3
7.9
1036
1305
2106
26.0
61.4
Oth
er In
puts
Inse
ctici
des
2712
34-5
7.2
197.
50
028
--
Irrig
ation
cha
rges
825
2828
1262
242.
9-5
5.4
5330
348
468.
3-8
4.2
Crop
Insu
ranc
e -
560
-11
69.9
-0
0-
-
Paym
ent t
o Co
ntra
ctor
-19
6 -
--
-0
--
-
Inte
rest
on
wor
king
cap
ital
710
847
851
19.4
0.5
295
362
491
22.6
35.6
Misc
ella
neou
s24
3148
27.3
56.3
029
27-
-9.3
Fixe
d Co
st10
786
1448
113
650
34.3
-5.7
9275
6447
7132
-30.
510
.6
(Con
td...
)

226
Anne
xure
s
The Marketing Season 2021-22
Anne
x Ta
ble
5.5
(b) :
Jow
ar :
Bre
ak-u
p of
Cos
t of C
ultiv
ation
(`/h
a)
Cost
Item
s
Mah
aras
htra
Raja
stha
n
2016
-17
2017
-18
2018
-19
% c
hang
e in
20
17-1
8 ov
er
2016
-17
% c
hang
e in
20
18-1
9 ov
er
2017
-18
2016
-17
2017
-18
2018
-19
% c
hang
e in
20
17-1
8 ov
er
2016
-17
% c
hang
e in
20
18-1
9 ov
er
2017
-18
Rent
al v
alue
of o
wne
d la
nd64
9966
8383
932.
825
.649
5747
7052
72-3
.810
.5
Rent
pai
d fo
r lea
sed-
in la
nd0
00
--
00
0-
-
Land
reve
nue,
cess
es &
taxe
s28
3848
37.1
24.9
109
6-1
2.7
-32.
0
Depr
ecia
tion
on im
plem
ents
&
Farm
bui
ldin
gs61
270
756
415
.4-2
0.2
534
308
304
-42.
4-1
.2
Inte
rest
on
fixed
cap
ital
3647
7053
4645
93.4
-34.
137
7413
6015
49-6
4.0
13.9
Tota
l Cos
t (C 2/h
a)40
818
5024
250
272
23.1
0.1
3236
332
707
3728
01.
114
.0
A 2(₹/h
a)24
055
2870
428
706
19.3
0.0
1028
612
258
1650
019
.234
.6
A 2+FL(
₹/ha
)30
671
3650
737
234
19.0
2.0
2363
226
577
3045
812
.514
.6
Yiel
d(qt
l/ha
)12
1111
-7.9
-4.8
96
8-3
2.2
33.0
A 2(₹/q
tl)12
1414
0015
1515
.38.
256
285
089
451
.35.
2
A 2+FL(
₹/qt
l)15
3918
1619
9218
.09.
712
9217
2016
3233
.1-5
.1
C 2(₹/q
tl)20
3824
5326
9920
.410
.017
8321
3620
2019
.8-5
.4
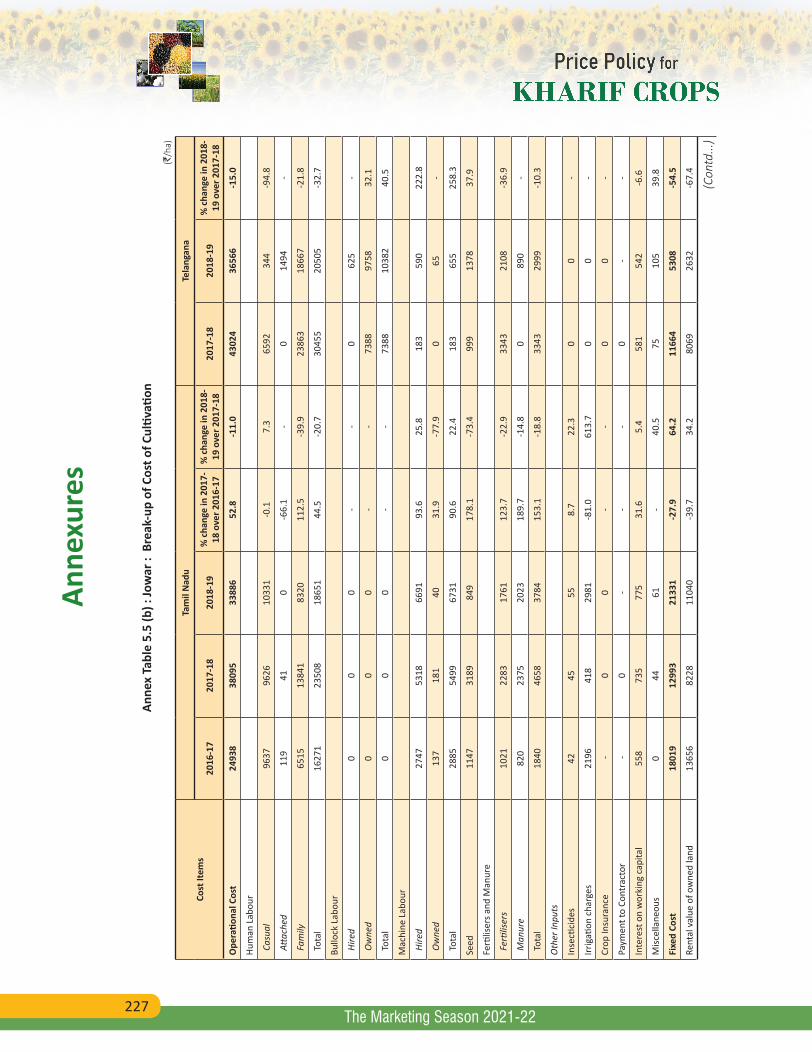
227
Anne
xure
s
The Marketing Season 2021-22
Anne
x Ta
ble
5.5
(b) :
Jow
ar :
Bre
ak-u
p of
Cos
t of C
ultiv
ation
(`/h
a)
Cost
Item
sTa
mil
Nad
uTe
lang
ana
2016
-17
2017
-18
2018
-19
% c
hang
e in
201
7-18
ove
r 201
6-17
% c
hang
e in
201
8-19
ove
r 201
7-18
2017
-18
2018
-19
% c
hang
e in
201
8-19
ove
r 201
7-18
Ope
ratio
nal C
ost
2493
838
095
3388
652
.8-1
1.0
4302
436
566
-15.
0
Hum
an L
abou
r
Cas
ual
9637
9626
1033
1-0
.17.
365
9234
4-9
4.8
Atta
ched
119
410
-66.
1-
014
94-
Fam
ily65
1513
841
8320
112.
5-3
9.9
2386
318
667
-21.
8
Tot
al16
271
2350
818
651
44.5
-20.
730
455
2050
5-3
2.7
Bullo
ck L
abou
r
Hire
d0
00
--
062
5-
Ow
ned
00
0-
-73
8897
5832
.1
Tot
al0
00
--
7388
1038
240
.5
Mac
hine
Lab
our
Hire
d27
4753
1866
9193
.625
.818
359
022
2.8
Ow
ned
137
181
4031
.9-7
7.9
065
-
Tot
al28
8554
9967
3190
.622
.418
365
525
8.3
Seed
1147
3189
849
178.
1-7
3.4
999
1378
37.9
Ferti
liser
s and
Man
ure
Fer
tilise
rs10
2122
8317
6112
3.7
-22.
933
4321
08-3
6.9
Man
ure
820
2375
2023
189.
7-1
4.8
089
0-
Tot
al18
4046
5837
8415
3.1
-18.
833
4329
99-1
0.3
Oth
er In
puts
Inse
ctici
des
4245
558.
722
.30
0-
Irrig
ation
cha
rges
2196
418
2981
-81.
061
3.7
00
-
Crop
Insu
ranc
e -
00
--
00
-
Paym
ent t
o Co
ntra
ctor
-0
--
-0
--
Inte
rest
on
wor
king
cap
ital
558
735
775
31.6
5.4
581
542
-6.6
Misc
ella
neou
s0
4461
-40
.575
105
39.8
Fixe
d Co
st18
019
1299
321
331
-27.
964
.211
664
5308
-54.
5
Rent
al v
alue
of o
wne
d la
nd13
656
8228
1104
0-3
9.7
34.2
8069
2632
-67.
4
(Con
td...
)
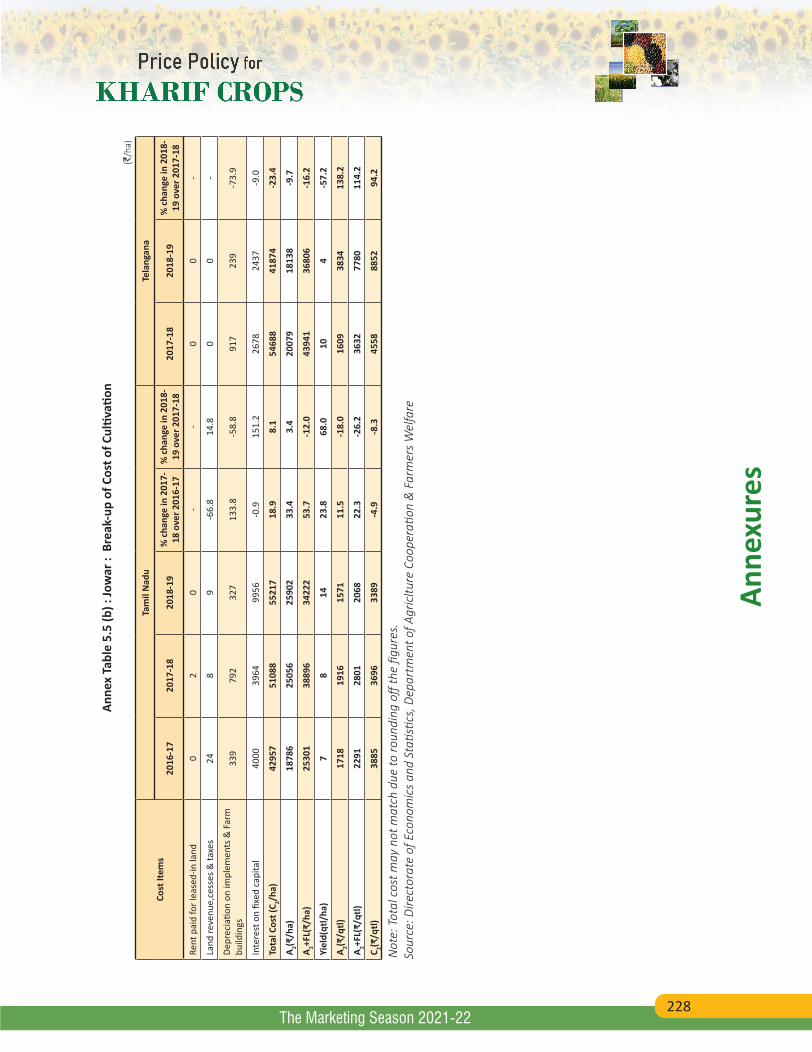
228
Anne
xure
s
The Marketing Season 2021-22
Anne
x Ta
ble
5.5
(b) :
Jow
ar :
Bre
ak-u
p of
Cos
t of C
ultiv
ation
(`/h
a)
Cost
Item
sTa
mil
Nad
uTe
lang
ana
2016
-17
2017
-18
2018
-19
% c
hang
e in
201
7-18
ove
r 201
6-17
% c
hang
e in
201
8-19
ove
r 201
7-18
2017
-18
2018
-19
% c
hang
e in
201
8-19
ove
r 201
7-18
Rent
pai
d fo
r lea
sed-
in la
nd0
20
--
00
-
Land
reve
nue,
cess
es &
taxe
s24
89
-66.
814
.80
0-
Depr
ecia
tion
on im
plem
ents
& F
arm
bu
ildin
gs33
979
232
713
3.8
-58.
891
723
9-7
3.9
Inte
rest
on
fixed
cap
ital
4000
3964
9956
-0.9
151.
226
7824
37-9
.0
Tota
l Cos
t (C 2/h
a)42
957
5108
855
217
18.9
8.1
5468
841
874
-23.
4
A 2(₹/h
a)18
786
2505
625
902
33.4
3.4
2007
918
138
-9.7
A 2+FL(
₹/ha
)25
301
3889
634
222
53.7
-12.
043
941
3680
6-1
6.2
Yiel
d(qt
l/ha
)7
814
23.8
68.0
104
-57.
2
A 2(₹/q
tl)17
1819
1615
7111
.5-1
8.0
1609
3834
138.
2
A 2+FL(
₹/qt
l)22
9128
0120
6822
.3-2
6.2
3632
7780
114.
2
C 2(₹/q
tl)38
8536
9633
89-4
.9-8
.345
5888
5294
.2
Not
e: T
otal
cos
t may
not
mat
ch d
ue to
roun
ding
off
the
figur
es.
Sour
ce: D
irect
orat
e of
Eco
nom
ics
and
Stati
stics
, Dep
artm
ent o
f Agr
icltu
re C
oope
ratio
n &
Far
mer
s W
elfa
re
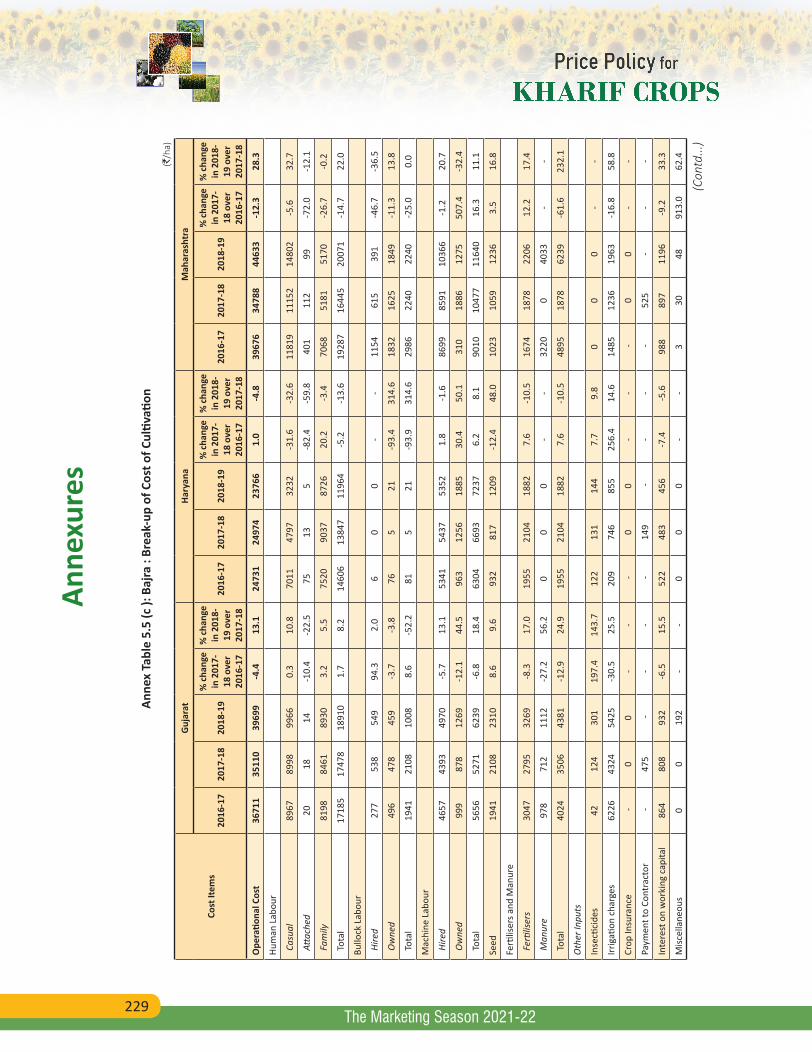
229
Anne
xure
s
The Marketing Season 2021-22
Anne
x Ta
ble
5.5
(c ):
Baj
ra :
Brea
k-up
of C
ost o
f Cul
tivati
on (`
/ha)
Cost
Item
s
Guj
arat
Hary
ana
Mah
aras
htra
2016
-17
2017
-18
2018
-19
% ch
ange
in
201
7-18
ove
r 20
16-1
7
% ch
ange
in
201
8-19
ove
r 20
17-1
8
2016
-17
2017
-18
2018
-19
% ch
ange
in
201
7-18
ove
r 20
16-1
7
% ch
ange
in
201
8-19
ove
r 20
17-1
8
2016
-17
2017
-18
2018
-19
% ch
ange
in
201
7-18
ove
r 20
16-1
7
% ch
ange
in
201
8-19
ove
r 20
17-1
8
Ope
ratio
nal C
ost
3671
135
110
3969
9-4
.413
.124
731
2497
423
766
1.0
-4.8
3967
634
788
4463
3-1
2.3
28.3
Hum
an L
abou
r
Cas
ual
8967
8998
9966
0.3
10.8
7011
4797
3232
-31.
6-3
2.6
1181
911
152
1480
2-5
.632
.7
Atta
ched
2018
14-1
0.4
-22.
575
135
-82.
4-5
9.8
401
112
99-7
2.0
-12.
1
Fam
ily81
9884
6189
303.
25.
575
2090
3787
2620
.2-3
.470
6851
8151
70-2
6.7
-0.2
Tot
al17
185
1747
818
910
1.7
8.2
1460
613
847
1196
4-5
.2-1
3.6
1928
716
445
2007
1-1
4.7
22.0
Bullo
ck L
abou
r
Hire
d27
753
854
994
.32.
06
00
--
1154
615
391
-46.
7-3
6.5
Ow
ned
496
478
459
-3.7
-3.8
765
21-9
3.4
314.
618
3216
2518
49-1
1.3
13.8
Tot
al19
4121
0810
088.
6-5
2.2
815
21-9
3.9
314.
629
8622
4022
40-2
5.0
0.0
Mac
hine
Lab
our
Hire
d46
5743
9349
70-5
.713
.153
4154
3753
521.
8-1
.686
9985
9110
366
-1.2
20.7
Ow
ned
999
878
1269
-12.
144
.596
312
5618
8530
.450
.131
018
8612
7550
7.4
-32.
4
Tot
al56
5652
7162
39-6
.818
.463
0466
9372
376.
28.
190
1010
477
1164
016
.311
.1
Seed
1941
2108
2310
8.6
9.6
932
817
1209
-12.
448
.010
2310
5912
363.
516
.8
Ferti
liser
s and
Man
ure
Fer
tilise
rs30
4727
9532
69-8
.317
.019
5521
0418
827.
6-1
0.5
1674
1878
2206
12.2
17.4
Man
ure
978
712
1112
-27.
256
.20
00
--
3220
040
33-
-
Tot
al40
2435
0643
81-1
2.9
24.9
1955
2104
1882
7.6
-10.
548
9518
7862
39-6
1.6
232.
1
Oth
er In
puts
Inse
ctici
des
4212
430
119
7.4
143.
712
213
114
47.
79.
80
00
--
Irrig
ation
cha
rges
6226
4324
5425
-30.
525
.520
974
685
525
6.4
14.6
1485
1236
1963
-16.
858
.8
Crop
Insu
ranc
e -
00
--
-0
0-
- -
00
--
Paym
ent t
o Co
ntra
ctor
-47
5 -
--
-14
9 -
--
-52
5-
--
Inte
rest
on
wor
king
cap
ital
864
808
932
-6.5
15.5
522
483
456
-7.4
-5.6
988
897
1196
-9.2
33.3
Misc
ella
neou
s0
019
2-
-0
00
--
330
4891
3.0
62.4
(Con
td...
)
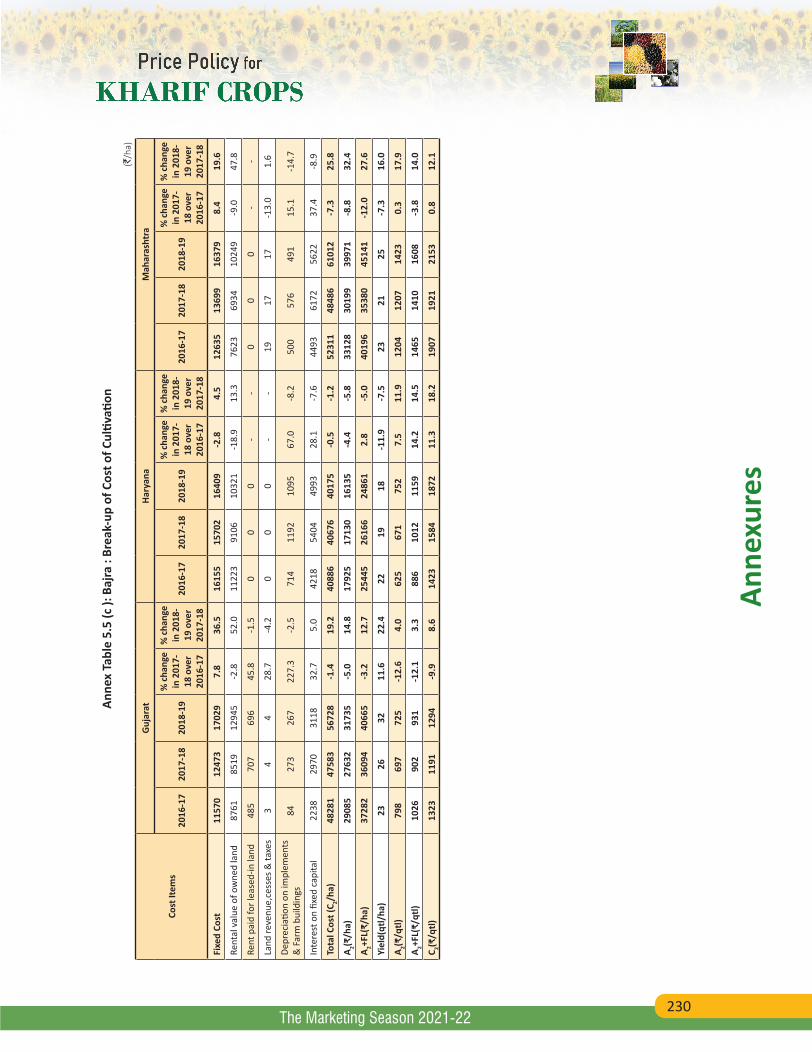
230
Anne
xure
s
The Marketing Season 2021-22
Anne
x Ta
ble
5.5
(c ):
Baj
ra :
Brea
k-up
of C
ost o
f Cul
tivati
on (`
/ha)
Cost
Item
s
Guj
arat
Hary
ana
Mah
aras
htra
2016
-17
2017
-18
2018
-19
% ch
ange
in
201
7-18
ove
r 20
16-1
7
% ch
ange
in
201
8-19
ove
r 20
17-1
8
2016
-17
2017
-18
2018
-19
% ch
ange
in
201
7-18
ove
r 20
16-1
7
% ch
ange
in
201
8-19
ove
r 20
17-1
8
2016
-17
2017
-18
2018
-19
% ch
ange
in
201
7-18
ove
r 20
16-1
7
% ch
ange
in
201
8-19
ove
r 20
17-1
8
Fixe
d Co
st11
570
1247
317
029
7.8
36.5
1615
515
702
1640
9-2
.84.
512
635
1369
916
379
8.4
19.6
Rent
al v
alue
of o
wne
d la
nd87
6185
1912
945
-2.8
52.0
1122
391
0610
321
-18.
913
.376
2369
3410
249
-9.0
47.8
Rent
pai
d fo
r lea
sed-
in la
nd48
570
769
645
.8-1
.50
00
--
00
0-
-
Land
reve
nue,
cess
es &
taxe
s3
44
28.7
-4.2
00
0-
-19
1717
-13.
01.
6
Depr
ecia
tion
on im
plem
ents
&
Far
m b
uild
ings
8427
326
722
7.3
-2.5
714
1192
1095
67.0
-8.2
500
576
491
15.1
-14.
7
Inte
rest
on
fixed
cap
ital
2238
2970
3118
32.7
5.0
4218
5404
4993
28.1
-7.6
4493
6172
5622
37.4
-8.9
Tota
l Cos
t (C 2/h
a)48
281
4758
356
728
-1.4
19.2
4088
640
676
4017
5-0
.5-1
.252
311
4848
661
012
-7.3
25.8
A 2(₹/h
a)29
085
2763
231
735
-5.0
14.8
1792
517
130
1613
5-4
.4-5
.833
128
3019
939
971
-8.8
32.4
A 2+FL(
₹/ha
)37
282
3609
440
665
-3.2
12.7
2544
526
166
2486
12.
8-5
.040
196
3538
045
141
-12.
027
.6
Yiel
d(qt
l/ha
)23
2632
11.6
22.4
2219
18-1
1.9
-7.5
2321
25-7
.316
.0
A 2(₹/q
tl)79
869
772
5-1
2.6
4.0
625
671
752
7.5
11.9
1204
1207
1423
0.3
17.9
A 2+FL(
₹/qt
l)10
2690
293
1-1
2.1
3.3
886
1012
1159
14.2
14.5
1465
1410
1608
-3.8
14.0
C 2(₹/q
tl)13
2311
9112
94-9
.98.
614
2315
8418
7211
.318
.219
0719
2121
530.
812
.1
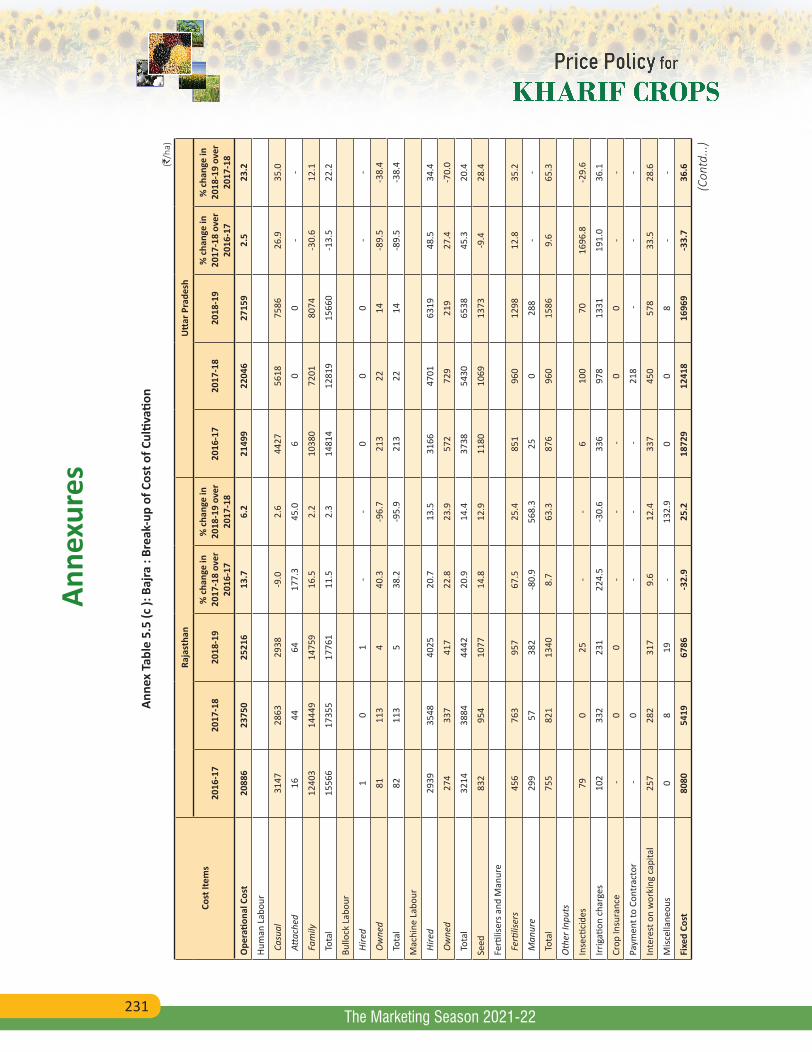
231
Anne
xure
s
The Marketing Season 2021-22
Anne
x Ta
ble
5.5
(c ):
Baj
ra :
Brea
k-up
of C
ost o
f Cul
tivati
on (`
/ha)
Cost
Item
s
Raja
stha
nU
ttar
Pra
desh
2016
-17
2017
-18
2018
-19
% c
hang
e in
20
17-1
8 ov
er
2016
-17
% c
hang
e in
20
18-1
9 ov
er
2017
-18
2016
-17
2017
-18
2018
-19
% c
hang
e in
20
17-1
8 ov
er
2016
-17
% c
hang
e in
20
18-1
9 ov
er
2017
-18
Ope
ratio
nal C
ost
2088
623
750
2521
613
.76.
221
499
2204
627
159
2.5
23.2
Hum
an L
abou
r
Cas
ual
3147
2863
2938
-9.0
2.6
4427
5618
7586
26.9
35.0
Atta
ched
1644
6417
7.3
45.0
60
0-
-
Fam
ily12
403
1444
914
759
16.5
2.2
1038
072
0180
74-3
0.6
12.1
Tot
al15
566
1735
517
761
11.5
2.3
1481
412
819
1566
0-1
3.5
22.2
Bullo
ck L
abou
r
Hire
d1
01
--
00
0-
-
Ow
ned
8111
34
40.3
-96.
721
322
14-8
9.5
-38.
4
Tot
al82
113
538
.2-9
5.9
213
2214
-89.
5-3
8.4
Mac
hine
Lab
our
Hire
d29
3935
4840
2520
.713
.531
6647
0163
1948
.534
.4
Ow
ned
274
337
417
22.8
23.9
572
729
219
27.4
-70.
0
Tot
al32
1438
8444
4220
.914
.437
3854
3065
3845
.320
.4
Seed
832
954
1077
14.8
12.9
1180
1069
1373
-9.4
28.4
Ferti
liser
s and
Man
ure
Fer
tilise
rs45
676
395
767
.525
.485
196
012
9812
.835
.2
Man
ure
299
5738
2-8
0.9
568.
325
028
8-
-
Tot
al75
582
113
408.
763
.387
696
015
869.
665
.3
Oth
er In
puts
Inse
ctici
des
790
25-
-6
100
7016
96.8
-29.
6
Irrig
ation
cha
rges
102
332
231
224.
5-3
0.6
336
978
1331
191.
036
.1
Crop
Insu
ranc
e -
00
--
-0
0-
-
Paym
ent t
o Co
ntra
ctor
-0
--
-21
8 -
--
Inte
rest
on
wor
king
cap
ital
257
282
317
9.6
12.4
337
450
578
33.5
28.6
Misc
ella
neou
s0
819
-13
2.9
00
8-
-
Fixe
d Co
st80
8054
1967
86-3
2.9
25.2
1872
912
418
1696
9-3
3.7
36.6
(Con
td...
)
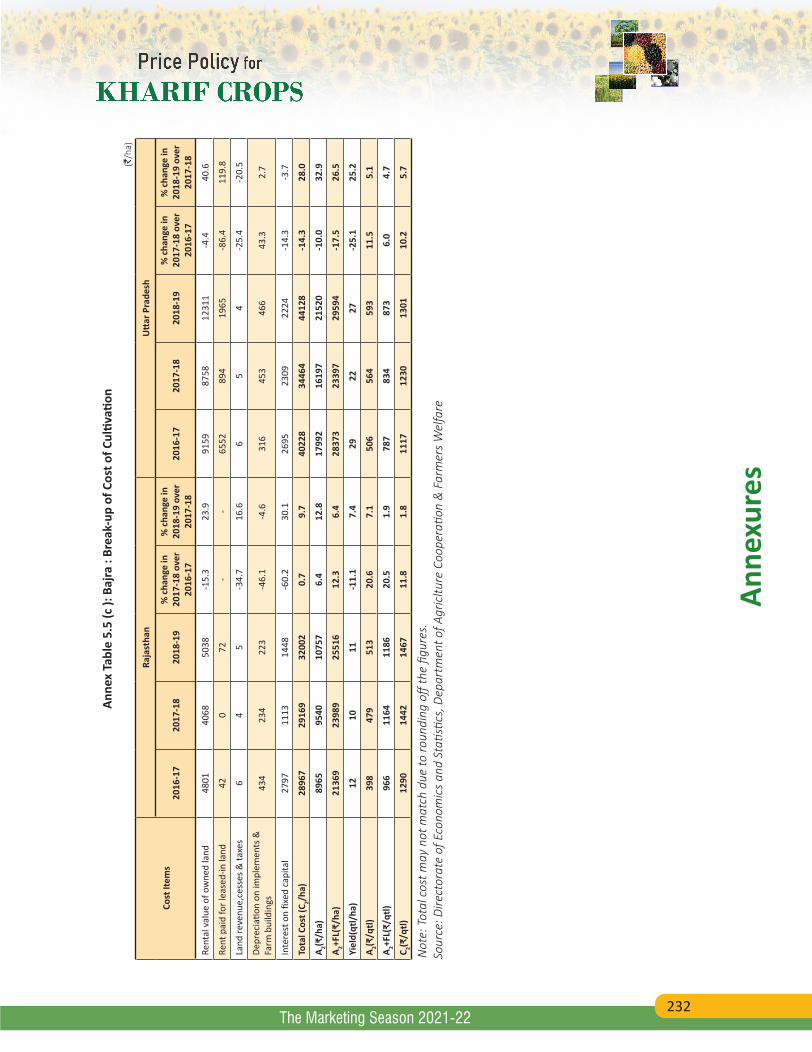
232
Anne
xure
s
The Marketing Season 2021-22
Anne
x Ta
ble
5.5
(c ):
Baj
ra :
Brea
k-up
of C
ost o
f Cul
tivati
on (`
/ha)
Cost
Item
s
Raja
stha
nU
ttar
Pra
desh
2016
-17
2017
-18
2018
-19
% c
hang
e in
20
17-1
8 ov
er
2016
-17
% c
hang
e in
20
18-1
9 ov
er
2017
-18
2016
-17
2017
-18
2018
-19
% c
hang
e in
20
17-1
8 ov
er
2016
-17
% c
hang
e in
20
18-1
9 ov
er
2017
-18
Rent
al v
alue
of o
wne
d la
nd48
0140
6850
38-1
5.3
23.9
9159
8758
1231
1-4
.440
.6
Rent
pai
d fo
r lea
sed-
in la
nd42
072
--
6552
894
1965
-86.
411
9.8
Land
reve
nue,
cess
es &
taxe
s6
45
-34.
716
.66
54
-25.
4-2
0.5
Depr
ecia
tion
on im
plem
ents
&
Farm
bui
ldin
gs43
423
422
3-4
6.1
-4.6
316
453
466
43.3
2.7
Inte
rest
on
fixed
cap
ital
2797
1113
1448
-60.
230
.126
9523
0922
24-1
4.3
-3.7
Tota
l Cos
t (C 2/h
a)28
967
2916
932
002
0.7
9.7
4022
834
464
4412
8-1
4.3
28.0
A 2(₹/h
a)89
6595
4010
757
6.4
12.8
1799
216
197
2152
0-1
0.0
32.9
A 2+FL(
₹/ha
)21
369
2398
925
516
12.3
6.4
2837
323
397
2959
4-1
7.5
26.5
Yiel
d(qt
l/ha
)12
1011
-11.
17.
429
2227
-25.
125
.2
A 2(₹/q
tl)39
847
951
320
.67.
150
656
459
311
.55.
1
A 2+FL(
₹/qt
l)96
611
6411
8620
.51.
978
783
487
36.
04.
7
C 2(₹/q
tl)12
9014
4214
6711
.81.
811
1712
3013
0110
.25.
7
Not
e: T
otal
cos
t may
not
mat
ch d
ue to
roun
ding
off
the
figur
es.
Sour
ce: D
irect
orat
e of
Eco
nom
ics
and
Stati
stics
, Dep
artm
ent o
f Agr
icltu
re C
oope
ratio
n &
Far
mer
s W
elfa
re
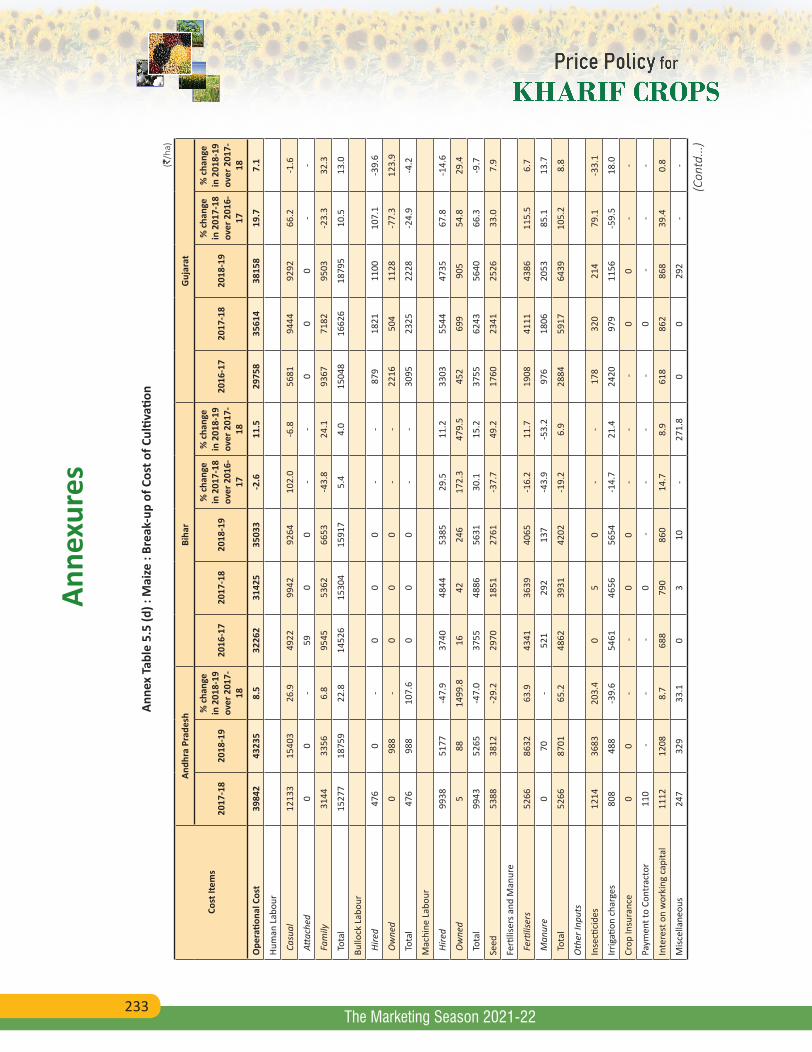
233
Anne
xure
s
The Marketing Season 2021-22
Anne
x Ta
ble
5.5
(d) :
Mai
ze :
Brea
k-up
of C
ost o
f Cul
tivati
on (`
/ha)
Cost
Item
s
Andh
ra P
rade
shBi
har
Guj
arat
2017
-18
2018
-19
% c
hang
e in
201
8-19
ov
er 2
017-
18
2016
-17
2017
-18
2018
-19
% c
hang
e in
201
7-18
ov
er 2
016-
17
% c
hang
e in
201
8-19
ov
er 2
017-
18
2016
-17
2017
-18
2018
-19
% c
hang
e in
201
7-18
ov
er 2
016-
17
% c
hang
e in
201
8-19
ov
er 2
017-
18
Ope
ratio
nal C
ost
3984
243
235
8.5
3226
231
425
3503
3-2
.611
.529
758
3561
438
158
19.7
7.1
Hum
an L
abou
r
Cas
ual
1213
315
403
26.9
4922
9942
9264
102.
0-6
.856
8194
4492
9266
.2-1
.6
Atta
ched
00
-59
00
--
00
0-
-
Fam
ily31
4433
566.
895
4553
6266
53-4
3.8
24.1
9367
7182
9503
-23.
332
.3
Tot
al15
277
1875
922
.814
526
1530
415
917
5.4
4.0
1504
816
626
1879
510
.513
.0
Bullo
ck L
abou
r
Hire
d47
60
-0
00
--
879
1821
1100
107.
1-3
9.6
Ow
ned
098
8-
00
0-
-22
1650
411
28-7
7.3
123.
9
Tot
al47
698
810
7.6
00
0-
-30
9523
2522
28-2
4.9
-4.2
Mac
hine
Lab
our
Hire
d99
3851
77-4
7.9
3740
4844
5385
29.5
11.2
3303
5544
4735
67.8
-14.
6
Ow
ned
588
1499
.816
4224
617
2.3
479.
545
269
990
554
.829
.4
Tot
al99
4352
65-4
7.0
3755
4886
5631
30.1
15.2
3755
6243
5640
66.3
-9.7
Seed
5388
3812
-29.
229
7018
5127
61-3
7.7
49.2
1760
2341
2526
33.0
7.9
Ferti
liser
s and
Man
ure
Fer
tilise
rs52
6686
3263
.943
4136
3940
65-1
6.2
11.7
1908
4111
4386
115.
56.
7
Man
ure
070
-52
129
213
7-4
3.9
-53.
297
618
0620
5385
.113
.7
Tot
al52
6687
0165
.248
6239
3142
02-1
9.2
6.9
2884
5917
6439
105.
28.
8
Oth
er In
puts
Inse
ctici
des
1214
3683
203.
40
50
--
178
320
214
79.1
-33.
1
Irrig
ation
cha
rges
808
488
-39.
654
6146
5656
54-1
4.7
21.4
2420
979
1156
-59.
518
.0
Crop
Insu
ranc
e0
0-
-0
0-
- -
00
--
Paym
ent t
o Co
ntra
ctor
110
--
-0
--
- -
0 -
--
Inte
rest
on
wor
king
cap
ital
1112
1208
8.7
688
790
860
14.7
8.9
618
862
868
39.4
0.8
Misc
ella
neou
s24
732
933
.10
310
-27
1.8
00
292
--
(Con
td...
)

234
Anne
xure
s
The Marketing Season 2021-22
Anne
x Ta
ble
5.5
(d) :
Mai
ze :
Brea
k-up
of C
ost o
f Cul
tivati
on (`
/ha)
Cost
Item
s
Andh
ra P
rade
shBi
har
Guj
arat
2017
-18
2018
-19
% c
hang
e in
201
8-19
ov
er 2
017-
18
2016
-17
2017
-18
2018
-19
% c
hang
e in
201
7-18
ov
er 2
016-
17
% c
hang
e in
201
8-19
ov
er 2
017-
18
2016
-17
2017
-18
2018
-19
% c
hang
e in
201
7-18
ov
er 2
016-
17
% c
hang
e in
201
8-19
ov
er 2
017-
18
Fixe
d Co
st22
146
3351
951
.415
147
1703
917
481
12.5
2.6
1024
270
1799
13-3
1.5
41.3
Rent
al v
alue
of o
wne
d la
nd21
359
2675
625
.312
864
1469
115
647
14.2
6.5
6239
5274
7147
-15.
535
.5
Rent
pai
d fo
r lea
sed-
in la
nd18
259
3931
56.7
00
0-
-12
1559
0-9
5.2
-
Land
reve
nue,
cess
es &
taxe
s0
0-
8111
411
140
.7-2
.67
69
-14.
152
.2
Depr
ecia
tion
on im
plem
ents
&
Farm
bui
ldin
gs79
9520
.155
751
341
6-7
.9-1
8.9
248
171
229
-30.
933
.9
Inte
rest
on
fixed
cap
ital
526
729
38.7
1645
1721
1307
4.6
-24.
125
3315
0825
28-4
0.5
67.6
Tota
l Cos
t (C 2/h
a)61
988
7675
423
.847
409
4846
352
514
2.2
8.4
4000
042
631
4807
26.
612
.8
A 2(₹/h
a)36
959
4591
324
.223
355
2668
928
906
14.3
8.3
2186
128
667
2889
431
.10.
8
A 2+FL(
₹/ha
)40
103
4926
922
.932
900
3205
135
560
-2.6
10.9
3122
835
849
3839
714
.87.
1
Yiel
d(qt
l/ha
)54
42-2
1.6
3640
4011
.8-1
.619
1619
-14.
218
.2
A 2(₹/q
tl)64
910
4060
.354
957
464
34.
512
.092
512
2411
7832
.3-3
.8
A 2+FL(
₹/qt
l)73
011
3255
.279
267
978
4-1
4.3
15.5
1241
1532
1566
23.4
2.3
C 2(₹/q
tl)11
2017
3955
.211
3410
3111
61-9
.112
.715
8718
2119
6014
.87.
6
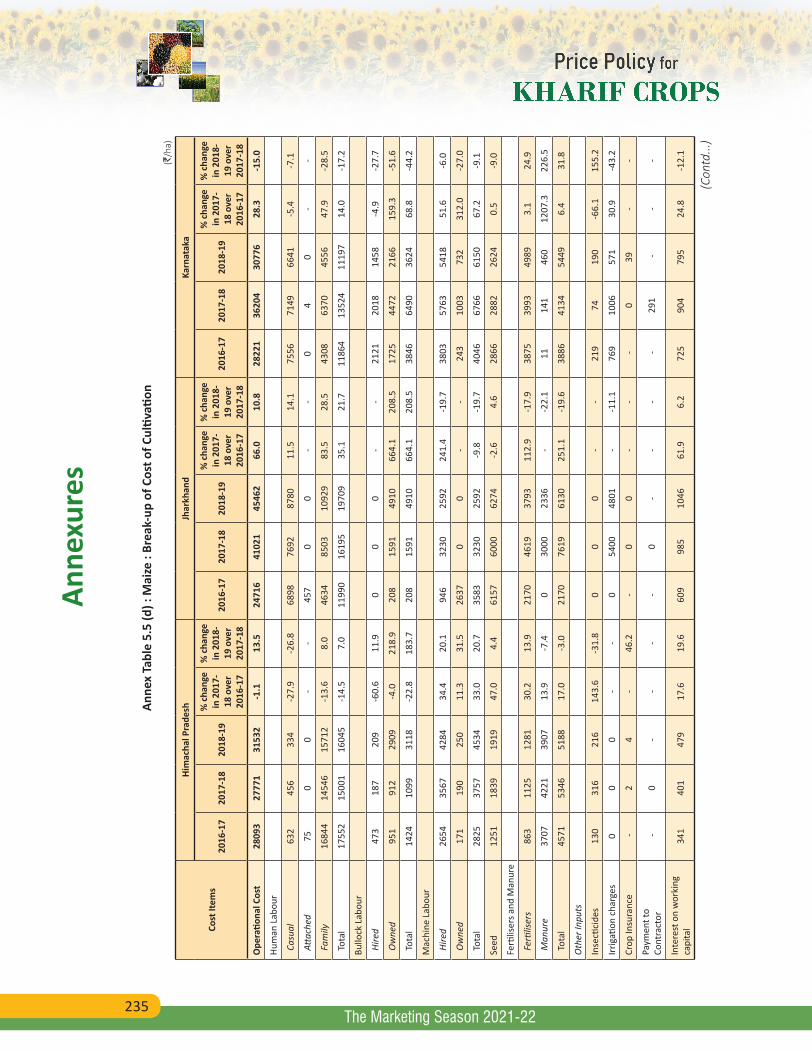
235
Anne
xure
s
The Marketing Season 2021-22
Anne
x Ta
ble
5.5
(d) :
Mai
ze :
Brea
k-up
of C
ost o
f Cul
tivati
on (`
/ha)
Cost
Item
s
Him
acha
l Pra
desh
Jhar
khan
dKa
rnat
aka
2016
-17
2017
-18
2018
-19
% c
hang
e in
201
7-18
ove
r 20
16-1
7
% c
hang
e in
201
8-19
ove
r 20
17-1
8
2016
-17
2017
-18
2018
-19
% c
hang
e in
201
7-18
ove
r 20
16-1
7
% c
hang
e in
201
8-19
ove
r 20
17-1
8
2016
-17
2017
-18
2018
-19
% c
hang
e in
201
7-18
ove
r 20
16-1
7
% c
hang
e in
201
8-19
ove
r 20
17-1
8
Ope
ratio
nal C
ost
2809
327
771
3153
2-1
.113
.524
716
4102
145
462
66.0
10.8
2822
136
204
3077
628
.3-1
5.0
Hum
an L
abou
r
Cas
ual
632
456
334
-27.
9-2
6.8
6898
7692
8780
11.5
14.1
7556
7149
6641
-5.4
-7.1
Atta
ched
750
0-
-45
70
0-
-0
40
--
Fam
ily16
844
1454
615
712
-13.
68.
046
3485
0310
929
83.5
28.5
4308
6370
4556
47.9
-28.
5
Tot
al17
552
1500
116
045
-14.
57.
011
990
1619
519
709
35.1
21.7
1186
413
524
1119
714
.0-1
7.2
Bullo
ck L
abou
r
Hire
d47
318
720
9-6
0.6
11.9
00
0-
-21
2120
1814
58-4
.9-2
7.7
Ow
ned
951
912
2909
-4.0
218.
920
815
9149
1066
4.1
208.
517
2544
7221
6615
9.3
-51.
6
Tot
al14
2410
9931
18-2
2.8
183.
720
815
9149
1066
4.1
208.
538
4664
9036
2468
.8-4
4.2
Mac
hine
Lab
our
Hire
d26
5435
6742
8434
.420
.194
632
3025
9224
1.4
-19.
738
0357
6354
1851
.6-6
.0
Ow
ned
171
190
250
11.3
31.5
2637
00
--
243
1003
732
312.
0-2
7.0
Tot
al28
2537
5745
3433
.020
.735
8332
3025
92-9
.8-1
9.7
4046
6766
6150
67.2
-9.1
Seed
1251
1839
1919
47.0
4.4
6157
6000
6274
-2.6
4.6
2866
2882
2624
0.5
-9.0
Ferti
liser
s and
Man
ure
Fer
tilise
rs86
311
2512
8130
.213
.921
7046
1937
9311
2.9
-17.
938
7539
9349
893.
124
.9
Man
ure
3707
4221
3907
13.9
-7.4
030
0023
36-
-22.
111
141
460
1207
.322
6.5
Tot
al45
7153
4651
8817
.0-3
.021
7076
1961
3025
1.1
-19.
638
8641
3454
496.
431
.8
Oth
er In
puts
Inse
ctici
des
130
316
216
143.
6-3
1.8
00
0-
-21
974
190
-66.
115
5.2
Irrig
ation
cha
rges
00
0-
-0
5400
4801
--1
1.1
769
1006
571
30.9
-43.
2
Crop
Insu
ranc
e -
24
-46
.2-
00
--
-0
39-
-
Paym
ent t
o Co
ntra
ctor
-0
--
--
0-
--
-29
1 -
--
Inte
rest
on
wor
king
ca
pita
l34
140
147
917
.619
.660
998
510
4661
.96.
272
590
479
524
.8-1
2.1
(Con
td...
)
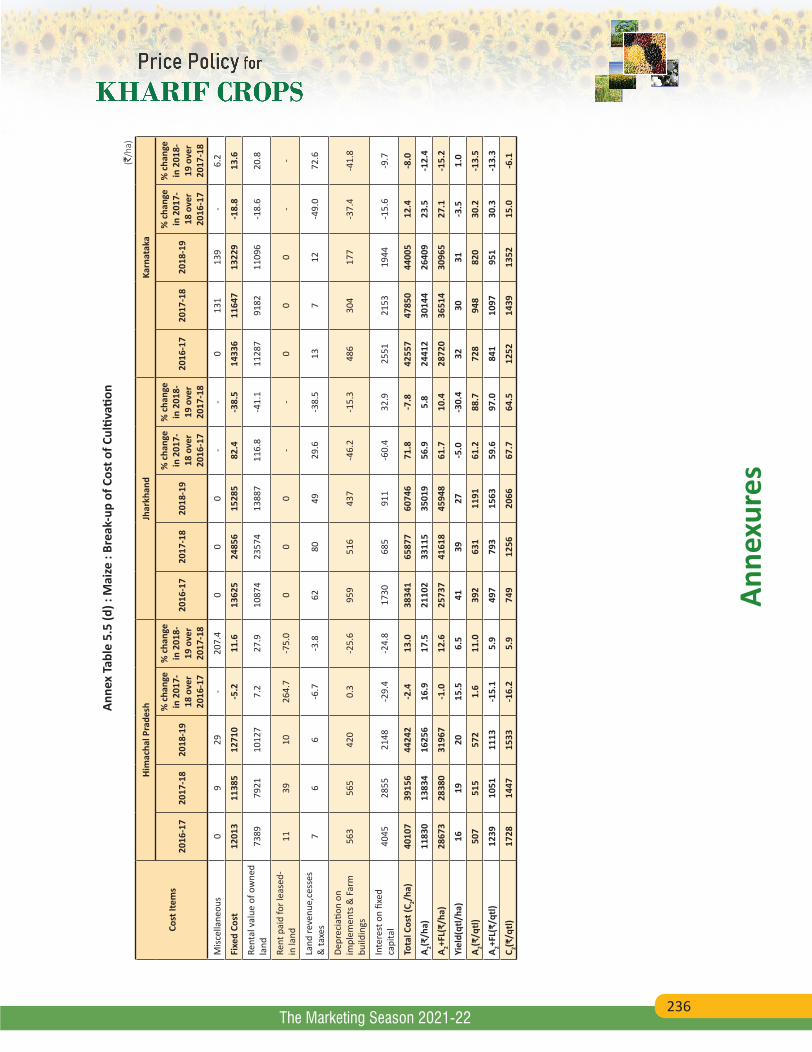
236
Anne
xure
s
The Marketing Season 2021-22
Anne
x Ta
ble
5.5
(d) :
Mai
ze :
Brea
k-up
of C
ost o
f Cul
tivati
on (`
/ha)
Cost
Item
s
Him
acha
l Pra
desh
Jhar
khan
dKa
rnat
aka
2016
-17
2017
-18
2018
-19
% c
hang
e in
201
7-18
ove
r 20
16-1
7
% c
hang
e in
201
8-19
ove
r 20
17-1
8
2016
-17
2017
-18
2018
-19
% c
hang
e in
201
7-18
ove
r 20
16-1
7
% c
hang
e in
201
8-19
ove
r 20
17-1
8
2016
-17
2017
-18
2018
-19
% c
hang
e in
201
7-18
ove
r 20
16-1
7
% c
hang
e in
201
8-19
ove
r 20
17-1
8
Misc
ella
neou
s0
929
-20
7.4
00
0-
-0
131
139
-6.
2
Fixe
d Co
st12
013
1138
512
710
-5.2
11.6
1362
524
856
1528
582
.4-3
8.5
1433
611
647
1322
9-1
8.8
13.6
Rent
al v
alue
of o
wne
d la
nd73
8979
2110
127
7.2
27.9
1087
423
574
1388
711
6.8
-41.
111
287
9182
1109
6-1
8.6
20.8
Rent
pai
d fo
r lea
sed-
in la
nd11
3910
264.
7-7
5.0
00
0-
-0
00
--
Land
reve
nue,
cess
es
& ta
xes
76
6-6
.7-3
.862
8049
29.6
-38.
513
712
-49.
072
.6
Depr
ecia
tion
on
impl
emen
ts &
Far
m
build
ings
563
565
420
0.3
-25.
695
951
643
7-4
6.2
-15.
348
630
417
7-3
7.4
-41.
8
Inte
rest
on
fixed
ca
pita
l40
4528
5521
48-2
9.4
-24.
817
3068
591
1-6
0.4
32.9
2551
2153
1944
-15.
6-9
.7
Tota
l Cos
t (C 2/h
a)40
107
3915
644
242
-2.4
13.0
3834
165
877
6074
671
.8-7
.842
557
4785
044
005
12.4
-8.0
A 2(₹/h
a)11
830
1383
416
256
16.9
17.5
2110
233
115
3501
956
.95.
824
412
3014
426
409
23.5
-12.
4
A 2+FL(
₹/ha
)28
673
2838
031
967
-1.0
12.6
2573
741
618
4594
861
.710
.428
720
3651
430
965
27.1
-15.
2
Yiel
d(qt
l/ha
)16
1920
15.5
6.5
4139
27-5
.0-3
0.4
3230
31-3
.51.
0
A 2(₹/q
tl)50
751
557
21.
611
.039
263
111
9161
.288
.772
894
882
030
.2-1
3.5
A 2+FL(
₹/qt
l)12
3910
5111
13-1
5.1
5.9
497
793
1563
59.6
97.0
841
1097
951
30.3
-13.
3
C 2(₹/q
tl)17
2814
4715
33-1
6.2
5.9
749
1256
2066
67.7
64.5
1252
1439
1352
15.0
-6.1
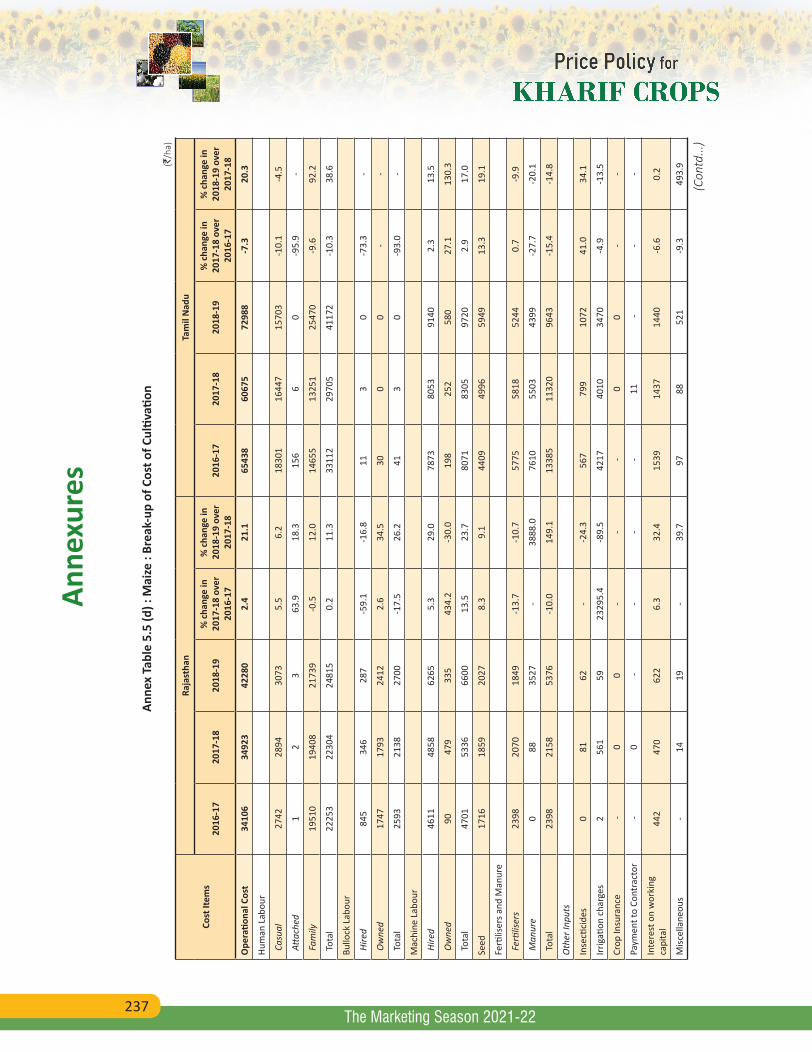
237
Anne
xure
s
The Marketing Season 2021-22
Anne
x Ta
ble
5.5
(d) :
Mai
ze :
Brea
k-up
of C
ost o
f Cul
tivati
on (`
/ha)
Cost
Item
s
Raja
stha
nTa
mil
Nad
u
2016
-17
2017
-18
2018
-19
% c
hang
e in
20
17-1
8 ov
er
2016
-17
% c
hang
e in
20
18-1
9 ov
er
2017
-18
2016
-17
2017
-18
2018
-19
% c
hang
e in
20
17-1
8 ov
er
2016
-17
% c
hang
e in
20
18-1
9 ov
er
2017
-18
Ope
ratio
nal C
ost
3410
634
923
4228
02.
421
.165
438
6067
572
988
-7.3
20.3
Hum
an L
abou
r
Cas
ual
2742
2894
3073
5.5
6.2
1830
116
447
1570
3-1
0.1
-4.5
Atta
ched
12
363
.918
.315
66
0-9
5.9
-
Fam
ily19
510
1940
821
739
-0.5
12.0
1465
513
251
2547
0-9
.692
.2
Tot
al22
253
2230
424
815
0.2
11.3
3311
229
705
4117
2-1
0.3
38.6
Bullo
ck L
abou
r
Hire
d84
534
628
7-5
9.1
-16.
811
30
-73.
3-
Ow
ned
1747
1793
2412
2.6
34.5
300
0-
-
Tot
al25
9321
3827
00-1
7.5
26.2
413
0-9
3.0
-
Mac
hine
Lab
our
Hire
d46
1148
5862
655.
329
.078
7380
5391
402.
313
.5
Ow
ned
9047
933
543
4.2
-30.
019
825
258
027
.113
0.3
Tot
al47
0153
3666
0013
.523
.780
7183
0597
202.
917
.0
Seed
1716
1859
2027
8.3
9.1
4409
4996
5949
13.3
19.1
Ferti
liser
s and
Man
ure
Fer
tilise
rs23
9820
7018
49-1
3.7
-10.
757
7558
1852
440.
7-9
.9
Man
ure
088
3527
-38
88.0
7610
5503
4399
-27.
7-2
0.1
Tot
al23
9821
5853
76-1
0.0
149.
113
385
1132
096
43-1
5.4
-14.
8
Oth
er In
puts
Inse
ctici
des
081
62-
-24.
356
779
910
7241
.034
.1
Irrig
ation
cha
rges
256
159
2329
5.4
-89.
542
1740
1034
70-4
.9-1
3.5
Crop
Insu
ranc
e -
00
--
-0
0-
-
Paym
ent t
o Co
ntra
ctor
-0
--
- -
11 -
--
Inte
rest
on
wor
king
ca
pita
l44
247
062
26.
332
.415
3914
3714
40-6
.60.
2
Misc
ella
neou
s-
1419
-39
.797
8852
1-9
.349
3.9
(Con
td...
)
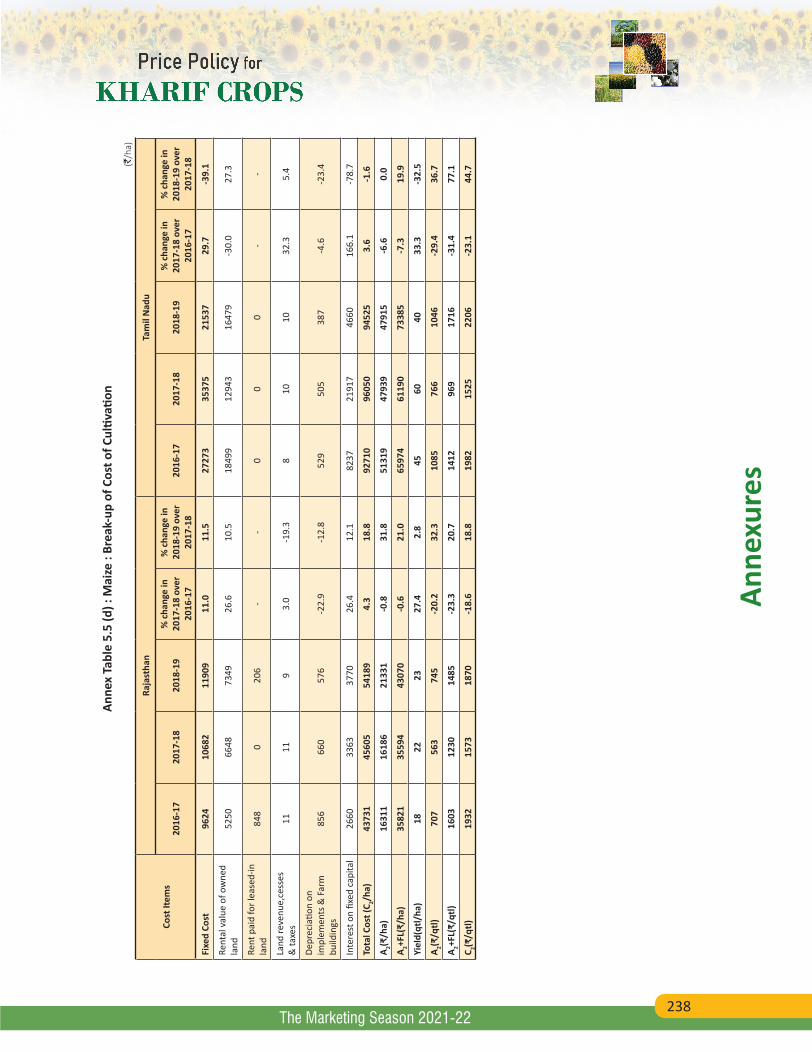
238
Anne
xure
s
The Marketing Season 2021-22
Anne
x Ta
ble
5.5
(d) :
Mai
ze :
Brea
k-up
of C
ost o
f Cul
tivati
on (`
/ha)
Cost
Item
s
Raja
stha
nTa
mil
Nad
u
2016
-17
2017
-18
2018
-19
% c
hang
e in
20
17-1
8 ov
er
2016
-17
% c
hang
e in
20
18-1
9 ov
er
2017
-18
2016
-17
2017
-18
2018
-19
% c
hang
e in
20
17-1
8 ov
er
2016
-17
% c
hang
e in
20
18-1
9 ov
er
2017
-18
Fixe
d Co
st96
2410
682
1190
911
.011
.527
273
3537
521
537
29.7
-39.
1
Rent
al v
alue
of o
wne
d la
nd52
5066
4873
4926
.610
.518
499
1294
316
479
-30.
027
.3
Rent
pai
d fo
r lea
sed-
in
land
848
020
6-
-0
00
--
Land
reve
nue,
cess
es
& ta
xes
1111
93.
0-1
9.3
810
1032
.35.
4
Depr
ecia
tion
on
impl
emen
ts &
Far
m
build
ings
856
660
576
-22.
9-1
2.8
529
505
387
-4.6
-23.
4
Inte
rest
on
fixed
cap
ital
2660
3363
3770
26.4
12.1
8237
2191
746
6016
6.1
-78.
7
Tota
l Cos
t (C 2/h
a)43
731
4560
554
189
4.3
18.8
9271
096
050
9452
53.
6-1
.6
A 2(₹/h
a)16
311
1618
621
331
-0.8
31.8
5131
947
939
4791
5-6
.60.
0
A 2+FL(
₹/ha
)35
821
3559
443
070
-0.6
21.0
6597
461
190
7338
5-7
.319
.9
Yiel
d(qt
l/ha
)18
2223
27.4
2.8
4560
4033
.3-3
2.5
A 2(₹/q
tl)70
756
374
5-2
0.2
32.3
1085
766
1046
-29.
436
.7
A 2+FL(
₹/qt
l)16
0312
3014
85-2
3.3
20.7
1412
969
1716
-31.
477
.1
C 2(₹/q
tl)19
3215
7318
70-1
8.6
18.8
1982
1525
2206
-23.
144
.7
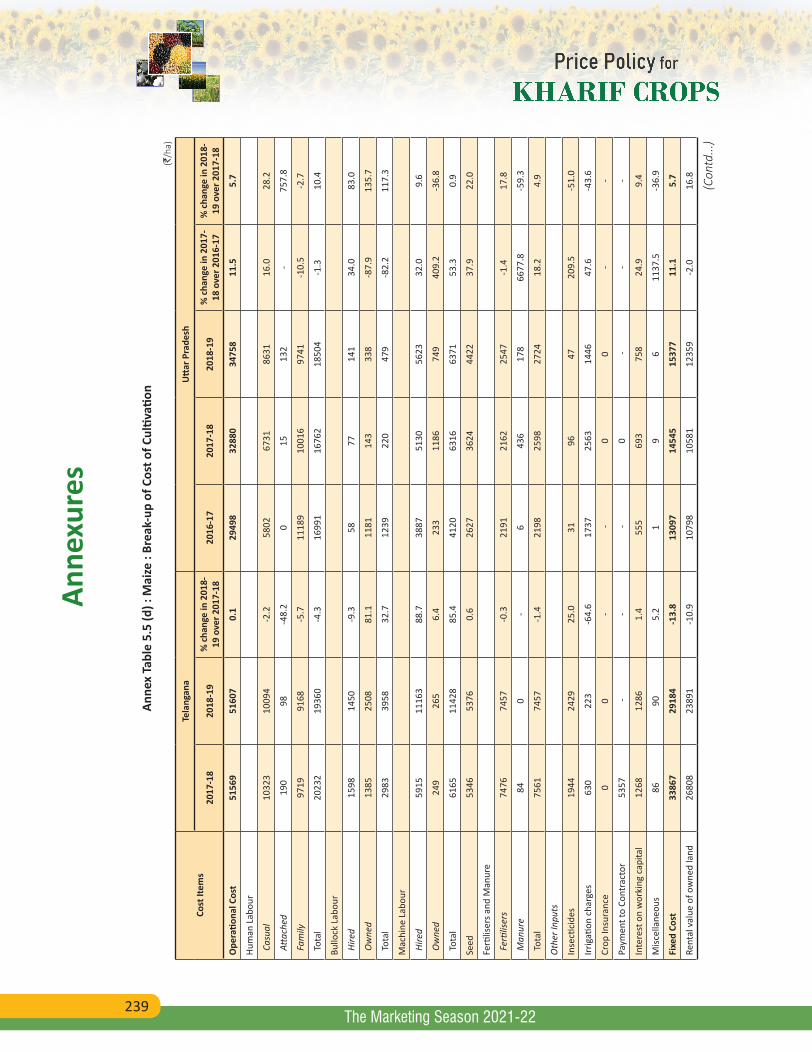
239
Anne
xure
s
The Marketing Season 2021-22
Anne
x Ta
ble
5.5
(d) :
Mai
ze :
Brea
k-up
of C
ost o
f Cul
tivati
on (`
/ha)
Cost
Item
sTe
lang
ana
Utt
ar P
rade
sh
2017
-18
2018
-19
% c
hang
e in
201
8-19
ove
r 201
7-18
2016
-17
2017
-18
2018
-19
% c
hang
e in
201
7-18
ove
r 201
6-17
% c
hang
e in
201
8-19
ove
r 201
7-18
Ope
ratio
nal C
ost
5156
951
607
0.1
2949
832
880
3475
811
.55.
7
Hum
an L
abou
r
Cas
ual
1032
310
094
-2.2
5802
6731
8631
16.0
28.2
Atta
ched
190
98-4
8.2
015
132
-75
7.8
Fam
ily97
1991
68-5
.711
189
1001
697
41-1
0.5
-2.7
Tot
al20
232
1936
0-4
.316
991
1676
218
504
-1.3
10.4
Bullo
ck L
abou
r
Hire
d15
9814
50-9
.358
7714
134
.083
.0
Ow
ned
1385
2508
81.1
1181
143
338
-87.
913
5.7
Tot
al29
8339
5832
.712
3922
047
9-8
2.2
117.
3
Mac
hine
Lab
our
Hire
d59
1511
163
88.7
3887
5130
5623
32.0
9.6
Ow
ned
249
265
6.4
233
1186
749
409.
2-3
6.8
Tot
al61
6511
428
85.4
4120
6316
6371
53.3
0.9
Seed
5346
5376
0.6
2627
3624
4422
37.9
22.0
Ferti
liser
s and
Man
ure
Fer
tilise
rs74
7674
57-0
.321
9121
6225
47-1
.417
.8
Man
ure
840
-6
436
178
6677
.8-5
9.3
Tot
al75
6174
57-1
.421
9825
9827
2418
.24.
9
Oth
er In
puts
Inse
ctici
des
1944
2429
25.0
3196
4720
9.5
-51.
0
Irrig
ation
cha
rges
630
223
-64.
617
3725
6314
4647
.6-4
3.6
Crop
Insu
ranc
e0
0-
-0
0-
-
Paym
ent t
o Co
ntra
ctor
5357
--
-0
--
-
Inte
rest
on
wor
king
cap
ital
1268
1286
1.4
555
693
758
24.9
9.4
Misc
ella
neou
s86
905.
21
96
1137
.5-3
6.9
Fixe
d Co
st33
867
2918
4-1
3.8
1309
714
545
1537
711
.15.
7
Rent
al v
alue
of o
wne
d la
nd26
808
2389
1-1
0.9
1079
810
581
1235
9-2
.016
.8
(Con
td...
)
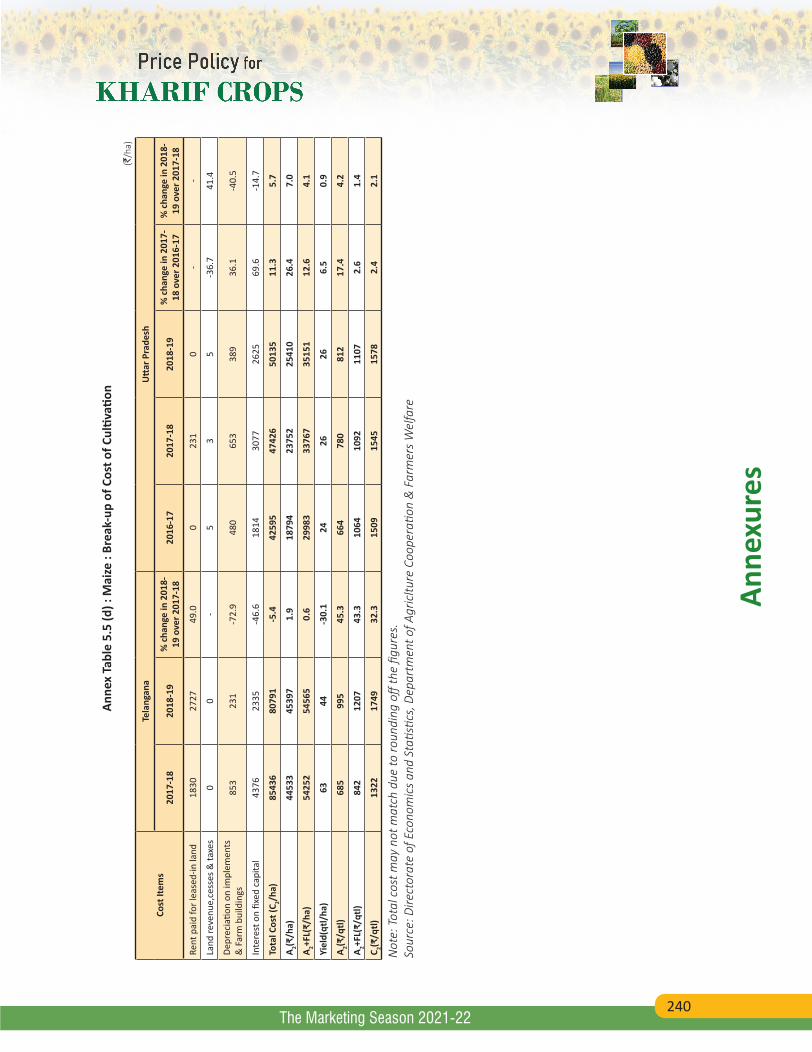
240
Anne
xure
s
The Marketing Season 2021-22
Anne
x Ta
ble
5.5
(d) :
Mai
ze :
Brea
k-up
of C
ost o
f Cul
tivati
on (`
/ha)
Cost
Item
sTe
lang
ana
Utt
ar P
rade
sh
2017
-18
2018
-19
% c
hang
e in
201
8-19
ove
r 201
7-18
2016
-17
2017
-18
2018
-19
% c
hang
e in
201
7-18
ove
r 201
6-17
% c
hang
e in
201
8-19
ove
r 201
7-18
Rent
pai
d fo
r lea
sed-
in la
nd18
3027
2749
.00
231
0-
-
Land
reve
nue,
cess
es &
taxe
s0
0-
53
5-3
6.7
41.4
Depr
ecia
tion
on im
plem
ents
&
Far
m b
uild
ings
853
231
-72.
948
065
338
936
.1-4
0.5
Inte
rest
on
fixed
cap
ital
4376
2335
-46.
618
1430
7726
2569
.6-1
4.7
Tota
l Cos
t (C 2/h
a)85
436
8079
1-5
.442
595
4742
650
135
11.3
5.7
A 2(₹/h
a)44
533
4539
71.
918
794
2375
225
410
26.4
7.0
A 2+FL(
₹/ha
)54
252
5456
50.
629
983
3376
735
151
12.6
4.1
Yiel
d(qt
l/ha
)63
44-3
0.1
2426
266.
50.
9
A 2(₹/q
tl)68
599
545
.366
478
081
217
.44.
2
A 2+FL(
₹/qt
l)84
212
0743
.310
6410
9211
072.
61.
4
C 2(₹/q
tl)13
2217
4932
.315
0915
4515
782.
42.
1
Not
e: T
otal
cos
t may
not
mat
ch d
ue to
roun
ding
off
the
figur
es.
Sour
ce: D
irect
orat
e of
Eco
nom
ics
and
Stati
stics
, Dep
artm
ent o
f Agr
icltu
re C
oope
ratio
n &
Far
mer
s W
elfa
re
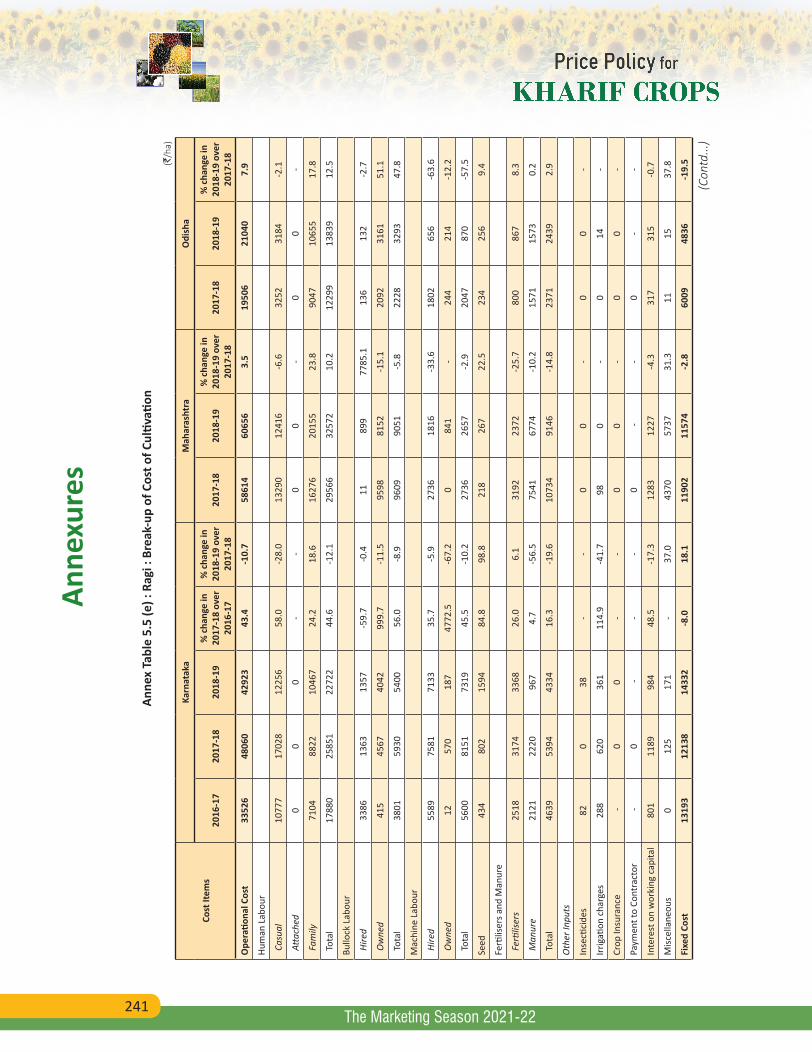
241
Anne
xure
s
The Marketing Season 2021-22
Anne
x Ta
ble
5.5
(e) :
Rag
i : B
reak
-up
of C
ost o
f Cul
tivati
on (`
/ha)
Cost
Item
s
Karn
atak
aM
ahar
asht
raO
dish
a
2016
-17
2017
-18
2018
-19
% c
hang
e in
20
17-1
8 ov
er
2016
-17
% c
hang
e in
20
18-1
9 ov
er
2017
-18
2017
-18
2018
-19
% c
hang
e in
20
18-1
9 ov
er
2017
-18
2017
-18
2018
-19
% c
hang
e in
20
18-1
9 ov
er
2017
-18
Ope
ratio
nal C
ost
3352
648
060
4292
343
.4-1
0.7
5861
460
656
3.5
1950
621
040
7.9
Hum
an L
abou
r
Cas
ual
1077
717
028
1225
658
.0-2
8.0
1329
012
416
-6.6
3252
3184
-2.1
Atta
ched
00
0-
-0
0-
00
-
Fam
ily71
0488
2210
467
24.2
18.6
1627
620
155
23.8
9047
1065
517
.8
Tot
al17
880
2585
122
722
44.6
-12.
129
566
3257
210
.212
299
1383
912
.5
Bullo
ck L
abou
r
Hire
d33
8613
6313
57-5
9.7
-0.4
1189
977
85.1
136
132
-2.7
Ow
ned
415
4567
4042
999.
7-1
1.5
9598
8152
-15.
120
9231
6151
.1
Tot
al38
0159
3054
0056
.0-8
.996
0990
51-5
.822
2832
9347
.8
Mac
hine
Lab
our
Hire
d55
8975
8171
3335
.7-5
.927
3618
16-3
3.6
1802
656
-63.
6
Ow
ned
1257
018
747
72.5
-67.
20
841
-24
421
4-1
2.2
Tot
al56
0081
5173
1945
.5-1
0.2
2736
2657
-2.9
2047
870
-57.
5
Seed
434
802
1594
84.8
98.8
218
267
22.5
234
256
9.4
Ferti
liser
s and
Man
ure
Fer
tilise
rs25
1831
7433
6826
.06.
131
9223
72-2
5.7
800
867
8.3
Man
ure
2121
2220
967
4.7
-56.
575
4167
74-1
0.2
1571
1573
0.2
Tot
al46
3953
9443
3416
.3-1
9.6
1073
491
46-1
4.8
2371
2439
2.9
Oth
er In
puts
Inse
ctici
des
820
38-
-0
0-
00
-
Irrig
ation
cha
rges
288
620
361
114.
9-4
1.7
980
-0
14-
Crop
Insu
ranc
e -
00
--
00
-0
0-
Paym
ent t
o Co
ntra
ctor
-0
--
-0
--
0-
-
Inte
rest
on
wor
king
cap
ital
801
1189
984
48.5
-17.
312
8312
27-4
.331
731
5-0
.7
Misc
ella
neou
s0
125
171
-37
.043
7057
3731
.311
1537
.8
Fixe
d Co
st13
193
1213
814
332
-8.0
18.1
1190
211
574
-2.8
6009
4836
-19.
5
(Con
td...
)
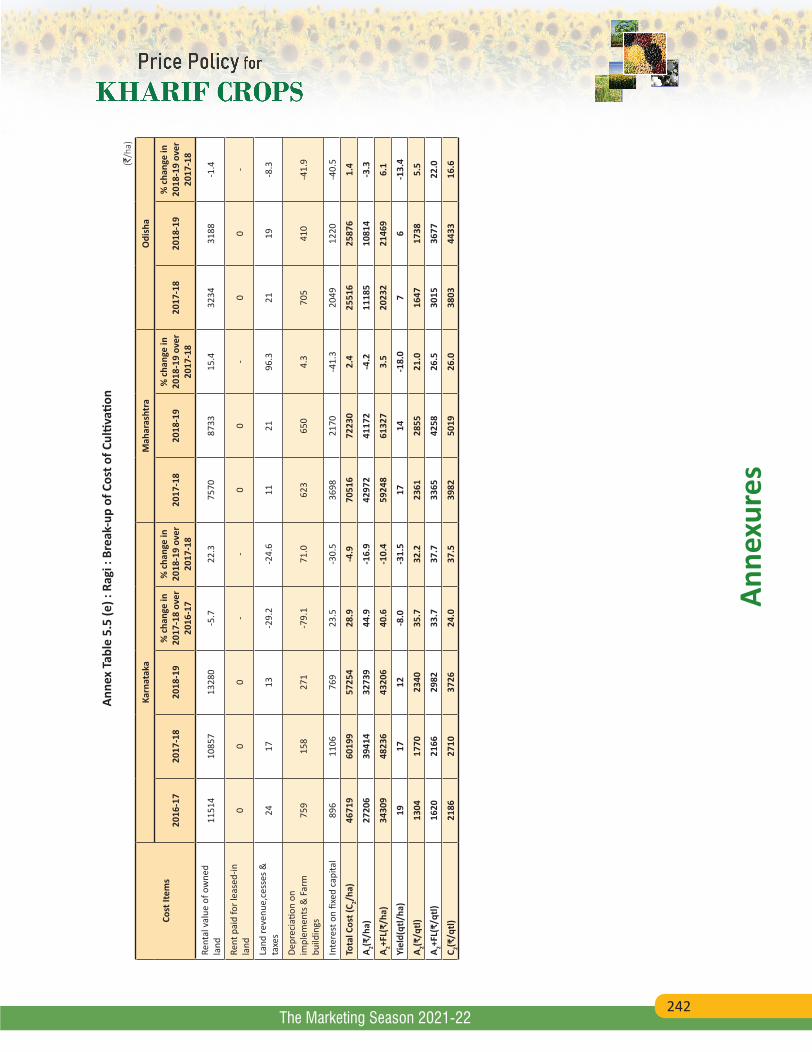
242
Anne
xure
s
The Marketing Season 2021-22
Anne
x Ta
ble
5.5
(e) :
Rag
i : B
reak
-up
of C
ost o
f Cul
tivati
on (`
/ha)
Cost
Item
s
Karn
atak
aM
ahar
asht
raO
dish
a
2016
-17
2017
-18
2018
-19
% c
hang
e in
20
17-1
8 ov
er
2016
-17
% c
hang
e in
20
18-1
9 ov
er
2017
-18
2017
-18
2018
-19
% c
hang
e in
20
18-1
9 ov
er
2017
-18
2017
-18
2018
-19
% c
hang
e in
20
18-1
9 ov
er
2017
-18
Rent
al v
alue
of o
wne
d la
nd11
514
1085
713
280
-5.7
22.3
7570
8733
15.4
3234
3188
-1.4
Rent
pai
d fo
r lea
sed-
in
land
00
0-
-0
0-
00
-
Land
reve
nue,
cess
es &
ta
xes
2417
13-2
9.2
-24.
611
2196
.321
19-8
.3
Depr
ecia
tion
on
impl
emen
ts &
Far
m
build
ings
759
158
271
-79.
171
.062
365
04.
370
541
0-4
1.9
Inte
rest
on
fixed
cap
ital
896
1106
769
23.5
-30.
536
9821
70-4
1.3
2049
1220
-40.
5
Tota
l Cos
t (C 2/h
a)46
719
6019
957
254
28.9
-4.9
7051
672
230
2.4
2551
625
876
1.4
A 2(₹/h
a)27
206
3941
432
739
44.9
-16.
942
972
4117
2-4
.211
185
1081
4-3
.3
A 2+FL(
₹/ha
)34
309
4823
643
206
40.6
-10.
459
248
6132
73.
520
232
2146
96.
1
Yiel
d(qt
l/ha
)19
1712
-8.0
-31.
517
14-1
8.0
76
-13.
4
A 2(₹/q
tl)13
0417
7023
4035
.732
.223
6128
5521
.016
4717
385.
5
A 2+FL(
₹/qt
l)16
2021
6629
8233
.737
.733
6542
5826
.530
1536
7722
.0
C 2(₹/q
tl)21
8627
1037
2624
.037
.539
8250
1926
.038
0344
3316
.6
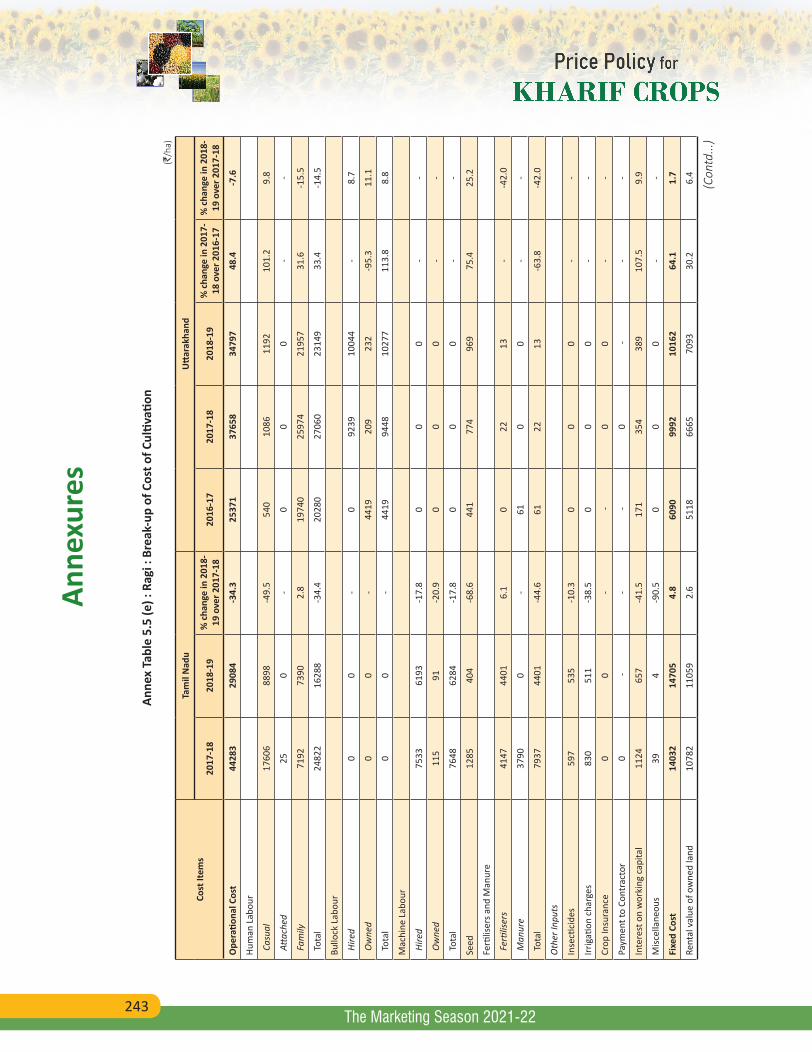
243
Anne
xure
s
The Marketing Season 2021-22
Anne
x Ta
ble
5.5
(e) :
Rag
i : B
reak
-up
of C
ost o
f Cul
tivati
on (`
/ha)
Cost
Item
sTa
mil
Nad
uU
ttar
akha
nd
2017
-18
2018
-19
% c
hang
e in
201
8-19
ove
r 201
7-18
2016
-17
2017
-18
2018
-19
% c
hang
e in
201
7-18
ove
r 201
6-17
% c
hang
e in
201
8-19
ove
r 201
7-18
Ope
ratio
nal C
ost
4428
329
084
-34.
325
371
3765
834
797
48.4
-7.6
Hum
an L
abou
r
Cas
ual
1760
688
98-4
9.5
540
1086
1192
101.
29.
8
Atta
ched
250
-0
00
--
Fam
ily71
9273
902.
819
740
2597
421
957
31.6
-15.
5
Tot
al24
822
1628
8-3
4.4
2028
027
060
2314
933
.4-1
4.5
Bullo
ck L
abou
r
Hire
d0
0-
092
3910
044
-8.
7
Ow
ned
00
-44
1920
923
2-9
5.3
11.1
Tot
al0
0-
4419
9448
1027
711
3.8
8.8
Mac
hine
Lab
our
Hire
d75
3361
93-1
7.8
00
0-
-
Ow
ned
115
91-2
0.9
00
0-
-
Tot
al76
4862
84-1
7.8
00
0-
-
Seed
1285
404
-68.
644
177
496
975
.425
.2
Ferti
liser
s and
Man
ure
Fer
tilise
rs41
4744
016.
10
2213
--4
2.0
Man
ure
3790
0-
610
0-
-
Tot
al79
3744
01-4
4.6
6122
13-6
3.8
-42.
0
Oth
er In
puts
Inse
ctici
des
597
535
-10.
30
00
--
Irrig
ation
cha
rges
830
511
-38.
50
00
--
Crop
Insu
ranc
e0
0-
-0
0-
-
Paym
ent t
o Co
ntra
ctor
0 -
- -
0 -
--
Inte
rest
on
wor
king
cap
ital
1124
657
-41.
517
135
438
910
7.5
9.9
Misc
ella
neou
s39
4-9
0.5
00
0-
-
Fixe
d Co
st14
032
1470
54.
860
9099
9210
162
64.1
1.7
Rent
al v
alue
of o
wne
d la
nd10
782
1105
92.
651
1866
6570
9330
.26.
4
(Con
td...
)
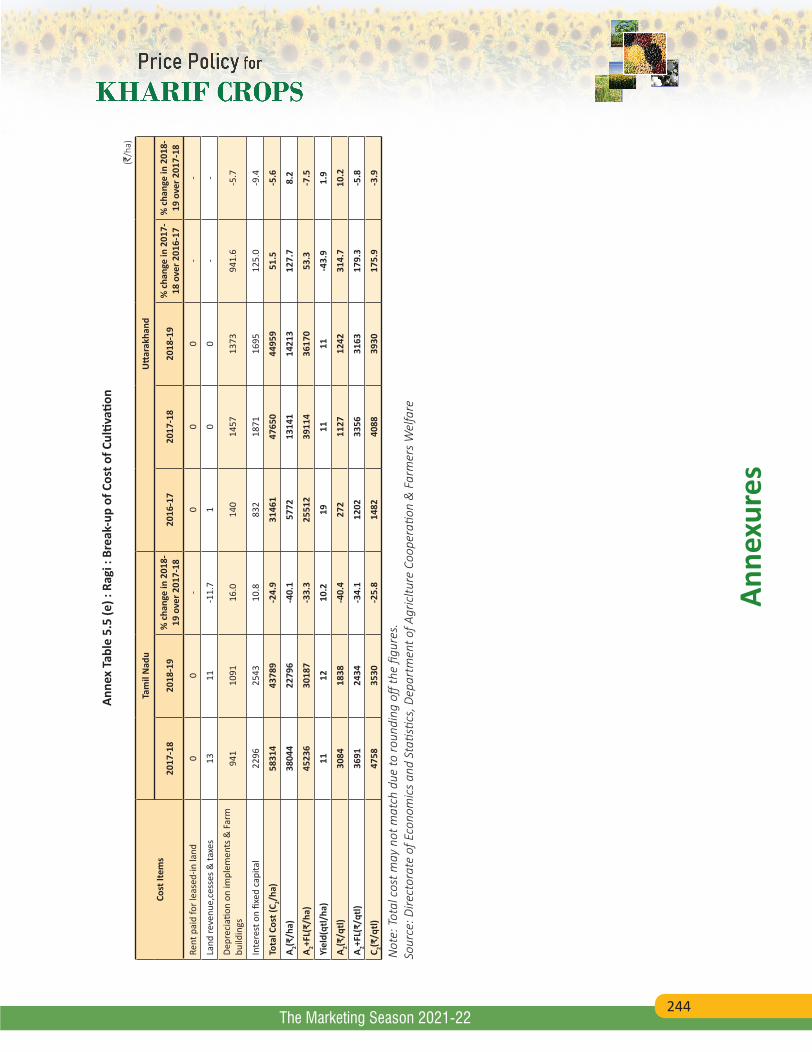
244
Anne
xure
s
The Marketing Season 2021-22
Anne
x Ta
ble
5.5
(e) :
Rag
i : B
reak
-up
of C
ost o
f Cul
tivati
on (`
/ha)
Cost
Item
sTa
mil
Nad
uU
ttar
akha
nd
2017
-18
2018
-19
% c
hang
e in
201
8-19
ove
r 201
7-18
2016
-17
2017
-18
2018
-19
% c
hang
e in
201
7-18
ove
r 201
6-17
% c
hang
e in
201
8-19
ove
r 201
7-18
Rent
pai
d fo
r lea
sed-
in la
nd0
0-
00
0-
-
Land
reve
nue,
cess
es &
taxe
s13
11-1
1.7
10
0-
-
Depr
ecia
tion
on im
plem
ents
& F
arm
bu
ildin
gs94
110
9116
.014
014
5713
7394
1.6
-5.7
Inte
rest
on
fixed
cap
ital
2296
2543
10.8
832
1871
1695
125.
0-9
.4
Tota
l Cos
t (C 2/h
a)58
314
4378
9-2
4.9
3146
147
650
4495
951
.5-5
.6
A 2(₹/h
a)38
044
2279
6-4
0.1
5772
1314
114
213
127.
78.
2
A 2+FL(
₹/ha
)45
236
3018
7-3
3.3
2551
239
114
3617
053
.3-7
.5
Yiel
d(qt
l/ha
)11
1210
.219
1111
-43.
91.
9
A 2(₹/q
tl)30
8418
38-4
0.4
272
1127
1242
314.
710
.2
A 2+FL(
₹/qt
l)36
9124
34-3
4.1
1202
3356
3163
179.
3-5
.8
C 2(₹/q
tl)47
5835
30-2
5.8
1482
4088
3930
175.
9-3
.9
Not
e: T
otal
cos
t may
not
mat
ch d
ue to
roun
ding
off
the
figur
es.
Sour
ce: D
irect
orat
e of
Eco
nom
ics
and
Stati
stics
, Dep
artm
ent o
f Agr
icltu
re C
oope
ratio
n &
Far
mer
s W
elfa
re
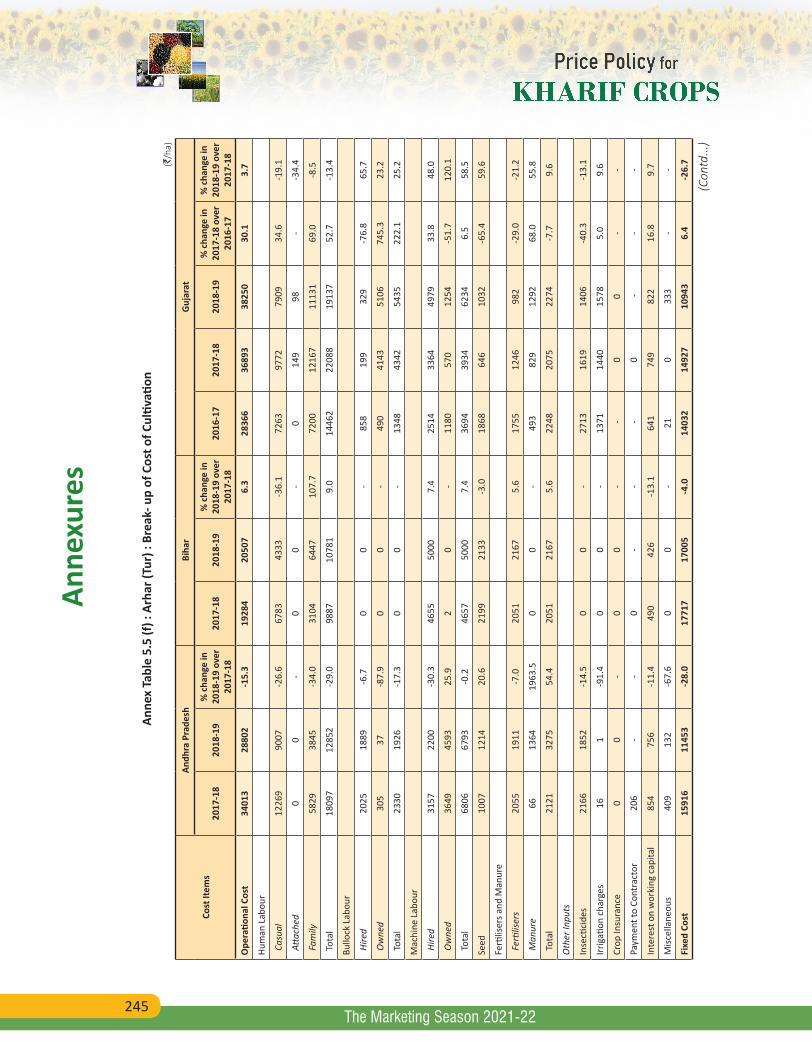
245
Anne
xure
s
The Marketing Season 2021-22
Anne
x Ta
ble
5.5
(f) :
Arh
ar (T
ur) :
Bre
ak- u
p of
Cos
t of C
ultiv
ation
(`/h
a)
Cost
Item
s
Andh
ra P
rade
shBi
har
Guj
arat
2017
-18
2018
-19
% c
hang
e in
20
18-1
9 ov
er
2017
-18
2017
-18
2018
-19
% c
hang
e in
20
18-1
9 ov
er
2017
-18
2016
-17
2017
-18
2018
-19
% c
hang
e in
20
17-1
8 ov
er
2016
-17
% c
hang
e in
20
18-1
9 ov
er
2017
-18
Ope
ratio
nal C
ost
3401
328
802
-15.
319
284
2050
76.
328
366
3689
338
250
30.1
3.7
Hum
an L
abou
r
Cas
ual
1226
990
07-2
6.6
6783
4333
-36.
172
6397
7279
0934
.6-1
9.1
Atta
ched
00
-0
0-
014
998
--3
4.4
Fam
ily58
2938
45-3
4.0
3104
6447
107.
772
0012
167
1113
169
.0-8
.5
Tot
al18
097
1285
2-2
9.0
9887
1078
19.
014
462
2208
819
137
52.7
-13.
4
Bullo
ck L
abou
r
Hire
d20
2518
89-6
.70
0-
858
199
329
-76.
865
.7
Ow
ned
305
37-8
7.9
00
-49
041
4351
0674
5.3
23.2
Tot
al23
3019
26-1
7.3
00
-13
4843
4254
3522
2.1
25.2
Mac
hine
Lab
our
Hire
d31
5722
00-3
0.3
4655
5000
7.4
2514
3364
4979
33.8
48.0
Ow
ned
3649
4593
25.9
20
-11
8057
012
54-5
1.7
120.
1
Tot
al68
0667
93-0
.246
5750
007.
436
9439
3462
346.
558
.5
Seed
1007
1214
20.6
2199
2133
-3.0
1868
646
1032
-65.
459
.6
Ferti
liser
s and
Man
ure
Fer
tilise
rs20
5519
11-7
.020
5121
675.
617
5512
4698
2-2
9.0
-21.
2
Man
ure
6613
6419
63.5
00
-49
382
912
9268
.055
.8
Tot
al21
2132
7554
.420
5121
675.
622
4820
7522
74-7
.79.
6
Oth
er In
puts
Inse
ctici
des
2166
1852
-14.
50
0-
2713
1619
1406
-40.
3-1
3.1
Irrig
ation
cha
rges
161
-91.
40
0-
1371
1440
1578
5.0
9.6
Crop
Insu
ranc
e0
0-
00
- -
00
--
Paym
ent t
o Co
ntra
ctor
206
--
0-
- -
0 -
--
Inte
rest
on
wor
king
cap
ital
854
756
-11.
449
042
6-1
3.1
641
749
822
16.8
9.7
Misc
ella
neou
s40
913
2-6
7.6
00
-21
033
3-
-
Fixe
d Co
st15
916
1145
3-2
8.0
1771
717
005
-4.0
1403
214
927
1094
36.
4-2
6.7
(Con
td...
)
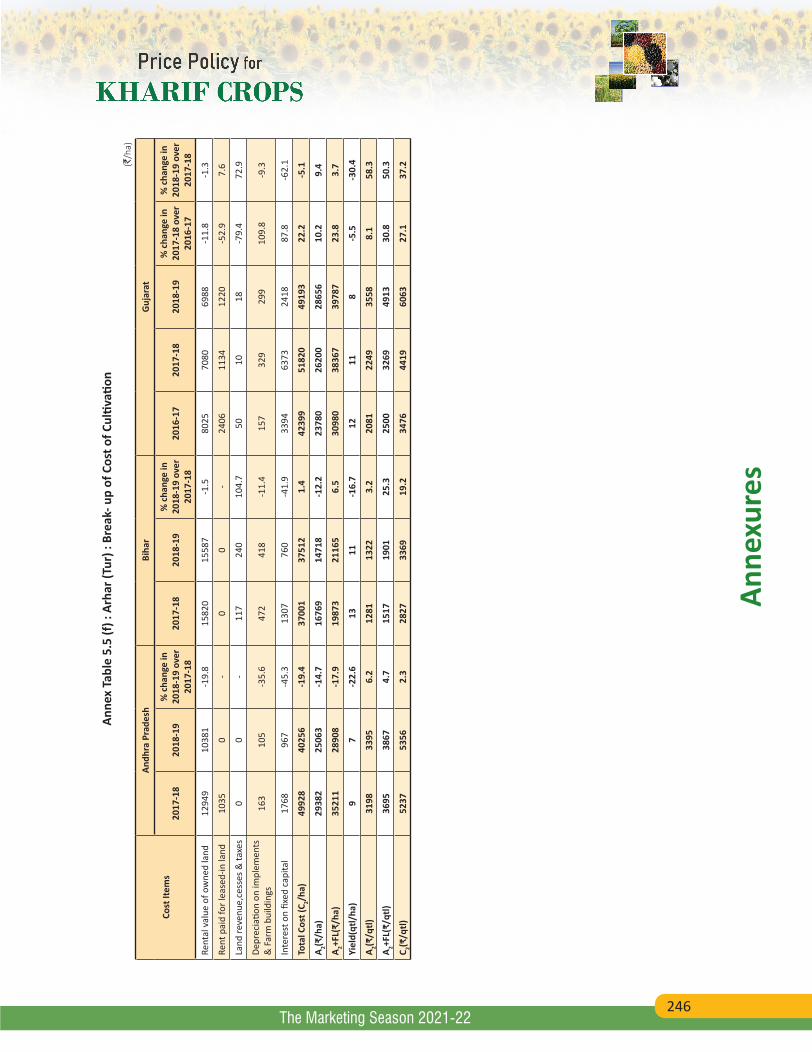
246
Anne
xure
s
The Marketing Season 2021-22
Anne
x Ta
ble
5.5
(f) :
Arh
ar (T
ur) :
Bre
ak- u
p of
Cos
t of C
ultiv
ation
(`/h
a)
Cost
Item
s
Andh
ra P
rade
shBi
har
Guj
arat
2017
-18
2018
-19
% c
hang
e in
20
18-1
9 ov
er
2017
-18
2017
-18
2018
-19
% c
hang
e in
20
18-1
9 ov
er
2017
-18
2016
-17
2017
-18
2018
-19
% c
hang
e in
20
17-1
8 ov
er
2016
-17
% c
hang
e in
20
18-1
9 ov
er
2017
-18
Rent
al v
alue
of o
wne
d la
nd12
949
1038
1-1
9.8
1582
015
587
-1.5
8025
7080
6988
-11.
8-1
.3
Rent
pai
d fo
r lea
sed-
in la
nd10
350
-0
0-
2406
1134
1220
-52.
97.
6
Land
reve
nue,
cess
es &
taxe
s0
0-
117
240
104.
750
1018
-79.
472
.9
Depr
ecia
tion
on im
plem
ents
&
Far
m b
uild
ings
163
105
-35.
647
241
8-1
1.4
157
329
299
109.
8-9
.3
Inte
rest
on
fixed
cap
ital
1768
967
-45.
313
0776
0-4
1.9
3394
6373
2418
87.8
-62.
1
Tota
l Cos
t (C 2/h
a)49
928
4025
6-1
9.4
3700
137
512
1.4
4239
951
820
4919
322
.2-5
.1
A 2(₹/h
a)29
382
2506
3-1
4.7
1676
914
718
-12.
223
780
2620
028
656
10.2
9.4
A 2+FL(
₹/ha
)35
211
2890
8-1
7.9
1987
321
165
6.5
3098
038
367
3978
723
.83.
7
Yiel
d(qt
l/ha
)9
7-2
2.6
1311
-16.
712
118
-5.5
-30.
4
A 2(₹/q
tl)31
9833
956.
212
8113
223.
220
8122
4935
588.
158
.3
A 2+FL(
₹/qt
l)36
9538
674.
715
1719
0125
.325
0032
6949
1330
.850
.3
C 2(₹/q
tl)52
3753
562.
328
2733
6919
.234
7644
1960
6327
.137
.2

247
Anne
xure
s
The Marketing Season 2021-22
Anne
x Ta
ble
5.5
(f) :
Arh
ar (T
ur) :
Bre
ak- u
p of
Cos
t of C
ultiv
ation
(`/h
a)
Cost
Item
s
Karn
atak
aM
adhy
a Pr
ades
h
2016
-17
2017
-18
2018
-19
% c
hang
e in
20
17-1
8 ov
er
2016
-17
% c
hang
e in
20
18-1
9 ov
er
2017
-18
2016
-17
2017
-18
2018
-19
% c
hang
e in
20
17-1
8 ov
er
2016
-17
% c
hang
e in
20
18-1
9 ov
er
2017
-18
Ope
ratio
nal C
ost
1968
630
447
2947
654
.7-3
.225
019
2361
926
310
-5.6
11.4
Hum
an L
abou
r
Cas
ual
4653
4784
4541
2.8
-5.1
2823
5318
6332
88.4
19.1
Atta
ched
537
46-8
7.3
574.
928
625
49-9
1.1
95.0
Fam
ily26
9951
6344
3091
.3-1
4.2
7682
6394
6107
-16.
8-4
.5
Tot
al74
0599
5490
1734
.4-9
.410
790
1173
712
488
8.8
6.4
Bullo
ck L
abou
r
Hire
d93
028
6024
5820
7.4
-14.
080
245
273
205.
611
.6
Ow
ned
1676
2676
4247
59.7
58.7
3764
1551
1251
-58.
8-1
9.3
Tot
al26
0655
3567
0511
2.4
21.1
3844
1796
1525
-53.
3-1
5.1
Mac
hine
Lab
our
Hire
d41
4955
1957
8433
.04.
827
6037
7246
9336
.724
.4
Ow
ned
3858
641
714
28.9
-28.
840
638
757
9-4
.549
.6
Tot
al41
8861
0562
0145
.81.
631
6541
5952
7231
.426
.8
Seed
1395
889
857
-36.
3-3
.632
7020
9122
99-3
6.1
9.9
Ferti
liser
s and
Man
ure
Fer
tilise
rs14
6228
2026
9892
.8-4
.310
5815
5218
0746
.716
.4
Man
ure
138
103
500
-25.
338
4.0
1085
372
465
-65.
724
.8
Tot
al16
0129
2331
9882
.69.
421
4319
2422
71-1
0.2
18.0
Oth
er In
puts
Inse
ctici
des
1899
3960
2476
108.
5-3
7.5
1078
1049
1315
-2.6
25.3
Irrig
ation
cha
rges
7973
112
-6.8
52.9
161
252
325
56.9
28.9
Crop
Insu
ranc
e -
00
--
-84
151
-80
.7
Paym
ent t
o Co
ntra
ctor
-31
40
--
-0
--
-
Inte
rest
on
wor
king
cap
ital
515
776
759
50.7
-2.2
525
522
612
-0.6
17.3
Misc
ella
neou
s0
232
151
--3
4.8
436
51-8
7.0
829.
2
Fixe
d Co
st14
266
1416
511
343
-0.7
-19.
916
201
1158
613
356
-28.
515
.3
(Con
td...
)

248
Anne
xure
s
The Marketing Season 2021-22
Anne
x Ta
ble
5.5
(f) :
Arh
ar (T
ur) :
Bre
ak- u
p of
Cos
t of C
ultiv
ation
(`/h
a)
Cost
Item
s
Karn
atak
aM
adhy
a Pr
ades
h
2016
-17
2017
-18
2018
-19
% c
hang
e in
20
17-1
8 ov
er
2016
-17
% c
hang
e in
20
18-1
9 ov
er
2017
-18
2016
-17
2017
-18
2018
-19
% c
hang
e in
20
17-1
8 ov
er
2016
-17
% c
hang
e in
20
18-1
9 ov
er
2017
-18
Rent
al v
alue
of o
wne
d la
nd12
380
1184
296
77-4
.3-1
8.3
1182
678
3510
380
-33.
832
.5
Rent
pai
d fo
r lea
sed-
in la
nd0
00
--
00
0-
-
Land
reve
nue,
cess
es &
taxe
s11
1011
-13.
69.
611
47
-60.
949
.1
Depr
ecia
tion
on im
plem
ents
&
Farm
bui
ldin
gs27
821
524
2-2
2.7
12.5
1392
1269
835
-8.8
-34.
2
Inte
rest
on
fixed
cap
ital
1597
2098
1413
31.4
-32.
629
7224
7821
34-1
6.6
-13.
9
Tota
l Cos
t (C 2/h
a)33
952
4492
640
819
32.3
-9.1
4122
035
205
3966
6-1
4.6
12.7
A 2(₹/h
a)17
277
2582
325
299
49.5
-2.0
1874
018
499
2104
5-1
.313
.8
A 2+FL(
₹/ha
)19
976
3098
629
728
55.1
-4.1
2642
224
892
2715
2-5
.89.
1
Yiel
d(qt
l/ha
)10
117
3.6
-30.
410
79
-26.
622
.2
A 2(₹/q
tl)16
1723
5533
4645
.742
.116
7523
2421
3038
.7-8
.3
A 2+FL(
₹/qt
l)18
8928
2638
9949
.638
.024
1230
5027
1726
.4-1
0.9
C 2(₹/q
tl)32
1040
9053
5527
.430
.937
3943
1639
6315
.4-8
.2
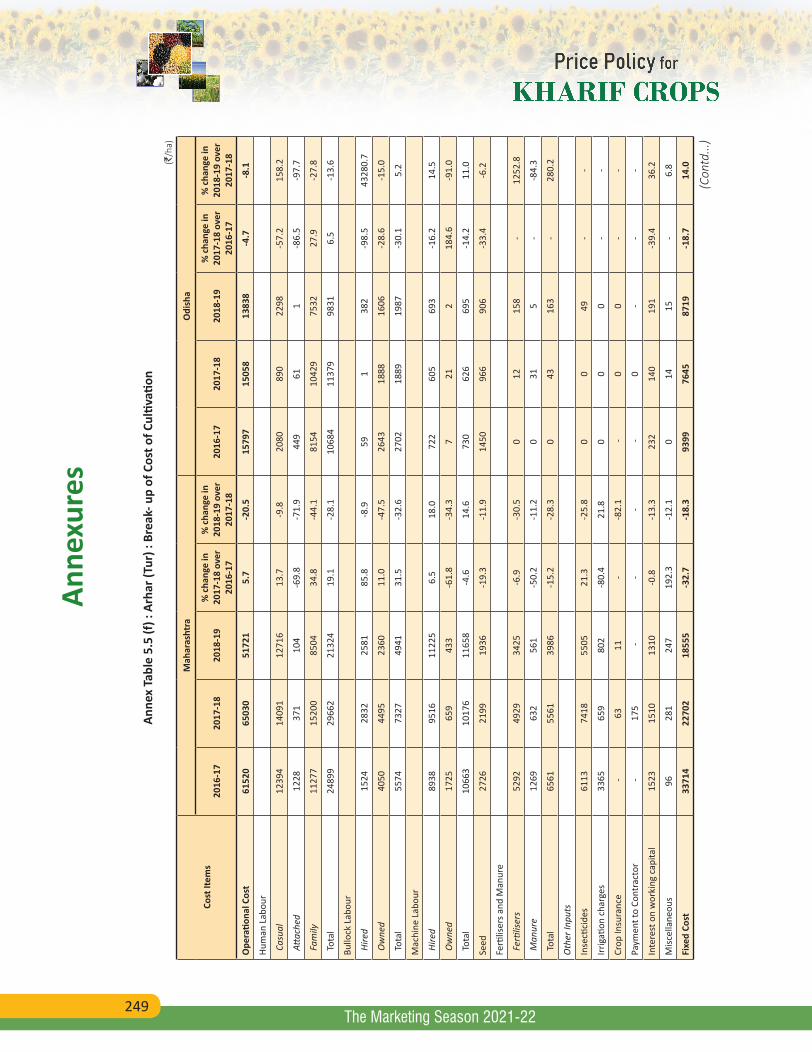
249
Anne
xure
s
The Marketing Season 2021-22
Anne
x Ta
ble
5.5
(f) :
Arh
ar (T
ur) :
Bre
ak- u
p of
Cos
t of C
ultiv
ation
(`/h
a)
Cost
Item
s
Mah
aras
htra
Odi
sha
2016
-17
2017
-18
2018
-19
% c
hang
e in
20
17-1
8 ov
er
2016
-17
% c
hang
e in
20
18-1
9 ov
er
2017
-18
2016
-17
2017
-18
2018
-19
% c
hang
e in
20
17-1
8 ov
er
2016
-17
% c
hang
e in
20
18-1
9 ov
er
2017
-18
Ope
ratio
nal C
ost
6152
065
030
5172
15.
7-2
0.5
1579
715
058
1383
8-4
.7-8
.1
Hum
an L
abou
r
Cas
ual
1239
414
091
1271
613
.7-9
.820
8089
022
98-5
7.2
158.
2
Atta
ched
1228
371
104
-69.
8-7
1.9
449
611
-86.
5-9
7.7
Fam
ily11
277
1520
085
0434
.8-4
4.1
8154
1042
975
3227
.9-2
7.8
Tot
al24
899
2966
221
324
19.1
-28.
110
684
1137
998
316.
5-1
3.6
Bullo
ck L
abou
r
Hire
d15
2428
3225
8185
.8-8
.959
138
2-9
8.5
4328
0.7
Ow
ned
4050
4495
2360
11.0
-47.
526
4318
8816
06-2
8.6
-15.
0
Tot
al55
7473
2749
4131
.5-3
2.6
2702
1889
1987
-30.
15.
2
Mac
hine
Lab
our
Hire
d89
3895
1611
225
6.5
18.0
722
605
693
-16.
214
.5
Ow
ned
1725
659
433
-61.
8-3
4.3
721
218
4.6
-91.
0
Tot
al10
663
1017
611
658
-4.6
14.6
730
626
695
-14.
211
.0
Seed
2726
2199
1936
-19.
3-1
1.9
1450
966
906
-33.
4-6
.2
Ferti
liser
s and
Man
ure
Fer
tilise
rs52
9249
2934
25-6
.9-3
0.5
012
158
-12
52.8
Man
ure
1269
632
561
-50.
2-1
1.2
031
5-
-84.
3
Tot
al65
6155
6139
86-1
5.2
-28.
30
4316
3-
280.
2
Oth
er In
puts
Inse
ctici
des
6113
7418
5505
21.3
-25.
80
049
--
Irrig
ation
cha
rges
3365
659
802
-80.
421
.80
00
--
Crop
Insu
ranc
e -
6311
--8
2.1
-0
0-
-
Paym
ent t
o Co
ntra
ctor
-17
5 -
--
-0
--
-
Inte
rest
on
wor
king
cap
ital
1523
1510
1310
-0.8
-13.
323
214
019
1-3
9.4
36.2
Misc
ella
neou
s96
281
247
192.
3-1
2.1
014
15-
6.8
Fixe
d Co
st33
714
2270
218
555
-32.
7-1
8.3
9399
7645
8719
-18.
714
.0
(Con
td...
)

250
Anne
xure
s
The Marketing Season 2021-22
Anne
x Ta
ble
5.5
(f) :
Arh
ar (T
ur) :
Bre
ak- u
p of
Cos
t of C
ultiv
ation
(`/h
a)
Cost
Item
s
Mah
aras
htra
Odi
sha
2016
-17
2017
-18
2018
-19
% c
hang
e in
20
17-1
8 ov
er
2016
-17
% c
hang
e in
20
18-1
9 ov
er
2017
-18
2016
-17
2017
-18
2018
-19
% c
hang
e in
20
17-1
8 ov
er
2016
-17
% c
hang
e in
20
18-1
9 ov
er
2017
-18
Rent
al v
alue
of o
wne
d la
nd18
749
1408
412
885
-24.
9-8
.561
3254
9864
81-1
0.3
17.9
Rent
pai
d fo
r lea
sed-
in la
nd0
00
--
00
0-
-
Land
reve
nue,
cess
es &
taxe
s47
6364
34.8
2.2
1918
19-6
.55.
1
Depr
ecia
tion
on im
plem
ents
&
Farm
bui
ldin
gs11
5613
9410
2120
.6-2
6.8
731
648
782
-11.
320
.6
Inte
rest
on
fixed
cap
ital
1376
371
6045
84-4
8.0
-36.
025
1614
8014
38-4
1.2
-2.9
Tota
l Cos
t (C 2/h
a)95
234
8773
270
276
-7.9
-19.
925
196
2270
322
557
-9.9
-0.6
A 2(₹/h
a)51
444
5128
744
302
-0.3
-13.
683
9352
9571
06-3
6.9
34.2
A 2+FL(
₹/ha
)62
722
6648
752
806
6.0
-20.
616
547
1572
414
638
-5.0
-6.9
Yiel
d(qt
l/ha
)22
1916
-15.
7-1
6.0
45
532
.1-3
.8
A 2(₹/q
tl)22
4826
3827
3217
.33.
621
9010
7714
23-5
0.9
32.2
A 2+FL(
₹/qt
l)27
4434
4532
6425
.6-5
.342
5330
7329
49-2
7.7
-4.0
C 2(₹/q
tl)41
6645
4743
439.
1-4
.564
7144
4145
52-3
1.4
2.5
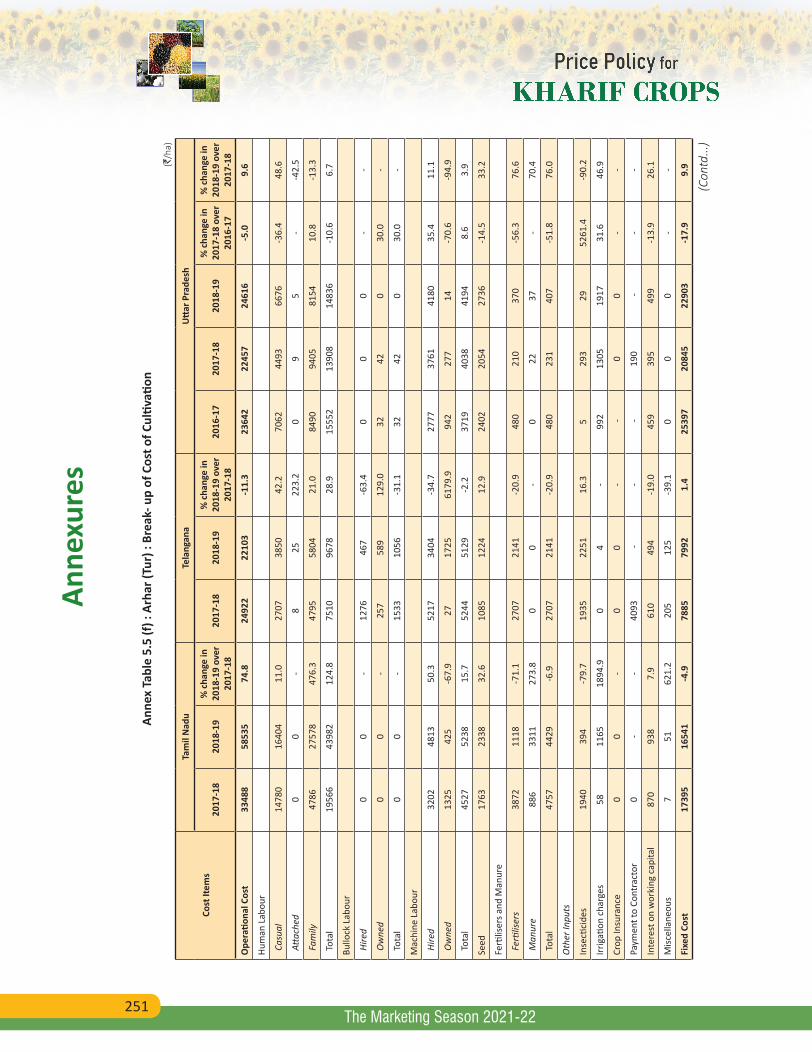
251
Anne
xure
s
The Marketing Season 2021-22
Anne
x Ta
ble
5.5
(f) :
Arh
ar (T
ur) :
Bre
ak- u
p of
Cos
t of C
ultiv
ation
(`/h
a)
Cost
Item
s
Tam
il N
adu
Tela
ngan
aU
ttar
Pra
desh
2017
-18
2018
-19
% c
hang
e in
20
18-1
9 ov
er
2017
-18
2017
-18
2018
-19
% c
hang
e in
20
18-1
9 ov
er
2017
-18
2016
-17
2017
-18
2018
-19
% c
hang
e in
20
17-1
8 ov
er
2016
-17
% c
hang
e in
20
18-1
9 ov
er
2017
-18
Ope
ratio
nal C
ost
3348
858
535
74.8
2492
222
103
-11.
323
642
2245
724
616
-5.0
9.6
Hum
an L
abou
r
Cas
ual
1478
016
404
11.0
2707
3850
42.2
7062
4493
6676
-36.
448
.6
Atta
ched
00
-8
2522
3.2
09
5-
-42.
5
Fam
ily47
8627
578
476.
347
9558
0421
.084
9094
0581
5410
.8-1
3.3
Tot
al19
566
4398
212
4.8
7510
9678
28.9
1555
213
908
1483
6-1
0.6
6.7
Bullo
ck L
abou
r
Hire
d0
0-
1276
467
-63.
40
00
--
Ow
ned
00
-25
758
912
9.0
3242
030
.0-
Tot
al0
0-
1533
1056
-31.
132
420
30.0
-
Mac
hine
Lab
our
Hire
d32
0248
1350
.352
1734
04-3
4.7
2777
3761
4180
35.4
11.1
Ow
ned
1325
425
-67.
927
1725
6179
.994
227
714
-70.
6-9
4.9
Tot
al45
2752
3815
.752
4451
29-2
.237
1940
3841
948.
63.
9
Seed
1763
2338
32.6
1085
1224
12.9
2402
2054
2736
-14.
533
.2
Ferti
liser
s and
Man
ure
Fer
tilise
rs38
7211
18-7
1.1
2707
2141
-20.
948
021
037
0-5
6.3
76.6
Man
ure
886
3311
273.
80
0-
022
37-
70.4
Tot
al47
5744
29-6
.927
0721
41-2
0.9
480
231
407
-51.
876
.0
Oth
er In
puts
Inse
ctici
des
1940
394
-79.
719
3522
5116
.35
293
2952
61.4
-90.
2
Irrig
ation
cha
rges
5811
6518
94.9
04
-99
213
0519
1731
.646
.9
Crop
Insu
ranc
e0
0-
00
- -
00
--
Paym
ent t
o Co
ntra
ctor
0-
-40
93 -
- -
190
--
-
Inte
rest
on
wor
king
cap
ital
870
938
7.9
610
494
-19.
045
939
549
9-1
3.9
26.1
Misc
ella
neou
s7
5162
1.2
205
125
-39.
10
00
--
Fixe
d Co
st17
395
1654
1-4
.978
8579
921.
425
397
2084
522
903
-17.
99.
9
(Con
td...
)
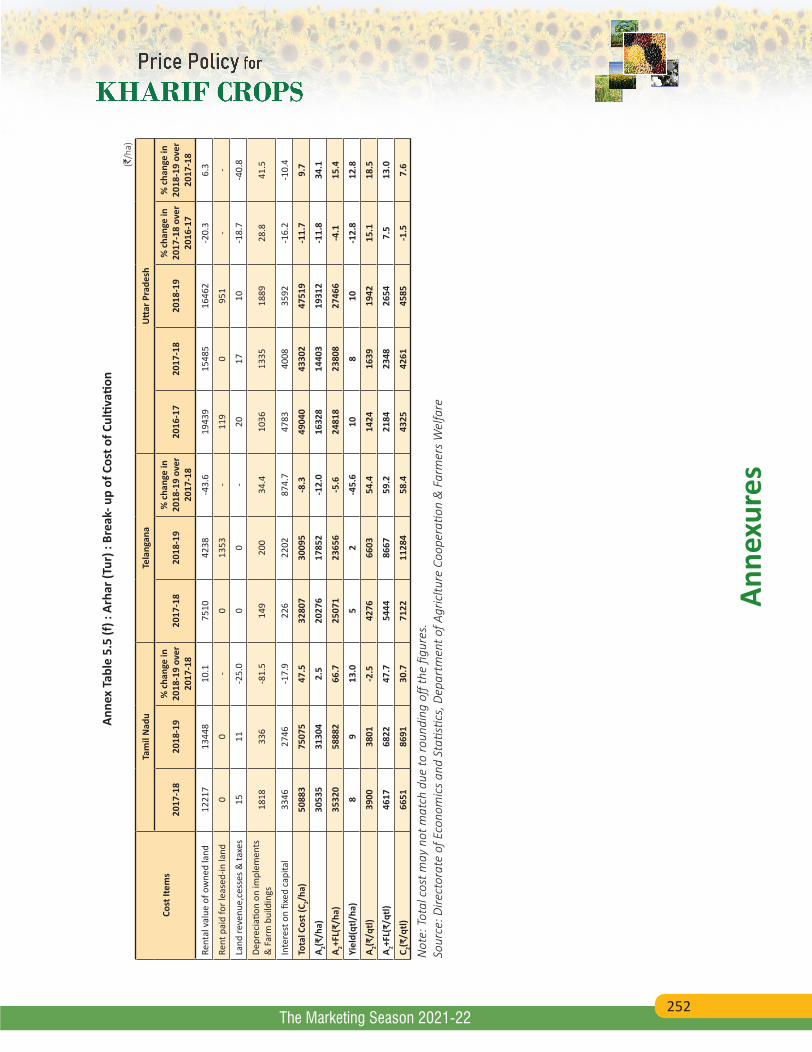
252
Anne
xure
s
The Marketing Season 2021-22
Anne
x Ta
ble
5.5
(f) :
Arh
ar (T
ur) :
Bre
ak- u
p of
Cos
t of C
ultiv
ation
(`/h
a)
Cost
Item
s
Tam
il N
adu
Tela
ngan
aU
ttar
Pra
desh
2017
-18
2018
-19
% c
hang
e in
20
18-1
9 ov
er
2017
-18
2017
-18
2018
-19
% c
hang
e in
20
18-1
9 ov
er
2017
-18
2016
-17
2017
-18
2018
-19
% c
hang
e in
20
17-1
8 ov
er
2016
-17
% c
hang
e in
20
18-1
9 ov
er
2017
-18
Rent
al v
alue
of o
wne
d la
nd12
217
1344
810
.175
1042
38-4
3.6
1943
915
485
1646
2-2
0.3
6.3
Rent
pai
d fo
r lea
sed-
in la
nd0
0-
013
53-
119
095
1-
-
Land
reve
nue,
cess
es &
taxe
s15
11-2
5.0
00
-20
1710
-18.
7-4
0.8
Depr
ecia
tion
on im
plem
ents
&
Far
m b
uild
ings
1818
336
-81.
514
920
034
.410
3613
3518
8928
.841
.5
Inte
rest
on
fixed
cap
ital
3346
2746
-17.
922
622
0287
4.7
4783
4008
3592
-16.
2-1
0.4
Tota
l Cos
t (C 2/h
a)50
883
7507
547
.532
807
3009
5-8
.349
040
4330
247
519
-11.
79.
7
A 2(₹/h
a)30
535
3130
42.
520
276
1785
2-1
2.0
1632
814
403
1931
2-1
1.8
34.1
A 2+FL(
₹/ha
)35
320
5888
266
.725
071
2365
6-5
.624
818
2380
827
466
-4.1
15.4
Yiel
d(qt
l/ha
)8
913
.05
2-4
5.6
108
10-1
2.8
12.8
A 2(₹/q
tl)39
0038
01-2
.542
7666
0354
.414
2416
3919
4215
.118
.5
A 2+FL(
₹/qt
l)46
1768
2247
.754
4486
6759
.221
8423
4826
547.
513
.0
C 2(₹/q
tl)66
5186
9130
.771
2211
284
58.4
4325
4261
4585
-1.5
7.6
Not
e: T
otal
cos
t may
not
mat
ch d
ue to
roun
ding
off
the
figur
es.
Sour
ce: D
irect
orat
e of
Eco
nom
ics
and
Stati
stics
, Dep
artm
ent o
f Agr
icltu
re C
oope
ratio
n &
Far
mer
s W
elfa
re
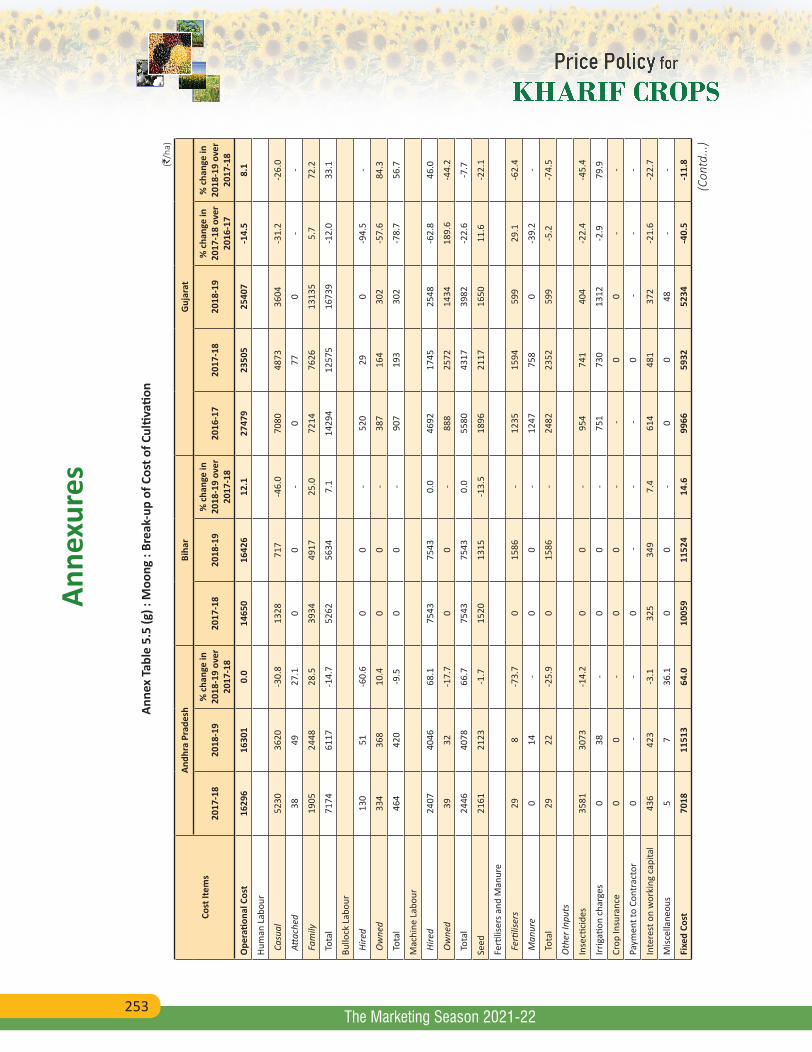
253
Anne
xure
s
The Marketing Season 2021-22
Anne
x Ta
ble
5.5
(g) :
Moo
ng :
Brea
k-up
of C
ost o
f Cul
tivati
on (`
/ha)
Cost
Item
s
Andh
ra P
rade
shBi
har
Guj
arat
2017
-18
2018
-19
% c
hang
e in
20
18-1
9 ov
er
2017
-18
2017
-18
2018
-19
% c
hang
e in
20
18-1
9 ov
er
2017
-18
2016
-17
2017
-18
2018
-19
% c
hang
e in
20
17-1
8 ov
er
2016
-17
% c
hang
e in
20
18-1
9 ov
er
2017
-18
Ope
ratio
nal C
ost
1629
616
301
0.0
1465
016
426
12.1
2747
923
505
2540
7-1
4.5
8.1
Hum
an L
abou
r
Cas
ual
5230
3620
-30.
813
2871
7-4
6.0
7080
4873
3604
-31.
2-2
6.0
Atta
ched
3849
27.1
00
-0
770
--
Fam
ily19
0524
4828
.539
3449
1725
.072
1476
2613
135
5.7
72.2
Tot
al71
7461
17-1
4.7
5262
5634
7.1
1429
412
575
1673
9-1
2.0
33.1
Bullo
ck L
abou
r
Hire
d13
051
-60.
60
0-
520
290
-94.
5-
Ow
ned
334
368
10.4
00
-38
716
430
2-5
7.6
84.3
Tot
al46
442
0-9
.50
0-
907
193
302
-78.
756
.7
Mac
hine
Lab
our
Hire
d24
0740
4668
.175
4375
430.
046
9217
4525
48-6
2.8
46.0
Ow
ned
3932
-17.
70
0-
888
2572
1434
189.
6-4
4.2
Tot
al24
4640
7866
.775
4375
430.
055
8043
1739
82-2
2.6
-7.7
Seed
2161
2123
-1.7
1520
1315
-13.
518
9621
1716
5011
.6-2
2.1
Ferti
liser
s and
Man
ure
Fer
tilise
rs29
8-7
3.7
015
86-
1235
1594
599
29.1
-62.
4
Man
ure
014
-0
0-
1247
758
0-3
9.2
-
Tot
al29
22-2
5.9
015
86-
2482
2352
599
-5.2
-74.
5
Oth
er In
puts
Inse
ctici
des
3581
3073
-14.
20
0-
954
741
404
-22.
4-4
5.4
Irrig
ation
cha
rges
038
-0
0-
751
730
1312
-2.9
79.9
Crop
Insu
ranc
e0
0-
00
- -
00
--
Paym
ent t
o Co
ntra
ctor
0 -
-0
--
-0
--
-
Inte
rest
on
wor
king
cap
ital
436
423
-3.1
325
349
7.4
614
481
372
-21.
6-2
2.7
Misc
ella
neou
s5
736
.10
0-
00
48-
-
Fixe
d Co
st70
1811
513
64.0
1005
911
524
14.6
9966
5932
5234
-40.
5-1
1.8
(Con
td...
)
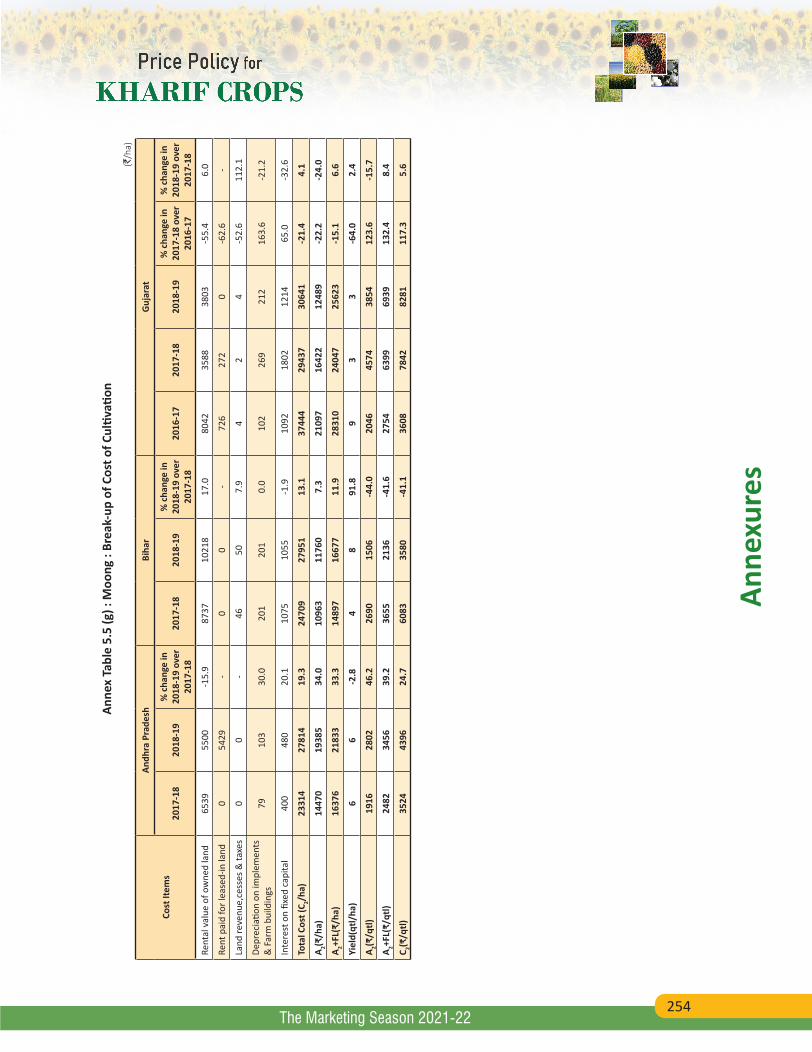
254
Anne
xure
s
The Marketing Season 2021-22
Anne
x Ta
ble
5.5
(g) :
Moo
ng :
Brea
k-up
of C
ost o
f Cul
tivati
on (`
/ha)
Cost
Item
s
Andh
ra P
rade
shBi
har
Guj
arat
2017
-18
2018
-19
% c
hang
e in
20
18-1
9 ov
er
2017
-18
2017
-18
2018
-19
% c
hang
e in
20
18-1
9 ov
er
2017
-18
2016
-17
2017
-18
2018
-19
% c
hang
e in
20
17-1
8 ov
er
2016
-17
% c
hang
e in
20
18-1
9 ov
er
2017
-18
Rent
al v
alue
of o
wne
d la
nd65
3955
00-1
5.9
8737
1021
817
.080
4235
8838
03-5
5.4
6.0
Rent
pai
d fo
r lea
sed-
in la
nd0
5429
-0
0-
726
272
0-6
2.6
-
Land
reve
nue,
cess
es &
taxe
s0
0-
4650
7.9
42
4-5
2.6
112.
1
Depr
ecia
tion
on im
plem
ents
&
Far
m b
uild
ings
7910
330
.020
120
10.
010
226
921
216
3.6
-21.
2
Inte
rest
on
fixed
cap
ital
400
480
20.1
1075
1055
-1.9
1092
1802
1214
65.0
-32.
6
Tota
l Cos
t (C 2/h
a)23
314
2781
419
.324
709
2795
113
.137
444
2943
730
641
-21.
44.
1
A 2(₹/h
a)14
470
1938
534
.010
963
1176
07.
321
097
1642
212
489
-22.
2-2
4.0
A 2+FL(
₹/ha
)16
376
2183
333
.314
897
1667
711
.928
310
2404
725
623
-15.
16.
6
Yiel
d(qt
l/ha
)6
6-2
.84
891
.89
33
-64.
02.
4
A 2(₹/q
tl)19
1628
0246
.226
9015
06-4
4.0
2046
4574
3854
123.
6-1
5.7
A 2+FL(
₹/qt
l)24
8234
5639
.236
5521
36-4
1.6
2754
6399
6939
132.
48.
4
C 2(₹/q
tl)35
2443
9624
.760
8335
80-4
1.1
3608
7842
8281
117.
35.
6
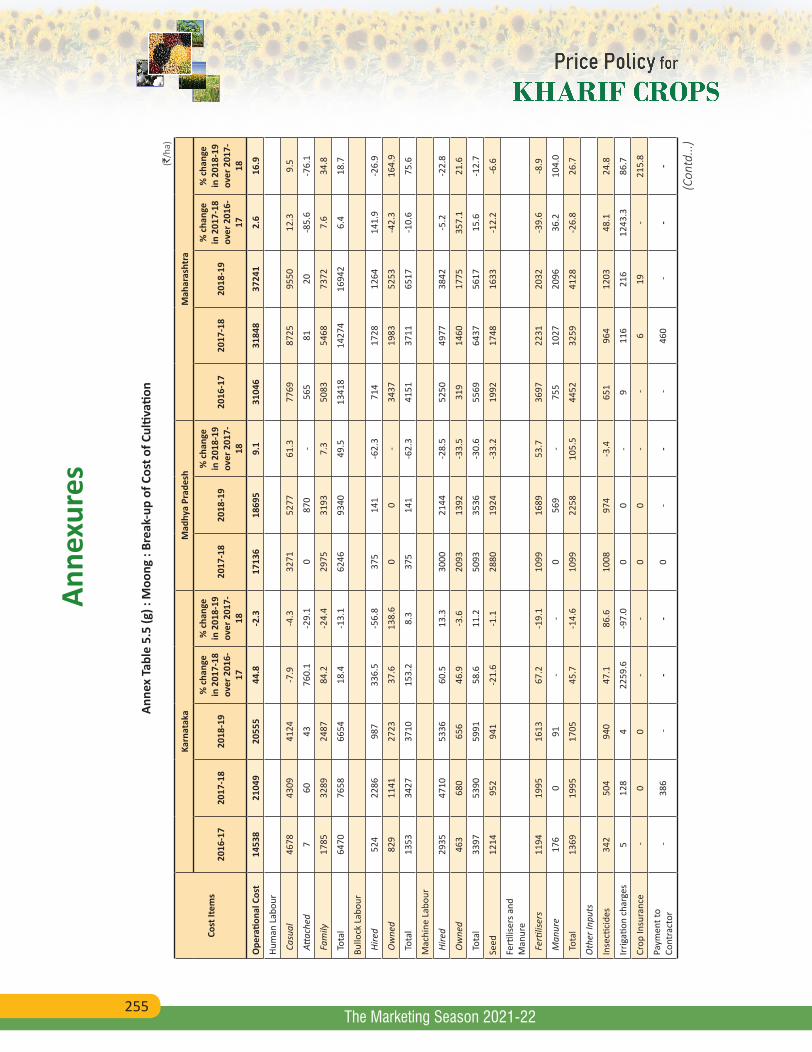
255
Anne
xure
s
The Marketing Season 2021-22
Anne
x Ta
ble
5.5
(g) :
Moo
ng :
Brea
k-up
of C
ost o
f Cul
tivati
on (`
/ha)
Cost
Item
s
Karn
atak
aM
adhy
a Pr
ades
hM
ahar
asht
ra
2016
-17
2017
-18
2018
-19
% c
hang
e in
201
7-18
ov
er 2
016-
17
% c
hang
e in
201
8-19
ov
er 2
017-
18
2017
-18
2018
-19
% c
hang
e in
201
8-19
ov
er 2
017-
18
2016
-17
2017
-18
2018
-19
% c
hang
e in
201
7-18
ov
er 2
016-
17
% c
hang
e in
201
8-19
ov
er 2
017-
18
Ope
ratio
nal C
ost
1453
821
049
2055
544
.8-2
.317
136
1869
59.
131
046
3184
837
241
2.6
16.9
Hum
an L
abou
r
Cas
ual
4678
4309
4124
-7.9
-4.3
3271
5277
61.3
7769
8725
9550
12.3
9.5
Atta
ched
760
4376
0.1
-29.
10
870
-56
581
20-8
5.6
-76.
1
Fam
ily17
8532
8924
8784
.2-2
4.4
2975
3193
7.3
5083
5468
7372
7.6
34.8
Tot
al64
7076
5866
5418
.4-1
3.1
6246
9340
49.5
1341
814
274
1694
26.
418
.7
Bullo
ck L
abou
r
Hire
d52
422
8698
733
6.5
-56.
837
514
1-6
2.3
714
1728
1264
141.
9-2
6.9
Ow
ned
829
1141
2723
37.6
138.
60
0-
3437
1983
5253
-42.
316
4.9
Tot
al13
5334
2737
1015
3.2
8.3
375
141
-62.
341
5137
1165
17-1
0.6
75.6
Mac
hine
Lab
our
Hire
d29
3547
1053
3660
.513
.330
0021
44-2
8.5
5250
4977
3842
-5.2
-22.
8
Ow
ned
463
680
656
46.9
-3.6
2093
1392
-33.
531
914
6017
7535
7.1
21.6
Tot
al33
9753
9059
9158
.611
.250
9335
36-3
0.6
5569
6437
5617
15.6
-12.
7
Seed
1214
952
941
-21.
6-1
.128
8019
24-3
3.2
1992
1748
1633
-12.
2-6
.6
Ferti
liser
s and
M
anur
e
Fer
tilise
rs11
9419
9516
1367
.2-1
9.1
1099
1689
53.7
3697
2231
2032
-39.
6-8
.9
Man
ure
176
091
--
056
9-
755
1027
2096
36.2
104.
0
Tot
al13
6919
9517
0545
.7-1
4.6
1099
2258
105.
544
5232
5941
28-2
6.8
26.7
Oth
er In
puts
Inse
ctici
des
342
504
940
47.1
86.6
1008
974
-3.4
651
964
1203
48.1
24.8
Irrig
ation
cha
rges
512
84
2259
.6-9
7.0
00
-9
116
216
1243
.386
.7
Crop
Insu
ranc
e -
00
--
00
- -
619
-21
5.8
Paym
ent t
o Co
ntra
ctor
-38
6 -
--
0-
- -
460
--
-
(Con
td...
)
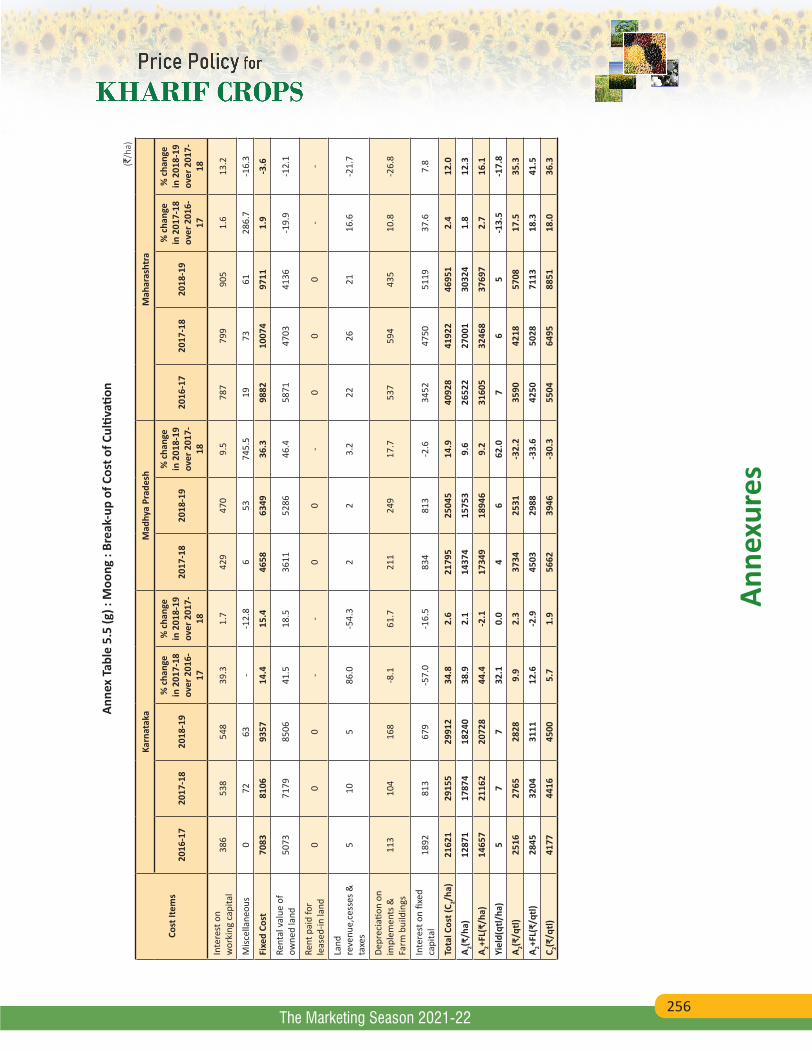
256
Anne
xure
s
The Marketing Season 2021-22
Anne
x Ta
ble
5.5
(g) :
Moo
ng :
Brea
k-up
of C
ost o
f Cul
tivati
on (`
/ha)
Cost
Item
s
Karn
atak
aM
adhy
a Pr
ades
hM
ahar
asht
ra
2016
-17
2017
-18
2018
-19
% c
hang
e in
201
7-18
ov
er 2
016-
17
% c
hang
e in
201
8-19
ov
er 2
017-
18
2017
-18
2018
-19
% c
hang
e in
201
8-19
ov
er 2
017-
18
2016
-17
2017
-18
2018
-19
% c
hang
e in
201
7-18
ov
er 2
016-
17
% c
hang
e in
201
8-19
ov
er 2
017-
18
Inte
rest
on
wor
king
cap
ital
386
538
548
39.3
1.7
429
470
9.5
787
799
905
1.6
13.2
Misc
ella
neou
s0
7263
--1
2.8
653
745.
519
7361
286.
7-1
6.3
Fixe
d Co
st70
8381
0693
5714
.415
.446
5863
4936
.398
8210
074
9711
1.9
-3.6
Rent
al v
alue
of
owne
d la
nd50
7371
7985
0641
.518
.536
1152
8646
.458
7147
0341
36-1
9.9
-12.
1
Rent
pai
d fo
r le
ased
-in la
nd0
00
--
00
-0
00
--
Land
re
venu
e,ce
sses
&
taxe
s5
105
86.0
-54.
32
23.
222
2621
16.6
-21.
7
Depr
ecia
tion
on
impl
emen
ts &
Fa
rm b
uild
ings
113
104
168
-8.1
61.7
211
249
17.7
537
594
435
10.8
-26.
8
Inte
rest
on
fixed
ca
pita
l18
9281
367
9-5
7.0
-16.
583
481
3-2
.634
5247
5051
1937
.67.
8
Tota
l Cos
t (C 2/h
a)21
621
2915
529
912
34.8
2.6
2179
525
045
14.9
4092
841
922
4695
12.
412
.0
A 2(₹/h
a)12
871
1787
418
240
38.9
2.1
1437
415
753
9.6
2652
227
001
3032
41.
812
.3
A 2+FL(
₹/ha
)14
657
2116
220
728
44.4
-2.1
1734
918
946
9.2
3160
532
468
3769
72.
716
.1
Yiel
d(qt
l/ha
)5
77
32.1
0.0
46
62.0
76
5-1
3.5
-17.
8
A 2(₹/q
tl)25
1627
6528
289.
92.
337
3425
31-3
2.2
3590
4218
5708
17.5
35.3
A 2+FL(
₹/qt
l)28
4532
0431
1112
.6-2
.945
0329
88-3
3.6
4250
5028
7113
18.3
41.5
C 2(₹/q
tl)41
7744
1645
005.
71.
956
6239
46-3
0.3
5504
6495
8851
18.0
36.3
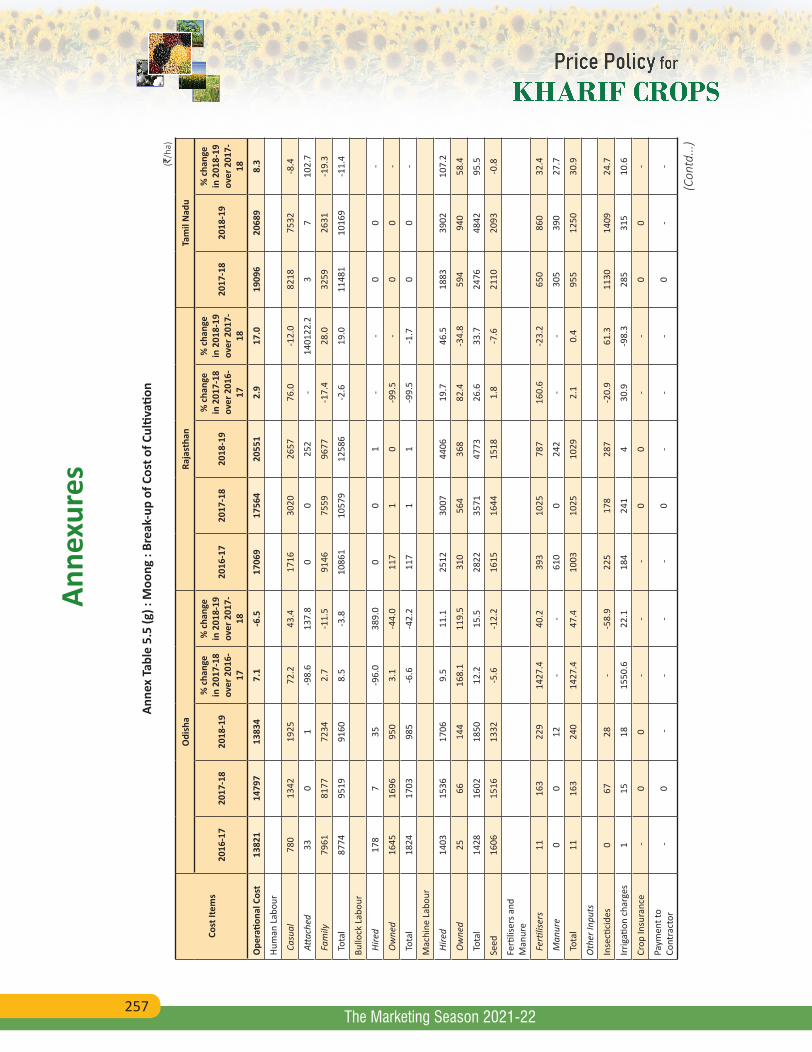
257
Anne
xure
s
The Marketing Season 2021-22
Anne
x Ta
ble
5.5
(g) :
Moo
ng :
Brea
k-up
of C
ost o
f Cul
tivati
on (`
/ha)
Cost
Item
s
Odi
sha
Raja
stha
nTa
mil
Nad
u
2016
-17
2017
-18
2018
-19
% c
hang
e in
201
7-18
ov
er 2
016-
17
% c
hang
e in
201
8-19
ov
er 2
017-
18
2016
-17
2017
-18
2018
-19
% c
hang
e in
201
7-18
ov
er 2
016-
17
% c
hang
e in
201
8-19
ov
er 2
017-
18
2017
-18
2018
-19
% c
hang
e in
201
8-19
ov
er 2
017-
18
Ope
ratio
nal C
ost
1382
114
797
1383
47.
1-6
.517
069
1756
420
551
2.9
17.0
1909
620
689
8.3
Hum
an L
abou
r
Cas
ual
780
1342
1925
72.2
43.4
1716
3020
2657
76.0
-12.
082
1875
32-8
.4
Atta
ched
330
1-9
8.6
137.
80
025
2-
1401
22.2
37
102.
7
Fam
ily79
6181
7772
342.
7-1
1.5
9146
7559
9677
-17.
428
.032
5926
31-1
9.3
Tot
al87
7495
1991
608.
5-3
.810
861
1057
912
586
-2.6
19.0
1148
110
169
-11.
4
Bullo
ck L
abou
r
Hire
d17
87
35-9
6.0
389.
00
01
--
00
-
Ow
ned
1645
1696
950
3.1
-44.
011
71
0-9
9.5
-0
0-
Tot
al18
2417
0398
5-6
.6-4
2.2
117
11
-99.
5-1
.70
0-
Mac
hine
Lab
our
Hire
d14
0315
3617
069.
511
.125
1230
0744
0619
.746
.518
8339
0210
7.2
Ow
ned
2566
144
168.
111
9.5
310
564
368
82.4
-34.
859
494
058
.4
Tot
al14
2816
0218
5012
.215
.528
2235
7147
7326
.633
.724
7648
4295
.5
Seed
1606
1516
1332
-5.6
-12.
216
1516
4415
181.
8-7
.621
1020
93-0
.8
Ferti
liser
s and
M
anur
e
Fer
tilise
rs11
163
229
1427
.440
.239
310
2578
716
0.6
-23.
265
086
032
.4
Man
ure
00
12-
-61
00
242
--
305
390
27.7
Tot
al11
163
240
1427
.447
.410
0310
2510
292.
10.
495
512
5030
.9
Oth
er In
puts
Inse
ctici
des
067
28-
-58.
922
517
828
7-2
0.9
61.3
1130
1409
24.7
Irrig
ation
cha
rges
115
1815
50.6
22.1
184
241
430
.9-9
8.3
285
315
10.6
Crop
Insu
ranc
e -
00
--
-0
0-
-0
0-
Paym
ent t
o Co
ntra
ctor
-0
--
- -
0-
--
0-
-
(Con
td...
)
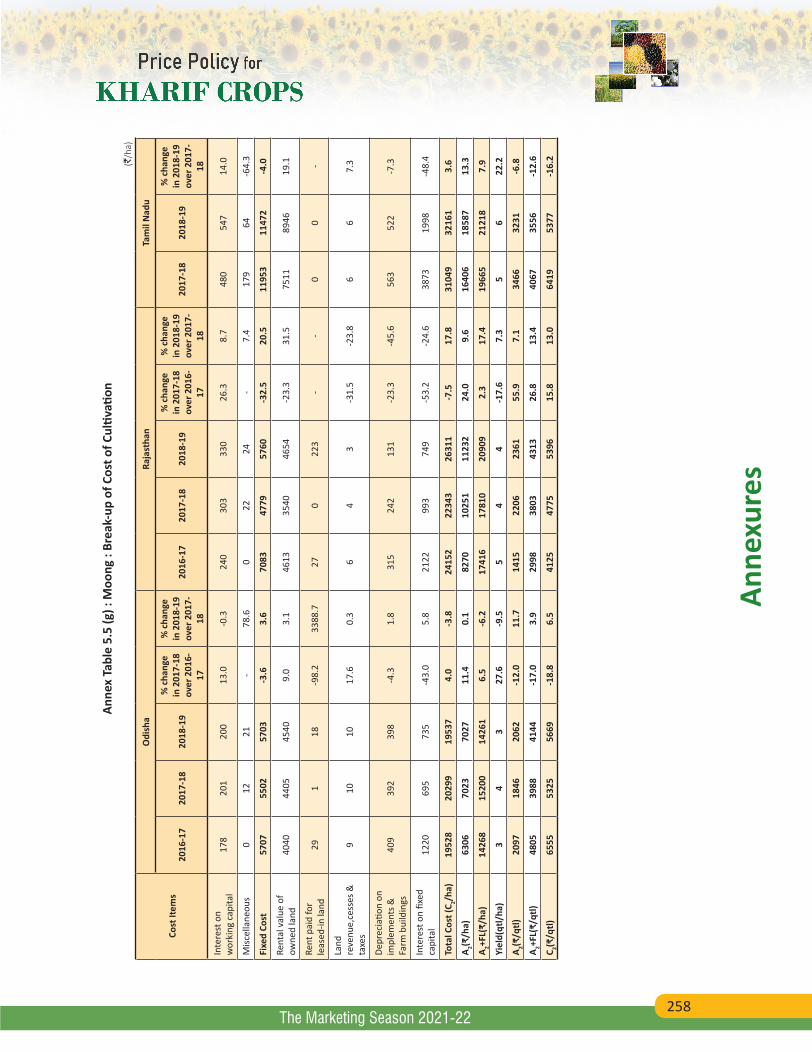
258
Anne
xure
s
The Marketing Season 2021-22
Anne
x Ta
ble
5.5
(g) :
Moo
ng :
Brea
k-up
of C
ost o
f Cul
tivati
on (`
/ha)
Cost
Item
s
Odi
sha
Raja
stha
nTa
mil
Nad
u
2016
-17
2017
-18
2018
-19
% c
hang
e in
201
7-18
ov
er 2
016-
17
% c
hang
e in
201
8-19
ov
er 2
017-
18
2016
-17
2017
-18
2018
-19
% c
hang
e in
201
7-18
ov
er 2
016-
17
% c
hang
e in
201
8-19
ov
er 2
017-
18
2017
-18
2018
-19
% c
hang
e in
201
8-19
ov
er 2
017-
18
Inte
rest
on
wor
king
cap
ital
178
201
200
13.0
-0.3
240
303
330
26.3
8.7
480
547
14.0
Misc
ella
neou
s0
1221
-78
.60
2224
-7.
417
964
-64.
3
Fixe
d Co
st57
0755
0257
03-3
.63.
670
8347
7957
60-3
2.5
20.5
1195
311
472
-4.0
Rent
al v
alue
of
owne
d la
nd40
4044
0545
409.
03.
146
1335
4046
54-2
3.3
31.5
7511
8946
19.1
Rent
pai
d fo
r le
ased
-in la
nd29
118
-98.
233
88.7
270
223
--
00
-
Land
re
venu
e,ce
sses
&
taxe
s9
1010
17.6
0.3
64
3-3
1.5
-23.
86
67.
3
Depr
ecia
tion
on
impl
emen
ts &
Fa
rm b
uild
ings
409
392
398
-4.3
1.8
315
242
131
-23.
3-4
5.6
563
522
-7.3
Inte
rest
on
fixed
ca
pita
l12
2069
573
5-4
3.0
5.8
2122
993
749
-53.
2-2
4.6
3873
1998
-48.
4
Tota
l Cos
t (C 2/h
a)19
528
2029
919
537
4.0
-3.8
2415
222
343
2631
1-7
.517
.831
049
3216
13.
6
A 2(₹/h
a)63
0670
2370
2711
.40.
182
7010
251
1123
224
.09.
616
406
1858
713
.3
A 2+FL(
₹/ha
)14
268
1520
014
261
6.5
-6.2
1741
617
810
2090
92.
317
.419
665
2121
87.
9
Yiel
d(qt
l/ha
)3
43
27.6
-9.5
54
4-1
7.6
7.3
56
22.2
A 2(₹/q
tl)20
9718
4620
62-1
2.0
11.7
1415
2206
2361
55.9
7.1
3466
3231
-6.8
A 2+FL(
₹/qt
l)48
0539
8841
44-1
7.0
3.9
2998
3803
4313
26.8
13.4
4067
3556
-12.
6
C 2(₹/q
tl)65
5553
2556
69-1
8.8
6.5
4125
4775
5396
15.8
13.0
6419
5377
-16.
2
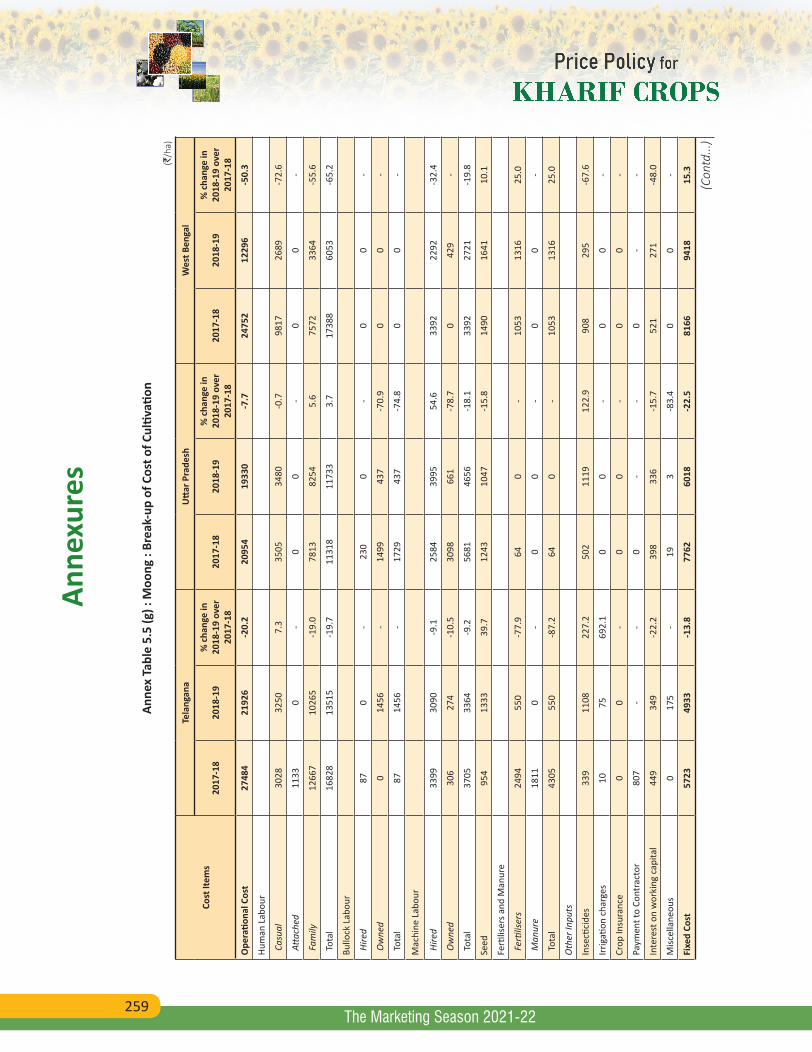
259
Anne
xure
s
The Marketing Season 2021-22
Anne
x Ta
ble
5.5
(g) :
Moo
ng :
Brea
k-up
of C
ost o
f Cul
tivati
on (`
/ha)
Cost
Item
s
Tela
ngan
aU
ttar
Pra
desh
Wes
t Ben
gal
2017
-18
2018
-19
% c
hang
e in
20
18-1
9 ov
er
2017
-18
2017
-18
2018
-19
% c
hang
e in
20
18-1
9 ov
er
2017
-18
2017
-18
2018
-19
% c
hang
e in
20
18-1
9 ov
er
2017
-18
Ope
ratio
nal C
ost
2748
421
926
-20.
220
954
1933
0-7
.724
752
1229
6-5
0.3
Hum
an L
abou
r
Cas
ual
3028
3250
7.3
3505
3480
-0.7
9817
2689
-72.
6
Atta
ched
1133
0-
00
-0
0-
Fam
ily12
667
1026
5-1
9.0
7813
8254
5.6
7572
3364
-55.
6
Tot
al16
828
1351
5-1
9.7
1131
811
733
3.7
1738
860
53-6
5.2
Bullo
ck L
abou
r
Hire
d87
0-
230
0-
00
-
Ow
ned
014
56-
1499
437
-70.
90
0-
Tot
al87
1456
-17
2943
7-7
4.8
00
-
Mac
hine
Lab
our
Hire
d33
9930
90-9
.125
8439
9554
.633
9222
92-3
2.4
Ow
ned
306
274
-10.
530
9866
1-7
8.7
042
9-
Tot
al37
0533
64-9
.256
8146
56-1
8.1
3392
2721
-19.
8
Seed
954
1333
39.7
1243
1047
-15.
814
9016
4110
.1
Ferti
liser
s and
Man
ure
Fer
tilise
rs24
9455
0-7
7.9
640
-10
5313
1625
.0
Man
ure
1811
0-
00
-0
0-
Tot
al43
0555
0-8
7.2
640
-10
5313
1625
.0
Oth
er In
puts
Inse
ctici
des
339
1108
227.
250
211
1912
2.9
908
295
-67.
6
Irrig
ation
cha
rges
1075
692.
10
0-
00
-
Crop
Insu
ranc
e0
0-
00
-0
0-
Paym
ent t
o Co
ntra
ctor
807
--
0-
-0
--
Inte
rest
on
wor
king
cap
ital
449
349
-22.
239
833
6-1
5.7
521
271
-48.
0
Misc
ella
neou
s0
175
-19
3-8
3.4
00
-
Fixe
d Co
st57
2349
33-1
3.8
7762
6018
-22.
581
6694
1815
.3
(Con
td...
)
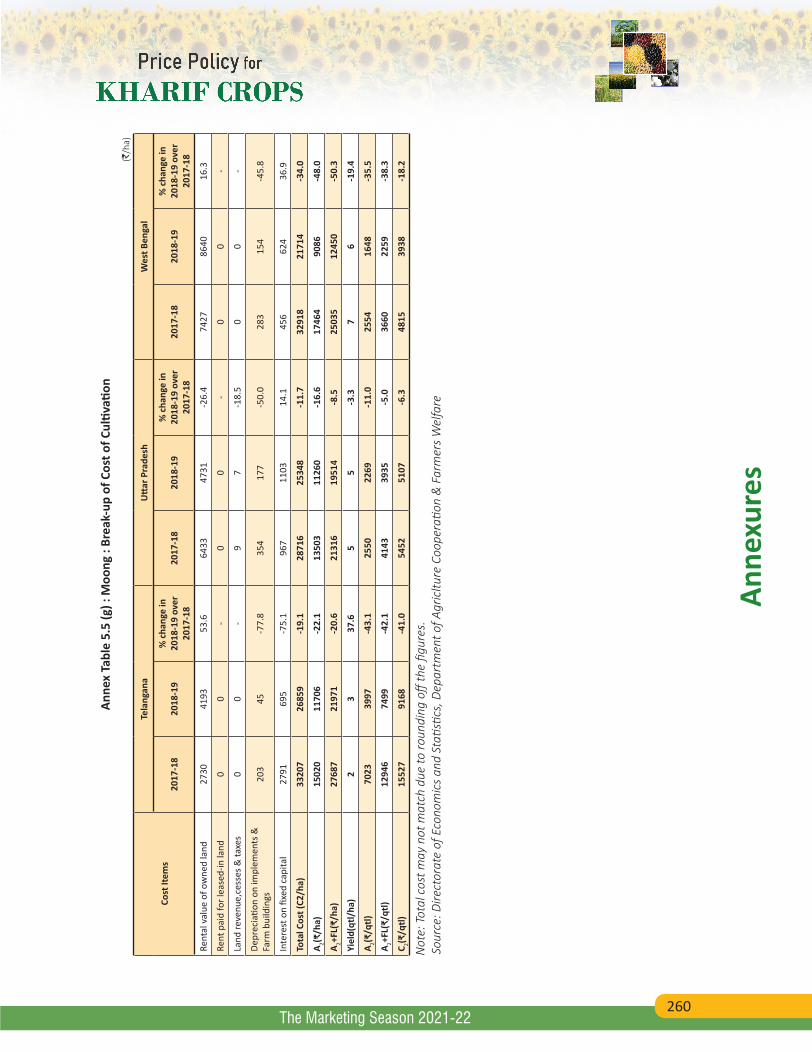
260
Anne
xure
s
The Marketing Season 2021-22
Anne
x Ta
ble
5.5
(g) :
Moo
ng :
Brea
k-up
of C
ost o
f Cul
tivati
on (`
/ha)
Cost
Item
s
Tela
ngan
aU
ttar
Pra
desh
Wes
t Ben
gal
2017
-18
2018
-19
% c
hang
e in
20
18-1
9 ov
er
2017
-18
2017
-18
2018
-19
% c
hang
e in
20
18-1
9 ov
er
2017
-18
2017
-18
2018
-19
% c
hang
e in
20
18-1
9 ov
er
2017
-18
Rent
al v
alue
of o
wne
d la
nd27
3041
9353
.664
3347
31-2
6.4
7427
8640
16.3
Rent
pai
d fo
r lea
sed-
in la
nd0
0-
00
-0
0-
Land
reve
nue,
cess
es &
taxe
s0
0-
97
-18.
50
0-
Depr
ecia
tion
on im
plem
ents
&
Farm
bui
ldin
gs20
345
-77.
835
417
7-5
0.0
283
154
-45.
8
Inte
rest
on
fixed
cap
ital
2791
695
-75.
196
711
0314
.145
662
436
.9
Tota
l Cos
t (C2
/ha)
3320
726
859
-19.
128
716
2534
8-1
1.7
3291
821
714
-34.
0
A 2(₹/h
a)15
020
1170
6-2
2.1
1350
311
260
-16.
617
464
9086
-48.
0
A 2+FL(
₹/ha
)27
687
2197
1-2
0.6
2131
619
514
-8.5
2503
512
450
-50.
3
Yiel
d(qt
l/ha
)2
337
.65
5-3
.37
6-1
9.4
A 2(₹/q
tl)70
2339
97-4
3.1
2550
2269
-11.
025
5416
48-3
5.5
A 2+FL(
₹/qt
l)12
946
7499
-42.
141
4339
35-5
.036
6022
59-3
8.3
C 2(₹/q
tl)15
527
9168
-41.
054
5251
07-6
.348
1539
38-1
8.2
Not
e: T
otal
cos
t may
not
mat
ch d
ue to
roun
ding
off
the
figur
es.
Sour
ce: D
irect
orat
e of
Eco
nom
ics
and
Stati
stics
, Dep
artm
ent o
f Agr
icltu
re C
oope
ratio
n &
Far
mer
s W
elfa
re
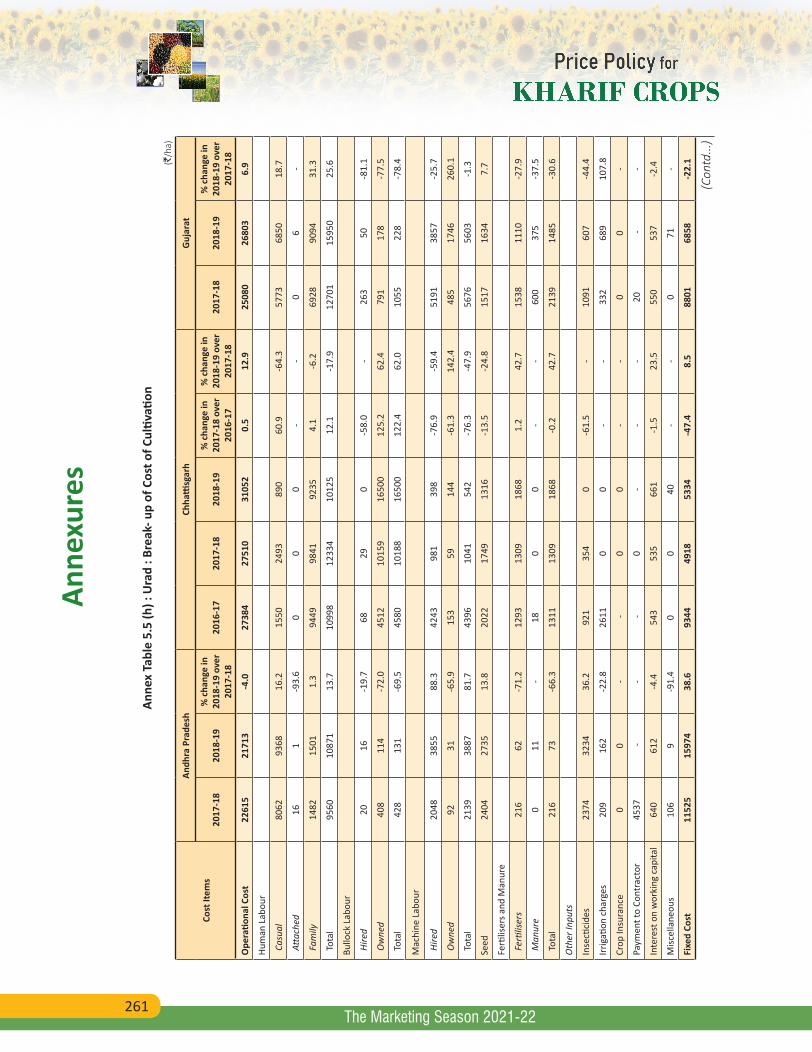
261
Anne
xure
s
The Marketing Season 2021-22
Anne
x Ta
ble
5.5
(h) :
Ura
d : B
reak
- up
of C
ost o
f Cul
tivati
on (`
/ha)
Cost
Item
s
Andh
ra P
rade
shCh
hatti
sgar
hG
ujar
at
2017
-18
2018
-19
% c
hang
e in
20
18-1
9 ov
er
2017
-18
2016
-17
2017
-18
2018
-19
% c
hang
e in
20
17-1
8 ov
er
2016
-17
% c
hang
e in
20
18-1
9 ov
er
2017
-18
2017
-18
2018
-19
% c
hang
e in
20
18-1
9 ov
er
2017
-18
Ope
ratio
nal C
ost
2261
521
713
-4.0
2738
427
510
3105
20.
512
.925
080
2680
36.
9
Hum
an L
abou
r
Cas
ual
8062
9368
16.2
1550
2493
890
60.9
-64.
357
7368
5018
.7
Atta
ched
161
-93.
60
00
--
06
-
Fam
ily14
8215
011.
394
4998
4192
354.
1-6
.269
2890
9431
.3
Tot
al95
6010
871
13.7
1099
812
334
1012
512
.1-1
7.9
1270
115
950
25.6
Bullo
ck L
abou
r
Hire
d20
16-1
9.7
6829
0-5
8.0
-26
350
-81.
1
Ow
ned
408
114
-72.
045
1210
159
1650
012
5.2
62.4
791
178
-77.
5
Tot
al42
813
1-6
9.5
4580
1018
816
500
122.
462
.010
5522
8-7
8.4
Mac
hine
Lab
our
Hire
d20
4838
5588
.342
4398
139
8-7
6.9
-59.
451
9138
57-2
5.7
Ow
ned
9231
-65.
915
359
144
-61.
314
2.4
485
1746
260.
1
Tot
al21
3938
8781
.743
9610
4154
2-7
6.3
-47.
956
7656
03-1
.3
Seed
2404
2735
13.8
2022
1749
1316
-13.
5-2
4.8
1517
1634
7.7
Ferti
liser
s and
Man
ure
Fer
tilise
rs21
662
-71.
212
9313
0918
681.
242
.715
3811
10-2
7.9
Man
ure
011
-18
00
--
600
375
-37.
5
Tot
al21
673
-66.
313
1113
0918
68-0
.242
.721
3914
85-3
0.6
Oth
er In
puts
Inse
ctici
des
2374
3234
36.2
921
354
0-6
1.5
-10
9160
7-4
4.4
Irrig
ation
cha
rges
209
162
-22.
826
110
0-
-33
268
910
7.8
Crop
Insu
ranc
e0
0-
-0
0-
-0
0-
Paym
ent t
o Co
ntra
ctor
4537
--
-0
--
-20
--
Inte
rest
on
wor
king
cap
ital
640
612
-4.4
543
535
661
-1.5
23.5
550
537
-2.4
Misc
ella
neou
s10
69
-91.
40
040
--
071
-
Fixe
d Co
st11
525
1597
438
.693
4449
1853
34-4
7.4
8.5
8801
6858
-22.
1
(Con
td...
)
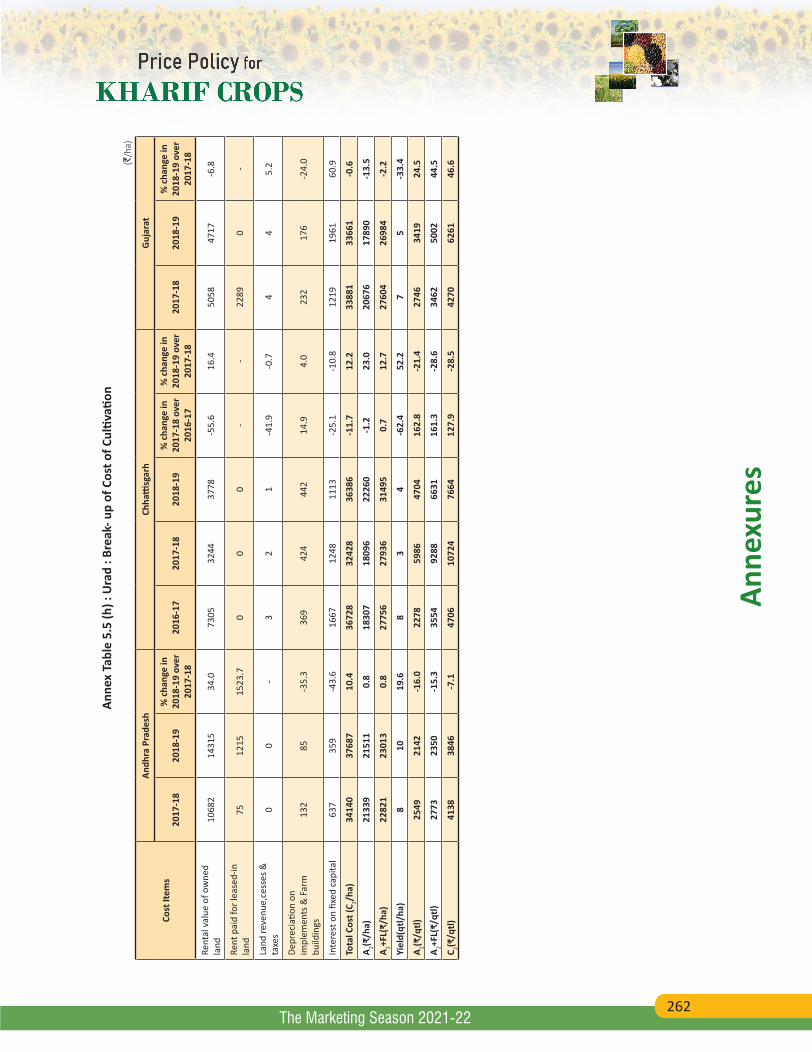
262
Anne
xure
s
The Marketing Season 2021-22
Anne
x Ta
ble
5.5
(h) :
Ura
d : B
reak
- up
of C
ost o
f Cul
tivati
on (`
/ha)
Cost
Item
s
Andh
ra P
rade
shCh
hatti
sgar
hG
ujar
at
2017
-18
2018
-19
% c
hang
e in
20
18-1
9 ov
er
2017
-18
2016
-17
2017
-18
2018
-19
% c
hang
e in
20
17-1
8 ov
er
2016
-17
% c
hang
e in
20
18-1
9 ov
er
2017
-18
2017
-18
2018
-19
% c
hang
e in
20
18-1
9 ov
er
2017
-18
Rent
al v
alue
of o
wne
d la
nd10
682
1431
534
.073
0532
4437
78-5
5.6
16.4
5058
4717
-6.8
Rent
pai
d fo
r lea
sed-
in
land
7512
1515
23.7
00
0-
-22
890
-
Land
reve
nue,
cess
es &
ta
xes
00
-3
21
-41.
9-0
.74
45.
2
Depr
ecia
tion
on
impl
emen
ts &
Far
m
build
ings
132
85-3
5.3
369
424
442
14.9
4.0
232
176
-24.
0
Inte
rest
on
fixed
cap
ital
637
359
-43.
616
6712
4811
13-2
5.1
-10.
812
1919
6160
.9
Tota
l Cos
t (C 2/h
a)34
140
3768
710
.436
728
3242
836
386
-11.
712
.233
881
3366
1-0
.6
A 2(₹/h
a)21
339
2151
10.
818
307
1809
622
260
-1.2
23.0
2067
617
890
-13.
5
A 2+FL(
₹/ha
)22
821
2301
30.
827
756
2793
631
495
0.7
12.7
2760
426
984
-2.2
Yiel
d(qt
l/ha
)8
1019
.68
34
-62.
452
.27
5-3
3.4
A 2(₹/q
tl)25
4921
42-1
6.0
2278
5986
4704
162.
8-2
1.4
2746
3419
24.5
A 2+FL(
₹/qt
l)27
7323
50-1
5.3
3554
9288
6631
161.
3-2
8.6
3462
5002
44.5
C 2(₹/q
tl)41
3838
46-7
.147
0610
724
7664
127.
9-2
8.5
4270
6261
46.6
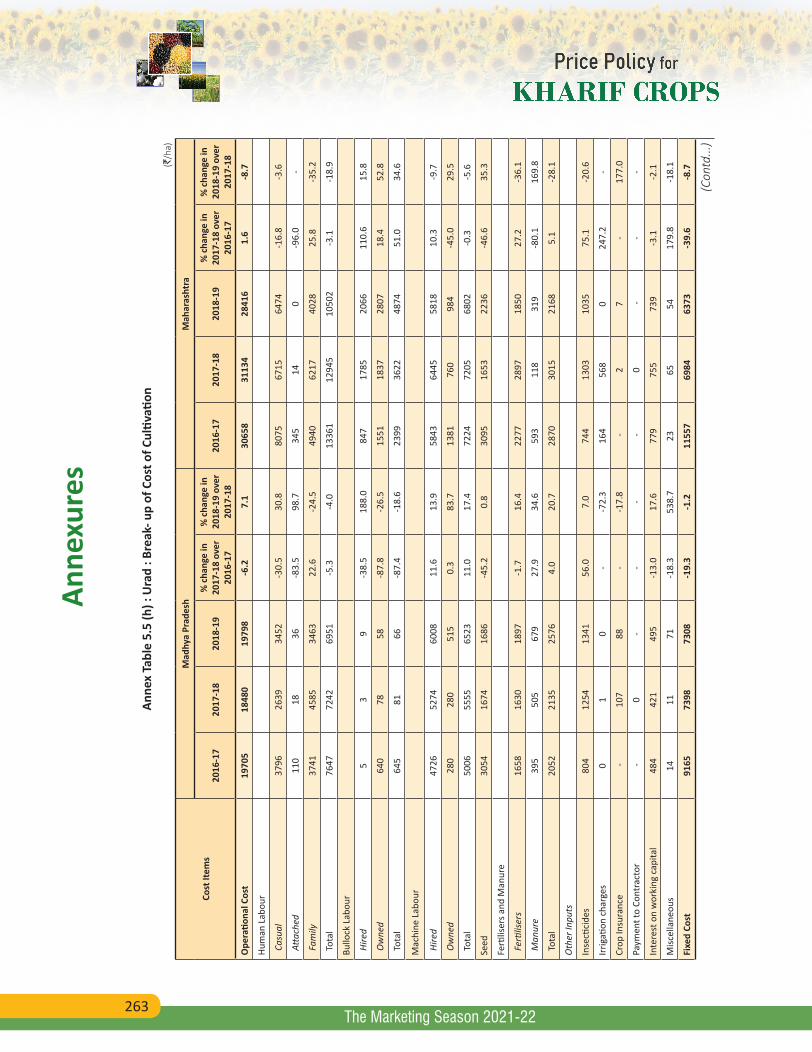
263
Anne
xure
s
The Marketing Season 2021-22
Anne
x Ta
ble
5.5
(h) :
Ura
d : B
reak
- up
of C
ost o
f Cul
tivati
on (`
/ha)
Cost
Item
s
Mad
hya
Prad
esh
Mah
aras
htra
2016
-17
2017
-18
2018
-19
% c
hang
e in
20
17-1
8 ov
er
2016
-17
% c
hang
e in
20
18-1
9 ov
er
2017
-18
2016
-17
2017
-18
2018
-19
% c
hang
e in
20
17-1
8 ov
er
2016
-17
% c
hang
e in
20
18-1
9 ov
er
2017
-18
Ope
ratio
nal C
ost
1970
518
480
1979
8-6
.27.
130
658
3113
428
416
1.6
-8.7
Hum
an L
abou
r
Cas
ual
3796
2639
3452
-30.
530
.880
7567
1564
74-1
6.8
-3.6
Atta
ched
110
1836
-83.
598
.734
514
0-9
6.0
-
Fam
ily37
4145
8534
6322
.6-2
4.5
4940
6217
4028
25.8
-35.
2
Tot
al76
4772
4269
51-5
.3-4
.013
361
1294
510
502
-3.1
-18.
9
Bullo
ck L
abou
r
Hire
d5
39
-38.
518
8.0
847
1785
2066
110.
615
.8
Ow
ned
640
7858
-87.
8-2
6.5
1551
1837
2807
18.4
52.8
Tot
al64
581
66-8
7.4
-18.
623
9936
2248
7451
.034
.6
Mac
hine
Lab
our
Hire
d47
2652
7460
0811
.613
.958
4364
4558
1810
.3-9
.7
Ow
ned
280
280
515
0.3
83.7
1381
760
984
-45.
029
.5
Tot
al50
0655
5565
2311
.017
.472
2472
0568
02-0
.3-5
.6
Seed
3054
1674
1686
-45.
20.
830
9516
5322
36-4
6.6
35.3
Ferti
liser
s and
Man
ure
Fer
tilise
rs16
5816
3018
97-1
.716
.422
7728
9718
5027
.2-3
6.1
Man
ure
395
505
679
27.9
34.6
593
118
319
-80.
116
9.8
Tot
al20
5221
3525
764.
020
.728
7030
1521
685.
1-2
8.1
Oth
er In
puts
Inse
ctici
des
804
1254
1341
56.0
7.0
744
1303
1035
75.1
-20.
6
Irrig
ation
cha
rges
01
0-
-72.
316
456
80
247.
2-
Crop
Insu
ranc
e -
107
88-
-17.
8 -
27
-17
7.0
Paym
ent t
o Co
ntra
ctor
-0
--
- -
0 -
--
Inte
rest
on
wor
king
cap
ital
484
421
495
-13.
017
.677
975
573
9-3
.1-2
.1
Misc
ella
neou
s14
1171
-18.
353
8.7
2365
5417
9.8
-18.
1
Fixe
d Co
st91
6573
9873
08-1
9.3
-1.2
1155
769
8463
73-3
9.6
-8.7
(Con
td...
)
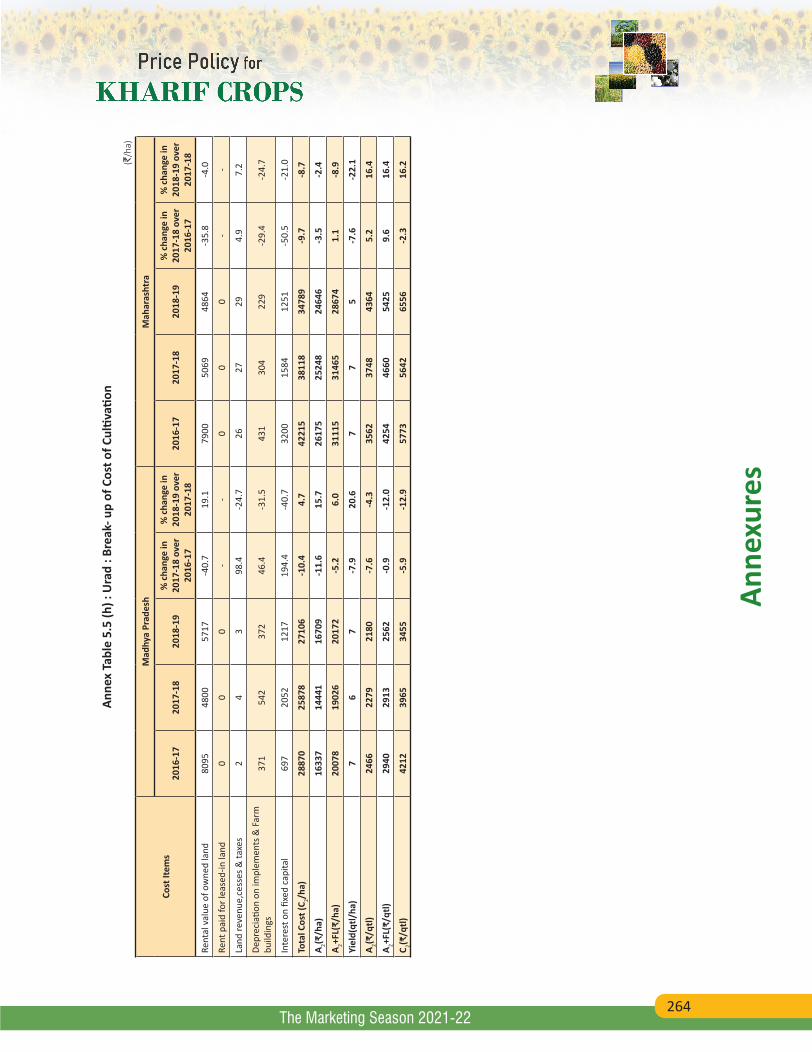
264
Anne
xure
s
The Marketing Season 2021-22
Anne
x Ta
ble
5.5
(h) :
Ura
d : B
reak
- up
of C
ost o
f Cul
tivati
on (`
/ha)
Cost
Item
s
Mad
hya
Prad
esh
Mah
aras
htra
2016
-17
2017
-18
2018
-19
% c
hang
e in
20
17-1
8 ov
er
2016
-17
% c
hang
e in
20
18-1
9 ov
er
2017
-18
2016
-17
2017
-18
2018
-19
% c
hang
e in
20
17-1
8 ov
er
2016
-17
% c
hang
e in
20
18-1
9 ov
er
2017
-18
Rent
al v
alue
of o
wne
d la
nd80
9548
0057
17-4
0.7
19.1
7900
5069
4864
-35.
8-4
.0
Rent
pai
d fo
r lea
sed-
in la
nd0
00
--
00
0-
-
Land
reve
nue,
cess
es &
taxe
s2
43
98.4
-24.
726
2729
4.9
7.2
Depr
ecia
tion
on im
plem
ents
& F
arm
bu
ildin
gs37
154
237
246
.4-3
1.5
431
304
229
-29.
4-2
4.7
Inte
rest
on
fixed
cap
ital
697
2052
1217
194.
4-4
0.7
3200
1584
1251
-50.
5-2
1.0
Tota
l Cos
t (C 2/h
a)28
870
2587
827
106
-10.
44.
742
215
3811
834
789
-9.7
-8.7
A 2(₹/h
a)16
337
1444
116
709
-11.
615
.726
175
2524
824
646
-3.5
-2.4
A 2+FL(
₹/ha
)20
078
1902
620
172
-5.2
6.0
3111
531
465
2867
41.
1-8
.9
Yiel
d(qt
l/ha
)7
67
-7.9
20.6
77
5-7
.6-2
2.1
A 2(₹/q
tl)24
6622
7921
80-7
.6-4
.335
6237
4843
645.
216
.4
A 2+FL(
₹/qt
l)29
4029
1325
62-0
.9-1
2.0
4254
4660
5425
9.6
16.4
C 2(₹/q
tl)42
1239
6534
55-5
.9-1
2.9
5773
5642
6556
-2.3
16.2
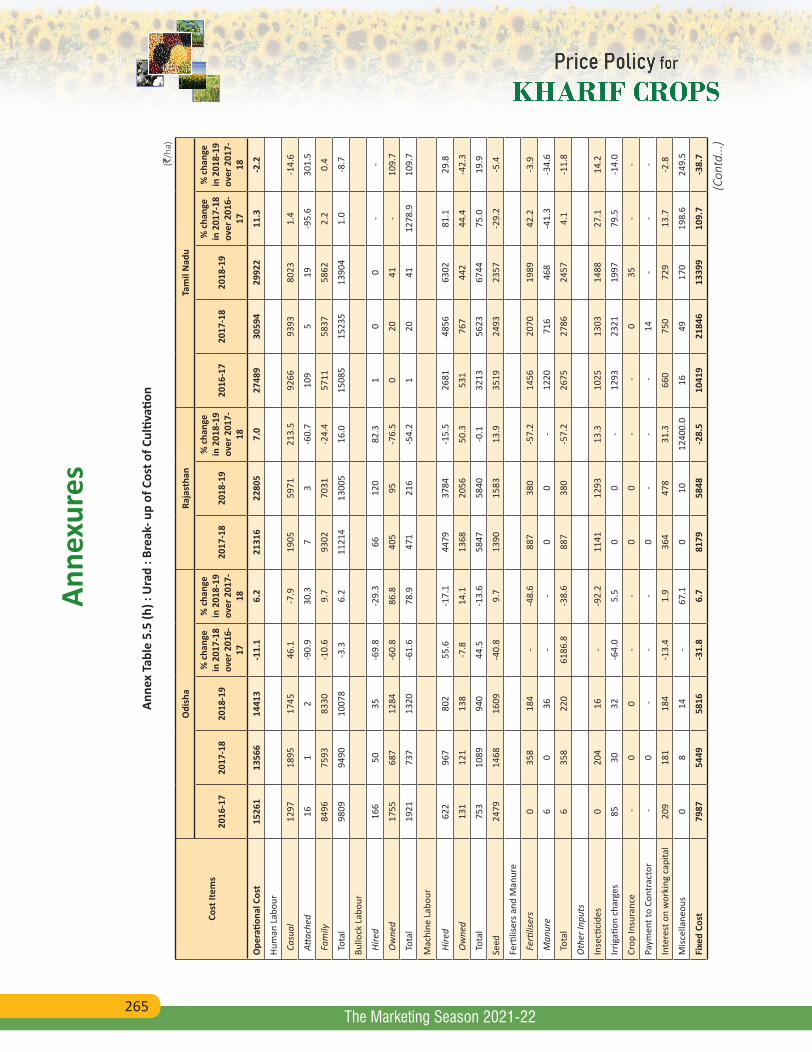
265
Anne
xure
s
The Marketing Season 2021-22
Anne
x Ta
ble
5.5
(h) :
Ura
d : B
reak
- up
of C
ost o
f Cul
tivati
on (`
/ha)
Cost
Item
s
Odi
sha
Raja
stha
nTa
mil
Nad
u
2016
-17
2017
-18
2018
-19
% c
hang
e in
201
7-18
ov
er 2
016-
17
% c
hang
e in
201
8-19
ov
er 2
017-
18
2017
-18
2018
-19
% c
hang
e in
201
8-19
ov
er 2
017-
18
2016
-17
2017
-18
2018
-19
% c
hang
e in
201
7-18
ov
er 2
016-
17
% c
hang
e in
201
8-19
ov
er 2
017-
18
Ope
ratio
nal C
ost
1526
113
566
1441
3-1
1.1
6.2
2131
622
805
7.0
2748
930
594
2992
211
.3-2
.2
Hum
an L
abou
r
Cas
ual
1297
1895
1745
46.1
-7.9
1905
5971
213.
592
6693
9380
231.
4-1
4.6
Atta
ched
161
2-9
0.9
30.3
73
-60.
710
95
19-9
5.6
301.
5
Fam
ily84
9675
9383
30-1
0.6
9.7
9302
7031
-24.
457
1158
3758
622.
20.
4
Tot
al98
0994
9010
078
-3.3
6.2
1121
413
005
16.0
1508
515
235
1390
41.
0-8
.7
Bullo
ck L
abou
r
Hire
d16
650
35-6
9.8
-29.
366
120
82.3
10
0-
-
Ow
ned
1755
687
1284
-60.
886
.840
595
-76.
50
2041
-10
9.7
Tot
al19
2173
713
20-6
1.6
78.9
471
216
-54.
21
2041
1278
.910
9.7
Mac
hine
Lab
our
Hire
d62
296
780
255
.6-1
7.1
4479
3784
-15.
526
8148
5663
0281
.129
.8
Ow
ned
131
121
138
-7.8
14.1
1368
2056
50.3
531
767
442
44.4
-42.
3
Tot
al75
310
8994
044
.5-1
3.6
5847
5840
-0.1
3213
5623
6744
75.0
19.9
Seed
2479
1468
1609
-40.
89.
713
9015
8313
.935
1924
9323
57-2
9.2
-5.4
Ferti
liser
s and
Man
ure
Fer
tilise
rs0
358
184
--4
8.6
887
380
-57.
214
5620
7019
8942
.2-3
.9
Man
ure
60
36-
-0
0-
1220
716
468
-41.
3-3
4.6
Tot
al6
358
220
6186
.8-3
8.6
887
380
-57.
226
7527
8624
574.
1-1
1.8
Oth
er In
puts
Inse
ctici
des
020
416
--9
2.2
1141
1293
13.3
1025
1303
1488
27.1
14.2
Irrig
ation
cha
rges
8530
32-6
4.0
5.5
00
-12
9323
2119
9779
.5-1
4.0
Crop
Insu
ranc
e -
00
--
00
- -
035
--
Paym
ent t
o Co
ntra
ctor
-0
--
-0
--
-14
--
-
Inte
rest
on
wor
king
cap
ital
209
181
184
-13.
41.
936
447
831
.366
075
072
913
.7-2
.8
Misc
ella
neou
s0
814
-67
.10
1012
400.
016
4917
019
8.6
249.
5
Fixe
d Co
st79
8754
4958
16-3
1.8
6.7
8179
5848
-28.
510
419
2184
613
399
109.
7-3
8.7
(Con
td...
)
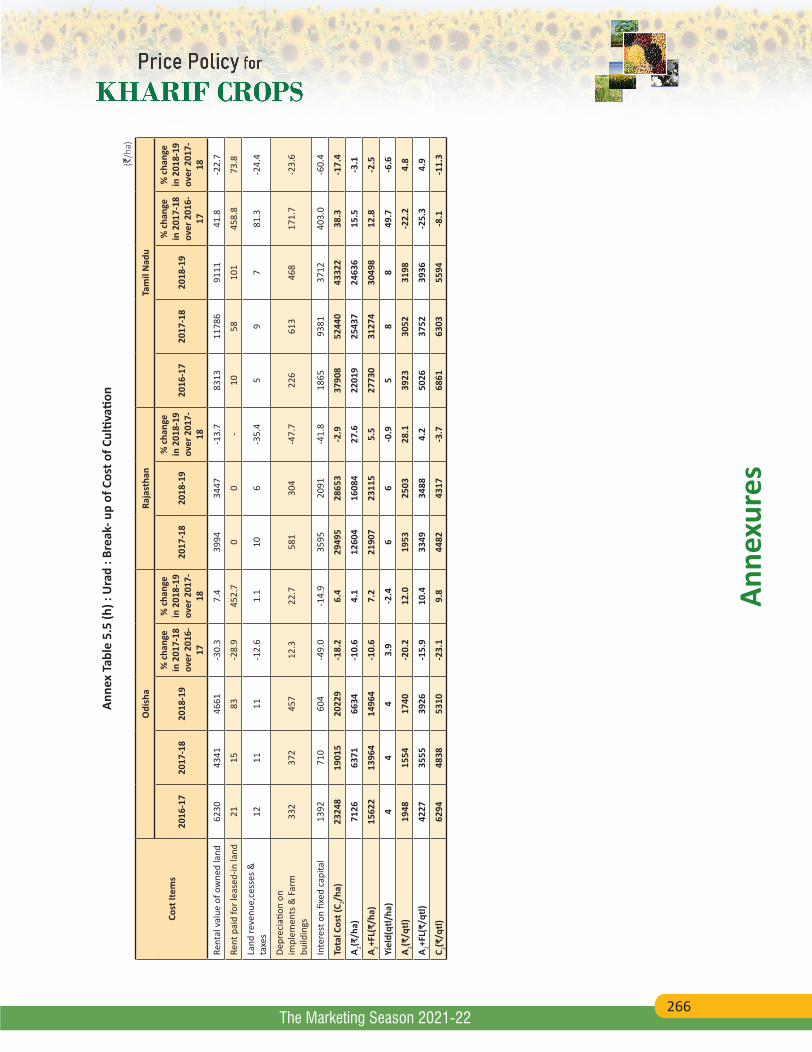
266
Anne
xure
s
The Marketing Season 2021-22
Anne
x Ta
ble
5.5
(h) :
Ura
d : B
reak
- up
of C
ost o
f Cul
tivati
on (`
/ha)
Cost
Item
s
Odi
sha
Raja
stha
nTa
mil
Nad
u
2016
-17
2017
-18
2018
-19
% c
hang
e in
201
7-18
ov
er 2
016-
17
% c
hang
e in
201
8-19
ov
er 2
017-
18
2017
-18
2018
-19
% c
hang
e in
201
8-19
ov
er 2
017-
18
2016
-17
2017
-18
2018
-19
% c
hang
e in
201
7-18
ov
er 2
016-
17
% c
hang
e in
201
8-19
ov
er 2
017-
18
Rent
al v
alue
of o
wne
d la
nd62
3043
4146
61-3
0.3
7.4
3994
3447
-13.
783
1311
786
9111
41.8
-22.
7
Rent
pai
d fo
r lea
sed-
in la
nd21
1583
-28.
945
2.7
00
-10
5810
145
8.8
73.8
Land
reve
nue,
cess
es &
ta
xes
1211
11-1
2.6
1.1
106
-35.
45
97
81.3
-24.
4
Depr
ecia
tion
on
impl
emen
ts &
Far
m
build
ings
332
372
457
12.3
22.7
581
304
-47.
722
661
346
817
1.7
-23.
6
Inte
rest
on
fixed
cap
ital
1392
710
604
-49.
0-1
4.9
3595
2091
-41.
818
6593
8137
1240
3.0
-60.
4
Tota
l Cos
t (C 2/h
a)23
248
1901
520
229
-18.
26.
429
495
2865
3-2
.937
908
5244
043
322
38.3
-17.
4
A 2(₹/h
a)71
2663
7166
34-1
0.6
4.1
1260
416
084
27.6
2201
925
437
2463
615
.5-3
.1
A 2+FL(
₹/ha
)15
622
1396
414
964
-10.
67.
221
907
2311
55.
527
730
3127
430
498
12.8
-2.5
Yiel
d(qt
l/ha
)4
44
3.9
-2.4
66
-0.9
58
849
.7-6
.6
A 2(₹/q
tl)19
4815
5417
40-2
0.2
12.0
1953
2503
28.1
3923
3052
3198
-22.
24.
8
A 2+FL(
₹/qt
l)42
2735
5539
26-1
5.9
10.4
3349
3488
4.2
5026
3752
3936
-25.
34.
9
C 2(₹/q
tl)62
9448
3853
10-2
3.1
9.8
4482
4317
-3.7
6861
6303
5594
-8.1
-11.
3
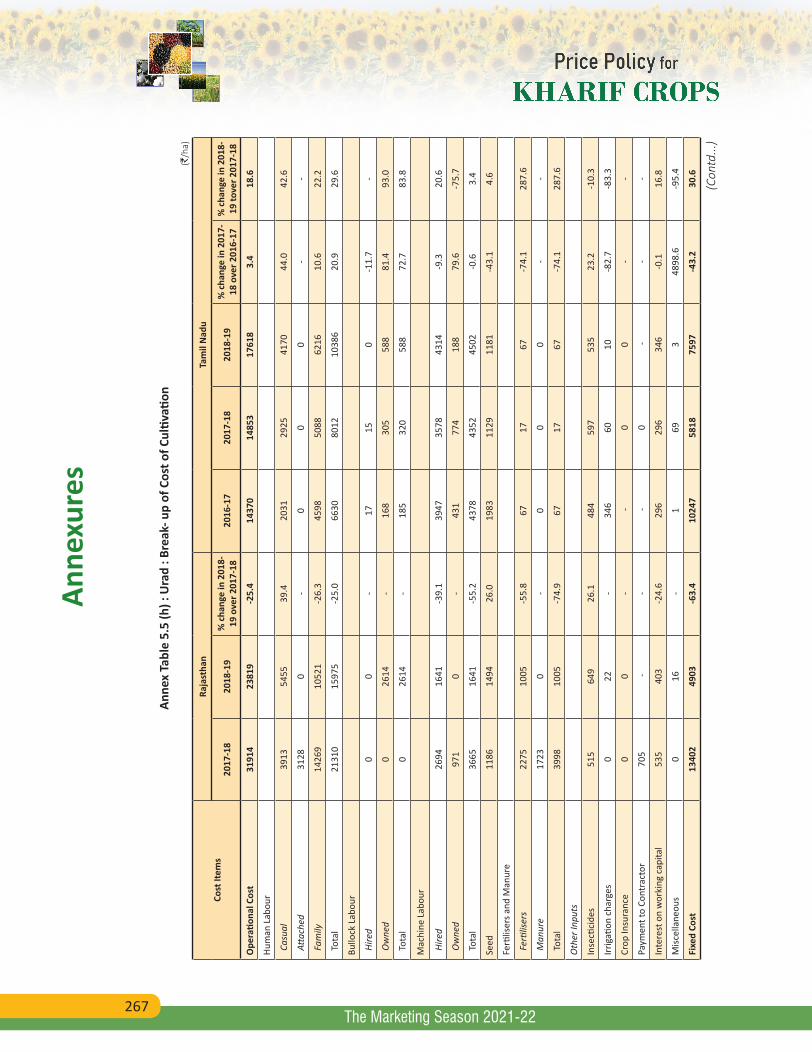
267
Anne
xure
s
The Marketing Season 2021-22
An
nex
Tabl
e 5.
5 (h
) : U
rad
: Bre
ak- u
p of
Cos
t of C
ultiv
ation
(`/h
a)
Cost
Item
sRa
jast
han
Tam
il N
adu
2017
-18
2018
-19
% c
hang
e in
201
8-19
ove
r 201
7-18
2016
-17
2017
-18
2018
-19
% c
hang
e in
201
7-18
ove
r 201
6-17
% c
hang
e in
201
8-19
tove
r 201
7-18
Ope
ratio
nal C
ost
3191
423
819
-25.
414
370
1485
317
618
3.4
18.6
Hum
an L
abou
r
Cas
ual
3913
5455
39.4
2031
2925
4170
44.0
42.6
Atta
ched
3128
0-
00
0-
-
Fam
ily14
269
1052
1-2
6.3
4598
5088
6216
10.6
22.2
Tot
al21
310
1597
5-2
5.0
6630
8012
1038
620
.929
.6
Bullo
ck L
abou
r
Hire
d0
0-
1715
0-1
1.7
-
Ow
ned
026
14-
168
305
588
81.4
93.0
Tot
al0
2614
-18
532
058
872
.783
.8
Mac
hine
Lab
our
Hire
d26
9416
41-3
9.1
3947
3578
4314
-9.3
20.6
Ow
ned
971
0-
431
774
188
79.6
-75.
7
Tot
al36
6516
41-5
5.2
4378
4352
4502
-0.6
3.4
Seed
1186
1494
26.0
1983
1129
1181
-43.
14.
6
Ferti
liser
s and
Man
ure
Fer
tilise
rs22
7510
05-5
5.8
6717
67-7
4.1
287.
6
Man
ure
1723
0-
00
0-
-
Tot
al39
9810
05-7
4.9
6717
67-7
4.1
287.
6
Oth
er In
puts
Inse
ctici
des
515
649
26.1
484
597
535
23.2
-10.
3
Irrig
ation
cha
rges
022
-34
660
10-8
2.7
-83.
3
Crop
Insu
ranc
e0
0-
-0
0-
-
Paym
ent t
o Co
ntra
ctor
705
--
-0
--
-
Inte
rest
on
wor
king
cap
ital
535
403
-24.
629
629
634
6-0
.116
.8
Misc
ella
neou
s0
16-
169
348
98.6
-95.
4
Fixe
d Co
st13
402
4903
-63.
410
247
5818
7597
-43.
230
.6
(Con
td...
)

268
Anne
xure
s
The Marketing Season 2021-22
Anne
x Ta
ble
5.5
(h) :
Ura
d : B
reak
- up
of C
ost o
f Cul
tivati
on (`
/ha)
Cost
Item
sRa
jast
han
Tam
il N
adu
2017
-18
2018
-19
% c
hang
e in
201
8-19
ove
r 201
7-18
2016
-17
2017
-18
2018
-19
% c
hang
e in
201
7-18
ove
r 201
6-17
% c
hang
e in
201
8-19
tove
r 201
7-18
Rent
al v
alue
of o
wne
d la
nd55
5245
82-1
7.5
7523
4435
5731
-41.
129
.2
Rent
pai
d fo
r lea
sed-
in la
nd0
0-
260
425
--
Land
reve
nue,
cess
es &
taxe
s0
0-
36
386
.3-5
2.3
Depr
ecia
tion
on im
plem
ents
& F
arm
bu
ildin
gs45
154
-88.
133
019
324
0-4
1.7
24.8
Inte
rest
on
fixed
cap
ital
7399
268
-96.
423
6411
8411
98-4
9.9
1.1
Tota
l Cos
t (C 2/h
a)45
316
2872
3-3
6.6
2461
720
671
2521
5-1
6.0
22.0
A 2(₹/h
a)18
095
1335
2-2
6.2
1013
299
6412
071
-1.7
21.1
A 2+FL(
₹/ha
)32
364
2387
3-2
6.2
1473
015
052
1828
72.
221
.5
Yiel
d(qt
l/ha
)4
3-2
0.4
43
5-2
2.5
52.2
A 2(₹/q
tl)47
4644
20-6
.923
2227
1322
7316
.8-1
6.2
A 2+FL(
₹/qt
l)84
8979
03-6
.933
5842
3934
1226
.2-1
9.5
C 2(₹/q
tl)11
886
9508
-20.
056
0058
2146
983.
9-1
9.3
Not
e: T
otal
cos
t may
not
mat
ch d
ue to
roun
ding
off
the
figur
es.
Sour
ce: D
irect
orat
e of
Eco
nom
ics
and
Stati
stics
, Dep
artm
ent o
f Agr
icltu
re C
oope
ratio
n &
Far
mer
s W
elfa
re
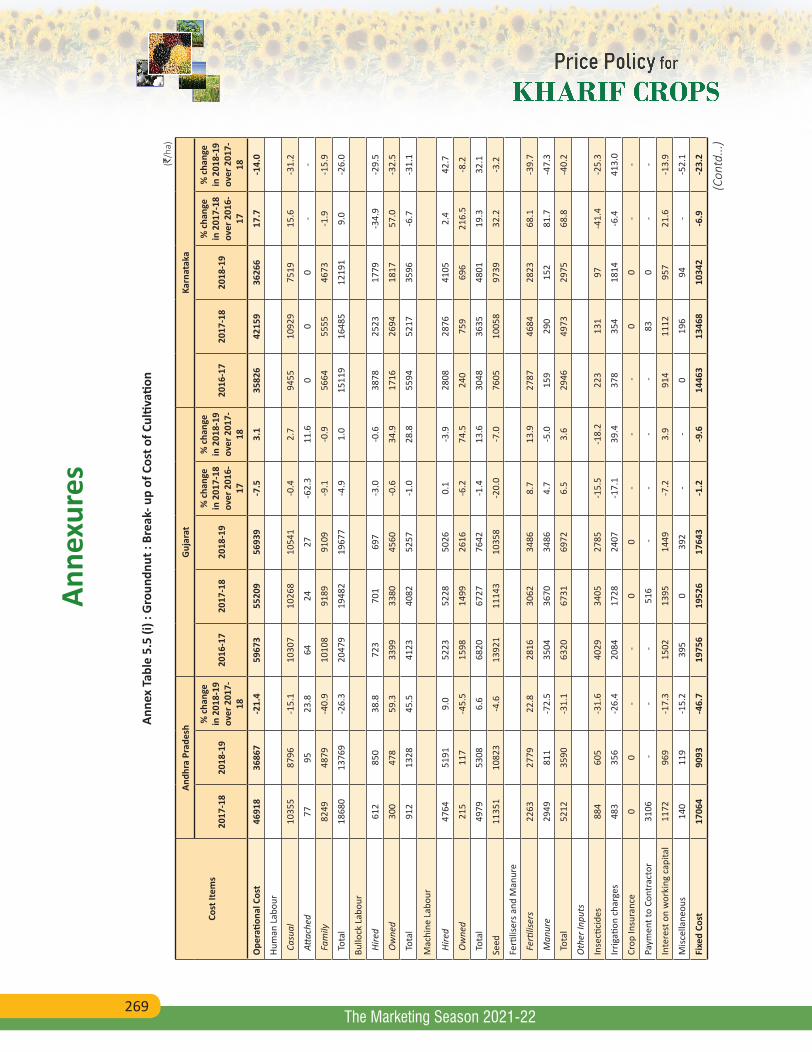
269
Anne
xure
s
The Marketing Season 2021-22
Anne
x Ta
ble
5.5
(i) :
Gro
undn
ut :
Brea
k- u
p of
Cos
t of C
ultiv
ation
(`/h
a)
Cost
Item
s
Andh
ra P
rade
shG
ujar
atKa
rnat
aka
2017
-18
2018
-19
% c
hang
e in
201
8-19
ov
er 2
017-
18
2016
-17
2017
-18
2018
-19
% c
hang
e in
201
7-18
ov
er 2
016-
17
% c
hang
e in
201
8-19
ov
er 2
017-
18
2016
-17
2017
-18
2018
-19
% c
hang
e in
201
7-18
ov
er 2
016-
17
% c
hang
e in
201
8-19
ov
er 2
017-
18
Ope
ratio
nal C
ost
4691
836
867
-21.
459
673
5520
956
939
-7.5
3.1
3582
642
159
3626
617
.7-1
4.0
Hum
an L
abou
r
Cas
ual
1035
587
96-1
5.1
1030
710
268
1054
1-0
.42.
794
5510
929
7519
15.6
-31.
2
Atta
ched
7795
23.8
6424
27-6
2.3
11.6
00
0-
-
Fam
ily82
4948
79-4
0.9
1010
891
8991
09-9
.1-0
.956
6455
5546
73-1
.9-1
5.9
Tot
al18
680
1376
9-2
6.3
2047
919
482
1967
7-4
.91.
015
119
1648
512
191
9.0
-26.
0
Bullo
ck L
abou
r
Hire
d61
285
038
.872
370
169
7-3
.0-0
.638
7825
2317
79-3
4.9
-29.
5
Ow
ned
300
478
59.3
3399
3380
4560
-0.6
34.9
1716
2694
1817
57.0
-32.
5
Tot
al91
213
2845
.541
2340
8252
57-1
.028
.855
9452
1735
96-6
.7-3
1.1
Mac
hine
Lab
our
Hire
d47
6451
919.
052
2352
2850
260.
1-3
.928
0828
7641
052.
442
.7
Ow
ned
215
117
-45.
515
9814
9926
16-6
.274
.524
075
969
621
6.5
-8.2
Tot
al49
7953
086.
668
2067
2776
42-1
.413
.630
4836
3548
0119
.332
.1
Seed
1135
110
823
-4.6
1392
111
143
1035
8-2
0.0
-7.0
7605
1005
897
3932
.2-3
.2
Ferti
liser
s and
Man
ure
Fer
tilise
rs22
6327
7922
.828
1630
6234
868.
713
.927
8746
8428
2368
.1-3
9.7
Man
ure
2949
811
-72.
535
0436
7034
864.
7-5
.015
929
015
281
.7-4
7.3
Tot
al52
1235
90-3
1.1
6320
6731
6972
6.5
3.6
2946
4973
2975
68.8
-40.
2
Oth
er In
puts
Inse
ctici
des
884
605
-31.
640
2934
0527
85-1
5.5
-18.
222
313
197
-41.
4-2
5.3
Irrig
ation
cha
rges
483
356
-26.
420
8417
2824
07-1
7.1
39.4
378
354
1814
-6.4
413.
0
Crop
Insu
ranc
e0
0-
-0
0-
- -
00
--
Paym
ent t
o Co
ntra
ctor
3106
--
-51
6 -
--
-83
0-
-
Inte
rest
on
wor
king
cap
ital
1172
969
-17.
315
0213
9514
49-7
.23.
991
411
1295
721
.6-1
3.9
Misc
ella
neou
s14
011
9-1
5.2
395
039
2-
-0
196
94-
-52.
1
Fixe
d Co
st17
064
9093
-46.
719
756
1952
617
643
-1.2
-9.6
1446
313
468
1034
2-6
.9-2
3.2
(Con
td...
)
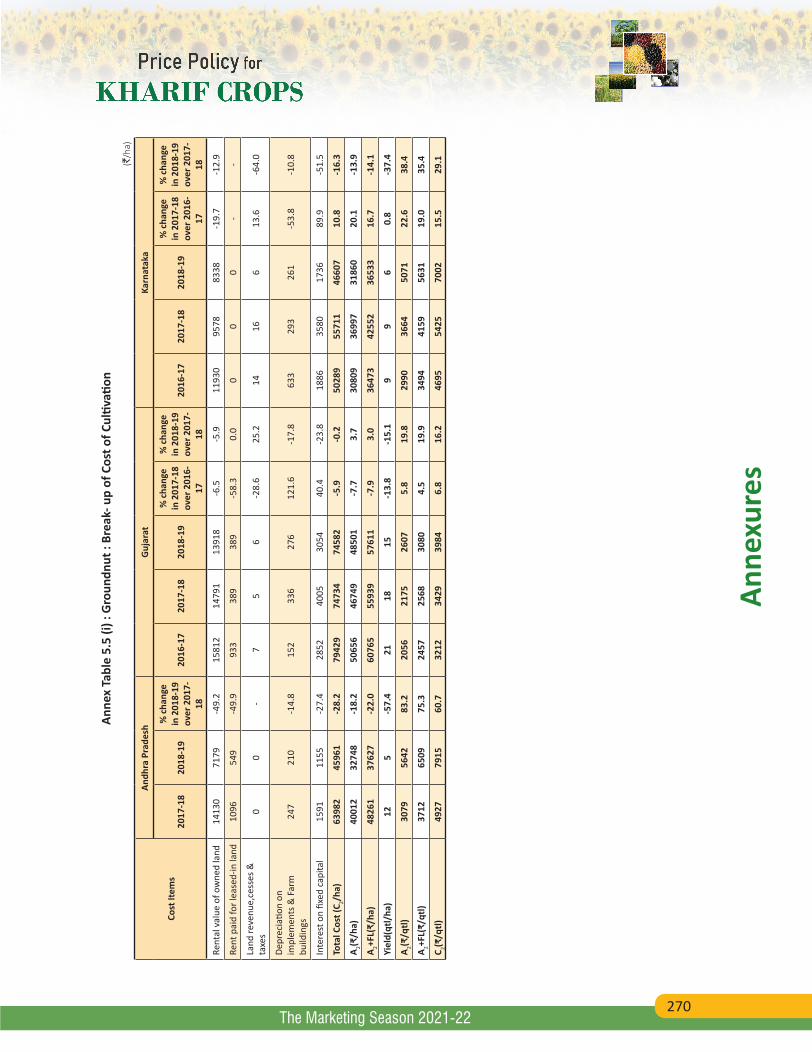
270
Anne
xure
s
The Marketing Season 2021-22
Anne
x Ta
ble
5.5
(i) :
Gro
undn
ut :
Brea
k- u
p of
Cos
t of C
ultiv
ation
(`/h
a)
Cost
Item
s
Andh
ra P
rade
shG
ujar
atKa
rnat
aka
2017
-18
2018
-19
% c
hang
e in
201
8-19
ov
er 2
017-
18
2016
-17
2017
-18
2018
-19
% c
hang
e in
201
7-18
ov
er 2
016-
17
% c
hang
e in
201
8-19
ov
er 2
017-
18
2016
-17
2017
-18
2018
-19
% c
hang
e in
201
7-18
ov
er 2
016-
17
% c
hang
e in
201
8-19
ov
er 2
017-
18
Rent
al v
alue
of o
wne
d la
nd14
130
7179
-49.
215
812
1479
113
918
-6.5
-5.9
1193
095
7883
38-1
9.7
-12.
9
Rent
pai
d fo
r lea
sed-
in la
nd10
9654
9-4
9.9
933
389
389
-58.
30.
00
00
--
Land
reve
nue,
cess
es &
ta
xes
00
-7
56
-28.
625
.214
166
13.6
-64.
0
Depr
ecia
tion
on
impl
emen
ts &
Far
m
build
ings
247
210
-14.
815
233
627
612
1.6
-17.
863
329
326
1-5
3.8
-10.
8
Inte
rest
on
fixed
cap
ital
1591
1155
-27.
428
5240
0530
5440
.4-2
3.8
1886
3580
1736
89.9
-51.
5
Tota
l Cos
t (C 2/h
a)63
982
4596
1-2
8.2
7942
974
734
7458
2-5
.9-0
.250
289
5571
146
607
10.8
-16.
3
A 2(₹/h
a)40
012
3274
8-1
8.2
5065
646
749
4850
1-7
.73.
730
809
3699
731
860
20.1
-13.
9
A 2+FL(
₹/ha
)48
261
3762
7-2
2.0
6076
555
939
5761
1-7
.93.
036
473
4255
236
533
16.7
-14.
1
Yiel
d(qt
l/ha
)12
5-5
7.4
2118
15-1
3.8
-15.
19
96
0.8
-37.
4
A 2(₹/q
tl)30
7956
4283
.220
5621
7526
075.
819
.829
9036
6450
7122
.638
.4
A 2+FL(
₹/qt
l)37
1265
0975
.324
5725
6830
804.
519
.934
9441
5956
3119
.035
.4
C 2(₹/q
tl)49
2779
1560
.732
1234
2939
846.
816
.246
9554
2570
0215
.529
.1
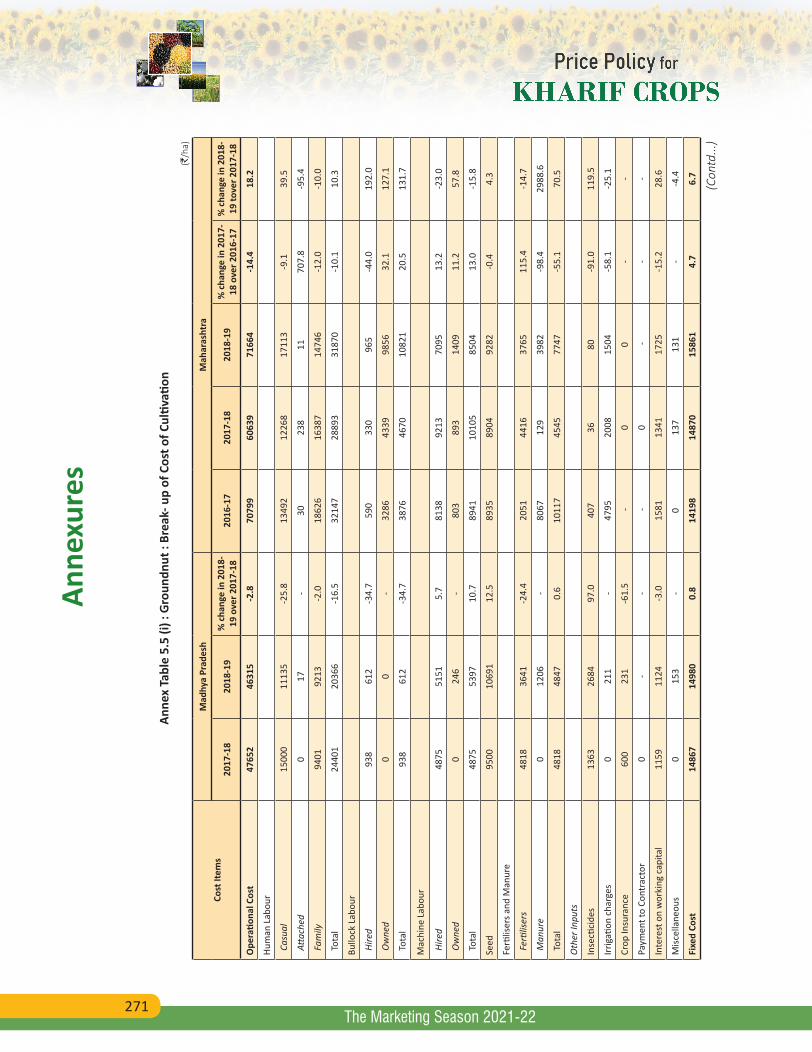
271
Anne
xure
s
The Marketing Season 2021-22
An
nex
Tabl
e 5.
5 (i)
: G
roun
dnut
: Br
eak-
up
of C
ost o
f Cul
tivati
on (`
/ha)
Cost
Item
sM
adhy
a Pr
ades
hM
ahar
asht
ra
2017
-18
2018
-19
% c
hang
e in
201
8-19
ove
r 201
7-18
2016
-17
2017
-18
2018
-19
% c
hang
e in
201
7-18
ove
r 201
6-17
% c
hang
e in
201
8-19
tove
r 201
7-18
Ope
ratio
nal C
ost
4765
246
315
-2.8
7079
960
639
7166
4-1
4.4
18.2
Hum
an L
abou
r
Cas
ual
1500
011
135
-25.
813
492
1226
817
113
-9.1
39.5
Atta
ched
017
-30
238
1170
7.8
-95.
4
Fam
ily94
0192
13-2
.018
626
1638
714
746
-12.
0-1
0.0
Tot
al24
401
2036
6-1
6.5
3214
728
893
3187
0-1
0.1
10.3
Bullo
ck L
abou
r
Hire
d93
861
2-3
4.7
590
330
965
-44.
019
2.0
Ow
ned
00
-32
8643
3998
5632
.112
7.1
Tot
al93
861
2-3
4.7
3876
4670
1082
120
.513
1.7
Mac
hine
Lab
our
Hire
d48
7551
515.
781
3892
1370
9513
.2-2
3.0
Ow
ned
024
6-
803
893
1409
11.2
57.8
Tot
al48
7553
9710
.789
4110
105
8504
13.0
-15.
8
Seed
9500
1069
112
.589
3589
0492
82-0
.44.
3
Ferti
liser
s and
Man
ure
Fer
tilise
rs48
1836
41-2
4.4
2051
4416
3765
115.
4-1
4.7
Man
ure
012
06-
8067
129
3982
-98.
429
88.6
Tot
al48
1848
470.
610
117
4545
7747
-55.
170
.5
Oth
er In
puts
Inse
ctici
des
1363
2684
97.0
407
3680
-91.
011
9.5
Irrig
ation
cha
rges
021
1-
4795
2008
1504
-58.
1-2
5.1
Crop
Insu
ranc
e60
023
1-6
1.5
-0
0-
-
Paym
ent t
o Co
ntra
ctor
0-
- -
0 -
--
Inte
rest
on
wor
king
cap
ital
1159
1124
-3.0
1581
1341
1725
-15.
228
.6
Misc
ella
neou
s0
153
-0
137
131
--4
.4
Fixe
d Co
st14
867
1498
00.
814
198
1487
015
861
4.7
6.7
(Con
td...
)
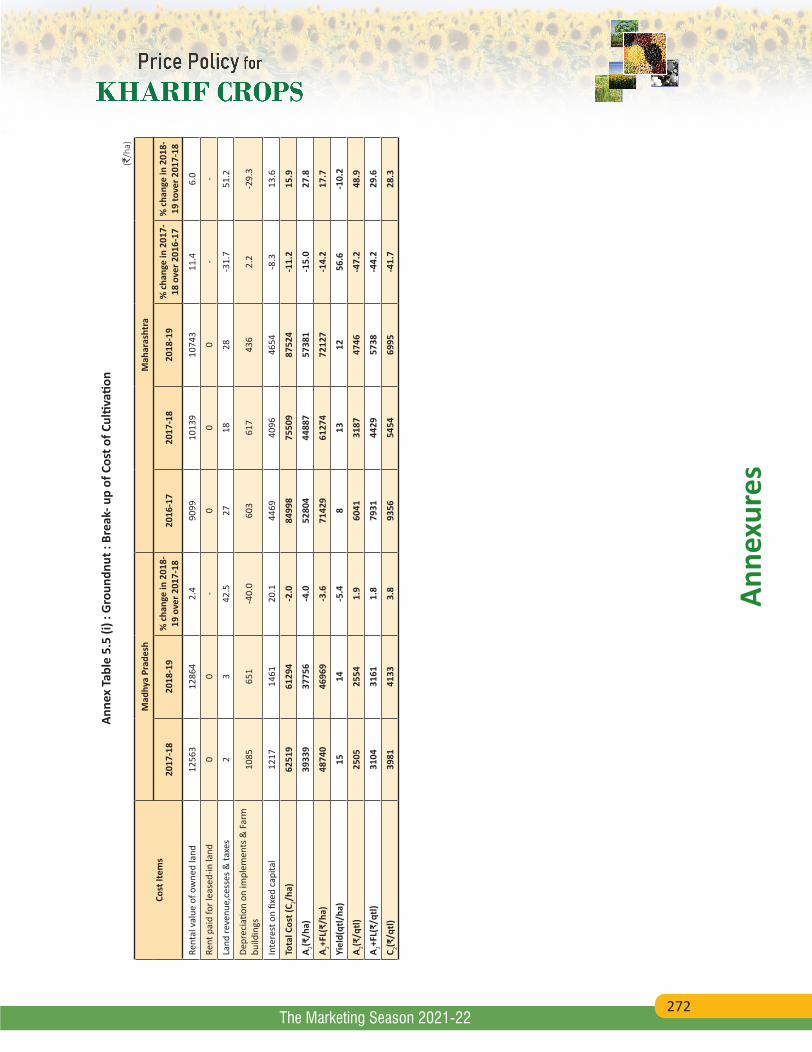
272
Anne
xure
s
The Marketing Season 2021-22
Anne
x Ta
ble
5.5
(i) :
Gro
undn
ut :
Brea
k- u
p of
Cos
t of C
ultiv
ation
(`/h
a)
Cost
Item
sM
adhy
a Pr
ades
hM
ahar
asht
ra
2017
-18
2018
-19
% c
hang
e in
201
8-19
ove
r 201
7-18
2016
-17
2017
-18
2018
-19
% c
hang
e in
201
7-18
ove
r 201
6-17
% c
hang
e in
201
8-19
tove
r 201
7-18
Rent
al v
alue
of o
wne
d la
nd12
563
1286
42.
490
9910
139
1074
311
.46.
0
Rent
pai
d fo
r lea
sed-
in la
nd0
0-
00
0-
-
Land
reve
nue,
cess
es &
taxe
s2
342
.527
1828
-31.
751
.2
Depr
ecia
tion
on im
plem
ents
& F
arm
bu
ildin
gs10
8565
1-4
0.0
603
617
436
2.2
-29.
3
Inte
rest
on
fixed
cap
ital
1217
1461
20.1
4469
4096
4654
-8.3
13.6
Tota
l Cos
t (C 2/h
a)62
519
6129
4-2
.084
998
7550
987
524
-11.
215
.9
A 2(₹/h
a)39
339
3775
6-4
.052
804
4488
757
381
-15.
027
.8
A 2+FL(
₹/ha
)48
740
4696
9-3
.671
429
6127
472
127
-14.
217
.7
Yiel
d(qt
l/ha
)15
14-5
.48
1312
56.6
-10.
2
A 2(₹/q
tl)25
0525
541.
960
4131
8747
46-4
7.2
48.9
A 2+FL(
₹/qt
l)31
0431
611.
879
3144
2957
38-4
4.2
29.6
C 2(₹/q
tl)39
8141
333.
893
5654
5469
95-4
1.7
28.3
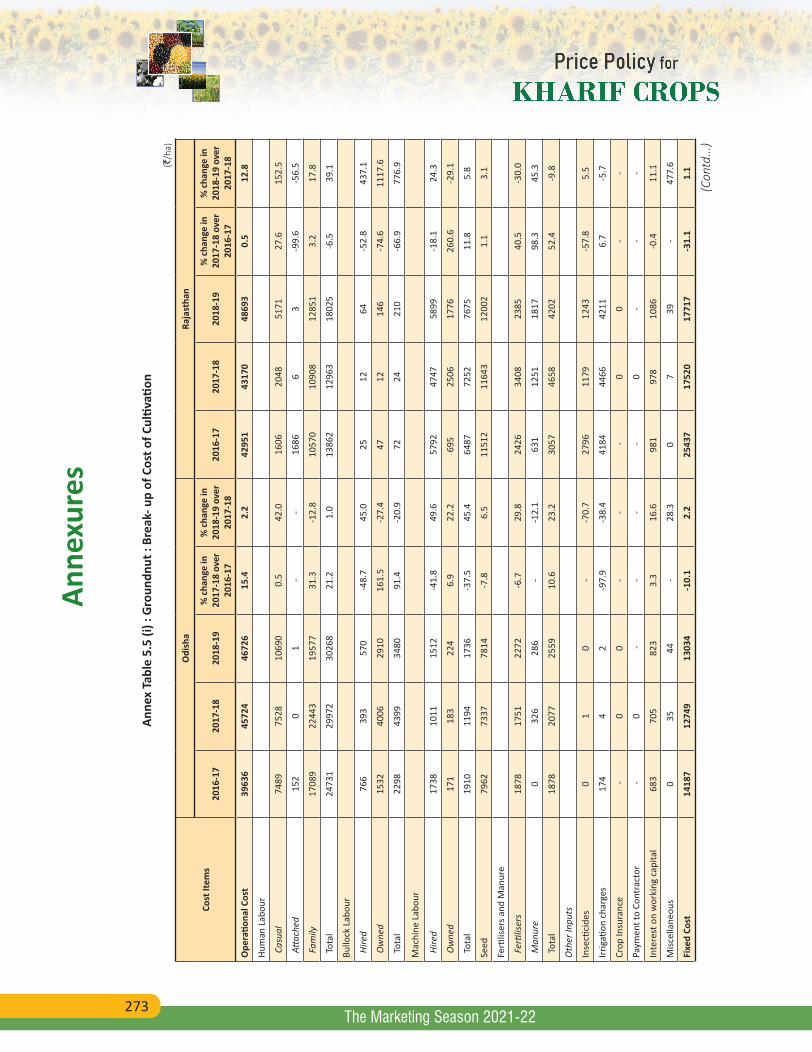
273
Anne
xure
s
The Marketing Season 2021-22
Anne
x Ta
ble
5.5
(i) :
Gro
undn
ut :
Brea
k- u
p of
Cos
t of C
ultiv
ation
(`/h
a)
Cost
Item
s
Odi
sha
Raja
stha
n
2016
-17
2017
-18
2018
-19
% c
hang
e in
20
17-1
8 ov
er
2016
-17
% c
hang
e in
20
18-1
9 ov
er
2017
-18
2016
-17
2017
-18
2018
-19
% c
hang
e in
20
17-1
8 ov
er
2016
-17
% c
hang
e in
20
18-1
9 ov
er
2017
-18
Ope
ratio
nal C
ost
3963
645
724
4672
615
.42.
242
951
4317
048
693
0.5
12.8
Hum
an L
abou
r
Cas
ual
7489
7528
1069
00.
542
.016
0620
4851
7127
.615
2.5
Atta
ched
152
01
--
1686
63
-99.
6-5
6.5
Fam
ily17
089
2244
319
577
31.3
-12.
810
570
1090
812
851
3.2
17.8
Tot
al24
731
2997
230
268
21.2
1.0
1386
212
963
1802
5-6
.539
.1
Bullo
ck L
abou
r
Hire
d76
639
357
0-4
8.7
45.0
2512
64-5
2.8
437.
1
Ow
ned
1532
4006
2910
161.
5-2
7.4
4712
146
-74.
611
17.6
Tot
al22
9843
9934
8091
.4-2
0.9
7224
210
-66.
977
6.9
Mac
hine
Lab
our
Hire
d17
3810
1115
12-4
1.8
49.6
5792
4747
5899
-18.
124
.3
Ow
ned
171
183
224
6.9
22.2
695
2506
1776
260.
6-2
9.1
Tot
al19
1011
9417
36-3
7.5
45.4
6487
7252
7675
11.8
5.8
Seed
7962
7337
7814
-7.8
6.5
1151
211
643
1200
21.
13.
1
Ferti
liser
s and
Man
ure
Fer
tilise
rs18
7817
5122
72-6
.729
.824
2634
0823
8540
.5-3
0.0
Man
ure
032
628
6-
-12.
163
112
5118
1798
.345
.3
Tot
al18
7820
7725
5910
.623
.230
5746
5842
0252
.4-9
.8
Oth
er In
puts
Inse
ctici
des
01
0-
-70.
727
9611
7912
43-5
7.8
5.5
Irrig
ation
cha
rges
174
42
-97.
9-3
8.4
4184
4466
4211
6.7
-5.7
Crop
Insu
ranc
e -
00
--
-0
0-
-
Paym
ent t
o Co
ntra
ctor
-0
--
- -
0-
--
Inte
rest
on
wor
king
cap
ital
683
705
823
3.3
16.6
981
978
1086
-0.4
11.1
Misc
ella
neou
s0
3544
-28
.30
739
-47
7.6
Fixe
d Co
st14
187
1274
913
034
-10.
12.
225
437
1752
017
717
-31.
11.
1
(Con
td...
)
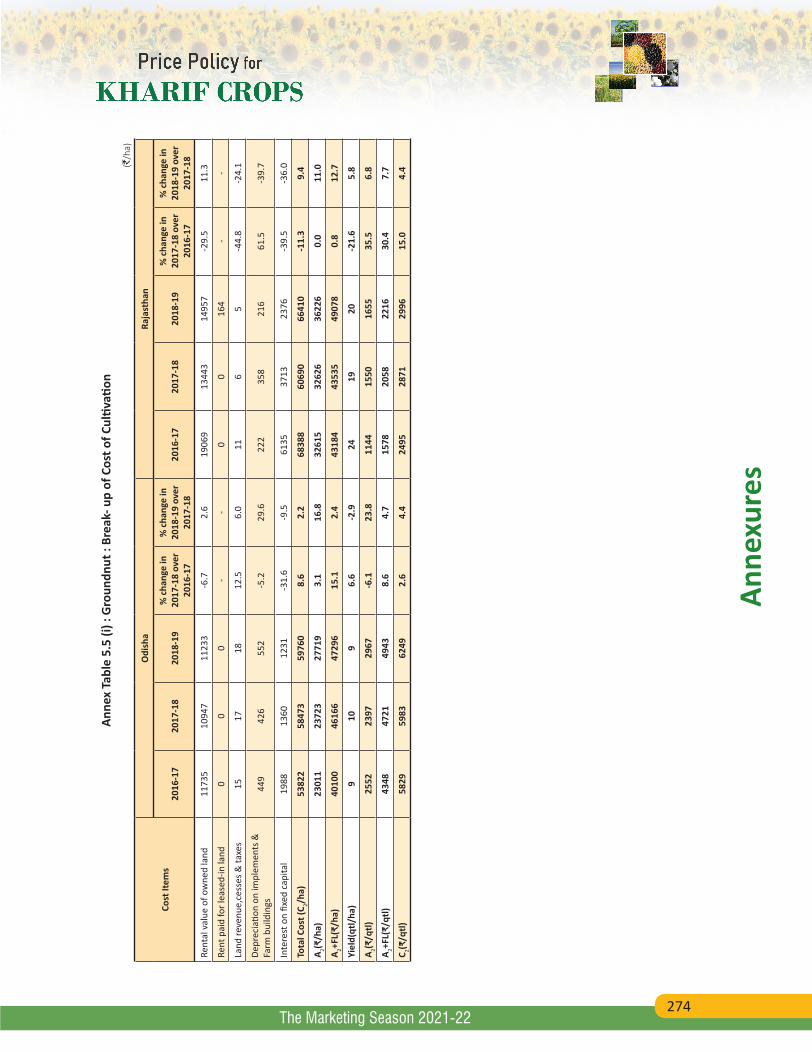
274
Anne
xure
s
The Marketing Season 2021-22
Anne
x Ta
ble
5.5
(i) :
Gro
undn
ut :
Brea
k- u
p of
Cos
t of C
ultiv
ation
(`/h
a)
Cost
Item
s
Odi
sha
Raja
stha
n
2016
-17
2017
-18
2018
-19
% c
hang
e in
20
17-1
8 ov
er
2016
-17
% c
hang
e in
20
18-1
9 ov
er
2017
-18
2016
-17
2017
-18
2018
-19
% c
hang
e in
20
17-1
8 ov
er
2016
-17
% c
hang
e in
20
18-1
9 ov
er
2017
-18
Rent
al v
alue
of o
wne
d la
nd11
735
1094
711
233
-6.7
2.6
1906
913
443
1495
7-2
9.5
11.3
Rent
pai
d fo
r lea
sed-
in la
nd0
00
--
00
164
--
Land
reve
nue,
cess
es &
taxe
s15
1718
12.5
6.0
116
5-4
4.8
-24.
1
Depr
ecia
tion
on im
plem
ents
&
Farm
bui
ldin
gs44
942
655
2-5
.229
.622
235
821
661
.5-3
9.7
Inte
rest
on
fixed
cap
ital
1988
1360
1231
-31.
6-9
.561
3537
1323
76-3
9.5
-36.
0
Tota
l Cos
t (C 2/h
a)53
822
5847
359
760
8.6
2.2
6838
860
690
6641
0-1
1.3
9.4
A 2(₹/h
a)23
011
2372
327
719
3.1
16.8
3261
532
626
3622
60.
011
.0
A 2+FL(
₹/ha
)40
100
4616
647
296
15.1
2.4
4318
443
535
4907
80.
812
.7
Yiel
d(qt
l/ha
)9
109
6.6
-2.9
2419
20-2
1.6
5.8
A 2(₹/q
tl)25
5223
9729
67-6
.123
.811
4415
5016
5535
.56.
8
A 2+FL(
₹/qt
l)43
4847
2149
438.
64.
715
7820
5822
1630
.47.
7
C 2(₹/q
tl)58
2959
8362
492.
64.
424
9528
7129
9615
.04.
4
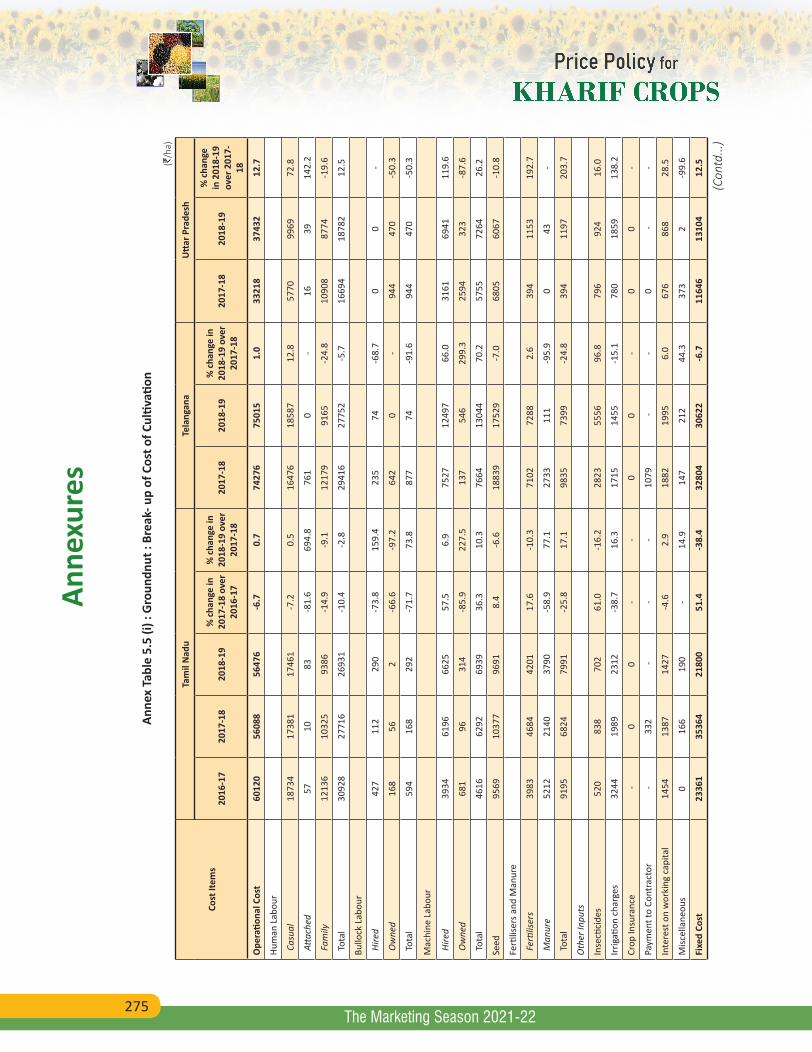
275
Anne
xure
s
The Marketing Season 2021-22
Anne
x Ta
ble
5.5
(i) :
Gro
undn
ut :
Brea
k- u
p of
Cos
t of C
ultiv
ation
(`/h
a)
Cost
Item
s
Tam
il N
adu
Tela
ngan
aU
ttar
Pra
desh
2016
-17
2017
-18
2018
-19
% c
hang
e in
20
17-1
8 ov
er
2016
-17
% c
hang
e in
20
18-1
9 ov
er
2017
-18
2017
-18
2018
-19
% c
hang
e in
20
18-1
9 ov
er
2017
-18
2017
-18
2018
-19
% c
hang
e in
201
8-19
ov
er 2
017-
18
Ope
ratio
nal C
ost
6012
056
088
5647
6-6
.70.
774
276
7501
51.
033
218
3743
212
.7
Hum
an L
abou
r
Cas
ual
1873
417
381
1746
1-7
.20.
516
476
1858
712
.857
7099
6972
.8
Atta
ched
5710
83-8
1.6
694.
876
10
-16
3914
2.2
Fam
ily12
136
1032
593
86-1
4.9
-9.1
1217
991
65-2
4.8
1090
887
74-1
9.6
Tot
al30
928
2771
626
931
-10.
4-2
.829
416
2775
2-5
.716
694
1878
212
.5
Bullo
ck L
abou
r
Hire
d42
711
229
0-7
3.8
159.
423
574
-68.
70
0-
Ow
ned
168
562
-66.
6-9
7.2
642
0-
944
470
-50.
3
Tot
al59
416
829
2-7
1.7
73.8
877
74-9
1.6
944
470
-50.
3
Mac
hine
Lab
our
Hire
d39
3461
9666
2557
.56.
975
2712
497
66.0
3161
6941
119.
6
Ow
ned
681
9631
4-8
5.9
227.
513
754
629
9.3
2594
323
-87.
6
Tot
al46
1662
9269
3936
.310
.376
6413
044
70.2
5755
7264
26.2
Seed
9569
1037
796
918.
4-6
.618
839
1752
9-7
.068
0560
67-1
0.8
Ferti
liser
s and
Man
ure
Fer
tilise
rs39
8346
8442
0117
.6-1
0.3
7102
7288
2.6
394
1153
192.
7
Man
ure
5212
2140
3790
-58.
977
.127
3311
1-9
5.9
043
-
Tot
al91
9568
2479
91-2
5.8
17.1
9835
7399
-24.
839
411
9720
3.7
Oth
er In
puts
Inse
ctici
des
520
838
702
61.0
-16.
228
2355
5696
.879
692
416
.0
Irrig
ation
cha
rges
3244
1989
2312
-38.
716
.317
1514
55-1
5.1
780
1859
138.
2
Crop
Insu
ranc
e -
00
--
00
-0
0-
Paym
ent t
o Co
ntra
ctor
-33
2 -
--
1079
--
0 -
-
Inte
rest
on
wor
king
cap
ital
1454
1387
1427
-4.6
2.9
1882
1995
6.0
676
868
28.5
Misc
ella
neou
s0
166
190
-14
.914
721
244
.337
32
-99.
6
Fixe
d Co
st23
361
3536
421
800
51.4
-38.
432
804
3062
2-6
.711
646
1310
412
.5
(Con
td...
)
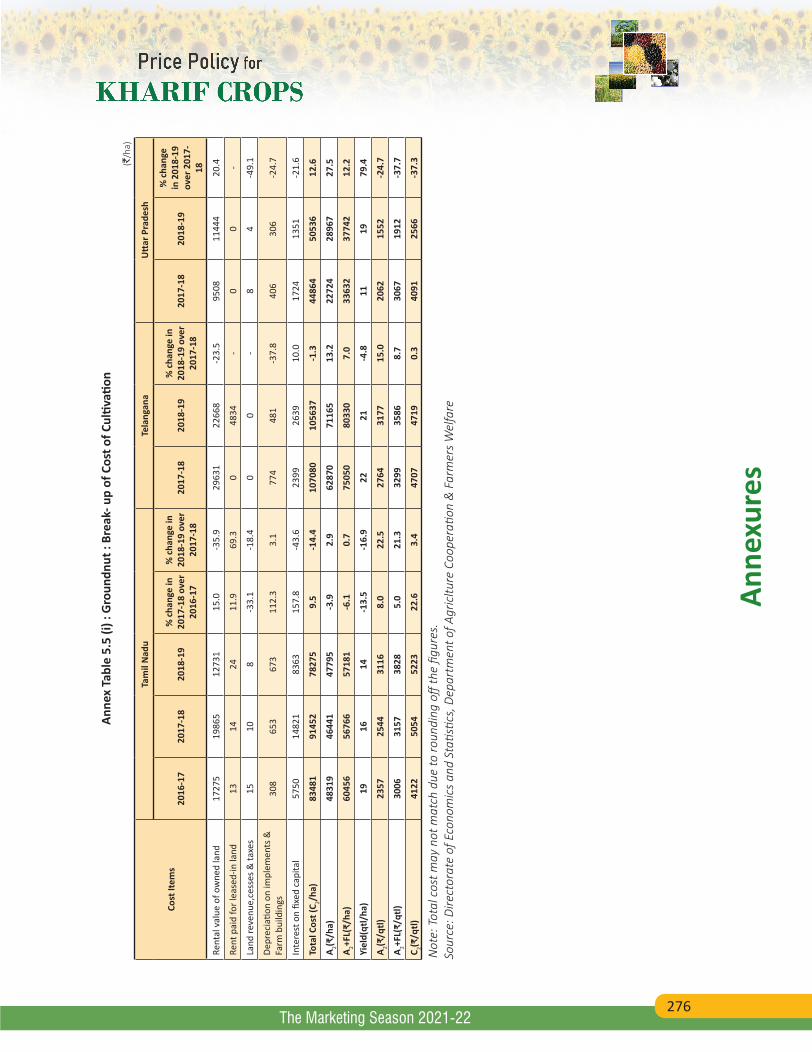
276
Anne
xure
s
The Marketing Season 2021-22
Anne
x Ta
ble
5.5
(i) :
Gro
undn
ut :
Brea
k- u
p of
Cos
t of C
ultiv
ation
(`/h
a)
Cost
Item
s
Tam
il N
adu
Tela
ngan
aU
ttar
Pra
desh
2016
-17
2017
-18
2018
-19
% c
hang
e in
20
17-1
8 ov
er
2016
-17
% c
hang
e in
20
18-1
9 ov
er
2017
-18
2017
-18
2018
-19
% c
hang
e in
20
18-1
9 ov
er
2017
-18
2017
-18
2018
-19
% c
hang
e in
201
8-19
ov
er 2
017-
18
Rent
al v
alue
of o
wne
d la
nd17
275
1986
512
731
15.0
-35.
929
631
2266
8-2
3.5
9508
1144
420
.4
Rent
pai
d fo
r lea
sed-
in la
nd13
1424
11.9
69.3
048
34-
00
-
Land
reve
nue,
cess
es &
taxe
s15
108
-33.
1-1
8.4
00
-8
4-4
9.1
Depr
ecia
tion
on im
plem
ents
&
Farm
bui
ldin
gs30
865
367
311
2.3
3.1
774
481
-37.
840
630
6-2
4.7
Inte
rest
on
fixed
cap
ital
5750
1482
183
6315
7.8
-43.
623
9926
3910
.017
2413
51-2
1.6
Tota
l Cos
t (C 2/h
a)83
481
9145
278
275
9.5
-14.
410
7080
1056
37-1
.344
864
5053
612
.6
A 2(₹/h
a)48
319
4644
147
795
-3.9
2.9
6287
071
165
13.2
2272
428
967
27.5
A 2+FL(
₹/ha
)60
456
5676
657
181
-6.1
0.7
7505
080
330
7.0
3363
237
742
12.2
Yiel
d(qt
l/ha
)19
1614
-13.
5-1
6.9
2221
-4.8
1119
79.4
A 2(₹/q
tl)23
5725
4431
168.
022
.527
6431
7715
.020
6215
52-2
4.7
A 2+FL(
₹/qt
l)30
0631
5738
285.
021
.332
9935
868.
730
6719
12-3
7.7
C 2(₹/q
tl)41
2250
5452
2322
.63.
447
0747
190.
340
9125
66-3
7.3
Not
e: T
otal
cos
t may
not
mat
ch d
ue to
roun
ding
off
the
figur
es.
Sour
ce: D
irect
orat
e of
Eco
nom
ics
and
Stati
stics
, Dep
artm
ent o
f Agr
icltu
re C
oope
ratio
n &
Far
mer
s W
elfa
re
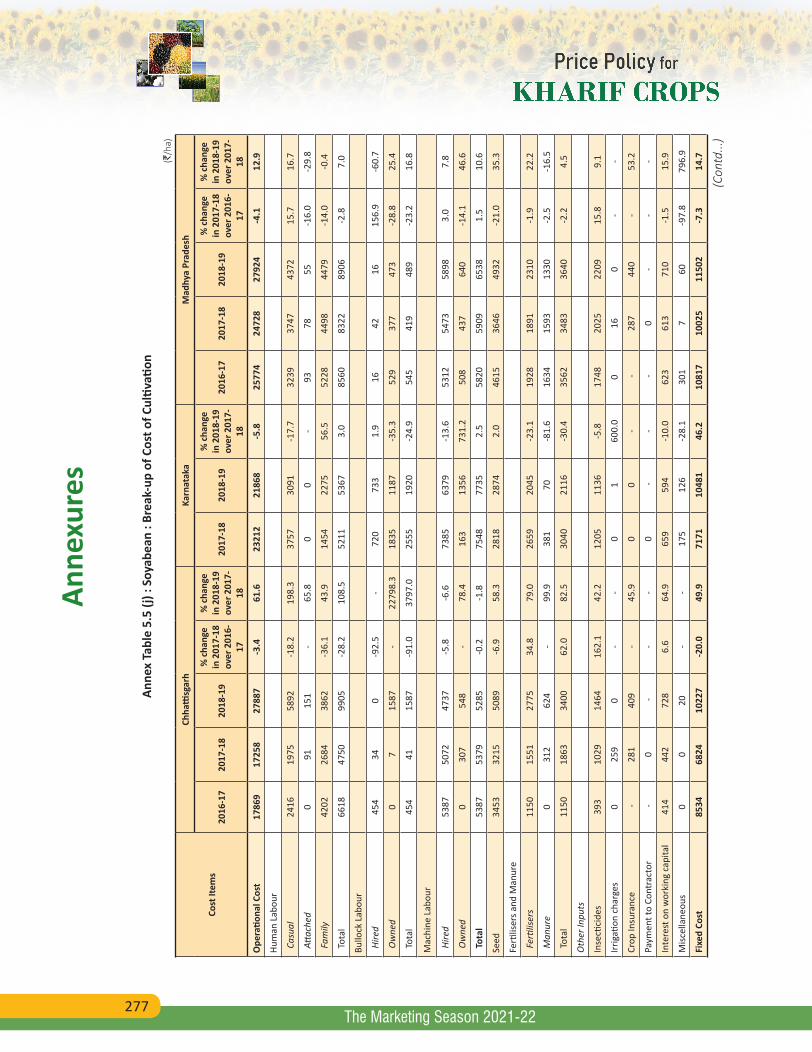
277
Anne
xure
s
The Marketing Season 2021-22
Ann
ex T
able
5.5
(j) :
Soy
abea
n : B
reak
-up
of C
ost o
f Cul
tivati
on (`
/ha)
Cost
Item
s
Chha
ttisg
arh
Karn
atak
aM
adhy
a Pr
ades
h
2016
-17
2017
-18
2018
-19
% c
hang
e in
201
7-18
ov
er 2
016-
17
% c
hang
e in
201
8-19
ov
er 2
017-
18
2017
-18
2018
-19
% c
hang
e in
201
8-19
ov
er 2
017-
18
2016
-17
2017
-18
2018
-19
% c
hang
e in
201
7-18
ov
er 2
016-
17
% c
hang
e in
201
8-19
ov
er 2
017-
18
Ope
ratio
nal C
ost
1786
917
258
2788
7-3
.461
.623
212
2186
8-5
.825
774
2472
827
924
-4.1
12.9
Hum
an L
abou
r
Cas
ual
2416
1975
5892
-18.
219
8.3
3757
3091
-17.
732
3937
4743
7215
.716
.7
Atta
ched
091
151
-65
.80
0-
9378
55-1
6.0
-29.
8
Fam
ily42
0226
8438
62-3
6.1
43.9
1454
2275
56.5
5228
4498
4479
-14.
0-0
.4
Tot
al66
1847
5099
05-2
8.2
108.
552
1153
673.
085
6083
2289
06-2
.87.
0
Bullo
ck L
abou
r
Hire
d45
434
0-9
2.5
-72
073
31.
916
4216
156.
9-6
0.7
Ow
ned
07
1587
-22
798.
318
3511
87-3
5.3
529
377
473
-28.
825
.4
Tot
al45
441
1587
-91.
037
97.0
2555
1920
-24.
954
541
948
9-2
3.2
16.8
Mac
hine
Lab
our
Hire
d53
8750
7247
37-5
.8-6
.673
8563
79-1
3.6
5312
5473
5898
3.0
7.8
Ow
ned
030
754
8-
78.4
163
1356
731.
250
843
764
0-1
4.1
46.6
Tot
al53
8753
7952
85-0
.2-1
.875
4877
352.
558
2059
0965
381.
510
.6
Seed
3453
3215
5089
-6.9
58.3
2818
2874
2.0
4615
3646
4932
-21.
035
.3
Ferti
liser
s and
Man
ure
Fer
tilise
rs11
5015
5127
7534
.879
.026
5920
45-2
3.1
1928
1891
2310
-1.9
22.2
Man
ure
031
262
4-
99.9
381
70-8
1.6
1634
1593
1330
-2.5
-16.
5
Tot
al11
5018
6334
0062
.082
.530
4021
16-3
0.4
3562
3483
3640
-2.2
4.5
Oth
er In
puts
Inse
ctici
des
393
1029
1464
162.
142
.212
0511
36-5
.817
4820
2522
0915
.89.
1
Irrig
ation
cha
rges
025
90
--
01
600.
00
160
--
Crop
Insu
ranc
e -
281
409
-45
.90
0-
-28
744
0-
53.2
Paym
ent t
o Co
ntra
ctor
-0
--
-0
--
-0
--
-
Inte
rest
on
wor
king
cap
ital
414
442
728
6.6
64.9
659
594
-10.
062
361
371
0-1
.515
.9
Misc
ella
neou
s0
020
--
175
126
-28.
130
17
60-9
7.8
796.
9
Fixe
d Co
st85
3468
2410
227
-20.
049
.971
7110
481
46.2
1081
710
025
1150
2-7
.314
.7
(Con
td...
)
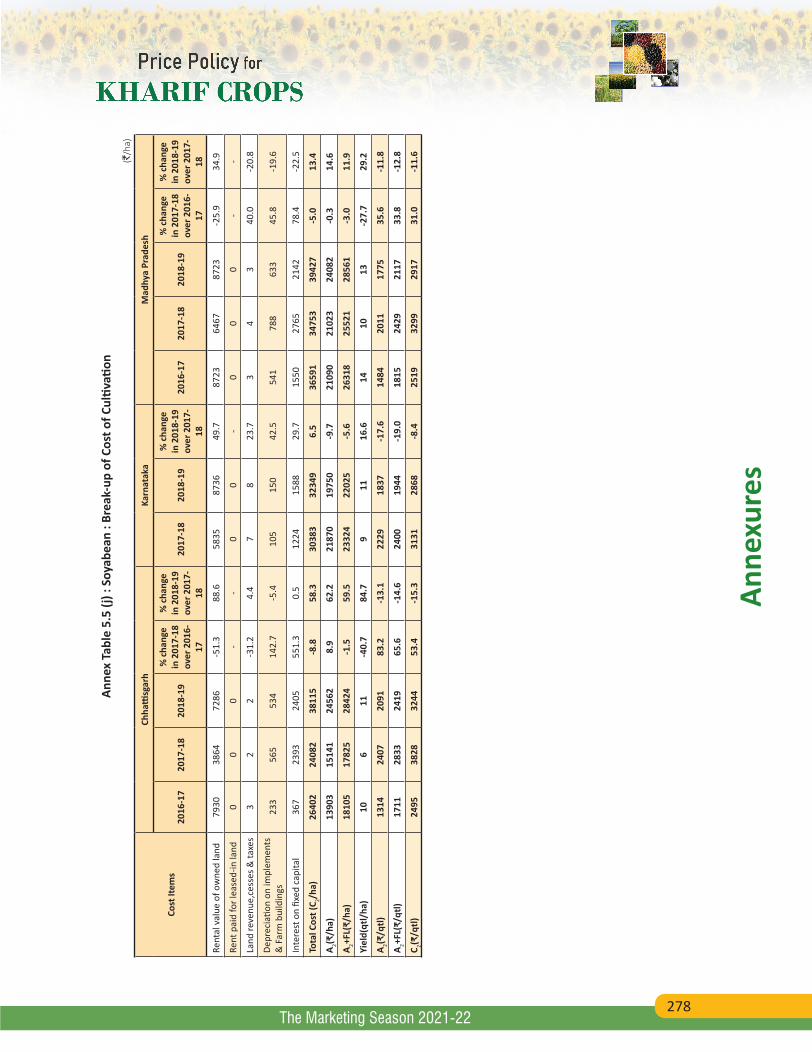
278
Anne
xure
s
The Marketing Season 2021-22
Ann
ex T
able
5.5
(j) :
Soy
abea
n : B
reak
-up
of C
ost o
f Cul
tivati
on (`
/ha)
Cost
Item
s
Chha
ttisg
arh
Karn
atak
aM
adhy
a Pr
ades
h
2016
-17
2017
-18
2018
-19
% c
hang
e in
201
7-18
ov
er 2
016-
17
% c
hang
e in
201
8-19
ov
er 2
017-
18
2017
-18
2018
-19
% c
hang
e in
201
8-19
ov
er 2
017-
18
2016
-17
2017
-18
2018
-19
% c
hang
e in
201
7-18
ov
er 2
016-
17
% c
hang
e in
201
8-19
ov
er 2
017-
18
Rent
al v
alue
of o
wne
d la
nd79
3038
6472
86-5
1.3
88.6
5835
8736
49.7
8723
6467
8723
-25.
934
.9
Rent
pai
d fo
r lea
sed-
in la
nd0
00
--
00
-0
00
--
Land
reve
nue,
cess
es &
taxe
s3
22
-31.
24.
47
823
.73
43
40.0
-20.
8
Depr
ecia
tion
on im
plem
ents
&
Far
m b
uild
ings
233
565
534
142.
7-5
.410
515
042
.554
178
863
345
.8-1
9.6
Inte
rest
on
fixed
cap
ital
367
2393
2405
551.
30.
512
2415
8829
.715
5027
6521
4278
.4-2
2.5
Tota
l Cos
t (C 2/h
a)26
402
2408
238
115
-8.8
58.3
3038
332
349
6.5
3659
134
753
3942
7-5
.013
.4
A 2(₹/h
a)13
903
1514
124
562
8.9
62.2
2187
019
750
-9.7
2109
021
023
2408
2-0
.314
.6
A 2+FL(
₹/ha
)18
105
1782
528
424
-1.5
59.5
2332
422
025
-5.6
2631
825
521
2856
1-3
.011
.9
Yiel
d(qt
l/ha
)10
611
-40.
784
.79
1116
.614
1013
-27.
729
.2
A 2(₹/q
tl)13
1424
0720
9183
.2-1
3.1
2229
1837
-17.
614
8420
1117
7535
.6-1
1.8
A 2+FL(
₹/qt
l)17
1128
3324
1965
.6-1
4.6
2400
1944
-19.
018
1524
2921
1733
.8-1
2.8
C 2(₹/q
tl)24
9538
2832
4453
.4-1
5.3
3131
2868
-8.4
2519
3299
2917
31.0
-11.
6
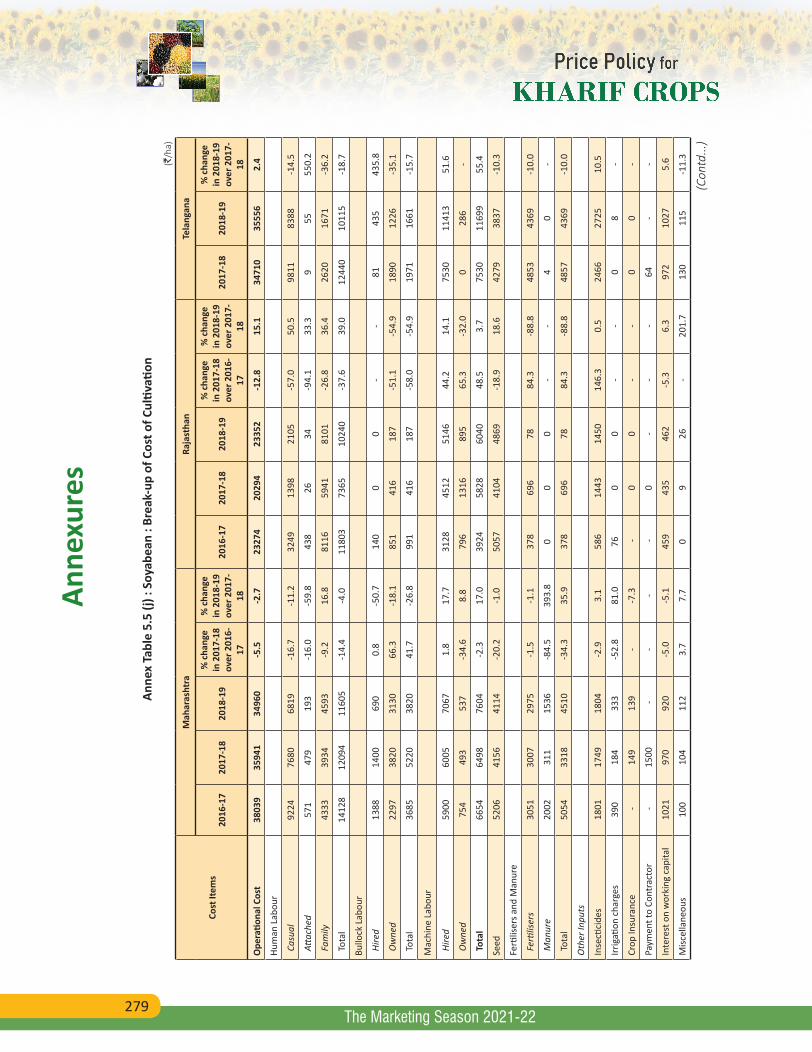
279
Anne
xure
s
The Marketing Season 2021-22
Ann
ex T
able
5.5
(j) :
Soy
abea
n : B
reak
-up
of C
ost o
f Cul
tivati
on (`
/ha)
Cost
Item
s
Mah
aras
htra
Raja
stha
nTe
lang
ana
2016
-17
2017
-18
2018
-19
% c
hang
e in
201
7-18
ov
er 2
016-
17
% c
hang
e in
201
8-19
ov
er 2
017-
18
2016
-17
2017
-18
2018
-19
% c
hang
e in
201
7-18
ov
er 2
016-
17
% c
hang
e in
201
8-19
ov
er 2
017-
18
2017
-18
2018
-19
% c
hang
e in
201
8-19
ov
er 2
017-
18
Ope
ratio
nal C
ost
3803
935
941
3496
0-5
.5-2
.723
274
2029
423
352
-12.
815
.134
710
3555
62.
4
Hum
an L
abou
r
Cas
ual
9224
7680
6819
-16.
7-1
1.2
3249
1398
2105
-57.
050
.598
1183
88-1
4.5
Atta
ched
571
479
193
-16.
0-5
9.8
438
2634
-94.
133
.39
5555
0.2
Fam
ily43
3339
3445
93-9
.216
.881
1659
4181
01-2
6.8
36.4
2620
1671
-36.
2
Tot
al14
128
1209
411
605
-14.
4-4
.011
803
7365
1024
0-3
7.6
39.0
1244
010
115
-18.
7
Bullo
ck L
abou
r
Hire
d13
8814
0069
00.
8-5
0.7
140
00
--
8143
543
5.8
Ow
ned
2297
3820
3130
66.3
-18.
185
141
618
7-5
1.1
-54.
918
9012
26-3
5.1
Tot
al36
8552
2038
2041
.7-2
6.8
991
416
187
-58.
0-5
4.9
1971
1661
-15.
7
Mac
hine
Lab
our
Hire
d59
0060
0570
671.
817
.731
2845
1251
4644
.214
.175
3011
413
51.6
Ow
ned
754
493
537
-34.
68.
879
613
1689
565
.3-3
2.0
028
6-
Tot
al66
5464
9876
04-2
.317
.039
2458
2860
4048
.53.
775
3011
699
55.4
Seed
5206
4156
4114
-20.
2-1
.050
5741
0448
69-1
8.9
18.6
4279
3837
-10.
3
Ferti
liser
s and
Man
ure
Fer
tilise
rs30
5130
0729
75-1
.5-1
.137
869
678
84.3
-88.
848
5343
69-1
0.0
Man
ure
2002
311
1536
-84.
539
3.8
00
0-
-4
0-
Tot
al50
5433
1845
10-3
4.3
35.9
378
696
7884
.3-8
8.8
4857
4369
-10.
0
Oth
er In
puts
Inse
ctici
des
1801
1749
1804
-2.9
3.1
586
1443
1450
146.
30.
524
6627
2510
.5
Irrig
ation
cha
rges
390
184
333
-52.
881
.076
00
--
08
-
Crop
Insu
ranc
e -
149
139
--7
.3 -
00
--
00
-
Paym
ent t
o Co
ntra
ctor
-15
00 -
--
-0
--
-64
--
Inte
rest
on
wor
king
cap
ital
1021
970
920
-5.0
-5.1
459
435
462
-5.3
6.3
972
1027
5.6
Misc
ella
neou
s10
010
411
23.
77.
70
926
-20
1.7
130
115
-11.
3
(Con
td...
)
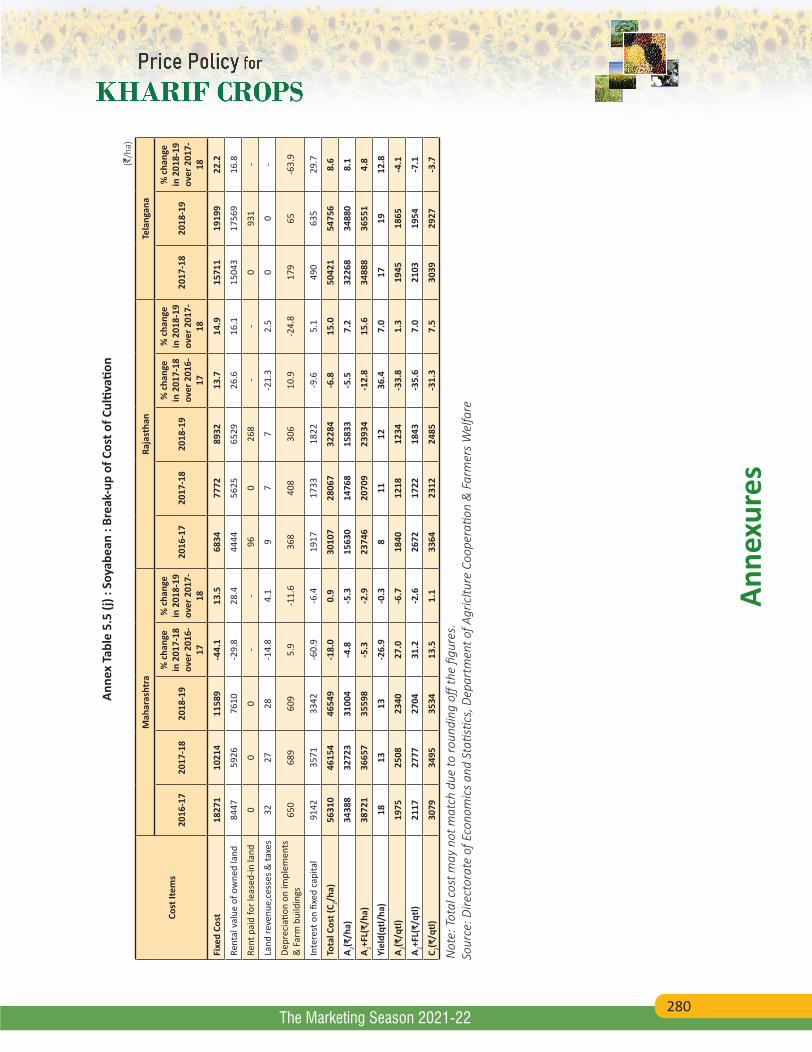
280
Anne
xure
s
The Marketing Season 2021-22
Ann
ex T
able
5.5
(j) :
Soy
abea
n : B
reak
-up
of C
ost o
f Cul
tivati
on (`
/ha)
Cost
Item
s
Mah
aras
htra
Raja
stha
nTe
lang
ana
2016
-17
2017
-18
2018
-19
% c
hang
e in
201
7-18
ov
er 2
016-
17
% c
hang
e in
201
8-19
ov
er 2
017-
18
2016
-17
2017
-18
2018
-19
% c
hang
e in
201
7-18
ov
er 2
016-
17
% c
hang
e in
201
8-19
ov
er 2
017-
18
2017
-18
2018
-19
% c
hang
e in
201
8-19
ov
er 2
017-
18
Fixe
d Co
st18
271
1021
411
589
-44.
113
.568
3477
7289
3213
.714
.915
711
1919
922
.2
Rent
al v
alue
of o
wne
d la
nd84
4759
2676
10-2
9.8
28.4
4444
5625
6529
26.6
16.1
1504
317
569
16.8
Rent
pai
d fo
r lea
sed-
in la
nd0
00
--
960
268
--
093
1-
Land
reve
nue,
cess
es &
taxe
s32
2728
-14.
84.
19
77
-21.
32.
50
0-
Depr
ecia
tion
on im
plem
ents
&
Far
m b
uild
ings
650
689
609
5.9
-11.
636
840
830
610
.9-2
4.8
179
65-6
3.9
Inte
rest
on
fixed
cap
ital
9142
3571
3342
-60.
9-6
.419
1717
3318
22-9
.65.
149
063
529
.7
Tota
l Cos
t (C 2/h
a)56
310
4615
446
549
-18.
00.
930
107
2806
732
284
-6.8
15.0
5042
154
756
8.6
A 2(₹/h
a)34
388
3272
331
004
-4.8
-5.3
1563
014
768
1583
3-5
.57.
232
268
3488
08.
1
A 2+FL(
₹/ha
)38
721
3665
735
598
-5.3
-2.9
2374
620
709
2393
4-1
2.8
15.6
3488
836
551
4.8
Yiel
d(qt
l/ha
)18
1313
-26.
9-0
.38
1112
36.4
7.0
1719
12.8
A 2(₹/q
tl)19
7525
0823
4027
.0-6
.718
4012
1812
34-3
3.8
1.3
1945
1865
-4.1
A 2+FL(
₹/qt
l)21
1727
7727
0431
.2-2
.626
7217
2218
43-3
5.6
7.0
2103
1954
-7.1
C 2(₹/q
tl)30
7934
9535
3413
.51.
133
6423
1224
85-3
1.3
7.5
3039
2927
-3.7
Not
e: T
otal
cos
t may
not
mat
ch d
ue to
roun
ding
off
the
figur
es.
Sour
ce: D
irect
orat
e of
Eco
nom
ics
and
Stati
stics
, Dep
artm
ent o
f Agr
icltu
re C
oope
ratio
n &
Far
mer
s W
elfa
re
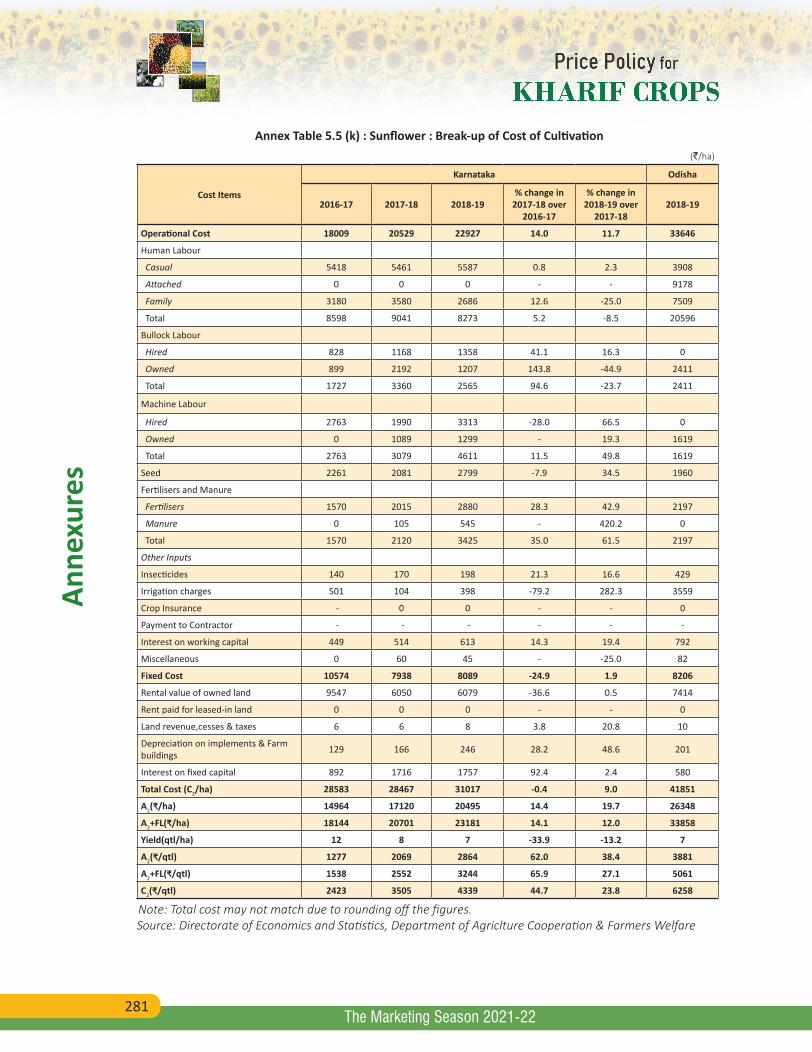
281
Anne
xure
s
The Marketing Season 2021-22
Annex Table 5.5 (k) : Sunflower : Break-up of Cost of Cultivation (`/ha)
Cost Items
Karnataka Odisha
2016-17 2017-18 2018-19% change in
2017-18 over 2016-17
% change in 2018-19 over
2017-182018-19
Operational Cost 18009 20529 22927 14.0 11.7 33646
Human Labour
Casual 5418 5461 5587 0.8 2.3 3908
Attached 0 0 0 - - 9178
Family 3180 3580 2686 12.6 -25.0 7509
Total 8598 9041 8273 5.2 -8.5 20596
Bullock Labour
Hired 828 1168 1358 41.1 16.3 0
Owned 899 2192 1207 143.8 -44.9 2411
Total 1727 3360 2565 94.6 -23.7 2411
Machine Labour
Hired 2763 1990 3313 -28.0 66.5 0
Owned 0 1089 1299 - 19.3 1619
Total 2763 3079 4611 11.5 49.8 1619
Seed 2261 2081 2799 -7.9 34.5 1960
Fertilisers and Manure
Fertilisers 1570 2015 2880 28.3 42.9 2197
Manure 0 105 545 - 420.2 0
Total 1570 2120 3425 35.0 61.5 2197
Other Inputs
Insecticides 140 170 198 21.3 16.6 429
Irrigation charges 501 104 398 -79.2 282.3 3559
Crop Insurance - 0 0 - - 0
Payment to Contractor - - - - - -
Interest on working capital 449 514 613 14.3 19.4 792
Miscellaneous 0 60 45 - -25.0 82
Fixed Cost 10574 7938 8089 -24.9 1.9 8206
Rental value of owned land 9547 6050 6079 -36.6 0.5 7414
Rent paid for leased-in land 0 0 0 - - 0
Land revenue,cesses & taxes 6 6 8 3.8 20.8 10
Depreciation on implements & Farm buildings 129 166 246 28.2 48.6 201
Interest on fixed capital 892 1716 1757 92.4 2.4 580
Total Cost (C2/ha) 28583 28467 31017 -0.4 9.0 41851
A2(₹/ha) 14964 17120 20495 14.4 19.7 26348
A2+FL(₹/ha) 18144 20701 23181 14.1 12.0 33858
Yield(qtl/ha) 12 8 7 -33.9 -13.2 7
A2(₹/qtl) 1277 2069 2864 62.0 38.4 3881
A2+FL(₹/qtl) 1538 2552 3244 65.9 27.1 5061
C2(₹/qtl) 2423 3505 4339 44.7 23.8 6258
Note: Total cost may not match due to rounding off the figures.Source: Directorate of Economics and Statistics, Department of Agriclture Cooperation & Farmers Welfare
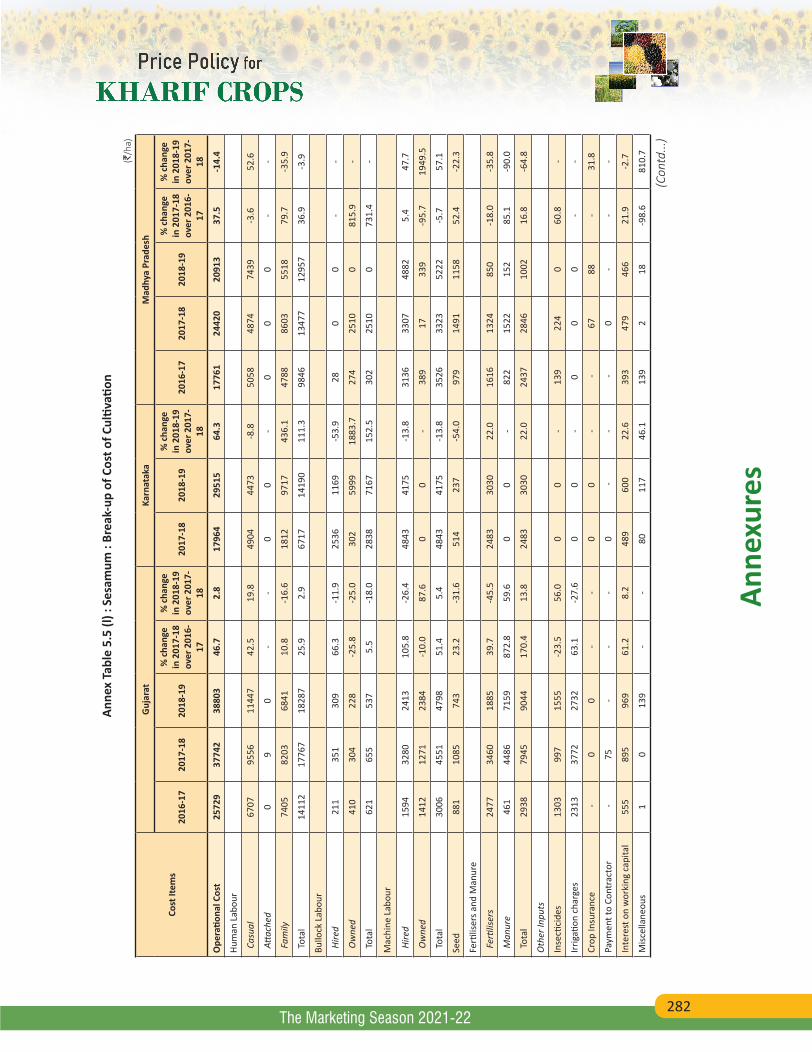
282
Anne
xure
s
The Marketing Season 2021-22
Anne
x Ta
ble
5.5
(l) :
Sesa
mum
: Br
eak-
up o
f Cos
t of C
ultiv
ation
(`/h
a)
Cost
Item
s
Guj
arat
Karn
atak
aM
adhy
a Pr
ades
h
2016
-17
2017
-18
2018
-19
% c
hang
e in
201
7-18
ov
er 2
016-
17
% c
hang
e in
201
8-19
ov
er 2
017-
18
2017
-18
2018
-19
% c
hang
e in
201
8-19
ov
er 2
017-
18
2016
-17
2017
-18
2018
-19
% c
hang
e in
201
7-18
ov
er 2
016-
17
% c
hang
e in
201
8-19
ov
er 2
017-
18
Ope
ratio
nal C
ost
2572
937
742
3880
346
.72.
817
964
2951
564
.317
761
2442
020
913
37.5
-14.
4
Hum
an L
abou
r
Cas
ual
6707
9556
1144
742
.519
.849
0444
73-8
.850
5848
7474
39-3
.652
.6
Atta
ched
09
0-
-0
0-
00
0-
-
Fam
ily74
0582
0368
4110
.8-1
6.6
1812
9717
436.
147
8886
0355
1879
.7-3
5.9
Tot
al14
112
1776
718
287
25.9
2.9
6717
1419
011
1.3
9846
1347
712
957
36.9
-3.9
Bullo
ck L
abou
r
Hire
d21
135
130
966
.3-1
1.9
2536
1169
-53.
928
00
--
Ow
ned
410
304
228
-25.
8-2
5.0
302
5999
1883
.727
425
100
815.
9-
Tot
al62
165
553
75.
5-1
8.0
2838
7167
152.
530
225
100
731.
4-
Mac
hine
Lab
our
Hire
d15
9432
8024
1310
5.8
-26.
448
4341
75-1
3.8
3136
3307
4882
5.4
47.7
Ow
ned
1412
1271
2384
-10.
087
.60
0-
389
1733
9-9
5.7
1949
.5
Tot
al30
0645
5147
9851
.45.
448
4341
75-1
3.8
3526
3323
5222
-5.7
57.1
Seed
881
1085
743
23.2
-31.
651
423
7-5
4.0
979
1491
1158
52.4
-22.
3
Ferti
liser
s and
Man
ure
Fer
tilise
rs24
7734
6018
8539
.7-4
5.5
2483
3030
22.0
1616
1324
850
-18.
0-3
5.8
Man
ure
461
4486
7159
872.
859
.60
0-
822
1522
152
85.1
-90.
0
Tot
al29
3879
4590
4417
0.4
13.8
2483
3030
22.0
2437
2846
1002
16.8
-64.
8
Oth
er In
puts
Inse
ctici
des
1303
997
1555
-23.
556
.00
0-
139
224
060
.8-
Irrig
ation
cha
rges
2313
3772
2732
63.1
-27.
60
0-
00
0-
-
Crop
Insu
ranc
e -
00
--
00
- -
6788
-31
.8
Paym
ent t
o Co
ntra
ctor
-75
--
-0
--
-0
--
-
Inte
rest
on
wor
king
cap
ital
555
895
969
61.2
8.2
489
600
22.6
393
479
466
21.9
-2.7
Misc
ella
neou
s1
013
9-
-80
117
46.1
139
218
-98.
681
0.7
(Con
td...
)
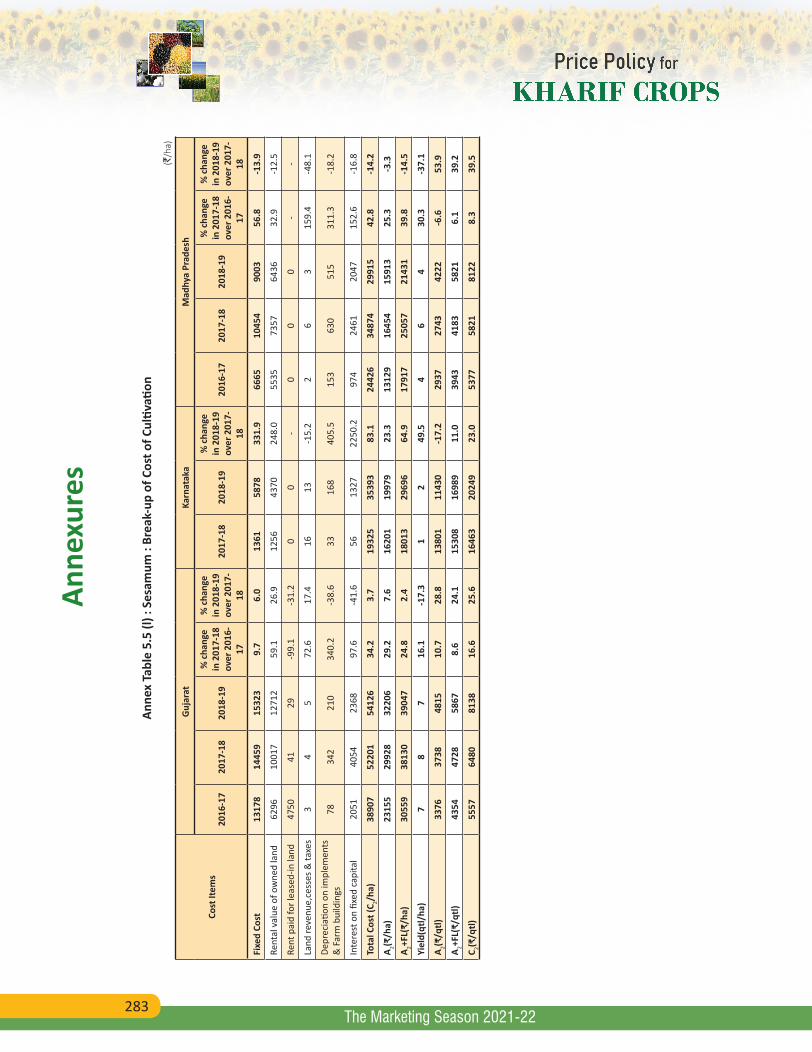
283
Anne
xure
s
The Marketing Season 2021-22
Anne
x Ta
ble
5.5
(l) :
Sesa
mum
: Br
eak-
up o
f Cos
t of C
ultiv
ation
(`/h
a)
Cost
Item
s
Guj
arat
Karn
atak
aM
adhy
a Pr
ades
h
2016
-17
2017
-18
2018
-19
% c
hang
e in
201
7-18
ov
er 2
016-
17
% c
hang
e in
201
8-19
ov
er 2
017-
18
2017
-18
2018
-19
% c
hang
e in
201
8-19
ov
er 2
017-
18
2016
-17
2017
-18
2018
-19
% c
hang
e in
201
7-18
ov
er 2
016-
17
% c
hang
e in
201
8-19
ov
er 2
017-
18
Fixe
d Co
st13
178
1445
915
323
9.7
6.0
1361
5878
331.
966
6510
454
9003
56.8
-13.
9
Rent
al v
alue
of o
wne
d la
nd62
9610
017
1271
259
.126
.912
5643
7024
8.0
5535
7357
6436
32.9
-12.
5
Rent
pai
d fo
r lea
sed-
in la
nd47
5041
29-9
9.1
-31.
20
0-
00
0-
-
Land
reve
nue,
cess
es &
taxe
s3
45
72.6
17.4
1613
-15.
22
63
159.
4-4
8.1
Depr
ecia
tion
on im
plem
ents
&
Far
m b
uild
ings
7834
221
034
0.2
-38.
633
168
405.
515
363
051
531
1.3
-18.
2
Inte
rest
on
fixed
cap
ital
2051
4054
2368
97.6
-41.
656
1327
2250
.297
424
6120
4715
2.6
-16.
8
Tota
l Cos
t (C 2/h
a)38
907
5220
154
126
34.2
3.7
1932
535
393
83.1
2442
634
874
2991
542
.8-1
4.2
A 2(₹/h
a)23
155
2992
832
206
29.2
7.6
1620
119
979
23.3
1312
916
454
1591
325
.3-3
.3
A 2+FL(
₹/ha
)30
559
3813
039
047
24.8
2.4
1801
329
696
64.9
1791
725
057
2143
139
.8-1
4.5
Yiel
d(qt
l/ha
)7
87
16.1
-17.
31
249
.54
64
30.3
-37.
1
A 2(₹/q
tl)33
7637
3848
1510
.728
.813
801
1143
0-1
7.2
2937
2743
4222
-6.6
53.9
A 2+FL(
₹/qt
l)43
5447
2858
678.
624
.115
308
1698
911
.039
4341
8358
216.
139
.2
C 2(₹/q
tl)55
5764
8081
3816
.625
.616
463
2024
923
.053
7758
2181
228.
339
.5
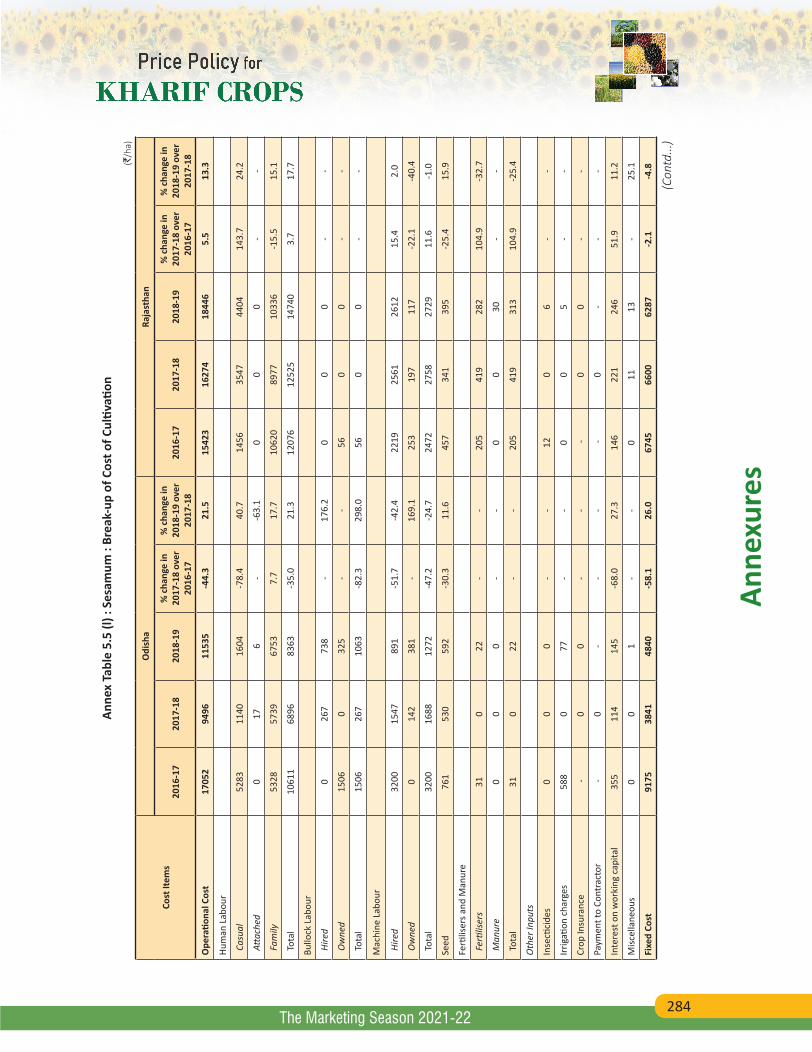
284
Anne
xure
s
The Marketing Season 2021-22
Anne
x Ta
ble
5.5
(l) :
Sesa
mum
: Br
eak-
up o
f Cos
t of C
ultiv
ation
(`/h
a)
Cost
Item
s
Odi
sha
Raja
stha
n
2016
-17
2017
-18
2018
-19
% c
hang
e in
20
17-1
8 ov
er
2016
-17
% c
hang
e in
20
18-1
9 ov
er
2017
-18
2016
-17
2017
-18
2018
-19
% c
hang
e in
20
17-1
8 ov
er
2016
-17
% c
hang
e in
20
18-1
9 ov
er
2017
-18
Ope
ratio
nal C
ost
1705
294
9611
535
-44.
321
.515
423
1627
418
446
5.5
13.3
Hum
an L
abou
r
Cas
ual
5283
1140
1604
-78.
440
.714
5635
4744
0414
3.7
24.2
Atta
ched
017
6-
-63.
10
00
--
Fam
ily53
2857
3967
537.
717
.710
620
8977
1033
6-1
5.5
15.1
Tot
al10
611
6896
8363
-35.
021
.312
076
1252
514
740
3.7
17.7
Bullo
ck L
abou
r
Hire
d0
267
738
-17
6.2
00
0-
-
Ow
ned
1506
032
5-
-56
00
--
Tot
al15
0626
710
63-8
2.3
298.
056
00
--
Mac
hine
Lab
our
Hire
d32
0015
4789
1-5
1.7
-42.
422
1925
6126
1215
.42.
0
Ow
ned
014
238
1-
169.
125
319
711
7-2
2.1
-40.
4
Tot
al32
0016
8812
72-4
7.2
-24.
724
7227
5827
2911
.6-1
.0
Seed
761
530
592
-30.
311
.645
734
139
5-2
5.4
15.9
Ferti
liser
s and
Man
ure
Fer
tilise
rs31
022
--
205
419
282
104.
9-3
2.7
Man
ure
00
0-
-0
030
--
Tot
al31
022
--
205
419
313
104.
9-2
5.4
Oth
er In
puts
Inse
ctici
des
00
0-
-12
06
--
Irrig
ation
cha
rges
588
077
--
00
5-
-
Crop
Insu
ranc
e -
00
--
-0
0-
-
Paym
ent t
o Co
ntra
ctor
-0
--
- -
0-
--
Inte
rest
on
wor
king
cap
ital
355
114
145
-68.
027
.314
622
124
651
.911
.2
Misc
ella
neou
s0
01
--
011
13-
25.1
Fixe
d Co
st91
7538
4148
40-5
8.1
26.0
6745
6600
6287
-2.1
-4.8
(Con
td...
)
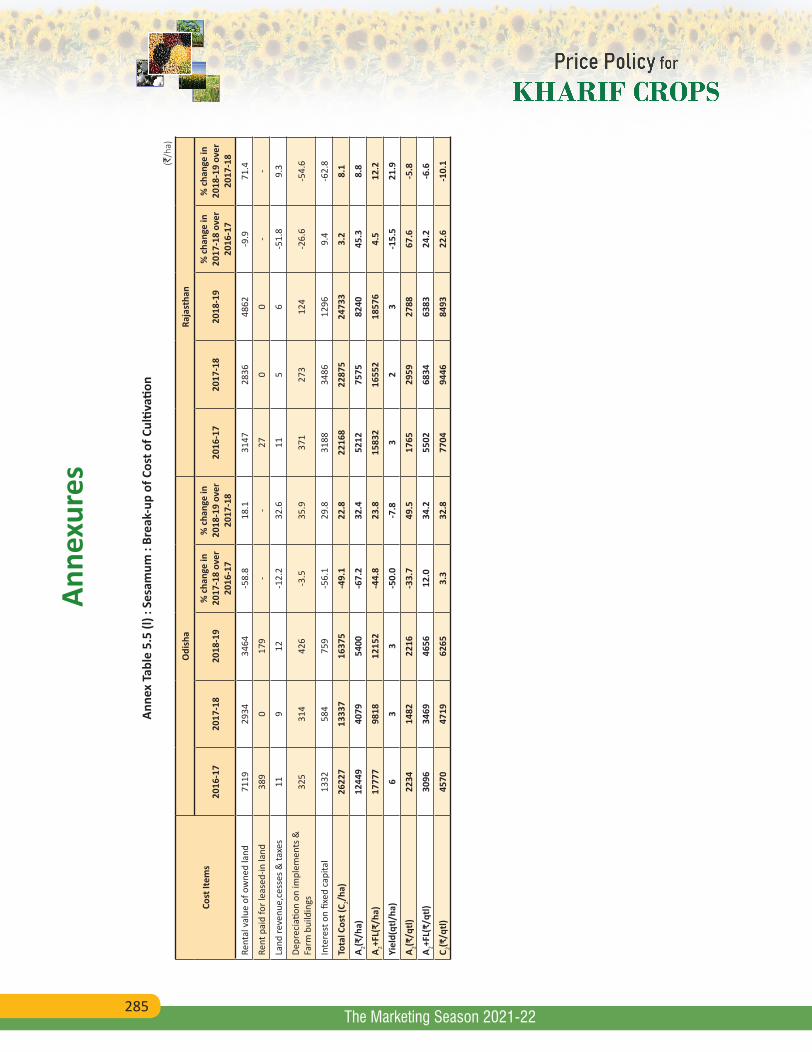
285
Anne
xure
s
The Marketing Season 2021-22
Anne
x Ta
ble
5.5
(l) :
Sesa
mum
: Br
eak-
up o
f Cos
t of C
ultiv
ation
(`/h
a)
Cost
Item
s
Odi
sha
Raja
stha
n
2016
-17
2017
-18
2018
-19
% c
hang
e in
20
17-1
8 ov
er
2016
-17
% c
hang
e in
20
18-1
9 ov
er
2017
-18
2016
-17
2017
-18
2018
-19
% c
hang
e in
20
17-1
8 ov
er
2016
-17
% c
hang
e in
20
18-1
9 ov
er
2017
-18
Rent
al v
alue
of o
wne
d la
nd71
1929
3434
64-5
8.8
18.1
3147
2836
4862
-9.9
71.4
Rent
pai
d fo
r lea
sed-
in la
nd38
90
179
--
270
0-
-
Land
reve
nue,
cess
es &
taxe
s11
912
-12.
232
.611
56
-51.
89.
3
Depr
ecia
tion
on im
plem
ents
&
Farm
bui
ldin
gs32
531
442
6-3
.535
.937
127
312
4-2
6.6
-54.
6
Inte
rest
on
fixed
cap
ital
1332
584
759
-56.
129
.831
8834
8612
969.
4-6
2.8
Tota
l Cos
t (C 2/h
a)26
227
1333
716
375
-49.
122
.822
168
2287
524
733
3.2
8.1
A 2(₹/h
a)12
449
4079
5400
-67.
232
.452
1275
7582
4045
.38.
8
A 2+FL(
₹/ha
)17
777
9818
1215
2-4
4.8
23.8
1583
216
552
1857
64.
512
.2
Yiel
d(qt
l/ha
)6
33
-50.
0-7
.83
23
-15.
521
.9
A 2(₹/q
tl)22
3414
8222
16-3
3.7
49.5
1765
2959
2788
67.6
-5.8
A 2+FL(
₹/qt
l)30
9634
6946
5612
.034
.255
0268
3463
8324
.2-6
.6
C 2(₹/q
tl)45
7047
1962
653.
332
.877
0494
4684
9322
.6-1
0.1
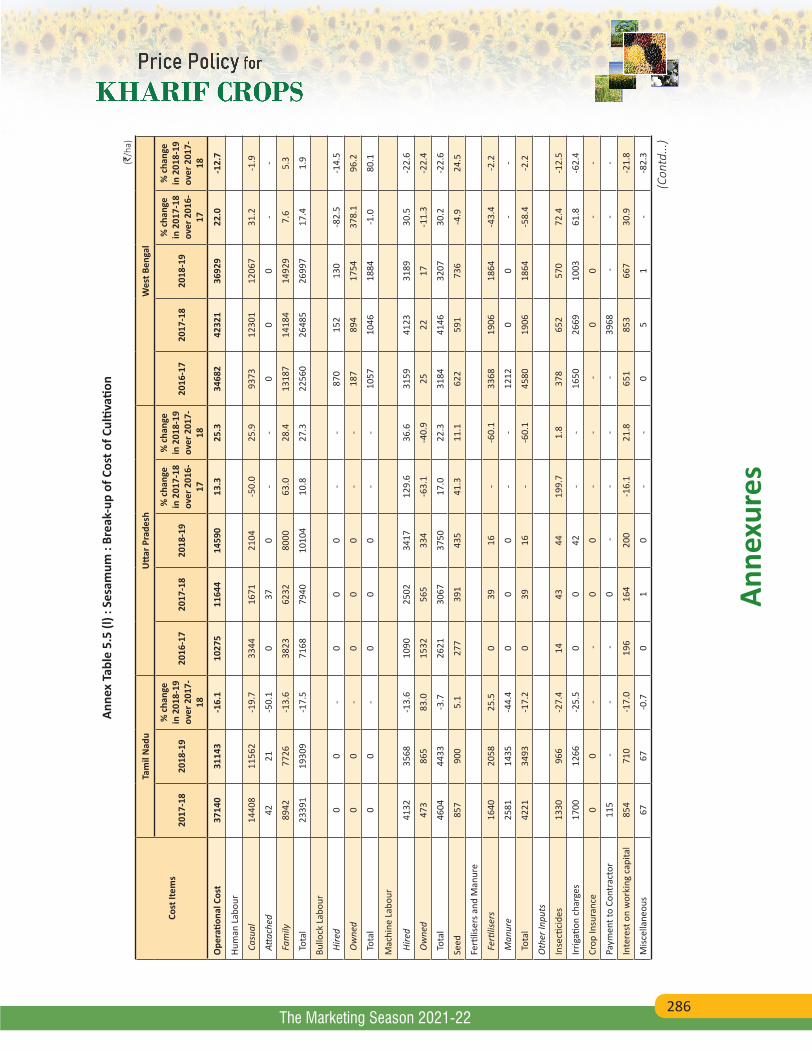
286
Anne
xure
s
The Marketing Season 2021-22
Anne
x Ta
ble
5.5
(l) :
Sesa
mum
: Br
eak-
up o
f Cos
t of C
ultiv
ation
(`/h
a)
Cost
Item
s
Tam
il N
adu
Utt
ar P
rade
shW
est B
enga
l
2017
-18
2018
-19
% c
hang
e in
201
8-19
ov
er 2
017-
18
2016
-17
2017
-18
2018
-19
% c
hang
e in
201
7-18
ov
er 2
016-
17
% c
hang
e in
201
8-19
ov
er 2
017-
18
2016
-17
2017
-18
2018
-19
% c
hang
e in
201
7-18
ov
er 2
016-
17
% c
hang
e in
201
8-19
ov
er 2
017-
18
Ope
ratio
nal C
ost
3714
031
143
-16.
110
275
1164
414
590
13.3
25.3
3468
242
321
3692
922
.0-1
2.7
Hum
an L
abou
r
Cas
ual
1440
811
562
-19.
733
4416
7121
04-5
0.0
25.9
9373
1230
112
067
31.2
-1.9
Atta
ched
4221
-50.
10
370
--
00
0-
-
Fam
ily89
4277
26-1
3.6
3823
6232
8000
63.0
28.4
1318
714
184
1492
97.
65.
3
Tot
al23
391
1930
9-1
7.5
7168
7940
1010
410
.827
.322
560
2648
526
997
17.4
1.9
Bullo
ck L
abou
r
Hire
d0
0-
00
0-
-87
015
213
0-8
2.5
-14.
5
Ow
ned
00
-0
00
--
187
894
1754
378.
196
.2
Tot
al0
0-
00
0-
-10
5710
4618
84-1
.080
.1
Mac
hine
Lab
our
Hire
d41
3235
68-1
3.6
1090
2502
3417
129.
636
.631
5941
2331
8930
.5-2
2.6
Ow
ned
473
865
83.0
1532
565
334
-63.
1-4
0.9
2522
17-1
1.3
-22.
4
Tot
al46
0444
33-3
.726
2130
6737
5017
.022
.331
8441
4632
0730
.2-2
2.6
Seed
857
900
5.1
277
391
435
41.3
11.1
622
591
736
-4.9
24.5
Ferti
liser
s and
Man
ure
Fer
tilise
rs16
4020
5825
.50
3916
--6
0.1
3368
1906
1864
-43.
4-2
.2
Man
ure
2581
1435
-44.
40
00
--
1212
00
--
Tot
al42
2134
93-1
7.2
039
16-
-60.
145
8019
0618
64-5
8.4
-2.2
Oth
er In
puts
Inse
ctici
des
1330
966
-27.
414
4344
199.
71.
837
865
257
072
.4-1
2.5
Irrig
ation
cha
rges
1700
1266
-25.
50
042
--
1650
2669
1003
61.8
-62.
4
Crop
Insu
ranc
e0
0-
-0
0-
- -
00
--
Paym
ent t
o Co
ntra
ctor
115
--
-0
--
- -
3968
--
-
Inte
rest
on
wor
king
cap
ital
854
710
-17.
019
616
420
0-1
6.1
21.8
651
853
667
30.9
-21.
8
Misc
ella
neou
s67
67-0
.70
10
--
05
1-
-82.
3
(Con
td...
)
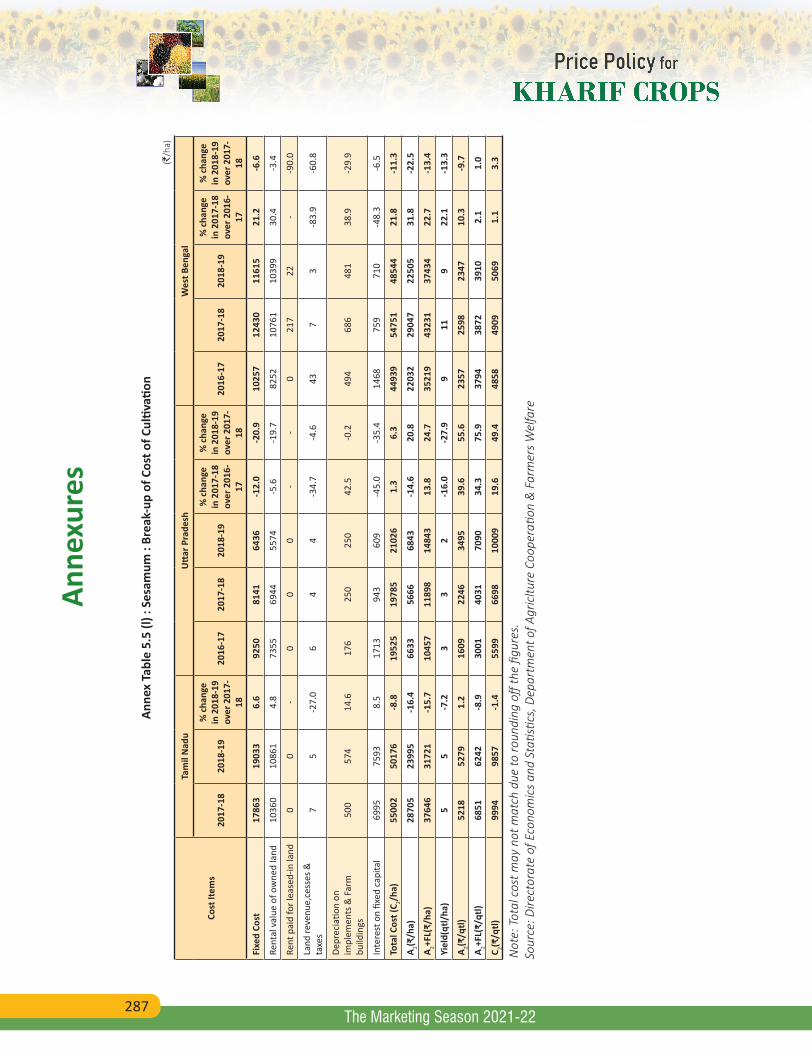
287
Anne
xure
s
The Marketing Season 2021-22
Anne
x Ta
ble
5.5
(l) :
Sesa
mum
: Br
eak-
up o
f Cos
t of C
ultiv
ation
(`/h
a)
Cost
Item
s
Tam
il N
adu
Utt
ar P
rade
shW
est B
enga
l
2017
-18
2018
-19
% c
hang
e in
201
8-19
ov
er 2
017-
18
2016
-17
2017
-18
2018
-19
% c
hang
e in
201
7-18
ov
er 2
016-
17
% c
hang
e in
201
8-19
ov
er 2
017-
18
2016
-17
2017
-18
2018
-19
% c
hang
e in
201
7-18
ov
er 2
016-
17
% c
hang
e in
201
8-19
ov
er 2
017-
18
Fixe
d Co
st17
863
1903
36.
692
5081
4164
36-1
2.0
-20.
910
257
1243
011
615
21.2
-6.6
Rent
al v
alue
of o
wne
d la
nd10
360
1086
14.
873
5569
4455
74-5
.6-1
9.7
8252
1076
110
399
30.4
-3.4
Rent
pai
d fo
r lea
sed-
in la
nd0
0-
00
0-
-0
217
22-
-90.
0
Land
reve
nue,
cess
es &
ta
xes
75
-27.
06
44
-34.
7-4
.643
73
-83.
9-6
0.8
Depr
ecia
tion
on
impl
emen
ts &
Far
m
build
ings
500
574
14.6
176
250
250
42.5
-0.2
494
686
481
38.9
-29.
9
Inte
rest
on
fixed
cap
ital
6995
7593
8.5
1713
943
609
-45.
0-3
5.4
1468
759
710
-48.
3-6
.5
Tota
l Cos
t (C 2/h
a)55
002
5017
6-8
.819
525
1978
521
026
1.3
6.3
4493
954
751
4854
421
.8-1
1.3
A 2(₹/h
a)28
705
2399
5-1
6.4
6633
5666
6843
-14.
620
.822
032
2904
722
505
31.8
-22.
5
A 2+FL(
₹/ha
)37
646
3172
1-1
5.7
1045
711
898
1484
313
.824
.735
219
4323
137
434
22.7
-13.
4
Yiel
d(qt
l/ha
)5
5-7
.23
32
-16.
0-2
7.9
911
922
.1-1
3.3
A 2(₹/q
tl)52
1852
791.
216
0922
4634
9539
.655
.623
5725
9823
4710
.3-9
.7
A 2+FL(
₹/qt
l)68
5162
42-8
.930
0140
3170
9034
.375
.937
9438
7239
102.
11.
0
C 2(₹/q
tl)99
9498
57-1
.455
9966
9810
009
19.6
49.4
4858
4909
5069
1.1
3.3
Not
e: T
otal
cos
t may
not
mat
ch d
ue to
roun
ding
off
the
figur
es.
Sour
ce: D
irect
orat
e of
Eco
nom
ics
and
Stati
stics
, Dep
artm
ent o
f Agr
icltu
re C
oope
ratio
n &
Far
mer
s W
elfa
re
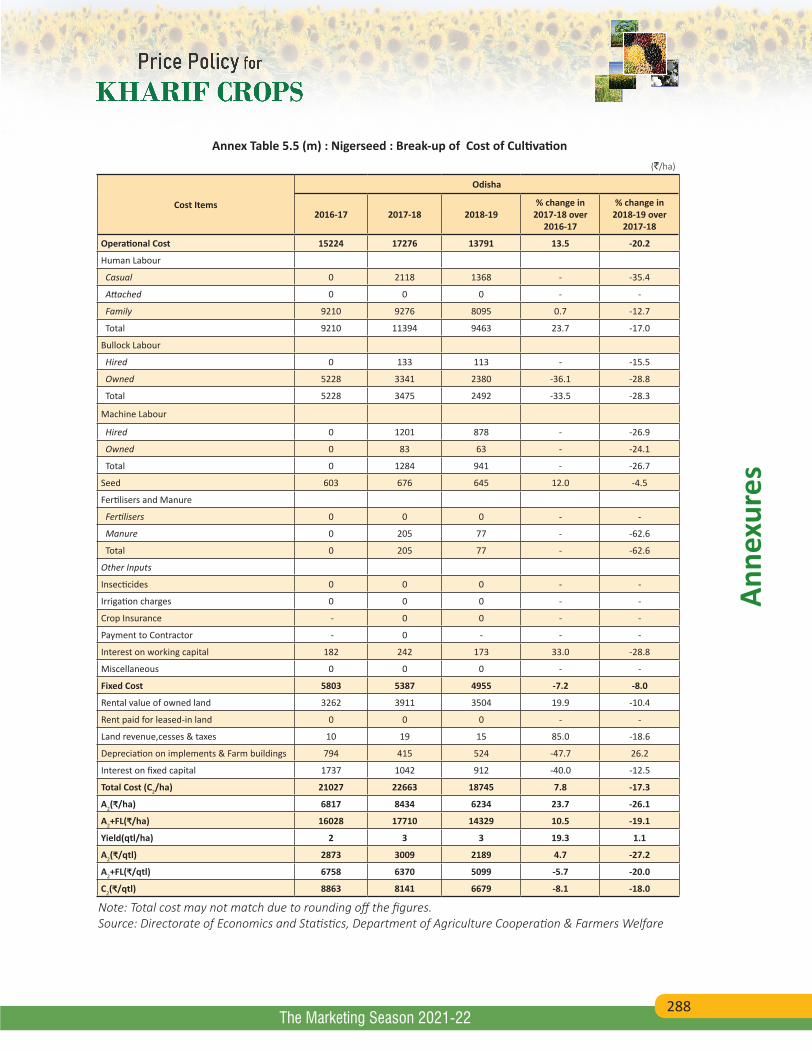
288
Anne
xure
s
The Marketing Season 2021-22
Annex Table 5.5 (m) : Nigerseed : Break-up of Cost of Cultivation (`/ha)
Cost Items
Odisha
2016-17 2017-18 2018-19% change in
2017-18 over 2016-17
% change in 2018-19 over
2017-18
Operational Cost 15224 17276 13791 13.5 -20.2
Human Labour
Casual 0 2118 1368 - -35.4
Attached 0 0 0 - -
Family 9210 9276 8095 0.7 -12.7
Total 9210 11394 9463 23.7 -17.0
Bullock Labour
Hired 0 133 113 - -15.5
Owned 5228 3341 2380 -36.1 -28.8
Total 5228 3475 2492 -33.5 -28.3
Machine Labour
Hired 0 1201 878 - -26.9
Owned 0 83 63 - -24.1
Total 0 1284 941 - -26.7
Seed 603 676 645 12.0 -4.5
Fertilisers and Manure
Fertilisers 0 0 0 - -
Manure 0 205 77 - -62.6
Total 0 205 77 - -62.6
Other Inputs
Insecticides 0 0 0 - -
Irrigation charges 0 0 0 - -
Crop Insurance - 0 0 - -
Payment to Contractor - 0 - - -
Interest on working capital 182 242 173 33.0 -28.8
Miscellaneous 0 0 0 - -
Fixed Cost 5803 5387 4955 -7.2 -8.0
Rental value of owned land 3262 3911 3504 19.9 -10.4
Rent paid for leased-in land 0 0 0 - -
Land revenue,cesses & taxes 10 19 15 85.0 -18.6
Depreciation on implements & Farm buildings 794 415 524 -47.7 26.2
Interest on fixed capital 1737 1042 912 -40.0 -12.5
Total Cost (C2/ha) 21027 22663 18745 7.8 -17.3
A2(₹/ha) 6817 8434 6234 23.7 -26.1
A2+FL(₹/ha) 16028 17710 14329 10.5 -19.1
Yield(qtl/ha) 2 3 3 19.3 1.1
A2(₹/qtl) 2873 3009 2189 4.7 -27.2
A2+FL(₹/qtl) 6758 6370 5099 -5.7 -20.0
C2(₹/qtl) 8863 8141 6679 -8.1 -18.0
Note: Total cost may not match due to rounding off the figures.Source: Directorate of Economics and Statistics, Department of Agriculture Cooperation & Farmers Welfare
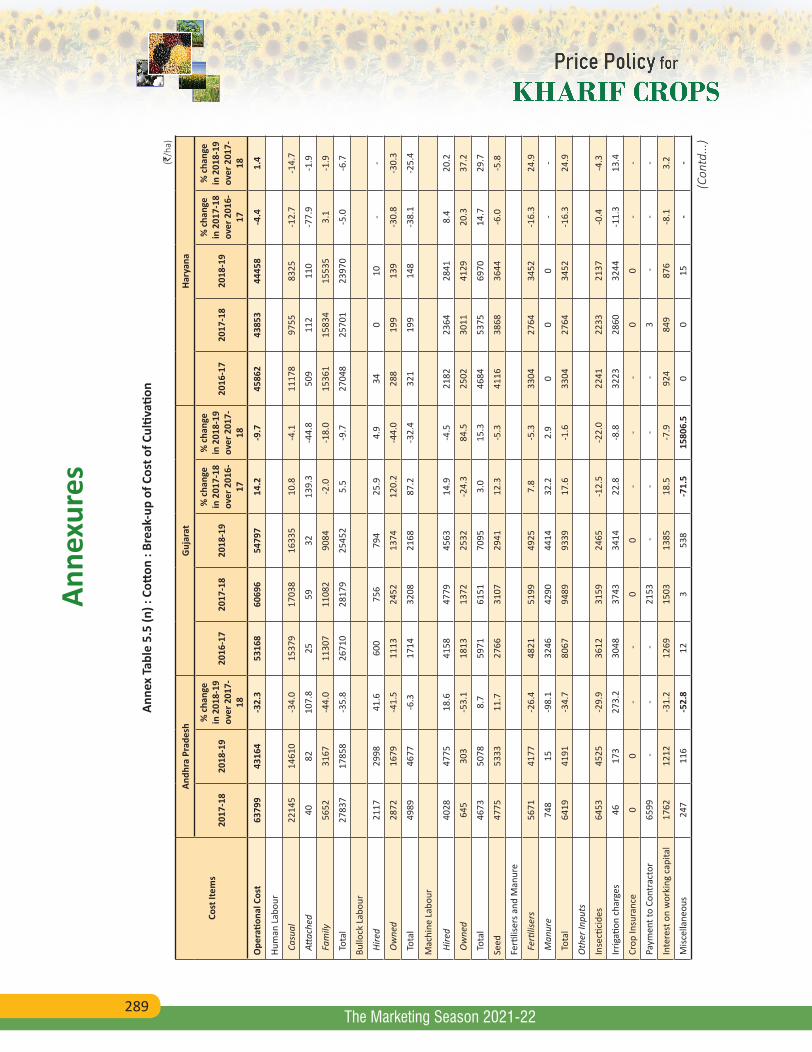
289
Anne
xure
s
The Marketing Season 2021-22
Anne
x Ta
ble
5.5
(n) :
Cott
on :
Brea
k-up
of C
ost o
f Cul
tivati
on (`
/ha)
Cost
Item
s
Andh
ra P
rade
shG
ujar
atHa
ryan
a
2017
-18
2018
-19
% c
hang
e in
201
8-19
ov
er 2
017-
18
2016
-17
2017
-18
2018
-19
% c
hang
e in
201
7-18
ov
er 2
016-
17
% c
hang
e in
201
8-19
ov
er 2
017-
18
2016
-17
2017
-18
2018
-19
% c
hang
e in
201
7-18
ov
er 2
016-
17
% c
hang
e in
201
8-19
ov
er 2
017-
18
Ope
ratio
nal C
ost
6379
943
164
-32.
353
168
6069
654
797
14.2
-9.7
4586
243
853
4445
8-4
.41.
4
Hum
an L
abou
r
Cas
ual
2214
514
610
-34.
015
379
1703
816
335
10.8
-4.1
1117
897
5583
25-1
2.7
-14.
7
Atta
ched
4082
107.
825
5932
139.
3-4
4.8
509
112
110
-77.
9-1
.9
Fam
ily56
5231
67-4
4.0
1130
711
082
9084
-2.0
-18.
015
361
1583
415
535
3.1
-1.9
Tot
al27
837
1785
8-3
5.8
2671
028
179
2545
25.
5-9
.727
048
2570
123
970
-5.0
-6.7
Bullo
ck L
abou
r
Hire
d21
1729
9841
.660
075
679
425
.94.
934
010
--
Ow
ned
2872
1679
-41.
511
1324
5213
7412
0.2
-44.
028
819
913
9-3
0.8
-30.
3
Tot
al49
8946
77-6
.317
1432
0821
6887
.2-3
2.4
321
199
148
-38.
1-2
5.4
Mac
hine
Lab
our
Hire
d40
2847
7518
.641
5847
7945
6314
.9-4
.521
8223
6428
418.
420
.2
Ow
ned
645
303
-53.
118
1313
7225
32-2
4.3
84.5
2502
3011
4129
20.3
37.2
Tot
al46
7350
788.
759
7161
5170
953.
015
.346
8453
7569
7014
.729
.7
Seed
4775
5333
11.7
2766
3107
2941
12.3
-5.3
4116
3868
3644
-6.0
-5.8
Ferti
liser
s and
Man
ure
Fer
tilise
rs56
7141
77-2
6.4
4821
5199
4925
7.8
-5.3
3304
2764
3452
-16.
324
.9
Man
ure
748
15-9
8.1
3246
4290
4414
32.2
2.9
00
0-
-
Tot
al64
1941
91-3
4.7
8067
9489
9339
17.6
-1.6
3304
2764
3452
-16.
324
.9
Oth
er In
puts
Inse
ctici
des
6453
4525
-29.
936
1231
5924
65-1
2.5
-22.
022
4122
3321
37-0
.4-4
.3
Irrig
ation
cha
rges
4617
327
3.2
3048
3743
3414
22.8
-8.8
3223
2860
3244
-11.
313
.4
Crop
Insu
ranc
e0
0-
-0
0-
- -
00
--
Paym
ent t
o Co
ntra
ctor
6599
--
-21
53 -
--
-3
--
-
Inte
rest
on
wor
king
cap
ital
1762
1212
-31.
212
6915
0313
8518
.5-7
.992
484
987
6-8
.13.
2
Misc
ella
neou
s24
711
6-5
2.8
123
538
-71.
515
806.
50
015
--
(Con
td...
)
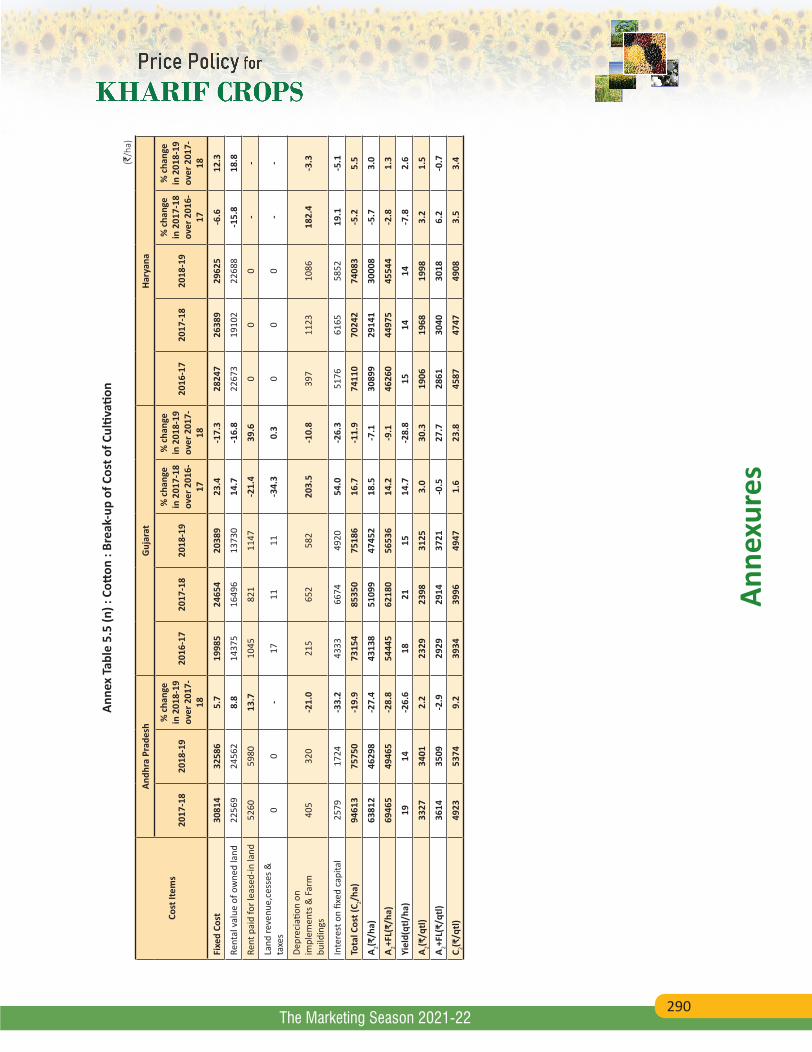
290
Anne
xure
s
The Marketing Season 2021-22
Anne
x Ta
ble
5.5
(n) :
Cott
on :
Brea
k-up
of C
ost o
f Cul
tivati
on (`
/ha)
Cost
Item
s
Andh
ra P
rade
shG
ujar
atHa
ryan
a
2017
-18
2018
-19
% c
hang
e in
201
8-19
ov
er 2
017-
18
2016
-17
2017
-18
2018
-19
% c
hang
e in
201
7-18
ov
er 2
016-
17
% c
hang
e in
201
8-19
ov
er 2
017-
18
2016
-17
2017
-18
2018
-19
% c
hang
e in
201
7-18
ov
er 2
016-
17
% c
hang
e in
201
8-19
ov
er 2
017-
18
Fixe
d Co
st30
814
3258
65.
719
985
2465
420
389
23.4
-17.
328
247
2638
929
625
-6.6
12.3
Rent
al v
alue
of o
wne
d la
nd22
569
2456
28.
814
375
1649
613
730
14.7
-16.
822
673
1910
222
688
-15.
818
.8
Rent
pai
d fo
r lea
sed-
in la
nd52
6059
8013
.710
4582
111
47-2
1.4
39.6
00
0-
-
Land
reve
nue,
cess
es &
ta
xes
00
-17
1111
-34.
30.
30
00
--
Depr
ecia
tion
on
impl
emen
ts &
Far
m
build
ings
405
320
-21.
021
565
258
220
3.5
-10.
839
711
2310
8618
2.4
-3.3
Inte
rest
on
fixed
cap
ital
2579
1724
-33.
243
3366
7449
2054
.0-2
6.3
5176
6165
5852
19.1
-5.1
Tota
l Cos
t (C 2/h
a)94
613
7575
0-1
9.9
7315
485
350
7518
616
.7-1
1.9
7411
070
242
7408
3-5
.25.
5
A 2(₹/h
a)63
812
4629
8-2
7.4
4313
851
099
4745
218
.5-7
.130
899
2914
130
008
-5.7
3.0
A 2+FL(
₹/ha
)69
465
4946
5-2
8.8
5444
562
180
5653
614
.2-9
.146
260
4497
545
544
-2.8
1.3
Yiel
d(qt
l/ha
)19
14-2
6.6
1821
1514
.7-2
8.8
1514
14-7
.82.
6
A 2(₹/q
tl)33
2734
012.
223
2923
9831
253.
030
.319
0619
6819
983.
21.
5
A 2+FL(
₹/qt
l)36
1435
09-2
.929
2929
1437
21-0
.527
.728
6130
4030
186.
2-0
.7
C 2(₹/q
tl)49
2353
749.
239
3439
9649
471.
623
.845
8747
4749
083.
53.
4

291
Anne
xure
s
The Marketing Season 2021-22
Anne
x Ta
ble
5.5
(n) :
Cott
on :
Brea
k-up
of C
ost o
f Cul
tivati
on (`
/ha)
Cost
Item
s
Karn
atak
aM
adhy
a Pr
ades
h
2016
-17
2017
-18
2018
-19
% c
hang
e in
20
17-1
8 ov
er
2016
-17
% c
hang
e in
20
18-1
9 ov
er
2017
-18
2016
-17
2017
-18
2018
-19
% c
hang
e in
20
17-1
8 ov
er
2016
-17
% c
hang
e in
20
18-1
9 ov
er
2017
-18
Ope
ratio
nal C
ost
4393
143
367
3988
0-1
.3-8
.060
707
5655
763
013
-6.8
11.4
Hum
an L
abou
r
Cas
ual
1554
511
470
1160
8-2
6.2
1.2
1166
417
585
1849
450
.85.
2
Atta
ched
06
0-
-52
630
459
2-4
2.2
94.9
Fam
ily56
1369
8767
8924
.5-2
.819
500
1123
914
506
-42.
429
.1
Tot
al21
158
1846
318
396
-12.
7-0
.431
690
2912
733
592
-8.1
15.3
Bullo
ck L
abou
r
Hire
d14
5615
4415
106.
0-2
.20
854
970
-13
.6
Ow
ned
1827
3077
3917
68.4
27.3
7537
5438
3921
-27.
8-2
7.9
Tot
al32
8346
2154
2740
.717
.475
3762
9248
90-1
6.5
-22.
3
Mac
hine
Lab
our
Hire
d38
9130
6935
28-2
1.1
15.0
3359
3512
4584
4.5
30.5
Ow
ned
710
2747
1476
287.
1-4
6.3
7628
252
926
8.9
87.4
Tot
al46
0058
1650
0426
.4-1
4.0
3436
3794
5113
10.4
34.8
Seed
3233
3998
3341
23.7
-16.
421
8622
1220
981.
2-5
.2
Ferti
liser
s and
Man
ure
Fer
tilise
rs47
0143
5237
44-7
.4-1
4.0
3206
3706
5428
15.6
46.5
Man
ure
1392
807
276
-42.
0-6
5.8
3793
2492
2335
-34.
3-6
.3
Tot
al60
9451
6040
20-1
5.3
-22.
169
9961
9877
63-1
1.4
25.3
Oth
er In
puts
Inse
ctici
des
2616
3158
1986
20.7
-37.
146
2253
4243
2715
.6-1
9.0
Irrig
ation
cha
rges
1786
791
517
-55.
7-3
4.6
1576
1459
2490
-7.4
70.6
Crop
Insu
ranc
e -
00
--
-73
411
90-
62.2
Paym
ent t
o Co
ntra
ctor
- -
--
- -
0-
--
Inte
rest
on
wor
king
cap
ital
1161
1102
1003
-5.1
-9.0
1249
1373
1470
10.0
7.0
Misc
ella
neou
s0
257
186
--2
7.9
1412
2380
-98.
324
2.7
Fixe
d Co
st25
805
1831
118
931
-29.
03.
422
040
2210
328
722
0.3
29.9
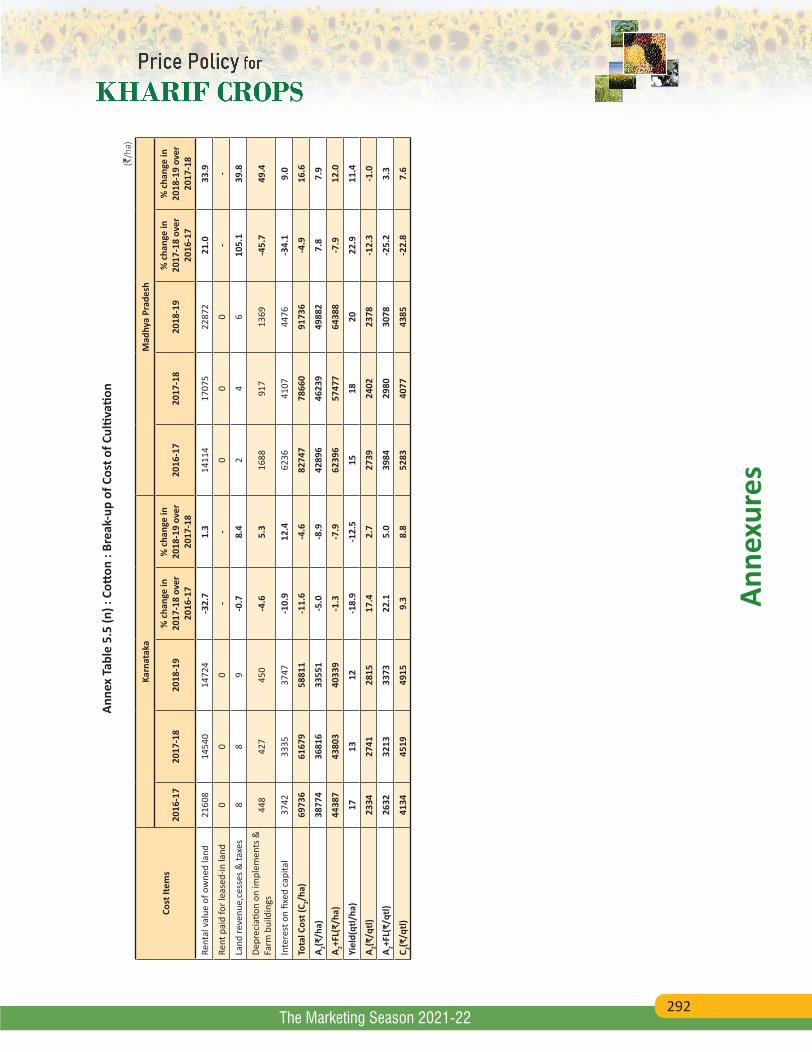
292
Anne
xure
s
The Marketing Season 2021-22
Anne
x Ta
ble
5.5
(n) :
Cott
on :
Brea
k-up
of C
ost o
f Cul
tivati
on (`
/ha)
Cost
Item
s
Karn
atak
aM
adhy
a Pr
ades
h
2016
-17
2017
-18
2018
-19
% c
hang
e in
20
17-1
8 ov
er
2016
-17
% c
hang
e in
20
18-1
9 ov
er
2017
-18
2016
-17
2017
-18
2018
-19
% c
hang
e in
20
17-1
8 ov
er
2016
-17
% c
hang
e in
20
18-1
9 ov
er
2017
-18
Rent
al v
alue
of o
wne
d la
nd21
608
1454
014
724
-32.
71.
314
114
1707
522
872
21.0
33.9
Rent
pai
d fo
r lea
sed-
in la
nd0
00
--
00
0-
-
Land
reve
nue,
cess
es &
taxe
s8
89
-0.7
8.4
24
610
5.1
39.8
Depr
ecia
tion
on im
plem
ents
&
Farm
bui
ldin
gs44
842
745
0-4
.65.
316
8891
713
69-4
5.7
49.4
Inte
rest
on
fixed
cap
ital
3742
3335
3747
-10.
912
.462
3641
0744
76-3
4.1
9.0
Tota
l Cos
t (C 2/h
a)69
736
6167
958
811
-11.
6-4
.682
747
7866
091
736
-4.9
16.6
A 2(₹/h
a)38
774
3681
633
551
-5.0
-8.9
4289
646
239
4988
27.
87.
9
A 2+FL(
₹/ha
)44
387
4380
340
339
-1.3
-7.9
6239
657
477
6438
8-7
.912
.0
Yiel
d(qt
l/ha
)17
1312
-18.
9-1
2.5
1518
2022
.911
.4
A 2(₹/q
tl)23
3427
4128
1517
.42.
727
3924
0223
78-1
2.3
-1.0
A 2+FL(
₹/qt
l)26
3232
1333
7322
.15.
039
8429
8030
78-2
5.2
3.3
C 2(₹/q
tl)41
3445
1949
159.
38.
852
8340
7743
85-2
2.8
7.6
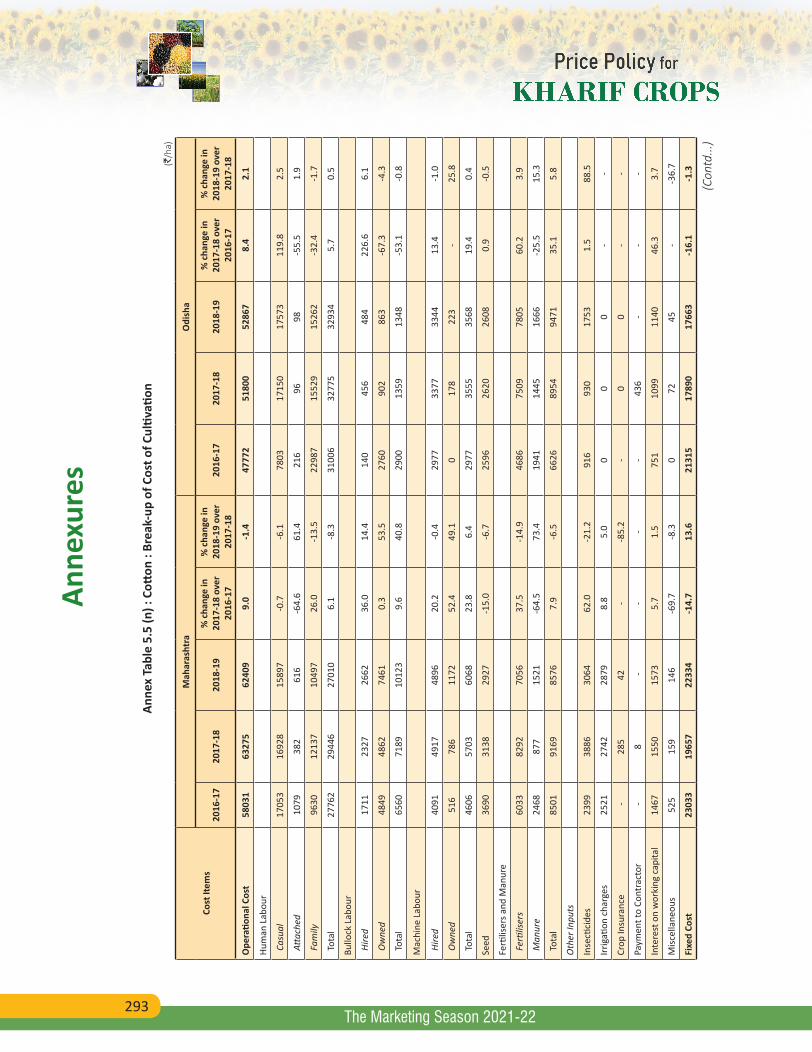
293
Anne
xure
s
The Marketing Season 2021-22
Anne
x Ta
ble
5.5
(n) :
Cott
on :
Brea
k-up
of C
ost o
f Cul
tivati
on (`
/ha)
Cost
Item
s
Mah
aras
htra
Odi
sha
2016
-17
2017
-18
2018
-19
% c
hang
e in
20
17-1
8 ov
er
2016
-17
% c
hang
e in
20
18-1
9 ov
er
2017
-18
2016
-17
2017
-18
2018
-19
% c
hang
e in
20
17-1
8 ov
er
2016
-17
% c
hang
e in
20
18-1
9 ov
er
2017
-18
Ope
ratio
nal C
ost
5803
163
275
6240
99.
0-1
.447
772
5180
052
867
8.4
2.1
Hum
an L
abou
r
Cas
ual
1705
316
928
1589
7-0
.7-6
.178
0317
150
1757
311
9.8
2.5
Atta
ched
1079
382
616
-64.
661
.421
696
98-5
5.5
1.9
Fam
ily96
3012
137
1049
726
.0-1
3.5
2298
715
529
1526
2-3
2.4
-1.7
Tot
al27
762
2944
627
010
6.1
-8.3
3100
632
775
3293
45.
70.
5
Bullo
ck L
abou
r
Hire
d17
1123
2726
6236
.014
.414
045
648
422
6.6
6.1
Ow
ned
4849
4862
7461
0.3
53.5
2760
902
863
-67.
3-4
.3
Tot
al65
6071
8910
123
9.6
40.8
2900
1359
1348
-53.
1-0
.8
Mac
hine
Lab
our
Hire
d40
9149
1748
9620
.2-0
.429
7733
7733
4413
.4-1
.0
Ow
ned
516
786
1172
52.4
49.1
017
822
3-
25.8
Tot
al46
0657
0360
6823
.86.
429
7735
5535
6819
.40.
4
Seed
3690
3138
2927
-15.
0-6
.725
9626
2026
080.
9-0
.5
Ferti
liser
s and
Man
ure
Fer
tilise
rs60
3382
9270
5637
.5-1
4.9
4686
7509
7805
60.2
3.9
Man
ure
2468
877
1521
-64.
573
.419
4114
4516
66-2
5.5
15.3
Tot
al85
0191
6985
767.
9-6
.566
2689
5494
7135
.15.
8
Oth
er In
puts
Inse
ctici
des
2399
3886
3064
62.0
-21.
291
693
017
531.
588
.5
Irrig
ation
cha
rges
2521
2742
2879
8.8
5.0
00
0-
-
Crop
Insu
ranc
e -
285
42-
-85.
2-
00
--
Paym
ent t
o Co
ntra
ctor
-8
--
--
436
--
-
Inte
rest
on
wor
king
cap
ital
1467
1550
1573
5.7
1.5
751
1099
1140
46.3
3.7
Misc
ella
neou
s52
515
914
6-6
9.7
-8.3
072
45-
-36.
7
Fixe
d Co
st23
033
1965
722
334
-14.
713
.621
315
1789
017
663
-16.
1-1
.3
(Con
td...
)
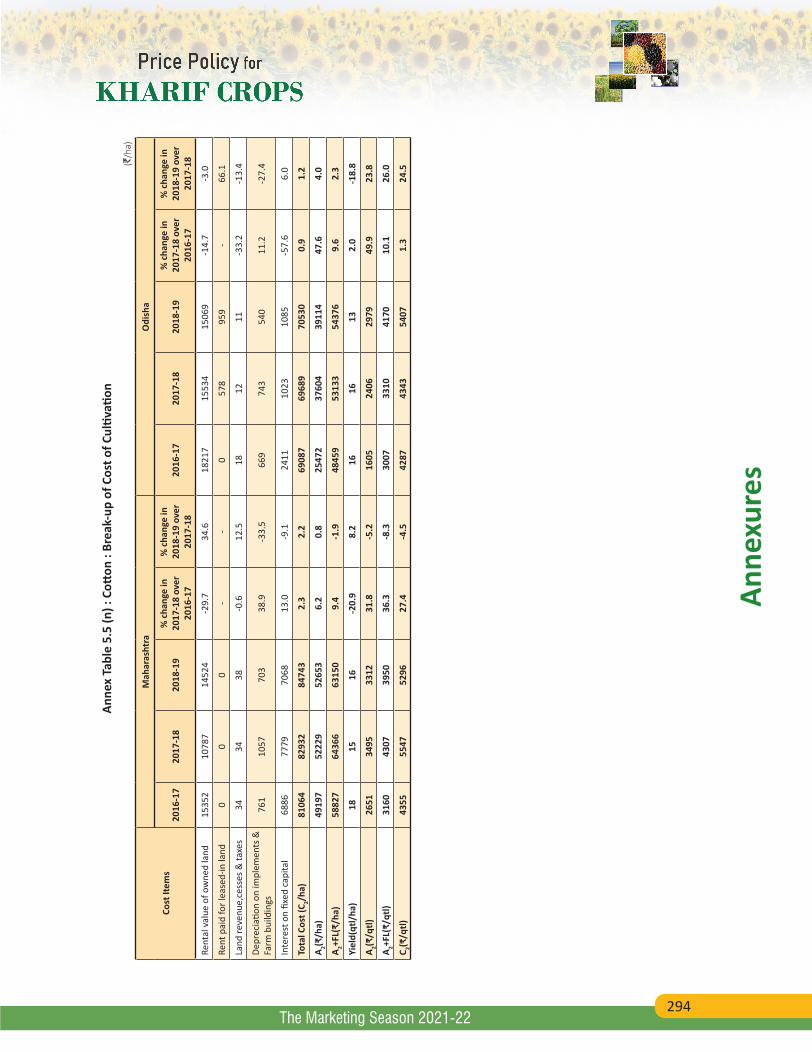
294
Anne
xure
s
The Marketing Season 2021-22
Anne
x Ta
ble
5.5
(n) :
Cott
on :
Brea
k-up
of C
ost o
f Cul
tivati
on (`
/ha)
Cost
Item
s
Mah
aras
htra
Odi
sha
2016
-17
2017
-18
2018
-19
% c
hang
e in
20
17-1
8 ov
er
2016
-17
% c
hang
e in
20
18-1
9 ov
er
2017
-18
2016
-17
2017
-18
2018
-19
% c
hang
e in
20
17-1
8 ov
er
2016
-17
% c
hang
e in
20
18-1
9 ov
er
2017
-18
Rent
al v
alue
of o
wne
d la
nd15
352
1078
714
524
-29.
734
.618
217
1553
415
069
-14.
7-3
.0
Rent
pai
d fo
r lea
sed-
in la
nd0
00
--
057
895
9-
66.1
Land
reve
nue,
cess
es &
taxe
s34
3438
-0.6
12.5
1812
11-3
3.2
-13.
4
Depr
ecia
tion
on im
plem
ents
&
Farm
bui
ldin
gs76
110
5770
338
.9-3
3.5
669
743
540
11.2
-27.
4
Inte
rest
on
fixed
cap
ital
6886
7779
7068
13.0
-9.1
2411
1023
1085
-57.
66.
0
Tota
l Cos
t (C 2/h
a)81
064
8293
284
743
2.3
2.2
6908
769
689
7053
00.
91.
2
A 2(₹/h
a)49
197
5222
952
653
6.2
0.8
2547
237
604
3911
447
.64.
0
A 2+FL(
₹/ha
)58
827
6436
663
150
9.4
-1.9
4845
953
133
5437
69.
62.
3
Yiel
d(qt
l/ha
)18
1516
-20.
98.
216
1613
2.0
-18.
8
A 2(₹/q
tl)26
5134
9533
1231
.8-5
.216
0524
0629
7949
.923
.8
A 2+FL(
₹/qt
l)31
6043
0739
5036
.3-8
.330
0733
1041
7010
.126
.0
C 2(₹/q
tl)43
5555
4752
9627
.4-4
.542
8743
4354
071.
324
.5
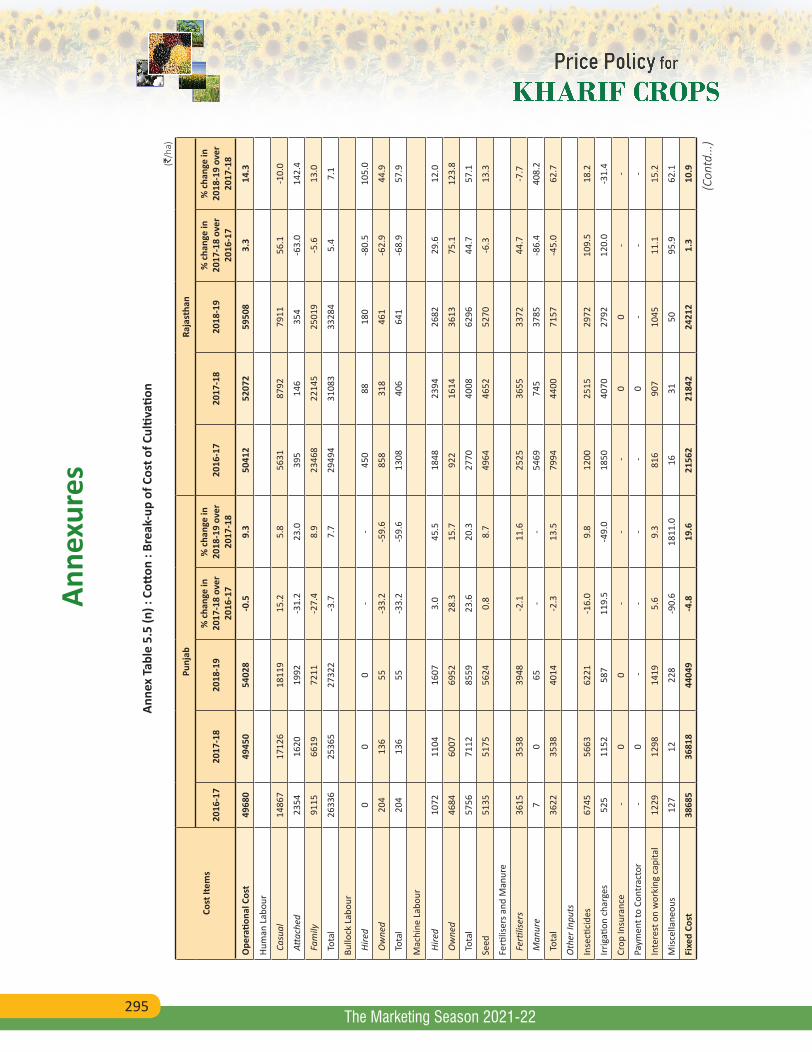
295
Anne
xure
s
The Marketing Season 2021-22
Anne
x Ta
ble
5.5
(n) :
Cott
on :
Brea
k-up
of C
ost o
f Cul
tivati
on (`
/ha)
Cost
Item
s
Punj
abRa
jast
han
2016
-17
2017
-18
2018
-19
% c
hang
e in
20
17-1
8 ov
er
2016
-17
% c
hang
e in
20
18-1
9 ov
er
2017
-18
2016
-17
2017
-18
2018
-19
% c
hang
e in
20
17-1
8 ov
er
2016
-17
% c
hang
e in
20
18-1
9 ov
er
2017
-18
Ope
ratio
nal C
ost
4968
049
450
5402
8-0
.59.
350
412
5207
259
508
3.3
14.3
Hum
an L
abou
r
Cas
ual
1486
717
126
1811
915
.25.
856
3187
9279
1156
.1-1
0.0
Atta
ched
2354
1620
1992
-31.
223
.039
514
635
4-6
3.0
142.
4
Fam
ily91
1566
1972
11-2
7.4
8.9
2346
822
145
2501
9-5
.613
.0
Tot
al26
336
2536
527
322
-3.7
7.7
2949
431
083
3328
45.
47.
1
Bullo
ck L
abou
r
Hire
d0
00
--
450
8818
0-8
0.5
105.
0
Ow
ned
204
136
55-3
3.2
-59.
685
831
846
1-6
2.9
44.9
Tot
al20
413
655
-33.
2-5
9.6
1308
406
641
-68.
957
.9
Mac
hine
Lab
our
Hire
d10
7211
0416
073.
045
.518
4823
9426
8229
.612
.0
Ow
ned
4684
6007
6952
28.3
15.7
922
1614
3613
75.1
123.
8
Tot
al57
5671
1285
5923
.620
.327
7040
0862
9644
.757
.1
Seed
5135
5175
5624
0.8
8.7
4964
4652
5270
-6.3
13.3
Ferti
liser
s and
Man
ure
Fer
tilise
rs36
1535
3839
48-2
.111
.625
2536
5533
7244
.7-7
.7
Man
ure
70
65-
-54
6974
537
85-8
6.4
408.
2
Tot
al36
2235
3840
14-2
.313
.579
9444
0071
57-4
5.0
62.7
Oth
er In
puts
Inse
ctici
des
6745
5663
6221
-16.
09.
812
0025
1529
7210
9.5
18.2
Irrig
ation
cha
rges
525
1152
587
119.
5-4
9.0
1850
4070
2792
120.
0-3
1.4
Crop
Insu
ranc
e -
00
--
-0
0-
-
Paym
ent t
o Co
ntra
ctor
-0
--
- -
0-
--
Inte
rest
on
wor
king
cap
ital
1229
1298
1419
5.6
9.3
816
907
1045
11.1
15.2
Misc
ella
neou
s12
712
228
-90.
618
11.0
1631
5095
.962
.1
Fixe
d Co
st38
685
3681
844
049
-4.8
19.6
2156
221
842
2421
21.
310
.9
(Con
td...
)
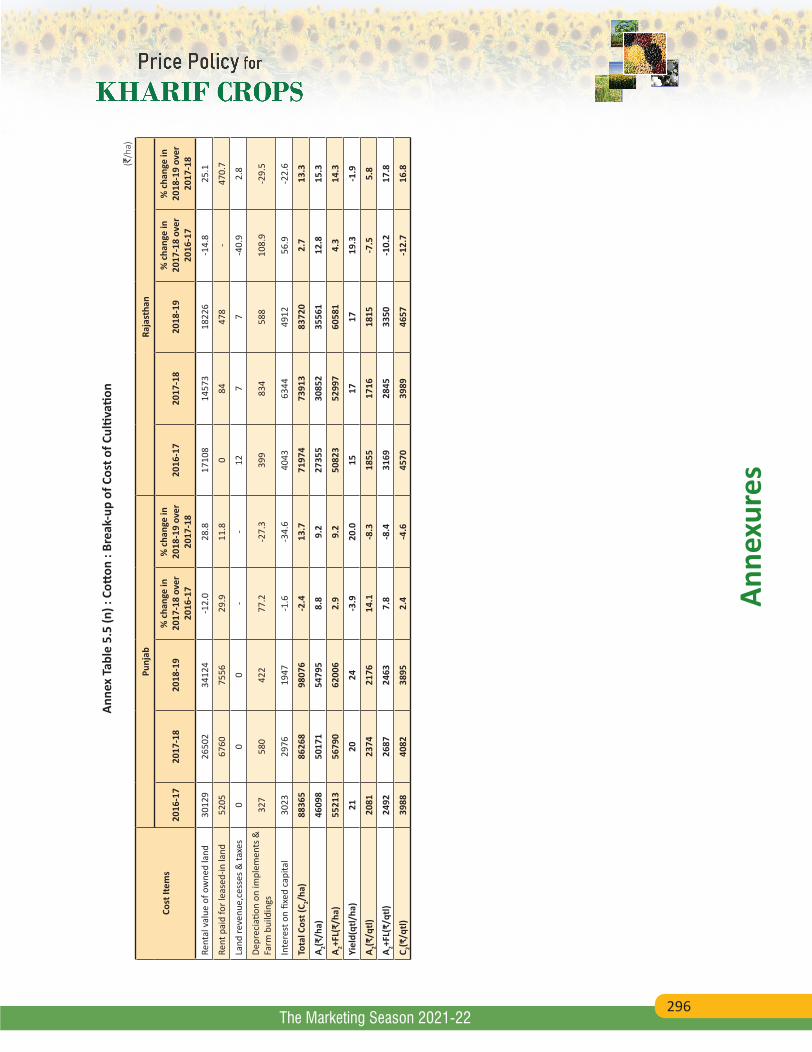
296
Anne
xure
s
The Marketing Season 2021-22
Anne
x Ta
ble
5.5
(n) :
Cott
on :
Brea
k-up
of C
ost o
f Cul
tivati
on (`
/ha)
Cost
Item
s
Punj
abRa
jast
han
2016
-17
2017
-18
2018
-19
% c
hang
e in
20
17-1
8 ov
er
2016
-17
% c
hang
e in
20
18-1
9 ov
er
2017
-18
2016
-17
2017
-18
2018
-19
% c
hang
e in
20
17-1
8 ov
er
2016
-17
% c
hang
e in
20
18-1
9 ov
er
2017
-18
Rent
al v
alue
of o
wne
d la
nd30
129
2650
234
124
-12.
028
.817
108
1457
318
226
-14.
825
.1
Rent
pai
d fo
r lea
sed-
in la
nd52
0567
6075
5629
.911
.80
8447
8-
470.
7
Land
reve
nue,
cess
es &
taxe
s0
00
--
127
7-4
0.9
2.8
Depr
ecia
tion
on im
plem
ents
&
Farm
bui
ldin
gs32
758
042
277
.2-2
7.3
399
834
588
108.
9-2
9.5
Inte
rest
on
fixed
cap
ital
3023
2976
1947
-1.6
-34.
640
4363
4449
1256
.9-2
2.6
Tota
l Cos
t (C 2/h
a)88
365
8626
898
076
-2.4
13.7
7197
473
913
8372
02.
713
.3
A 2(₹/h
a)46
098
5017
154
795
8.8
9.2
2735
530
852
3556
112
.815
.3
A 2+FL(
₹/ha
)55
213
5679
062
006
2.9
9.2
5082
352
997
6058
14.
314
.3
Yiel
d(qt
l/ha
)21
2024
-3.9
20.0
1517
1719
.3-1
.9
A 2(₹/q
tl)20
8123
7421
7614
.1-8
.318
5517
1618
15-7
.55.
8
A 2+FL(
₹/qt
l)24
9226
8724
637.
8-8
.431
6928
4533
50-1
0.2
17.8
C 2(₹/q
tl)39
8840
8238
952.
4-4
.645
7039
8946
57-1
2.7
16.8
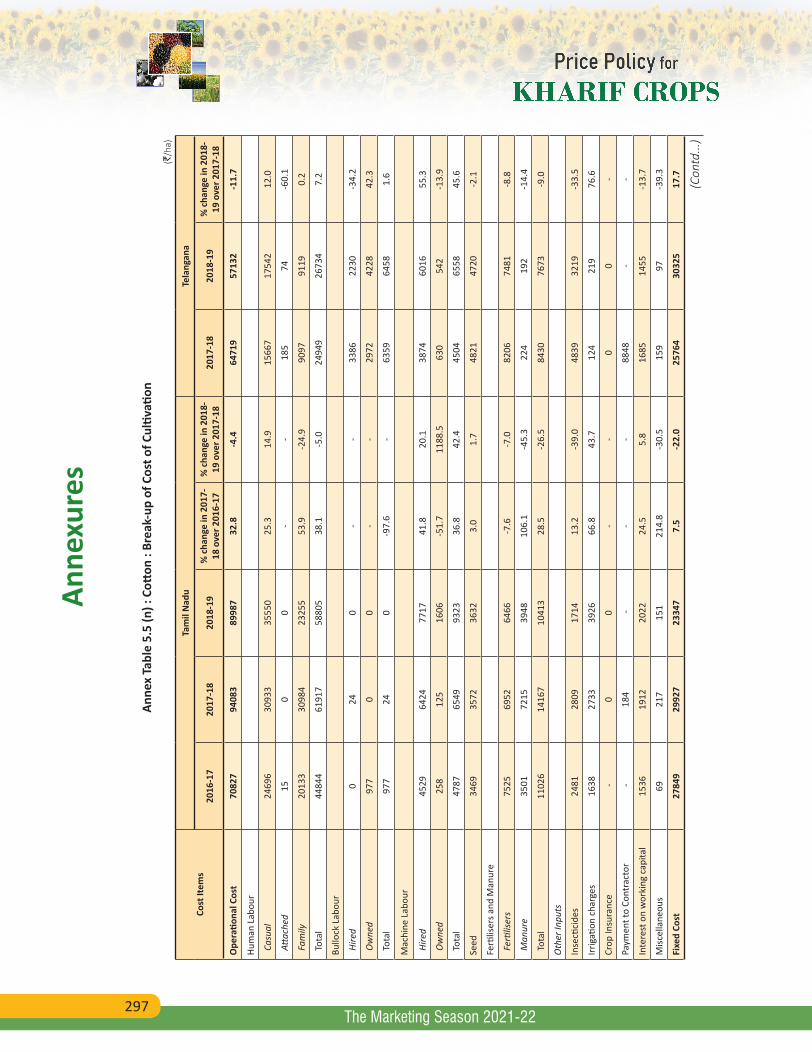
297
Anne
xure
s
The Marketing Season 2021-22
Anne
x Ta
ble
5.5
(n) :
Cott
on :
Brea
k-up
of C
ost o
f Cul
tivati
on (`
/ha)
Cost
Item
sTa
mil
Nad
uTe
lang
ana
2016
-17
2017
-18
2018
-19
% c
hang
e in
201
7-18
ove
r 201
6-17
% c
hang
e in
201
8-19
ove
r 201
7-18
2017
-18
2018
-19
% c
hang
e in
201
8-19
ove
r 201
7-18
Ope
ratio
nal C
ost
7082
794
083
8998
732
.8-4
.464
719
5713
2-1
1.7
Hum
an L
abou
r
Cas
ual
2469
630
933
3555
025
.314
.915
667
1754
212
.0
Atta
ched
150
0-
-18
574
-60.
1
Fam
ily20
133
3098
423
255
53.9
-24.
990
9791
190.
2
Tot
al44
844
6191
758
805
38.1
-5.0
2494
926
734
7.2
Bullo
ck L
abou
r
Hire
d0
240
--
3386
2230
-34.
2
Ow
ned
977
00
--
2972
4228
42.3
Tot
al97
724
0-9
7.6
-63
5964
581.
6
Mac
hine
Lab
our
Hire
d45
2964
2477
1741
.820
.138
7460
1655
.3
Ow
ned
258
125
1606
-51.
711
88.5
630
542
-13.
9
Tot
al47
8765
4993
2336
.842
.445
0465
5845
.6
Seed
3469
3572
3632
3.0
1.7
4821
4720
-2.1
Ferti
liser
s and
Man
ure
Fer
tilise
rs75
2569
5264
66-7
.6-7
.082
0674
81-8
.8
Man
ure
3501
7215
3948
106.
1-4
5.3
224
192
-14.
4
Tot
al11
026
1416
710
413
28.5
-26.
584
3076
73-9
.0
Oth
er In
puts
Inse
ctici
des
2481
2809
1714
13.2
-39.
048
3932
19-3
3.5
Irrig
ation
cha
rges
1638
2733
3926
66.8
43.7
124
219
76.6
Crop
Insu
ranc
e -
00
--
00
-
Paym
ent t
o Co
ntra
ctor
-18
4 -
--
8848
--
Inte
rest
on
wor
king
cap
ital
1536
1912
2022
24.5
5.8
1685
1455
-13.
7
Misc
ella
neou
s69
217
151
214.
8-3
0.5
159
97-3
9.3
Fixe
d Co
st27
849
2992
723
347
7.5
-22.
025
764
3032
517
.7
(Con
td...
)
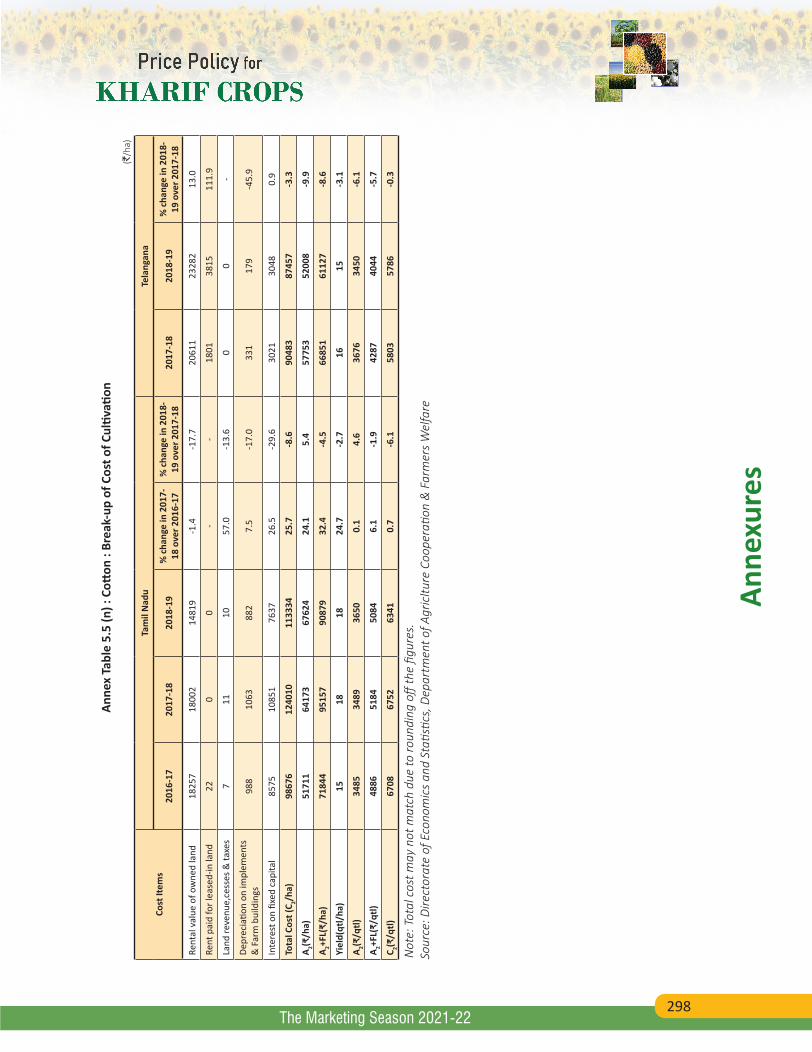
298
Anne
xure
s
The Marketing Season 2021-22
Anne
x Ta
ble
5.5
(n) :
Cott
on :
Brea
k-up
of C
ost o
f Cul
tivati
on (`
/ha)
Cost
Item
sTa
mil
Nad
uTe
lang
ana
2016
-17
2017
-18
2018
-19
% c
hang
e in
201
7-18
ove
r 201
6-17
% c
hang
e in
201
8-19
ove
r 201
7-18
2017
-18
2018
-19
% c
hang
e in
201
8-19
ove
r 201
7-18
Rent
al v
alue
of o
wne
d la
nd18
257
1800
214
819
-1.4
-17.
720
611
2328
213
.0
Rent
pai
d fo
r lea
sed-
in la
nd22
00
--
1801
3815
111.
9
Land
reve
nue,
cess
es &
taxe
s7
1110
57.0
-13.
60
0-
Depr
ecia
tion
on im
plem
ents
&
Far
m b
uild
ings
988
1063
882
7.5
-17.
033
117
9-4
5.9
Inte
rest
on
fixed
cap
ital
8575
1085
176
3726
.5-2
9.6
3021
3048
0.9
Tota
l Cos
t (C 2/h
a)98
676
1240
1011
3334
25.7
-8.6
9048
387
457
-3.3
A 2(₹/h
a)51
711
6417
367
624
24.1
5.4
5775
352
008
-9.9
A 2+FL(
₹/ha
)71
844
9515
790
879
32.4
-4.5
6685
161
127
-8.6
Yiel
d(qt
l/ha
)15
1818
24.7
-2.7
1615
-3.1
A 2(₹/q
tl)34
8534
8936
500.
14.
636
7634
50-6
.1
A 2+FL(
₹/qt
l)48
8651
8450
846.
1-1
.942
8740
44-5
.7
C 2(₹/q
tl)67
0867
5263
410.
7-6
.158
0357
86-0
.3
Not
e: T
otal
cos
t may
not
mat
ch d
ue to
roun
ding
off
the
figur
es.
Sour
ce: D
irect
orat
e of
Eco
nom
ics
and
Stati
stics
, Dep
artm
ent o
f Agr
icltu
re C
oope
ratio
n &
Far
mer
s W
elfa
re
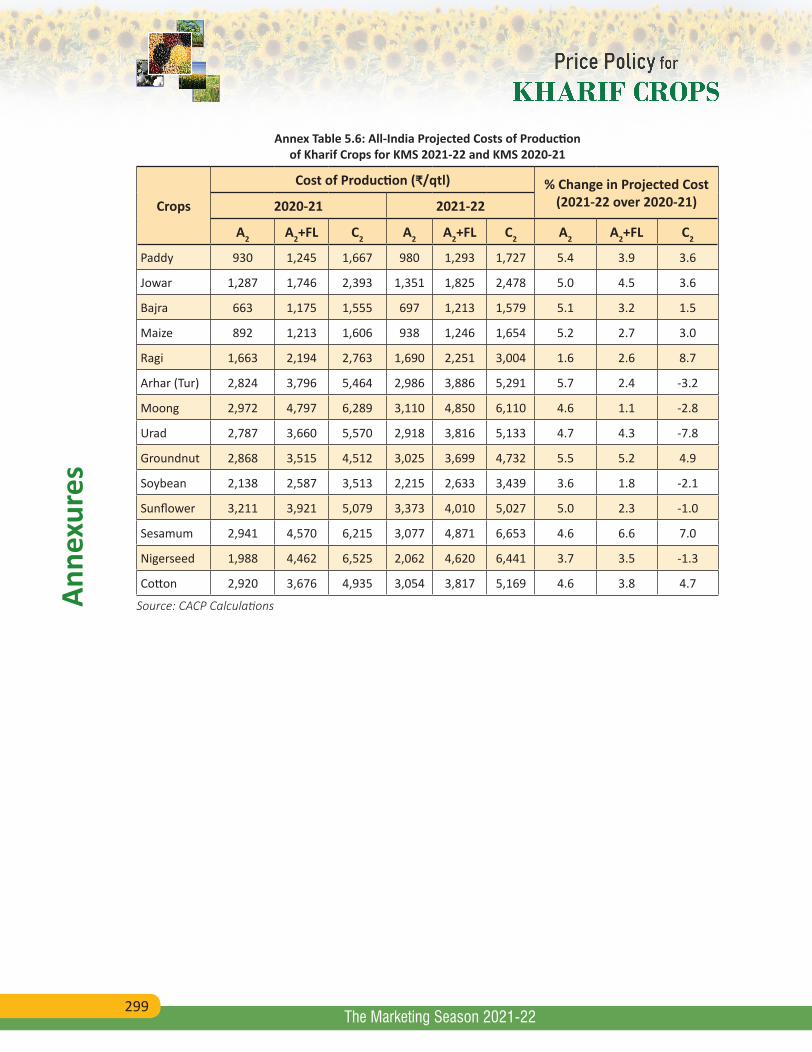
299
Anne
xure
s
The Marketing Season 2021-22
Annex Table 5.6: All-India Projected Costs of Production of Kharif Crops for KMS 2021-22 and KMS 2020-21
Crops
Cost of Production (₹/qtl) % Change in Projected Cost (2021-22 over 2020-21)2020-21 2021-22
A2 A2+FL C2 A2 A2+FL C2 A2 A2+FL C2
Paddy 930 1,245 1,667 980 1,293 1,727 5.4 3.9 3.6
Jowar 1,287 1,746 2,393 1,351 1,825 2,478 5.0 4.5 3.6
Bajra 663 1,175 1,555 697 1,213 1,579 5.1 3.2 1.5
Maize 892 1,213 1,606 938 1,246 1,654 5.2 2.7 3.0
Ragi 1,663 2,194 2,763 1,690 2,251 3,004 1.6 2.6 8.7
Arhar (Tur) 2,824 3,796 5,464 2,986 3,886 5,291 5.7 2.4 -3.2
Moong 2,972 4,797 6,289 3,110 4,850 6,110 4.6 1.1 -2.8
Urad 2,787 3,660 5,570 2,918 3,816 5,133 4.7 4.3 -7.8
Groundnut 2,868 3,515 4,512 3,025 3,699 4,732 5.5 5.2 4.9
Soybean 2,138 2,587 3,513 2,215 2,633 3,439 3.6 1.8 -2.1
Sunflower 3,211 3,921 5,079 3,373 4,010 5,027 5.0 2.3 -1.0
Sesamum 2,941 4,570 6,215 3,077 4,871 6,653 4.6 6.6 7.0
Nigerseed 1,988 4,462 6,525 2,062 4,620 6,441 3.7 3.5 -1.3
Cotton 2,920 3,676 4,935 3,054 3,817 5,169 4.6 3.8 4.7
Source: CACP Calculations
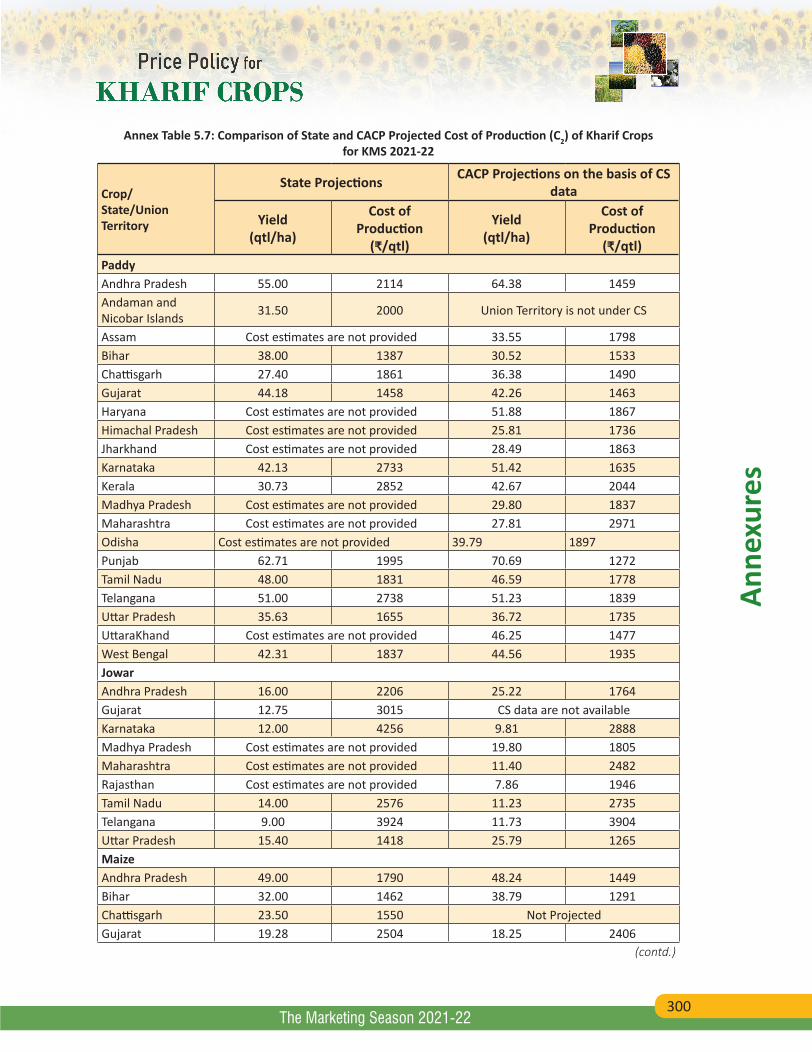
300
Anne
xure
s
The Marketing Season 2021-22
Annex Table 5.7: Comparison of State and CACP Projected Cost of Production (C2) of Kharif Crops for KMS 2021-22
Crop/ State/Union Territory
State Projections CACP Projections on the basis of CS data
Yield (qtl/ha)
Cost of Production
(₹/qtl)
Yield (qtl/ha)
Cost of Production
(₹/qtl)PaddyAndhra Pradesh 55.00 2114 64.38 1459Andaman and Nicobar Islands 31.50 2000 Union Territory is not under CS
Assam Cost estimates are not provided 33.55 1798Bihar 38.00 1387 30.52 1533Chattisgarh 27.40 1861 36.38 1490Gujarat 44.18 1458 42.26 1463Haryana Cost estimates are not provided 51.88 1867Himachal Pradesh Cost estimates are not provided 25.81 1736Jharkhand Cost estimates are not provided 28.49 1863Karnataka 42.13 2733 51.42 1635Kerala 30.73 2852 42.67 2044Madhya Pradesh Cost estimates are not provided 29.80 1837Maharashtra Cost estimates are not provided 27.81 2971Odisha Cost estimates are not provided 39.79 1897Punjab 62.71 1995 70.69 1272Tamil Nadu 48.00 1831 46.59 1778Telangana 51.00 2738 51.23 1839Uttar Pradesh 35.63 1655 36.72 1735UttaraKhand Cost estimates are not provided 46.25 1477West Bengal 42.31 1837 44.56 1935JowarAndhra Pradesh 16.00 2206 25.22 1764Gujarat 12.75 3015 CS data are not availableKarnataka 12.00 4256 9.81 2888Madhya Pradesh Cost estimates are not provided 19.80 1805Maharashtra Cost estimates are not provided 11.40 2482Rajasthan Cost estimates are not provided 7.86 1946Tamil Nadu 14.00 2576 11.23 2735Telangana 9.00 3924 11.73 3904Uttar Pradesh 15.40 1418 25.79 1265MaizeAndhra Pradesh 49.00 1790 48.24 1449Bihar 32.00 1462 38.79 1291Chattisgarh 23.50 1550 Not ProjectedGujarat 19.28 2504 18.25 2406
(contd.)
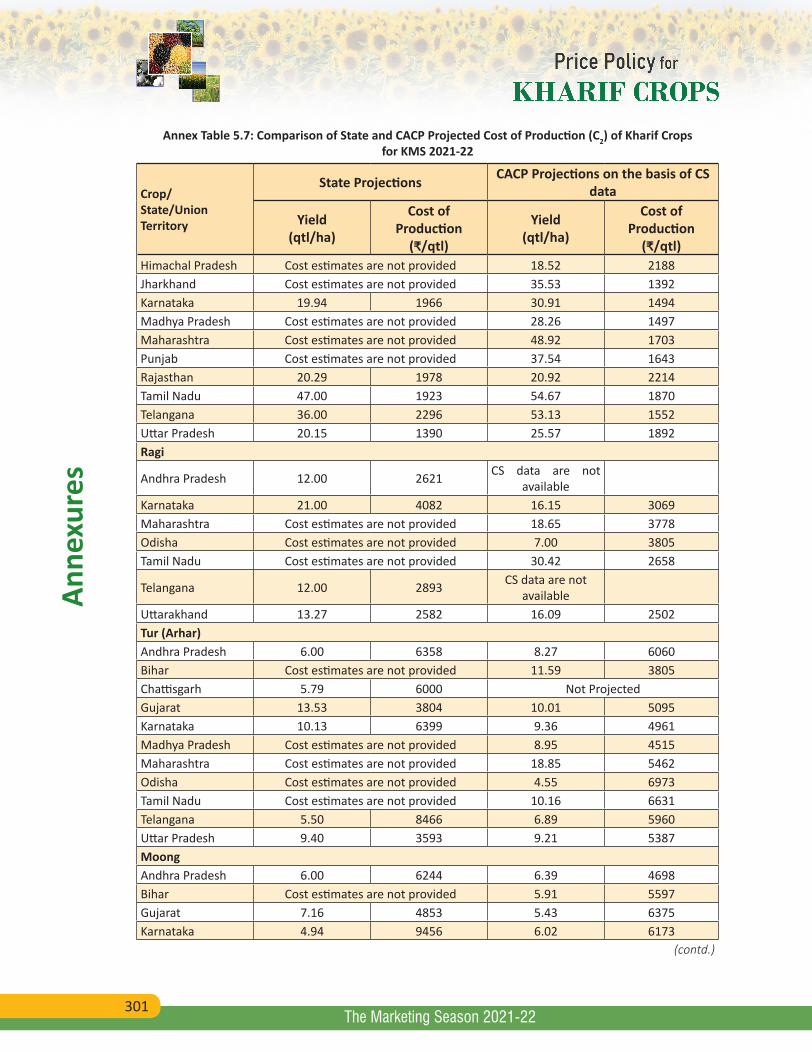
301
Anne
xure
s
The Marketing Season 2021-22
Annex Table 5.7: Comparison of State and CACP Projected Cost of Production (C2) of Kharif Crops for KMS 2021-22
Crop/ State/Union Territory
State Projections CACP Projections on the basis of CS data
Yield (qtl/ha)
Cost of Production
(₹/qtl)
Yield (qtl/ha)
Cost of Production
(₹/qtl)Himachal Pradesh Cost estimates are not provided 18.52 2188Jharkhand Cost estimates are not provided 35.53 1392Karnataka 19.94 1966 30.91 1494Madhya Pradesh Cost estimates are not provided 28.26 1497Maharashtra Cost estimates are not provided 48.92 1703Punjab Cost estimates are not provided 37.54 1643Rajasthan 20.29 1978 20.92 2214Tamil Nadu 47.00 1923 54.67 1870Telangana 36.00 2296 53.13 1552Uttar Pradesh 20.15 1390 25.57 1892Ragi
Andhra Pradesh 12.00 2621 CS data are not available
Karnataka 21.00 4082 16.15 3069Maharashtra Cost estimates are not provided 18.65 3778Odisha Cost estimates are not provided 7.00 3805Tamil Nadu Cost estimates are not provided 30.42 2658
Telangana 12.00 2893 CS data are not available
Uttarakhand 13.27 2582 16.09 2502Tur (Arhar)Andhra Pradesh 6.00 6358 8.27 6060Bihar Cost estimates are not provided 11.59 3805Chattisgarh 5.79 6000 Not ProjectedGujarat 13.53 3804 10.01 5095Karnataka 10.13 6399 9.36 4961Madhya Pradesh Cost estimates are not provided 8.95 4515Maharashtra Cost estimates are not provided 18.85 5462Odisha Cost estimates are not provided 4.55 6973Tamil Nadu Cost estimates are not provided 10.16 6631Telangana 5.50 8466 6.89 5960Uttar Pradesh 9.40 3593 9.21 5387MoongAndhra Pradesh 6.00 6244 6.39 4698Bihar Cost estimates are not provided 5.91 5597Gujarat 7.16 4853 5.43 6375Karnataka 4.94 9456 6.02 6173
(contd.)
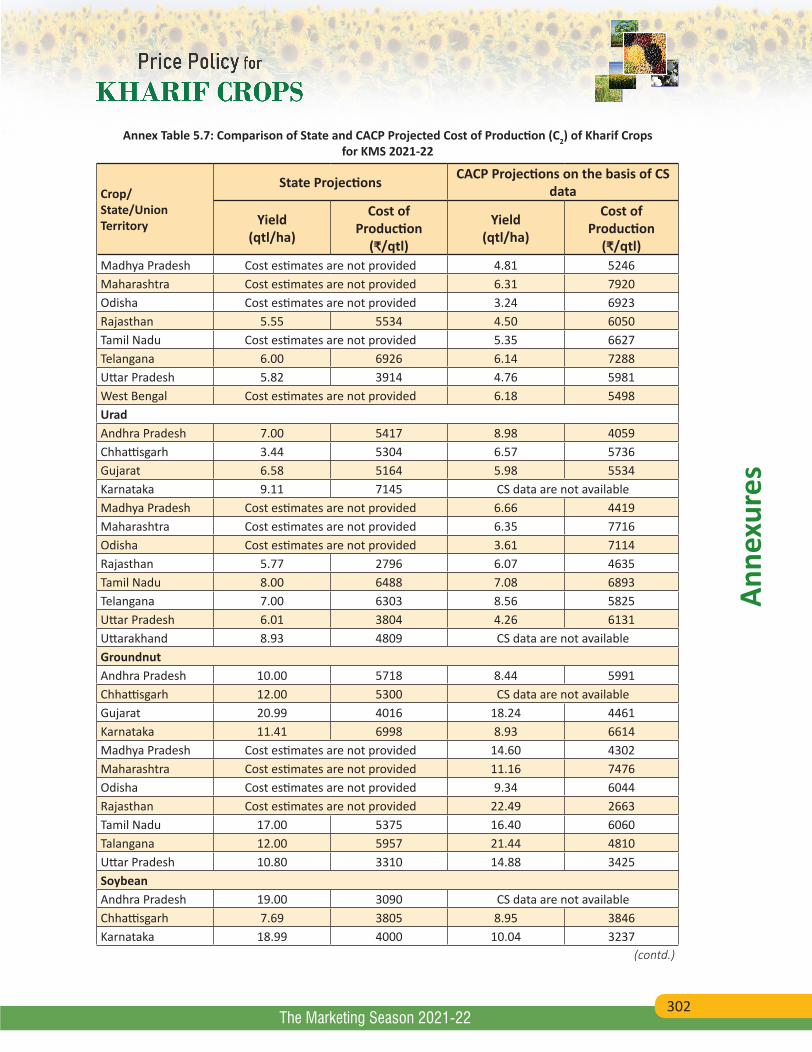
302
Anne
xure
s
The Marketing Season 2021-22
Annex Table 5.7: Comparison of State and CACP Projected Cost of Production (C2) of Kharif Crops for KMS 2021-22
Crop/ State/Union Territory
State Projections CACP Projections on the basis of CS data
Yield (qtl/ha)
Cost of Production
(₹/qtl)
Yield (qtl/ha)
Cost of Production
(₹/qtl)Madhya Pradesh Cost estimates are not provided 4.81 5246Maharashtra Cost estimates are not provided 6.31 7920Odisha Cost estimates are not provided 3.24 6923Rajasthan 5.55 5534 4.50 6050Tamil Nadu Cost estimates are not provided 5.35 6627Telangana 6.00 6926 6.14 7288Uttar Pradesh 5.82 3914 4.76 5981West Bengal Cost estimates are not provided 6.18 5498UradAndhra Pradesh 7.00 5417 8.98 4059Chhattisgarh 3.44 5304 6.57 5736Gujarat 6.58 5164 5.98 5534Karnataka 9.11 7145 CS data are not availableMadhya Pradesh Cost estimates are not provided 6.66 4419Maharashtra Cost estimates are not provided 6.35 7716Odisha Cost estimates are not provided 3.61 7114Rajasthan 5.77 2796 6.07 4635Tamil Nadu 8.00 6488 7.08 6893Telangana 7.00 6303 8.56 5825Uttar Pradesh 6.01 3804 4.26 6131Uttarakhand 8.93 4809 CS data are not availableGroundnutAndhra Pradesh 10.00 5718 8.44 5991Chhattisgarh 12.00 5300 CS data are not availableGujarat 20.99 4016 18.24 4461Karnataka 11.41 6998 8.93 6614Madhya Pradesh Cost estimates are not provided 14.60 4302Maharashtra Cost estimates are not provided 11.16 7476Odisha Cost estimates are not provided 9.34 6044Rajasthan Cost estimates are not provided 22.49 2663Tamil Nadu 17.00 5375 16.40 6060Talangana 12.00 5957 21.44 4810Uttar Pradesh 10.80 3310 14.88 3425SoybeanAndhra Pradesh 19.00 3090 CS data are not availableChhattisgarh 7.69 3805 8.95 3846Karnataka 18.99 4000 10.04 3237
(contd.)
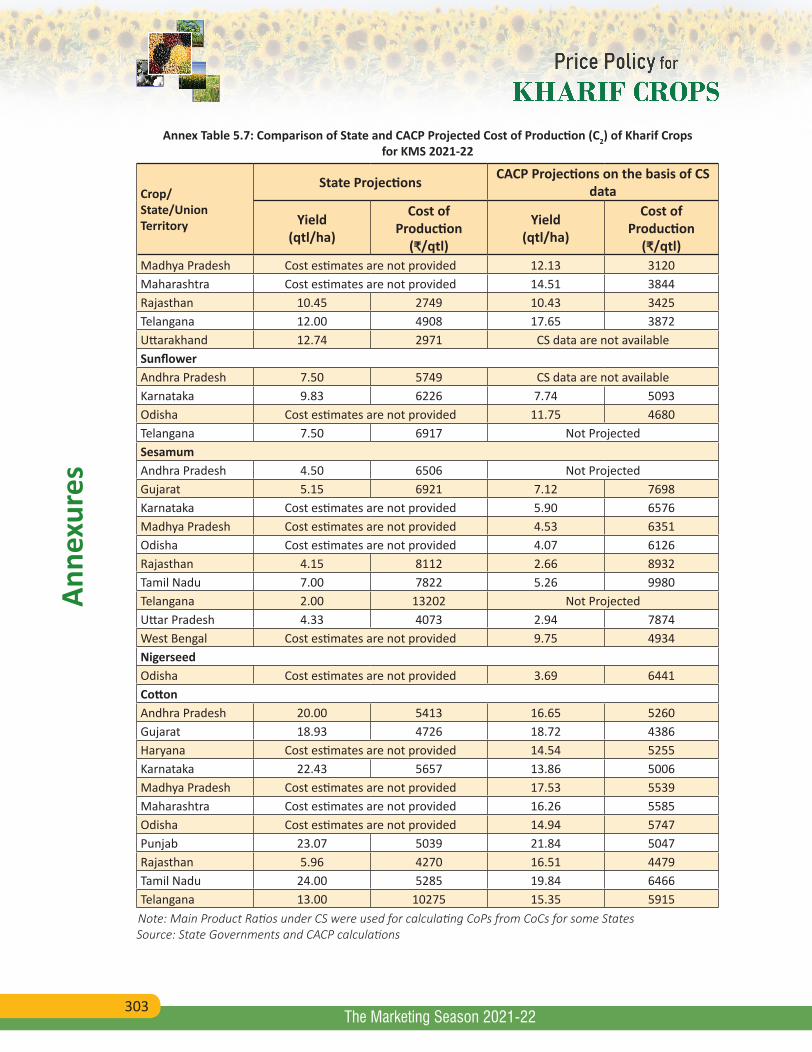
303
Anne
xure
s
The Marketing Season 2021-22
Annex Table 5.7: Comparison of State and CACP Projected Cost of Production (C2) of Kharif Crops for KMS 2021-22
Crop/ State/Union Territory
State Projections CACP Projections on the basis of CS data
Yield (qtl/ha)
Cost of Production
(₹/qtl)
Yield (qtl/ha)
Cost of Production
(₹/qtl)Madhya Pradesh Cost estimates are not provided 12.13 3120Maharashtra Cost estimates are not provided 14.51 3844Rajasthan 10.45 2749 10.43 3425Telangana 12.00 4908 17.65 3872Uttarakhand 12.74 2971 CS data are not availableSunflowerAndhra Pradesh 7.50 5749 CS data are not availableKarnataka 9.83 6226 7.74 5093Odisha Cost estimates are not provided 11.75 4680Telangana 7.50 6917 Not ProjectedSesamumAndhra Pradesh 4.50 6506 Not ProjectedGujarat 5.15 6921 7.12 7698Karnataka Cost estimates are not provided 5.90 6576Madhya Pradesh Cost estimates are not provided 4.53 6351Odisha Cost estimates are not provided 4.07 6126Rajasthan 4.15 8112 2.66 8932Tamil Nadu 7.00 7822 5.26 9980Telangana 2.00 13202 Not ProjectedUttar Pradesh 4.33 4073 2.94 7874West Bengal Cost estimates are not provided 9.75 4934NigerseedOdisha Cost estimates are not provided 3.69 6441CottonAndhra Pradesh 20.00 5413 16.65 5260Gujarat 18.93 4726 18.72 4386Haryana Cost estimates are not provided 14.54 5255Karnataka 22.43 5657 13.86 5006Madhya Pradesh Cost estimates are not provided 17.53 5539Maharashtra Cost estimates are not provided 16.26 5585Odisha Cost estimates are not provided 14.94 5747Punjab 23.07 5039 21.84 5047Rajasthan 5.96 4270 16.51 4479Tamil Nadu 24.00 5285 19.84 6466Telangana 13.00 10275 15.35 5915Note: Main Product Ratios under CS were used for calculating CoPs from CoCs for some StatesSource: State Governments and CACP calculations
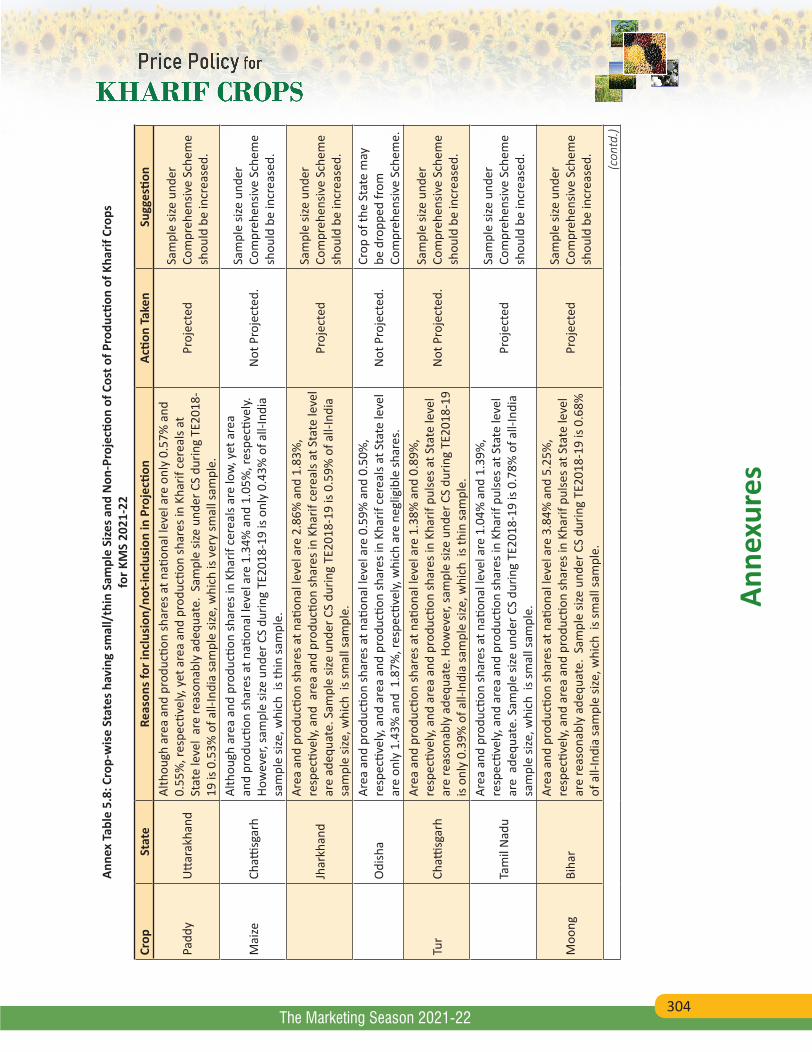
304
Anne
xure
s
The Marketing Season 2021-22
Anne
x Ta
ble
5.8:
Cro
p-w
ise
Stat
es h
avin
g sm
all/
thin
Sam
ple
Size
s and
Non
-Pro
jecti
on o
f Cos
t of P
rodu
ction
of K
harif
Cro
ps
for K
MS
2021
-22
Crop
Stat
eRe
ason
s for
incl
usio
n/no
t-inc
lusi
on in
Pro
jecti
onAc
tion
Take
nSu
gges
tion
Padd
yU
ttara
khan
d
Alth
ough
are
a an
d pr
oduc
tion
shar
es a
t nati
onal
leve
l are
onl
y 0.
57%
and
0.
55%
, res
pecti
vely,
yet
are
a an
d pr
oduc
tion
shar
es in
Kha
rif c
erea
ls at
St
ate
leve
l ar
e re
ason
ably
ade
quat
e. S
ampl
e siz
e un
der C
S du
ring
TE20
18-
19 is
0.5
3% o
f all-
Indi
a sa
mpl
e siz
e, w
hich
is v
ery
smal
l sam
ple.
Proj
ecte
dSa
mpl
e siz
e un
der
Com
preh
ensiv
e Sc
hem
e sh
ould
be
incr
ease
d.
Mai
zeCh
attisg
arh
Alth
ough
are
a an
d pr
oduc
tion
shar
es in
Kha
rif c
erea
ls ar
e lo
w, y
et a
rea
and
prod
uctio
n sh
ares
at n
ation
al le
vel a
re 1
.34%
and
1.0
5%, r
espe
ctive
ly.
How
ever
, sam
ple
size
unde
r CS
durin
g TE
2018
-19
is on
ly 0
.43%
of a
ll-In
dia
sam
ple
size,
whi
ch i
s thi
n sa
mpl
e.
Not
Pro
ject
ed.
Sam
ple
size
unde
r Co
mpr
ehen
sive
Sche
me
shou
ld b
e in
crea
sed.
Jhar
khan
d
Area
and
pro
ducti
on sh
ares
at n
ation
al le
vel a
re 2
.86%
and
1.8
3%,
resp
ectiv
ely,
and
are
a an
d pr
oduc
tion
shar
es in
Kha
rif c
erea
ls at
Sta
te le
vel
are
adeq
uate
. Sam
ple
size
unde
r CS
durin
g TE
2018
-19
is 0.
59%
of a
ll-In
dia
sam
ple
size,
whi
ch i
s sm
all s
ampl
e.
Proj
ecte
dSa
mpl
e siz
e un
der
Com
preh
ensiv
e Sc
hem
e sh
ould
be
incr
ease
d.
Odi
sha
Area
and
pro
ducti
on sh
ares
at n
ation
al le
vel a
re 0
.59%
and
0.5
0%,
resp
ectiv
ely,
and
area
and
pro
ducti
on sh
ares
in K
harif
cer
eals
at S
tate
leve
l ar
e on
ly 1
.43%
and
1.8
7%, r
espe
ctive
ly, w
hich
are
neg
ligib
le sh
ares
. N
ot P
roje
cted
.Cr
op o
f the
Sta
te m
ay
be d
ropp
ed fr
om
Com
preh
ensiv
e Sc
hem
e.
Tur
Chatti
sgar
h
Area
and
pro
ducti
on sh
ares
at n
ation
al le
vel a
re 1
.38%
and
0.8
9%,
resp
ectiv
ely,
and
area
and
pro
ducti
on sh
ares
in K
harif
pul
ses a
t Sta
te le
vel
are
reas
onab
ly a
dequ
ate.
How
ever
, sam
ple
size
unde
r CS
durin
g TE
2018
-19
is on
ly 0
.39%
of a
ll-In
dia
sam
ple
size,
whi
ch i
s thi
n sa
mpl
e.
Not
Pro
ject
ed.
Sam
ple
size
unde
r Co
mpr
ehen
sive
Sche
me
shou
ld b
e in
crea
sed.
Tam
il N
adu
Area
and
pro
ducti
on sh
ares
at n
ation
al le
vel a
re 1
.04%
and
1.3
9%,
resp
ectiv
ely,
and
area
and
pro
ducti
on sh
ares
in K
harif
pul
ses a
t Sta
te le
vel
are
ade
quat
e. S
ampl
e siz
e un
der C
S du
ring
TE20
18-1
9 is
0.78
% o
f all-
Indi
a sa
mpl
e siz
e, w
hich
is s
mal
l sam
ple.
Proj
ecte
dSa
mpl
e siz
e un
der
Com
preh
ensiv
e Sc
hem
e sh
ould
be
incr
ease
d.
Moo
ngBi
har
Area
and
pro
ducti
on sh
ares
at n
ation
al le
vel a
re 3
.84%
and
5.2
5%,
resp
ectiv
ely,
and
area
and
pro
ducti
on sh
ares
in K
harif
pul
ses a
t Sta
te le
vel
are
reas
onab
ly a
dequ
ate.
Sam
ple
size
unde
r CS
durin
g TE
2018
-19
is 0.
68%
of
all-
Indi
a sa
mpl
e siz
e, w
hich
is s
mal
l sam
ple.
Proj
ecte
dSa
mpl
e siz
e un
der
Com
preh
ensiv
e Sc
hem
e sh
ould
be
incr
ease
d. (con
td.)
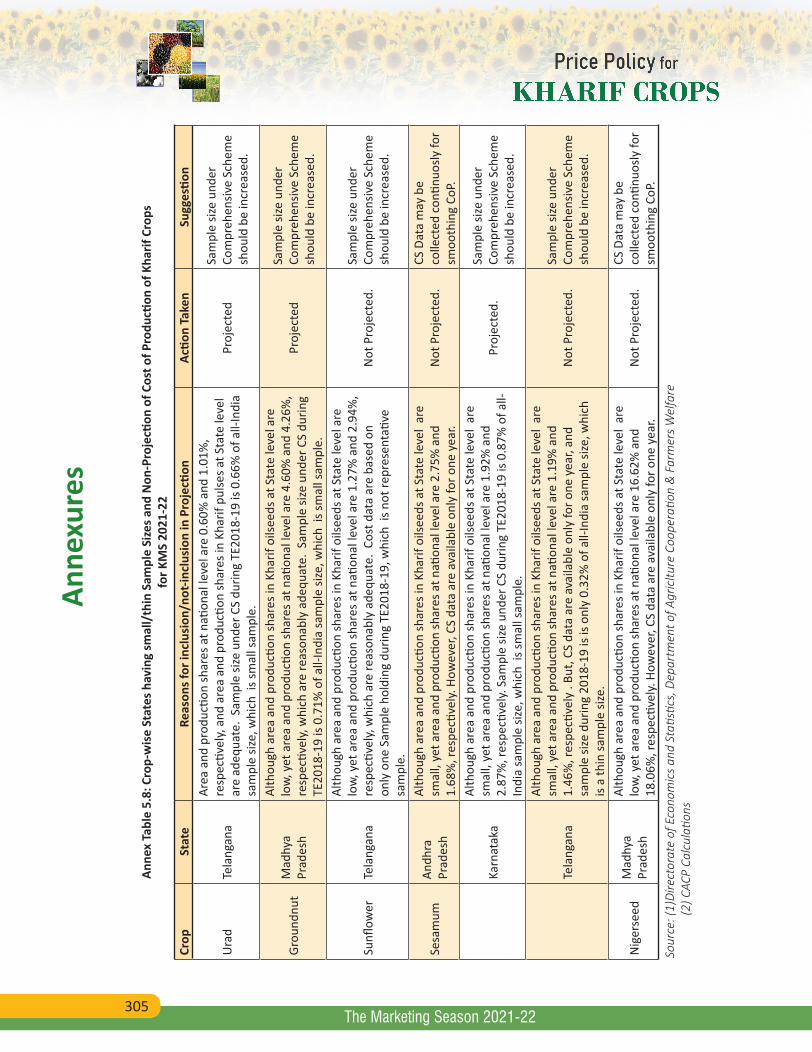
305
Anne
xure
s
The Marketing Season 2021-22
Anne
x Ta
ble
5.8:
Cro
p-w
ise
Stat
es h
avin
g sm
all/
thin
Sam
ple
Size
s and
Non
-Pro
jecti
on o
f Cos
t of P
rodu
ction
of K
harif
Cro
ps
for K
MS
2021
-22
Crop
Stat
eRe
ason
s for
incl
usio
n/no
t-inc
lusi
on in
Pro
jecti
onAc
tion
Take
nSu
gges
tion
Ura
dTe
lang
ana
Area
and
pro
ducti
on sh
ares
at n
ation
al le
vel a
re 0
.60%
and
1.0
1%,
resp
ectiv
ely,
and
area
and
pro
ducti
on sh
ares
in K
harif
pul
ses a
t Sta
te le
vel
are
adeq
uate
. Sa
mpl
e siz
e un
der C
S du
ring
TE20
18-1
9 is
0.66
% o
f all-
Indi
a sa
mpl
e siz
e, w
hich
is s
mal
l sam
ple.
Proj
ecte
dSa
mpl
e siz
e un
der
Com
preh
ensiv
e Sc
hem
e sh
ould
be
incr
ease
d.
Grou
ndnu
tM
adhy
a Pr
ades
h
Alth
ough
are
a an
d pr
oduc
tion
shar
es in
Kha
rif o
ilsee
ds a
t Sta
te le
vel a
re
low,
yet
are
a an
d pr
oduc
tion
shar
es a
t nati
onal
leve
l are
4.6
0% a
nd 4
.26%
, re
spec
tivel
y, w
hich
are
reas
onab
ly a
dequ
ate.
Sam
ple
size
unde
r CS
durin
g TE
2018
-19
is 0.
71%
of a
ll-In
dia
sam
ple
size,
whi
ch i
s sm
all s
ampl
e.
Proj
ecte
dSa
mpl
e siz
e un
der
Com
preh
ensiv
e Sc
hem
e sh
ould
be
incr
ease
d.
Sunfl
ower
Tela
ngan
a
Alth
ough
are
a an
d pr
oduc
tion
shar
es in
Kha
rif o
ilsee
ds a
t Sta
te le
vel a
re
low,
yet
are
a an
d pr
oduc
tion
shar
es a
t nati
onal
leve
l are
1.2
7% a
nd 2
.94%
, re
spec
tivel
y, w
hich
are
reas
onab
ly a
dequ
ate.
Cos
t dat
a ar
e ba
sed
on
only
one
Sam
ple
hold
ing
durin
g TE
2018
-19,
whi
ch i
s not
repr
esen
tativ
e sa
mpl
e.
Not
Pro
ject
ed.
Sam
ple
size
unde
r Co
mpr
ehen
sive
Sche
me
shou
ld b
e in
crea
sed.
Sesa
mum
Andh
ra
Prad
esh
Alth
ough
are
a an
d pr
oduc
tion
shar
es in
Kha
rif o
ilsee
ds a
t Sta
te le
vel
are
smal
l, ye
t are
a an
d pr
oduc
tion
shar
es a
t nati
onal
leve
l are
2.7
5% a
nd
1.68
%, r
espe
ctive
ly. H
owev
er, C
S da
ta a
re a
vaila
ble
only
for o
ne y
ear.
Not
Pro
ject
ed.
CS D
ata
may
be
colle
cted
con
tinuo
sly fo
r sm
ooth
ing
CoP.
Karn
atak
a
Alth
ough
are
a an
d pr
oduc
tion
shar
es in
Kha
rif o
ilsee
ds a
t Sta
te le
vel
are
smal
l, ye
t are
a an
d pr
oduc
tion
shar
es a
t nati
onal
leve
l are
1.9
2% a
nd
2.87
%, r
espe
ctive
ly. S
ampl
e siz
e un
der C
S du
ring
TE20
18-1
9 is
0.87
% o
f all-
Indi
a sa
mpl
e siz
e, w
hich
is s
mal
l sam
ple.
Proj
ecte
d.Sa
mpl
e siz
e un
der
Com
preh
ensiv
e Sc
hem
e sh
ould
be
incr
ease
d.
Tela
ngan
a
Alth
ough
are
a an
d pr
oduc
tion
shar
es in
Kha
rif o
ilsee
ds a
t Sta
te le
vel
are
smal
l, ye
t are
a an
d pr
oduc
tion
shar
es a
t nati
onal
leve
l are
1.1
9% a
nd
1.46
%, r
espe
ctive
ly .
But,
CS d
ata
are
avai
labl
e on
ly fo
r one
yea
r, an
d sa
mpl
e siz
e du
ring
2018
-19
is is
only
0.3
2% o
f all-
Indi
a sa
mpl
e siz
e, w
hich
is
a th
in sa
mpl
e siz
e.
Not
Pro
ject
ed.
Sam
ple
size
unde
r Co
mpr
ehen
sive
Sche
me
shou
ld b
e in
crea
sed.
Nig
erse
edM
adhy
a Pr
ades
h
Alth
ough
are
a an
d pr
oduc
tion
shar
es in
Kha
rif o
ilsee
ds a
t Sta
te le
vel
are
low,
yet
are
a an
d pr
oduc
tion
shar
es a
t nati
onal
leve
l are
16.
62%
and
18
.06%
, res
pecti
vely.
How
ever
, CS
data
are
ava
ilabl
e on
ly fo
r one
yea
r. N
ot P
roje
cted
.CS
Dat
a m
ay b
e co
llect
ed c
ontin
uosly
for
smoo
thin
g Co
P.
Sour
ce: (
1)Di
rect
orat
e of
Eco
nom
ics
and
Stati
stics
, Dep
artm
ent o
f Agr
icltu
re C
oope
ratio
n &
Far
mer
s W
elfa
re
(2) C
ACP
Calc
ulati
ons
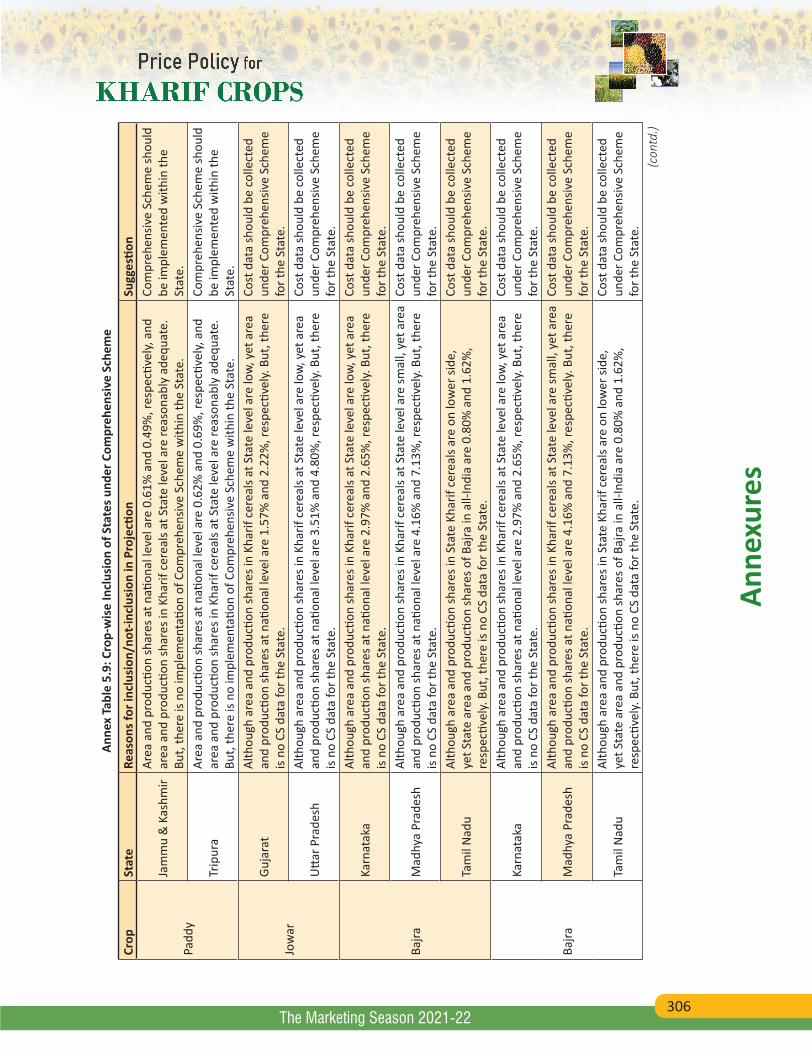
306
Anne
xure
s
The Marketing Season 2021-22
Anne
x Ta
ble
5.9:
Cro
p-w
ise
Incl
usio
n of
Sta
tes u
nder
Com
preh
ensi
ve S
chem
e
Crop
Stat
eRe
ason
s for
incl
usio
n/no
t-inc
lusi
on in
Pro
jecti
onSu
gges
tion
Padd
y
Jam
mu
& K
ashm
ir
Area
and
pro
ducti
on sh
ares
at n
ation
al le
vel a
re 0
.61%
and
0.4
9%, r
espe
ctive
ly, a
nd
area
and
pro
ducti
on sh
ares
in K
harif
cer
eals
at S
tate
leve
l are
reas
onab
ly a
dequ
ate.
Bu
t, th
ere
is no
impl
emen
tatio
n of
Com
preh
ensiv
e Sc
hem
e w
ithin
the
Stat
e.
Com
preh
ensiv
e Sc
hem
e sh
ould
be
impl
emen
ted
with
in th
e St
ate.
Trip
ura
Ar
ea a
nd p
rodu
ction
shar
es a
t nati
onal
leve
l are
0.6
2% a
nd 0
.69%
, res
pecti
vely,
and
ar
ea a
nd p
rodu
ction
shar
es in
Kha
rif c
erea
ls at
Sta
te le
vel a
re re
ason
ably
ade
quat
e.
But,
ther
e is
no im
plem
enta
tion
of C
ompr
ehen
sive
Sche
me
with
in th
e St
ate.
Com
preh
ensiv
e Sc
hem
e sh
ould
be
impl
emen
ted
with
in th
e St
ate.
Jow
ar
Guja
rat
Alth
ough
are
a an
d pr
oduc
tion
shar
es in
Kha
rif c
erea
ls at
Sta
te le
vel a
re lo
w, y
et a
rea
and
prod
uctio
n sh
ares
at n
ation
al le
vel a
re 1
.57%
and
2.2
2%, r
espe
ctive
ly. B
ut, t
here
is
no C
S da
ta fo
r the
Sta
te.
Cost
dat
a sh
ould
be
colle
cted
un
der C
ompr
ehen
sive
Sche
me
for t
he S
tate
.
Utta
r Pra
desh
Alth
ough
are
a an
d pr
oduc
tion
shar
es in
Kha
rif c
erea
ls at
Sta
te le
vel a
re lo
w, y
et a
rea
and
prod
uctio
n sh
ares
at n
ation
al le
vel a
re 3
.51%
and
4.8
0%, r
espe
ctive
ly. B
ut, t
here
is
no C
S da
ta fo
r the
Sta
te.
Cost
dat
a sh
ould
be
colle
cted
un
der C
ompr
ehen
sive
Sche
me
for t
he S
tate
.
Bajra
Karn
atak
aAl
thou
gh a
rea
and
prod
uctio
n sh
ares
in K
harif
cer
eals
at S
tate
leve
l are
low,
yet
are
a an
d pr
oduc
tion
shar
es a
t nati
onal
leve
l are
2.9
7% a
nd 2
.65%
, res
pecti
vely.
But
, the
re
is no
CS
data
for t
he S
tate
.
Cost
dat
a sh
ould
be
colle
cted
un
der C
ompr
ehen
sive
Sche
me
for t
he S
tate
.
Mad
hya
Prad
esh
Alth
ough
are
a an
d pr
oduc
tion
shar
es in
Kha
rif c
erea
ls at
Sta
te le
vel a
re sm
all,
yet a
rea
and
prod
uctio
n sh
ares
at n
ation
al le
vel a
re 4
.16%
and
7.1
3%, r
espe
ctive
ly. B
ut, t
here
is
no C
S da
ta fo
r the
Sta
te.
Cost
dat
a sh
ould
be
colle
cted
un
der C
ompr
ehen
sive
Sche
me
for t
he S
tate
.
Tam
il N
adu
Alth
ough
are
a an
d pr
oduc
tion
shar
es in
Sta
te K
harif
cer
eals
are
on lo
wer
side
, ye
t Sta
te a
rea
and
prod
uctio
n sh
ares
of B
ajra
in a
ll-In
dia
are
0.80
% a
nd 1
.62%
, re
spec
tivel
y. B
ut, t
here
is n
o CS
dat
a fo
r the
Sta
te.
Cost
dat
a sh
ould
be
colle
cted
un
der C
ompr
ehen
sive
Sche
me
for t
he S
tate
.
Bajra
Karn
atak
aAl
thou
gh a
rea
and
prod
uctio
n sh
ares
in K
harif
cer
eals
at S
tate
leve
l are
low,
yet
are
a an
d pr
oduc
tion
shar
es a
t nati
onal
leve
l are
2.9
7% a
nd 2
.65%
, res
pecti
vely.
But
, the
re
is no
CS
data
for t
he S
tate
.
Cost
dat
a sh
ould
be
colle
cted
un
der C
ompr
ehen
sive
Sche
me
for t
he S
tate
.
Mad
hya
Prad
esh
Alth
ough
are
a an
d pr
oduc
tion
shar
es in
Kha
rif c
erea
ls at
Sta
te le
vel a
re sm
all,
yet a
rea
and
prod
uctio
n sh
ares
at n
ation
al le
vel a
re 4
.16%
and
7.1
3%, r
espe
ctive
ly. B
ut, t
here
is
no C
S da
ta fo
r the
Sta
te.
Cost
dat
a sh
ould
be
colle
cted
un
der C
ompr
ehen
sive
Sche
me
for t
he S
tate
.
Tam
il N
adu
Alth
ough
are
a an
d pr
oduc
tion
shar
es in
Sta
te K
harif
cer
eals
are
on lo
wer
side
, ye
t Sta
te a
rea
and
prod
uctio
n sh
ares
of B
ajra
in a
ll-In
dia
are
0.80
% a
nd 1
.62%
, re
spec
tivel
y. B
ut, t
here
is n
o CS
dat
a fo
r the
Sta
te.
Cost
dat
a sh
ould
be
colle
cted
un
der C
ompr
ehen
sive
Sche
me
for t
he S
tate
.(c
ontd
.)
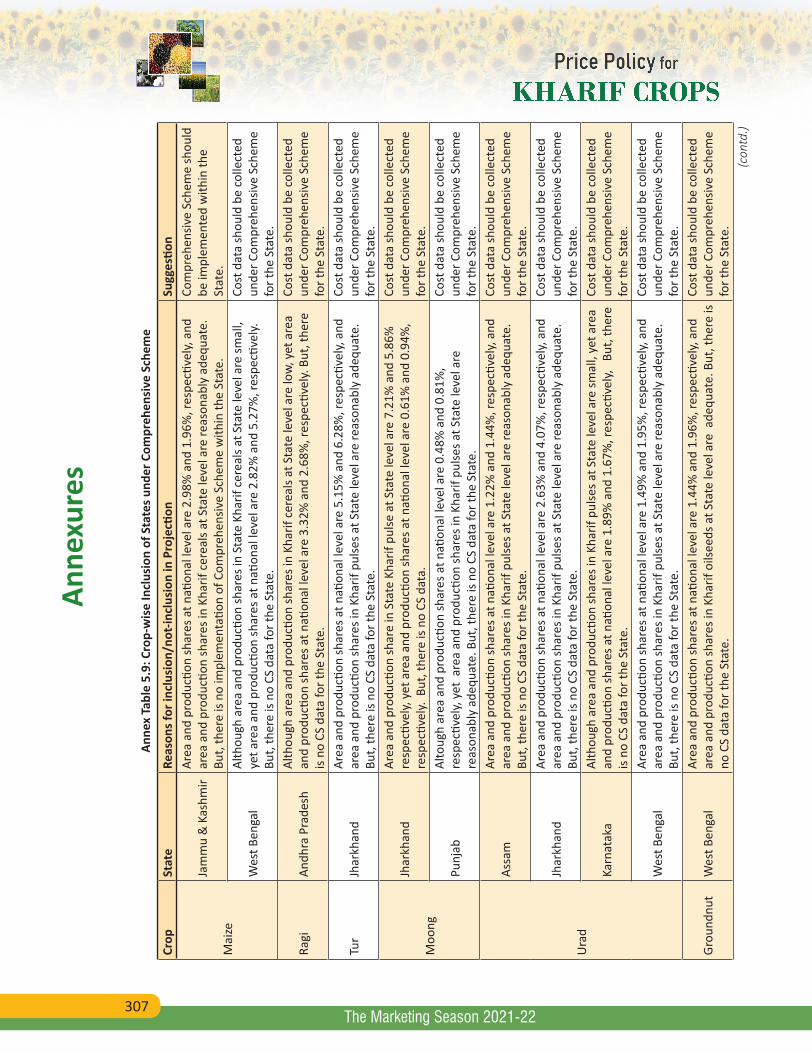
307
Anne
xure
s
The Marketing Season 2021-22
Anne
x Ta
ble
5.9:
Cro
p-w
ise
Incl
usio
n of
Sta
tes u
nder
Com
preh
ensi
ve S
chem
e
Crop
Stat
eRe
ason
s for
incl
usio
n/no
t-inc
lusi
on in
Pro
jecti
onSu
gges
tion
Mai
ze
Jam
mu
& K
ashm
irAr
ea a
nd p
rodu
ction
shar
es a
t nati
onal
leve
l are
2.9
8% a
nd 1
.96%
, res
pecti
vely,
and
ar
ea a
nd p
rodu
ction
shar
es in
Kha
rif c
erea
ls at
Sta
te le
vel a
re re
ason
ably
ade
quat
e.
But,
ther
e is
no im
plem
enta
tion
of C
ompr
ehen
sive
Sche
me
with
in th
e St
ate.
Com
preh
ensiv
e Sc
hem
e sh
ould
be
impl
emen
ted
with
in th
e St
ate.
Wes
t Ben
gal
Alth
ough
are
a an
d pr
oduc
tion
shar
es in
Sta
te K
harif
cer
eals
at S
tate
leve
l are
smal
l, ye
t are
a an
d pr
oduc
tion
shar
es a
t nati
onal
leve
l are
2.8
2% a
nd 5
.27%
, res
pecti
vely.
Bu
t, th
ere
is no
CS
data
for t
he S
tate
.
Cost
dat
a sh
ould
be
colle
cted
un
der C
ompr
ehen
sive
Sche
me
for t
he S
tate
.
Ragi
Andh
ra P
rade
shAl
thou
gh a
rea
and
prod
uctio
n sh
ares
in K
harif
cer
eals
at S
tate
leve
l are
low,
yet
are
a an
d pr
oduc
tion
shar
es a
t nati
onal
leve
l are
3.3
2% a
nd 2
.68%
, res
pecti
vely.
But
, the
re
is no
CS
data
for t
he S
tate
.
Cost
dat
a sh
ould
be
colle
cted
un
der C
ompr
ehen
sive
Sche
me
for t
he S
tate
.
Tur
Jhar
khan
d
Area
and
pro
ducti
on sh
ares
at n
ation
al le
vel a
re 5
.15%
and
6.2
8%, r
espe
ctive
ly, a
nd
area
and
pro
ducti
on sh
ares
in K
harif
pul
ses a
t Sta
te le
vel a
re re
ason
ably
ade
quat
e.
But,
ther
e is
no C
S da
ta fo
r the
Sta
te.
Cost
dat
a sh
ould
be
colle
cted
un
der C
ompr
ehen
sive
Sche
me
for t
he S
tate
.
Moo
ng
Jhar
khan
d
Area
and
pro
ducti
on sh
are
in S
tate
Kha
rif p
ulse
at S
tate
leve
l are
7.2
1% a
nd 5
.86%
re
spec
tivel
y, ye
t are
a an
d pr
oduc
tion
shar
es a
t nati
onal
leve
l are
0.6
1% a
nd 0
.94%
, re
spec
tivel
y. B
ut, t
here
is n
o CS
dat
a.
Cost
dat
a sh
ould
be
colle
cted
un
der C
ompr
ehen
sive
Sche
me
for t
he S
tate
.
Punj
abAl
toug
h ar
ea a
nd p
rodu
ction
shar
es a
t nati
onal
leve
l are
0.4
8% a
nd 0
.81%
, re
spec
tivel
y, ye
t ar
ea a
nd p
rodu
ction
shar
es in
Kha
rif p
ulse
s at S
tate
leve
l are
re
ason
ably
ade
quat
e. B
ut, t
here
is n
o CS
dat
a fo
r the
Sta
te.
Cost
dat
a sh
ould
be
colle
cted
un
der C
ompr
ehen
sive
Sche
me
for t
he S
tate
.
Ura
d
Assa
mAr
ea a
nd p
rodu
ction
shar
es a
t nati
onal
leve
l are
1.2
2% a
nd 1
.44%
, res
pecti
vely,
and
ar
ea a
nd p
rodu
ction
shar
es in
Kha
rif p
ulse
s at S
tate
leve
l are
reas
onab
ly a
dequ
ate.
Bu
t, th
ere
is no
CS
data
for t
he S
tate
.
Cost
dat
a sh
ould
be
colle
cted
un
der C
ompr
ehen
sive
Sche
me
for t
he S
tate
.
Jhar
khan
d
Area
and
pro
ducti
on sh
ares
at n
ation
al le
vel a
re 2
.63%
and
4.0
7%, r
espe
ctive
ly, a
nd
area
and
pro
ducti
on sh
ares
in K
harif
pul
ses a
t Sta
te le
vel a
re re
ason
ably
ade
quat
e.
But,
ther
e is
no C
S da
ta fo
r the
Sta
te.
Cost
dat
a sh
ould
be
colle
cted
un
der C
ompr
ehen
sive
Sche
me
for t
he S
tate
.
Karn
atak
aAl
thou
gh a
rea
and
prod
uctio
n sh
ares
in K
harif
pul
ses a
t Sta
te le
vel a
re sm
all,
yet a
rea
and
prod
uctio
n sh
ares
at n
ation
al le
vel a
re 1
.89%
and
1.6
7%, r
espe
ctive
ly,
But,
ther
e is
no C
S da
ta fo
r the
Sta
te.
Cost
dat
a sh
ould
be
colle
cted
un
der C
ompr
ehen
sive
Sche
me
for t
he S
tate
.
Wes
t Ben
gal
Area
and
pro
ducti
on sh
ares
at n
ation
al le
vel a
re 1
.49%
and
1.9
5%, r
espe
ctive
ly, a
nd
area
and
pro
ducti
on sh
ares
in K
harif
pul
ses a
t Sta
te le
vel a
re re
ason
ably
ade
quat
e.
But,
ther
e is
no C
S da
ta fo
r the
Sta
te.
Cost
dat
a sh
ould
be
colle
cted
un
der C
ompr
ehen
sive
Sche
me
for t
he S
tate
.
Grou
ndnu
tW
est B
enga
lAr
ea a
nd p
rodu
ction
shar
es a
t nati
onal
leve
l are
1.4
4% a
nd 1
.96%
, res
pecti
vely,
and
ar
ea a
nd p
rodu
ction
shar
es in
Kha
rif o
ilsee
ds a
t Sta
te le
vel a
re a
dequ
ate.
But
, the
re is
no
CS
data
for t
he S
tate
.
Cost
dat
a sh
ould
be
colle
cted
un
der C
ompr
ehen
sive
Sche
me
for t
he S
tate
.(c
ontd
.)
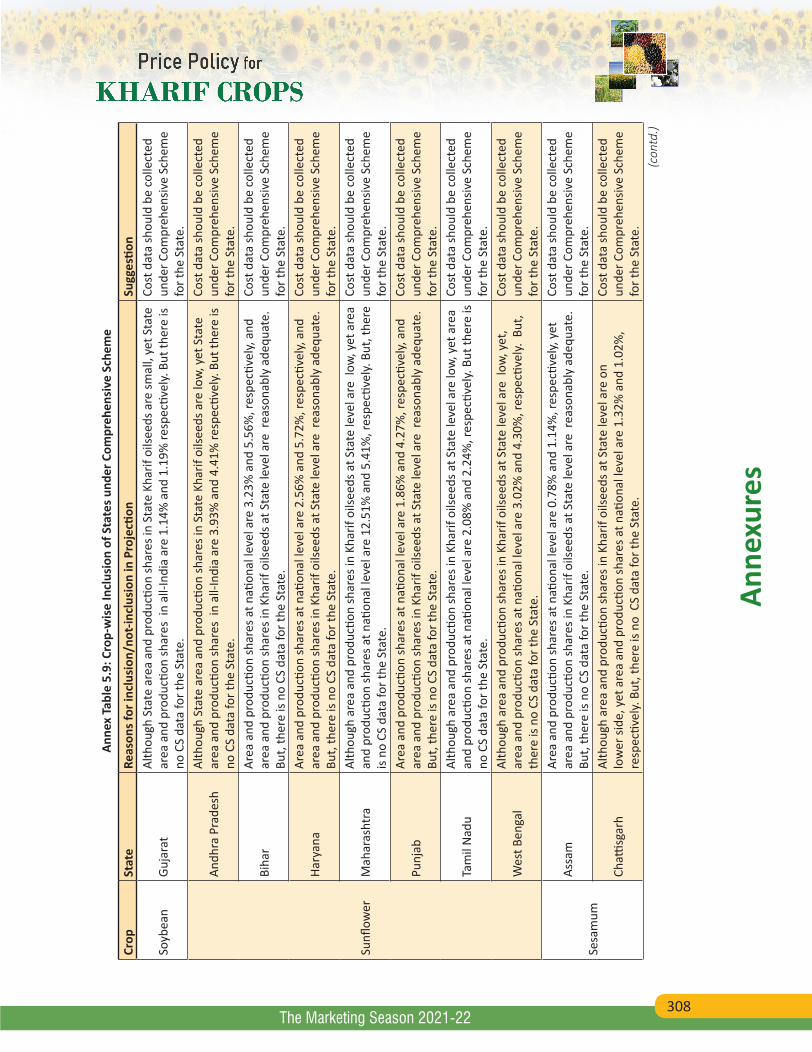
308
Anne
xure
s
The Marketing Season 2021-22
Anne
x Ta
ble
5.9:
Cro
p-w
ise
Incl
usio
n of
Sta
tes u
nder
Com
preh
ensi
ve S
chem
e
Crop
Stat
eRe
ason
s for
incl
usio
n/no
t-inc
lusi
on in
Pro
jecti
onSu
gges
tion
Soyb
ean
Guja
rat
Alth
ough
Sta
te a
rea
and
prod
uctio
n sh
ares
in S
tate
Kha
rif o
ilsee
ds a
re sm
all,
yet S
tate
ar
ea a
nd p
rodu
ction
shar
es i
n al
l-Ind
ia a
re 1
.14%
and
1.1
9% re
spec
tivel
y. B
ut th
ere
is no
CS
data
for t
he S
tate
.
Cost
dat
a sh
ould
be
colle
cted
un
der C
ompr
ehen
sive
Sche
me
for t
he S
tate
.
Sunfl
ower
Andh
ra P
rade
shAl
thou
gh S
tate
are
a an
d pr
oduc
tion
shar
es in
Sta
te K
harif
oils
eeds
are
low,
yet
Sta
te
area
and
pro
ducti
on sh
ares
in
all-I
ndia
are
3.9
3% a
nd 4
.41%
resp
ectiv
ely.
But
ther
e is
no C
S da
ta fo
r the
Sta
te.
Cost
dat
a sh
ould
be
colle
cted
un
der C
ompr
ehen
sive
Sche
me
for t
he S
tate
.
Biha
r
Ar
ea a
nd p
rodu
ction
shar
es a
t nati
onal
leve
l are
3.2
3% a
nd 5
.56%
, res
pecti
vely,
and
ar
ea a
nd p
rodu
ction
shar
es in
Kha
rif o
ilsee
ds a
t Sta
te le
vel a
re r
easo
nabl
y ad
equa
te.
But,
ther
e is
no C
S da
ta fo
r the
Sta
te.
Cost
dat
a sh
ould
be
colle
cted
un
der C
ompr
ehen
sive
Sche
me
for t
he S
tate
.
Hary
ana
Area
and
pro
ducti
on sh
ares
at n
ation
al le
vel a
re 2
.56%
and
5.7
2%, r
espe
ctive
ly, a
nd
area
and
pro
ducti
on sh
ares
in K
harif
oils
eeds
at S
tate
leve
l are
rea
sona
bly
adeq
uate
. Bu
t, th
ere
is no
CS
data
for t
he S
tate
.
Cost
dat
a sh
ould
be
colle
cted
un
der C
ompr
ehen
sive
Sche
me
for t
he S
tate
.
Mah
aras
htra
Alth
ough
are
a an
d pr
oduc
tion
shar
es in
Kha
rif o
ilsee
ds a
t Sta
te le
vel a
re l
ow, y
et a
rea
and
prod
uctio
n sh
ares
at n
ation
al le
vel a
re 1
2.51
% a
nd 5
.41%
, res
pecti
vely.
But
, the
re
is no
CS
data
for t
he S
tate
.
Cost
dat
a sh
ould
be
colle
cted
un
der C
ompr
ehen
sive
Sche
me
for t
he S
tate
.
Punj
ab
Area
and
pro
ducti
on sh
ares
at n
ation
al le
vel a
re 1
.86%
and
4.2
7%, r
espe
ctive
ly, a
nd
area
and
pro
ducti
on sh
ares
in K
harif
oils
eeds
at S
tate
leve
l are
rea
sona
bly
adeq
uate
. Bu
t, th
ere
is no
CS
data
for t
he S
tate
.
Cost
dat
a sh
ould
be
colle
cted
un
der C
ompr
ehen
sive
Sche
me
for t
he S
tate
.
Tam
il N
adu
Alth
ough
are
a an
d pr
oduc
tion
shar
es in
Kha
rif o
ilsee
ds a
t Sta
te le
vel a
re lo
w, y
et a
rea
and
prod
uctio
n sh
ares
at n
ation
al le
vel a
re 2
.08%
and
2.2
4%, r
espe
ctive
ly. B
ut th
ere
is no
CS
data
for t
he S
tate
.
Cost
dat
a sh
ould
be
colle
cted
un
der C
ompr
ehen
sive
Sche
me
for t
he S
tate
.
Wes
t Ben
gal
Alth
ough
are
a an
d pr
oduc
tion
shar
es in
Kha
rif o
ilsee
ds a
t Sta
te le
vel a
re l
ow, y
et,
area
and
pro
ducti
on sh
ares
at n
ation
al le
vel a
re 3
.02%
and
4.3
0%, r
espe
ctive
ly. B
ut,
ther
e is
no C
S da
ta fo
r the
Sta
te.
Cost
dat
a sh
ould
be
colle
cted
un
der C
ompr
ehen
sive
Sche
me
for t
he S
tate
.
Sesa
mum
Assa
mAr
ea a
nd p
rodu
ction
shar
es a
t nati
onal
leve
l are
0.7
8% a
nd 1
.14%
, res
pecti
vely,
yet
ar
ea a
nd p
rodu
ction
shar
es in
Kha
rif o
ilsee
ds a
t Sta
te le
vel a
re r
easo
nabl
y ad
equa
te.
But,
ther
e is
no C
S da
ta fo
r the
Sta
te.
Cost
dat
a sh
ould
be
colle
cted
un
der C
ompr
ehen
sive
Sche
me
for t
he S
tate
.
Chatti
sgar
hAl
thou
gh a
rea
and
prod
uctio
n sh
ares
in K
harif
oils
eeds
at S
tate
leve
l are
on
low
er si
de, y
et a
rea
and
prod
uctio
n sh
ares
at n
ation
al le
vel a
re 1
.32%
and
1.0
2%,
resp
ectiv
ely.
But
, the
re is
no
CS
data
for t
he S
tate
.
Cost
dat
a sh
ould
be
colle
cted
un
der C
ompr
ehen
sive
Sche
me
for t
he S
tate
.(c
ontd
.)
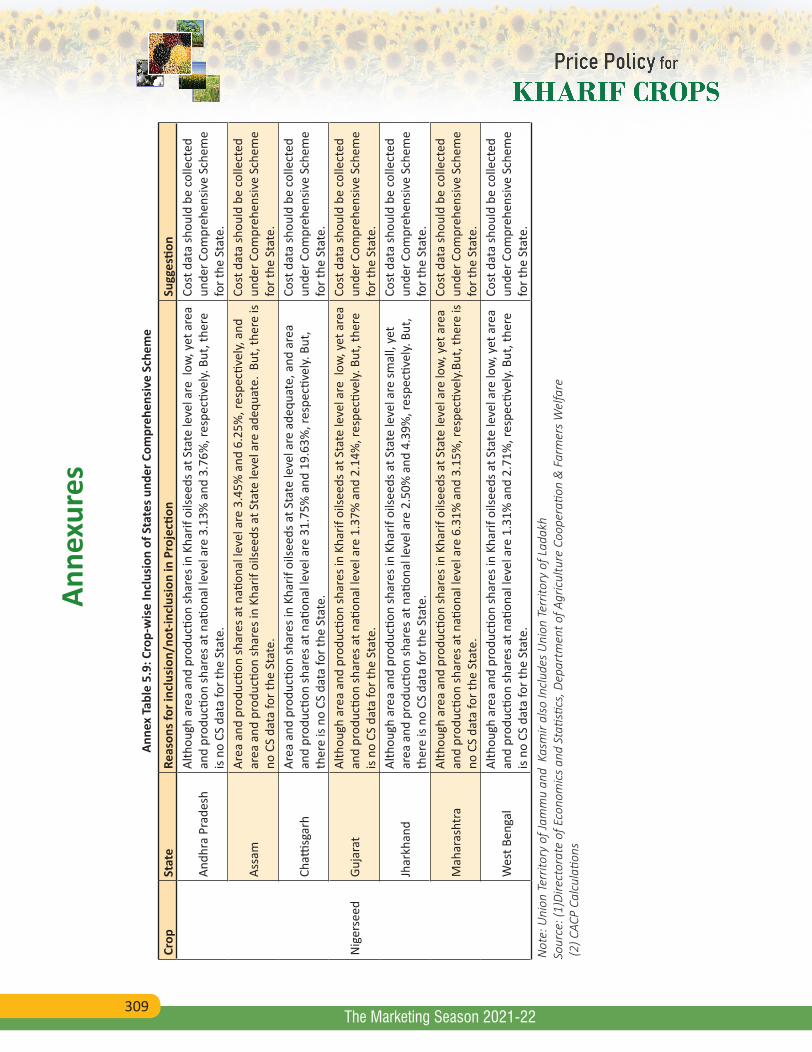
309
Anne
xure
s
The Marketing Season 2021-22
Anne
x Ta
ble
5.9:
Cro
p-w
ise
Incl
usio
n of
Sta
tes u
nder
Com
preh
ensi
ve S
chem
e
Crop
Stat
eRe
ason
s for
incl
usio
n/no
t-inc
lusi
on in
Pro
jecti
onSu
gges
tion
Nig
erse
ed
Andh
ra P
rade
shAl
thou
gh a
rea
and
prod
uctio
n sh
ares
in K
harif
oils
eeds
at S
tate
leve
l are
low
, yet
are
a an
d pr
oduc
tion
shar
es a
t nati
onal
leve
l are
3.1
3% a
nd 3
.76%
, res
pecti
vely.
But
, the
re
is no
CS
data
for t
he S
tate
.
Cost
dat
a sh
ould
be
colle
cted
un
der C
ompr
ehen
sive
Sche
me
for t
he S
tate
.
Assa
mAr
ea a
nd p
rodu
ction
shar
es a
t nati
onal
leve
l are
3.4
5% a
nd 6
.25%
, res
pecti
vely,
and
ar
ea a
nd p
rodu
ction
shar
es in
Kha
rif o
ilsee
ds a
t Sta
te le
vel a
re a
dequ
ate.
But
, the
re is
no
CS
data
for t
he S
tate
.
Cost
dat
a sh
ould
be
colle
cted
un
der C
ompr
ehen
sive
Sche
me
for t
he S
tate
.
Chatti
sgar
hAr
ea a
nd p
rodu
ction
shar
es in
Kha
rif o
ilsee
ds a
t Sta
te le
vel a
re a
dequ
ate,
and
are
a an
d pr
oduc
tion
shar
es a
t nati
onal
leve
l are
31.
75%
and
19.
63%
, res
pecti
vely.
But
, th
ere
is no
CS
data
for t
he S
tate
.
Cost
dat
a sh
ould
be
colle
cted
un
der C
ompr
ehen
sive
Sche
me
for t
he S
tate
.
Guja
rat
Alth
ough
are
a an
d pr
oduc
tion
shar
es in
Kha
rif o
ilsee
ds a
t Sta
te le
vel a
re l
ow, y
et a
rea
and
prod
uctio
n sh
ares
at n
ation
al le
vel a
re 1
.37%
and
2.1
4%, r
espe
ctive
ly. B
ut, t
here
is
no C
S da
ta fo
r the
Sta
te.
Cost
dat
a sh
ould
be
colle
cted
un
der C
ompr
ehen
sive
Sche
me
for t
he S
tate
.
Jhar
khan
d
Alth
ough
are
a an
d pr
oduc
tion
shar
es in
Kha
rif o
ilsee
ds a
t Sta
te le
vel a
re sm
all,
yet
area
and
pro
ducti
on sh
ares
at n
ation
al le
vel a
re 2
.50%
and
4.3
9%, r
espe
ctive
ly. B
ut,
ther
e is
no C
S da
ta fo
r the
Sta
te.
Cost
dat
a sh
ould
be
colle
cted
un
der C
ompr
ehen
sive
Sche
me
for t
he S
tate
.
Mah
aras
htra
Alth
ough
are
a an
d pr
oduc
tion
shar
es in
Kha
rif o
ilsee
ds a
t Sta
te le
vel a
re lo
w, y
et a
rea
and
prod
uctio
n sh
ares
at n
ation
al le
vel a
re 6
.31%
and
3.1
5%, r
espe
ctive
ly.Bu
t, th
ere
is no
CS
data
for t
he S
tate
.
Cost
dat
a sh
ould
be
colle
cted
un
der C
ompr
ehen
sive
Sche
me
for t
he S
tate
.
Wes
t Ben
gal
Alth
ough
are
a an
d pr
oduc
tion
shar
es in
Kha
rif o
ilsee
ds a
t Sta
te le
vel a
re lo
w, y
et a
rea
and
prod
uctio
n sh
ares
at n
ation
al le
vel a
re 1
.31%
and
2.7
1%, r
espe
ctive
ly. B
ut, t
here
is
no C
S da
ta fo
r the
Sta
te.
Cost
dat
a sh
ould
be
colle
cted
un
der C
ompr
ehen
sive
Sche
me
for t
he S
tate
.N
ote:
Uni
on T
errit
ory
of Ja
mm
u an
d K
asm
ir al
so In
clud
es U
nion
Ter
ritor
y of
Lad
akh
Sour
ce: (
1)Di
rect
orat
e of
Eco
nom
ics
and
Stati
stics
, Dep
artm
ent o
f Agr
icul
ture
Coo
pera
tion
& F
arm
ers
Wel
fare
(2) C
ACP
Calc
ulati
ons
310
Anne
xure
s
The Marketing Season 2021-22
311
Anne
xure
s
The Marketing Season 2021-22

312
Anne
xure
s
The Marketing Season 2021-22