Mean and Variance Dynamics Between Agricultural Commodity Prices, Crude Oil Prices and Exchange Rates Ardian Harri Mississippi State University Darren Hudson Texas Tech University

Welcome message from author
This document is posted to help you gain knowledge. Please leave a comment to let me know what you think about it! Share it to your friends and learn new things together.
Transcript
Mean and Variance Dynamics Between Agricultural Commodity Prices, Crude Oil Prices and Exchange Rates
Ardian HarriMississippi State UniversityDarren HudsonTexas Tech University
Research Question
• Energy impacts commodity production– Increased use of chemical and petroleum
derived inputs in agriculture– Increased use of agricultural commodities in
energy production – Recent developments in energy policy have
fundamentally changed the relationship between agricultural commodity prices and energy commodities
Research Question
• Investigate whether casual relationships exist between means and variances of agricultural commodity prices, crude oil prices and exchange rates
• Investigate whether these casual relationships change over time
Importance of Research
• Study on variance causation to understand how information is transmitted across prices and markets
• Changes in variance reflect the arrival of information and the extent to which market evaluates and assimilates new information
• It is of interest to both academics and practitioners
Previous work
• Campiche et al. (2007)
– Covariability between crude oil prices and corn, sorghum, sugar, soybeans, soybean oil, and palm oil prices
– Corn and soybeans prices are cointegrated with crude oil price during the 2006-2007 period but not during the 2003-2005 period
– Crude oil prices do not adjust to changes in the corn and soybean market
Previous work
• Harri, Nalley and Hudson (2009)
– Price relationship between primary agricultural commodities, exchange rates, and crude oil prices
– Cointegrating relation between corn, soybeans cotton prices and crude oil prices starts April 2006
– Exchange rates play a role in the linkage of prices– Crude oil prices Granger-cause corn prices– Corn prices do not Granger-cause crude oil prices
Data and Methods
• Daily data April 2003-March 2009• Futures prices for corn and crude oil obtained
from Commodity Research Bureau• Exchange rate data obtained from Federal
Reserve Economic Data database• Based on previous research divide the sample in
two subperiods:– April 2003-March 2006– April 2006-March 2009
Data and Methods
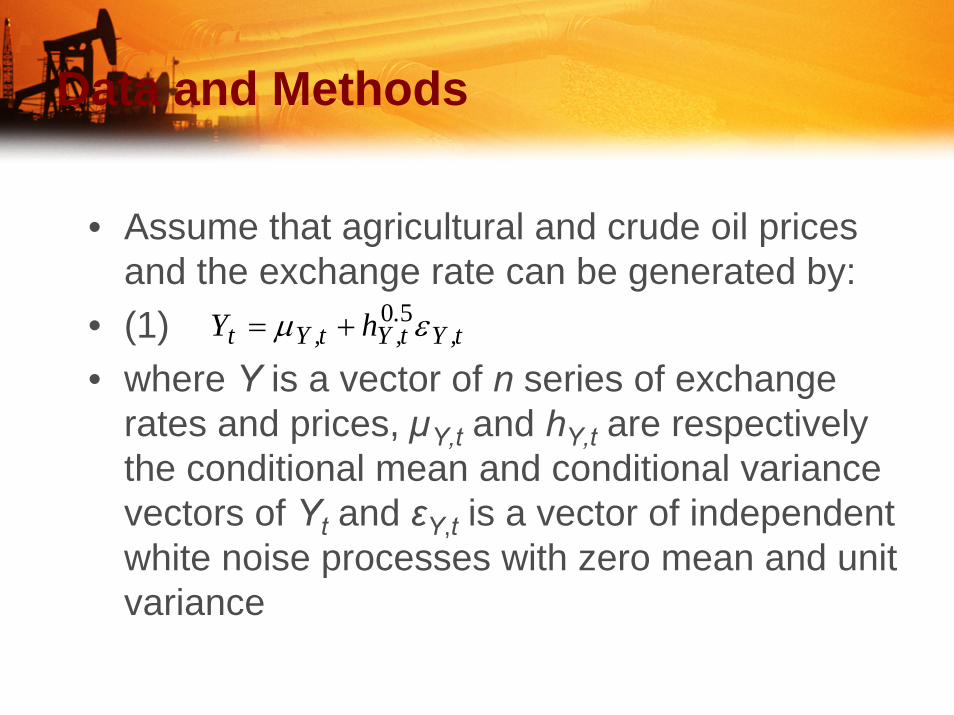
• Assume that agricultural and crude oil prices and the exchange rate can be generated by:
• (1) • where Y is a vector of n series of exchange
rates and prices, µY,t and hY,t are respectively the conditional mean and conditional variance vectors of Yt and εY,t is a vector of independent white noise processes with zero mean and unit variance
t,Y.t,Yt,Yt hY εμ 50+=
Data and Methods
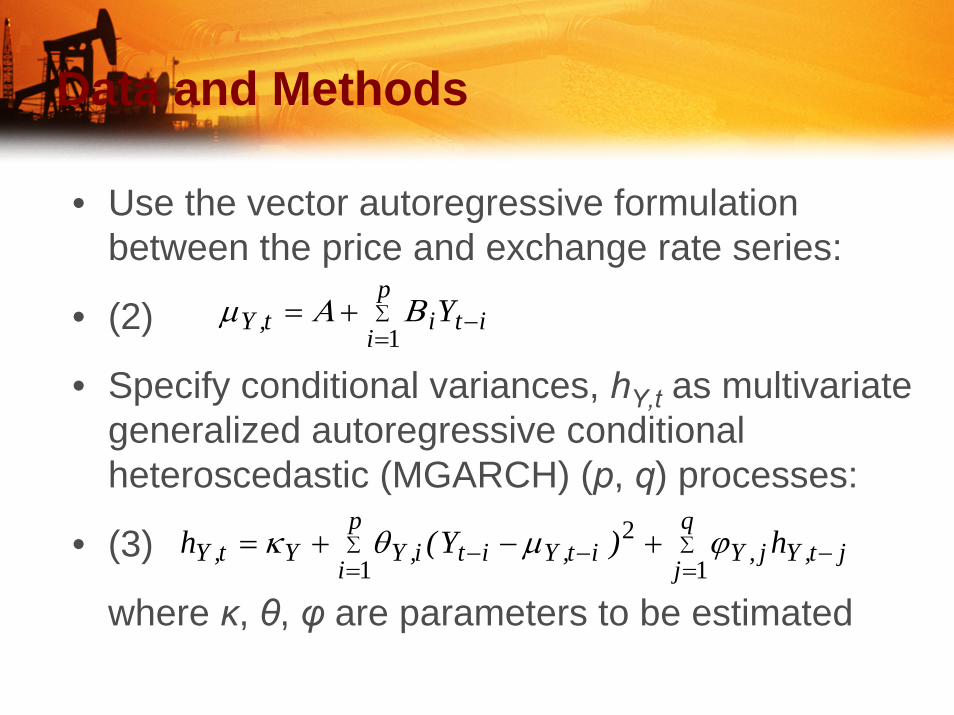
• Use the vector autoregressive formulation between the price and exchange rate series:
• (2)
• Specify conditional variances, hY,t as multivariate generalized autoregressive conditional heteroscedastic (MGARCH) (p, q) processes:
• (3)
where κ, θ, φ are parameters to be estimated
∑=
−+=p
iitit,Y Y
1ΒΑμ
∑∑=
−−=
− +−+=q
jjt,Yj,Yit,Y
p
iiti,YYt,Y h)Y(h
12
1ϕμθκ
Data and Methods
• Cheung and Ng (1996) test of causality in variance based on the sample cross-correlation function (CCF) of the squared residuals
• Similar to the causality in mean test• Hong (2001) introduce flexible weights for the
cross-correlations at each lag• Hafner and Herwartz (2006) Lagrange multiplier
test in the framework of the MGARCH model
Results
Variable FX Crude Corn h(FX) h(Crude) h(Corn)
Intercept -0.001 0.006** 0.001 -0.085 -0.233 -0.813*
FX(t) - - -0.107** - - -
Crude(t) -0.04* - - - - -
Crude(t-1) - -0.07*** - - - -
Arch 9.481** 3.869*** 36.20*
Garch 0.989* 0.958* 0.884*
N=739 Log likelihood 3580
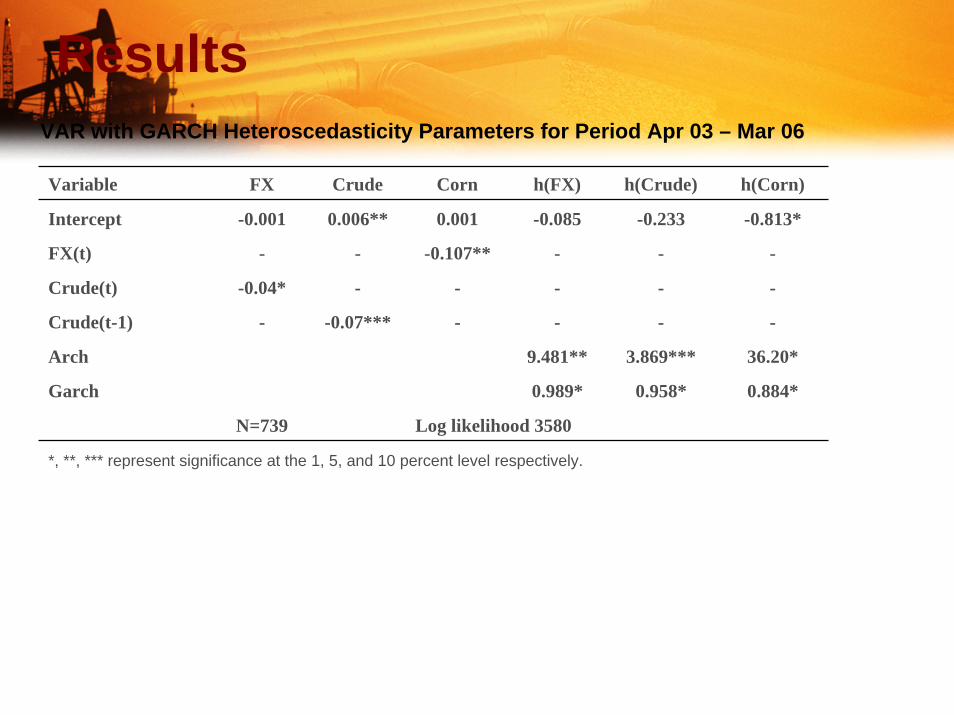
VAR with GARCH Heteroscedasticity Parameters for Period Apr 03 – Mar 06
*, **, *** represent significance at the 1, 5, and 10 percent level respectively.
Results
Lag FX and Crude FX and Corn Crude and Corn FX and Crude FX and Corn Crude and Corn
CCF of Standardized Residuals (Mean Causality) CCF of Squared Standardized Residuals (Variance Causality)
-6 -0.04522 0.08388 -0.03369 -0.0536 0.00899 -0.03053-5 0.02821 -0.04026 -0.02882 -0.00322 -0.02618 -0.00812-4 0.04056 0.03228 -0.01017 -0.03016 0.02743 -0.00891-3 0.02283 0.00709 -0.06725 -0.00441 -0.01194 0.014-2 0.04125 -0.01394 -0.00451 0.04204 -0.04111 -0.04239-1 0.03009 -0.0485 -0.06574 -0.02197 -0.01668 -0.016810 -0.03816 -0.00349 0.04101 0.0427 0.00439 0.009821 -0.06801 -0.03023 0.00878 0.01267 0.01208 -0.014312 -0.0098 -0.01188 0.01207 -0.05025 0.01777 -0.003053 -0.02604 -0.02399 0.01677 -0.0237 -0.03148 -0.005684 0.02348 0.01799 0.04335 -0.01334 -0.03447 -0.002655 0.07232 -0.03371 -0.05219 0.06853 -0.00456 -0.0126 -0.01455 0.02239 0.02303 0.03642 -0.01804 -0.01523
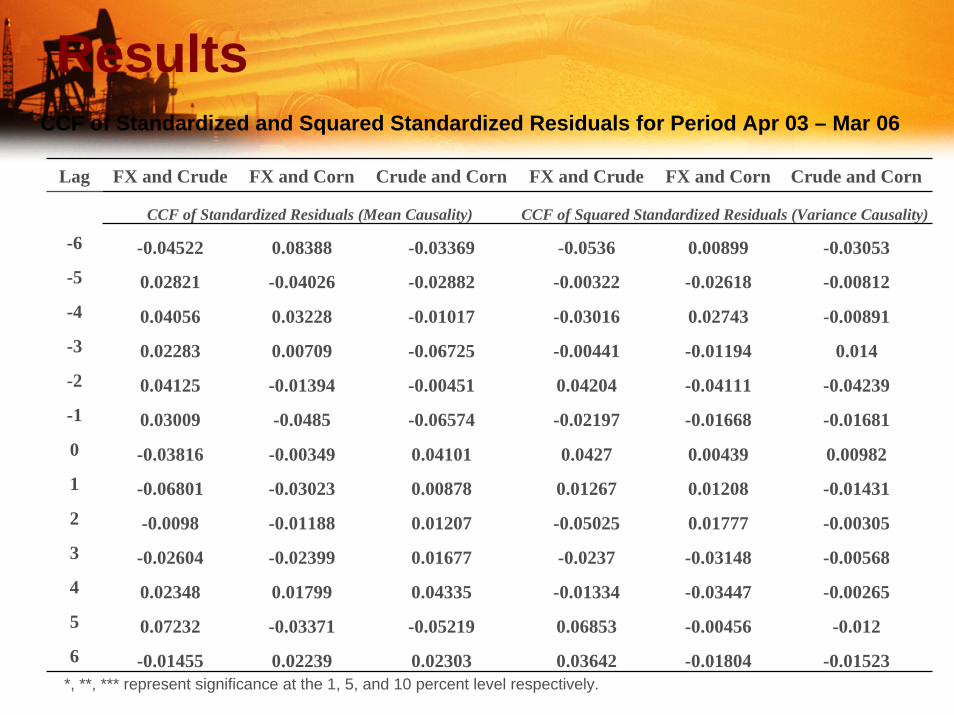
CCF of Standardized and Squared Standardized Residuals for Period Apr 03 – Mar 06
*, **, *** represent significance at the 1, 5, and 10 percent level respectively.
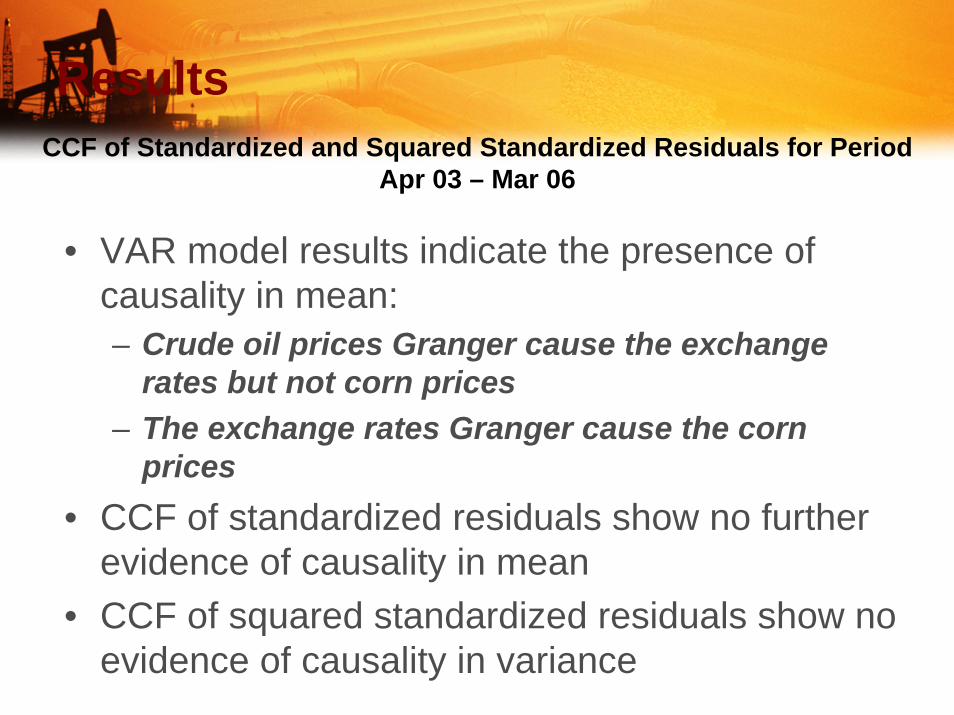
Results
• VAR model results indicate the presence of causality in mean:– Crude oil prices Granger cause the exchange
rates but not corn prices– The exchange rates Granger cause the corn
prices• CCF of standardized residuals show no further
evidence of causality in mean• CCF of squared standardized residuals show no
evidence of causality in variance
CCF of Standardized and Squared Standardized Residuals for Period Apr 03 – Mar 06
Results
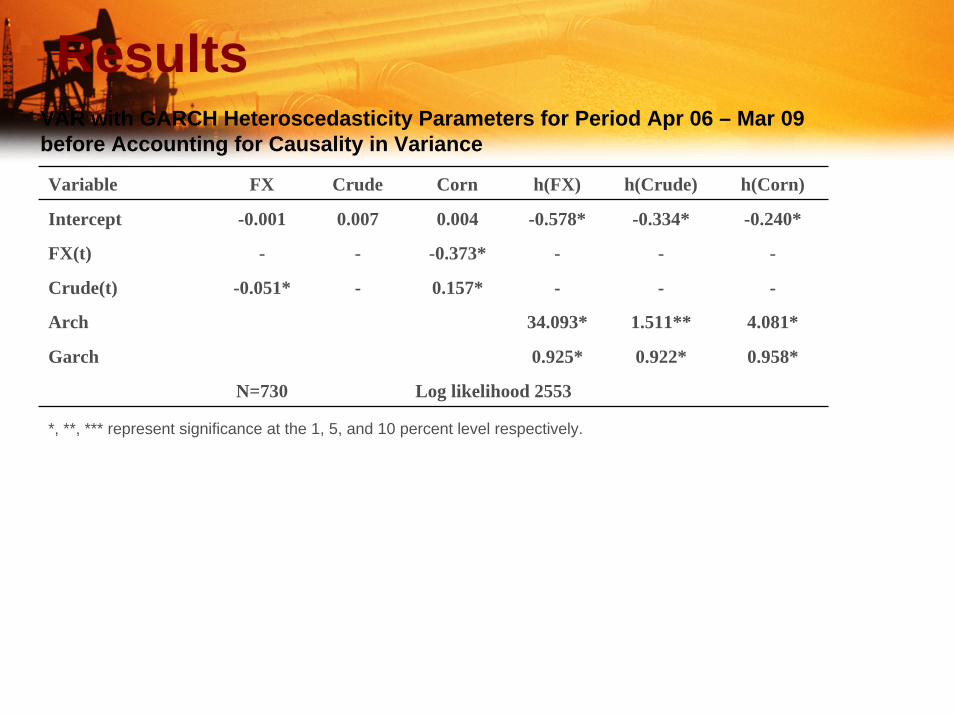
Variable FX Crude Corn h(FX) h(Crude) h(Corn)
Intercept -0.001 0.007 0.004 -0.578* -0.334* -0.240*
FX(t) - - -0.373* - - -
Crude(t) -0.051* - 0.157* - - -
Arch 34.093* 1.511** 4.081*
Garch 0.925* 0.922* 0.958*
N=730 Log likelihood 2553
VAR with GARCH Heteroscedasticity Parameters for Period Apr 06 – Mar 09 before Accounting for Causality in Variance
*, **, *** represent significance at the 1, 5, and 10 percent level respectively.
Results
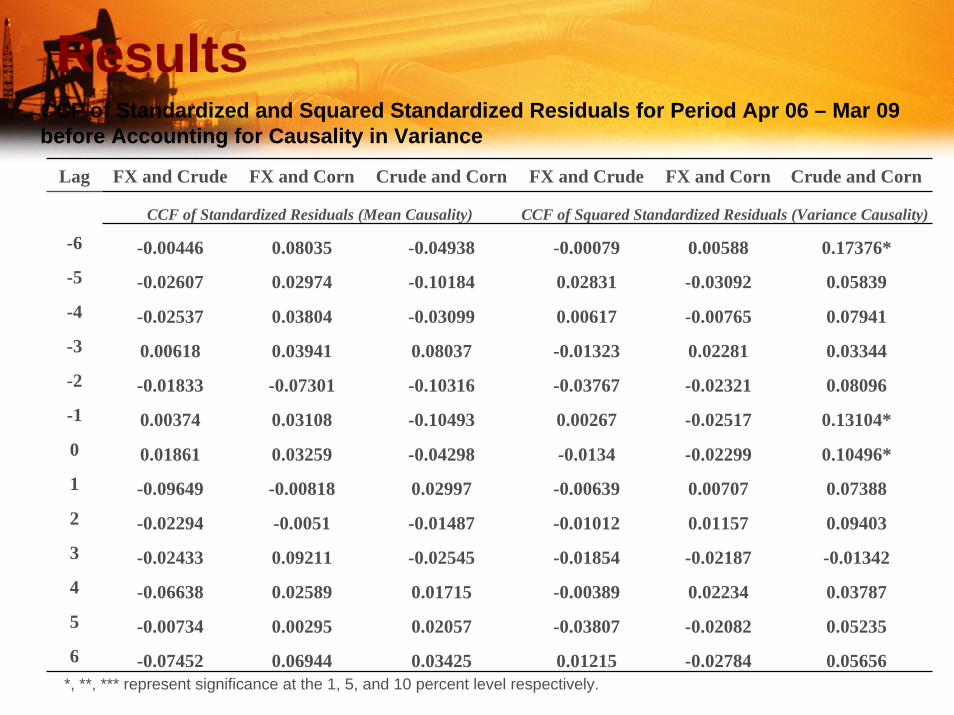
Lag FX and Crude FX and Corn Crude and Corn FX and Crude FX and Corn Crude and Corn
CCF of Standardized Residuals (Mean Causality) CCF of Squared Standardized Residuals (Variance Causality)
-6 -0.00446 0.08035 -0.04938 -0.00079 0.00588 0.17376*-5 -0.02607 0.02974 -0.10184 0.02831 -0.03092 0.05839-4 -0.02537 0.03804 -0.03099 0.00617 -0.00765 0.07941-3 0.00618 0.03941 0.08037 -0.01323 0.02281 0.03344-2 -0.01833 -0.07301 -0.10316 -0.03767 -0.02321 0.08096-1 0.00374 0.03108 -0.10493 0.00267 -0.02517 0.13104*0 0.01861 0.03259 -0.04298 -0.0134 -0.02299 0.10496*1 -0.09649 -0.00818 0.02997 -0.00639 0.00707 0.073882 -0.02294 -0.0051 -0.01487 -0.01012 0.01157 0.094033 -0.02433 0.09211 -0.02545 -0.01854 -0.02187 -0.013424 -0.06638 0.02589 0.01715 -0.00389 0.02234 0.037875 -0.00734 0.00295 0.02057 -0.03807 -0.02082 0.052356 -0.07452 0.06944 0.03425 0.01215 -0.02784 0.05656
CCF of Standardized and Squared Standardized Residuals for Period Apr 06 – Mar 09 before Accounting for Causality in Variance
*, **, *** represent significance at the 1, 5, and 10 percent level respectively.
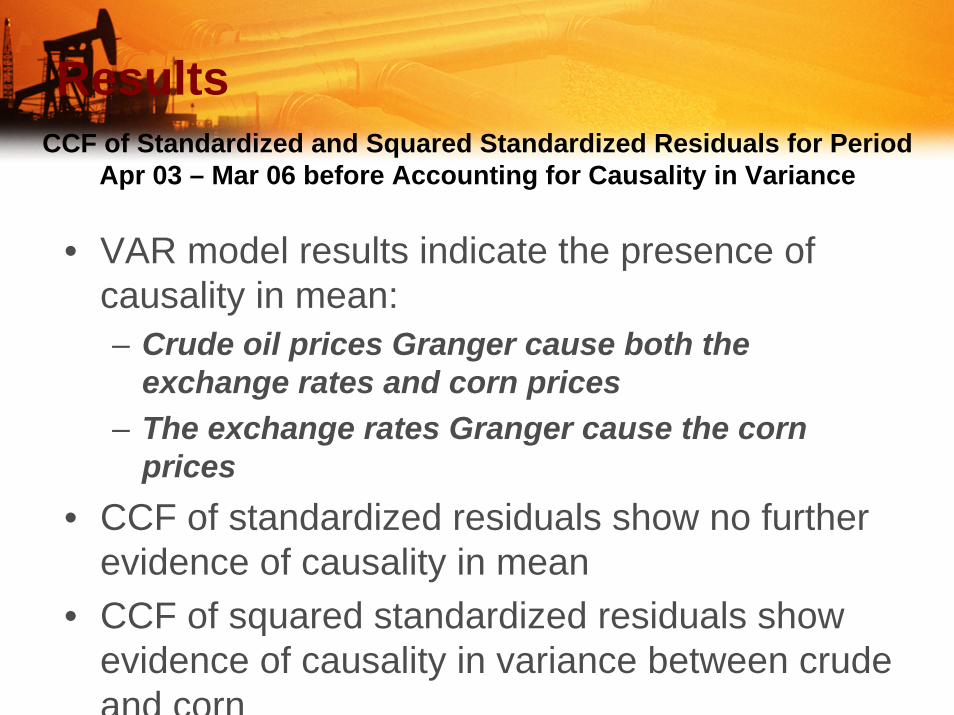
Results
• VAR model results indicate the presence of causality in mean:– Crude oil prices Granger cause both the
exchange rates and corn prices– The exchange rates Granger cause the corn
prices• CCF of standardized residuals show no further
evidence of causality in mean• CCF of squared standardized residuals show
evidence of causality in variance between crude and corn
CCF of Standardized and Squared Standardized Residuals for Period Apr 03 – Mar 06 before Accounting for Causality in Variance
Results
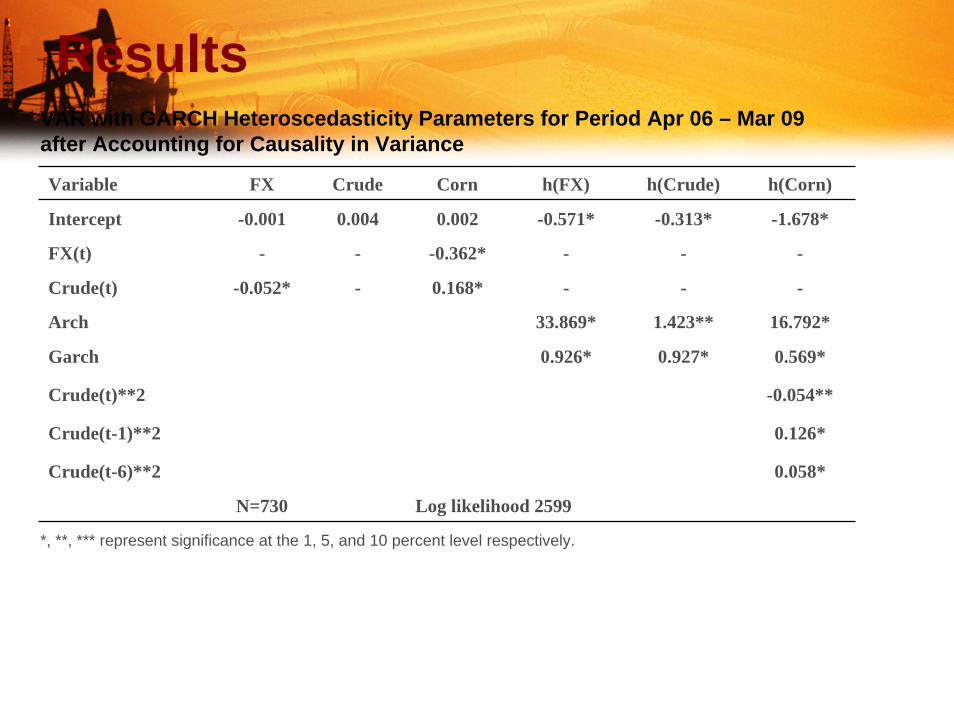
Variable FX Crude Corn h(FX) h(Crude) h(Corn)
Intercept -0.001 0.004 0.002 -0.571* -0.313* -1.678*
FX(t) - - -0.362* - - -
Crude(t) -0.052* - 0.168* - - -
Arch 33.869* 1.423** 16.792*
Garch 0.926* 0.927* 0.569*
Crude(t)**2 -0.054**
Crude(t-1)**2 0.126*
Crude(t-6)**2 0.058*
N=730 Log likelihood 2599
VAR with GARCH Heteroscedasticity Parameters for Period Apr 06 – Mar 09 after Accounting for Causality in Variance
*, **, *** represent significance at the 1, 5, and 10 percent level respectively.
Results
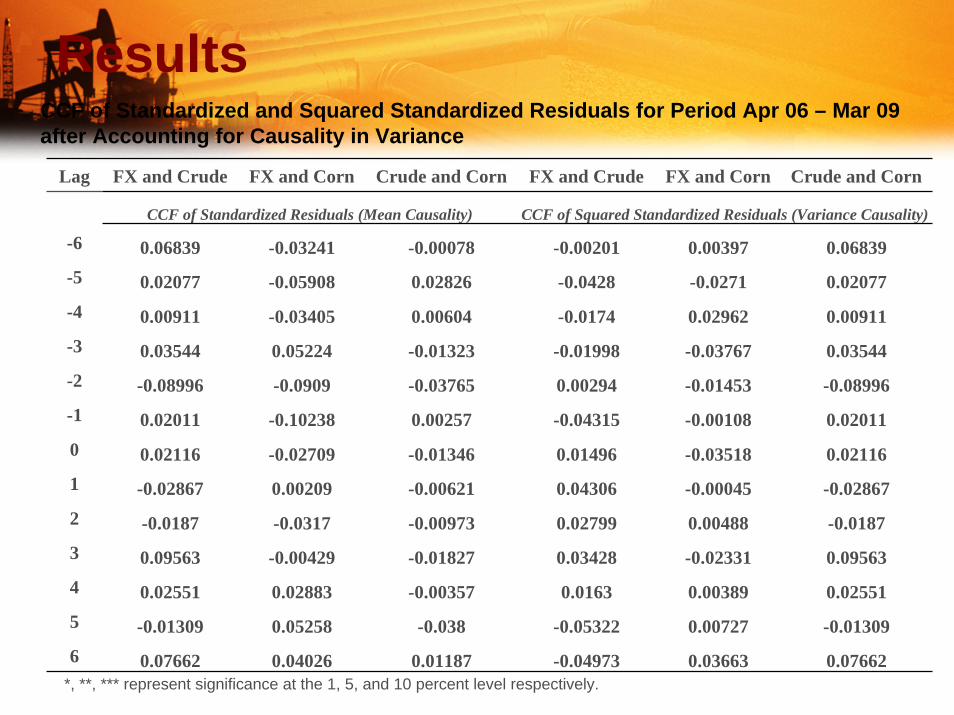
Lag FX and Crude FX and Corn Crude and Corn FX and Crude FX and Corn Crude and Corn
CCF of Standardized Residuals (Mean Causality) CCF of Squared Standardized Residuals (Variance Causality)
-6 0.06839 -0.03241 -0.00078 -0.00201 0.00397 0.06839-5 0.02077 -0.05908 0.02826 -0.0428 -0.0271 0.02077-4 0.00911 -0.03405 0.00604 -0.0174 0.02962 0.00911-3 0.03544 0.05224 -0.01323 -0.01998 -0.03767 0.03544-2 -0.08996 -0.0909 -0.03765 0.00294 -0.01453 -0.08996-1 0.02011 -0.10238 0.00257 -0.04315 -0.00108 0.020110 0.02116 -0.02709 -0.01346 0.01496 -0.03518 0.021161 -0.02867 0.00209 -0.00621 0.04306 -0.00045 -0.028672 -0.0187 -0.0317 -0.00973 0.02799 0.00488 -0.01873 0.09563 -0.00429 -0.01827 0.03428 -0.02331 0.095634 0.02551 0.02883 -0.00357 0.0163 0.00389 0.025515 -0.01309 0.05258 -0.038 -0.05322 0.00727 -0.013096 0.07662 0.04026 0.01187 -0.04973 0.03663 0.07662
CCF of Standardized and Squared Standardized Residuals for Period Apr 06 – Mar 09 after Accounting for Causality in Variance
*, **, *** represent significance at the 1, 5, and 10 percent level respectively.
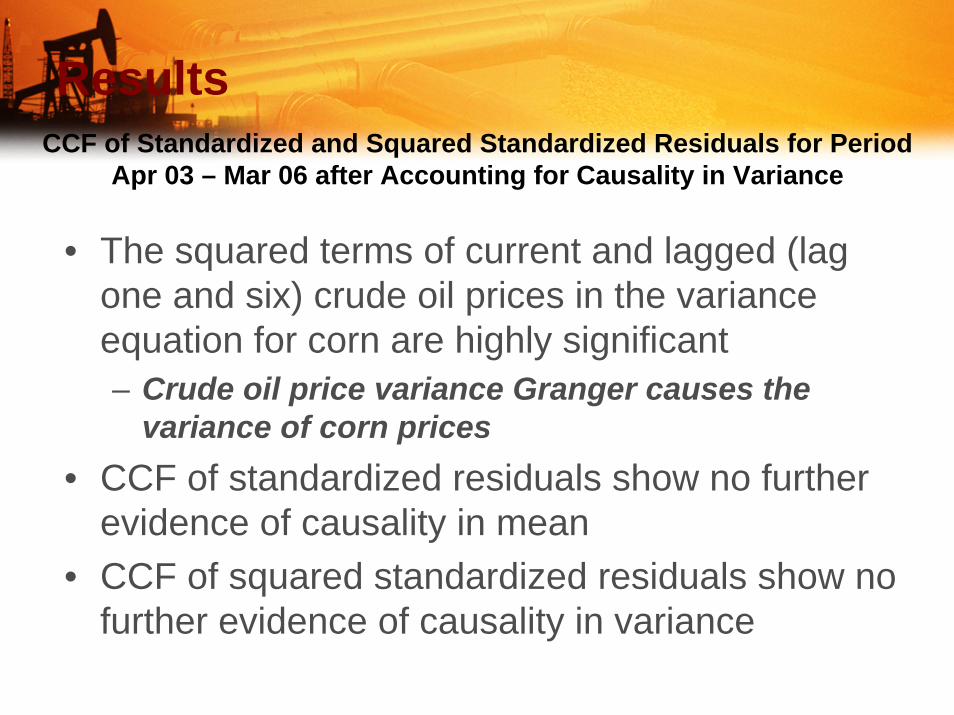
Results
• The squared terms of current and lagged (lag one and six) crude oil prices in the variance equation for corn are highly significant– Crude oil price variance Granger causes the
variance of corn prices• CCF of standardized residuals show no further
evidence of causality in mean• CCF of squared standardized residuals show no
further evidence of causality in variance
CCF of Standardized and Squared Standardized Residuals for Period Apr 03 – Mar 06 after Accounting for Causality in Variance
Conclusions
• Empirical evidence shows that variance of crude oil prices Granger causes the variance of corn prices
• Empirical evidence supports the findings that information flows from the energy markets into the corn markets
• These findings raise implications for the role of the corn futures contracts as a hedging tool for corn producers
Related Documents