9000 Virginia Manor Rd Ste 290, Beltsville MD 20705 | 301-474-0607 | www.dfrsolutions.com
Case Study: TCT Model Verification for NAND BGAs
March 25 I Ken Symonds

9000 Virginia Manor Rd Ste 290, Beltsville MD 20705 | 301-474-0607 | www.dfrsolutions.com
Copyright of DfR Solutions 2019
Abstract
Sample to sample thermal variation during temperature cycle testing can varysignificantly depending on the uniformity of airflow within a chamber.
The Blattau model for solder fatigue indicates that a variation of +/-5C in hot soaktemperature would lead to more than 25% change in solder fatigue stress across thepopulation.
A designed experiment has been performed to evaluate the agreement of the modeledprediction specifically for NAND BGAs used in Solid State Drives.
2
9000 Virginia Manor Rd Ste 290, Beltsville MD 20705 | 301-474-0607 | www.dfrsolutions.com
Copyright of DfR Solutions 2019
Agenda
12. Thermo-Mechanical Model
13. Experimental vs FEA Comparison
14. Incremental Solder Fatigue Variation
15. Single-Sided vs Double-Sided BGAs
16. Solder Ball Cross Sections
17. Wrap-Up
18. Future Opportunities
19. Acknowledgements
3
1. Overview
2. Thermal Cycle Stress – High Level
3. Hypothetical Scenario
4. Chamber Thermal Variation
5. Modeled Solder Fatigue Variation
6. Designed Experiment
7. Test Hardware
8. NAND BGAs
9. Experimental Results
10. Life-Stress ALTA Analysis
11. Concerns Realized
9000 Virginia Manor Rd Ste 290, Beltsville MD 20705 | 301-474-0607 | www.dfrsolutions.com
Copyright of DfR Solutions 2019
Overview
Problem Statement• Sample to sample thermal variation during temperature cycle testing (TCT) can be significant due to non-
uniform airflow within chambers • The Blattau model for solder fatigue predicts >25% variation in solder fatigue stress for variation of +/-5C• Question: Is this model accurate for NAND BGAs ?
Designed Experiment• Goal: Determine the change in solder fatigue stress to NAND BGAs due to thermal variation• A controlled thermal cycle test is performed with 3 hot soak temperatures (85C, 105C and 125C )• Test Vehicle: Daisy-chained PCBA and NAND BGAs with resistance-based monitoring
Analysis• Cycles to Failure (CTF) data collected and plotted via Weibull analysis to determine characteristic life • Life-Stress analysis performed in Alta to determine activation energy and incremental thermal acceleration • Thermo-Mechanical Finite Element Analysis (FEA) performed in Sherlock to compare to experimental data
Results• Closed form solder fatigue predictions from Sherlock agree very closely with experimental results • Thermo-Mechanical FEA results from Sherlock agree closely at 125 C, but diverge as temperature
decreases
4
9000 Virginia Manor Rd Ste 290, Beltsville MD 20705 | 301-474-0607 | www.dfrsolutions.com
Copyright of DfR Solutions 2019
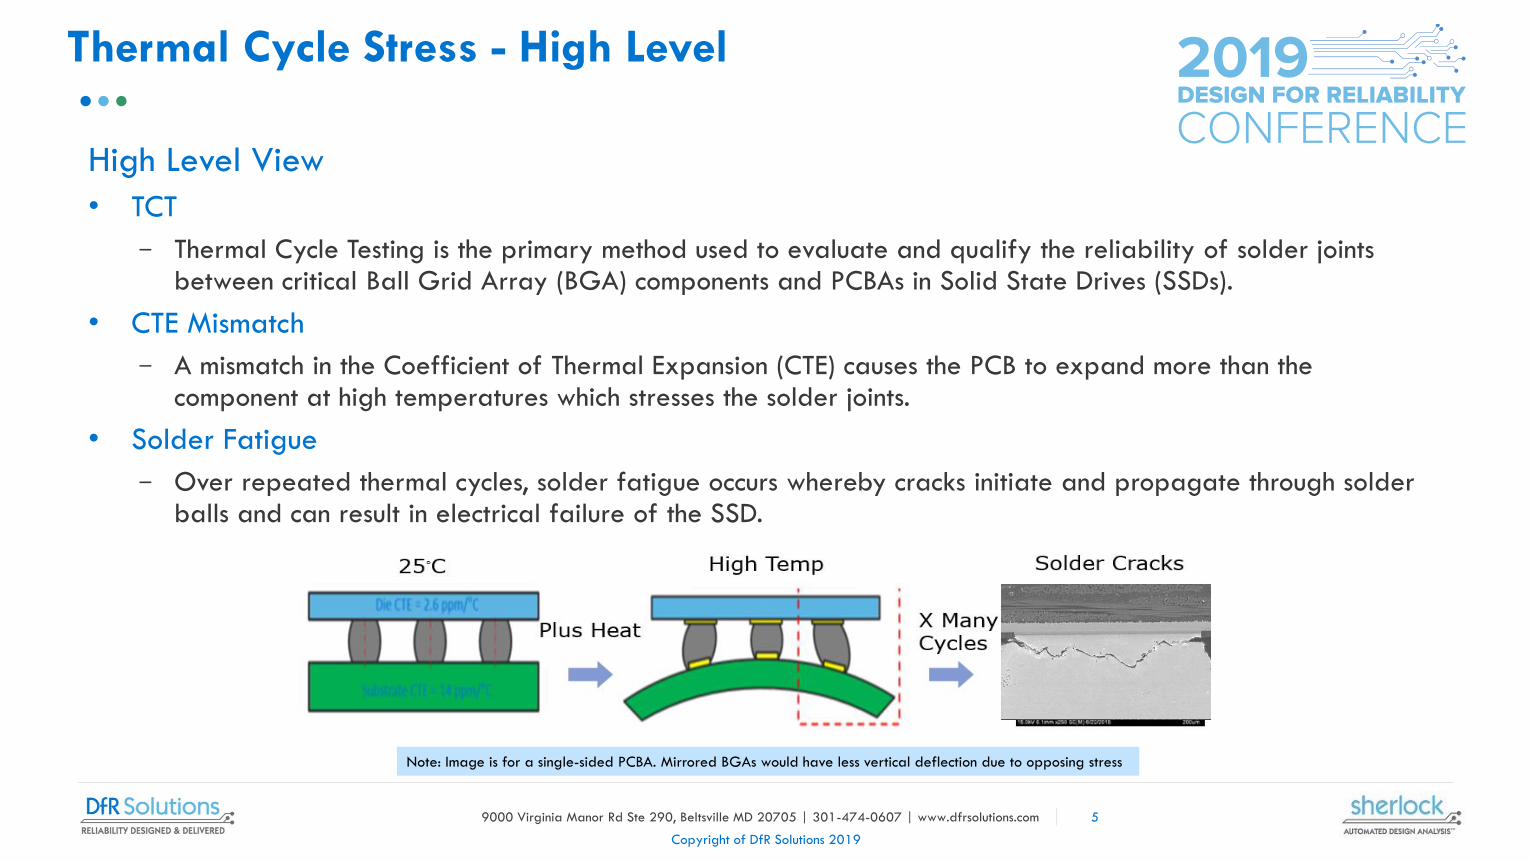
Thermal Cycle Stress - High Level
High Level View
• TCT
− Thermal Cycle Testing is the primary method used to evaluate and qualify the reliability of solder joints between critical Ball Grid Array (BGA) components and PCBAs in Solid State Drives (SSDs).
• CTE Mismatch
− A mismatch in the Coefficient of Thermal Expansion (CTE) causes the PCB to expand more than the component at high temperatures which stresses the solder joints.
• Solder Fatigue
− Over repeated thermal cycles, solder fatigue occurs whereby cracks initiate and propagate through solder balls and can result in electrical failure of the SSD.
5
Note: Image is for a single-sided PCBA. Mirrored BGAs would have less vertical deflection due to opposing stress
9000 Virginia Manor Rd Ste 290, Beltsville MD 20705 | 301-474-0607 | www.dfrsolutions.com
Copyright of DfR Solutions 2019
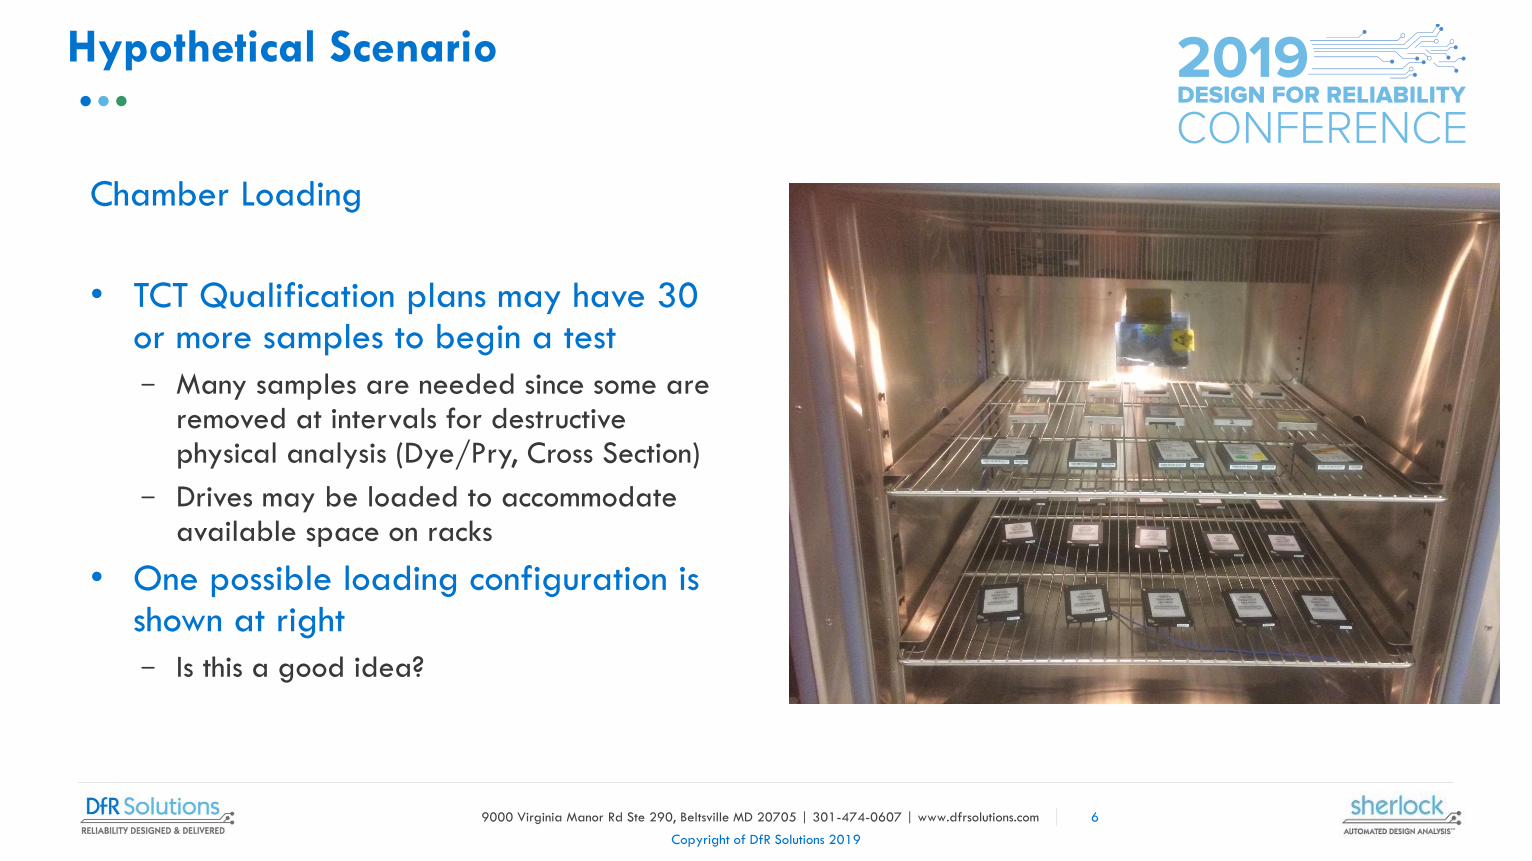
Hypothetical Scenario
Chamber Loading
• TCT Qualification plans may have 30 or more samples to begin a test
− Many samples are needed since some are removed at intervals for destructive physical analysis (Dye/Pry, Cross Section)
− Drives may be loaded to accommodate available space on racks
• One possible loading configuration is shown at right
− Is this a good idea?
6
9000 Virginia Manor Rd Ste 290, Beltsville MD 20705 | 301-474-0607 | www.dfrsolutions.com
Copyright of DfR Solutions 2019
Chamber Thermal Variation
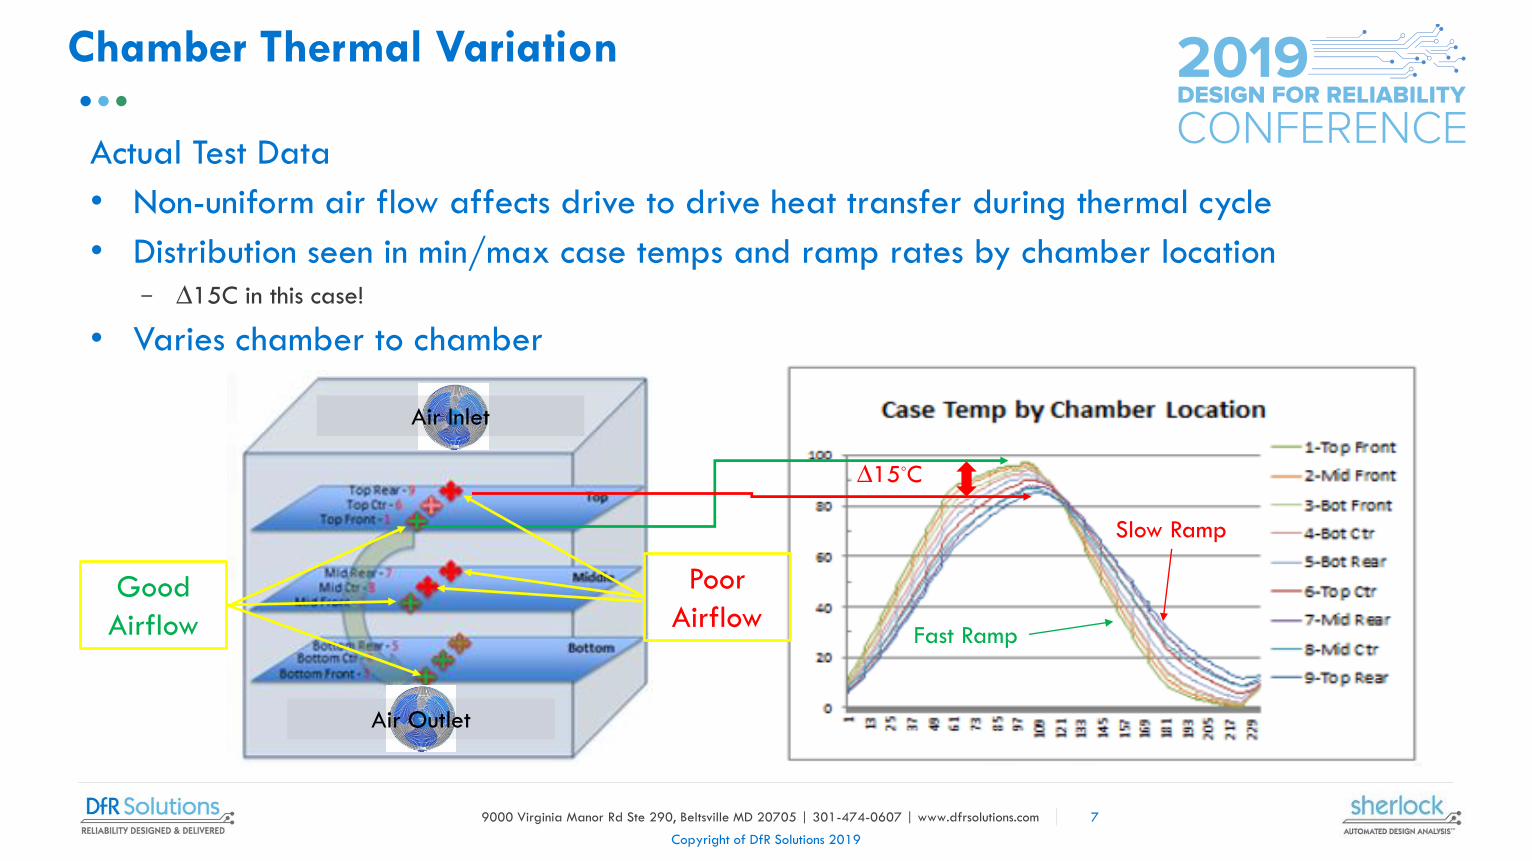
Actual Test Data
• Non-uniform air flow affects drive to drive heat transfer during thermal cycle
• Distribution seen in min/max case temps and ramp rates by chamber location− ∆15C in this case!
• Varies chamber to chamber
7
∆15C
Fast Ramp
Slow Ramp
Good
Airflow
Poor
Airflow
Air Outlet
Air Inlet
9000 Virginia Manor Rd Ste 290, Beltsville MD 20705 | 301-474-0607 | www.dfrsolutions.com
Copyright of DfR Solutions 2019
Modeled Solder Fatigue Variation
The Blattau Model
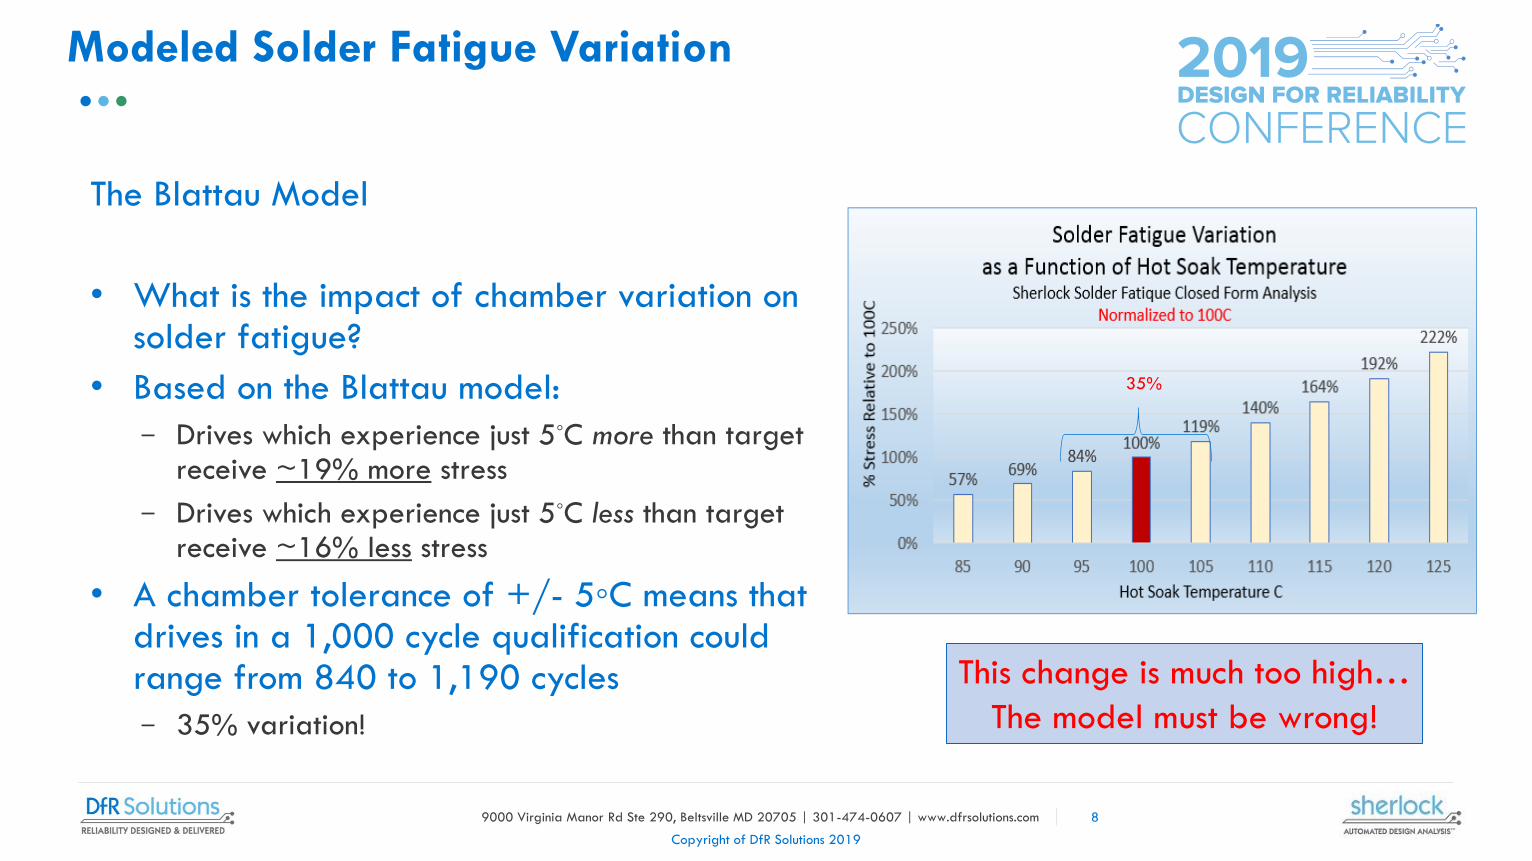
• What is the impact of chamber variation on solder fatigue?
• Based on the Blattau model:
− Drives which experience just 5C more than target receive ~19% more stress
− Drives which experience just 5C less than target receive ~16% less stress
• A chamber tolerance of +/- 5C means that drives in a 1,000 cycle qualification could range from 840 to 1,190 cycles
− 35% variation!
8
This change is much too high…
The model must be wrong!
35%
9000 Virginia Manor Rd Ste 290, Beltsville MD 20705 | 301-474-0607 | www.dfrsolutions.com
Copyright of DfR Solutions 2019
Designed Experiment
Thermal Profiles
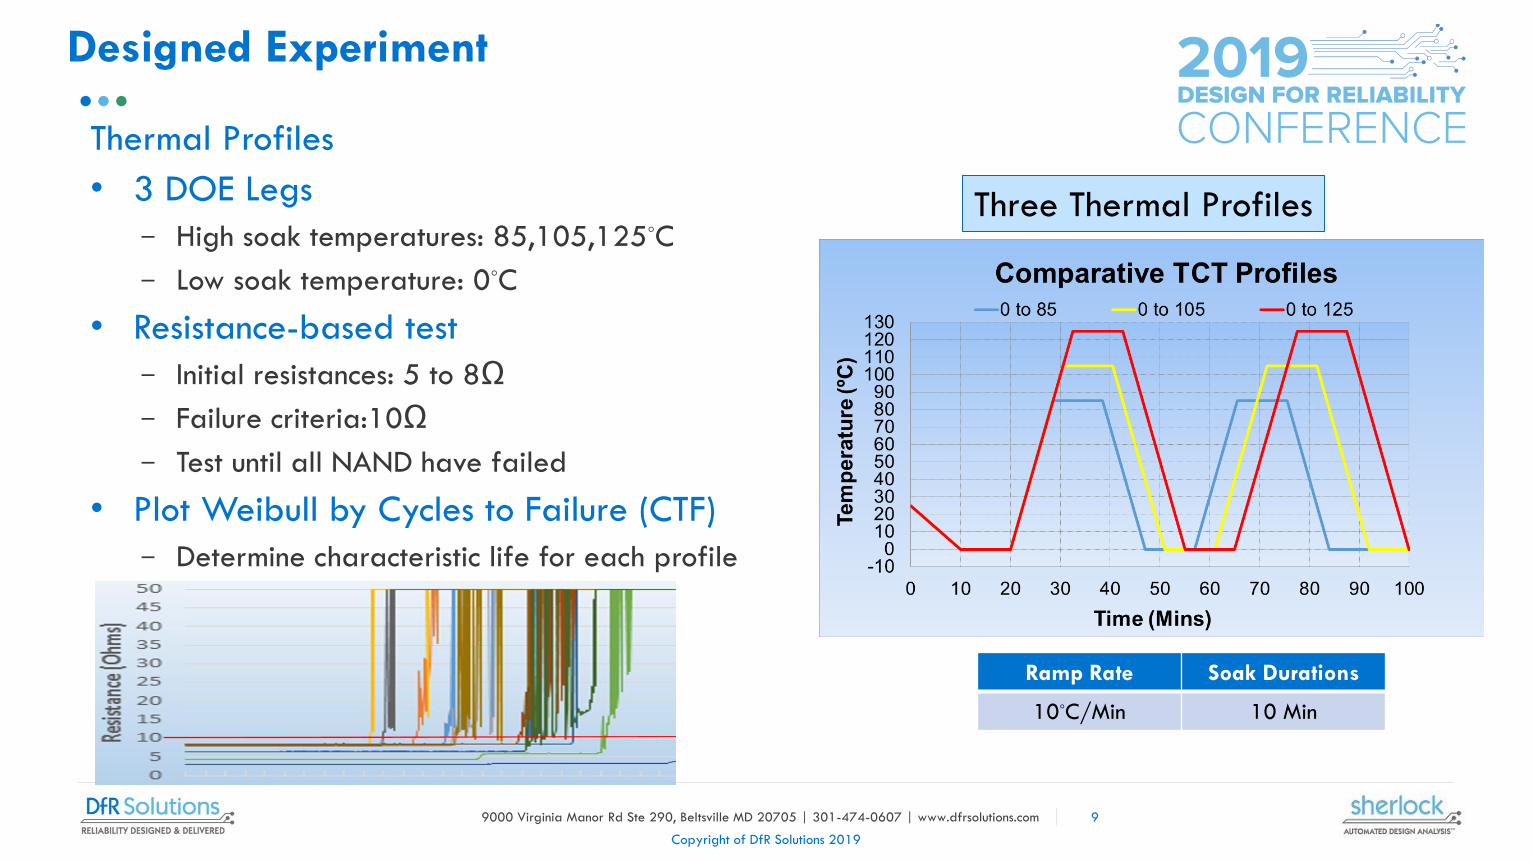
• 3 DOE Legs
− High soak temperatures: 85,105,125C
− Low soak temperature: 0C
• Resistance-based test
− Initial resistances: 5 to 8Ω
− Failure criteria:10Ω
− Test until all NAND have failed
• Plot Weibull by Cycles to Failure (CTF)
− Determine characteristic life for each profile
9
Three Thermal Profiles
Ramp Rate Soak Durations
10C/Min 10 Min

9000 Virginia Manor Rd Ste 290, Beltsville MD 20705 | 301-474-0607 | www.dfrsolutions.com
Copyright of DfR Solutions 2019
Test Hardware
• Daisy-Chained NAND / PCBA− Design based on an actual SSD product; however,
modified to incorporate direct resistance-based measurement across all solder balls in discrete NAND BGAs
− 12 BGAs monitored per PCBA
− 2 PCBs, 24 NAND per leg
• Resistance Monitoring − PCBAs connected with wire specifically used for resistance
monitoring
• Chamber Configuration− Test boards mounted with additional fans to provide
uniform airflow
• Data Acquisition− Data acquisition unit records both resistance and BGA
case temperature in 10s increments
10
Data Acquisition Pod and Controller
Test Module, Chamber Arrangement
9000 Virginia Manor Rd Ste 290, Beltsville MD 20705 | 301-474-0607 | www.dfrsolutions.com
Copyright of DfR Solutions 2019
NAND BGAs
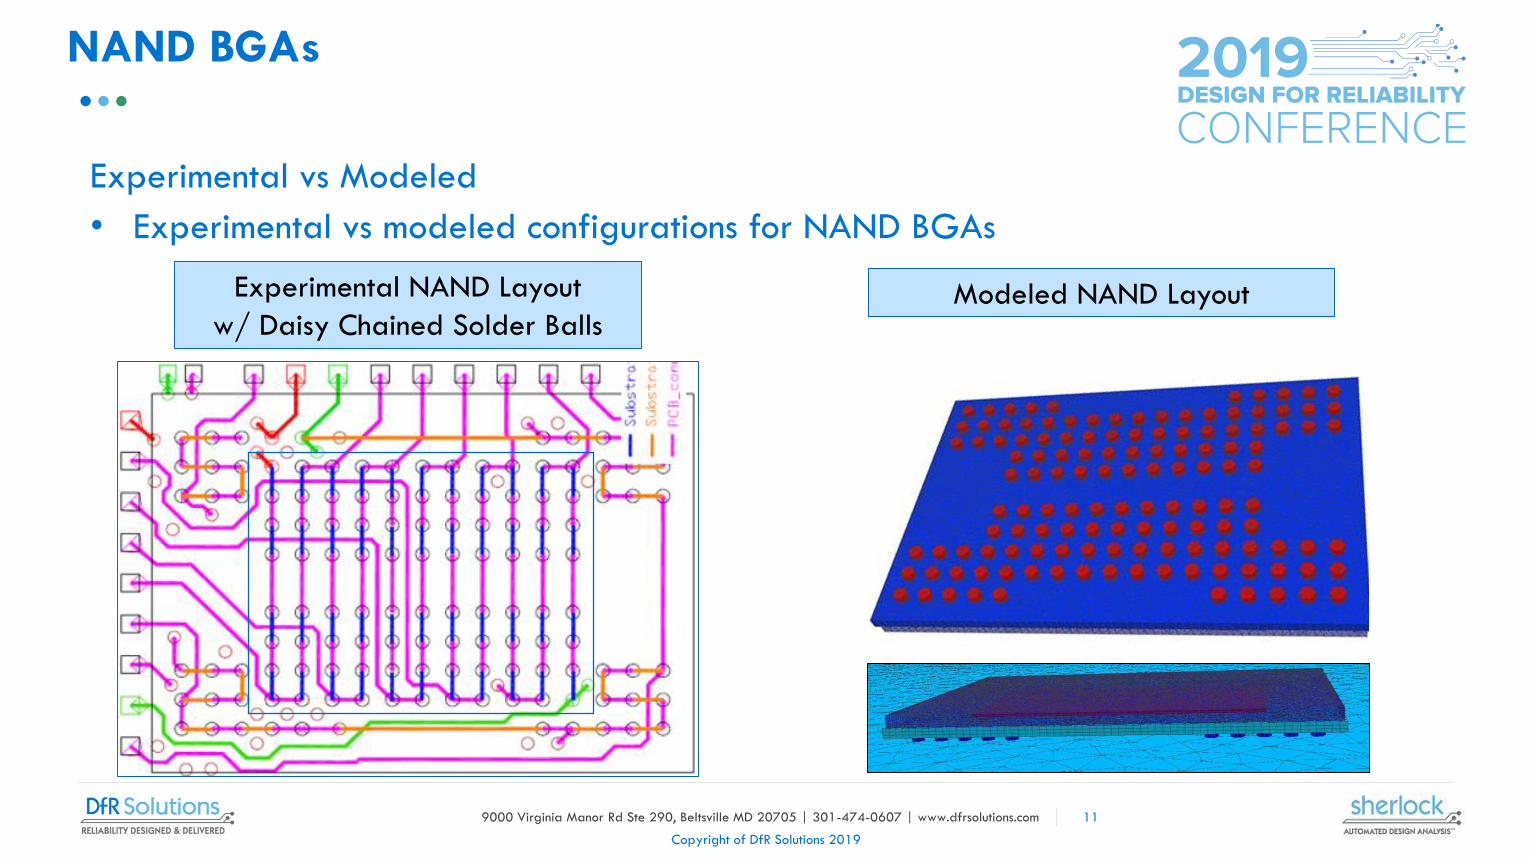
Experimental vs Modeled
• Experimental vs modeled configurations for NAND BGAs
Experimental NAND Layout
w/ Daisy Chained Solder Balls Modeled NAND Layout
11

9000 Virginia Manor Rd Ste 290, Beltsville MD 20705 | 301-474-0607 | www.dfrsolutions.com
Copyright of DfR Solutions 2019
Experimental Results
Weibull Analysis
• Experimental cycles to failure are evaluated per component when the resistance measurement first exceeds 10Ω
• 2P Weibull plots are generated for each profile
− Beautiful data!
• Characteristic life (Eta)
− Relative acceleration between conditions is determined from the ratios of Eta
› 125C to 105C: 1.9x
› 105C to 85C: 1.9x
• This is why I chose 105C rather than 100C for the mid-point even though 0 to 100C is a primary standard
12
9000 Virginia Manor Rd Ste 290, Beltsville MD 20705 | 301-474-0607 | www.dfrsolutions.com
Copyright of DfR Solutions 2019
Experimental Data Analysis
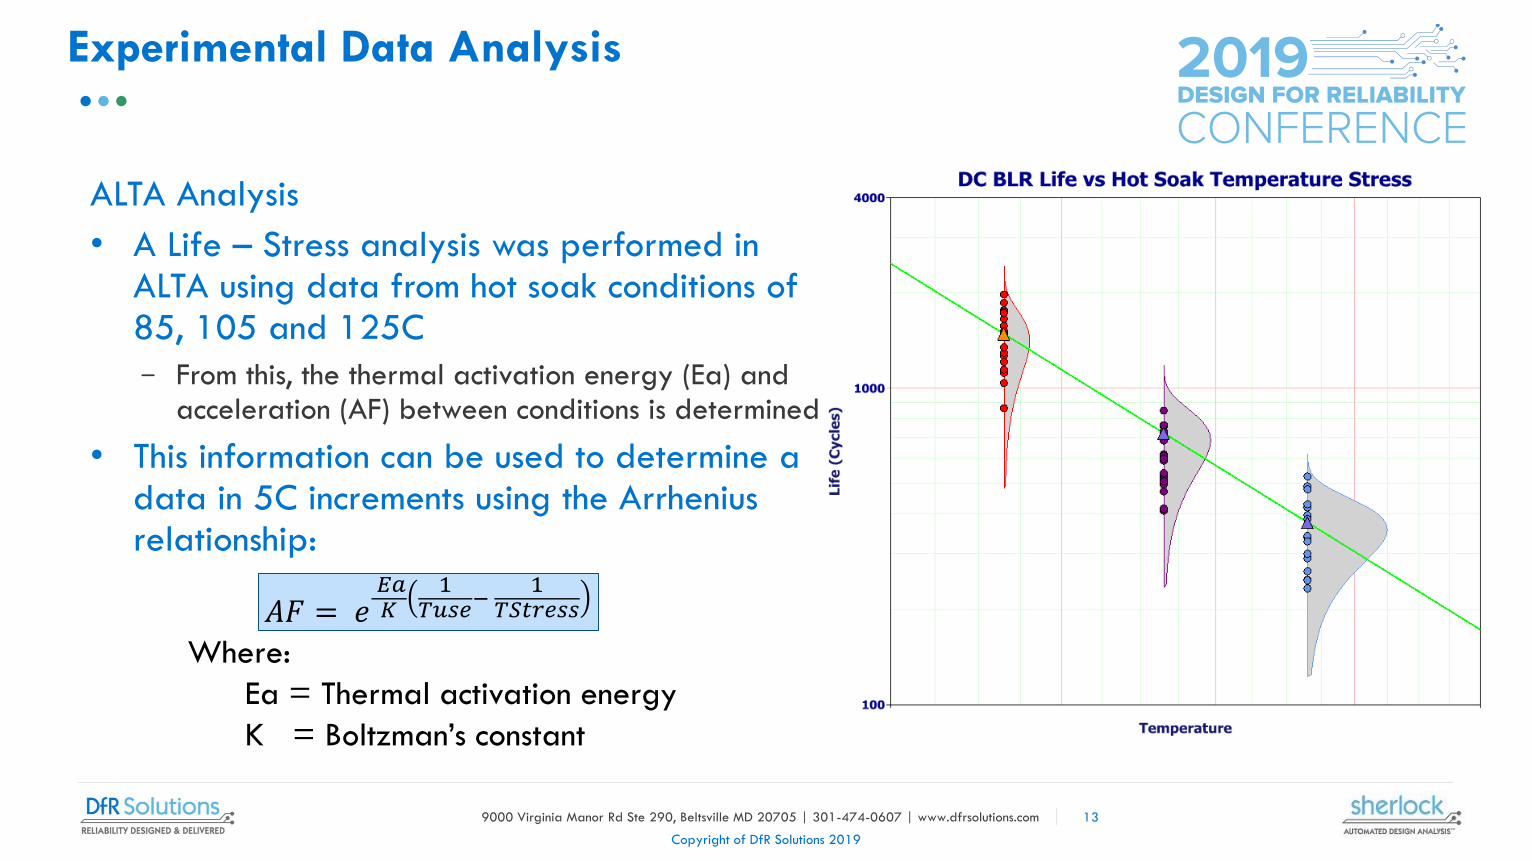
ALTA Analysis
• A Life – Stress analysis was performed in ALTA using data from hot soak conditions of 85, 105 and 125C
− From this, the thermal activation energy (Ea) and acceleration (AF) between conditions is determined
• This information can be used to determine a data in 5C increments using the Arrhenius relationship:
13
𝐴𝐹 = 𝑒𝐸𝑎𝐾
1𝑇𝑢𝑠𝑒−
1𝑇𝑆𝑡𝑟𝑒𝑠𝑠
Where:
Ea = Thermal activation energy
K = Boltzman’s constant

9000 Virginia Manor Rd Ste 290, Beltsville MD 20705 | 301-474-0607 | www.dfrsolutions.com
Copyright of DfR Solutions 2019
Concerns Realized
Solder Fatigue Variation Verified
• The incremental extrapolation from Alta allows a direct comparison of experimental to modeled data
• The agreement is curiously excellent! − The reason is that both approaches heavily
leverage the same Arrhenius equation!
• This data confirms the initial concern: − +/- 5C thermal variation leads to ~ 35%
variation in solder fatigue!
− Test environments need to be carefully characterized and designed
• WDC has developed proprietary hardware capable of controlling thermal variation to < 2.5C!
14

9000 Virginia Manor Rd Ste 290, Beltsville MD 20705 | 301-474-0607 | www.dfrsolutions.com
Copyright of DfR Solutions 2019
Thermo-Mechanical Model
15
Mesh Strain Stress
Finite Element Analysis
• Thermo-mech module in Sherlock enables fatigue life prediction for BGA components due to system level effects such as double-sided BGA configuration.
• Incremental static steps are solved to determine thermally induces stress and strain in each solder joint in every package.
• Fatigue prediction is provided by identifying the critical solder joint for each component and calculating the energy density at highest temperature increment.
9000 Virginia Manor Rd Ste 290, Beltsville MD 20705 | 301-474-0607 | www.dfrsolutions.com
Copyright of DfR Solutions 2019
Experimental vs. FEA Comparison
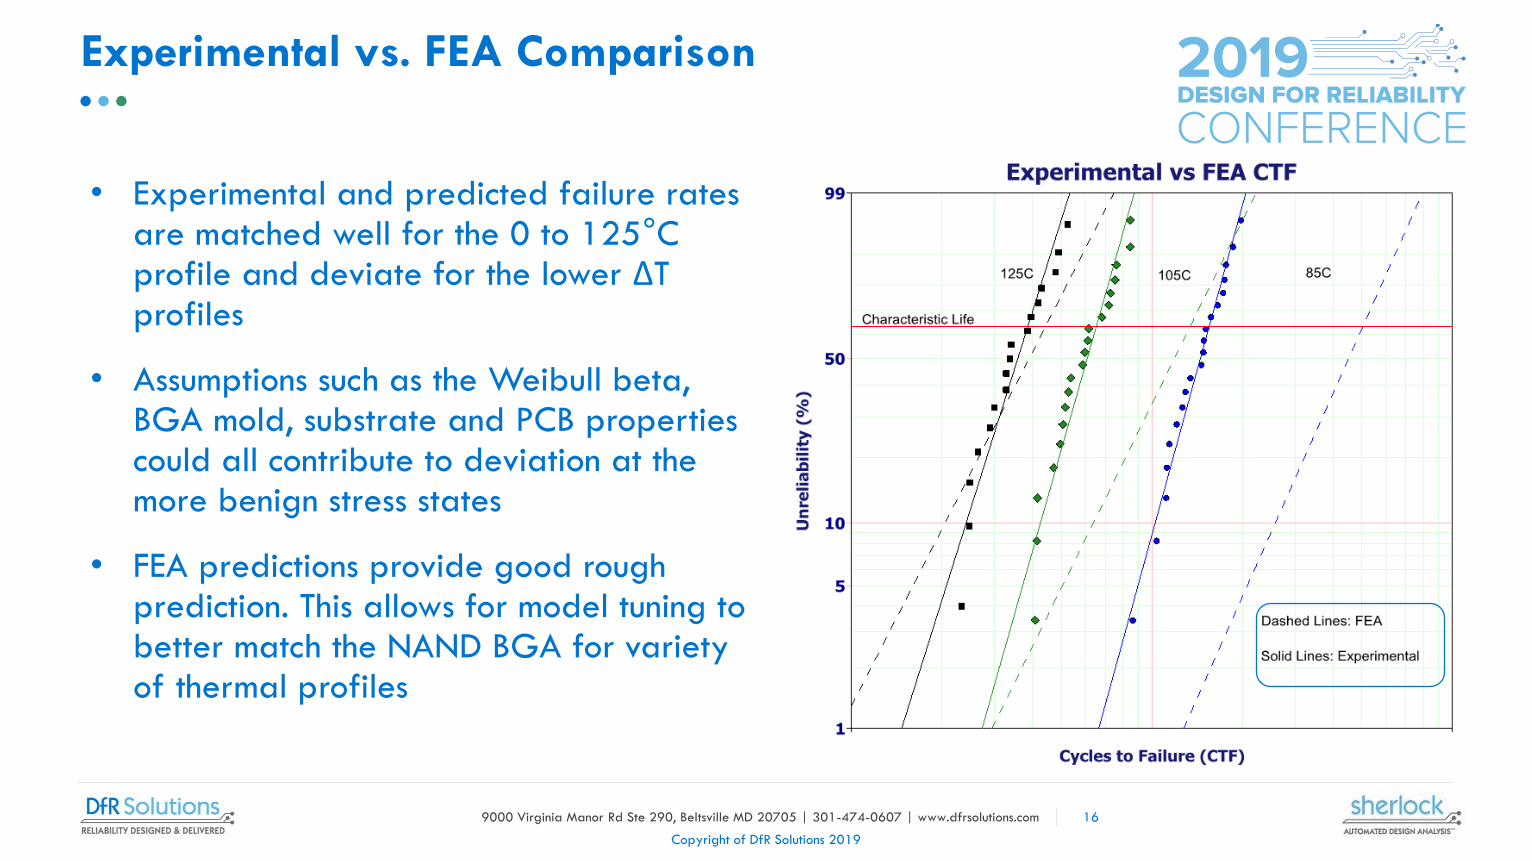
• Experimental and predicted failure rates are matched well for the 0 to 125°C profile and deviate for the lower ΔT profiles
• Assumptions such as the Weibull beta, BGA mold, substrate and PCB properties could all contribute to deviation at the more benign stress states
• FEA predictions provide good rough prediction. This allows for model tuning to better match the NAND BGA for variety of thermal profiles
16

9000 Virginia Manor Rd Ste 290, Beltsville MD 20705 | 301-474-0607 | www.dfrsolutions.com
Copyright of DfR Solutions 2019
Incremental Solder Fatigue Variation
FEA vs Experimental
• Incremental experimental vs FEA modeled solder fatigue is determined and compared
• Since the Weibull overlay shows 125C is nearly equal and diverges at lower temperatures, the deltas are referenced to an assumed 125C equivalency
• At 100C, +/- 5C thermal chamber variation projects to fatigue variation of 12% for FEA vs 15% experimental
17
+/-5C
Note: These percentages around 100C differ from slide

9000 Virginia Manor Rd Ste 290, Beltsville MD 20705 | 301-474-0607 | www.dfrsolutions.com
Copyright of DfR Solutions 2019
Single-sided vs. Double-sided BGAs
• Predictions can be extended for single-sided BGA configuration using the same Thermo-mechanical model approach.
• Double-sided component stiffen the PCB resulting in larger thermally induced shear strain in solder joints compared to single sided components.
• Strain distribution at 125°C shows higher strain in both solder joints and PCB for the double-sided configuration as expected.
18
Single-sided
Double-sided
Equivalent strain distribution at 125°C

9000 Virginia Manor Rd Ste 290, Beltsville MD 20705 | 301-474-0607 | www.dfrsolutions.com
Copyright of DfR Solutions 2019
Single-sided vs. Double-sided
Experimental Results
• All BGAs were depopulated from 1 side of a set of boards prior to running them through the 125C thermal profile
• The data sets matched fairly well in slope and demonstrated an acceleration of 3.2X for the double-sided configuration
19

9000 Virginia Manor Rd Ste 290, Beltsville MD 20705 | 301-474-0607 | www.dfrsolutions.com
Copyright of DfR Solutions 2019
Single-sided vs. Double-sided
FEA Results
• Thermo-Mechanical FEA modeling of single- vs double-sided configurations showed an acceleration of ~ 1.8X for the double-sided case
20
9000 Virginia Manor Rd Ste 290, Beltsville MD 20705 | 301-474-0607 | www.dfrsolutions.com
Copyright of DfR Solutions 2019
Solder Ball Cross Sections
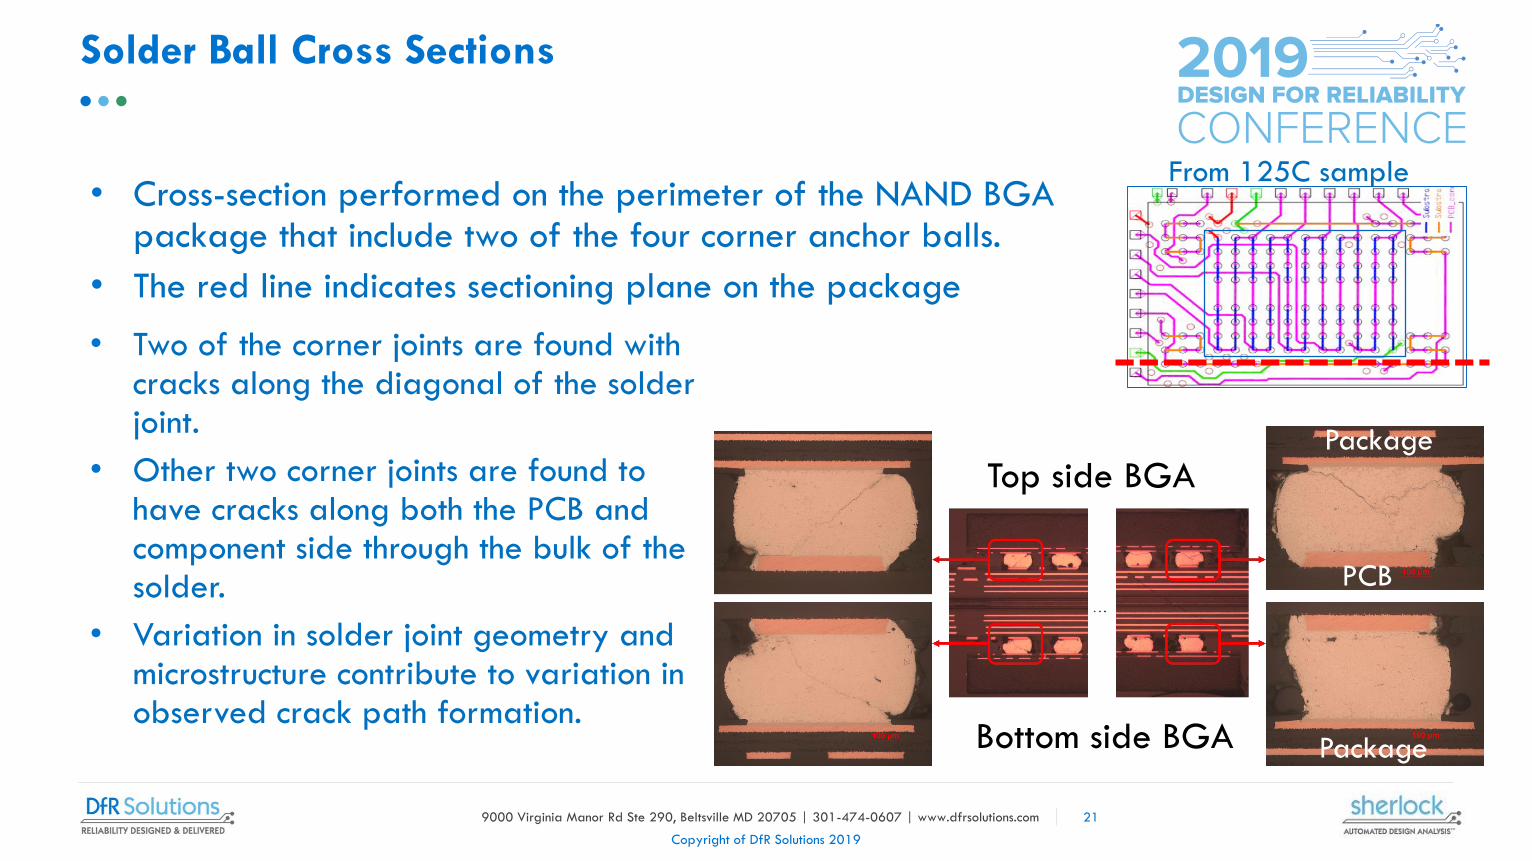
• Cross-section performed on the perimeter of the NAND BGA package that include two of the four corner anchor balls.
• The red line indicates sectioning plane on the package
21
From 125C sample
• Two of the corner joints are found with cracks along the diagonal of the solder joint.
• Other two corner joints are found to have cracks along both the PCB and component side through the bulk of the solder.
• Variation in solder joint geometry and microstructure contribute to variation in observed crack path formation.
Top side BGA
Bottom side BGA
PCB
Package
Package
9000 Virginia Manor Rd Ste 290, Beltsville MD 20705 | 301-474-0607 | www.dfrsolutions.com
Copyright of DfR Solutions 2019
Solder Ball Cross Sections
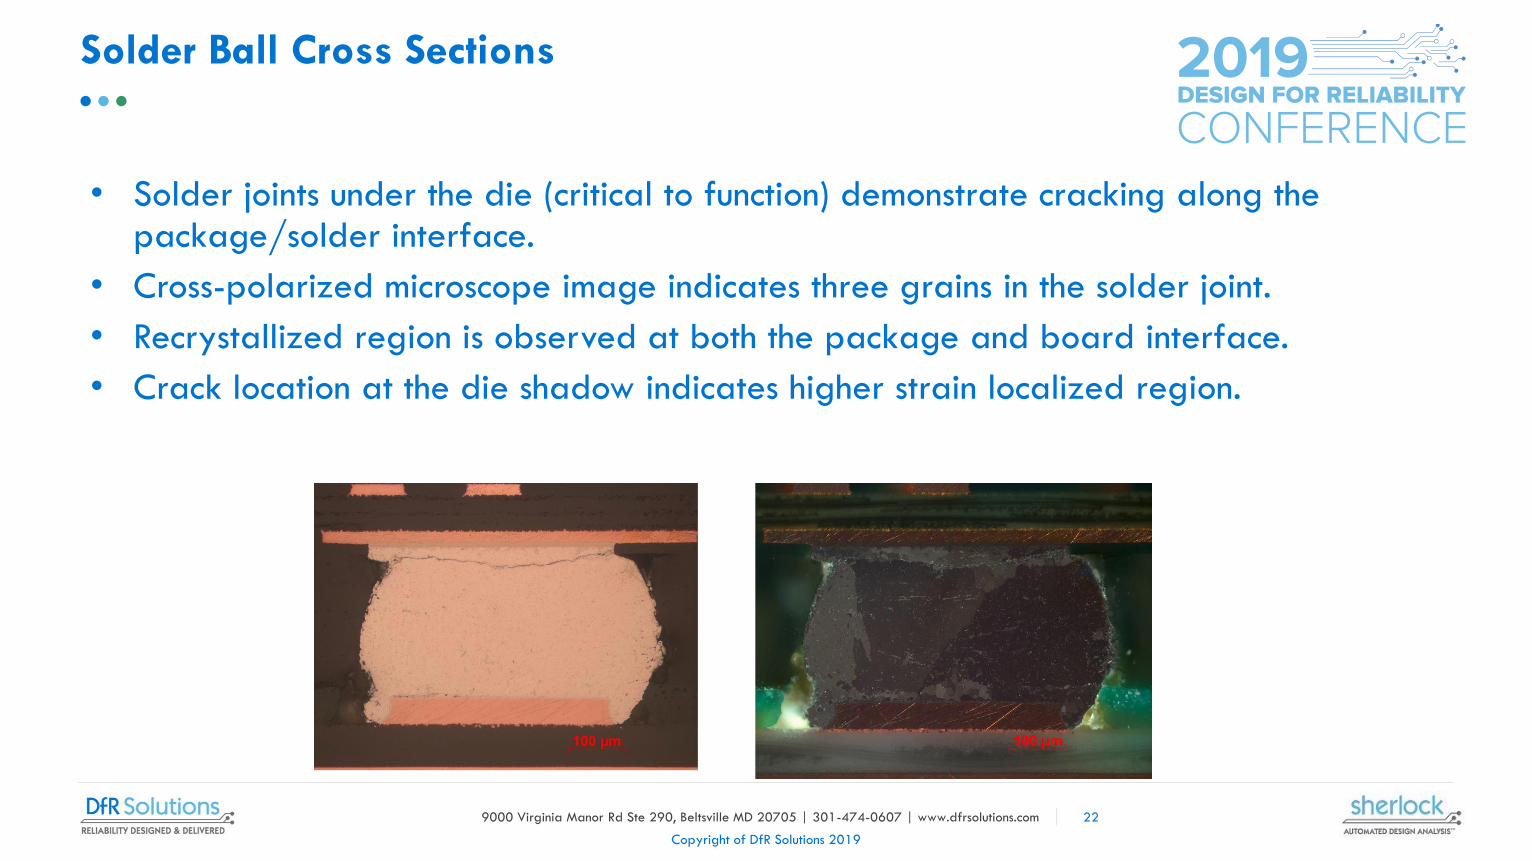
• Solder joints under the die (critical to function) demonstrate cracking along the package/solder interface.
• Cross-polarized microscope image indicates three grains in the solder joint.
• Recrystallized region is observed at both the package and board interface.
• Crack location at the die shadow indicates higher strain localized region.
22
9000 Virginia Manor Rd Ste 290, Beltsville MD 20705 | 301-474-0607 | www.dfrsolutions.com
Copyright of DfR Solutions 2019
Wrap Up
• The initial concern of significant variation in solder fatigue stress applied during thermal cycle qualification has been confirmed and verified − Resistance-based data for 3 thermal profiles was analyzed using Weibull and Life-Stress analysis− BGA and PCBA design information was analyzed using both closed-form and thermo-mechanical
finite element analysis− These analytical techniques transformed data from 3 DOE legs 20C apart to incremental resolution
of 5C
• Thermal variation of +/- 5C in hot soak temperature WILL lead to a range of ~850 to 1,200 effective cycles for a 1,000 cycle qualification − This level of variation can render results inconclusive at best or, worse, misinterpreted
• Analysis of single- vs double-sided BGA mounting was also performed− Double-sided or mirrored mounting shows an acceleration of 3.2x (experimental) vs 1.8x (modeled)
over single-sided configurations
• The experimental data obtained in this work will be critical in refining existing FEA models so that more complex problems can be confidently addressed − Most importantly, the ability to extend this methodology to accurately predict reliability of
functional balls toward the inner region of the array will be highly valuable
23

9000 Virginia Manor Rd Ste 290, Beltsville MD 20705 | 301-474-0607 | www.dfrsolutions.com
Copyright of DfR Solutions 2019
Future Opportunities
The current presentation has referenced the first ball to fail in NAND BGAs which by design is one of anumber of non-functional so called ‘anchor balls’ used to absorb the brunt of the thermo-mechanical stress.In this manner, the effect of thermal variation on characteristic life for different profiles has beenexperimentally verified.
• First Functional Ball CTF
What is perhaps more important to the reliability community is to better quantify the expected cyclesto failure for the first functional ball. During the course of this work, data on the first functional ball tofail has also been gathered which could be analyzed to better characterize true operational life forNAND BGAs.
• Alternate Profiles / Mechanisms
Each of the data sets for mirrored NAND in this work show Weibull Betas of ~5; however, datacollected for a -40 to 85C profile shows a distinctly steeper slope, perhaps due to an alternate failuremechanism or increased acceleration. Additional work to understand this potential difference could beinteresting.
24
9000 Virginia Manor Rd Ste 290, Beltsville MD 20705 | 301-474-0607 | www.dfrsolutions.com
Copyright of DfR Solutions 2019
Acknowledgements
• Special thanks to Maxim for detailed support and guidance on FEA analyses and physics of solder fatigue failure.
• Appreciation to Craig whose memorable exclamation of “yay, physics wins again!” -when an FEA analysis correctly identified the cap of buried via design to be susceptible to cracking under excessive design-related stress - was an inspiration as to the fun of figuring out the underlying physical mechanisms for reliability failures.
• Nathan of course as the ‘founding father’ of the Blattau model for solder fatigue failure and for numerous impromptu consults as interesting issues arise.
• David for FEA support and Natalie for patience:^)
• Nisha and Bernhard for understanding.
25

9000 Virginia Manor Rd Ste 290, Beltsville MD 20705 | 301-474-0607 | www.dfrsolutions.com
Copyright of DfR Solutions 2019
Speaker Bio
Ken Symonds, Western Digital
Currently with the Advanced Reliability Engineering (ARE) team at
Western Digital, Ken has leveraged his academic foundation in physics
and material science in over 30 year’s of experience in reliability test
and analysis with emphasis on semiconductor and storage technologies.
Beginning with hands-on failure analysis and investigation of device
physics and wear out mechanisms in semiconductors, Ken has extended
this focus to reliability modeling of Solid State Drives.
Maxim Serebreni, Research Engineer at DfR Solutions
Maxim currently works as a research engineer with DfR
Solutions. He has a background in experimental mechanics,
material characterization and numerical modeling. His
current research involves integration of Pb-free solder
alloys in harsh use environments. He has consulted in the
fields of electronics reliability, electronic packaging design
and solder alloy metallurgy. He is currently completing his
PhD in Mechanical Engineering at the University of
Maryland, College Park under the supervision of Dr.
Patrick McCluskey.
26