IMPORTANT DISCLOSURES APPEAR AT THE BACK OF THIS REPORT 1
Mittel ITALY / Holding
Company update
HOLD (Unchanged) Target: € 2.0 (Prev. 2.2) Risk: High
STOCK DATA
Price € 1.5
Bloomberg code MIT IM
Market Cap. (€ mn) 134
Free Float 33%
Shares Out. (mn) 87.9
52-week range 1.47 - 2.07
Daily Volumes (000) 31.09
PERFORMANCE 1M 3M 12M
Absolute -0.3% -5.9% -12.8%
Rel. to FTSE all shares -0.8% -0.1% -33.3%
MAIN METRICS 2013 2014E 2015E
EPS - € cents -52 -5 -3
DPS ord - € cents 0 0 0
NAV 2013 2014E 2015E
Nav ps ord - € 3.4 2.6 2.6
Listed assets 25% 25% 25%
Controlling 20% 23% 23%
MULTIPLES 2013 2014E 2015E
P/E ord n.m. n.m. n.m.
P/E ord Adj n.m. n.m. n.m.
PBV 0.4 x 0.3 x 0.3 x
INDEBTNESS 2013 2014E 2015E
NFP holding -121.7 -108.1 -107.2
D/E 0.6 0.3 0.3
Debt to assets ratio 0.4 0.4 0.4
PRICE ORD LAST 365 DAYS
ANALYSTS Luigi de Bellis - +39026204375 – [email protected] Alessandro Cecchini - +39026204859 – [email protected] September 3, 2014 # 339
FIRST MAJOR DELEVERAGE DEAL
Mittel (MIT) announced that the controlled company Fashion District
(56.7%) entered into an agreement to dispose the Mantova and
Molfetta outlet stores: this operation will result in an improvement of
MIT’s consolidated NFP by ~€100mn (from -€194mn to -€94mn).
Although the assets’ disposal occurred at slightly lower values than
expected, this operation enables to considerably reduce the group’s
financial leverage as well as the implicit risk profile of the stock. NAV
updated at € 2.6ps (from € 2.9ps). The stock is trading 42% discount
on the NAV vs. 32% for the main Italian holding, partially justified by
higher financial leverage and a more complex holding structure.
� 2 Fashion District’s outlet stores sold to Blackstone fund
Last July 31st 2014, Mittel (MIT) announced that Fashion District (FD – an
indirectly controlled company through a 56.7% stake) entered into an
agreement with a fund managed by Idea Fimit (and fully subscribed by
Blackstone) setting forth the disposal of the two real estate complexes (in
Mantova and Molfetta) as well as the trade licenses of the outlet stores.
The total value of the transaction amounts to € 123.7mn, of which:
• € 103mn for the real estate assets (at 21% discount vs. the book
value and our valuation);
• € 20.7mn for the two trade companies (licenses)
The closing of the deal is expected between October 2nd and the deadline of
December 2014 15th. Thanks to the deal, MIT’s consolidated NFP will
improve by ~ € 100mn, whereas the effect on MIT’s consolidated net profit
is estimated to be ~ € -7mn on FY14 (in terms of deal costs/capital loss net
of tax impact, while in 1H14 the outlet segment closed with a net loss of € -
7.3mn). The implicit valuation of MIT’s interest in Earchimede (which
controls FD through a 66.7% stake) – based on the values of the FD
transaction – is estimated to be around € 79mn vs. our valuation of €
92mn; the mismatch is partly due to the valuation of the real estate assets
and partly to the ongoing loss (2014E).
� NAV updated to € 2.6ps (from 2.9ps). Target € 2.0ps (from 2.2ps)
We have updated the NAV to € 2.6ps (from 2.9ps) in order to factor in
the performance of listed assets and the value attributed to Fashion District
in the sale agreement. Target at € 2.0ps (from € 2.2ps) applying a 25%
discount to the NAV. As far as our estimates are concerned, we have
deconsolidated the contribution from Fashion District and incorporated the
higher expected loss on 2014, in addition to the transaction-related costs.
As a whole, the 2014E net profit moves to € -3.3mn from € -0.4mn, and on
2015E it changes to € -3mn from prev. € -8.3mn. The 2014E consolidated
NFP drops to € -98mn from € -198mn as a result of the FD disposal.
� HOLD recommendation confirmed
We maintain our HOLD view on the stock, since on the positive side:
• The NAV shows a prevalence of unlisted assets, with some quality
names (e.g. Sorin 23% of NAV, Intesa 6% and Moncler 4%).
• The discount on NAV is high: 42% vs. 32% of the main Italian
holdings
offset by the following factors:
• Visibility on the de-leverage process is still low, since it is mostly
linked to i) real estate sales, ii) cash-in of financial receivables
• The stock liquidity is low and the holding structure is complex
Mit tel – September 3, 2014
IMPORTANT DISCLOSURES APPEAR AT THE BACK OF THIS REPORT 2
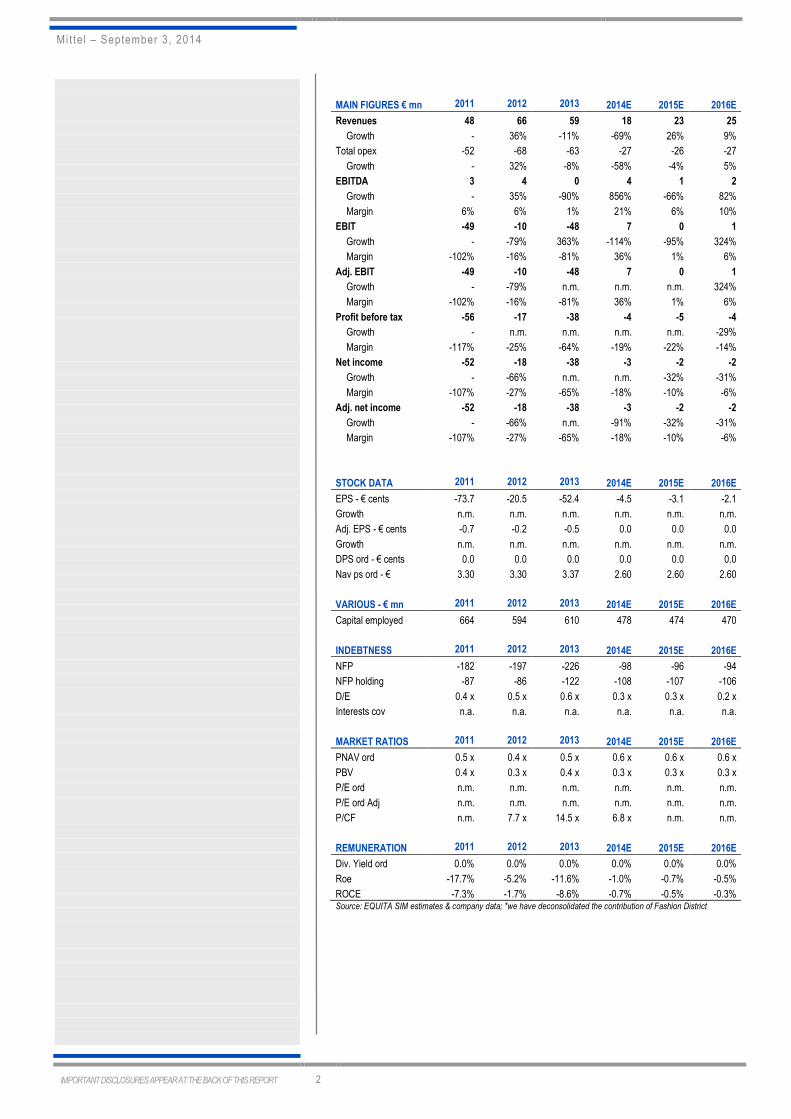
MAIN FIGURES € mn 2011 2012 2013 2014E 2015E 2016E
Revenues 48 66 59 18 23 25
Growth - 36% -11% -69% 26% 9%
Total opex -52 -68 -63 -27 -26 -27
Growth - 32% -8% -58% -4% 5%
EBITDA 3 4 0 4 1 2
Growth - 35% -90% 856% -66% 82%
Margin 6% 6% 1% 21% 6% 10%
EBIT -49 -10 -48 7 0 1
Growth - -79% 363% -114% -95% 324%
Margin -102% -16% -81% 36% 1% 6%
Adj. EBIT -49 -10 -48 7 0 1
Growth - -79% n.m. n.m. n.m. 324%
Margin -102% -16% -81% 36% 1% 6%
Profit before tax -56 -17 -38 -4 -5 -4
Growth - n.m. n.m. n.m. n.m. -29%
Margin -117% -25% -64% -19% -22% -14%
Net income -52 -18 -38 -3 -2 -2
Growth - -66% n.m. n.m. -32% -31%
Margin -107% -27% -65% -18% -10% -6%
Adj. net income -52 -18 -38 -3 -2 -2
Growth - -66% n.m. -91% -32% -31%
Margin -107% -27% -65% -18% -10% -6%
STOCK DATA 2011 2012 2013 2014E 2015E 2016E
EPS - € cents -73.7 -20.5 -52.4 -4.5 -3.1 -2.1
Growth n.m. n.m. n.m. n.m. n.m. n.m.
Adj. EPS - € cents -0.7 -0.2 -0.5 0.0 0.0 0.0
Growth n.m. n.m. n.m. n.m. n.m. n.m.
DPS ord - € cents 0.0 0.0 0.0 0.0 0.0 0.0
Nav ps ord - € 3.30 3.30 3.37 2.60 2.60 2.60
VARIOUS - € mn 2011 2012 2013 2014E 2015E 2016E
Capital employed 664 594 610 478 474 470
INDEBTNESS 2011 2012 2013 2014E 2015E 2016E
NFP -182 -197 -226 -98 -96 -94
NFP holding -87 -86 -122 -108 -107 -106
D/E 0.4 x 0.5 x 0.6 x 0.3 x 0.3 x 0.2 x
Interests cov n.a. n.a. n.a. n.a. n.a. n.a.
MARKET RATIOS 2011 2012 2013 2014E 2015E 2016E
PNAV ord 0.5 x 0.4 x 0.5 x 0.6 x 0.6 x 0.6 x
PBV 0.4 x 0.3 x 0.4 x 0.3 x 0.3 x 0.3 x
P/E ord n.m. n.m. n.m. n.m. n.m. n.m.
P/E ord Adj n.m. n.m. n.m. n.m. n.m. n.m.
P/CF n.m. 7.7 x 14.5 x 6.8 x n.m. n.m.
REMUNERATION 2011 2012 2013 2014E 2015E 2016E
Div. Yield ord 0.0% 0.0% 0.0% 0.0% 0.0% 0.0%
Roe -17.7% -5.2% -11.6% -1.0% -0.7% -0.5%
ROCE -7.3% -1.7% -8.6% -0.7% -0.5% -0.3% Source: EQUITA SIM estimates & company data; *we have deconsolidated the contribution of Fashion District

Mit tel – September 3, 2014
IMPORTANT DISCLOSURES APPEAR AT THE BACK OF THIS REPORT 3
NAV BUSINESS SEGMENTATION - 2013
Banking5%
Financial serv ices
3%Property
5%
Lux ury Motor Yachts
4%
Other65%
Treasury shares5%
Outlet13%
CONTROLLING STAKE - 2013
Controlling 23%
Relev ant11%
Minorities66%
NAV & DISCOUNT
-30%
-20%
-10%
0%
10%
20%
30%
40%
50%
60%
70%
80%
0.0
1.0
2.0
3.0
4.0
5.0
6.0
7.0
8.0
9.0
10.0 NAV PS Discount Historical Average
UN / LISTED ASSETS WEIGHT
Listed Assets25%
Unlisted Assets75%
BUSINESS DESCRIPTION
Mittel is active in the following sectors:
• Investments and Private Equity; MIT invests in the capital of listed
and non-listed companies directly or indirectly via specialised closed
end funds, with the aim of enhancing value in the medium term. In more
detail:
- Investments in listed companies: Intesa SanPaolo (0.1% stake),
Ubi Banca (0.2% stake), RCS (1.1% stake), Sorin (10.2% through
Tower 6 Bis and Bios) and Moncler (0.3% stake)
- Investments in non-listed companies: Azimut-Benetti (5.5%
stake) and Istituto Atesino di Sviluppo (1.7%);
- Participations in PE management companies: Progressio SGR
(15%);
- Stakes in PE funds: Equinox 2, Progressio Investimenti I & II etc.
Management aims to increase this activity and exposure to Private Equity
Management in the medium term. In this regard, MIT and Roland Berger
Strategy Consultants have recently signed a partnership aimed at
launching a PE fund (named “Rexelera”) focused on Restructuring and
Turnaround of Italian manufacturing companies.
• Advisory and Grant Finance: main services:
- Investment Banking activities (i.e. M&A, DCM, ECM);
- Debt Advisory and Restructuring;
- Grant Finance – assistance to obtain grant financing for research,
development or other initiatives.
• Outlet business: Mittel, via Fashion District Group (56.6% stake),
manages three Factory Outlet Centers in Mantova, Molfetta and
Valmontone.
• In the Real Estate sector, Mittel operates in the following businesses:
- Property development or redevelopment via the group Mittel
Investimenti Immobiliari, focusing mainly on mid-level
residential/tertiary real estate deals in Lombardy;
- Participations in Real Estate management companies and PE
funds: The company owns a stake in Mittel Real Estate SGR (35%)
and Castello SGR (21.3%) and interests in some funds managed by
the latter.
Mit tel – September 3, 2014
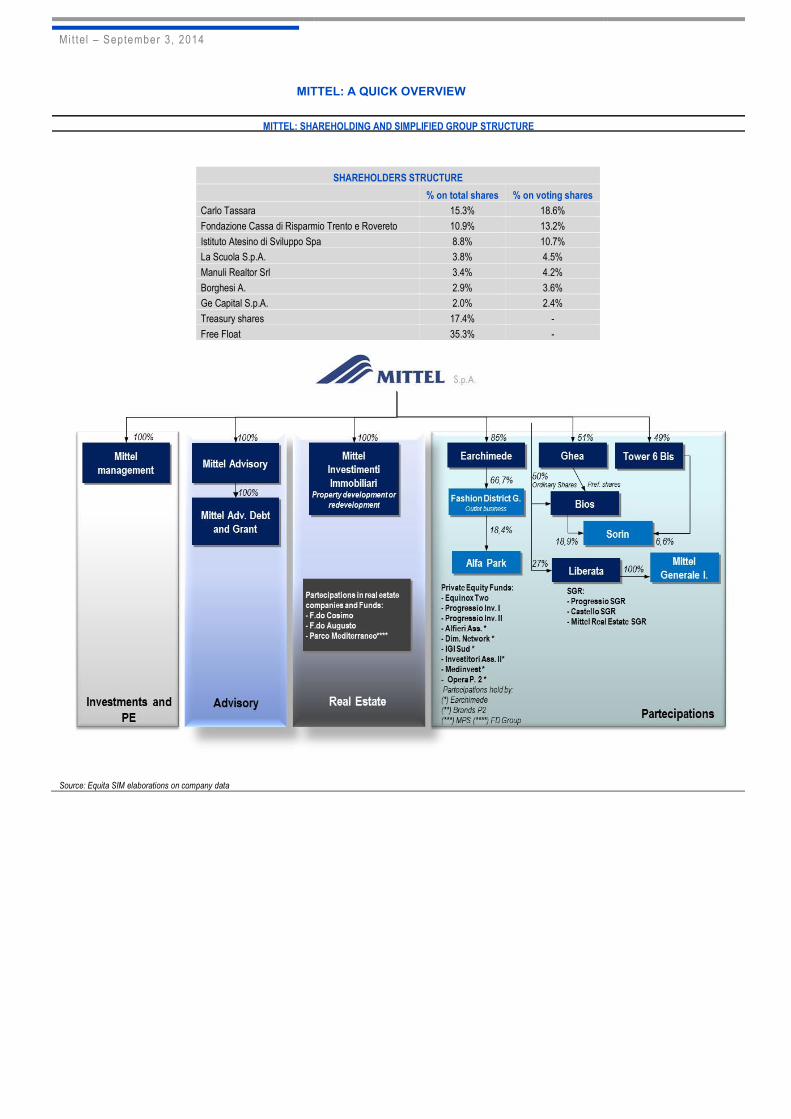
MITTEL: A QUICK OVERVIEW
MITTEL: SHAREHOLDING AND SIMPLIFIED GROUP STRUCTURE
Source: Equita SIM elaborations on company data
SHAREHOLDERS STRUCTURE
% on total shares % on voting shares
Carlo Tassara 15.3% 18.6%
Fondazione Cassa di Risparmio Trento e Rovereto 10.9% 13.2%
Istituto Atesino di Sviluppo Spa 8.8% 10.7%
La Scuola S.p.A. 3.8% 4.5%
Manuli Realtor Srl 3.4% 4.2%
Borghesi A. 2.9% 3.6%
Ge Capital S.p.A. 2.0% 2.4%
Treasury shares 17.4% -
Free Float 35.3% -
Mit tel – September 3, 2014
IMPORTANT DISCLOSURES APPEAR AT THE BACK OF THIS REPORT 5
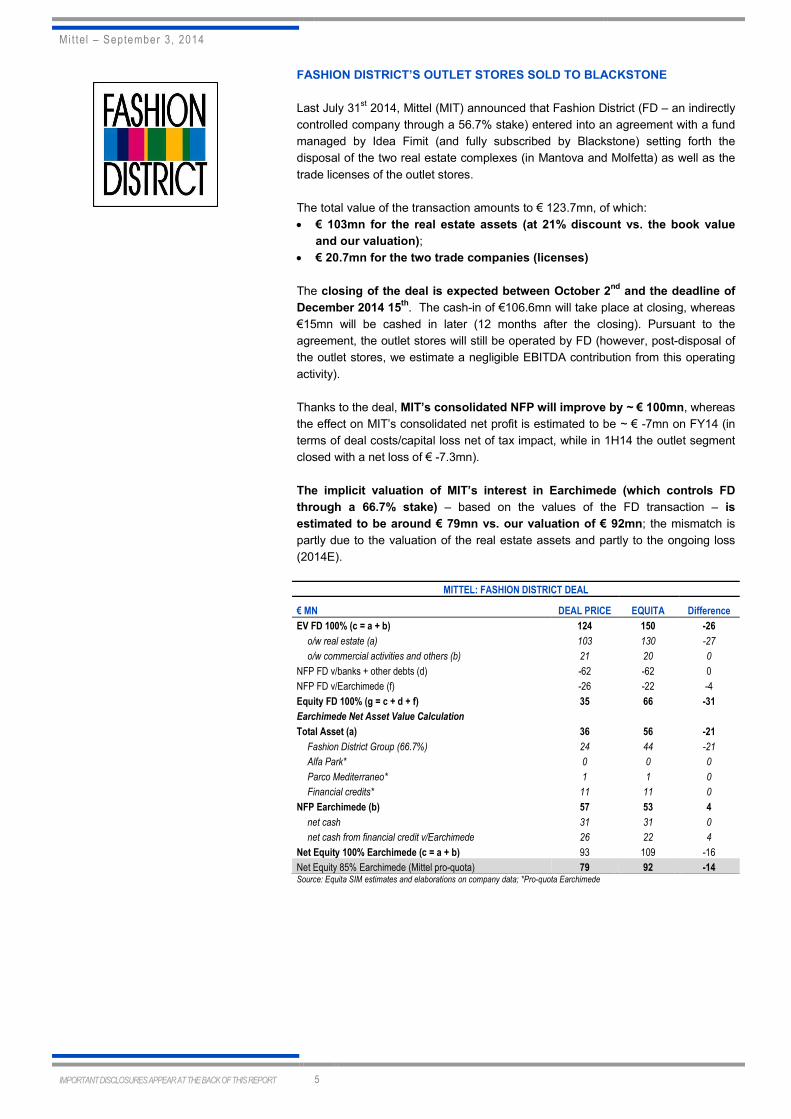
FASHION DISTRICT’S OUTLET STORES SOLD TO BLACKSTONE
Last July 31st 2014, Mittel (MIT) announced that Fashion District (FD – an indirectly
controlled company through a 56.7% stake) entered into an agreement with a fund
managed by Idea Fimit (and fully subscribed by Blackstone) setting forth the
disposal of the two real estate complexes (in Mantova and Molfetta) as well as the
trade licenses of the outlet stores.
The total value of the transaction amounts to € 123.7mn, of which:
• € 103mn for the real estate assets (at 21% discount vs. the book value
and our valuation);
• € 20.7mn for the two trade companies (licenses)
The closing of the deal is expected between October 2nd and the deadline of
December 2014 15th. The cash-in of €106.6mn will take place at closing, whereas
€15mn will be cashed in later (12 months after the closing). Pursuant to the
agreement, the outlet stores will still be operated by FD (however, post-disposal of
the outlet stores, we estimate a negligible EBITDA contribution from this operating
activity).
Thanks to the deal, MIT’s consolidated NFP will improve by ~ € 100mn, whereas
the effect on MIT’s consolidated net profit is estimated to be ~ € -7mn on FY14 (in
terms of deal costs/capital loss net of tax impact, while in 1H14 the outlet segment
closed with a net loss of € -7.3mn).
The implicit valuation of MIT’s interest in Earchimede (which controls FD
through a 66.7% stake) – based on the values of the FD transaction – is
estimated to be around € 79mn vs. our valuation of € 92mn; the mismatch is
partly due to the valuation of the real estate assets and partly to the ongoing loss
(2014E).
MITTEL: FASHION DISTRICT DEAL
€ MN DEAL PRICE EQUITA Difference
EV FD 100% (c = a + b) 124 150 -26
o/w real estate (a) 103 130 -27
o/w commercial activities and others (b) 21 20 0
NFP FD v/banks + other debts (d) -62 -62 0
NFP FD v/Earchimede (f) -26 -22 -4
Equity FD 100% (g = c + d + f) 35 66 -31
Earchimede Net Asset Value Calculation Total Asset (a) 36 56 -21
Fashion District Group (66.7%) 24 44 -21
Alfa Park* 0 0 0
Parco Mediterraneo* 1 1 0
Financial credits* 11 11 0
NFP Earchimede (b) 57 53 4
net cash 31 31 0
net cash from financial credit v/Earchimede 26 22 4
Net Equity 100% Earchimede (c = a + b) 93 109 -16
Net Equity 85% Earchimede (Mittel pro-quota) 79 92 -14 Source: Equita SIM estimates and elaborations on company data; *Pro-quota Earchimede

Mit tel – September 3, 2014
IMPORTANT DISCLOSURES APPEAR AT THE BACK OF THIS REPORT 6
MITTEL 9M14 RESULTS
• Revenues = €41.6mn (-4.4% YoY) vs. €39.5mn expected;
• EBITDA = €11.7mn (from € 1.2mn) vs. €3.5mn exp.;
• Net Income = €4.3mn (from €-15.8mn) vs. €-3.0mn exp.;
• Consolidated NFP = €-194.3mn (from €-191.6mn in 2Q14 and €-226mn
FY13) vs. €-192mn exp..
MITTEL: CONSOLIDATED RESULTS (€mn)
3Q13 3Q14 3Q14 Change 9M13 9M14 9M14
Exp. Actual act/exp Exp. Actual
Revenues 14.0 13.8 15.8 14.6% 43.6 39.6 41.6
change YoY - -0.9% 13.5% - -9.1% -4.4%
Operating Costs -13.9 -13.7 -12.6 -45.8 -43.1 -42.0
Income (loss) from partecipations 1.6 0.5 5.6 3.6 7.1 12.1
EBITDA 1.7 0.6 8.8 1305.6% 1.2 3.5 11.7
change YoY - -63% n.m. - n.m. n.m.
EBIT -6.7 -2.4 5.1 -308.3% -15.9 -4.9 2.6
change YoY - n.m. n.m. - n.m. n.m.
Pre-Tax -5.9 -3.7 2.3 -163.0% -16.6 -10.2 -4.1
change YoY - n.m. n.m. - n.m. n.m.
Group Net Income -6.5 -3.2 4.1 -227.8% -15.8 -3.1 4.3
change YoY - n.m. n.m. - n.m. n.m.
NFP Consolidated -181.9 -191.8 -194.3 1.3% -181.9 -191.8 -194.3 Source: EQUITA SIM estimates and company data
9M14 results were helped by the income arising from equity holdings (€ 12.1mn),
i.e. dividends (€ 6.3mn) and profit ensuing from the partial disposal of listed stocks
in the portfolio (€ 5.8mn). These numbers were largely offset by negative
adjustments of financial assets and receivables (€ 18.1mn).
More in detail:
• Revenues = € 41.6mn (-4.4% YoY) vs. € 39.6mn expected. Total sales
slightly decreased YoY, but their quality is better thanks to a higher
contribution from “Core revenues” (€ 41.0 vs. €30.6mn in 9M13) as a result of
the acceleration in the selling process of real estate assets (€ 11.3mn vs. €
1.9mn in 9M13).
MITTEL - 9M SALES BREAKDOWN
9M13 9M14 ∆ YoY
Total Sales 43.6 41.6 -2.0
- Core revenues 30.6 41.0 10.4
- Proceeds from partecipations 2.4 6.1 3.7
- ∆ Real Estate inventories 10.6 -5.5 -16.1 Source: Company data
• EBITDA = € 11.7mn (from € 1.2mn in 9M13) vs. € 3.5mn expected. The
YoY increase mainly ensued from the following: 1) decreasing costs of
procurement mainly resulting from the lower building activity in the Real
Estate sector, due to the completion of some initiatives; 2) higher income from
equity holdings (€ 12.1mn vs. € 3.6mn in 9M13) ensuing from sustained
dividends (€ 6.3mn mostly linked to the dividend pay-out of the Progressio
Fund) and from the profit arising from the partial disposal of listed stocks in
the portfolio (~ € 5.8mn, UBI and Intesa SanPaolo).
These factors largely offset an increase in the costs for services (€ 27.5mn vs.
€ 24.2mn in 9M13) due to the costs linked to the termination of the agreement
with the former CEO A. Borghesi (€ 3.3mn in total).
• Write-downs of equity holdings = € 18.1mn (vs. € 6.6mn in 9M13). More in
detail, adjustments concerned the following: 1) outlet segment: € 9.4mn
mainly related to the total write-down of the stake held in Alfa Park (€ 6.5mn)
due to the persisting negative performance of theme parks, 2) Mittel SpA: €

Mit tel – September 3, 2014
IMPORTANT DISCLOSURES APPEAR AT THE BACK OF THIS REPORT 7
6.5mn above all due to the impairment on the stake held in Azimut Benetti (€
6.2mn) following the deterioration of consolidated results (e.g. “Milano
Finanza” of August 26th reports FY13 EBITDA of € 10mn vs. € 23mn in FY12)
and 3) Private Equity Funds: € 1.6mn. The € 18.1mn of write-downs reported
in 1H14 does not include the effects of Fashion District deal (i.e. ~ € -7mn on
FY14).
• Net profit = € 4.3mn (from € -15.8mn) vs. € -3.0mn expected. It mostly
benefited from the pro-quota results of Brand Partners 2 (€ 25.7mn) linked to
the selling process of the stake in Moncler.
• Consolidated NFP = € -194.3mn (from € -191.6mn in 2Q14 and € -226mn
in FY13) vs. € -192mn expected. The improvement vs. FY13 results was
mainly the result of Moncler’s sale in 1Q14 (some € 23mn).
MITTEL - CONSOLIDATED NFP (€ mn)
FY13 9M14 ∆ YoY
Current Liquidity 66.4 62.0 -4.4
Current Financial Credits 30.6 29.1 -1.5
Total Assets 97.0 91.1 -5.9
Bank debt -210.7 -173.1 -37.6
Bond -97.4 -99.3 1.9
Other financial debts -15.3 -12.0 -3.2
Total Liabilities -323.4 -284.4 -39.0
NFP -226.4 -193.4 -33.0 Source: Company data
� SORIN (29% of NAV): Results below expectations but investment case
unchanged
SORIN’s 1H14 results showed some top-line growth, albeit lower than
expected. In particular, in 1H14 Sorin generated revenues for € 336.9mn, with a
+3.1% LFL YoY or +0.1% YoY reported.
SORIN 2Q AND 1H RESULTS (€ mn)
QUARTERLY FIGURES EXPECTED ACTUAL
2Q13 2Q14E YoY ∆% 2Q14A YoY ∆% Abs ∆
Revenues 187.7 188.2 0% 190.6 2% 2
EBITDA 31.2 29.2 -6% 28.6 -8% -1
Margin 16.6 15.5 15.0 -1
EBIT 19.8 15.2 -23% 15.8 -20% 1
Net income 14.2 10.5 -26% 10.0 -30% 0
NFP -90.9 -87.0 -4% -109.4 20% -22
CUMULATED FIGURES EXPECTED ACTUAL
1H13 1H14E YoY ∆% 1H14A YoY ∆% Abs ∆
Revenues 366.4 364.5 -1% 366.9 0% 2
EBITDA 57.5 56.0 -3% 55.4 -4% -1
Margin 15.7 15.4 15.1 0
EBIT 28.5 29.4 3% 30.0 5% 1
Net income 19.2 20.3 6% 19.8 3% 0
NFP -90.9 -87.0 -4% -109.4 20% -22 Source: Equita SIM estimates & Company data
The revenues guidance on FY14 projects a LFL growth between +3/+5% vs.
+3.1% in 1H14; a +2/+4% improvement is expected in 3Q14 and some
acceleration in 4Q14 (which should benefit from the progress in Japan and CRM in
general for product innovation).
EBITDA in 1H14 reached € 55.4mn, with a 15.1% margin, slightly lower than the €
57.5mn in 1H13 (15.7% margin), as a result of the unfavourable impact of FX rates
as well as ongoing investments in New Ventures.
Mit tel – September 3, 2014
IMPORTANT DISCLOSURES APPEAR AT THE BACK OF THIS REPORT 8
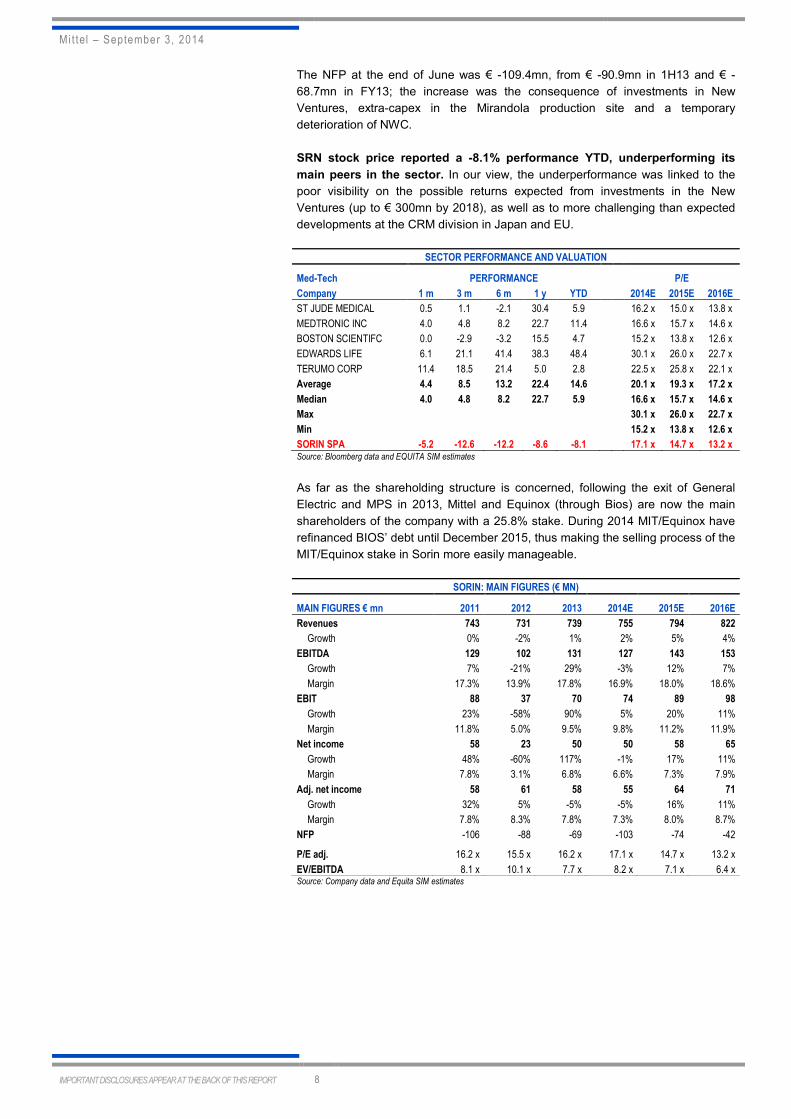
The NFP at the end of June was € -109.4mn, from € -90.9mn in 1H13 and € -
68.7mn in FY13; the increase was the consequence of investments in New
Ventures, extra-capex in the Mirandola production site and a temporary
deterioration of NWC.
SRN stock price reported a -8.1% performance YTD, underperforming its
main peers in the sector. In our view, the underperformance was linked to the
poor visibility on the possible returns expected from investments in the New
Ventures (up to € 300mn by 2018), as well as to more challenging than expected
developments at the CRM division in Japan and EU.
SECTOR PERFORMANCE AND VALUATION
Med-Tech PERFORMANCE P/E
Company 1 m 3 m 6 m 1 y YTD 2014E 2015E 2016E
ST JUDE MEDICAL 0.5 1.1 -2.1 30.4 5.9
16.2 x 15.0 x 13.8 x
MEDTRONIC INC 4.0 4.8 8.2 22.7 11.4
16.6 x 15.7 x 14.6 x
BOSTON SCIENTIFC 0.0 -2.9 -3.2 15.5 4.7
15.2 x 13.8 x 12.6 x
EDWARDS LIFE 6.1 21.1 41.4 38.3 48.4
30.1 x 26.0 x 22.7 x
TERUMO CORP 11.4 18.5 21.4 5.0 2.8
22.5 x 25.8 x 22.1 x
Average 4.4 8.5 13.2 22.4 14.6 20.1 x 19.3 x 17.2 x
Median 4.0 4.8 8.2 22.7 5.9 16.6 x 15.7 x 14.6 x
Max 30.1 x 26.0 x 22.7 x
Min 15.2 x 13.8 x 12.6 x
SORIN SPA -5.2 -12.6 -12.2 -8.6 -8.1 17.1 x 14.7 x 13.2 x Source: Bloomberg data and EQUITA SIM estimates
As far as the shareholding structure is concerned, following the exit of General
Electric and MPS in 2013, Mittel and Equinox (through Bios) are now the main
shareholders of the company with a 25.8% stake. During 2014 MIT/Equinox have
refinanced BIOS’ debt until December 2015, thus making the selling process of the
MIT/Equinox stake in Sorin more easily manageable.
SORIN: MAIN FIGURES (€ MN)
MAIN FIGURES € mn 2011 2012 2013 2014E 2015E 2016E
Revenues 743 731 739 755 794 822
Growth 0% -2% 1% 2% 5% 4%
EBITDA 129 102 131 127 143 153
Growth 7% -21% 29% -3% 12% 7%
Margin 17.3% 13.9% 17.8% 16.9% 18.0% 18.6%
EBIT 88 37 70 74 89 98
Growth 23% -58% 90% 5% 20% 11%
Margin 11.8% 5.0% 9.5% 9.8% 11.2% 11.9%
Net income 58 23 50 50 58 65
Growth 48% -60% 117% -1% 17% 11%
Margin 7.8% 3.1% 6.8% 6.6% 7.3% 7.9%
Adj. net income 58 61 58 55 64 71
Growth 32% 5% -5% -5% 16% 11%
Margin 7.8% 8.3% 7.8% 7.3% 8.0% 8.7%
NFP -106 -88 -69 -103 -74 -42
P/E adj. 16.2 x 15.5 x 16.2 x 17.1 x 14.7 x 13.2 x
EV/EBITDA 8.1 x 10.1 x 7.7 x 8.2 x 7.1 x 6.4 x Source: Company data and Equita SIM estimates
Mit tel – September 3, 2014
IMPORTANT DISCLOSURES APPEAR AT THE BACK OF THIS REPORT 9
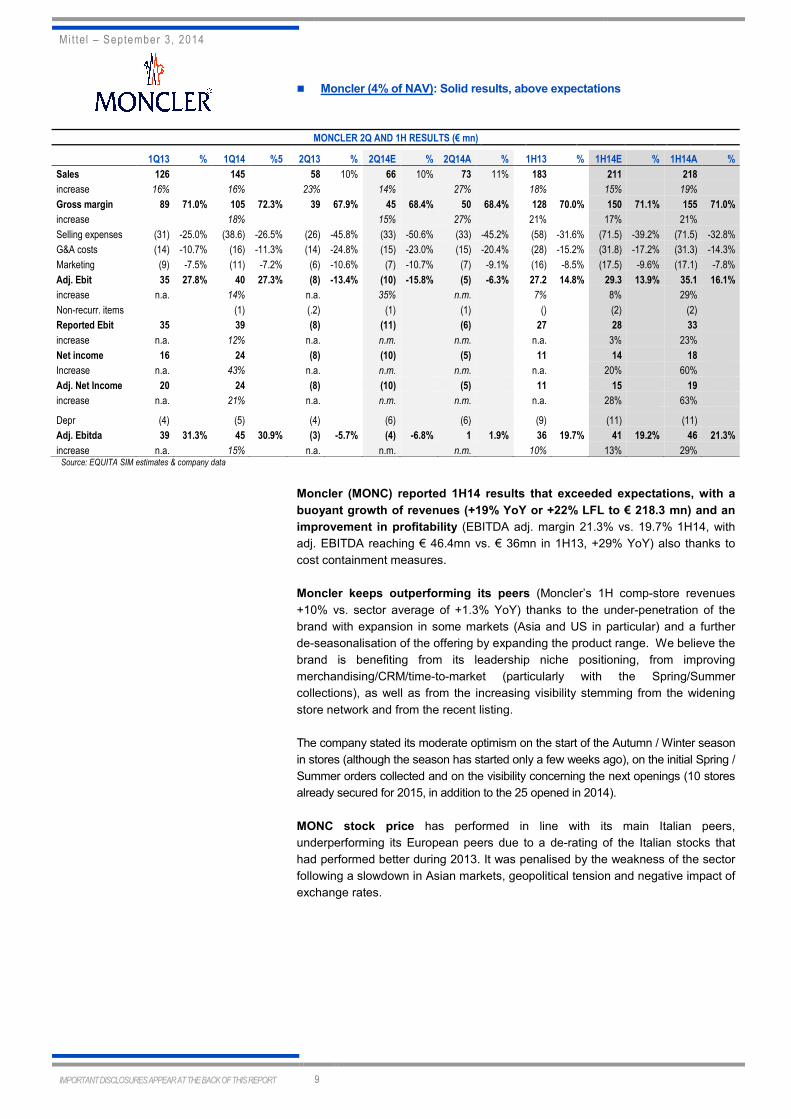
� Moncler (4% of NAV): Solid results, above expectations
MONCLER 2Q AND 1H RESULTS (€ mn)
1Q13 % 1Q14 %5 2Q13 % 2Q14E % 2Q14A % 1H13 % 1H14E % 1H14A %
Sales 126 145 58 10% 66 10% 73 11% 183 211 218
increase 16% 16% 23% 14% 27% 18% 15% 19%
Gross margin 89 71.0% 105 72.3% 39 67.9% 45 68.4% 50 68.4% 128 70.0% 150 71.1% 155 71.0%
increase 18% 15% 27% 21% 17% 21%
Selling expenses (31) -25.0% (38.6) -26.5% (26) -45.8% (33) -50.6% (33) -45.2% (58) -31.6% (71.5) -39.2% (71.5) -32.8%
G&A costs (14) -10.7% (16) -11.3% (14) -24.8% (15) -23.0% (15) -20.4% (28) -15.2% (31.8) -17.2% (31.3) -14.3%
Marketing (9) -7.5% (11) -7.2% (6) -10.6% (7) -10.7% (7) -9.1% (16) -8.5% (17.5) -9.6% (17.1) -7.8%
Adj. Ebit 35 27.8% 40 27.3% (8) -13.4% (10) -15.8% (5) -6.3% 27.2 14.8% 29.3 13.9% 35.1 16.1%
increase n.a. 14% n.a. 35% n.m. 7% 8% 29%
Non-recurr. items (1) (.2) (1) (1) () (2) (2)
Reported Ebit 35 39 (8) (11) (6) 27 28 33
increase n.a. 12% n.a. n.m. n.m. n.a. 3% 23%
Net income 16 24 (8) (10) (5) 11 14 18
Increase n.a. 43% n.a. n.m. n.m. n.a. 20% 60%
Adj. Net Income 20 24 (8) (10) (5) 11 15 19
increase n.a. 21% n.a. n.m. n.m. n.a. 28% 63%
Depr (4) (5) (4) (6) (6) (9) (11) (11)
Adj. Ebitda 39 31.3% 45 30.9% (3) -5.7% (4) -6.8% 1 1.9% 36 19.7% 41 19.2% 46 21.3%
increase n.a. 15% n.a. n.m. n.m. 10% 13% 29% Source: EQUITA SIM estimates & company data
Moncler (MONC) reported 1H14 results that exceeded expectations, with a
buoyant growth of revenues (+19% YoY or +22% LFL to € 218.3 mn) and an
improvement in profitability (EBITDA adj. margin 21.3% vs. 19.7% 1H14, with
adj. EBITDA reaching € 46.4mn vs. € 36mn in 1H13, +29% YoY) also thanks to
cost containment measures.
Moncler keeps outperforming its peers (Moncler’s 1H comp-store revenues
+10% vs. sector average of +1.3% YoY) thanks to the under-penetration of the
brand with expansion in some markets (Asia and US in particular) and a further
de-seasonalisation of the offering by expanding the product range. We believe the
brand is benefiting from its leadership niche positioning, from improving
merchandising/CRM/time-to-market (particularly with the Spring/Summer
collections), as well as from the increasing visibility stemming from the widening
store network and from the recent listing.
The company stated its moderate optimism on the start of the Autumn / Winter season
in stores (although the season has started only a few weeks ago), on the initial Spring /
Summer orders collected and on the visibility concerning the next openings (10 stores
already secured for 2015, in addition to the 25 opened in 2014).
MONC stock price has performed in line with its main Italian peers,
underperforming its European peers due to a de-rating of the Italian stocks that
had performed better during 2013. It was penalised by the weakness of the sector
following a slowdown in Asian markets, geopolitical tension and negative impact of
exchange rates.

Mit tel – September 3, 2014
IMPORTANT DISCLOSURES APPEAR AT THE BACK OF THIS REPORT 10
SECTOR PERFORMANCE AND VALUATION
Luxury PERFORMANCE P/E
Company 1 m 3 m 6 m 1 y YTD 2014E 2015E 2016E
HERMES 1% 1% 12% 7% -1%
31.8 x 28.3 x 25.1 x
BRUNELLO CUCINELLI 7% -2% -9% -14% -28%
37.6 x 34.2 x 30.3 x
LVMH 0% -9% -2% -1% -1%
19.4 x 17.5 x 15.7 x
RICHEMONT 0% -7% 0% 0% -1%
18.3 x 16.2 x 14.5 x
TIFFANY 3% 4% 9% 32% 10%
23.4 x 20.7 x 18.1 x
BURBERRY 0% -6% -7% -7% -6% 18.9 x 17.2 x 14.9 x
KERING (LUXURY) 5% 0% 8% -7% 4% 16.1 x 14.3 x 13.1 x
SWATCH 2% -5% -14% -7% -15% 17.1 x 15.2 x 13.7 x
TOD'S -3% -16% -16% -38% -32% 20.7 x 18.9 x 17.3 x
PRADA 0% -7% -8% -28% -22% 23.4 x 21.3 x 18.9 x
FERRAGAMO -5% -9% -11% -14% -25% 21.7 x 19.2 x 17.1 x
Average 1% -5% -4% -7% -11% 22.6 x 20.3 x 18.1 x
Median 0% -6% -7% -7% -6% 20.7 x 18.9 x 17.1 x
Max 37.6 x 34.2 x 30.3 x
Min 16.1 x 14.3 x 13.1 x
MONCLER 0% -11% -10% n.a. -25% 25.3 x 20.7 x 17.6 x Source: Bloomberg data and EQUITA SIM estimates
MONCLER: MAIN FIGURES (€ MN)
MAIN FIGURES € mn 2011 2012 2013 2014E 2015E 2016E
Revenues 364 489 581 679 791 896
Growth 29% 34% 19% 17% 16% 13%
Adj. EBITDA 114 162 192 223 263 303
Growth 26% 41% 19% 16% 18% 15%
Margin 31.5% 33.0% 33.0% 32.8% 33.3% 33.8%
EBIT 102 146 166 195 229 263
Growth 20% 43% 14% 17% 18% 15%
Margin 28.0% 29.8% 28.7% 28.7% 29.0% 29.3%
Net income 56 82 92 117 144 170
Growth - 47% 12% 28% 23% 18%
Margin 15.4% 16.9% 15.9% 17.3% 18.2% 19.0%
Adj. net income 58 82 96 120 147 173
Growth - 43% 17% 25% 22% 18%
Margin 15.9% 16.9% 16.6% 17.7% 18.5% 19.3%
NFP -270 -229 -171 -123 -53 51
P/E adj. 44.2 x 30.9 x 31.4 x 25.3 x 20.7 x 17.6 x
EV/EBITDA 25.3 x 17.2 x 17.2 x 14.4 x 11.9 x 9.9 x Source: Company data and Equita SIM estimates

Mit tel – September 3, 2014
IMPORTANT DISCLOSURES APPEAR AT THE BACK OF THIS REPORT 11
VALUATION: UPDATED NAV TO € 2.6ps (from prev. 2.9ps)
We have updated the NAV to € 2.6ps (from 2.9ps) in order to factor in the
performance of listed assets and the value attributed to Fashion District in the sale
agreement. In particular the NAV moves to 2.6ps (from 2.9) mostly as a result of
the update of the listed assets performance (€ -19mn or € -0.2ps mainly due to the
negative performance posted by Sorin) and of the lower valuation of Fashion
District (€ -17mn or € -0.15ps), partly offset by other minor adjustments post 3Q14
results. Target at € 2.0ps (from € 2.2ps) applying a 25% discount to the NAV.
As far as our estimates are concerned, we have deconsolidated the contribution
from Fashion District and incorporated the higher expected loss on 2014, in
addition to the transaction-related costs. As a whole, the 2014E net profit moves to
€ -3.3mn from € -0.4mn, and on 2015E it changes to € -3mn from prev. € -8.3mn.
The 2014E consolidated NFP drops to € -98mn from € -198mn as a result of
the FD disposal.
MITTEL - NAV
Asset Sector Stake % #
shares €
PS €
mn % Valuation method
Intesa Sanpaolo Banking 0.04% 6.2 2.3 15 6% Market Value
UBI Banca ScpA Banking 0.20% 1.8 6.1 11 5% Market Value
RCS Media Group SpA Media 1.33% 5.6 1.1 6 3% Market Value
Sorin* Biomedical 12.7% 60.9 1.9 53 23% Net equity (Market Value)
Moncler Fashion 0.3% 0.8 11.9 9 4% Market Value
Mittel Treasury shares 17.4% 15.3 1.5 23 10% Market Value
TOTAL LISTED SHAREHOLDINGS (1) 118 51%
Mittel Generale Investimenti (Liberata spa) Financial Services 27% 2 1% M&A deal - P/BV 0.9x
Mittel Investimenti Immobiliare (Property Assets) Real Estate 100% 22 10% Book Value June-14
Property Assets Valuation Real Estate 100% 115 50% Book Value June-14
Attributable NFP MII Real Estate 100% -93 -40% As of June-14
Earchimede Holding 85.0% 79 34% -
Fashion District Group/Alfa Park/Parco Med. Outlet 56.1% 30 13% Deal value @July 2014 for FD, BV for the other stakes
NFP Earchimede Holding 85.0% 48 21% Estimated at deal value
Funds (i.e Progressio I/II, Cosimo I, Augusto, Equinox) PE and RE Funds n.m. 45 19% Book Value June-14
Azimut-Benetti Luxury Motor Yachts 6.21%** 19 8% EV/EBITDA 2014E = 12x
Istituto Atesino di Sviluppo S.p.A. Holding 1.7% 3 1% Book Value June-14
Mittel Advisory*** Financial Services 100% 7 3% Book Value June-14 (impl. P/E 2014E = 9x)
Progressio SGR Financial Services 15% 1 0% Book Value June-14
Castello SGR Real Estate 21% 4 2% P/E 2013E = 12x, P/AUM = ~1.5%
Microventures Financial Services 15.0% 4 2% Book Value June-14
Financial credits Mittel SpA (st/lt) Miscellaneous n.m. 158 69% Equita SIM estimates and Company data
Others partecipations and other assets/liabilities Miscellaneous 100.0% 18 8% Equita SIM estimates and Company data
TOTAL UNLISTED SHAREHOLDINGS (2) 360 157%
ATTRIBUTABLE NFP (3) -191 -84% Adj. NFP as today (Financial debt – cash)
HOLDING COSTS (4) -58 -26% Normalised cash costs net of taxes capitalised @ 10%
TAXES ON POTENTIAL CAPITAL GAINS (5) 0 0%
STOCK OPTIONS DILUTION (6) 0 0%
TOTAL NET ASSET VALUE (1+2+3+4+5+6) 229 100%
Nr. of Shares (mn) 87.9
NAV per Ord share € 2.6
Current discount (premium) 42%
P/NAV 0.58
Source: EQUITA SIM estimates * via Tower 6 Bis, Bios and Ghea; ** considering treasury shares; *** including Mittel Advisory and Mittel Advisory Debt and Grant.

Mit tel – September 3, 2014
IMPORTANT DISCLOSURES APPEAR AT THE BACK OF THIS REPORT 12
SECTOR AND STOCK PERFORMANCE
MIT reported a -12.6% negative performance YTD, underperforming both the
FTSEMIB index by 22% and the LPX50 index by 19%. The stock also
underperformed the main listed Italian holdings, which reported a +4% positive
performance YTD.
ITALIAN HOLDING COMPANIES: STOCK PERFORMANCE
DESCRIPTION PERFORMANCE
Company Currency Price Mkt cap (€ mn) 1 m 3 m 6 m 1 y YTD
ASTM SPA EUR 10.5 921 -5.1 -9.5 -12.7 16.6 -8.8
CIR SPA EUR 1.1 857 3.8 -5.6 -2.7 1.5 -6.4
COFIDE SPA EUR 0.5 378 3.6 -1.9 -6.5 -0.1 -7.1
DEA CAPITAL SPA EUR 1.4 442 8.4 -0.7 19.0 14.3 16.5
EXOR EUR 30.0 7,377 7.2 -1.6 8.9 18.1 6.1
IMMSI SPA EUR 0.6 211 -0.2 -19.3 25.1 46.5 31.5
ITALMOBILIARE EUR 29.5 949 0.9 -10.0 -3.0 58.2 15.1
MEDIOBANCA EUR 6.9 5,901 0.9 -9.0 -5.5 38.9 4.2
VIANINI LAVORI EUR 5.3 232 4.2 -5.9 -6.1 53.6 2.8
MITTEL SPA EUR 1.5 134 -0.7 -6.2 -9.3 -13.1 -12.6
Average 2.3 -7.0 0.7 23.5 4.1
Median 2.2 -6.1 -4.2 17.4 3.5
FTSE MIB INDEX
2.0 -4.1 5.1 22.6 9.5 LPX50 Listed PE EUR TR
4.0 3.6 5.4 18.9 6.4 Source:Bloomberg prices
We think the stock was impacted by the uncertainty arising as a result of the
resignation of the Board in January 2014 following an irremediable rift (probably
ensuing from a different strategic view on the company) created within the BoD
with the former CEO Borghesi.
As of today no new CEO has been appointed, and strategic decisions (e.g.
disposals, acquisitions) are still being taken by the Executive Committee that
keeps meeting regularly.
Furthermore, there is still uncertainty on the future of the 15.3% stake held by
Zaleski’s Tassara, which is selling its holdings as required by the creditor banks.
As far as listed assets are concerned (51% of NAV), the excellent performance
booked by the banking holdings (Intesa and UBI +29% and +24% YTD
respectively) was offset by the soft performance reported by Sorin and Moncler (-
8% and -24% YTD respectively) in spite of good operating results.
PERFORMANCE OF LISTED ASSETS
DESCRIPTION PERFORMANCE
Mittel listed assets % of NAV Currency Price Mkt cap (€ mn) 1 m 3 m 6 m 1 y YTD
INTESA SANPAOLO 6% EUR 2.3 37,922 2.8 -5.2 7.7 51.7 29.4
UBI BANCA SCPA 5% EUR 6.1 5,510 -0.9 -11.6 2.3 64.2 23.8
RCS MEDIAGROUP 3% EUR 1.2 605 0.9 -22.5 -22.0 2.0 -12.1
SORIN SPA 25% EUR 1.9 912 -5.2 -12.6 -12.2 -8.6 -8.1
MONCLER SPA 4% EUR 12.0 2,995 7.4 -10.7 -7.6 n.a. -24.2 Source:Bloomberg prices

Mit tel – September 3, 2014
IMPORTANT DISCLOSURES APPEAR AT THE BACK OF THIS REPORT 13
PERFORMANCE OF LISTED ASSETS YTD
Source: Bloomberg prices
The tables below show the current and historical discount (premium) to NAV of the
main Italian holding companies. At the current price, MIT is trading at a 42%
discount to NAV, compared to the 32% of Italian holding companies, and it’s
not far from the historical average (36% in the 2006-2013 time period).
ITALIAN HOLDNG COMPANIES: CURRENT AND HISTORICAL NAV AND DISCOUNTS
Company Val. method NAV (€ PS) * Disc. / (Prem.) to NAV
listed assets 2007 2008 2009 2010 2011 2012 2013 2014 2007 2008 2009 2010 2011 2012 2013 Avg.** 2014
ASTM
market price 20.9 10.7 12.5 14.5 11.7 14.5 17.5 19.8 31% 50% 23% 33% 38% 48% 36% 37% 47%
CAMFIN (1) market price 2.37 0.49 0.65 0.56 0.56 0.90 1.02 n.a. 40% 40% 54% 34% 58% 39% n.a. 36% -
CIR
market price 3.28 2.15 2.50 2.18 2.20 1.75 1.85 1.50 24% 65% 30% 36% 44% 54% 38% 37% 28%
COFIDE
see through 1.64 1.03 1.21 1.06 1.08 0.81 0.87 0.69 35% 68% 48% 38% 49% 51% 38% 43% 25%
DEA CAPITAL
market price 2.40 1.64 1.88 1.99 2.10 2.15 1.95 2.13 10% 22% 33% 43% 39% 38% 35% 26% 32%
EXOR ord. (2) market price 9.2 15.9 25.2 36.6 25.8 31.8 33.0 34.8 28% 50% 48% 36% 42% 40% 16% 35% 14%
IMMSI
market price 2.12 1.24 1.57 1.86 1.30 0.87 0.86 1.01 35% 44% 47% 55% 56% 50% 45% 45% 39%
ITALMOBILIARE (3) market price 93.1 53.1 56.4 42.3 32.7 25.8 34.1 35.4 32% 49% 47% 41% 56% 53% 29% 43% 20%
MEDIOBANCA (4) market price 16.4 14.3 11.1 10.1 7.9 6.0 7.4 7.1 10% 40% 36% 35% 15% 32% 37% 26% 9%
MITTEL
market price 5.0 4.5 5.0 4.2 3.3 3.3 3.4 2.5 -5% 49% 27% 20% 51% 61% 49% 36% 42% VIANINI LAVORI
market price 13.44 10.86 11.22 11.32 8.29 7.69 11.63 13.45 n.a. 63% 58% 65% 60% 60% 56% 61% 60%
AVERAGE 24% 49% 41% 40% 46% 48% 38% 36% 32% (1) see-through until 2009; at market price starting from 2010 (2) IFIL ord. until 2007 (assuming total n. shares ord+sav), EXOR ord. (IFIL+IFI) since merger announcement (Sep-08) (3) adj. number shares: before Nov-07 based on market discount; after Nov-07 applying avg. between 3-year and market discounts (4) year-end: June * based on estimated year-end net debt and listed assets valued at December avg. market price ** 9-year historical arithmetic average (2004-12 when available) Source: EQUITA SIM estimates
ITALIAN HOLDING ADJ. AVERAGE DISCOUNT TREND
Source: Equita SIM estimates
0%
10%
20%
30%
40%
50%
60%
-80%
-65%
-50%
-35%
-20%
-5%
10%
25%
40%
Ital
ian
Ho
ldin
g a
dj.*
av
g. d
isco
un
t to
NA
V
FT
SE
All
Ita
lian
Sh
are
s c
han
ge
(Dec
-05
=1
00)
% change in FTSE All Italian Shares
Holding adj.* avg. discount
Market historical adj.* monthly avg. discount (since Jan-06)
* excluding non recurrent events / unusual premiums
Data are: MONTHLY since Jan-06, WEEKLY since Jan-08 & and DAILY since Sep-08

Mit tel – September 3, 2014
IMPORTANT DISCLOSURES APPEAR AT THE BACK OF THIS REPORT 14
SENSITIVITY
MITTEL NAV: SENSITIVITY (€ PS)
SORIN FIN. CREDITS -25.0% -15.0% -10.0% TODAY 10.0% 15.0% 25.0%
2€ mn.6 143 150 154 158 162 166 174
-25.0% 40 2.3 2.4 2.4 2.4 2.5 2.5 2.6
-15.0% 45 2.3 2.4 2.5 2.5 2.6 2.6 2.7
-10.0% 48 2.4 2.5 2.5 2.5 2.6 2.6 2.7
TODAY 53 2.4 2.5 2.6 2.6 2.6 2.7 2.8
10.0% 59 2.5 2.6 2.6 2.7 2.7 2.8 2.8
15.0% 61 2.5 2.6 2.6 2.7 2.7 2.8 2.9
25.0% 67 2.6 2.7 2.7 2.8 2.8 2.8 2.9 Source: EQUITA SIM estimates
MITTEL NAV: SENSITIVITY (€ PS)
INTESA UBI -40.0% -30.0% -20.0% TODAY 20.0% 30.0% 40.0%
SAN PAOLO 3€ ps.5 3.6 4.2 4.8 6.0 7.2 7.8 8.4
-40.0% 1.4 2.5 2.5 2.5 2.5 2.6 2.6 2.6
-30.0% 1.6 2.5 2.5 2.5 2.6 2.6 2.6 2.6
-20.0% 1.8 2.5 2.5 2.5 2.6 2.6 2.6 2.6
TODAY 2.3 2.6 2.6 2.6 2.6 2.6 2.6 2.7
20.0% 2.7 2.6 2.6 2.6 2.6 2.7 2.7 2.7
30.0% 2.9 2.6 2.6 2.6 2.6 2.7 2.7 2.7
40.0% 3.2 2.6 2.6 2.6 2.7 2.7 2.7 2.7 Source: EQUITA SIM estimates
STATEMENT OF RISK
The primary elements that could positively impact MITTEL include:
• Significant improvement in the main assets reference macroeconomic scenario
• Increase in valuation for property development projects
• Positive share price performance of Intesa Sanpaolo, UBI Banca, RCS, Sorin
and Moncler
• Significant improvement of luxury motor yachts market conditions affecting
Azimut Benetti
• Significant improvement of consumer retail
The primary elements that could negatively impact MITTEL include:
• Significant deterioration in the main assets reference macroeconomic scenario
• Valuation risk for property development projects
• Negative share price performance of Intesa Sanpaolo, UBI Banca, RCS, Sorin
and Moncler
• Potential write-downs on loans following a difficult market environment
• Significant deterioration of luxury motor yachts market conditions affecting
Azimut Benetti
• Significant deterioration of consumer retail

Mit tel – September 3, 2014
IMPORTANT DISCLOSURES APPEAR AT THE BACK OF THIS REPORT 15
INFORMATION PURSUANT TO ARTICLE 69 ET SEQ. OF CONSOB (Italian securities & exchange commission) REGULATION no. 11971/1999 This publication has been prepared by Luigi de Bellis on behalf of EQUITA SIM SpA (licensed to practice by CONSOB resolution no. 11761 of December 22nd 1998 and registered as no. 67 in the Italian central register of investment service companies and financial intermediaries)
In the past EQUITA SIM has published studies on Mittel
EQUITA SIM is distributing this publication via e-mail to more than 700 qualified operators from September 4, 2014
The prices of the financial instruments shown in the report are the reference prices posted on the day prior to the date indicated on cover page.
EQUITA SIM intends to provide continuous coverage of the financial instrument forming the subject of the present publication, with a semi-annual frequency and, in any case, with a frequency consistent with the timing of the issuer’s periodical financial reporting and of any exceptional event occurring in the issuer’s sphere of activity. The information contained in this publication is based on sources believed to be reliable. Although EQUITA SIM makes every reasonable endeavour to obtain information from sources that it deems to be reliable, it accepts no responsibility or liability as to the completeness, accuracy or exactitude of such information. If there are doubts in this respect, EQUITA SIM clearly highlights this circumstance. The most important sources of information used are the issuer’s public corporate documentation (such as, for example, annual and interim reports, press releases, and presentations) besides information made available by financial service companies (such as, for example, Bloomberg and Reuters) and domestic and international business publications. It is EQUITA SIM’s practice to submit a pre-publication draft of its reports for review to the Investor Relations Department of the issuer forming the subject of the report, solely for the purpose of correcting any inadvertent material inaccuracies. This note has been submitted to the issuer. EQUITA SIM has adopted internal procedures able to assure the independence of its financial analysts and that establish appropriate rules of conduct for them.
Furthermore, it is pointed out that EQUITA SIM SpA is an intermediary licensed to provide all investment services as per Italian Legislative Decree no. 58/1998. Given this, EQUITA SIM might hold positions in and execute transactions concerning the financial instruments covered by the present publication, or could provide, or wish to provide, investment and/or related services to the issuers of the financial instruments covered by this publication. Consequently, it might have a potential conflict of interest concerning the issuers, financial issuers and transactions forming the subject of the present publication.
Equita SIM S.p.A. provides, or has provided in the last 12 months investment banking services for Mittel S.p.A. Equita SIM S.p.A. performs, or has performed in the last 12 months, the role of intermediary in charge for coordinating and collecting acceptances in the OPSC and global coordinator and bookrunner in the OPSO for financial instruments issued by Mittel S.p.A. as well as financial advisor to Mittel S.p.A. for the deal Equita SIM S.p.A. performs, or has performed in the last 12 months, the role of specialist for financial instruments issued by Mittel S.p.A. In addition, it is also pointed out that, within the constraints of current internal procedures, EQUITA SIM’s directors, employees and/or outside professionals might hold long or short positions in the financial instruments covered by this publication and buy or sell them at any time, both on their own account and that of third parties.
The remuneration of the financial analysts who have produced the publication is not directly linked to corporate finance transactions undertaken by EQUITA SIM.
The recommendations to BUY, HOLD and REDUCE are based on Expected Total Return (ETR – expected absolute performance in the next 12 months inclusive of the dividend paid out by the stock’s issuer) and on the degree of risk associated with the stock, as per the matrix shown in the table. The level of risk is based on the stock’s liquidity and volatility and on the analyst’s opinion of the business model of the company being analysed. Due to fluctuations of the stock, the ETR might temporarily fall outside the ranges shown in the table.
EXPECTED TOTAL RETURN FOR THE VARIOUS CATEGORIES OF RECOMMENDATION AND RISK PROFILE
RECOMMENDATION/RATING Low Risk Medium Risk High Risk
BUY ETR >= 10% ETR >= 15% ETR >= 20%
HOLD -5% <ETR< 10% -5% <ETR< 15% 0% <ETR< 20%
REDUCE ETR <= -5% ETR <= -5% ETR <= 0%
The methods preferred by EQUITA SIM to evaluate and set a value on the stocks forming the subject of the publication, and therefore the Expected Total Return in 12 months, are those most commonly used in market practice, i.e. multiples comparison (comparison with market ratios, e.g. P/E, EV/EBITDA, and others, expressed by stocks belonging to the same or similar sectors), or classical financial methods such as discounted cash flow (DCF) models, or others based on similar concepts. For financial stocks, EQUITA SIM also uses valuation methods based on comparison of ROE (ROEV – return on embedded value – in the case of insurance companies), cost of capital and P/BV (P/EV – ratio of price to embedded value – in the case of insurance companies).
MOST RECENT CHANGES IN RECOMMENDATION AND/OR IN TARGET PRICE (OLD ONES IN BRACKETS):
Date Rec. Target Price (€) Risk Comment
nil
DISCLAIMER The purpose of this publication is merely to provide information that is up to date and as accurate as possible. The publication does not represent to be, nor can it be construed as being, an offer or solicitation to buy, subscribe or sell financial products or instruments, or to execute any operation whatsoever concerning such products or instruments. EQUITA SIM does not guarantee any specific result as regards the information contained in the present publication, and accepts no responsibility or liability for the outcome of the transactions recommended therein or for the results produced by such transactions. Each and every investment/divestiture decision is the sole responsibility of the party receiving the advice and recommendations, who is free to decide whether or not to implement them. Therefore, EQUITA SIM and/or the author of the present publication cannot in any way be held liable for any losses, damage or lower earnings that the party using the publication might suffer following execution of transactions on the basis of the information and/or recommendations contained therein. The estimates and opinions expressed in the publication may be subject to change without notice.
EQUITY RATING DISPERSION AS OF JUNE 30, 2014 (art. 69-quinquies c. 2 lett. B e c. 3 reg. Consob 11971/99)
COMPANIES COVERED COMPANIES COVERED WITH BANKING RELATIONSHIP
BUY 43.8% 55.1%
HOLD 51.1% 42.9%
REDUCE 5.1% 2.0%
NOT RATED 0.0% 0.0%