Global Poverty Monitoring Technical Note 1
April 2018 PovcalNet Update
What’s New
Aziz Atamanov, Joao Pedro Azevedo, R. Andres Castaneda Aguilar,
Shaohua Chen, Paul A. Corral Rodas, Reno Dewina, Carolina Diaz-
Bonilla, Dean M. Jolliffe, Christoph Lakner, Kihoon Lee, Daniel
Gerszon Mahler, Jose Montes, Rose Mungai, Minh C. Nguyen, Espen
Beer Prydz, Prem Sangraula, Kinnon Scott, Ayago Esmubancha
Wambile, Judy Yang and Qinghua Zhao
April 2018
(Updated November 2019*)
Keywords: PovcalNet, what’s new; April 2018; SEDLAC-03; CPI
Development Data Group
Development Research Group
Poverty and Equity Global Practice Group
Pub
lic D
iscl
osur
e A
utho
rized
Pub
lic D
iscl
osur
e A
utho
rized
Pub
lic D
iscl
osur
e A
utho
rized
Pub
lic D
iscl
osur
e A
utho
rized
GLOBAL POVERTY MONITORING TECHNICAL NOTE 1
Abstract
The April 2018 update to PovcalNet involves several changes to the data underlying the
global poverty estimates. Some welfare aggregates have been changed for improved
harmonization, some surveys have been dropped due to data quality concerns, and some
of the CPI and national accounts input data have been revised. This document details
the content of and reasoning behind the changes made. In addition to the changes listed
here, 97 new country-years have been added. This brings the total number of surveys to
1577.
All authors are with the World Bank. Corresponding authors: Joao Pedro Azevedo
([email protected]) and Christoph Lakner ([email protected]). This Note has been
cleared by Francisco H. G. Ferreira.
*November 2019 update:
• Section 2.1.4 on Chile has been removed. The previous version of the document
stated that Chile had been moved from SEDLAC-02 to SEDLAC-03. In fact, we
continue to use SEDLAC-02 for Chile until further checks are carried out.
The Global Poverty Monitoring Technical Note Series publishes short papers that document methodological aspects
of the World Bank’s global poverty estimates. The papers carry the names of the authors and should be cited
accordingly. The findings, interpretations, and conclusions expressed in this paper are entirely those of the authors.
They do not necessarily represent the views of the International Bank for Reconstruction and Development/World
Bank and its affiliated organizations, or those of the Executive Directors of the World Bank or the governments they
represent. Global Poverty Monitoring Technical Notes are available at http://iresearch.worldbank.org/PovcalNet/.
1
Contents 1. Introduction ........................................................................................................................................... 2
2. Changes to welfare aggregates .............................................................................................................. 4
2.1 Update from SEDLAC-02 to SEDLAC-03 ........................................................................................ 4
2.1.1 Argentina ...................................................................................................................................... 4
2.1.2 Bolivia .......................................................................................................................................... 5
2.1.3 Brazil ............................................................................................................................................ 5
2.1.4 Colombia ...................................................................................................................................... 5
2.1.5 Costa Rica .................................................................................................................................... 5
2.1.6 Dominican Republic .................................................................................................................... 5
2.1.7 Ecuador ........................................................................................................................................ 6
2.1.8 Guatemala .................................................................................................................................... 6
2.1.9 Haiti (income) .............................................................................................................................. 6
2.1.10 Honduras .................................................................................................................................... 6
2.1.11 Mexico (income) ........................................................................................................................ 6
2.1.12 Nicaragua ................................................................................................................................... 6
2.1.13 Panama ....................................................................................................................................... 6
2.1.14 Paraguay ..................................................................................................................................... 6
2.1.15 Peru ............................................................................................................................................ 6
2.1.16 Uruguay ...................................................................................................................................... 7
2.2 Other changes to welfare aggregates .................................................................................................. 7
2.2.1 Armenia ........................................................................................................................................ 7
2.2.2 EU-SILC ...................................................................................................................................... 7
2.2.3 Georgia ......................................................................................................................................... 7
2.2.4 Kazakhstan ................................................................................................................................... 7
2.2.5 Mexico (consumption) ................................................................................................................. 7
2.2.6 Mozambique ................................................................................................................................ 8
2.2.7 Serbia ........................................................................................................................................... 8
2.2.8 Timor-Leste .................................................................................................................................. 8
2.2.9 West Bank and Gaza .................................................................................................................... 8
3 Changes to CPI data ................................................................................................................................... 9
3.1 Latin America and the Caribbean: Switch from ILO to IFS CPI data ................................................ 9
3.2 Sub-Saharan Africa: Reweighting CPIs .............................................................................................. 9
3.3 Changes to the survey year ................................................................................................................. 9
4 Changes to national accounts and population data .................................................................................. 10
5 Removal of surveys .................................................................................................................................. 11
5.1 Eastern Europe and Central Asia ...................................................................................................... 11
5.2 Azerbaijan ......................................................................................................................................... 11
5.3 Germany ............................................................................................................................................ 11
5.4 Guatemala ......................................................................................................................................... 11
5.5 Macedonia ......................................................................................................................................... 11
5.6 Tajikistan........................................................................................................................................... 11
6 Country-years added ................................................................................................................................ 13
7 References ................................................................................................................................................ 14
2
1. Introduction
The April 2018 global poverty update from the World Bank contains revisions to the global and regional
estimates from 1981 to 2013, originally released in October 2016 and revised in October 2017. The World
Bank’s next major update of global and regional poverty estimates is scheduled for October 2018, where
we plan to release global poverty estimates for the reference year 2015. This will coincide with the launch
of the next Poverty and Shared Prosperity report.
The April 2018 update includes new surveys that we have received and processed, as well as several
changes to the existing data. Some changes reflect improvements in the welfare aggregate based on new
harmonization efforts and more available information. Other changes involve corrections of minor errors
in the construction of the welfare aggregate. When relevant, we have also updated some of the auxiliary
data, such as the CPIs, as part of the regular updating cycle. Finally, we have dropped a few surveys from
the database based on data quality concerns or the unavailability of sufficient documentation. This
document outlines the changes made to the underlying data by country, and explains the reasons why these
changes have been made.
Our main objectives with this note are twofold. First, we would like to document any changes that can
affect the World Bank’s reported global poverty numbers. Second, over time, these notes can gradually
inform how we can better align ex-ante and ex-post data collection and welfare derivation efforts led by
national and international agencies interested in stronger international comparability. Our understanding is
that internationally comparable statistics should not replace national definitions, but can play a valuable
role when national agencies are interested in cross-country comparisons and benchmarking.
The intended audience of this technical note covers all PovcalNet users, including national statistical offices
and other government agencies responsible for poverty monitoring and the Sustainable Development Goals,
as well as the broader research community.
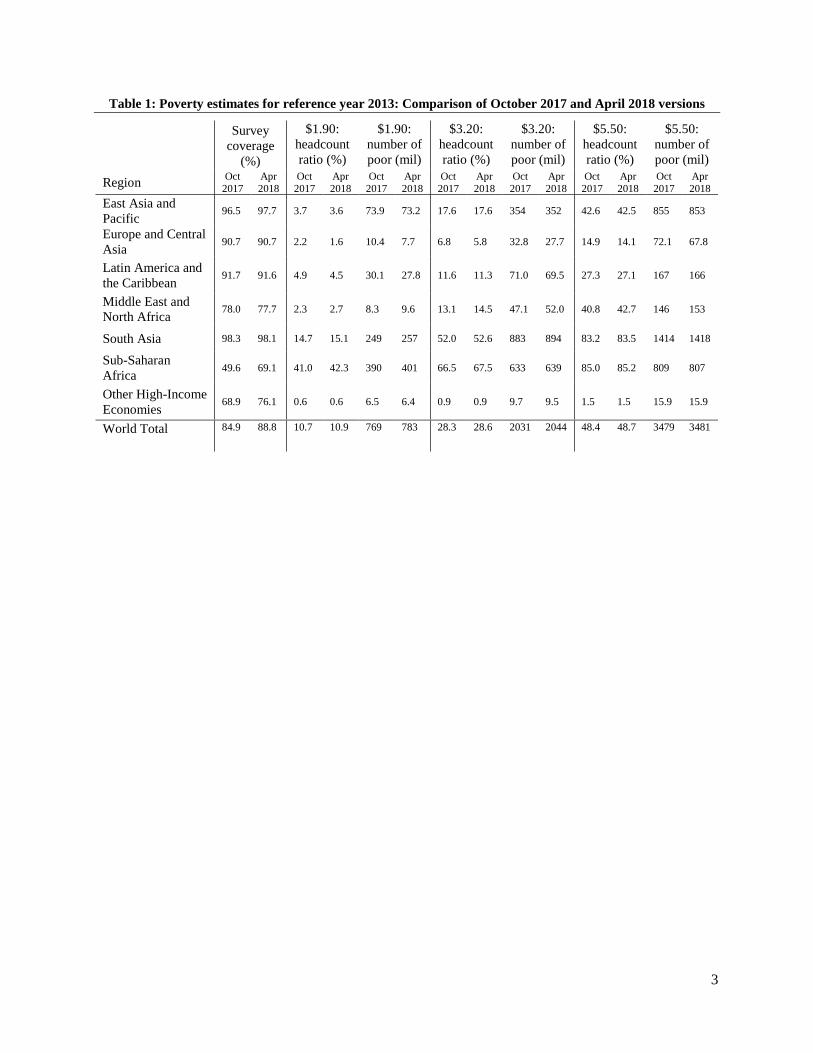
Table 1 details the impact of the updates on global poverty in 2013. The global $1.90 headcount ratio
increases from 10.7% to 10.9% with the new data, and the number of poor increases from 769 million to
783 million people. This change at the global level is primarily driven by new surveys from South Asia and
Sub-Saharan Africa. Particularly, new surveys in Bangladesh and Ethiopia each add more than 7 million
poor people compared to the previous estimate, which was based on extrapolations and interpolations of
older surveys.
Some regions have also undergone substantial changes for the regional headcount ratios that are less
noticeable at the global level. In the Middle East and North Africa, the headcount ratio increases from 2.3%
to 2.7%, and the number of poor from 8.3 million to 9.6 million. This is driven by revised growth rates for
Syria in recent years (see section 4). In Europe and Central Asia, the headcount ratio decreases from 2.2%
to 1.6% and the number of poor from 10.4 million to 7.7 million. This is primarily driven by changes for
Tajikistan and Uzbekistan, where poverty has been revised downward. In Tajikistan, this is caused by
replacing with surveys of greater comparability (see section 5.6), and in Uzbekistan by a new CPI series
(see section 3).
3
Table 1: Poverty estimates for reference year 2013: Comparison of October 2017 and April 2018 versions
Region
Survey
coverage
(%)
$1.90:
headcount
ratio (%)
$1.90:
number of
poor (mil)
$3.20:
headcount
ratio (%)
$3.20:
number of
poor (mil)
$5.50:
headcount
ratio (%)
$5.50:
number of
poor (mil)
Oct
2017
Apr
2018
Oct
2017
Apr
2018
Oct
2017
Apr
2018
Oct
2017
Apr
2018
Oct
2017
Apr
2018
Oct
2017
Apr
2018
Oct
2017
Apr
2018
East Asia and
Pacific 96.5 97.7 3.7 3.6 73.9 73.2 17.6 17.6 354 352 42.6 42.5 855 853
Europe and Central
Asia 90.7 90.7 2.2 1.6 10.4 7.7 6.8 5.8 32.8 27.7 14.9 14.1 72.1 67.8
Latin America and
the Caribbean 91.7 91.6 4.9 4.5 30.1 27.8 11.6 11.3 71.0 69.5 27.3 27.1 167 166
Middle East and
North Africa 78.0 77.7 2.3 2.7 8.3 9.6 13.1 14.5 47.1 52.0 40.8 42.7 146 153
South Asia 98.3 98.1 14.7 15.1 249 257 52.0 52.6 883 894 83.2 83.5 1414 1418
Sub-Saharan
Africa 49.6 69.1 41.0 42.3 390 401 66.5 67.5 633 639 85.0 85.2 809 807
Other High-Income
Economies 68.9 76.1 0.6 0.6 6.5 6.4 0.9 0.9 9.7 9.5 1.5 1.5 15.9 15.9
World Total 84.9 88.8 10.7 10.9 769 783 28.3 28.6 2031 2044 48.4 48.7 3479 3481
4
2. Changes to welfare aggregates
2.1 Update from SEDLAC-02 to SEDLAC-03 The PovcalNet data for Latin America and the Caribbean are taken from the Socio-Economic Database for
Latin America and the Caribbean (SEDLAC). SEDLAC has been developed by the Center for
Distributional, Labor and Social Studies (CEDLAS) of the Universidad Nacional de La Plata in Argentina,
in partnership with World Bank’s Poverty and Equity Group’s Latin America team. A process of
methodological and technical revisions to the SEDLAC project started in 2015, to address several issues
presented by users during the preceding five years. Additional changes were made to better align the
SEDLAC data with the household survey harmonized by the World Bank for other regions. These revisions
of the welfare aggregate represent a move from version 02 of the SEDLAC project, to version 03.
The main methodological changes in SEDLAC-03 that directly affect welfare measurement, such as
estimates of poverty and inequality, are as follows:
1. Modifications were made to the imputation of rent for owner-occupiers in Argentina, Brazil,
Ecuador, and Honduras. These surveys lack estimates of implicit rent by the national statistical
office (NSO), or a self-reported rent question. The previous methodology applied a premium of 10
percent of total income to home owners, which was found to be imprecise and to have significant
distributional implications. The new methodology uses a hedonic model to impute rent in these
four countries.1
2. The following modifications to the imputation of implicit rent were applied to all surveys:
a. Rent has been imputed in older surveys that lacked self-reported rent, using the share of
self-reported rent by decile in the closest survey with this information.
b. Rent imputations have been extended to households in usufruct, ceded dwellings, and
possession without documentation.
c. Dwellings provided free-of-charge by employers have been changed to in-kind labor
income instead of rent.
d. The methodology to treat missing values on self-reported rent has been standardized across
all household surveys.
3. The variable for secondary household members has been updated in some countries. Secondary
household members tend to be domestic employees and tenants. When questionnaires include
ambiguous categories, SEDLAC follows the national convention for defining household members.
Other country-specific changes are listed below.
2.1.1 Argentina
1. Income aggregates already created by the NSO were disregarded and recreated from the component
incomes. The NSO had included non-current income sources, like labor bonuses, in its aggregate.
2. Regarding non-labor income, bonuses for pensions were correctly converted to monthly values,
retroactive income for pensions was excluded from the welfare aggregate as it is not current income,
and a small modification was made to “other incomes” to distinguish between casual and current
incomes.
1 The methodology for the hedonic model is documented in a background note written by the World Bank’s Poverty
and Equity Group’s Latin America team and CEDLAS (forthcoming, draft available upon request). The hedonic model
uses a quantile regression which takes into account that housing characteristics may be valued differently along the
distribution (also see Balcázar et al., 2017).
5
3. The new hedonic model using quantile regression (QR) for imputing rent was used instead of the
10 percent premium discussed above.
2.1.2 Bolivia
1. Individual labor income earned during the last month for individuals who were unemployed during
the last week is corrected. In particular, the type of employment and the source of income were
made consistent.
2. Two Conditional Cash Transfers (Bono Juana Azurduy and Bono Juancito Pinto) are now included
in the non-labor income component. Remittances in-kind from abroad are now correctly converted
to monthly values.
3. The 10 percent premium to account for imputed rent was replaced by the self-reported value in the
surveys. Additionally, the group of households for which rent was imputed increased by adding
those whose dwellings were ceded. Finally, a coding error in homeownership was fixed in the 2000,
2001, and 2002 surveys.
2.1.3 Brazil
1. The new hedonic model using QR for imputing rent was used instead of the 10 percent premium
discussed above.
2. Additionally, the group of households for which rent was imputed increased by adding those whose
dwellings were ceded.
2.1.4 Colombia
1. All four quarters of data are now included in SEDLAC-03, given the availability of a longer series
of annual microdata (from 2008 to the present). Previously, only the third quarter of the survey was
used to maintain comparability with surveys pre-2008 where complete data were only available for
that quarter. To take advantage of the improved representativeness of the most recent surveys,
comparability over time of the Colombian series is now broken in 2008.
2. Price adjustments by department (Spanish departamentos) were incorporated using the
methodology by the NSO to create spatial price indices.
3. Incomes received during the last 12 months as severance pay are now excluded from the welfare
aggregate as they are considered casual income.
4. The group of households for which rent was imputed was expanded to include households living
in ceded dwelling.
2.1.5 Costa Rica
1. Individual labor income now includes income earned last month by individuals who were
unemployed during the last week. Previously, these labor incomes were excluded.
2. For the 2001-2009 period, household rent is imputed using the new hedonic model, whereas for
2010 onwards the self-reported value is used instead. The self-reported question was only added to
the survey in 2010.
2.1.6 Dominican Republic
1. In the conversion to monthly values, individual labor income earned weekly is now multiplied by
4.33 rather than by 4.3. Labor income received every two weeks is now multiplied by 2.165 rather
than by 2.
2. The following sources of income were excluded from the income aggregate: severance pay,
inheritance, gambling income, and sporadic income from accident or life insurance policies by
foreign insurance companies.
3. The definition of secondary household members has been corrected.
6
2.1.7 Ecuador
1. Individual labor income now includes income earned last month by individuals who were
unemployed during the last week. Previously, these labor incomes were excluded.
2. The new hedonic model using QR for imputing rent was used instead of the 10 percent premium
discussed above.
2.1.8 Guatemala
1. An error in the temporal price deflation was fixed in the 2006 survey.
2. In the 2014 survey, non-labor income is now assigned to the corresponding individual, rather than
to the head of household.
2.1.9 Haiti (income)
1. The disaggregation of labor incomes was improved. Income aggregates already created by the NSO
were disregarded and recreated from the component incomes.
2.1.10 Honduras
1. In-kind labor income was added in the 2001, 2002, and 2003 surveys.
2. Non-labor income outliers are no longer eliminated.
3. Individual labor income now includes income earned last month by individuals who were
unemployed during the last week. Previously, these labor incomes were excluded.
4. Since 2009, non-labor income now includes discounts for some goods and services given to the
elderly.
5. The new hedonic model using QR for imputing rent was used instead of the 10 percent premium
discussed above.
2.1.11 Mexico (income)
1. Labor income now includes the following sources of income: vocational salary and bonuses
converted to monthly values.
2. Non-labor income now includes monetary donations from other households.
2.1.12 Nicaragua
1. Individual labor income now includes income earned last month by individuals who were
unemployed during the last week. Previously, these labor incomes were excluded.
2. Temporal price deflators were modified to improve comparability of incomes captured during
different months of the year.
2.1.13 Panama
1. Labor income now includes agricultural incomes and incomes for the thirteenth month.
2. In the 2000 survey, labor income of self-employed and employers in the agricultural sector is now
included.
3. In the 2011 survey, private scholarships are now included as part of non-labor income.
2.1.14 Paraguay
1. The glass of milk provided to children in public schools is now included as an in-kind transfer. This
information is not available in the 2002 survey.
2. Revised sampling weights released by the NSO were included in the 2000-2015 period. It has not
yet been possible to make this revision for surveys prior to 2000.
2.1.15 Peru
1. An error in the estimation of imputed rent has been fixed.
7
2. Income aggregates already created by the NSO were disregarded and recreated from the component
incomes.
2.1.16 Uruguay
1. The treatment and identification of employment by income (e.g., wage, self-employed, employer)
and employments types have been improved.
2. Labor income now includes bonuses converted to monthly values and vocational salary.
3. Public transfers that depend on household composition are now treated properly.
4. Redundancy pay and other extraordinary income is now excluded from non-labor income, while
“other current incomes” are included.
2.2 Other changes to welfare aggregates
2.2.1 Armenia
Coding errors have been corrected in the harmonization of the welfare aggregate for 2006, 2009, 2011 and
2014.
2.2.2 EU-SILC
All historical EU-SILC data have been updated to data release 09/2017. The updates for each country-year
are documented on the Eurostat website [CIRCABC → Eurostat → EU-SILC → Library →
data_dissemination → udb_user_database].
2.2.3 Georgia
The methodology to estimate international poverty in Georgia has been revised following a collaboration
between the NSO and the World Bank, in particular regarding food consumption. The revised methodology
adds information on food produced at the household from a section of the questionnaire that was not used
before. The regular food questionnaire collects information on food arriving to the household during seven
days, which may miss information on food stored at the household that is consumed during this period.
Therefore, the new methodology is more accurate for households that rely heavily on food produced at the
household.
As a result of these changes, Georgia’s poverty headcount ratio at $3.2/day (2011 PPP) decreases
substantially, from 25.6 percent to 17.1 percent in 2016. The trend in poverty over time is consistent before
and after the changes. Neighboring Armenia, with a similar GDP per capita, still reports a lower poverty
rate (13.5 percent in 2015). Inequality also decreases -- the Gini decreases from 39 to 36.5 points in 2016,
although Georgia’s ranking among countries in the region remains broadly similar.
2.2.4 Kazakhstan
The harmonization from 2001 to 2015 has been updated on several dimensions such as regional deflators,
sampling weights, and rent. The implications for poverty estimates are minor.
2.2.5 Mexico (consumption)
The consumption aggregate from the Mexico Household Income and Expenditure Survey (ENlGH) has
been harmonized. In all years, we now report “total current expenditure,” which is the sum of “current
monetary expenditure” and “current non-monetary expenditure.”
In 2008, the Mexican National Institute of Statistics and Geography (INEGI) applied the recommendations
issued at the 17th International Conference of Labour Statisticians and the Canberra Group Report to
ENIGH. This implied a change in the income and expenditure classifications. From 2008 onwards, only
8
“current monetary expenditure” is available -- neither “total current expenditure” nor “current non-
monetary expenditure” are reported. For surveys from 2008, we construct “current non-monetary
expenditure” by adding the five variables below:
• autonomous consumption
• estimated implicit rent
• compensation in-kind
• transfer in-kind from relatives
• transfer in-kind from public institution
To this we add “current monetary expenditure” to arrive at a variable which is comparable to the “total
current expenditure” variable reported until 2008. This methodology entails a minor break in the Mexican
consumption series at 2008.
2.2.6 Mozambique
The welfare aggregate from the 1996 survey is no longer spatially deflated. This has generated moderate
adjustments to the national poverty rates and a large adjustment to the Gini, which changes from 44.4 to
53.6.
2.2.7 Serbia
The following updates have been made to the harmonization of the welfare aggregate for 2004, 2005, 2006,
2007, 2008, 2009, 2010, and 2013:
1. Diary data are used for food consumption and recall data are used for non-food consumption.
2. Durable spending is no longer annualized.
3. For education spending, only 9 months are considered.
4. Rent and imputed rent are excluded from total consumption. Previously, total consumption included
implicit rent in some years, which, aside from being a sub-optimal measure of rent, created an
inconsistent time series.
2.2.8 Timor-Leste
In 2014 a new methodology to construct the welfare aggregate was adopted. The welfare aggregate in the
2007 survey has been revised such that it follows this new 2014 methodology. The revisions affected
primarily the measurement of rent, as well as the spatial price adjustment. As a result of the changes in the
welfare aggregate, the poverty headcount ratio in 2007 increases from 43.4% to 47.0% (at $1.9/day, 2011
PPP). World Bank (2016) explains the methodological changes between the two surveys in more detail.
2.2.9 West Bank and Gaza
There was a mistake in how spatial deflators were applied to welfare aggregates in 2004, 2010 and 2011
years by the World Bank team. The mistake was identified with the help of the Palestinian Central Bureau
of Statistics and fixed in this update. The implications for the welfare aggregates are minimal.
9
3 Changes to CPI data
The baseline source of CPI data has been updated to IMF’s International Financial Statistics (IFS) as of
December 2017. The annual series is created by averaging the monthly IFS series. We continue to use
alternative CPI data in countries where they were used previously. A detailed technical report, which fully
accounts for the various CPI series used, will be published on the PovcalNet website.
3.1 Latin America and the Caribbean: Switch from ILO to IFS CPI data In Latin America and the Caribbean, the baseline source of CPI data has been changed from ILO to the
latest IFS data, consistent with the rest of the world. This has led to several substantial changes to the
historical series, mostly in the 1980s and early 1990s.
3.2 Sub-Saharan Africa: Reweighting CPIs In several African countries, the price data for the 2011 ICP round was collected in both 2011 and 2012.
Therefore, in Mali, Mozambique, Rwanda, Tanzania and Uganda, a weighted average of the 2011 and 2012
CPI was previously used. New information from the African Development Bank suggests that only the
2011 prices were used for computing the PPPs, while the 2012 prices were collected for validation purposes.
Therefore, the reweighting of CPIs has been removed for these five countries, which now simply use the
annual IFS CPI series. These adjustments have caused minor revisions to the estimated poverty headcount
ratios in these countries.
3.3 Changes to the survey year In three cases, the survey year has been updated and the CPI changed accordingly. This concerns Fiji
2013.24 (previously 2013), Ghana 2012.8 (previously 2012) and Comoros 2013.5 (previously 2013).2 In
South Africa 2005 and 2010, the survey year reported in PovcalNet has changed (previously 2006 and 2011,
respectively) but no changes in the CPI were necessary. In these two cases, the survey is from the earlier
year (2005 and 2010), but the welfare aggregate is expressed in next year’s prices (2006 and 2011).
2 The decimal year notation is used when data are collected over two calendar years. The number before the decimal
point refers to the first year of data collection, while the numbers after the decimal point show the proportion of data
collected in the second year. For example, the Fiji survey (2013.24) was conducted in 2013 and 2014, with 24% of
the data collected in 2014. For these countries, we use a weighted average of the annual CPI series, where the weights
are based on the data collection. In the case of Fiji, we use a CPI that is the weighted average of the 2013 and 2014
CPIs, with weights of 76% and 24%, respectively.
10
4 Changes to national accounts and population data
National accounts data (per capita GDP and per capita personal consumption expenditure) used in lining
up survey estimates to the reference years that are used for reporting regional and global poverty estimates
have been revised to the December 2017 version of the World Bank’s World Development Indicators
(WDI). Missing national accounts data from WDI have been supplemented with data from the UN
Statistical Yearbook (40th and 43rd editions) and earlier editions of the IMF’s IFS, especially for the 1980s
and early 1990s. For Syria in recent years, national accounts estimates are taken from Gobat and Kostial
(2016). Linear extrapolations of national accounts data are no longer used to fill missing years, and
observations are instead set to missing if national accounts data are not available to align survey estimates.
The methods and national accounts data used for lining up continue to be revised and improved. A detailed
technical note to be published in October 2018 will offer a more detailed explanation and documentation.
The population data has likewise been updated to the December 2017 version of the WDI.
11
5 Removal of surveys
5.1 Eastern Europe and Central Asia 17 surveys in Eastern Europe and Central Asia covering the years 1987-1993 have been dropped due to
concerns about data quality or uncertainty about the source of the CPIs.3 The poverty estimates in these
country-years relied on very coarse grouped data, often with only 5 bins. In terms of CPI data, no official
data exist for these countries during these periods, and the various alternative sources yield very different
results. Users interested in this time period can obtain the original data from Milanovic (1998).
5.2 Azerbaijan The 2008 and 2011 data have been removed due to a withdrawal of data access permission by the NSO.
5.3 Germany Due to data access issues, EU-SILC surveys have been dropped for Germany and replaced with LIS surveys.
5.4 Guatemala The 2011 ENCOVI Survey has been removed due to concerns over data quality, and because the results
appeared out of line with general trends. This is consistent with the NSO’s approach, which has stopped
using this survey round.
5.5 Macedonia The 2009 and 2010 Macedonia Household Budget Survey (HBS) have been removed until a thorough
quality assessment and, if appropriate, a revision of this survey has been conducted. The sample size of the
survey decreased strongly since 2009. Furthermore, average consumption decreased and consumption-
based poverty rose in 2009, while the economy expanded and labor market indicators continued to improve.
This has raised concerns over the representativeness of the HBS data.
5.6 Tajikistan The Household Budget Survey (HBS) for 2012, 2013, 2014 has been removed. There are three main reasons
for this: 1) the HBS is not comparable with the 2007 and 2009 Tajikistan Living Standards Study (TLSS)
surveys, 2) the HBS has important shortcomings in the sampling design, and 3) the statistical agency is in
the process of rolling out an improved survey design that follows more closely the TLSS, which will replace
the existing HBS for the purposes of monitoring poverty.
The TLSS surveys used a standard two-stage sampling design, incorporated household size measurements
on the basis of a full household roster, and relied on a comprehensive recall-based questionnaire. In contrast,
the HBS sample is a legacy panel of households that is not weighted, does not currently incorporate a
reliable household roster, and uses a diary approach to collect consumption and expenditure information.
The shortcomings of the HBS sampling design include: 1) it is unconventional, structured in three stages
(first selecting districts, then selecting PSUs within districts, and finally households within those districts)
leading the sample to be concentrated in certain parts of the country and underrepresented in others, 2) the
3 This concerns Belarus (1988), Czech Republic (1988), Estonia (1988), Kazakhstan (1988), Kyrgyz Republic (1988,
1993), Lithuania (1988), Latvia (1988), Moldova (1988, 1992), Russian Federation (1988), Slovak Republic (1988,
1992), Slovenia (1987), Turkmenistan (1988), Ukraine (1988), Uzbekistan (1988).
12
sample refreshment procedure is not documented, and with the panel design likely leads to non-random
attrition that is unaccounted for, and 3) the survey lacks population weights.
The national statistical agency is in the process of rolling out a new version of the HBS that would
incorporate many elements from the previous TLSS approach. In particular, if fully implemented, the new
questionnaire would be recall-based, and the sample would be drawn following guidelines for a standard
two-stage sample. Thus, the TLSS design is likely to be the more consistent and comparable approach going
forward. Furthermore, the TLSS is more comparable with the Household Survey for the Purpose of
Improvement, Targeting and Advancing the Formula of Indirect Estimates of Needs (HSITAFIEN).
13
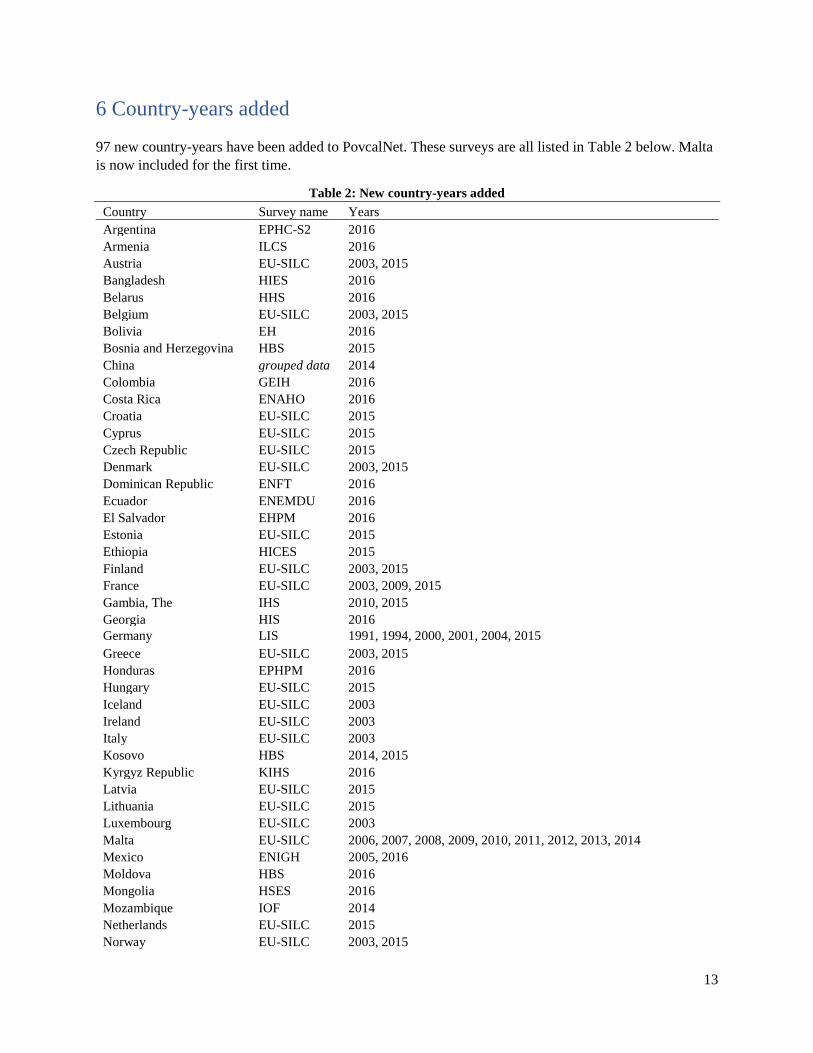
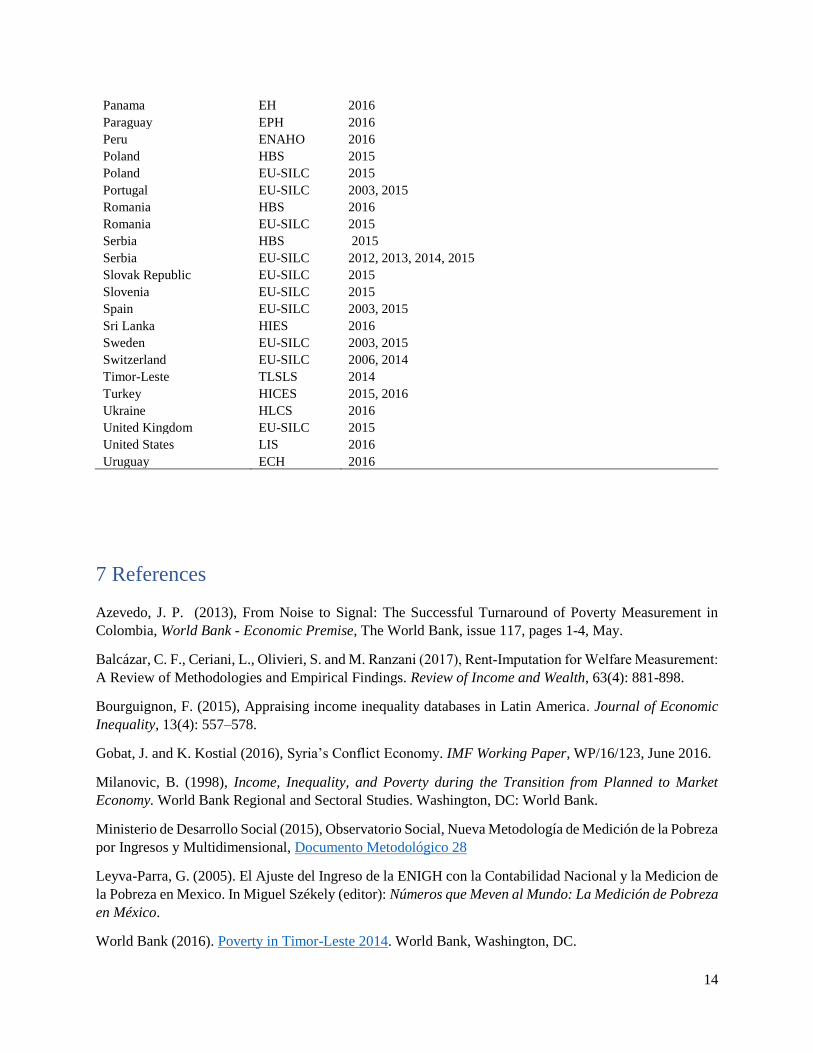
6 Country-years added
97 new country-years have been added to PovcalNet. These surveys are all listed in Table 2 below. Malta
is now included for the first time.
Table 2: New country-years added
Country Survey name Years
Argentina EPHC-S2 2016
Armenia ILCS 2016
Austria EU-SILC 2003, 2015
Bangladesh HIES 2016
Belarus HHS 2016
Belgium EU-SILC 2003, 2015
Bolivia EH 2016
Bosnia and Herzegovina HBS 2015
China grouped data 2014
Colombia GEIH 2016
Costa Rica ENAHO 2016
Croatia EU-SILC 2015
Cyprus EU-SILC 2015
Czech Republic EU-SILC 2015
Denmark EU-SILC 2003, 2015
Dominican Republic ENFT 2016
Ecuador ENEMDU 2016
El Salvador EHPM 2016
Estonia EU-SILC 2015
Ethiopia HICES 2015
Finland EU-SILC 2003, 2015
France EU-SILC 2003, 2009, 2015
Gambia, The IHS 2010, 2015
Georgia HIS 2016
Germany LIS 1991, 1994, 2000, 2001, 2004, 2015
Greece EU-SILC 2003, 2015
Honduras EPHPM 2016
Hungary EU-SILC 2015
Iceland EU-SILC 2003
Ireland EU-SILC 2003
Italy EU-SILC 2003
Kosovo HBS 2014, 2015
Kyrgyz Republic KIHS 2016
Latvia EU-SILC 2015
Lithuania EU-SILC 2015
Luxembourg EU-SILC 2003
Malta EU-SILC 2006, 2007, 2008, 2009, 2010, 2011, 2012, 2013, 2014
Mexico ENIGH 2005, 2016
Moldova HBS 2016
Mongolia HSES 2016
Mozambique IOF 2014
Netherlands EU-SILC 2015
Norway EU-SILC 2003, 2015
14
Panama EH 2016
Paraguay EPH 2016
Peru ENAHO 2016
Poland HBS 2015
Poland EU-SILC 2015
Portugal EU-SILC 2003, 2015
Romania HBS 2016
Romania EU-SILC 2015
Serbia HBS 2015
Serbia EU-SILC 2012, 2013, 2014, 2015
Slovak Republic EU-SILC 2015
Slovenia EU-SILC 2015
Spain EU-SILC 2003, 2015
Sri Lanka HIES 2016
Sweden EU-SILC 2003, 2015
Switzerland EU-SILC 2006, 2014
Timor-Leste TLSLS 2014
Turkey HICES 2015, 2016
Ukraine HLCS 2016
United Kingdom EU-SILC 2015
United States LIS 2016
Uruguay ECH 2016
7 References
Azevedo, J. P. (2013), From Noise to Signal: The Successful Turnaround of Poverty Measurement in
Colombia, World Bank - Economic Premise, The World Bank, issue 117, pages 1-4, May.
Balcázar, C. F., Ceriani, L., Olivieri, S. and M. Ranzani (2017), Rent‐Imputation for Welfare Measurement:
A Review of Methodologies and Empirical Findings. Review of Income and Wealth, 63(4): 881-898.
Bourguignon, F. (2015), Appraising income inequality databases in Latin America. Journal of Economic
Inequality, 13(4): 557–578.
Gobat, J. and K. Kostial (2016), Syria’s Conflict Economy. IMF Working Paper, WP/16/123, June 2016.
Milanovic, B. (1998), Income, Inequality, and Poverty during the Transition from Planned to Market
Economy. World Bank Regional and Sectoral Studies. Washington, DC: World Bank.
Ministerio de Desarrollo Social (2015), Observatorio Social, Nueva Metodología de Medición de la Pobreza
por Ingresos y Multidimensional, Documento Metodológico 28
Leyva-Parra, G. (2005). El Ajuste del Ingreso de la ENIGH con la Contabilidad Nacional y la Medicion de
la Pobreza en Mexico. In Miguel Székely (editor): Números que Meven al Mundo: La Medición de Pobreza
en México.
World Bank (2016). Poverty in Timor-Leste 2014. World Bank, Washington, DC.