Official Use Public Disclosure Authorized Public Disclosure Authorized Public Disclosure Authorized Public Disclosure Authorized

Welcome message from author
This document is posted to help you gain knowledge. Please leave a comment to let me know what you think about it! Share it to your friends and learn new things together.
Transcript

Official Use
Pub
lic D
iscl
osur
e A
utho
rized
Pub
lic D
iscl
osur
e A
utho
rized
Pub
lic D
iscl
osur
e A
utho
rized
Pub
lic D
iscl
osur
e A
utho
rized

India Development Update
JULY 2020

Official Use
Preface
The India Development Update (IDU) has two main aims. First, it provides a factual account of the key
developments in India’s economy over the previous six months and places these in a longer-term and global
context. Based on these developments and on policy changes over the period, the IDU also discusses the
outlook. Second, the IDU provides a more in-depth examination of selected economic and policy issues
and an analysis of India’s medium-term development challenges.
The report is prepared by the Macroeconomics, Trade and Investment (MTI) Global Practice team, under
the guidance of Junaid Ahmad (Country Director), Zoubida Allaoua (Regional Director), and Manuela
Francisco (Practice Manager). This edition was led by Poonam Gupta (Lead Economist and co-lead author)
and Dhruv Sharma (Senior Economist and co-lead author), and the core project team comprised Rishabh
Choudhary, Savita Dhingra, Rangeet Ghosh, Aurélien Kruse, Tanvir Malik, Sebastian Saez, Saurabh Shome,
Amit Singhi, and Rima Sukhija. It includes contributions from Robert Beyer, Shrayana Bhattacharya, Urmila
Chatterjee, Sebastian Franco-Bedoya, Virgilio Galdo, Qaiser Khan, Alexander Pankov, Mehnaz S. Safavian,
Ambrish Shahi, Venkat Bhargav Sreedhara, Marius Vismantas, and Lei Ye. The report also benefited from
discussions with and in-depth comments from Bhavna Bhatia, Csilla Lakatos, Sudip Mozumder and
Nandita Roy. Arsianti and Janani Khandhadai provided editorial support.
The findings, interpretations, and conclusions expressed in this report do not necessarily reflect the views
of the Executive Directors of the World Bank or the governments they represent. The World Bank does
not guarantee the accuracy of the data included in this work. The boundaries, colors, denominations, and
other information shown on any map in this work do not imply any judgment on the part of the World
Bank concerning the legal status of any territory or the endorsement or acceptance of such boundaries. The
report does not necessarily reflect the views of the Government of India and the findings of the study are
not binding on the Government of India. The report is based on data as of June 30, 2020.
This report is available for download via:
http://documents.worldbank.org/curated/en/342001596823446299/India-Development-Update
To receive the IDU and related publications by email, please email [email protected]. For questions and comments, please email [email protected] or [email protected] For information about the World Bank and its activities in India, please visit:
https://www.worldbank.org/en/country/india
www.linkedin.com/company/the-world-bank

Table of Contents
PREFACE ........................................................................................................................................ 2
FIGURES ......................................................................................................................................... 3
TABLES ........................................................................................................................................... 5
BOXES ............................................................................................................................................. 6
1. Overview ..................................................................................................................................................... 1
PART A – RECENT ECONOMIC DEVELOPMENTS .............................................................. 10
2. Real Sector ................................................................................................................................................ 10
3. Inflation ..................................................................................................................................................... 23
4. External Sector ......................................................................................................................................... 29
5. Macrofinancial developments ................................................................................................................ 36
6. Public Finance .......................................................................................................................................... 45
PART B – OUTLOOK AND SPECIAL TOPICS ......................................................................... 57
1. Global Economic Developments and Outlook ................................................................................. 57
2. Economic growth outlook and risks in India ..................................................................................... 63
3. Recent Developments in Trade Policy in India .................................................................................. 66
4. The implications of the COVID-19 pandemic for India’s social protection system ................... 73
5. The short-term distributional impacts of the COVID-19 pandemic .............................................. 82
6. India’s financial sector: the impact of COVID-19 and the long-term policy agenda ................... 88
7. Electricity consumption and night-time lights: two promising proxies for economic activity in
India .................................................................................................................................................................... 93
ANNEX ......................................................................................................................................... 99
REFERENCES ............................................................................................................................ 100
FIGURES
Figure A.1: Private consumption remains the key driver but has not compensated for weak investment and
exports ......................................................................................................................................................................... 11
Figure A.2: The industry and services sectors have suffered over the past couple of years .......................... 11
Figure A.3: Household perceptions of the general economic situation and outlook on (non-essential)
spending had worsened even before the advent of COVID-19 ........................................................................ 12
Figure A.4: Private consumption growth has moderated since Q2 FY18/19 ................................................. 12
Figure A.5: Public consumption growth has remained steady ........................................................................... 12
Figure A.6: Investment growth has turned negative ............................................................................................ 13
Figure A.7: Imports have contracted faster than exports as domestic activity has weakened ...................... 13
Figure A.8: Gross fixed capital formation ............................................................................................................. 14
Figure A.9: Growth in fixed investment ................................................................................................................ 14

Figure A.10: Capital goods production has moderated ....................................................................................... 15
Figure A.11: Gross NPA declined over the past two years, but stay elevated… ............................................ 15
Figure A.12: …while bank credit growth has eased ............................................................................................. 15
Figure A.13: Finances for capital formation .......................................................................................................... 16
Figure A.14: Agriculture growth is on a rebound, industrial growth has turned negative, while services
growth has moderated ............................................................................................................................................... 17
Figure A.15: Real rural wage growth has turned negative ................................................................................... 17
Figure A.16: Unemployment rate touched a historic high in April 2020 .......................................................... 17
Figure A.17: The manufacturing sector weakened significantly in FY19/20 ................................................... 18
Figure A.18: Contribution of internal trade and financial services to services growth have fallen .............. 18
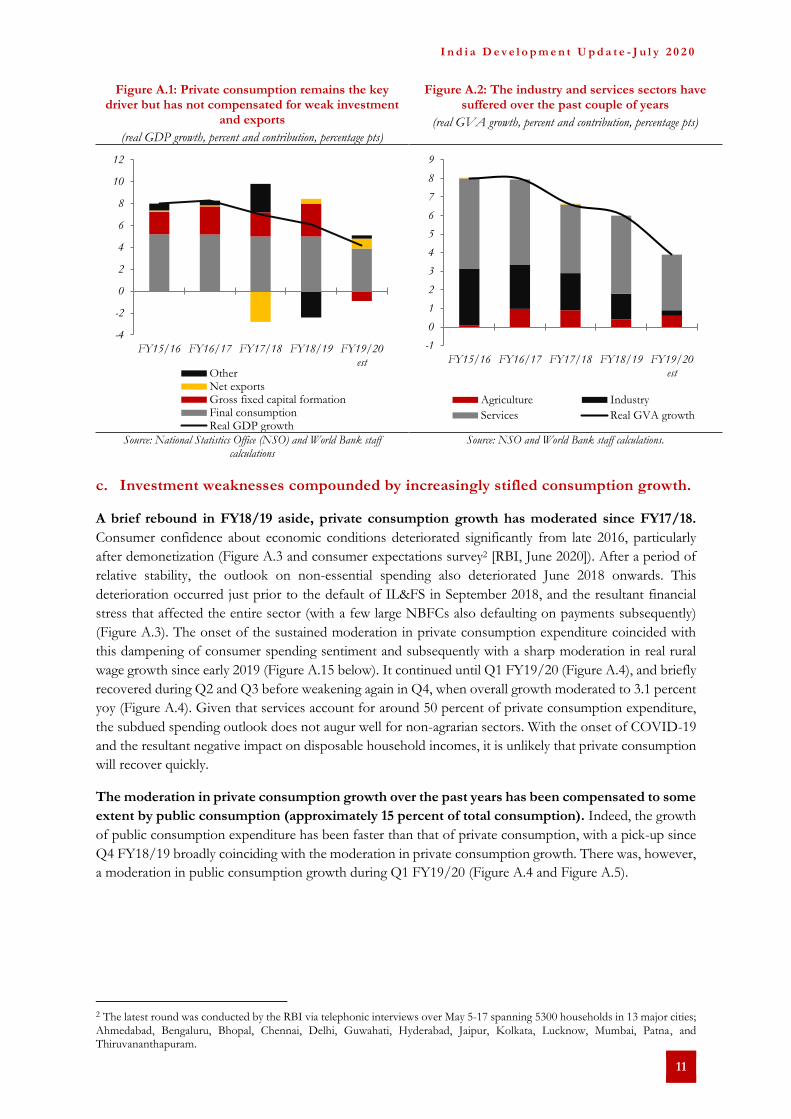
Figure A.19: The impact on mobility in India has been higher than some comparable economies ............ 19
Figure A.20: The mobility indices indicate a pick-up in mobility in India since April ................................... 19
Figure A.21: Moderation is noticed in growth of card transactions and inter-bank payments ..................... 20
Figure A.22: Number of households demanding MGNREGA work has increased in May and June ........ 20
Figure A.23: Growth (percent, yoy) in high-frequency indicators show the unprecedented impact of
COVID-19 .................................................................................................................................................................. 21
Figure A.24: Headline inflation picked up during November 2019 and June 2020 due to rising food inflation
....................................................................................................................................................................................... 23
Figure A.25: Vegetable prices particularly onion prices, contributed to the pick-up in food inflation ....... 24
Figure A.26: WPI and CPI diverged as aggregate demand fell in the economy .............................................. 24
Figure A. 27: Rural and Urban inflation converged with rising food inflation ................................................ 25
Figure A.28: Daily price changes of selected essential food grains due to COVID-19 lockdown in Mumbai,
Delhi, Kolkata and Chennai ..................................................................................................................................... 26
Figure A.29: Supply-chain bottlenecks caused prices to spike immediately following the lockdown .......... 28
Figure A.30: Both global and domestic factors contributed to a narrowing CAD…. .................................... 29
Figure A.31: Goods exports declined further in all categories…. ...................................................................... 29
Figure A.32: ….and goods imports declined at a faster pace than exports until Q3 ...................................... 29
Figure A.33: …while remittances remained strong despite the trade slowdown ............................................ 30
Figure A.34: The net services surplus has stabilized in recent years.................................................................. 30
Figure A.35: Services exports and imports growth continue to decline ........................................................... 30
Figure A.36: Portfolio flows remained robust in the first three quarters of FY19/20…. ............................. 31
Figure A.37: …. but took a hit in Q4 due to the COVID-19 outbreak ............................................................ 31
Figure A.38: Net FDI inflows remained robust with strong equity inflows .................................................... 32
Figure A.39: FDI equity inflows registered strong growth in FY19/20 ........................................................... 32
Figure A.40: FDI Equity inflows remained stable across various sectors ........................................................ 32
Figure A.41: Sources of variation in foreign exchange reserves ......................................................................... 33
Figure A.42: COVID-19 crisis worse than other sell-off episodes .................................................................... 34
Figure A.43: Debt outflows were higher than equity outflows .......................................................................... 34
Figure A.44: Many emerging markets witnessed significant net capital outflows ........................................... 34
Figure A.45: Emerging market currency depreciation since COVID-19 sell off ............................................ 34
Figure A.46: Financial markets plunged sharply from record levels due to the COVID-19 pandemic ...... 36
Figure A.47: The exchange rate depreciated on the back of monetary policy easing and capital outflows 37
Figure A.48: Yields fell on the back of monetary policy easing and targeted interventions by the RBI ..... 37
Figure A.49: Financial markets plunged sharply from record levels due to the COVID-19 pandemic ...... 38
Figure A.50: Overall, GNPAs improved compared to FY18/19… .................................................................. 38
Figure A.51: …while challenges remain in the NBFC sector ............................................................................. 38
Figure A.52: Credit growth was tepid throughout FY19/20… ......................................................................... 39
Figure A.53: …and no sector was immune to the moderation .......................................................................... 39
Figure A.54: Money supply growth has returned to pre-demonization rates .................................................. 40

Figure A.55: Fiscal deficit of the general government reversed its declining trajectory in recent years… .. 45
Figure A.56: …primarily because of high expenditures and weak tax proceeds ............................................. 45
Figure A.57: Tax and non-tax revenues declined in 2019-20 after a rise in 2018-19 on account of lower-
than-assumed tax buoyancy and weaker economic growth ................................................................................ 46
Figure A.58: Current expenditures contributed more to the growth of overall expenditures in 2019-20... 46
Figure A.59: The fiscal deficit and primary deficit both rose sharply in 2019-20 ........................................... 47
Figure A.60: Gross tax revenue declined due to the economic slowdown and tax cuts ................................ 47
Figure A.61: Corporate taxes had a negative contribution to revenue growth ................................................ 48
Figure A.62: The surplus capital transfer from the RBI contributed the most to non-tax revenues ........... 48
Figure A.63: Tax revenues, net of transfers to states declined despite a downward adjustment in devolved
taxes .............................................................................................................................................................................. 48
Figure A.64: Disinvestment receipts fell well below the budget estimates for 2019-20 ................................. 48
Figure A.65: Non-development spending and agriculture account for over half of the increase in total
spending....................................................................................................................................................................... 49
Figure A.66: Current spending shows a countercyclical increase, while capital expenditure growth is
subdued........................................................................................................................................................................ 49
Figure A.67: Subsidy expenditure remained largely stable .................................................................................. 50
Figure A.68: Expenditure growth outpaced growth in receipts ......................................................................... 50
Figure A.69: The fiscal deficit increased in FY19/20 following two years of relative fiscal prudence… ... 54
Figure A.70: …while the decline in borrowing post-UDAY resulted in lower debt ...................................... 54
Figure A.71: The increase in the primary deficit and the slowdown in growth contributed to the increase in
debt ............................................................................................................................................................................... 55
Figure A.72: In 2019-20, the rising primary deficit and the decline in real GDP growth have pushed up
central government debt ........................................................................................................................................... 56
Figure B.1: Global economy under the COVID-19 pandemic .......................................................................... 58
Figure B.2: Emerging market and developing economies ................................................................................... 59
Figure B.3: Financial markets turmoil .................................................................................................................... 60
Figure B.4: Oil price volatility and demand dynamics ......................................................................................... 61
Figure B.5: Global trade ............................................................................................................................................ 62
Figure B.6: Tariff Rates FY17/18 ........................................................................................................................... 67
Figure B.7: Tariffs Rates FY17/18 .......................................................................................................................... 67
Figure B.8: Tariffs Changes in Selected Sector: 2017-2019 ................................................................................ 68
Figure B.9: The main channels for short-term impacts of COVID-19 on household earnings ................... 83
Figure B.10: Impact of the COVID-19 crisis by expenditure decile in Scenario 1 – Aggregate................... 85
Figure B.11: Impact of the Covid-19 crisis by expenditure decile in Scenario 2 – Sectoral .......................... 85
Figure B.12: Impact of the COVID-19 crisis by expenditure decile in Scenario 3 – Institutional All ........ 86
Figure B.13: Impact of the COVID-19 crisis by expenditure decile in Scenario 3 – Institutional Urban .. 86
Figure B.14: Unpacking the relief package ............................................................................................................ 87
Figure B.15: Share of credit, March 2020 .............................................................................................................. 88
Figure B.16: GDP, electricity consumption, and night-time light intensity ..................................................... 94
Figure B.17: GDP, electricity consumption, and nighttime light intensity ....................................................... 95
Figure B.18: Deviation of electricity consumption from normal levels ............................................................ 96
Figure B.19: Effect of COVID-19 infections on districts’ night-time light intensity ..................................... 97
TABLES
Table A.1: Component-wise saving (% of GDP) ................................................................................................. 16
Table A.2: Percentage change in price of major commodities between 25 March and 28 April .................. 27
Table A.3: Measures to improve liquidity .............................................................................................................. 41

Table A.4: Measures to ease regulatory forbearance ............................................................................................ 42
Table B.1: Key Economic Indicators ..................................................................................................................... 65
Table B.2: Average Applied MFN Tariff (%) for Medical Products, 2019. ..................................................... 70
Table B.3: Impact on household expenditure per capita for different household types ................................ 85
Table B.4: Monthly co-movement of electricity and night-time lights with other indicators ....................... 95
BOXES
Box A.1: India’s post-GFC domestic investment and saving situation ............................................................ 14
Box A.2: The impact of COVID-19 on the financial and banking sectors ...................................................... 43
Box A.3: Economic stimulus and reform measures announced by the central government to alleviate the
impact of the COVID-19 outbreak ........................................................................................................................ 51
Box A.4: Financing measures adopted by the central government ................................................................... 53
Box B.1: Technology and Accountability Tools have Transformed Targeting and Delivery of Social
Protection in India since the early 2000s ............................................................................................................... 80
Box B.2: Unpacking the immediate policy response for the poor ..................................................................... 86

I n d i a D e v e l o p m e n t U p d a t e - J u l y 2 0 2 0
1
1. Overview
These are exceptional times worldwide. A highly infectious novel virus, COVID-19, has spread rapidly
across the globe, infecting nearly 17.3 million people, and causing over 670,000 deaths as of July 31, 2020,
in a short span of time. Governments have responded by limiting or prohibiting human interactions to
contain the spread of the virus and flatten the incidence curve. These containment measures have resulted
in an unprecedented decline in economic activity. The global economy is projected to contract sharply this
year even under the most benign baseline scenarios. While the contraction is likely to be steeper in advanced
economies, emerging markets and developing economies (EMDEs) are projected to contract markedly too.
Globalization has retreated further in the wake of the pandemic and old paradigms are being
challenged. International movement of persons has dramatically declined; global trade has nearly collapsed
due to anaemic global demand, disruptions in supply chains, and new protectionist measures; investor risk
aversion has increased, resulting in a flight to safety and capital flows reversal from emerging markets.
Existing models and previous assumptions about the policy space, role of the state, and adequacy of social
protection systems appear grossly inadequate to respond to the current situation.
India has been impacted by the virus too. Despite taking early pre-emptive distancing and isolation
measures, over 1.6 million people were infected, and over 35,700 deaths were attributed to the virus as of
end-July. As was the case elsewhere, the domestic containment measures and global developments are
projected to have sizable economic implications in India too.
The pandemic has afflicted India at a time when its economy had already been decelerating.
Defying a long-term accelerating path, real GDP growth moderated from 7.0 percent in 2017-18 to 6.1
percent in 2018-19 and 4.2 percent in 2019-20. The pre-COVID-19 growth deceleration was perceived to
be due to long-standing structural rigidities in key input markets; continuing balance sheet stress in the
banking and corporate sector, which were compounded more recently by stress in the non-banking segment
of the financial sector; increased risk aversion among banks and corporates; a decline in rural demand; and
a subdued global economy.
Several policy actions were initiated to arrest the pre-COVID-19 slowdown. These include a reduction
in the corporate tax rate; regulatory forbearances for micro, small, and medium enterprises (MSMEs), non-
bank financial companies (NBFCs), and the telecom and real estate sectors; recapitalization and
consolidation in the banking sector; an ambitious disinvestment plan, some rationalization, and reduction
in personal income tax rates; and business regulatory reforms. In addition, reversing nearly a two-decade
long process of trade liberalization, a number of tariff and non-tariff measures were initiated to restrict
imports.
The pandemic cut short any hope that these actions would yield the expected payoffs. The outlook
has now changed substantially, and the economy will likely contract in the current fiscal year. The economic
impact of the pandemic will be felt through the following channels: (i) a direct decline in domestic demand
and supply disruptions triggered by the containment measures, resulting in a near collapse in certain service
activities such as trade, transport, tourism, and travel; (ii) a second round of consumption and investment
slowdown, compounded by (and ultimately driving) distress in the financial sector and financial markets;
(iii) a global economic slowdown and decline in trade, resulting in a smaller global export market and weaker
remittances, and a retreat in capital flows amidst heightened risk aversion.
The government and the Reserve Bank of India (RBI) have taken timely and extensive policy
actions. These include enhanced social protection measures, monetary policy easing, regulatory
forbearance, and liquidity injections. These measures aim to provide immediate relief to households and
firms impacted by COVID-19. Besides these immediate recovery measures, the government has used the
opportunity to announce reforms aimed at easing investment in agriculture, and micro, small, and medium

I n d i a D e v e l o p m e n t U p d a t e - J u l y 2 0 2 0
2
enterprises, and reducing the size of the public sector. Going forward, it would be important to continue
with reforms to address the immediate and medium-term challenges that the economy faces. Most of these
are not new but have now acquired additional urgency and importance, to put the economy back on a
sounder footing toward a 7-percent-plus growth path.
a. Global economic implications of COVID-19
The ongoing COVID-19 pandemic is proving to be one of the most severe shocks to the world economy
in nearly a century. The global economy is consequently expected to contract in 2020. Advanced economies
are expected to transition from an expansion in 2019 to a contraction of several percentage points in 2020.
Global trade is experiencing its worst contraction in post-war history. The fall in activity has been
concentrated in traditionally stable service sectors such as tourism. While global value chains had benefitted
from a slight easing in tariffs and tensions between the United States and China in February 2020, the
COVID-19 outbreak has triggered stringent border controls and production delays that have dented the
global supply chains in recent months. Driven by collapsing demand, commodity prices have declined, led
by a precipitous fall in the price of oil. The pandemic is also expected to affect international migration and
remittances (please refer to the World Bank’s Migration and Development Brief). The economic slowdown
is likely to directly affect remittance outflows from the United States, the United Kingdom, and EU
countries; while falling oil prices will affect remittance outflows from GCC countries.
Global financial markets experienced volatility when the COVID-19 spread globally. The VIX index
of market volatility initially spiked to levels last seen during the global financial crisis (GFC) of 2008-09.
The strain on many countries’ financial systems was apparent amidst flight to safety by investors. Liquidity
stress permeated to several segments of the financial markets, including corporate and government debt.
As a result, many emerging and developing economies have had to endure a financial shock alongside a real
shock. They experienced substantial capital outflows, larger than in any other recent emerging market sell-
off event. This led to a tightening of financing conditions, widening bond spreads, and exchange rate
depreciation. Tightening liquidity made it more challenging for private and government borrowers to roll
over their debts.
These global developments have also impacted India. India is a large emerging market with an open
capital account. It has incrementally, but consistently, liberalized its capital account over the past two
decades. The COVID-19 outbreak has affected all key financial markets in India, including equity markets,
the exchange rate, bond yields, and non-resident portfolio flows. The equity market declined by nearly 28
percent, the exchange rate depreciated by 7 percent, and the net withdrawal of portfolio flows were of the
order of 16 billion dollars between January 30, when India declared its first COVID-19 case, and the end
of March. Equity markets later recovered, but they were 20 percent down from their level at the beginning
of the year as of the end of May. Bond yields in local currency declined by about 50 basis points (bps), even
as the spreads on dollar bonds increased.
A decline in oil prices is considered a positive terms of trade shock for India in ordinary times. It
alleviates pressure on the current account and can provide an opportunity to raise taxes on oil consumption
and phase-out energy subsidies. Under the current circumstances, with oil demand at historically low levels,
the positive effects of oil prices are likely to be muted.
b. The Indian economy before the COVID-19 shock
After averaging about 7 percent in the last decade, real GDP growth has decelerated in recent
years. Growth moderated from 7.0 percent in 2017-18 to 6.1 percent in 2018-19, and further to 4.2 percent
in 2019-20. The slowdown extended to investment, exports, and private consumption on the demand side;
and to manufacturing, construction, and various service activities on the production side. The growth
deceleration was perceived to be due to long-standing structural rigidities in key input markets, and

I n d i a D e v e l o p m e n t U p d a t e - J u l y 2 0 2 0
3
continuing balance sheet stress in the banking and corporate sectors, which were compounded more
recently by stress in the non-banking segment of the financial sector, increased risk aversion among banks
and corporates, and a subdued global economy.
In response, a number of policy actions were announced. These consisted of a reduction in the
corporate tax rate, regulatory forbearances for MSMEs, NBFCs, and the telecom and real estate sectors,
recapitalization and consolidation in the banking sector, an ambitious disinvestment plan, some
rationalization and reduction in the personal income tax, and business regulatory reforms.
Inflation has been well anchored and has declined steadily over the past decade, especially since
the country moved to inflation targeting in 2016-17. With economic growth moderating, and inflation
within the inflation targeting range, the RBI changed its monetary policy stance from neutral to
accommodative and lowered the policy rate four times, by a cumulative 110 bps from 6.25 percent to 5.15
percent during April 2019 and February 2020. Subsequently, it lowered the policy rate twice again in
response to the pandemic, by a total of 115 bps, bringing the key policy rate, repo, to 4.0 percent. It also
lowered the reverse repo rate by a larger cumulative amount of 155 bps – from 4.90 percent to 3.35 percent.
India’s external position has been robust, underpinned by a modest current account deficit and
large foreign reserves. The current account deficit (CAD) has averaged about 1.5 percent of GDP in the
past 5 years. It declined to 1.0 percent of GDP during 2019-20, due to a contraction in imports, attributed
to the slowdown in the economy, moderation in import prices, and to import substitution measures.
Exports have slowed as well, but less sharply than imports, resulting in an improvement in the trade and
CADs. Within total capital flows, India receives both FDI and portfolio equity and debt flows. Similar to
the experience of other emerging markets, FDI flows have been stable, while portfolio flows exhibit
episodic volatility.
The fiscal deficit has declined over the past decade, but it has exceeded the budget estimates in
recent years. Moreover, even as the officially reported deficit has declined, concerns have emerged about
the off-budget incurrence of the deficit. In the 2020-21 budget, the central government revised its deficit
estimate to 3.8 percent of GDP, up from 3.3 percent budgeted in 2019-20. The actual outturn was even
higher at 4.6 percent of GDP.
Likewise, general government debt increased to nearly 73 percent of GDP in 2019-20, after having
remained stable at around 69 percent in the previous years. In a technical sense, India’s public debt is
considered sustainable, being largely domestic, local currency denominated, and long term; and because
nominal GDP growth has typically been higher than the interest rate at which the debt has been raised. Yet,
the level of debt is high given India’s income level and market access. Debt servicing costs are at nearly 5
percent of GDP, which means that precious resources could be saved by consolidating debt or raising it
more efficiently. Besides, government borrowings nearly exhaust household savings, practically crowding
out the private sector. Further, the ongoing COVID-19 pandemic is expected to affect fiscal and debt
outcomes drastically, as we explain below.
The resolution of the decade-long balance sheet stress in the financial sector has remained a work
in progress. The RBI’s Financial Stability Report, released in July 2020, reports that even though the
banking sector is stable, there are key downside risks related to economic prospects. Risks related to
economic growth and India’s fiscal position were rated as ‘very high’. The overall NPA ratio declined from
its peak of 11.6 percent in 2018 to 8.5 percent in March 2020. While the government introduced measures
to address the prevalence of NPAs in the banking sector, including a novel Insolvency and Bankruptcy
Code, bank recapitalization program, and the consolidation of banks, the RBI noted the ratio is likely to
increase over the next year due to increased stress emanating from the current crisis.

I n d i a D e v e l o p m e n t U p d a t e - J u l y 2 0 2 0
4
c. The Impact of COVID-19 on the Indian Economy
The impact of COVID-19 on the economy has come in two phases. Initially, the main economic
impacts of COVID-19 were due to supply disruptions from China, and concentrated in activities such as
tourism, aviation, and other services. Thereafter, as the virus spread across the world, denting the economic
outlook and impairing investor sentiment, it further impacted growth, investment, exports, and remittances.
India implemented stringent lockdown and social distancing measures to curb the spread of the
COVID-19 pandemic, resulting in a quasi-standstill in economic activity in the first two months
of the current fiscal year. The lockdown period is likely to have adversely impacted the balance sheets of
households and firms. Social distancing provisions of varying stringency will probably need to remain in
place even beyond the lockdown period. Furthermore, even after the lockdown is lifted, businesses will
incur fixed and variable costs to adhere to new safety, hygiene, and social distancing norms. This would test
the viability of businesses. Another issue that may emerge is the availability of migrant workers to work in
urban centres after a large number of them returned home.
These mutually reinforcing disruptions in domestic supply and demand are expected to result in
a growth contraction in FY20/21, and the recovery is expected to be gradual thereafter.
Acknowledging considerable margins of uncertainty around any point estimate projection, using
information available until the end of May1, we projected that the economy will contract in FY20/21 by
over 3 percent and the rebound will be muted in FY21/22 in spite of the significant base effect. In the
current, rapidly evolving context these projections are likely to be revised as new information is
incorporated, especially as the daily number of cases continues to increase resulting in several states and
districts re-imposing lockdowns; and available high frequency indicators show that the economy has not
yet reverted to baseline. In our revised projections, which would be available in October 2020, we would
likely project a steeper contraction in the economy. The prospects for the global economy also remain
muted and this will add further downside risks to the outlook. On the supply side, the services sector will
be particularly impacted. On the demand side, any revival in domestic investment is likely to be significantly
delayed while neither private consumption, nor government spending, nor external demand available to
boost aggregate demand. Reflecting subpar economic activity, inflation is expected to fall to an average of
about 3.0 percent in FY20/21 before rising gradually in the following years. The current account is expected
to be almost balanced or in a small surplus in FY20/21, on the back of a decline in economic activity and
a weak external environment.
Significant fiscal implications are expected in the wake of the COVID-19 outbreak. With the revenue
outlook seriously dented, and new expenditure imperatives, the fiscal deficit and debt of the central and
state governments are likely to increase sharply over the next two years. In a baseline scenario, which takes
into account revised growth projections, lower-than-expected divestment proceeds, and new expenditure
commitments, the fiscal deficit of the central government is projected to increase to 6.6 percent of GDP
in FY20/21 and remain at a high of 5.5 percent in the following year. Assuming that, the states’ deficit is
contained within 3.5-4.5 percent of GDP, the deficit of the general government may rise to around 11
percent in FY20/21. India’s debt-to-GDP ratio is projected to increase significantly in the short term,
reflecting the expected contraction in GDP growth and increase in the primary deficit. While there is a
significant level of uncertainty around the projections, the general government debt-to-GDP ratio is
projected to peak at around 89 percent in FY22/23 before gradually declining thereafter. In alternative
scenarios, the deficit and debt numbers may turn out to be even higher.
1 The latest consensus forecasts are pointing to a contraction of 4.6 percent in FY20/21. This is a downward revision from the average forecast in June 2020 of a contraction 3.4 percent (Consensus Economics, July 13, 2020).

I n d i a D e v e l o p m e n t U p d a t e - J u l y 2 0 2 0
5
The risks to this outlook are mostly on the downside. They stem from mobility remaining significantly
constrained over the second quarter of the fiscal year, additional strains on the financial sector materializing,
and the global outlook deteriorating further.
Slow growth has been considered one of the main risks to the financial sector in RBI’s Financial
Stability Review. The risk could play out from the credit risk side as firms and households find it more
difficult to service their interest and repayment obligations in a slowing economy. Collateral values could
decline, and NBFCs would be particularly vulnerable since they lend to sectors susceptible to economic
and asset price cycles (personal, auto, housing, real estate loans). Banks may need to make higher
provisioning, and additional infusions of capital which would be hard to mobilize under a situation of fiscal
stress, and subdued valuations in financial markets. There is a concern regarding liquidity challenges turning
into solvency challenges.
d. COVID-19 impact on poverty
India has made remarkable progress in reducing absolute poverty since the 2000s, but challenges
remain. Between 2011 and 2015, poverty is estimated to have declined from 21.6 percent to 13.4 percent
(at the international poverty line), lifting more than 90 million people out of extreme poverty. However,
reducing broad-based poverty in the presently excluded groups (such as women and scheduled tribes) and
extending gains to a broader range of human development outcomes has remained challenging.
Half of India’s population remains vulnerable to a greater exposure to COVID-19 impacts, with
consumption levels precariously close to the poverty line. These households are at risk of slipping
back into poverty due to income and job losses triggered by COVID-19. Poorer households are more
prone to getting infected by the virus, since it is more difficult for them to implement social distancing and
as they have limited access to health care. The lockdown has had an adverse economic impact on the
informal sector, in which the poorer households are employed. Finally, any potential rise in prices can erode
their purchasing power.
The extent to which poverty is impacted will depend on the spread of contagion and market and
government responses. The impact will depend on how quickly labor markets adjust and the rate at which
migrant workers return to employment opportunities in urban locations after the restrictions are rolled
back. Meanwhile, social protection policies (PDS, MNREGA, cash transfers, pensions, support for SMEs)
have a key role in mitigating the shocks on the extreme poor.
Labor market informality constrains the ability of Indian households to cope and recover from
livelihood shocks triggered by lockdowns. Ninety percent of the Indian workforce is informal, without
access to significant savings or workplace-based social protection benefits such as paid sick leave or
provident fund. The latest Indian PLFS (2018-19) found that only 47.2 percent of urban male workers
and about 55 percent of urban female workers had regular wage/salaried employment in the usual status.
Even among workers in formal employment in the non-agricultural sector, about 70 percent did not have
written contracts and about 52 percent were not eligible for any form of social security benefits. These
populations are at risk of falling into poverty due to wage and livelihood losses triggered by slowing
economic activity.
In India, inter-state migrants are particularly at risk of increased poverty and destitution. Seasonal
migrants dominate low-paying, hazardous, and informal jobs in key sectors in urban areas, such as
construction. Estimates from the Economic Survey highlight that inter-state labor migration in India was
close to 9 million annually between 2011 and 2016. Migrant remittances are also vital for lower-income
Indian states. Following the loss of employment due to COVID-19 lockdowns, these migrant workers are
at increased risk of falling into poverty. The lack of portability in social protection benefits across state
boundaries makes migrants more vulnerable. With unemployment increasing, and the decline in earnings
and remittances, migrant workers and their families may need targeted support.
I n d i a D e v e l o p m e n t U p d a t e - J u l y 2 0 2 0
6
e. Policy imperatives to stabilize the economy and ensure medium-term outcomes
Most governments across the world have responded with monetary, fiscal, and regulatory policy
measures to support their economies. Measures along these lines have been announced in India too.
Under the Aatma Nirbhar Bharat Abhiyaan (Self-reliant India), the government announced an economic
stimulus package amounting to INR 20 trillion (about 10 percent of GDP). The package includes liquidity
measures announced by the RBI, the cost of regulatory forbearance, temporary tax relief, credit guarantee
programs, and direct spending on a range of measures. The bulk of the direct government spending was
aimed at poor and vulnerable households under the Pradhan Mantri Garib Kalyan Yojana (PMGKY),
which provides a package of cash and in-kind social assistance.
The package of measures uses India’s existing public distribution system (PDS) to create a
temporary basic minimum entitlement of rations for all and an increase in ration entitlements for
registered beneficiaries. Other measures include top-up cash transfers to farmers, higher wages under
the Mahatma Gandhi National Rural Employment Guarantee Scheme (MGNREGS), additional welfare
transfers to the elderly, widows, and the disabled, direct cash transfers to women with Jan Dhan Accounts,
and free cooking gas cylinders for three months to poor beneficiaries. The central government would make
provident fund contributions for employees and employers for 6 months for firms that mainly employ
workers below a certain income level. It also amended the Employee Provident Fund (EPF) regulations to
allow workers to access a non-refundable advance from their provident fund accounts. Forbearance
measures on tax collection included extending the last date for filing income tax, the last date of dispute
resolution and tax amnesty scheme and extending the deadline for filing Goods and Services Tax (GST)
returns.
States have also announced complementary welfare measures including increased entitlements of
subsidized rations through the PDS and increased direct cash transfers to beneficiaries of state pension
schemes. To ease the pressure on states budgets, the central government released their share of central
taxes for the month of April on the basis of budget estimates of revenue collection and encouraged state
governments to make direct transfers to unorganized construction workers from their Labor Welfare Board
funds. States’ borrowing limit has been increased from 3.0 to 3.5 percent of Gross State Domestic Product;
which could be further increased up to 5.0 percent, conditional on the implementation of a certain set of
reforms.
The RBI has announced an array of timely measures. Policy rates were cut by 75 bps (to 4.4 percent)
at the end of March and once again to 4 percent in May. Cash reserve requirements for banks were lowered
from 4 percent to 3 percent for a year. The RBI announced a moratorium on repayments of all term loans,
retail and corporate, to all financial institutions for three months, and a deferment of interest on working
capital facilities. It increased the overnight borrowing limit for commercial banks under the marginal
standing facility (MSF), and announced several liquidity easing measures targeted at different parts of the
financial system, including corporate bonds, NBFCs, and mutual funds. The RBI also increased the limit
on ways and means advances for states and took additional measures to ease their liquidity constraints.
Growth weaknesses may give rise to a number of challenges going forward, including on fiscal
outcomes, financial sector metrics, and investor sentiment. Thus, it would be important to navigate
the slowdown in a way that when COVID-19-related risks have subsided, the situation remains manageable
on fiscal, financial, and external accounts, and the economy can embark on a path of strong recovery and
resilience. It would be important to ensure that the medium-term reforms are carried out at some pace, and
the needed fiscal backstop is made available to ensure the stability of the banks and NBFCs. Since the
financial sector has been considered to be a growth bottleneck in past years, it would be important to
complete the restructuring and reforms required to put the sector on a sounder footing.
Fiscally, it would be challenging to generate tax and non-tax revenues, while there would be an
impetus to step up public expenditure. It would be useful to think of ways to finance elevated deficit

I n d i a D e v e l o p m e n t U p d a t e - J u l y 2 0 2 0
7
and debt. Reassessing subsidies to leverage any scope for efficiency gains may be useful. While it may be
necessary to borrow abroad, an informed discussion of how much can be safely borrowed, and in which
currency, would be useful. Once valuations in asset markets have been restored somewhat, one may think
of generating nontax revenues more aggressively than has been the case thus far. Tying the repayment of
new borrowings to disinvestment receipts may help put planned disinvestment back on the fast track. Even
if fiscal spending is the need of the hour, the way it is financed will become important both for the cost of
debt financing and its sustainability.
Capital flows and net balance of payment deficit would depend on the sentiment of global investors
and international liquidity conditions. Over the medium term, shifting the mix of capital toward FDI
would be useful to not only relax the resource constraint, but also to foster greater integration into global
value chains, spur complimentary domestic investments, and decrease India’s reliance on fickle portfolio
flows. In the short run, leveraging new resources from non-resident Indians may help bridge the gap in a
cost-efficient and safe way, as has been the case in some of the past episodes of balance of payment gaps.
The current pandemic has indicated that India could explore new economic opportunities in the
areas of digital technology, efficient retail, new avenues in health-tech and ed-tech services, and global
demand in areas such as pharmaceuticals, medical equipment, and protective gears. Leveraging these
opportunities can provide new growth levers. The crisis may also be used as an opportunity to expand the
coverage of social security and lay out a robust and modern system of social protection in urban areas and
expand the existing one in rural areas.
The COVID-19 crisis has raised additional questions on how to further support vulnerable sections
of the society, revive the economy, and support businesses and the financial sector: How much
fiscal space does the government have and how can additional revenue be raised? How would the
government and the RBI unwind their expanded positions? What would be the role of the state going
forward and how would this role be divided between the center and the states? How long will it take for
the consumer behavior to normalize? What kind of changes would persist beyond the pandemic and how
would businesses and public policy internalize them?
There is no precedent or clarity on these questions. The answer would depend crucially on the duration
of the pandemic, whether it will moderate after the current phase, and how soon normalcy in economic
activity and behaviour would be restored both nationally and globally. What one can say with more certainty
is that with vaccines not expected to be available for several months, and the herd immunity levels unlikely
to be reached within months, the current year will be challenging.
f. A closer look at selected policy and technical issues
Part B of the report provides the outlook for the global and the Indian economy and contains
discussion of a few policy and technical issues of topical interest. We provide in-depth coverage of
the issues related to trade policy, social protection, and the financial sector. We also discuss the innovative
use of high-frequency data such as electricity consumption and night-time data to track economic
momentum in real time and to complement more traditional measures. We also illustrate an exercise
containing micro-simulation analysis to assess the short-term distributional impacts of the COVID-19
crisis. The results of such a simulation exercise can provide useful benchmarks to design specific support
policies.
The note on trade policy developments reports that the global trade is showing continued
weakness amid heightened economic policy uncertainty. Direct supply disruptions are likely to affect
domestic production and export activities in India; furthermore, the growth shock in India’s major trading
partners will also reduce their export demand. India’s goods trade growth has already been slowing steadily
since 2013, and its growth decelerated further at the end of 2019. Services exports, on the other hand, have
maintained a healthy growth rate. Trade policy measures undertaken in the last few years have consisted of

I n d i a D e v e l o p m e n t U p d a t e - J u l y 2 0 2 0
8
both trade restrictive and liberalizing measures. While there has been an increase in simple average tariff
rates in 2018 and 2019, simultaneously, other measures have been taken to facilitate trade and liberalize
investments.
Looking ahead, the policy responses to a more uncertain global economy should seek to reduce
risks and provide stability for investors. The current crisis can open new opportunities for India. One
expected effect of the crisis is that multinationals will be seeking greater diversification of their activities
away from China. Whether India can seize this opportunity will depend on its capacity to implement
economic reforms, which may not include the use of tariffs as a recommended policy for India to
pursue. On the contrary, trade policy must be “an enabler.”
Social protection programs help people become resilient against the risks they face as they seek to
lead productive lives and expand their capabilities. The note on social protection outlines how India’s
overall social protection system can be strengthened in the context of the ongoing COVID-19 crisis. In
triggering a social protection response program through the PMGKY and Pradhan Mantri Garib Kalyan
Rojgar Yojana (PMGRY), India has relied on public works and in-kind and cash transfers through its
various pre-existing schemes and platforms. By doing so, the country is leveraging different mechanisms of
service delivery, including piggybacking on state government systems in the context of federal India, large
rural safety nets, food distribution outlets, community organizations and self-help groups, and direct benefit
transfers (DBTs) into bank accounts. The national government has also taken an important step to make
the PDS portable and more accessible during this time of crisis.
India’s existing social protection measures provide an important foundation to build a modern
social protection system. Future growth and resilience depend on how the social protection system
tackles disasters, decentralized governance, a flexible gig economy and demographic changes. At this stage
of development, where nearly half of India is precariously close to the poverty line and given the devastating
impacts of COVID-19, India needs an overarching strategy to guide how various innovations, schemes,
staff, and budgets will coordinate to ensure adequate social protection coverage for the poor and vulnerable.
The note on social protection identifies three areas for strategic reforms – (i) creating protocols which
empower states to provide cash-based assistance in the context of disasters and financing their social
protection needs (ii) scaling up portable cash and insurance support for the urban poor, and (iii) fostering
deeper accountability and institutional convergence for social protection. These reforms can help India
pivot its social protection system to address the needs of a more urban, mobile, and diverse population.
A third note points out that the recent liquidity and performance issues in the financial sector,
exacerbated by the COVID-19 crisis, present policymakers with a strong reason – and an
opportunity – to accelerate efforts toward building a more efficient, stable, and market-oriented
financial system. The COVID-19 pandemic risks exacerbating long-standing structural issues in the
financial sector such as slowing credit growth, liquidity shortages in the NBFC sector, and a high level of
non-performing loans (NPLs). Multiple reforms in recent years have improved India’s financial sector
oversight and financial inclusion, but more needs to be done to cope with the current headwinds and to
improve the safety, depth, and efficiency of financial intermediation. The authorities’ anti-crisis response in
recent months focused on injecting liquidity into the financial system and credit support windows to
MSMEs and NBFCs, among others. Borrowers were provided temporary relief through a loan moratorium
and suspension of insolvency procedures, while lenders benefit from regulatory forbearance. While these
extraordinary steps help mitigate the immediate crisis impact, preparations should be made to cope with an
anticipated increase in NPLs and potential solvency issues for banks and NBFCs after the measures expire.
The note identifies five areas for reforms for enhanced stability and efficiency of the sector. These
are as follows: (i) Maintaining financial sector stability is a critical challenge in the light of increased risks.
The toolkit may include the RBI’s continued focus on risk-based regulation and supervision; further
strengthening of financial sector safety nets; strengthening of liquidity and capital buffers as well as the

I n d i a D e v e l o p m e n t U p d a t e - J u l y 2 0 2 0
9
regulatory and institutional framework for debt restructuring and insolvency. 2) Reforms in the NBFC
sector are needed to support its role in channelling credit to the real sector. 3) Deeper capital markets are
critical for increasing the availability of long-term finance, especially given the asset-liability mismatches in
the banking sector. 4) The role of fintech in accelerating financial inclusion in India has been impressive,
but the synergies between fintech and MSMEs has yet to be fully exploited. Fintech lenders have lower
origination costs and turnaround times than traditional lenders and could help borrowers, especially
MSMEs, restart business activities post lockdown. 5) It is encouraging that the government is moving to a
more selective and strategic public sector footprint in the financial sector, as witnessed by the consolidation
of PSBs and strengthening their corporate governance and oversight. Gradually scaling back the statutory
requirement for state banks to provide liquidity, as well as the priority-sector lending policy, would be
helpful to reduce market distortion. In the longer run, when the market conditions improve, a mix of private
capital injections into state banks and, in some cases, full privatization could be considered.
While it is clear that economic activity has been disrupted by the COVID-19 pandemic, quantifying
this disruption in real time is challenging. This report examines how two proxies for economic activity
– electricity consumption and night-time light intensity – can be used to track developments and to
complement more traditional measures. Electricity consumption was nearly 30 percent below normal levels
at the end of March, remained a quarter below normal levels in April, 14 percent below normal in May, and
was still 8 percent below normal in June. In April, night-time light intensity declined in more than two
thirds of the districts and the average decline was 12 percent. These findings have implications for the
trajectory of the rebound of the economy.
Finally, the COVID-19 crisis threatens to reverse the remarkable gains India has experienced in
poverty reduction. The economic and distributional impacts of the crisis are likely to differ depending on
the sectors where households work and the nature of work arrangements. In the absence of high-frequency
data on living standards, we present a micro-simulation analysis, and an illustrative exercise to assess the
short-term distributional impacts of the COVID-19 crisis. The results of such a simulation exercise can
provide useful benchmarks to design specific support policies.

I n d i a D e v e l o p m e n t U p d a t e - J u l y 2 0 2 0
10
PART A – Recent Economic Developments
2. Real Sector
The COVID-19 shock came at a time when India’s growth was already moderating. The tentative signs of a revival in
economic activity, seen in the last quarter of FY19/20, have disappeared. The weakness in investment that characterized
recent years is likely to persist, and consumption is also likely to moderate. While the contribution of industry to growth has
fallen in recent years, services sector activity has also slowed during FY19/20. COVID-19 is affecting the real economy via
multiple channels, including via the financial sector. Growth is expected to be negative in FY20/21, despite a strong policy
response by the Government and the RBI.
The Indian economy is facing its biggest challenge in recent times with a blanket disruption of
economic activity on a scale worse than the GFC. In response to the COVID-19 outbreak, India began
proactively regulating the cross-border flows of people and goods in February and subsequently imposed
an all-encompassing lockdown in phases—the first phase (March 25–April 14) witnessed a total cessation
of economic activities except for those deemed “essential.” The subsequent phases were characterized by
a calibrated opening of specific activities.
Initial data points to massive disruptions in economic activity. The COVID-19 pandemic and the
public health responses have halted activity across sectors, triggered unprecedented risk-aversion among
consumers, and are likely to fundamentally alter the way agents interact given that social distancing measures
are likely to remain in place for the foreseeable future. Experience from other countries indicates that
mobility and activity are unlikely to revert to their full pre-crisis extent even after the health emergency
abates.
a. COVID-19 hit against the backdrop of weakening domestic activity
Unlike the GFC, the COVID-19 shock is not a conventional financial crisis. The initial shock
materialized in the form of trade disruptions (with exports to and imports from affected countries like
China being curtailed) and the cessation of tourism flows. Subsequently, as lockdowns were imposed,
domestic activity ceased in large swathes of the real sector—and both formal and informal segments. Unlike
the GFC that hit after years of strong growth, the onset of the COVID-19 outbreak occurred against the
backdrop of weakening activity in India, and of lingering challenges in banking and non-banking channels.
While investment had been subdued for years, private consumption growth had also begun to weaken. A
subdued global environment – characterized by weak trade flows – had exacerbated these trends.
b. Economic growth moderated significantly in FY18/19 and FY19/20
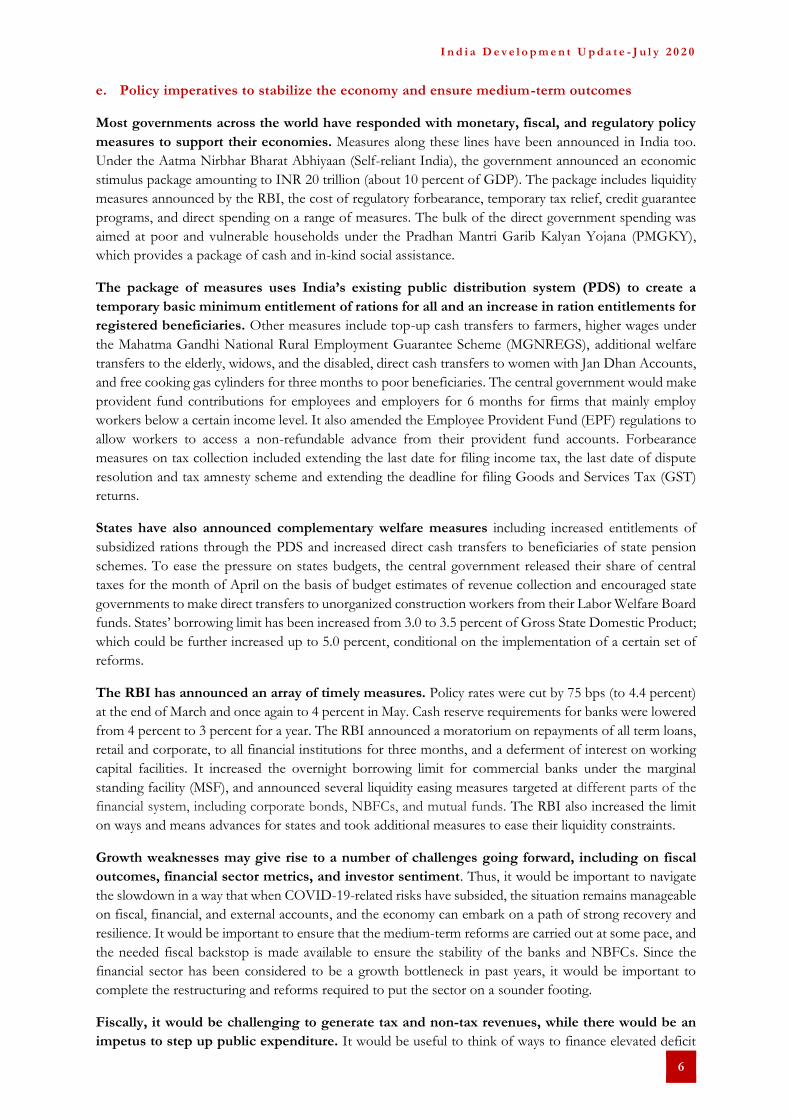
In FY19/20, India experienced slowing growth for the third consecutive year. Real GDP growth is
estimated to have eased to 4.2 percent in FY19/20, from 6.1 percent in FY18/19 (a year characterized by
stress in the non-banking segment of the financial sector, due to the failure of a systemically important non-
bank financial company – IL&FS) and 7 percent in FY17/18 (Figure A.1 and Figure A.2). Over the past 5
years (FY15/16–FY19/20) private consumption growth averaged 7.1 percent, although it moderated to 5.3
percent in FY19/20. Investment growth averaged 5.8 percent and contracted in FY19/20. Overall, the
slowdown is characterized by (i) fluctuating investment growth and a contraction in FY19/20; (ii) relatively
steady aggregate consumption growth between FY15/16 and FY18/19 but a significant moderation in
FY19/20, and (iii) volatility in net exports, with a positive contribution to GDP growth in FY19/20, mostly
due to a contraction in imports (reflecting weak domestic activity) (Figure A.1). These trends were reflected,
on the supply side, in a steadily declining contribution to the growth of the industry sector, aggravated in
FY19/20 by declining contribution from the services sector as well (Figure A.2).
I n d i a D e v e l o p m e n t U p d a t e - J u l y 2 0 2 0
11
Figure A.1: Private consumption remains the key driver but has not compensated for weak investment
and exports
(real GDP growth, percent and contribution, percentage pts)
Figure A.2: The industry and services sectors have suffered over the past couple of years
(real GVA growth, percent and contribution, percentage pts)
Source: National Statistics Office (NSO) and World Bank staff calculations
Source: NSO and World Bank staff calculations.
c. Investment weaknesses compounded by increasingly stifled consumption growth.
A brief rebound in FY18/19 aside, private consumption growth has moderated since FY17/18.
Consumer confidence about economic conditions deteriorated significantly from late 2016, particularly
after demonetization (Figure A.3 and consumer expectations survey2 [RBI, June 2020]). After a period of
relative stability, the outlook on non-essential spending also deteriorated June 2018 onwards. This
deterioration occurred just prior to the default of IL&FS in September 2018, and the resultant financial
stress that affected the entire sector (with a few large NBFCs also defaulting on payments subsequently)
(Figure A.3). The onset of the sustained moderation in private consumption expenditure coincided with
this dampening of consumer spending sentiment and subsequently with a sharp moderation in real rural
wage growth since early 2019 (Figure A.15 below). It continued until Q1 FY19/20 (Figure A.4), and briefly
recovered during Q2 and Q3 before weakening again in Q4, when overall growth moderated to 3.1 percent
yoy (Figure A.4). Given that services account for around 50 percent of private consumption expenditure,
the subdued spending outlook does not augur well for non-agrarian sectors. With the onset of COVID-19
and the resultant negative impact on disposable household incomes, it is unlikely that private consumption
will recover quickly.
The moderation in private consumption growth over the past years has been compensated to some
extent by public consumption (approximately 15 percent of total consumption). Indeed, the growth
of public consumption expenditure has been faster than that of private consumption, with a pick-up since
Q4 FY18/19 broadly coinciding with the moderation in private consumption growth. There was, however,
a moderation in public consumption growth during Q1 FY19/20 (Figure A.4 and Figure A.5).
2 The latest round was conducted by the RBI via telephonic interviews over May 5-17 spanning 5300 households in 13 major cities;
Ahmedabad, Bengaluru, Bhopal, Chennai, Delhi, Guwahati, Hyderabad, Jaipur, Kolkata, Lucknow, Mumbai, Patna, and Thiruvananthapuram.
-4
-2
0
2
4
6
8
10
12
FY15/16 FY16/17 FY17/18 FY18/19 FY19/20est
OtherNet exportsGross fixed capital formationFinal consumptionReal GDP growth
-1
0
1
2
3
4
5
6
7
8
9
FY15/16 FY16/17 FY17/18 FY18/19 FY19/20est
Agriculture Industry
Services Real GVA growth

I n d i a D e v e l o p m e n t U p d a t e - J u l y 2 0 2 0
12
Figure A.3: Household perceptions of the general economic situation and outlook on (non-essential) spending had worsened even before the advent of COVID-19
(percentage responses expecting the general economic situation to worsen and a decline in non-essential spending)
Source: RBI
Figure A.4: Private consumption growth has
moderated since Q2 FY18/19
(real, percent yoy)
Figure A.5: Public consumption growth has remained steady
(real, percent yoy)
Investment growth has turned negative in FY19/20. Growth in gross fixed capital formation remained
steady between Q3 FY17/18 and Q3 FY18/19 but subsequently collapsed and turned negative over the
last three quarters of FY19/20 (Figure A.6). Overall, low rates of investment growth are manifested in weak
credit uptake from banks and reflect the lingering impact of the “twin balance sheet” problem3, the
resolution of which is still a work-in-progress. In addition, financial stress in the NBFC sector (following
the IL&FS default in September 2018) suggests that the non-banking financial sector is also not immune
to the difficulties that banks faced since the GFC. Consequently, as NBFCs began to experience financing
bottlenecks, credit growth in the commercial sector fell sharply in FY18/19 and FY19/20.
Slowing activity both at home and abroad was reflected in a decline in import and export growth
since the second half of 2019. Export growth moderated sharply from Q4 FY18/19 onwards, as the
global outlook became more uncertain and weaknesses in the financial sector began to affect domestic
3 Unresolved instances of high corporate indebtedness coupled with NPA burden of public sector banks.
0.0
10.0
20.0
30.0
40.0
50.0
60.0
70.0
80.0
Sep
-15
Feb
-16
Jul-16
Dec
-16
May
-17
Oct
-17
Mar
-18
Aug
-18
Jan-
19
Jun-
19
Nov
-19
Apr
-20
current perception (eco. situation) 1-year ahead perception (eco. situation)current perception (ne spending) 1-year ahead perception (ne spending)
6.6
2.7
0
2
4
6
8
10
12
Q1 F
Y16/
17
Q2 F
Y16/
17
Q3 F
Y16/
17
Q4 F
Y16/
17
Q1 F
Y17/
18
Q2 F
Y17/
18
Q3 F
Y17/
18
Q4 F
Y17/
18
Q1 F
Y18/
19
Q2 F
Y18/
19
Q3 F
Y18/
19
Q4 F
Y18/
19
Q1 F
Y19/
20
Q2 F
Y19/
20
Q3 F
Y19/
20
Q4 F
Y19/
20
13.413.6
0
5
10
15
20
25
Q1 F
Y16/
17
Q2 F
Y16/
17
Q3 F
Y16/
17
Q4 F
Y16/
17
Q1 F
Y17/
18
Q2 F
Y17/
18
Q3 F
Y17/
18
Q4 F
Y17/
18
Q1 F
Y18/
19
Q2 F
Y18/
19
Q3 F
Y18/
19
Q4 F
Y18/
19
Q1 F
Y19/
20
Q2 F
Y19/
20
Q3 F
Y19/
20
Q4 F
Y19/
20

I n d i a D e v e l o p m e n t U p d a t e - J u l y 2 0 2 0
13
firms. Growth in imports declined steadily over this period, as domestic activity slowed, oil prices softened
from October 2018 onwards, and import duties were raised on certain commodities (Figure A.7).
The declining trend in exports and imports is expected to be exacerbated by the onset of COVID-
19. Exports are projected to decline further, as global demand remains weak and domestic supply chains
disruptions remain to some extent. Imports are expected to remain weak due to subdued domestic activity.
Data for March 2020 indicate a 35 and 29 percent decline yoy in exports and imports, respectively, in
nominal terms (see section 3 for a detailed discussion).
Figure A.6: Investment growth has turned negative
(real, percent yoy)
Figure A.7: Imports have contracted faster than exports as domestic activity has weakened
(real, percent yoy)
Source: NSO and World Bank staff calculations
-5.2-6.5
-10
-5
0
5
10
15
Q1 F
Y16/
17
Q2 F
Y16/
17
Q3 F
Y16/
17
Q4 F
Y16/
17
Q1 F
Y17/
18
Q2 F
Y17/
18
Q3 F
Y17/
18
Q4 F
Y17/
18
Q1 F
Y18/
19
Q2 F
Y18/
19
Q3 F
Y18/
19
Q4 F
Y18/
19
Q1 F
Y19/
20
Q2 F
Y19/
20
Q3 F
Y19/
20
Q4 F
Y19/
20
-15
-10
-5
0
5
10
15
20
25
30
Q1 F
Y16/
17
Q2 F
Y16/
17
Q3 F
Y16/
17
Q4 F
Y16/
17
Q1 F
Y17/
18
Q2 F
Y17/
18
Q3 F
Y17/
18
Q4 F
Y17/
18
Q1 F
Y18/
19
Q2 F
Y18/
19
Q3 F
Y18/
19
Q4 F
Y18/
19
Q1 F
Y19/
20
Q2 F
Y19/
20
Q3 F
Y19/
20
Q4 F
Y19/
20
Export Import

I n d i a D e v e l o p m e n t U p d a t e - J u l y 2 0 2 0
14
Box A.1: India’s post-GFC domestic investment and saving situation
The growth “boom” during India’s “dream run” in the mid-2000s was driven by the private corporate sector (Nagaraj,
20134). India’s investment rate climbed to about 36 percent of GDP prior to the GFC (Figure A.8), financed primarily
by credit from PSBs. As the GFC depressed economic activity and future revenue flows, a significant number of private
projects became unviable. As private indebtedness increased, the balance sheets of public banks deteriorated markedly
and non-performing assets (NPA) ballooned. The resulting “twin balance sheet” (TBS) problem—impaired balance
sheets of private corporates as well as public banks—induced risk aversion and depressed the flow of credit (Economic
Survey, 2016-17). The extent of the TBS problem only became fully clear in 2015, following the RBI’s Asset Quality
Review (Figure A.11) and resolution was delayed. It remains a work in progress, despite the ratio declining over the
past two years.
Gross fixed capital formation as a share of GDP in nominal terms declined by 9 percentage points between FY07/08
and FY19/20 (Figure A.8).
Figure A.8: Gross fixed capital formation
(nominal, percent of GDP)
Figure A.9: Growth in fixed investment
(real, percent)
Source: NSO. Source: NSO.
The growth rate in real private investment over FY12/13 and FY18/19 averaged at about 8 percent compared to about
18 percent over FY05/06 to FY11/125. Peaks in private corporate investment growth in recent years have mostly
coincided with peaks in public investment growth, while remaining subdued in other years (Figure A.9). Figure A.6
above shows that the uptick in GFCF witnessed in FY18/19 has not been sustained. That (private) investment has
remained subdued in recent years is borne out by trends in other real indicators of investment that are compiled outside
the national accounts:
Production of capital goods: Data from the old index of industrial production (IIP) capital goods (that is available
up to March 2017) shows that the average growth rate over FY12/13 to FY16/17 has been negative, at 3.0 percent vis-
à-vis an average of 17.1 percent over FY06/07 to FY11/12. Data for the new series of IIP (base 2011-12) also indicates
that growth in the production of capital goods over FY12/13 and FY19/20 has been negative – 0.4 percent on average
(Figure A.10).
4 Nagaraj, R., “India’s Dream Run, 2003-08: Understanding the Boom and Its Aftermath”, Economic and Political Weekly, Vol. 48(20), May 2013.
5 The break-up of investment into public and private is not available for FY19/20.
35.8
26.9
20
22
24
26
28
30
32
34
36
38
FY
01/02
FY
03/04
FY
05/06
FY
07/08
FY
09/10
FY
11/12
FY
13/14
FY
15/16
FY
17/18
FY
19/20 -15
-10
-5
0
5
10
15
20
25
FY13 FY14 FY15 FY16 FY17 FY18 FY19GFCF Private corporatePublic Households

I n d i a D e v e l o p m e n t U p d a t e - J u l y 2 0 2 0
15
Bank credit: Post GFC, credit growth continued to
be robust for a while, possibly reflecting expectations
of a strong growth rebound. However, following a
series of steps by the government and the RBI
(including the Asset Quality Review conducted during
FY15/16), the magnitude of the TBS problem began
to emerge. As the NPA ratio of PSBs increased sharply
from FY15/16 onwards (Figure A.11), credit to
industry suffered (compared to the services sector that
was less affected). Credit to industry registered
negative growth rates in real terms from late 2015
onwards (Figure A.12). The micro, small, and medium
segments of industry were hit particularly hard by the
ensuing credit crunch.
Figure A.11: Gross NPA declined over the past two
years, but stay elevated…
(percent of gross advances)
Figure A.12: …while bank credit growth has
eased
(real, percent yoy)
Source: RBI. Source: RBI.
The risk is that the COVID-19 shock will further delay the resolution of the TBS problem while potentially creating
new stress-points in the financial system. Even if outright bankruptcy can be avoided, firms in most sectors are likely
to see an extended period of weak demand and, additionally, a number of logistics-related issues over the short run (for
example, increased costs for re-establishing operations or resuming production post lockdown to meet enhanced health-
related and social-distancing norms). These factors make it unlikely that there will be swift return to “business as usual,”
thereby clouding prospects of a swift restoration of the investment cycle.
Gross Domestic Saving
The bulk of the financing for investment is from domestic sources. India’s domestic saving rate has declined by more
than 4 percentage points over the past 7 years, yet it remains higher than most comparable emerging market and
developing economies.
The decline in gross saving between FY11/12 and FY18/19 (by 4.5 pp) has been driven by a 5.5 percentage points
decline in household saving, counterbalanced only marginally by an increase in saving by the private corporate sector
(by about 1 percentage points), with saving by the public sector remaining broadly unchanged (Table A.1). However,
the bulk of the decline in household saving over the past 7 years has been on account of lower physical savings,
particularly in physical assets. This fall, however, did not translate into a sustained rise in net financial saving, which is
more relevant for the purpose of capital formation since household financial liabilities have increased in recent years.
While updated estimates of saving for FY19/20 will be released by the NSO in January 2021, estimates of households’
financial assets and liabilities based on quarterly data, released in the RBI Bulletin (June 2020), indicate that net financial
assets of households have increased to 7.7 percent of GDP in FY19/20 from 7.2 percent in FY18/19.
Figure A.10: Capital goods production has moderated
(percent, yoy, 3mma)
Source: Ministry of Statistics and Programme Implementation (MOSPI).
0
5
10
15
20
2000
2001
2002
2003
2004
2005
2006
2007
2008
2009
2010
2011
2012
2013
2014
2015
2016
2017
2018
2019
2020
SCB
Public Sector Banks
-20
0
20
40
60Ja
n-12
Mar
-13
May
-14
Jul-15
Sep
-16
Nov
-17
Jan-
19
Mar
-20
Services Industry
NBFC
-30
-20
-10
0
10
20
30
40
50
60
70
Jun-
06
Sep
-07
Dec
-08
Mar
-10
Jun-
11
Sep
-12
Dec
-13
Mar
-15
Jun-
16
Sep
-17
Dec
-18
Mar
-20
IIP (2004-05) series
IIP (2011-12) series

I n d i a D e v e l o p m e n t U p d a t e - J u l y 2 0 2 0
16
Table A.1: Component-wise saving (% of GDP)
Source: NSO.
Although households remain the primary suppliers
of saving for the purposes of capital formation,
their share has declined from nearly 70 percent in
FY11/12 to around 60 percent in FY18/19 (Figure
A.13). The share of financial corporations has also
declined from 9 percent in FY11/12 to 6.2 percent
in FY18/19. India has a high rate of saving on
aggregate, but if it co-exists with a subdued share
of net household financial saving, mobilizing
finances for investment, especially long-term
investment, will remain complicated going
forward.
FY11/
12
FY12/
13
FY13/
14
FY14/
15
FY15/
16
FY16/
17
FY17/
18
FY18/
19
1. Gross saving (a+b+c) 34.6 33.9 32.1 32.2 31.1 31.3 32.4 30.1
a. Public sector 1.5 1.4 1.0 1.0 1.2 1.7 1.7 1.5
b. Private corporate sector 9.5 10.0 10.7 11.7 11.9 11.5 11.6 10.4
c. Household sector 23.6 22.5 20.3 19.6 18.0 18.1 19.2 18.2
i. Net financial saving 7.4 7.4 7.4 7.1 8.1 7.4 7.7 6.5
Gross financial saving 10.7 10.7 10.6 10.1 10.9 10.5 12.1 10.5
Less financial liabilities 3.3 3.3 3.2 3.0 2.8 3.0 4.3 4.0
ii. Physical saving 16.3 15.1 12.9 12.5 9.9 10.7 11.4 11.7
of which physical assets 15.9 14.7 12.6 12.1 9.6 10.4 11.2 11.5
Figure A.13: Finances for capital formation (% of gross saving)
Source: RBI and MOSPI.
d. Contrasting fortunes on the supply side: a rebound in the agriculture sector, a sharp slowdown in the industrial sector and a moderation in services
Agriculture growth rebounded in FY19/20 after slowing in FY18/19 (Figure A.14). The rebound
happened on the back of a steady monsoon (rainfall over June–September 2019 was 110 percent of the
long-period average) and the lagged effect of income support schemes for farmers (extended by the central
government and a few state governments).
Rural wages have moderated. Wage labour is estimated to constitute about 43 percent of the average
monthly income of rural households6. A sustained fall in real rural wages of workers, in both agricultural
and non-agricultural occupations, was witnessed between July 2017 and July 2018. This was followed by a
moderate increase in both categories until January 2019, which has subsequently reversed. Data available
until March 2020 indicate that real wage growth in both segments remain in negative territory despite some
improvement in early 2020 (Figure A.15). This trend has been accompanied by a sustained fall in food
6 According to the National Bank for Agriculture and Rural Development (NABARD) All India Rural Financial Inclusion Survey 2016-17, wage labour is estimated to constitute 34 and 54 percent of the average monthly income of agricultural and non-agricultural households respectively.
28 29.4 33.4 35.3 39.2 37.5 37.4 36.1
68.2 66.4 63.3 60.7 57.8 57.8 59.2 60.3
-50
0
50
100
150
FY11/12
FY12/13
FY13/14
FY14/15
FY15/16
FY16/17
FY17/18
FY18/19
Household sector General governmentFinancial corporations Non-financial corporations

I n d i a D e v e l o p m e n t U p d a t e - J u l y 2 0 2 0
17
prices between Q4FY17/18 and Q4FY18/19. Data on fast moving consumer goods (FMCG) compiled by
Nielsen showed a sharp slowdown in rural consumption to a 7-year low during Q2 FY19/207.
Figure A.14: Agriculture growth is on a rebound, industrial growth has turned negative, while
services growth has moderated (yoy real GVA growth, percent)
Figure A.15: Real rural wage growth has turned negative
(%, yoy, combined men and women)
Source: NSO. Source: Labour Bureau.
Note: Does not include data on all occupation codes for women.
Figure A.16: Unemployment rate touched a historic high in May 2020 (monthly, percent)
Source: CMIE.
The COVID-19 outbreak led to a spike in both rural and urban unemployment. Data from the Centre
for Monitoring Indian Economy (CMIE) suggests that unemployment increased marginally in both rural
and urban areas between April 2019 and March 2020, but spiked to above 20 percent in April and May as
the lockdowns were imposed (Figure A.16: Unemployment rate touched a historic high in May 2020). Even
with a sharp decline in the unemployment rates in June, it remains to be seen if it can be sustained at these
levels in the coming months. Rising unemployment is expected to subject a large number of households to
income shocks.
Industrial growth has declined sharply since Q4 FY17/18 and turned negative during the second
half of FY19/20 (Figure A.17). This reflects the mutually reinforcing effects of weakening demand and
financial sector stress. Specifically, the stress in the NBFC sector post Q2 FY18/19 has affected housing
7 Please refer to the Livemint report https://www.businesstoday.in/current/economy-politics/fmcg-rural-growth-lowest-in-7-years-nielsen-report-poor-farm-income-pulls-down-retail-sales/story/385428.html.
-2
0
2
4
6
8
10
12
Q1 F
Y16/17
Q2 F
Y16/17
Q3 F
Y16/17
Q4 F
Y16/17
Q1 F
Y17/18
Q2 F
Y17/18
Q3 F
Y17/18
Q4 F
Y17/18
Q1 F
Y18/19
Q2 F
Y18/19
Q3 F
Y18/19
Q4 F
Y18/19
Q1 F
Y19/20
Q2 F
Y19/20
Q3 F
Y19/20
Q4 F
Y19/20
Agriculture Industry Services
-6%
-4%
-2%
0%
2%
4%
6%
Mar
-15
Jun-
15
Sep
-15
Dec
-15
Mar
-16
Jun-
16
Sep
-16
Dec
-16
Mar
-17
Jun-
17
Sep
-17
Dec
-17
Mar
-18
Jun-
18
Sep
-18
Dec
-18
Mar
-19
Jun-
19
Sep
-19
Dec
-19
Mar
-20
Agricultural Non-agricultural
-3
2
7
12
17
22
27
Apr
-18
May
-18
Jun-
18
Jul-18
Aug
-18
Sep
-18
Oct
-18
Nov
-18
Dec
-18
Jan-
19
Feb
-19
Mar
-19
Apr
-19
May
-19
Jun-
19
Jul-19
Aug
-19
Sep
-19
Oct
-19
Nov
-19
Dec
-19
Jan-
20
Feb
-20
Mar
-20
Apr
-20
May
-20
Jun-
20
Rural Urban All

I n d i a D e v e l o p m e n t U p d a t e - J u l y 2 0 2 0
18
finance companies and, in turn, the real estate sector. Small and medium firms, which rely significantly on
NBFCs, have faced an additional credit crunch. The financial stress on firms, including MSMEs8, has
adversely affected investment and manufacturing growth9. Weak manufacturing activity is also reflected in
a moderation in electricity generation. The rate of growth of electricity generation was over 3 percentage
points lower on average between Q1 FY18/19 and Q4 FY19/20, compared to the eight prior quarters. As
a result, the contributions of construction, manufacturing and electricity generation to industrial growth
have declined (Figure A.17). Given increased uncertainty post-COVID-19, it is unlikely that there will be a
quick revival of manufacturing or mining in the near-term. Sectors like construction that have been
impacted by social-distancing norms and labour shortage during the lockdown (given the exodus of migrant
labour away from large cities) also face challenges in resuming activities quickly.
Figure A.17: The manufacturing sector weakened
significantly in FY19/20
(yoy real growth in industry in percent, contribution in percentage
points)
Figure A.18: Contribution of internal trade and
financial services to services growth have fallen
(yoy real growth in services in percent, contribution in percentage
points)
Source: NSO and World Bank staff calculations Source: NSO and World Bank staff calculations
The impact of COVID-19 on industry is expected to be severe, as the sector was already under
stress. The manufacturing sector has faced the brunt of the first-round effects of the pandemic (as imports
of key intermediates suffered) and is likely to be impacted further by second-round effects in the form of
demand shocks. The industrial sector accounts for 25 percent of total employment and in sub-sectors such
as manufacturing and construction a majority of usually working persons are either self-employed or casual
workers. Unemployment will entail income losses not only for urban households but also for rural
agricultural households that supply migrant labour to cities in these activities.
The services sector is also witnessing a major disruption. Growth in the services sector (which
accounts for around 32 percent of total employment) moderated in FY19/20. Over the past 4 years, there
was a decline in the contribution of the “financial, real estate, and business” and “internal trade, hotels, and
transport” subsectors in aggregate services growth. By contrast, the contribution of “public administration,
defence, and other services,” which reflects government spending, has remained relatively steady, especially
over FY19/20 (Figure A.18). With the onset of COVID-19 and the ensuing lockdown essentially freezing
tourism and mobility, the hotel, restaurants, transport, and internal trade subsegments of services have been
8 Around 67 percent of MSMEs are estimated to be engaged in manufacturing and trade-related activities (Annual Report 2018-19, Ministry of Micro, Small and Medium Enterprises, Government of India).
9 Media reports, in early June, of a survey conducted by the All India Manufacturers’ Organization comprising 46,000 responses from various industry groups indicated that businesses of nearly 35 percent of MSMEs were severely affected in the wake of the COVID-19 pandemic. Please refer to the link https://economictimes.indiatimes.com/small-biz/sme-sector/over-one-third-msmes-start-shutting-shop-as-recovery-amid-covid-19-looks-unlikely-aimo-survey/articleshow/76141969.cms accessed on June 8, 2020.
-2
0
2
4
6
8
10
12
Q1 F
Y16/17
Q2 F
Y16/17
Q3 F
Y16/17
Q4 F
Y16/17
Q1 F
Y17/18
Q2 F
Y17/18
Q3 F
Y17/18
Q4 F
Y17/18
Q1 F
Y18/19
Q2 F
Y18/19
Q3 F
Y18/19
Q4 F
Y18/19
Q1 F
Y19/20
Q2 F
Y19/20
Q3 F
Y19/20
Q4 F
Y19/20
Mining ManufacturingElectricity ConstructionIndustry
0
2
4
6
8
10
12
Q1 F
Y16/17
Q2 F
Y16/17
Q3 F
Y16/17
Q4 F
Y16/17
Q1 F
Y17/18
Q2 F
Y17/18
Q3 F
Y17/18
Q4 F
Y17/18
Q1 F
Y18/19
Q2 F
Y18/19
Q3 F
Y18/19
Q4 F
Y18/19
Q1 F
Y19/20
Q2 F
Y19/20
Q3 F
Y19/20
Q4 F
Y19/20
Public administration, etc.Financial, real estate, etc.Internal tradeServices
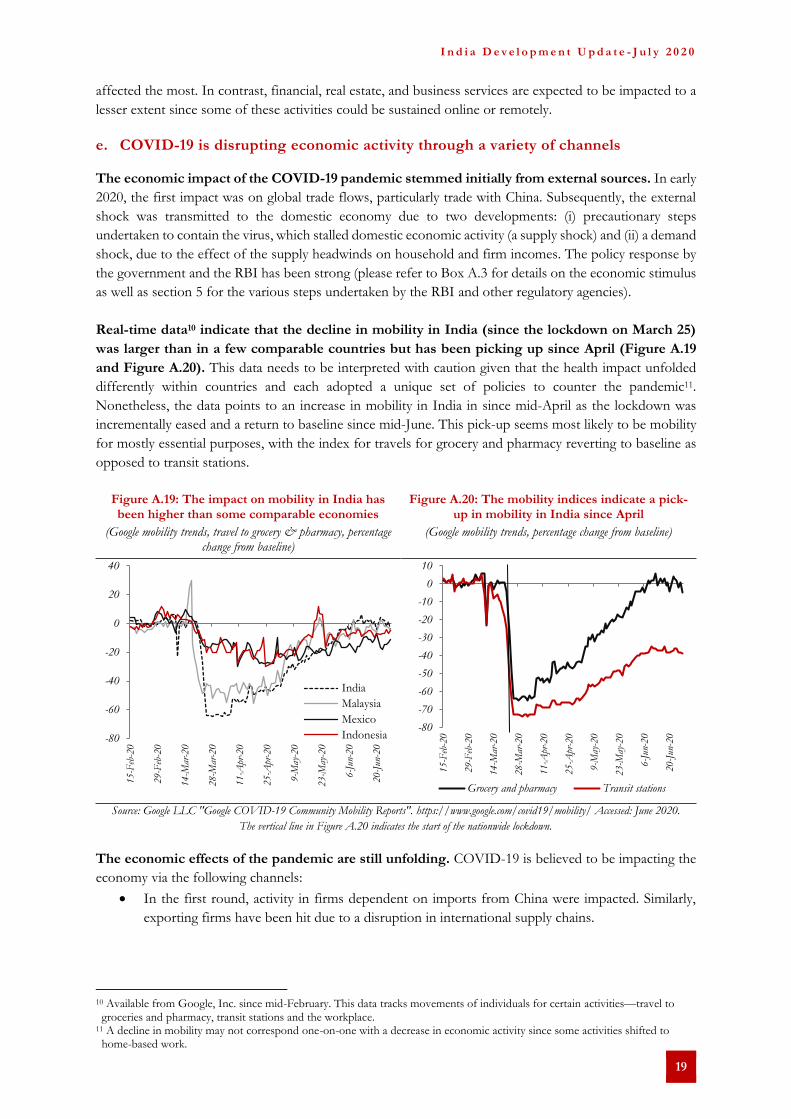
I n d i a D e v e l o p m e n t U p d a t e - J u l y 2 0 2 0
19
affected the most. In contrast, financial, real estate, and business services are expected to be impacted to a
lesser extent since some of these activities could be sustained online or remotely.
e. COVID-19 is disrupting economic activity through a variety of channels
The economic impact of the COVID-19 pandemic stemmed initially from external sources. In early
2020, the first impact was on global trade flows, particularly trade with China. Subsequently, the external
shock was transmitted to the domestic economy due to two developments: (i) precautionary steps
undertaken to contain the virus, which stalled domestic economic activity (a supply shock) and (ii) a demand
shock, due to the effect of the supply headwinds on household and firm incomes. The policy response by
the government and the RBI has been strong (please refer to Box A.3 for details on the economic stimulus
as well as section 5 for the various steps undertaken by the RBI and other regulatory agencies).
Real-time data10 indicate that the decline in mobility in India (since the lockdown on March 25)
was larger than in a few comparable countries but has been picking up since April (Figure A.19
and Figure A.20). This data needs to be interpreted with caution given that the health impact unfolded
differently within countries and each adopted a unique set of policies to counter the pandemic11.
Nonetheless, the data points to an increase in mobility in India in since mid-April as the lockdown was
incrementally eased and a return to baseline since mid-June. This pick-up seems most likely to be mobility
for mostly essential purposes, with the index for travels for grocery and pharmacy reverting to baseline as
opposed to transit stations.
Figure A.19: The impact on mobility in India has been higher than some comparable economies
(Google mobility trends, travel to grocery & pharmacy, percentage change from baseline)
Figure A.20: The mobility indices indicate a pick-up in mobility in India since April
(Google mobility trends, percentage change from baseline)
Source: Google LLC "Google COVID-19 Community Mobility Reports". https://www.google.com/covid19/mobility/ Accessed: June 2020.
The vertical line in Figure A.20 indicates the start of the nationwide lockdown.
The economic effects of the pandemic are still unfolding. COVID-19 is believed to be impacting the
economy via the following channels:
• In the first round, activity in firms dependent on imports from China were impacted. Similarly,
exporting firms have been hit due to a disruption in international supply chains.
10 Available from Google, Inc. since mid-February. This data tracks movements of individuals for certain activities—travel to groceries and pharmacy, transit stations and the workplace.
11 A decline in mobility may not correspond one-on-one with a decrease in economic activity since some activities shifted to home-based work.
-80
-60
-40
-20
0
20
40
15-F
eb-2
0
29-F
eb-2
0
14-M
ar-2
0
28-M
ar-2
0
11-A
pr-2
0
25-A
pr-2
0
9-M
ay-2
0
23-M
ay-2
0
6-J
un-2
0
20-J
un-2
0
India
Malaysia
Mexico
Indonesia-80
-70
-60
-50
-40
-30
-20
-10
0
10
15-F
eb-2
0
29-F
eb-2
0
14-M
ar-2
0
28-M
ar-2
0
11-A
pr-2
0
25-A
pr-2
0
9-M
ay-2
0
23-M
ay-2
0
6-J
un-2
0
20-J
un-2
0
Grocery and pharmacy Transit stations

I n d i a D e v e l o p m e n t U p d a t e - J u l y 2 0 2 0
20
• Subsequently, the lockdown halted domestic operations (procurement, production, and marketing)
in many sectors/businesses, across industrial and services sectors. Operations in businesses that
remained open to deliver essential services were curtailed.
• These developments have disrupted domestic supply chains and impacted household incomes and
spending.
• Aggregate output is expected to decline as businesses curtail production and household incomes
shrink. This will, in turn, negatively impact taxes and government revenue.
• This chain of events led to increased unemployment (Figure A.16: Unemployment rate touched a
historic high in May 2020) and can lead to business bankruptcies that could trigger a vicious cycle
of further demand contraction.
The disruption in the domestic supply chain occurred immediately after the first phase of the
lockdown. According to the All India Motor Transport Congress (AIMTC), daily movement of trucks
collapsed to below 10 percent of normal levels in early April12. Data on the electronic way (E-Way) bills13
published by the GST network (GSTN) show that only 40.6 million and 8.6 million E-Way bills were
generated during March and April 2020, compared to more than 57 million in February. With the cautious
easing of mobility restrictions, there is a gradual restoration of transportation, with the number of issuances
climbing to more than 25 million in May and 43 million in June.
Figure A.21: Moderation is noticed in growth of card transactions and inter-bank payments
(Growth in volume and value, percent yoy)
Figure A.22: Number of households demanding MGNREGA work has increased in May and June
(Households, million)
Source: National Payments Corporation of India, Ministry of Rural Development.
The red dotted line denotes the average for the first quarter for the past 5 years.
There are signs that aggregate demand has weakened further. Latest data from the RBI indicates a
pick-up in growth in currency with the public from March 2020 onwards. However, the growth in the
volume (and the value) of transactions using the RuPay card (for point-of-sale as well as e-commerce
purposes) declined significantly over March and April (Figure A.21). A similar trend is seen in inter-bank
money transfers via the Unified Payments Interface (UPI) application. The spike in demand for work from
households under the rural employment guarantee scheme (MGNREGA) over May and June possibly
12 Please refer to the report in the Economic Times https://www.business-standard.com/article/economy-policy/90-of-trucks-in-india-are-now-off-roads-amid-coronavirus-lockdown-120040800048_1.html accessed on May 28.
13 E-Way bills are electronically generated bills, required under the GST regime, for vehicular movement of goods between two destinations, typically of value exceeding INR 50,000 for most goods.
-100.0
0.0
100.0
200.0
300.0
400.0
500.0
Apr
'19
May
'19
Jun'
19
Jul'1
9
Aug
'19
Sep
'19
Oct
'19
Nov
'19
Dec
'19
Jan'
20
Feb
'20
Mar
'20
Apr
'20
May
'20
Jun'
20
RuPay Card Volume Growth (% yoy)
RuPay Card Value Growth (% yoy)
UPI Volume Growth (% yoy)
UPI Value Growth (% yoy)
0
5
10
15
20
25
30
35
40
45
50
Apr
-19
May
-19
Jun-
19
Jul-19
Aug
-19
Sep
-19
Oct
-19
Nov
-19
Dec
-19
Jan-
20
Feb
-20
Mar
-20
Apr
-20
May
-20
Jun-
20

I n d i a D e v e l o p m e n t U p d a t e - J u l y 2 0 2 0
21
reflects attempts to cushion income shocks arising from loss of employment opportunities elsewhere
(Figure A.22 and Box A.2).
High-frequency indicators capture the devastating impact on the economy, especially in April.
Figure A.23 summarizes the trends in a few macro-indicators in real terms. The immediate impact of
COVID-19 was initially evident via external channels (tourist inflow and trade) while the pervasive impact
on domestic indicators seems to have set-in once the lockdown was announced in late March. In particular:
• The initial shock materialized in the form of international supply chain disruptions as witnessed in
the 22 percent year-on-year contraction in port cargo traffic, on average, in April and May, reflected
in turn in a contraction of around 50 percent in both export and import over the same period.
• Reflecting the cumulative steps to filter inflow of travellers from abroad since late January, foreign
tourist arrivals contracted by more than 66 percent in March.
• Subsequently, as the lockdown took hold, rail freight and consumption of diesel contracted
respectively by more than 35 and 55 percent in April as domestic mobility came to a standstill.
• Domestic mobility restrictions have hit the industrial sector particularly hard. The large contraction
in production volumes (for example, of steel and automobiles) is reflected in the 18.3 percent year-
on-year contraction in the overall index of industrial production in March.
Figure A.23: Growth (percent, yoy) in high-frequency indicators show the unprecedented impact of COVID-19
The first round of impacts was in the form of external shocks as global trade and mobility dried up...
…with subsequent impact on domestic mobility…
I n d i a D e v e l o p m e n t U p d a t e - J u l y 2 0 2 0
22
…and economic activity
Source: CEIC. At the time of publication, data on foreign tourist arrivals is only available up to March 2020. Data on automobile production is not available for April
2020 and for domestic air passenger traffic was available up to May 2020.

I n d i a D e v e l o p m e n t U p d a t e - J u l y 2 0 2 0
23
3. Inflation
Headline inflation increased in FY19/20 compared to FY18/19 driven by a surge in the prices of certain food items, especially
vegetables. In contrast, core inflation was weaker in FY19/20 compared to FY18/19. Wholesale price inflation also slowed
and began diverging from consumer price inflation in FY19/20 with a fall in the demand for manufactured products.
Consequently, in view of a slowdown in demand and the economy in general, the RBI continued to maintain an accommodative
stance since June 2019. Since March 2020, the COVID-19 pandemic has severely exacerbated the pre-existing fall in
aggregate demand. Following an initial spike in prices due to supply chain disruptions, the lockdown has depressed incomes
and aggregate demand, and led to a sharp increase in unemployment.14 Consequently, inflation is expected to fall.
Headline inflation increased in FY19/20 compared to FY18/19. Headline Consumer Price Index (CPI)
inflation in FY19/20 averaged 4.8 percent, compared to 3.4 percent in FY18/19.15 The pick-up in inflation
in FY19/20 was driven by a surge in food inflation, which accounts for 40 percent of the combined national
CPI basket. Food inflation increased to double digit figures between November 2019 and June 2020,
peaking at 14.2 percent in December 2019, the highest in the past 6 years (Figure A.24). As a result, except
for March 2020, headline inflation exceeded the upper bound (6 percent) of the RBI target for all the
months between December 2019 and June 2020. The COVID-19 pandemic, however, has severely affected
aggregate demand. Following an initial spike in prices due to supply chain disruptions, the lockdown has
depressed incomes and aggregate demand and led to a sharp increase in unemployment. Consequently,
inflation is expected to fall.
Figure A.24: Headline inflation picked up during November 2019 and June 2020 due to rising food inflation
Note: Authorities did a partial release of price indices for April 2020 due to COVID-19.
Source: MoSPI, India
The sudden surge in food inflation was driven by a spike in onion prices. Vegetable prices, which
often experience large volatile swings, grew at double-digit rates as of September 2019 (Figure A.25). The
price of onions skyrocketed in the second half (H2) FY19/20 due to the late arrival of the monsoon and
excess rains in major onion-producing states (such as Karnataka, Gujarat, and Maharashtra) that resulted
in massive crop damage. To check the rise in price, the government temporarily instituted curbs on export
of onion from September 2019 to mid-March 2020. Food prices excluding vegetables, which tend to have
more sustained effects on food inflation, also firmed during this period, especially those of cereals, meat,
milk and oils.
14 The nationwide lockdown to reduce the spread of COVID-19 was enforced in Q1 of FY 20/21 from end-March to end-June
2020. 15 Average monthly year on year inflation.
-5
0
5
10
15
Jun-
15
Sep
-15
Dec
-15
Mar
-16
Jun-
16
Sep
-16
Dec
-16
Mar
-17
Jun-
17
Sep
-17
Dec
-17
Mar
-18
Jun-
18
Sep
-18
Dec
-18
Mar
-19
Jun-
19
Sep
-19
Dec
-19
Mar
-20
Jun-
20
Per
cent
Headline CPI Core CPI (excl. Food & Fuel)Food CPI RBI target

I n d i a D e v e l o p m e n t U p d a t e - J u l y 2 0 2 0
24
Figure A.25: Vegetable prices particularly onion prices, contributed to the pick-up in food inflation
Note: Data for April 2020 excludes data for subgroups “Meat and Fish” and “Prepared meals, snacks, sweets etc.”’
Source: MoSPI, India and WB calculations
In contrast, core inflation was weaker in FY19/20 compared to FY18/19. Core inflation (CPI
excluding food, fuel and light) moderated steadily until October 2019 (to 3.5 percent), after peaking in June
2018 (6.4 percent).16 The trend stabilized after October 2019. Consequently, average core inflation was
lower in FY19/20 at 4.0 percent, compared to that in FY18/19 (5.8 percent). Given moderating core
inflation and to support flagging growth, the monetary policy stance remained accommodative since June
2019.
CPI and WPI inflation started to diverge in FY19/20, with a fall in the demand for manufactured
products. CPI and WPI inflation started diverging from July 2019 (Q2 FY19/20) after tracking each other
closely for the past 3 years (Figure A.26). Between November 2016 and June 2019, the average differential
between the two measures was just 0.07 percentage points. In contrast, the average difference from July
2019 to June 2020 increased considerably to 5.2 percentage points. Manufactured goods have a 64 percent
weight in the WPI, while food is the largest component in the CPI index. Thus, the divergence most likely
reflected weakness in the demand for manufactured goods, although some of the difference could be
attributable to increasing trade and transportation margins. The fall in demand for manufactured goods,
which is relatively more income-elastic than food, is also in line with weak consumption, as the economy
slowed sharply in FY19/20.
Figure A.26: WPI and CPI diverged as aggregate demand fell in the economy
Source: MoSPI, India
16 Core CPI is defined as CPI excluding “food and beverages” and “fuel and light”. It is a weighted average of “pan tobacco and intoxicants”, “clothing and footwear”, “housing” and “miscellaneous” sub-categories of the CPI.
-4
-2
0
2
4
6
8
Apr
-18
May
-18
Jun-
18
Jul-18
Aug
-18
Sep
-18
Oct
-18
Nov
-18
Dec
-18
Jan-
19
Feb
-19
Mar
-19
Apr
-19
May
-19
Jun-
19
Jul-19
Aug
-19
Sep
-19
Oct
-19
Nov
-19
Dec
-19
Jan-
20
Feb
-20
Mar
-20
Apr
-20
May
-20
Jun-
20
Con
trib
utio
n (p
erce
ntag
e po
ints
)
Cereals and Products Meat and FishMilk and Milk Products EggOils and Fats Pulses and ProductsSugar and Confectionery SpicesFruits VegetablesFood CPI
-8
-6
-4
-2
0
2
4
6
8
10
Mar
-15
Jun-
15
Sep
-15
Dec
-15
Mar
-16
Jun-
16
Sep
-16
Dec
-16
Mar
-17
Jun-
17
Sep
-17
Dec
-17
Mar
-18
Jun-
18
Sep
-18
Dec
-18
Mar
-19
Jun-
19
Sep
-19
Dec
-19
Mar
-20
Jun-
20
Per
cent
WPI CPI

I n d i a D e v e l o p m e n t U p d a t e - J u l y 2 0 2 0
25
In recent months (February to June 2020) headline inflation has started to decline, driven largely
by a moderation in vegetable prices. The pace of increase in vegetable prices moderated to 1.9 percent
in June 2020 since reaching a high of above 60 percent in December 2019. However, the prices of other
food product groups have declined only marginally. In April 2020, food prices increased due to supply
chain disruptions following the country-wide lockdown17.
Core inflation has recently firmed up. The upward trajectory in core inflation since December 2019 was
predominantly driven by increases in the price of telecommunication services with the more recent push
coming on the back of rising commodity (gold and silver) prices as well as an increase in taxes on
intoxicants. The three largest private telecom service providers that service Indian customers were engaged
in increased competition in a bid to gain market share. While this led to unprecedented low charges for call
and data services, it also led to record losses for these telecom firms in Q2 2019. Thereafter, the firms hiked
prices between 15 and 47 percent as of December 2019.
Rural and urban inflation diverged in FY18/19 as rural prices fell at a faster pace. Rural and urban
headline inflation that had moved in a synchronized fashion in FY17/18 started diverging at the beginning
of FY18/19, especially Q2 FY 18/19 onwards. The divergence was caused by a sharp decline in rural
inflation for most of 2018 (Figure A.27). This faster decline was mainly due to differences in the
consumption baskets in rural and urban areas. Food has a weight of 47 percent in the rural consumption
basket compared to about 30 percent in the urban consumption basket. Therefore, as food price inflation
abated between July and December 2018, rural inflation fell faster relative to urban inflation. Then, with
the subsequent increase in food inflation, the divergence between the two price indices reduced. Rising
inflation in food commodities adversely affected the purchasing power of households in rural areas. (Figure
A.27) shows that the period of low (below 4 percent) rural inflation between August 2018 and September
2019 resulted in depressed (averaging 1.6 percent yoy) but positive growth in real rural wages. With the
pick-up in rural inflation since October 2019, the purchasing power of rural wage workers began contracting
in real terms.
Figure A. 27: Rural and Urban inflation converged with rising food inflation
Source: MoSPI, India
With the COVID-19 lockdown, the prices of most major commodities increased, reflecting
disruptions in supply chains. Besides onions, the price of almost all the other major commodities
increased sharply (Figure A.28). Even though prices were stable or decreased marginally before the
enforcement of the country-wide lockdown, supply chain disruptions following it resulted in double digit
price increases for many daily essentials. While farmers were ready to supply to the wholesale market,
17 Due to lockdown induced data collection issues, food CPI for April 2020 is not strictly comparable with the series for earlier months, because it excludes two food sub-groups – ‘Meat and fish’ and ‘Prepared meals, snacks, sweets etc.’.
-4
-2
0
2
4
6
8
10
Mar
-15
Jun-
15
Sep
-15
Dec
-15
Mar
-16
Jun-
16
Sep
-16
Dec
-16
Mar
-17
Jun-
17
Sep
-17
Dec
-17
Mar
-18
Jun-
18
Sep
-18
Dec
-18
Mar
-19
Jun-
19
Sep
-19
Dec
-19
Mar
-20
Jun-
20
Per
cent
Urban CPI Rural CPI Real Rural Wages

I n d i a D e v e l o p m e n t U p d a t e - J u l y 2 0 2 0
26
intermediaries including wholesalers and middlemen found it difficult to trade due to restrictions in the
lockdown period. The highest rise was observed in the prices of pulses and oil, and other cooking essentials
such as atta (wheat flour), potatoes, and vanaspati (cooking medium). Table A.2 summarises the major
commodities used in cooking and the percentage increase in price between 25 March (when the lockdown
was announced) and 28 April. Except onions, the prices of essentials increased across all major metros in
India (Figure A.29).
Figure A.28: Daily price changes of selected essential food grains due to COVID-19 lockdown in Mumbai, Delhi, Kolkata and Chennai
Once exports were banned and fresh supplies reached the market, onion prices continued to decline from the beginning of December
and stabilized thereafter
Tur dal witnessed one of the steepest rises in prices among major food commodities once the lockdown was imposed on 25 March
Sugar price witnessed a rise after the announcement of the nationwide lockdown, with the highest increase in percentage
terms in Chennai
After declining in two major cities, viz. Mumbai and Chennai, potato prices started rising a few days before the lockdown
Source: Department of Consumer Affairs, Ministry of Consumer Affairs, Food and Public Distribution, India
0
20
40
60
80
100
120
19-D
ec25-D
ec31-D
ec6-J
an12-J
an18-J
an24-J
an30-J
an5-F
eb11-F
eb17-F
eb23-F
eb29-F
eb6-M
ar12-M
ar18-M
ar24-M
ar30-M
ar5-A
pr11-A
pr17-A
pr23-A
pr29-A
pr
Ind
ian
Rup
ee
Onion : Daily Price in major cities
Delhi MumbaiChennai Kolkata
First COVID case in India
Pan- India Lockdown
0
20
40
60
80
100
120
19-D
ec25-D
ec31-D
ec6-J
an12-J
an18-J
an24-J
an30-J
an5-F
eb11-F
eb17-F
eb23-F
eb29-F
eb6-M
ar12-M
ar18-M
ar24-M
ar30-M
ar5-A
pr11-A
pr17-A
pr23-A
pr29-A
pr
Ind
ian
Rup
ee
Tur Dal: Daily Price in major cities
Delhi MumbaiChennai Kolkata
First COVID case in India
Pan- India Lockdown
0
5
10
15
20
25
30
35
40
45
50
19-D
ec25-D
ec31-D
ec6-J
an12-J
an18-J
an24-J
an30-J
an5-F
eb11-F
eb17-F
eb23-F
eb29-F
eb6-M
ar12-M
ar18-M
ar24-M
ar30-M
ar5-A
pr11-A
pr17-A
pr23-A
pr29-A
pr
Ind
ian
Rup
ee
Sugar: Daily Price in major cities
Delhi MumbaiChennai Kolkata
First COVID case in India
Pan- India Lockdown
0
5
10
15
20
25
30
35
40
45
50
19-D
ec25-D
ec31-D
ec6-J
an12-J
an18-J
an24-J
an30-J
an5-F
eb11-F
eb17-F
eb23-F
eb29-F
eb6-M
ar12-M
ar18-M
ar24-M
ar30-M
ar5-A
pr11-A
pr17-A
pr23-A
pr29-A
pr
Ind
ian
Rup
ee
Potato: Daily Price in major cities
Delhi MumbaiChennai Kolkata
First COVID case in India
Pan- India Lockdown

I n d i a D e v e l o p m e n t U p d a t e - J u l y 2 0 2 0
27
Table A.2: Percentage change in price of major commodities between 25 March and 28 April
Commodity % Change in price
Gram Dal 23.0
Masoor Dal 21.0
Tur Dal 17.4
Moong Dal 16.2
Potato 11.7
Sunflower Oil 9.2
Palm Oil 8.6
Atta 8.5
Soya Oil 8.4
Urad Dal 8.4
Vanaspati 8.1
Mustard Oil 6.1
Wheat 6.1
Rice 3.5
Tomato* -12.3
Onion -21.9
Source: Department of Consumer Affairs, Ministry of Consumer Affairs, Food and Public Distribution, India Note*: Price of tomatoes declined by almost 66 percent in Chennai in the given period, which pulled down the average inflation. In other
cities, the prices either remained stable or increased in the reference period.
After the initial increase in prices resulting from supply disruptions, the lockdown depressed
incomes and aggregate demand and led to a sharp increase in unemployment. Consequently,
inflation is expected to fall. This sentiment was reflected in the March 2020 edition of the RBI’s quarterly
Inflation Expectations Survey of Households. The survey noted that households expect inflation to decline
by 10 bps in the next quarter and by 20 bps in the next year. Food price inflation is likely to moderate
further, given satisfactory food grains and horticulture production in the ongoing and past agricultural18
seasons19 and sufficient food-grain stocks20.
Authorities have released only partial data due to data collection difficulties during the lockdown.
Authorities have not released the headline CPI data for April 2020, and instead, price indices for only three
of the six groups of items – a truncated food price index, housing, and health. In computing the food index,
sub-groups that have particularly been adversely affected (“meat and fish,” and “prepared meals, snacks,
etc.”) have been omitted. The National Statistical Organization has suspended its field operations since
19th March to limit the risk of contagion. Hence, for April estimates, data was collected telephonically and
from retail outlets. This has had two effects: it has 1) limited the coverage of price surveys to essential
commodities, and select retail outlets, and 2) incorrectly picked up differences in trade and transport
margins as price changes, since the newly surveyed retailers may have very different supply chains from the
regularly surveyed retailers.
18 The Indian agricultural crop year is from July to June. It has two main cropping seasons – Kharif from July to October (during the monsoon season) and Rabi from October to March (during winters). Grains are procured and stored by central and state agencies for subsequent distribution throughout the year through the public distribution system.
19 http://agricoop.gov.in/sites/default/files/Time-Series-1st-Adv-Estimate-2019-20-Final-Press.pdf 20 http://fci.gov.in/stocks.php?view=46

I n d i a D e v e l o p m e n t U p d a t e - J u l y 2 0 2 0
28
Figure A.29: Supply-chain bottlenecks caused prices to spike immediately following the lockdown
Source: Department of Consumer Affairs, Ministry of Consumer Affairs, Food and Public Distribution, India, and World Bank staff calculations
-40
-30
-20
-10
0
10
20
30
40
Che
nnai
Del
hi
Kol
kat
a
Mum
bai
Per
cent
cha
nge
in p
rice
s, M
arch
25 -
Apr
il 28, 2020
Atta Gram Dal Groundnut Oil Moong Dal
Potato Rice Sugar Tur Dal
Sunflower Oil Onion

I n d i a D e v e l o p m e n t U p d a t e - J u l y 2 0 2 0
29
4. External Sector
India’s external performance in FY19/20 was characterized by a narrowing CAD, robust foreign direct investment (FDI)
inflows, rebounding portfolio flows, and strong remittance inflows. These factors contributed to an increase in foreign exchange
reserves in FY19/20. The contraction of the CAD was driven by a narrowing of the merchandise trade deficit, caused by
sharper contraction in imports relative to exports, due to slowing domestic demand and falling oil prices. Overall, export growth
was subdued due to a moderation in global economic activity and heightened trade tensions. Net FDI inflows were robust
during FY19/20. The COVID-19 outbreak has clearly affected trade and capital flows. Merchandise trade growth
decelerated sharply in March and April 2020 with both exports and imports contracting. Net Portfolio flows also saw a sharp
reversal in March and the Rupee depreciated – albeit less than the currencies of emerging market peers.
The CAD narrowed to 0.9 percent of GDP in
FY19/20 (Figure A.30) from 2.1 percent in
FY18/19, thanks to a reduction in the trade
deficit, and import growth moderating faster
than export growth. In Q4 FY19/20, the current
account registered a surplus of 0.1 percent of
GDP; the first surplus since March 2007. Slowing
domestic demand and falling oil prices drove a
decline in goods imports, which fell by 8.2 percent
in FY19/20, relative to the previous fiscal year
(Figure A.32). During FY19/20, weakening global
trade led to fall in merchandise exports by 4.8
percent (Figure A.31). The net effect was a
narrowing of the merchandise trade deficit21
which stood at USD 157.5 billion in FY19/20
compared to USD 180.3 billion in FY18/19.
Figure A.31: Goods exports declined further in all categories….
(contribution to growth yoy, percentage points)
Figure A.32: ….and goods imports declined at a faster pace than exports until Q3
(contribution to growth yoy, percentage points)
Source: CEIC, Ministry of Commerce and Industry, World Bank staff calculations
21 Trade in services registered a net surplus of USD 84.9 billion in FY19/20, an improvement of USD 3 billion relative to FY18/19.
-15.0
-10.0
-5.0
0.0
5.0
10.0
15.0
20.0
Q1 2
017
Q2 2
017
Q3 2
017
Q4 2
017
Q1 2
018
Q2 2
018
Q3 2
018
Q4 2
018
Q1 2
019
Q2 2
019
Q3 2
019
Q4 2
019
Q1 2
020
Q2 2
020
Q3 2
020
Q4 2
020
Machinery and Transport EquipmentOthersPetroleum Crude and ProductsGems and JeweleryExports
-20.0
-10.0
0.0
10.0
20.0
30.0
40.0
Q1 2
017
Q2 2
017
Q3 2
017
Q4 2
017
Q1 2
018
Q2 2
018
Q3 2
018
Q4 2
018
Q1 2
019
Q2 2
019
Q3 2
019
Q4 2
019
Q1 2
020
Q2 2
020
Q3 2
020
Q4 2
020
Others MachineryGold OilImports
Figure A.30: Both global and domestic factors contributed to a narrowing CAD….
(Percentage of GDP)
Source: CEIC, RBI, World Bank staff calculations
-0.6
-1.8
-2.1
-0.9
-3.5
-3.0
-2.5
-2.0
-1.5
-1.0
-0.5
0.0
0.5
Q1 2
017
Q2 2
017
Q3 2
017
Q4 2
017
Q1 2
018
Q2 2
018
Q3 2
018
Q4 2
018
Q1 2
019
Q2 2
019
Q3 2
019
Q4 2
019
Q1 2
020
Q2 2
020
Q3 2
020
Q4 2
020
Average FY 16/17 Average FY 17/18
Average FY 18/19 Average FY 19/20
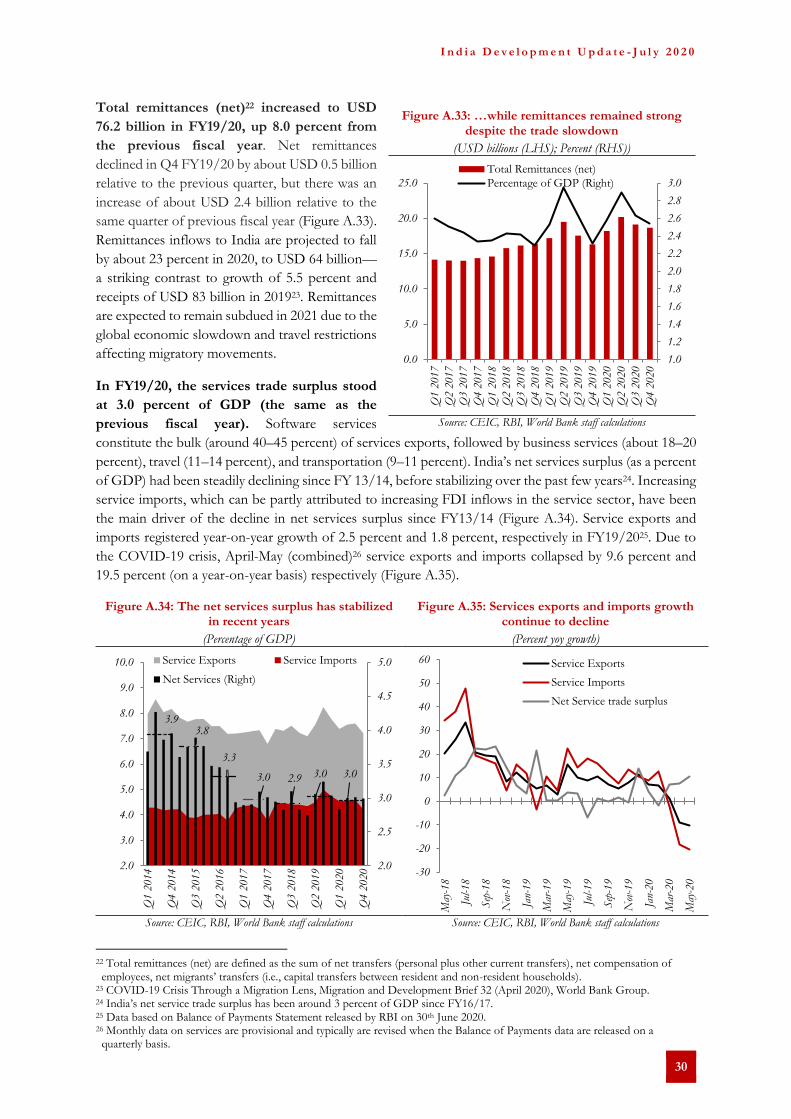
I n d i a D e v e l o p m e n t U p d a t e - J u l y 2 0 2 0
30
Total remittances (net)22 increased to USD
76.2 billion in FY19/20, up 8.0 percent from
the previous fiscal year. Net remittances
declined in Q4 FY19/20 by about USD 0.5 billion
relative to the previous quarter, but there was an
increase of about USD 2.4 billion relative to the
same quarter of previous fiscal year (Figure A.33).
Remittances inflows to India are projected to fall
by about 23 percent in 2020, to USD 64 billion—
a striking contrast to growth of 5.5 percent and
receipts of USD 83 billion in 201923. Remittances
are expected to remain subdued in 2021 due to the
global economic slowdown and travel restrictions
affecting migratory movements.
In FY19/20, the services trade surplus stood
at 3.0 percent of GDP (the same as the
previous fiscal year). Software services
constitute the bulk (around 40–45 percent) of services exports, followed by business services (about 18–20
percent), travel (11–14 percent), and transportation (9–11 percent). India’s net services surplus (as a percent
of GDP) had been steadily declining since FY 13/14, before stabilizing over the past few years24. Increasing
service imports, which can be partly attributed to increasing FDI inflows in the service sector, have been
the main driver of the decline in net services surplus since FY13/14 (Figure A.34). Service exports and
imports registered year-on-year growth of 2.5 percent and 1.8 percent, respectively in FY19/2025. Due to
the COVID-19 crisis, April-May (combined)26 service exports and imports collapsed by 9.6 percent and
19.5 percent (on a year-on-year basis) respectively (Figure A.35).
Figure A.34: The net services surplus has stabilized in recent years
(Percentage of GDP)
Figure A.35: Services exports and imports growth continue to decline
(Percent yoy growth)
Source: CEIC, RBI, World Bank staff calculations Source: CEIC, RBI, World Bank staff calculations
22 Total remittances (net) are defined as the sum of net transfers (personal plus other current transfers), net compensation of employees, net migrants’ transfers (i.e., capital transfers between resident and non-resident households).
23 COVID-19 Crisis Through a Migration Lens, Migration and Development Brief 32 (April 2020), World Bank Group. 24 India’s net service trade surplus has been around 3 percent of GDP since FY16/17. 25 Data based on Balance of Payments Statement released by RBI on 30th June 2020. 26 Monthly data on services are provisional and typically are revised when the Balance of Payments data are released on a quarterly basis.
3.93.8
3.3
3.0 2.9 3.0 3.0
2.0
2.5
3.0
3.5
4.0
4.5
5.0
2.0
3.0
4.0
5.0
6.0
7.0
8.0
9.0
10.0
Q1 2
014
Q4 2
014
Q3 2
015
Q2 2
016
Q1 2
017
Q4 2
017
Q3 2
018
Q2 2
019
Q1 2
020
Q4 2
020
Service Exports Service Imports
Net Services (Right)
-30
-20
-10
0
10
20
30
40
50
60
May
-18
Jul-18
Sep
-18
Nov
-18
Jan-
19
Mar
-19
May
-19
Jul-19
Sep
-19
Nov
-19
Jan-
20
Mar
-20
May
-20
Service Exports
Service Imports
Net Service trade surplus
Figure A.33: …while remittances remained strong despite the trade slowdown
(USD billions (LHS); Percent (RHS))
Source: CEIC, RBI, World Bank staff calculations
1.0
1.2
1.4
1.6
1.8
2.0
2.2
2.4
2.6
2.8
3.0
0.0
5.0
10.0
15.0
20.0
25.0
Q1 2
017
Q2 2
017
Q3 2
017
Q4 2
017
Q1 2
018
Q2 2
018
Q3 2
018
Q4 2
018
Q1 2
019
Q2 2
019
Q3 2
019
Q4 2
019
Q1 2
020
Q2 2
020
Q3 2
020
Q4 2
020
Total Remittances (net)
Percentage of GDP (Right)

I n d i a D e v e l o p m e n t U p d a t e - J u l y 2 0 2 0
31
Portfolio investment recorded net inflows of USD 1.4 billion in FY19/20, in contrast to outflows of
USD 2.4 billion in FY18/19. The net foreign portfolio investment (FPI) inflows (of about USD 15.1
billion) during the first three quarters of FY19/20 were driven by a host of global and domestic factors,
including a change in the US monetary policy stance, expectation of positive outcomes of the US–China
trade deal and domestic corporate tax rate cuts. There was a brief pause in inflows in the second quarter of
FY19/20 (Figure A.36) due to the imposition of an enhanced tax surcharge on FPIs in the Union Budget
presented in July. However, investor sentiment recovered in the third quarter after the enhanced tax
surcharge on FPIs was rolled back27 and the government announced corporate tax rate cuts targeted at
boosting corporate profitability and encouraged the creation of new manufacturing facilities. Due to the
ongoing COVID-19 crisis, net portfolio flows witnessed significant outflows of about USD 13.7 billion in
Q4 FY19/2028, and most of this occurred in in March 2020 (Figure A.37).
Figure A.36: Portfolio flows remained robust in the first three quarters of FY19/20….
(USD billions)
Figure A.37: …. but took a hit in Q4 due to the COVID-19 outbreak
(USD billions)
Source: CEIC, RBI, World Bank staff calculations Source: CEIC, National Securities Depository Limited, World Bank
staff calculations
At USD 43.0 billion, net FDI inflows were higher in FY19/20 than in the previous year (USD 30.7
billion) (Figure A.38). FDI equity inflows grew 12.6 percent in FY19/20 (Figure A.39) with the sectoral
shares remaining similar to historical averages (Figure A.40). The sectors which attracted the most FDI
equity inflows during FY19/20 were services (USD 7.9 billion) and computer software and hardware (USD
7.7 billion). Singapore continued to be the largest source of FDI in India during FY19/20 with investments
worth USD 11.65 billion, followed by Mauritius (USD 8.24 billion), and the Netherlands (USD 6.5 billion).
27 Net equity flows were on the sell-side in July-August. However, the direction of flow reversed in September with the withdrawal of the enhanced surcharge in the last week of August.
28 This data is based on Balance of Payments Statistics published by RBI. According to the Depository data (published by NSDL), net FPI flows during Jan-March 2020 were about USD 14.5 billion.
-20.0
-15.0
-10.0
-5.0
0.0
5.0
10.0
15.0
Q1 2
017
Q2 2
017
Q3 2
017
Q4 2
017
Q1 2
018
Q2 2
018
Q3 2
018
Q4 2
018
Q1 2
019
Q2 2
019
Q3 2
019
Q4 2
019
Q1 2
020
Q2 2
020
Q3 2
020
Q4 2
020
Equity (In India)
Abroad
Debt (In India)
Net Portfolio Investment
-18
-15
-12
-9
-6
-3
0
3
6
9
Apr
18
May
18
Jun
18
Jul 18
Aug
18
Sep
18
Oct
18
Nov
18
Dec
18
Jan
19
Feb
19
Mar
19
Apr
19
May
19
Jun
19
Jul 19
Aug
19
Sep
19
Oct
19
Nov
19
Dec
19
Jan
20
Feb
20
Mar
20
Apr
20
May
20
Jun
20
Hybrid
Debt (uincluding VRR)
Equity
Net FPI

I n d i a D e v e l o p m e n t U p d a t e - J u l y 2 0 2 0
32
Figure A.38: Net FDI inflows remained robust with strong equity inflows
(USD billions)
Figure A.39: FDI equity inflows registered strong growth in FY19/20
(USD billions (LHS); Fiscal year total, USD billions (RHS))
Source: CEIC, RBI, World Bank staff calculations Source: Department for Promotion of Industry and Internal Trade, World Bank staff calculations
Figure A.40: FDI Equity inflows remained stable across various sectors
(USD billions)
Source: CEIC, Department for Promotion of Industry and Internal Trade, World Bank staff calculations
-5.0
0.0
5.0
10.0
15.0
20.0Q
1 2
017
Q2 2
017
Q3 2
017
Q4 2
017
Q1 2
018
Q2 2
018
Q3 2
018
Q4 2
018
Q1 2
019
Q2 2
019
Q3 2
019
Q4 2
019
Q1 2
020
Q2 2
020
Q3 2
020
Q4 2
020
Equity and Investment Fund Shares
Debt Instruments
Net FDI inflows
30.9
40.0
43.5 44.9 44.4
50.0
0
10
20
30
40
50
60
0
1
2
3
4
5
6
7
8
9
May
14
Oct
14
Mar
15
Aug
15
Jan
16
Jun
16
Nov
16
Apr
17
Sep
17
Feb
18
Jul 18
Dec
18
May
19
Oct
19
Mar
20
FY14/15 FY15/16FY16/17 FY17/18FY18/19 FY19/20
02468
1012141618
Q1 2
017
Q2 2
017
Q3 2
017
Q4 2
017
Q1 2
018
Q2 2
018
Q3 2
018
Q4 2
018
Q1 2
019
Q2 2
019
Q3 2
019
Q4 2
019
Q1 2
020
Q2 2
020
Q3 2
020
Q4 2
020
Others Trading
Telecommunications Services Sector
Power Drugs and Pharmaceuticals
Construction Computer Software and Hardware
Chemicals, excl Fertilizers Automobile Industry
FDI Equity Inflows

I n d i a D e v e l o p m e n t U p d a t e - J u l y 2 0 2 0
33
During FY19/20, foreign exchange reserves
(on a balance of payments basis) recorded an
accretion of USD 59.5 billion compared to a
depletion of USD 3.3 billion in the previous
fiscal year. This increase was driven by a lower
CAD, robust capital inflows, and higher external
commercial borrowings (ECBs) (Figure A.41). In
nominal terms (including valuation effects),
foreign exchange reserves increased by USD 64.9
billion during FY19/20 against a depletion of
USD 11.7 billion during FY18/19. The valuation
gain, reflecting increase in gold prices, amounted
to USD 5.4 billion during FY19/20. Foreign
exchange reserves stood at USD 477.8 billion by
the end of FY19/20.
The impact of COVID-19 on India’s external sector
Due to the ongoing COVID-19 crisis, both
merchandise exports and imports collapsed sharply, and contracted about 60 percent year-on-year
in April 2020. The contraction was broad-based, with oil imports growth falling 59 percent yoy, gold
imports contracting 100 percent, electronics goods by 63 percent, and coal imports by 49 percent. As for
exports, the categories that suffered the most were petroleum products, which contracted 66 percent yoy,
jewellery exports which were nearly zero (in level terms), textiles & allied products down 88 percent,
electronics down 71 percent, and engineering goods down 65 percent. Provisional estimates suggest a net
trade surplus (merchandise and services together) of USD 4.4 billion in April-May 2020 as overall imports
declined more than exports. Exports (merchandise and services) in April-May 2020 are estimated to be
USD 61.6 billion – contraction of 33.7 percent compared to the same period last year and total imports are
estimated to be USD 57.2 billion, reflecting a contraction of 48.3 percent29.
The COVID-19 sell-off episode resulted in significant net portfolio outflows of about USD 15.9
billion in March 2020, thereby offsetting the net inflows (received until December 2019) for the
entire fiscal year FY19/20. The outflows were led by both equity and debt portfolio flows in roughly
equal proportions, with the financial services sector being affected the most (accounting for approximately
40 percent of the equity outflows and sovereign debt outflows and about 86.5 percent of the total debt
outflows in March 2020). However, India’s net capital outflows (of about USD 3.2 billion, in March 2020)
were modest when compared to other emerging market peers30 (See Figure A.44).
The sell-off episode continued in April–May with net portfolio outflows of about USD 2.9 billion.
This was led by net debt outflows of about USD 4.0 billion and offset partially by net equity inflows of
USD 1.1 billion31. However, in June 2020, foreign portfolio investment registered net inflows of about USD
3.4 billion with net equity inflows of USD 2.9 billion. Net portfolio outflows are during the current crisis
have exceeded sell-off episodes seen since the since the GFC (Figure A.42). Within 40 days of the onset of
the COVID-19 crisis32, equity outflows were at least twice the magnitude of outflows during the GFC.
Although debt outflows were of similar magnitude to those recorded during the Taper Tantrum, the
29 These estimates are published by Ministry of Commerce and Industry. 30 Based on data published by International Institute of Finance (IIF). 31 Net equity flows include net hybrid flows of USD 0.1 billion. 32 We consider 30th January, 2020 as the starting date for COVID-19 crisis in India, when the first coronavirus case in India was reported.
Figure A.41: Sources of variation in foreign exchange reserves
(USD billions)
Source: RBI, World Bank staff calculations
-24.7
-57.3
32.643.030.7
12.3
-12.7
23.010.4
12.6
22.1
6.0
16.1
5.4
-8.3
13.7
-80
-60
-40
-20
0
20
40
60
80
100
120
FY19/20 FY18/19 Change inValue
(FY19/20less
FY18/19)
Valuationchange
Other items incapital account
ExternalCommercialBorrowingsBankingCapital
PortfolioInvestment
Foreign DirectInvestment(FDI)CurrentAccountBalance

I n d i a D e v e l o p m e n t U p d a t e - J u l y 2 0 2 0
34
situation appears to be worsening further as debt flows in the third month since the onset of the crisis
remained on the sell side (Figure A.43).
Figure A.44: Many emerging markets witnessed significant net capital outflows
(USD billions, for March 2020)
Figure A.45: Emerging market currency depreciation since COVID-19 sell off
(From January 30 until May 29, 2020; percent change in exchange rate against US Dollar))
Source: IIF, World Bank staff calculations
Note: Figures presented are provisional estimates and may include errors and omissions; “-” denotes outflows.
Source: CEIC, World Bank staff calculations Note: A positive percentage change denotes depreciation of currency
against US dollar.
Since the onset of the COVID-19 crisis, the Rupee depreciated by around 5.5 percent relative to
the US dollar due to sell-off pressures. However, it depreciated less relative to currencies of other
emerging market economies (see Figure A.45). This is partly due to India’s strong external fundamentals,
-3.2
-45
-40
-35
-30
-25
-20
-15
-10
-5
0
5
Col
ombi
a
Arg
entina
Mex
ico
Mal
aysi
a
Sou
th A
frica
Indi
a
Egy
pt
Indo
nesi
a
Bra
zil
Sau
di A
rabi
a
Chi
na
5.5
-5
0
5
10
15
20
25
30
Tai
wan
ese
Dol
lar
Phi
lippi
nes
Pes
o
Tha
iland
Bah
t
Chi
nese
Ren
min
bi
Sou
th K
orea
n W
on
Indi
an R
upee
Mal
aysi
an R
ingg
it
Indo
nesi
an R
upia
h
Rus
sian
Rub
le
Mex
ican
New
Pes
o
Sou
th A
frican
Ran
d
Bra
zilia
n R
eal
Figure A.42: COVID-19 crisis worse than other sell-off episodes
Cumulative Net Portfolio Equity Flows (USD billions)
Figure A.43: Debt outflows were higher than equity outflows
Cumulative Net Portfolio Debt Flows (USD billions)
Source: CEIC, World Bank staff calculations Source: CEIC, World Bank staff calculations
Note: “t” denotes the starting date of crisis, “t+1” denotes the next day and so on. Starting date for COVID-19 is 30th January, 2020 (coincides with first COVID-19 case reported in India); for Emerging Market sell-off, 16th March, 2018; for Taper Tantrum, 22nd May, 2013 (FED Chair hinted at potential unwinding of QE); and for Global financial crisis, 15th September, 2008 (Lehman Brother filed bankruptcy on this
date).
-10.0
-8.0
-6.0
-4.0
-2.0
0.0
2.0
4.0
t
t+5
t+10
t+15
t+20
t+25
t+30
t+35
t+40
t+45
t+50
t+55
t+60
t+65
t+70
Emerging Market sell offTaper TantrumGlobal Financial CrisisCovid-19
outflow
-14.0
-12.0
-10.0
-8.0
-6.0
-4.0
-2.0
0.0
2.0
4.0
t
t+5
t+10
t+15
t+20
t+25
t+30
t+35
t+40
t+45
t+50
t+55
t+60
t+65
t+70
Emerging Market sell offTaper TantrumGlobal Financial CrisisCovid-19
outflow

I n d i a D e v e l o p m e n t U p d a t e - J u l y 2 0 2 0
35
including modest external debt, at about 20.1 percent of GDP33. India also has relatively robust positions
with regard to net international liabilities and gross external financing needs relative to foreign exchange
reserves. At the end of June, 202034, RBI’s foreign exchange reserves were comfortably placed at USD
506.8 billion. The accretion of reserves can be partly attributed to narrowing trade deficit and falling oil
prices.
33 As at end-December 2019. 34 As on June 26, 2020.

I n d i a D e v e l o p m e n t U p d a t e - J u l y 2 0 2 0
36
5. Macrofinancial developments
India’s financial markets made a strong start to FY19/20, before concerns about trade wars and the COVID-19 outbreak
saw the year end in significant losses. India’s macrofinancial assets, including the Rupee and bond yields, demonstrated relative
robustness, until the onset of the COVID-19 crisis. Monetary policy was accommodative during FY19/20 as the RBI focused
its policy efforts on supporting growth and on strengthening regulatory oversight to address challenges arising from NPLs. After
the onset of the COVID-19 crisis in late Q4 of FY19/20, the RBI responded proactively through policy rate cuts and a
series of measures aimed at easing regulatory forbearance and ensuring access to liquidity.
India’s financial markets made a strong start in
FY19/20 before concerns about trade wars and
the COVID-19 outbreak saw the year end in
significant losses. In the first half of FY19/20,
major indices (the SENSEX and the Nifty 50)
declined marginally. The Government’s attempt to
provide some support to the economy in Q3
FY19/20 helped generate a reversal in momentum,
with both the Nifty 50 and the SENSEX reaching
record levels in mid-January 2020, just before the
first positive case of COVID-19 was recorded in
India. Thereafter, however, the Indian financial
markets suffered significant losses in FY19/20
compared to FY18/19 when markets recorded
double digit gains (Figure A.58).
The Rupee depreciated 8.6 percent against the
USD in FY19/20, compared to around 6 percent
in the previous fiscal year (Figure A.47). For
most of the fiscal year, the Rupee was relatively
stable, although it suffered temporary bouts of volatility caused by policy decisions that included the
imposition (in July 2019) of a surcharge on income tax on high-income trusts (which affected several major
foreign investment funds and was subsequently withdrawn). These policy changes resulted in strong capital
outflows (see discussion in Section 4), which added downward pressure on the exchange rate. The
announcement of a corporate income tax cut in September 2019 contributed to net portfolio inflows, which
placed upward pressure on the Rupee, but this was offset by concerns about weak domestic growth. These
offsetting factors played a large role in keeping the Rupee relatively stable until Q4.
The 10-year benchmark yield fell 121 bps to 6.29 percent in FY19/20 (compared to its relative
stability in FY18/19) (Figure A.48). A major reason for the fall in yields was RBI’s easing monetary policy
stance in FY19/20 combined with efforts to improve transmission between lending rates and yields. On
that front, in Q3, the RBI engaged in interventions similar to the U.S. Federal Reserve’s “Operation Twist.”
The objective was to address the steepening in India’s yield curve and reducing the term premium that had
widened.
a. Impact of COVID-19 on macro-financial indicators
After the onset of the COVID-19 crisis, Indian financial markets reacted negatively and rapidly
entered bear market territory. The SENSEX and the Nifty 50 recorded losses of around 28 percent
between the end of January and the time the government imposed mobility restrictions at the end of March.
Just before the first official case was recorded in India at the end of January, markets had gained around
Figure A.46: Financial markets plunged sharply from record levels due to the COVID-19 pandemic
(index)
Source: CEIC, World Bank staff calculations
0
2,000
4,000
6,000
8,000
10,000
12,000
14,000
0
5,000
10,000
15,000
20,000
25,000
30,000
35,000
40,000
45,000
30/
06/
08
30/
06/
09
30/
06/
10
30/
06/
11
30/
06/
12
30/
06/
13
30/
06/
14
30/
06/
15
30/
06/
16
30/
06/
17
30/
06/
18
30/
06/
19
30/
06/
20
Sensex
Nifty 50 RHS
GFC
Taper tantrum
COVID-19

I n d i a D e v e l o p m e n t U p d a t e - J u l y 2 0 2 0
37
5 percent, after being steady in the first half of FY19/20. Markets have since pared back most of the losses,
but these movements seem at odds with increasing evidence about the impact of the lockdown on real
activity (see Section 1).
Until the first officially recorded COVID-19 positive case in India, the Rupee had depreciated only
around 3 percent against the USD. Thereafter, it lost a further 6 percentage points. The performance of
the Rupee during the spike in financial market volatility over the past few months is roughly on par with
that seen during the GFC and the Taper Tantrum. Depreciation pressure on the exchange rate rose
significantly in March due to massive net portfolio outflows (see Section 4 – including the single largest
daily outflow in the past 20 years on March 1735 amidst signs of the virus spreading rapidly in India and the
imposition of travel restrictions. Bond yields fell after India recorded its first COVID-19 positive case at
the end of January on the back of significant monetary policy easing. The 10-year benchmark yield fell (50
bps) between February and April, while the yields on 1-year bonds fell 156 bps over the same period.
Figure A.47: The exchange rate depreciated on the back of monetary policy easing and capital
outflows
(percent)
Figure A.48: Yields fell on the back of monetary policy easing and targeted interventions by the
RBI
(percent)
Source: CEIC, World Bank staff calculations (inverted scale) Source: CEIC, World Bank staff calculations
35 On March 17, 2020, India witnessed a massive single-day net portfolio outflow of about USD 2.2 billion. This was one of the largest single-day outflows over the past two decades.
30
35
40
45
50
55
60
65
70
75
80
30/
06/96
30/
06/98
30/
06/00
30/
06/02
30/
06/04
30/
06/06
30/
06/08
30/
06/10
30/
06/12
30/
06/14
30/
06/16
30/
06/18
30/
06/20
COVID-19
Taper tantrum
GFC
3
4
5
6
7
8
9
10
11
12
11/
08/08
11/
10/09
11/
12/10
11/
02/12
11/
04/13
11/
06/14
11/
08/15
11/
10/16
11/
12/17
11/
02/19
11/
04/20
10-year benchmark
1-year
Taper tantrum
GFC
COVID-19

I n d i a D e v e l o p m e n t U p d a t e - J u l y 2 0 2 0
38
b. Pre-COVID-19 monetary policy was geared primarily to supporting growth
Prior to the onset of the COVID-19 pandemic,
monetary policy was focused on supporting
economic activity (in the context of moderating
GDP growth) and strengthening the
macroprudential framework. Also, inflationary
pressures were well within the RBI’s target range
until the end of FY19/20, partly due to the
significant moderation in economic growth. These
factors allowed the RBI to move its monetary policy
stance from neutral to accommodative to support
growth (Figure A.49). With investment growth
moderating, the provision of credit was also an
essential element of the RBI’s deliberations in
FY19/20 – especially in the context of high NPLs
and weak transmission to lending rates. In FY19/20,
the repo rate was cut at four consecutive bi-monthly
meetings by a total of 110 bps – from 6.25 percent
to 5.15 percent. In its fifth bi-monthly meeting, the RBI’s Monetary Policy Committee (MPC) paused
cutting rates despite cutting its growth forecast for FY19/20 to 5 percent (from 6.1 percent in its October
meeting). The RBI noted36 that its stance was sufficiently accommodative at that stage. A spike in food
prices in Q3 was offered as another reason for the cessation in repo rate cuts.
Figure A.50: Overall, GNPAs improved compared to FY18/19…
(percent)
Figure A.51: …while challenges remain in the NBFC sector
(percent)
Source: Reserve Bank of India (FSR, July 2020) Source: Reserve Bank of India (FSR, July 2020) Note: * March 2020 values are provisional.
In addition to the shift toward an accommodative monetary stance, the RBI also undertook several
measures to bolster financial and banking sector stability, after the collapse of a major NBFC—
IL&FS—in late 2018. Despite improvements in the gross non-performing assets (GNPA) ratio for all
scheduled commercial banks in FY19/20, the NBFC and the private sector saw a moderate deterioration,
with their GNPA ratios rising from 6.1 percent to 6.4 percent and 3.7 percent to 4.2 percent
36 https://www.rbi.org.in/scripts/bs_viewcontent.aspx?Id=3796
8.5
11.3
4.2
2.3
6.4
0
2
4
6
8
10
12
14
16
18
All SCBs Public Private ForeignBanks
NBFCs
Gross NPAs to Total Advances
Mar-18 Mar-19 Sep-19 Mar-20
0
5
10
15
20
25
30
0
1
2
3
4
5
6
7
8
9
10
Mar
-15
Sep
-15
Mar
-16
Sep
-16
Mar
-17
Sep
-17
Mar
-18
Sep
-18
Mar
-19
Sep
-19
Mar
-20*
GNPA CRAR (RHS)
Figure A.49: Financial markets plunged sharply from record levels due to the COVID-19 pandemic
(index)
Source: CEIC, World Bank staff calculations
6.0
6.5
7.0
7.5
8.0
8.5
9.0
9.5
10.0
10.5
11.0
11.5
3.0
3.5
4.0
4.5
5.0
5.5
6.0
6.5
7.0
7.5
8.0
8.5
Jun-
15
Oct
-15
Feb
-16
Jun-
16
Oct
-16
Feb
-17
Jun-
17
Oct
-17
Feb
-18
Jun-
18
Oct
-18
Feb
-19
Jun-
19
Oct
-19
Feb
-20
Jun-
20
Repo rate
Weighted average lending rate

I n d i a D e v e l o p m e n t U p d a t e - J u l y 2 0 2 0
39
respectively37(Figure A.62). In its December 2019 edition of the bi-annual Financial Stability Report (FSR),
the RBI noted that the collapse of IL&FS had resulted in forced improvements in regulatory oversight due
to risks posed to the financial system. As such, the RBI introduced a liquidity coverage ratio (LCR)
requirement for NBFCs with assets more than INR 5,000 crore (accounting for around 87 percent of all
NBFCs). The LCR requires NBFCs to maintain a minimum level of high-quality liquid assets to cover the
expected net cash outflows during periods of stress38.To some extent, the stress in the NBFC sector was
reflected by another measure of resilience and soundness – the capital adequacy ratio (CRAR) – which also
declined marginally from 20.1 percent in March 2019 to 19.6 percent in March 202039. Despite the slight
decline, the ratio remains well above those recommended by Basel III requirements. For the banking sector,
the CRAR rose from 14.3 percent to 14.8 percent over the same period40.
The moderating growth trajectory was accompanied by a fall in credit growth, which was made
more acute by rising NPAs, especially in the NBFC sector. Despite monetary policy easing worth 110
bps in FY19/20, non-food credit growth continued to decelerate and fell to a 2-year low of 7 percent in
December 2019 (Figure A.52). Non-food credit growth averaged just over 9 percent in FY19/20 compared
to just over 12 percent in FY18/19 (when it was precisely driven by NBFCs and housing financing
companies). The moderation in credit growth was particularly sharp in the services (which includes NBFCs)
and industry sectors due to the overall slowdown in economic growth (Figure A.53). The overall economic
growth moderation, rising NPLs, and general lending risk aversion accelerated the decline in credit growth
despite some offset from monetary policy easing.
Figure A.52: Credit growth was tepid throughout FY19/20…
(percent)
Figure A.53: …and no sector was immune to the moderation
(percent)
Source: Reserve Bank of India (FSR, July 2020), World Bank staff calculations
Source: Reserve Bank of India (FSR, July 2020), World Bank staff calculations
37 The NBFC sector saw an improvement in the GNPA ratio from 6.1 percent in March 2019 to 5.6 percent in September 2019; however, it deteriorated to 6.4 percent in March 2020.
38 https://www.rbi.org.in/scripts/BS_PressReleaseDisplay.aspx?prid=48982 39 March 2020 data is provisional. 40 However, the CRAR of SCBs edged down to 14.8 percent from 15.0 percent in September 2019, mainly due to the reduction of CRARs of the PSBs.
2
4
6
8
10
12
14
16
May
-17
Aug
-17
Nov
-17
Feb
-18
May
-18
Aug
-18
Nov
-18
Feb
-19
May
-19
Aug
-19
Nov
-19
Feb
-20
May
-20
Overall Non-food credit
-6
-1
4
9
14
19
24
29
May
-17
Aug
-17
Nov
-17
Feb
-18
May
-18
Aug
-18
Nov
-18
Feb
-19
May
-19
Aug
-19
Nov
-19
Feb
-20
May
-20
Agriculture Industry
Services Overall

I n d i a D e v e l o p m e n t U p d a t e - J u l y 2 0 2 0
40
Besides supporting growth and bolstering credit growth, RBI’s focus in FY19/20 was also to
ensure adequate liquidity in the economy. Money supply aggregates (Figure A.54) showed a return to
pre-demonetization growth rates and various RBI
updates from FY19/20 provide further supporting
evidence to suggest that there is ample liquidity in
the economy.
c. Monetary policy responses to the COVID-19 crisis
After the RBI paused its easing stance in late
2019, the next major rate decision was made at
an out-of-cycle meeting at the end of March
2020, in direct response to the sharp slump in
activity41. The MPC lowered the repo rate at the end
of March 2020 by 75 bps, and the reverse repo rate
by 90 bps (thus creating an asymmetrical corridor as
repo was reduced by a smaller 75 bps). The goal was
to make it relatively unattractive for banks to
passively deposit funds with the Reserve Bank and
instead, to use these funds for on-lending to the
economy. In another meeting in mid-April, the
RBI’s governor announced a further reduction of 25 bps in the reverse repo while keeping the repo rate
unchanged, to encourage banks to lend the surplus funds to the economy. In the May MPC meeting,
another cut of 40 bps was announced for the repo, reverse-repo, bank rate, and MSF rate. Thus, the repo
rate was cut twice, by a cumulative 115 bps, and the reverse repo rate was cut at three consecutive MPC
meetings by a total of 155 bps – from 4.90 percent to 3.35 percent.
The RBI has also responded to changing macrofinancial risks through a series of regulatory
responses aimed at maintaining liquidity in the financial system, while simultaneously offering
support to borrowers. In addition to wholescale support, the RBI has also responded to sector-specific
liquidity needs and continues to adjust its policies based on market behaviour. Soon after the repo rate cut,
over the course of March, April, and May 2020, the RBI introduced several measures primarily aimed at
improving liquidity in the financial system (Table A.3) and instituting regulatory forbearance for banks and
other financial institutions. These measures included: (i) maintaining adequate liquidity in the system in the
face of COVID-19 related dislocations; (ii) facilitating and incentivizing bank credit flows; (iii) easing
financial stress; and (iv) enabling the normal functioning of markets. Many of the measures undertaken by
the RBI were similar to those adopted during the GFC. An assessment of the efficacy of the various
measures will begin to be possible once data such as credit growth, NPLs, and other banking sector
indicators are released over the next few months.
41 See Part B for a detailed discussion about the RBI’s response to the COVID-19 outbreak.
Figure A.54: Money supply growth has returned to pre-demonization rates
(percent, yoy growth)
Source: RBI, CEIC, World Bank staff calculations
-60
-40
-20
0
20
40
60
80
100
Mar
-15
Jun-
15
Sep
-15
Dec
-15
Mar
-16
Jun-
16
Sep
-16
Dec
-16
Mar
-17
Jun-
17
Sep
-17
Dec
-17
Mar
-18
Jun-
18
Sep
-18
Dec
-18
Mar
-19
Jun-
19
Sep
-19
Dec
-19
Mar
-20
Jun-
20
Currency in Circulation
M2
M3
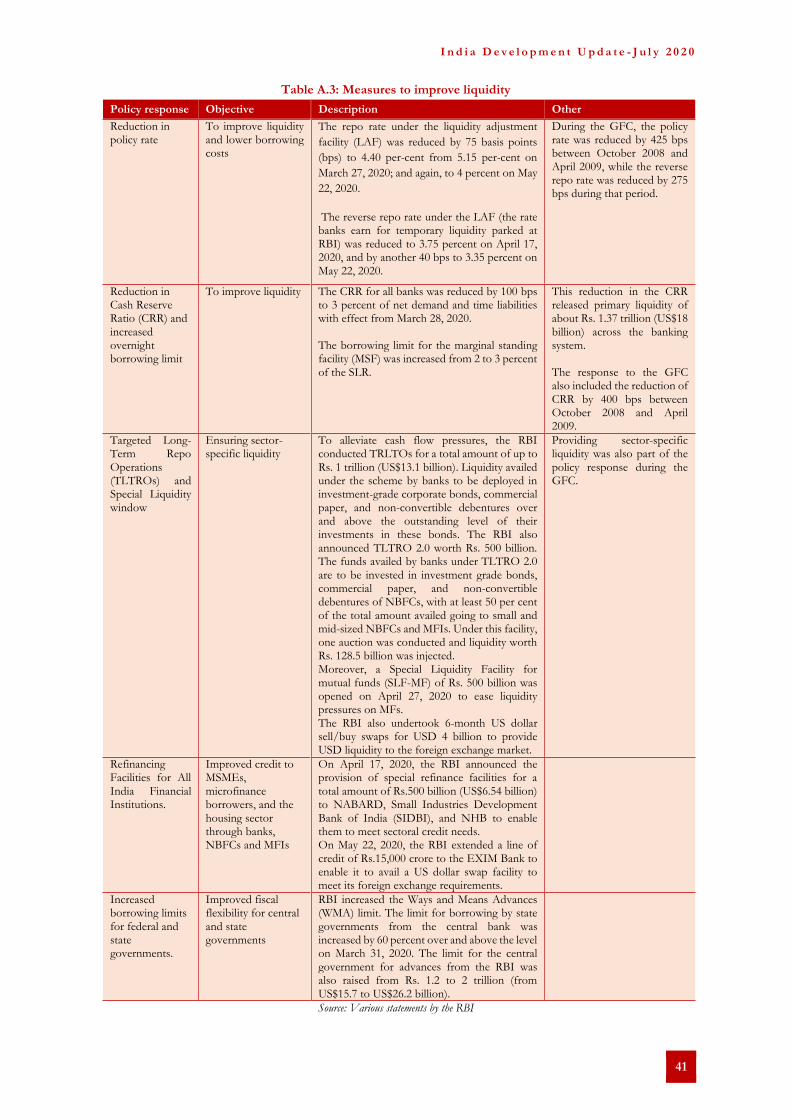
I n d i a D e v e l o p m e n t U p d a t e - J u l y 2 0 2 0
41
Table A.3: Measures to improve liquidity
Policy response Objective Description Other
Reduction in policy rate
To improve liquidity and lower borrowing costs
The repo rate under the liquidity adjustment
facility (LAF) was reduced by 75 basis points
(bps) to 4.40 per-cent from 5.15 per-cent on
March 27, 2020; and again, to 4 percent on May
22, 2020.
The reverse repo rate under the LAF (the rate banks earn for temporary liquidity parked at RBI) was reduced to 3.75 percent on April 17, 2020, and by another 40 bps to 3.35 percent on May 22, 2020.
During the GFC, the policy rate was reduced by 425 bps between October 2008 and April 2009, while the reverse repo rate was reduced by 275 bps during that period.
Reduction in Cash Reserve Ratio (CRR) and increased overnight borrowing limit
To improve liquidity The CRR for all banks was reduced by 100 bps to 3 percent of net demand and time liabilities with effect from March 28, 2020. The borrowing limit for the marginal standing facility (MSF) was increased from 2 to 3 percent of the SLR.
This reduction in the CRR released primary liquidity of about Rs. 1.37 trillion (US$18 billion) across the banking system. The response to the GFC also included the reduction of CRR by 400 bps between October 2008 and April 2009.
Targeted Long- Term Repo Operations (TLTROs) and Special Liquidity window
Ensuring sector-specific liquidity
To alleviate cash flow pressures, the RBI conducted TRLTOs for a total amount of up to Rs. 1 trillion (US$13.1 billion). Liquidity availed under the scheme by banks to be deployed in investment-grade corporate bonds, commercial paper, and non-convertible debentures over and above the outstanding level of their investments in these bonds. The RBI also announced TLTRO 2.0 worth Rs. 500 billion. The funds availed by banks under TLTRO 2.0 are to be invested in investment grade bonds, commercial paper, and non-convertible debentures of NBFCs, with at least 50 per cent of the total amount availed going to small and mid-sized NBFCs and MFIs. Under this facility, one auction was conducted and liquidity worth Rs. 128.5 billion was injected. Moreover, a Special Liquidity Facility for mutual funds (SLF-MF) of Rs. 500 billion was opened on April 27, 2020 to ease liquidity pressures on MFs. The RBI also undertook 6-month US dollar sell/buy swaps for USD 4 billion to provide USD liquidity to the foreign exchange market.
Providing sector-specific liquidity was also part of the policy response during the GFC.
Refinancing Facilities for All India Financial Institutions.
Improved credit to MSMEs, microfinance borrowers, and the housing sector through banks, NBFCs and MFIs
On April 17, 2020, the RBI announced the provision of special refinance facilities for a total amount of Rs.500 billion (US$6.54 billion) to NABARD, Small Industries Development Bank of India (SIDBI), and NHB to enable them to meet sectoral credit needs. On May 22, 2020, the RBI extended a line of credit of Rs.15,000 crore to the EXIM Bank to enable it to avail a US dollar swap facility to meet its foreign exchange requirements.
Increased borrowing limits for federal and state governments.
Improved fiscal flexibility for central and state governments
RBI increased the Ways and Means Advances (WMA) limit. The limit for borrowing by state governments from the central bank was increased by 60 percent over and above the level on March 31, 2020. The limit for the central government for advances from the RBI was also raised from Rs. 1.2 to 2 trillion (from US$15.7 to US$26.2 billion).
Source: Various statements by the RBI

I n d i a D e v e l o p m e n t U p d a t e - J u l y 2 0 2 0
42
Table A.4: Measures to ease regulatory forbearance
Policy response Objective Description Other
Moratorium on Term Loans, interest deferment on working capital facilities, NPA recognition standstill, and extension of Resolution Timeline
Supporting borrowers through deferment of repayments, easing of working capital financing and NPL resolution timelines
Lenders were allowed to grant a moratorium of six months on payment of instalments for all outstanding term loans as on March 1, 2020. In the case of the working capital facilities, the deferred interest could also be converted into a funded interest term loan repayable by March 31, 2021. The RBI also announced a six-month NPA recognition standstill for banks for all accounts for which a moratorium is granted, and which were not NPAs on March 1, 2020.
The period for implementation of resolution plans by lenders for their delinquent borrowers was extended by 180 days. Analysis by CRISIL, a rating agency, concluded that the loan moratorium could be the equivalent of additional liquidity of Rs.2.1 trillion (US$27.85 billion) to the enterprise sector, if all eligible firms opted for it. The RBI, using a one-time measure, allowed banks to increase their exposure to a group of connected counterparties from the current 25 percent to 30 percent of the eligible capital base of the bank.. The RBI increased the maximum permissible period of pre-shipment and post-shipment export credit sanctioned by banks from one year to 15 months, for disbursements made up to July 31, 2020.
Distribution of dividends
Maintaining capital levels of banks
Scheduled commercial banks and cooperative banks shall not be permitted make any dividend pay-outs pertaining to the financial year ended March 31, 2020 until the quarter ending September 2020.
NBFC loans to commercial real estate projects.
Supporting borrowers through forbearance in project timelines
NBFCs will be allowed to defer commercial real estate projects by an additional year, similar to the guidelines for banks.
Deferment of Implementation of Net Stable Funding Ratio (NSFR) and decrease in LCR
Temporarily easing liquidity management thresholds for banks
Banks in India were required to maintain a NSFR of 100 percent from April 1, 2020. This has now been deferred by six months, until October 1, 2020. The LCR requirement for banks was brought down from 100 to 80 percent.
Deferment of the last tranche of Capital Conservation Buffer (CCB).
Deferring capital requirements for banks
RBI deferred the implementation of the last tranche of CCB of 0.625 percent from March 31, 2020 to September 30, 2020.
Extension of deadline for filing of compliance returns.
Relief from compliance deadlines
Both SEBI and RBI have extended the deadline for various returns by 1-3 months.
Source: Various statements and press releases by the RBI.

I n d i a D e v e l o p m e n t U p d a t e - J u l y 2 0 2 0
43
Box A.2: The impact of COVID-19 on the financial and banking sectors
The COVID-19 crisis could exacerbate existing vulnerabilities in the financial and banking sectors. The
immediate impact of regulatory responses aimed at supporting the financial and banking sectors has been
somewhat mixed – mainly due to pre-existing challenges related to financial sector stress. The series of
liquidity measures have addressed immediate liquidity concerns at the systemic level, but channelling liquidity
broadly across the economy remains a challenge. Additional liquidity of around 3.5 percent of GDP has resulted in
a liquidity surplus42. The average systemic liquidity surplus between March 27 and April 14, 2020 was Rs.4.36 trillion
(US$ 57.82 billion). TLTROs also provided liquidity at the longer end of the yield curve. However, efforts to channel
liquidity to NBFCs and MFIs – which serve important sectors of the economy but do not have access to direct
liquidity from the RBI and often cannot access capital markets due to lower ratings – have been only partially
successful. TLTRO 2.0, which requires banks to invest proceeds in small and medium NBFC and MFI debt
issuances, saw only 51 percent of funds utilized. Moreover, banks have grown their portfolio of government
securities far in excess of the statutory requirement in January–March 2020, while the portfolio of corporate bonds
and equities has declined sharply. Various measures that are being implemented to improve credit growth will be
hampered by the prevalence of uncertainty and lenders’ risk aversion.
The various measures have not eased – thus far – the challenge of raising financing in the current climate.
For example, NBFCs and even state governments continue to struggle to raise funds, despite bond yields remaining
elevated. State governments managed to raise only 86 percent of the target amount on April 8, despite higher yields,
especially for longer tenors. Top-rated NBFC issuers have also had to reduce the issuance size due to rising yields
and lack of investors. While debt issuances by NBFCs increased in May and June 2020, the decrease in yields for
NBFCs has been lower as compared to other issuers. The benchmark 10-year government bond yield increased
between March 11 and mid-April, despite measures to boost liquidity. Increased risk aversion could continue to
limit fresh non-sovereign debt issuances.
Small private banks, NBFCs, and MFIs could be more severely impacted than larger banks. The lack of a
strong depositor base, exacerbated by the flight of deposits to larger banks post the Yes Bank crisis, could weaken
the liquidity position and stability of small private banks. Customer confidence in small private banks has declined
and may deteriorate further due to COVID-19, as customers might prefer PSBs with implied sovereign guarantee
or larger, more stable private banks. The liquidity position of NBFCs, especially small and medium NBFCs, might
deteriorate further due to difficulties accessing liquidity, potential slippages in the MSME and retail portfolios,
selective access to bank financing due to risk averseness of banks, decreasing capital market funds and securitization,
and lack of uniform applicability of RBI’s loan moratorium43. For instance, Bajaj Finance, a large NBFC, lost more
than 350,000 customers and around Rs. 50 billion (US$651 million) in assets under management in just 10 days.
NBFC bond yields have also risen sharply, even for top-rated issuers. NBFCs are required to comply with
provisioning requirements under IFRS 9, under which NPL provisioning and credit costs are more stringent, further
stressing the NBFC sector. Microfinance institutions (MFIs) serve many low-income people with their saving and
credit services. The economics of micro finance requires high repayment rates and therefore an increase in loan
delinquencies and slippages in the repayment rate due to a collapse in clients’ revenues would threaten the viability
of MFIs.
A clearer picture of potential solvency issues for banks and NBFCs will emerge after the loan moratoriums
and the NPA recognition standstill expire. Banks and NBFCs are allowed to offer a 6-month moratorium to
borrowers and do not have to categorize these accounts as NPAs for the duration of the moratorium. As a result,
the impact on NPAs and solvency can be determined only after the moratoriums end, when banks can track their
borrowers individually to determine and segregate the permanent impact from the temporary impact and make
appropriate provisions. While most banks have focused on retail lending in the past few years, a slowdown in
demand could impact both growth and repayments in the retail portfolio, resulting in increased stress for banks.
Further, the increased interconnectedness of banks and NBFCs might lead to a triple balance sheet problem44. Pre-
42 Surplus liquidity available after lending by RBI to banks. 43 NBFCs have to extend loan moratoriums to their borrowers while banks may choose whether to extend the loan moratorium to NBFCs.
44 The increased interconnectedness of the banking and NBFC sector has led to a triple balance sheet problem, especially since the default by IL&FS in 2018. The deterioration of corporate balance sheets (especially real estate firms) led to stress for NBFCs, which ultimately caused asset quality in banks to decline.

I n d i a D e v e l o p m e n t U p d a t e - J u l y 2 0 2 0
44
COVID-19, the banking sector CRAR stood at 14.8 percent and the provision coverage ratio, at 65.4 percent (March
2020). An increase in NPAs could result in higher provisions and recapitalization, especially for PSBs. The RBI’s
July 2020 FSR revealed that NPAs could increase to 12.5 per cent by March 2021 under the baseline scenario, as
compared to 8.5 percent in March 2020. Given the significant deterioration in economic conditions since then, there
is an expectation that NPAs could increase in the short to medium term.
Policy focus once the health element of the current crisis reaches a manageable threshold will need to turn
to alleviating financial sector stress by reviving lending while simultaneously improving NPL
management. As economic activity is revived post lockdown, borrowers (especially MSMEs) will require credit to
continue operations and for personnel expenses. Banks and DFIs must ensure the timely implementation of various
schemes for improving NBFC and MSME liquidity while de-risking fresh lending through guarantees where they
are available. After the moratoriums expire, banks must distinguish between temporarily stressed and non-viable
accounts to prevent fresh NPLs. NBFCs and MFIs will need to play a key role in providing credit to underbanked
clients and might need to continue to rely on bank borrowings until capital markets recover confidence in these
lenders. The government has announced a 50 percent increase in its borrowings in H1 2020-21, which may further
limit capital market funding to NBFCs and MFIs. Timely NPL resolution will be important to improve the capital
position of banks and maintain the stability of the financial system.
In addition to bolstering credit growth, lenders will need to successfully manage the tapering of regulatory
incentives, to ensure a smooth transition to usual regulatory norms. Lenders (especially banks) have received
several regulatory relaxations to incentivize them to lend to sectors that need credit. Post COVID, lenders will need
to ensure that these incentives are not used to disguise the actual status of accounts and do not lead to reduced
credit discipline. Increased interconnectedness between the banking and NBFC sectors could increase the risk of
contagion. The tapering of relaxations in liquidity and capital norms over the next few quarters could add further
stress to banks especially with regards to NPLs. This could necessitate another round of recapitalization for PSBs
and increasing contingent liabilities for the government.

I n d i a D e v e l o p m e n t U p d a t e - J u l y 2 0 2 0
45
6. Public Finance
Following a decline over the past few years, the fiscal deficit increased in FY19/20, as real GDP growth slowed even before
the COVID-19 outbreak, resulting in slower growth in tax revenue collection; and due to the corporate tax cut announced by
the central government and increased spending by both the central and state governments. The COVID-19 outbreak and the
subsequent lockdown are likely to add to the fiscal stress, and the central and state governments will have to confront the ongoing
crisis with limited fiscal space. General government debt has risen, largely due to slow economic growth and increasing primary
deficits. However, since most of India’s public debt is denominated in local currency, is locally held, and is long term, it is
generally considered sustainable.
a. General government
After declining gradually for six years since FY11/12, the general government deficit rose sharply
inFY19/20. In contrast, states’ fiscal deficit moderated in FY17/18 after rising continuously over the
previous six years. While the general government deficit reached 5.9 percent of GDP in FY18/19, it could
rise to 8.1 percent in FY19/2045 (Figure A.55) primarily on account of weak tax revenue growth and fiscal
measures (of which a corporate tax cut announced by the Centre in September 2019 is the most significant)
(Figure A.56). With the growth rate projected to turn negative, revenue growth will suffer substantially in
FY20/21. The rise in expenditure to counter the shock is expected to lead to a widening of the fiscal deficit
in FY20/21 to around 11 percent of GDP.
Figure A.55: Fiscal deficit of the general government reversed its declining trajectory in recent years…
(General government fiscal deficit, percent of GDP) *2020 RE is a World Bank estimate
Figure A.56: …primarily because of high expenditures and weak tax proceeds
(Total Expenditures and Revenues, percent of GDP)
Source: RBI, MoSPI Source: RBI, MoSPI
Even as revenue growth started to slow, much of the growth in expenditures in recent years was
on account of current expenditures, which increased by almost 2 percentage points as a share of GDP
in FY18/19 and are estimated to have increased further in FY19/20. For the states, the increase is
attributable to the implementation of the Ujjwal DISCOM Assurance Yojana (UDAY), which resulted in
45 The general government fiscal deficit figure for 2018-19 is based on fiscal accounts published by the central and state
governments in their budgets for 2020-21, state fiscal accounts published by the Comptroller-Auditor General of India, and World
Bank staff calculations. The fiscal deficit figure for 2019-20 is a World Bank estimate based on staff calculations.
7.8
6.96.7
6.7
6.9
6.9
5.85.9
8.1
5.0
5.5
6.0
6.5
7.0
7.5
8.0
8.5
2012 2013 2014 2015 2016 2017 2018 2019 2020RE
23
24
25
26
27
28
29
30
20.0
20.5
21.0
21.5
22.0
22.5
23.0
23.5
2016 2017 2018 2019 2020 RE
Total Revenues
Total Expenditures (RHS)

I n d i a D e v e l o p m e n t U p d a t e - J u l y 2 0 2 0
46
higher interest payments on absorbed contingent liabilities,46 whereas for the central government, the
increase is mainly a result the so-called non-development spending (such as defence, interest payments,
pensions and subsidies) and the introduction of a large-scale income transfer scheme for farmers. Current
expenditures rose from 22.5 percent of GDP in FY15/16 to 24.4 percent in FY18/19 and are expected to
grow further to 25.2 percent in FY19/20. Capital expenditure, on the other hand, declined as a share of
GDP to 4.2 percent in FY19/20 from a high of 5.0 percent in FY16/17 (Figure A.58).
Figure A.57: Tax and non-tax revenues declined in 2019-20 after a rise in 2018-19 on account of lower-than-assumed tax buoyancy and weaker economic
growth
(Tax and Non-Tax revenues, percent of GDP)
Figure A.58: Current expenditures contributed more to the growth of overall expenditures in 2019-20
(Current and Capital Expenditures, percent of GDP)
Source: RBI, MoSPI Source: RBI, MoSPI
b. Central government
After declining steadily to 3.4 percent in FY18/19, the centre’s fiscal deficit rose to 4.6 percent of
GDP (as per provisional accounts published by the Controller General of Accounts) in FY19/20 (Figure
A.59) on the back of a decline in tax revenues and non-debt capital receipts. The slowdown in growth
directly impacted both direct and indirect tax collection and this was compounded by the government’s
decision to cut corporate tax rates in order to boost private investment. Due to the considerable decline in
revised estimates of revenue collection, compared with budget estimates, the government resorted to the
FRBM escape clause to revise fiscal deficit targets upwards for FY19/20 and FY20/21.47
46 Under UDAY, states took over up to 75 percent of outstanding liabilities of loss-making electricity distribution companies during 2015-16 and 2016-17.
47 The Budget speech refers to section 4(2) of the FRBM Act that stipulates that a deviation in the annual fiscal deficit target by not more than 0.5 percent of GDP will be justified under specific circumstances including “unanticipated structural reforms in the economy with unanticipated fiscal implications.”.
0.0
0.5
1.0
1.5
2.0
2.5
3.0
3.5
4.0
4.5
5.0
15.5
16.0
16.5
17.0
17.5
18.0
18.5
19.0
2016 2017 2018 2019 2020RE
Tax Revenues Non Tax Revenues (RHS)
3.0
3.5
4.0
4.5
5.0
5.5
20.0
21.0
22.0
23.0
24.0
25.0
26.0
2016 2017 2018 2019 2020 RE
Current Expenditures Capital Expenditures

I n d i a D e v e l o p m e n t U p d a t e - J u l y 2 0 2 0
47
Figure A.59: The fiscal deficit and primary deficit both rose sharply in 2019-20
(Fiscal Deficit of the Central government, percent of GDP)
Figure A.60: Gross tax revenue declined due to the economic slowdown and tax cuts
(Contribution to gross tax revenues growth, percent of GDP)
Source: MoF, CGA, MoSPI, World Bank staff calculations Source: CGA, MoSPI, World Bank staff calculations
Gross tax revenues declined during FY19/20 with lower-than-budgeted receipts from both direct
and indirect taxes, especially the corporation tax and GST. The centre’s gross tax collections came in
at 9.9 percent of GDP during FY19/20, after three consecutive years above 11 percent. Nominal growth
of both direct and indirect taxes fell, with direct taxes growth turning negative according to provisional
accounts (Figure A.72).48 Direct taxes declined as a share of GDP, mainly due to the corporate tax cut
earlier in the year whereas indirect taxes were depressed by compliance challenges associated with the GST,
which led to subdued GST collections.49 Despite a rise in excise duties in the past years (when global crude
prices declined) and in spite of an increase in custom duties across a wide range of products, excise and
custom duties collections also dropped considerably as trading volumes declined.
Consequently, the contribution of direct taxes to the overall growth of gross tax revenues was
negative, a sharp reversal in the trend from FY17/18 and FY18/19, when they contributed 77 and 90
percent, respectively, to revenue growth. Excise duties stood at 1.2 percent of GDP in 2019-20, lower than
the annual average of 1.8 percent during FY11/12 to FY17/18. Similarly, custom duties amounted to just
0.5 percent of GDP, significantly lower than an annual average of 1.5 percent in the same period (Figure
A.61).
48 Direct taxes declined by 8.7 percent in 2019-20 vis-à-vis 15.3 percent average growth from 2016-17 to 2018-19, whereas indirect taxes grew by 3.1 percent in comparison with an almost 10 percent average growth during the same period of reference.
49 In September 2019, the government announced major reduction in tax for corporates in a bid to boost investments. The effective tax rate prior to the announcement ranged between 26 and 34 percent. With the government’s move, corporates were given an option to pay a lower tax rate of 22 percent (25.17 percent including cess and surcharges) if they did not claim any exemptions or incentives. As per government estimates, the tax cut resulted in forgone revenues to the tune of 0.7 percent of GDP.
3.9
3.5 3.53.4
4.6
0.0
0.2
0.4
0.6
0.8
1.0
1.2
1.4
1.6
1.8
0.0
0.5
1.0
1.5
2.0
2.5
3.0
3.5
4.0
4.5
5.0
2016 2017 2018 2019 2020Prov.
Fiscal DeficitPrimary Deficit (RHS)
16.9 17.9
11.8
8.4
-3.4
-10
-5
0
5
10
15
20
2016 2017 2018 2019 2020 Prov.
Direct Tax
Indirect Tax
Gross Tax Revenues

I n d i a D e v e l o p m e n t U p d a t e - J u l y 2 0 2 0
48
Figure A.61: Corporate taxes had a negative contribution to revenue growth
(Contribution to gross tax revenues growth, percent)
Figure A.62: The surplus capital transfer from the RBI contributed the most to non-tax revenues
(Contribution to gross non-tax revenues growth, percent)
Source: MoF, CGA, MoSPI, World Bank staff calculations Source: MoF, CGA, MoSPI, World Bank staff calculations
Non-tax revenues increased in FY19/20 due to a higher-than-expected surplus capital transfer
from the RBI. Non-tax revenues, including interest receipts, dividends, user fees, and spectrum auctions,
increased from 1.2 percent of GDP in FY18/19 to 1.6 percent in FY19/20 (Figure A.62). The rise was
primarily thanks to a one-time surplus-capital transfer by the RBI.50 On the other hand, non-debt capital
receipts declined as a share of GDP to lower than their decadal average of 0.4 percent. Central government
disinvestment receipts are estimated to have fallen to less than 50 percent of the budgeted amount, as plans
for disinvestment were derailed due to a deterioration of financial market conditions in March 2020 (Figure
A.64).
Figure A.63: Tax revenues, net of transfers to states declined despite a downward adjustment in
devolved taxes
(Tax and non-tax revenues of Centre, percent of GDP)
Figure A.64: Disinvestment receipts fell well below the budget estimates for 2019-20
(Actual disinvestment, percent of budgeted)
Source: MoF, CGA, MoSPI Source: DIPAM, World Bank staff calculations
50 In August 2019, the RBI accepted the Bimal Jalan committee recommendations and approved surplus-capital transfer to the government (RBI dividend) to the tune of INR 1.76 trillion. The dividend was INR 0.58 trillion above the budgeted figure of INR 0.9 trillion with INR 0.28 trillion given to the government in FY 2018-19 as interim dividend.
16.917.9
11.8
8.4
-3.4
-40
-20
0
20
40
2016 2017 2018 2019 2020Prov.
Others GST
Service Tax Union Excise Duties
Customs Income Tax
Corporate Tax Gross Tax Revenues
9.3-29.9
22.4
38.4
-40
-20
0
20
40
60
2017 2018 2019 2020 Prov.
Economic ServicesGeneral ServicesDividends and ProfitsInterestOthersGross Non-Tax Revenues
0.0
0.2
0.4
0.6
0.8
1.0
1.2
1.4
1.6
1.8
2.0
6.3
6.4
6.5
6.6
6.7
6.8
6.9
7.0
7.1
7.2
7.3
7.4
2017 2018 2019 2020 Prov.
Net Tax Revenues Non Tax Revenues (RHS)0
20
40
60
80
100
120
140
160
2014 2015 2016 2017 2018 2019 2020Prov.
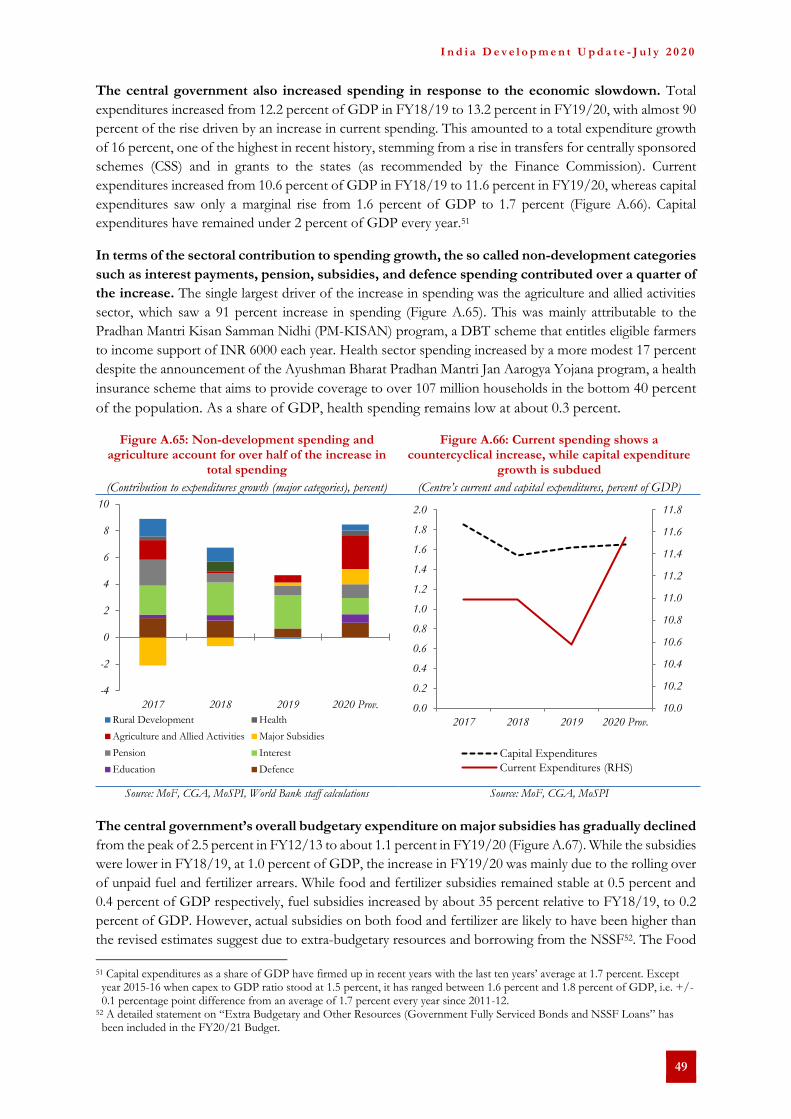
I n d i a D e v e l o p m e n t U p d a t e - J u l y 2 0 2 0
49
The central government also increased spending in response to the economic slowdown. Total
expenditures increased from 12.2 percent of GDP in FY18/19 to 13.2 percent in FY19/20, with almost 90
percent of the rise driven by an increase in current spending. This amounted to a total expenditure growth
of 16 percent, one of the highest in recent history, stemming from a rise in transfers for centrally sponsored
schemes (CSS) and in grants to the states (as recommended by the Finance Commission). Current
expenditures increased from 10.6 percent of GDP in FY18/19 to 11.6 percent in FY19/20, whereas capital
expenditures saw only a marginal rise from 1.6 percent of GDP to 1.7 percent (Figure A.66). Capital
expenditures have remained under 2 percent of GDP every year.51
In terms of the sectoral contribution to spending growth, the so called non-development categories
such as interest payments, pension, subsidies, and defence spending contributed over a quarter of
the increase. The single largest driver of the increase in spending was the agriculture and allied activities
sector, which saw a 91 percent increase in spending (Figure A.65). This was mainly attributable to the
Pradhan Mantri Kisan Samman Nidhi (PM-KISAN) program, a DBT scheme that entitles eligible farmers
to income support of INR 6000 each year. Health sector spending increased by a more modest 17 percent
despite the announcement of the Ayushman Bharat Pradhan Mantri Jan Aarogya Yojana program, a health
insurance scheme that aims to provide coverage to over 107 million households in the bottom 40 percent
of the population. As a share of GDP, health spending remains low at about 0.3 percent.
Figure A.65: Non-development spending and agriculture account for over half of the increase in
total spending
(Contribution to expenditures growth (major categories), percent)
Figure A.66: Current spending shows a countercyclical increase, while capital expenditure
growth is subdued
(Centre’s current and capital expenditures, percent of GDP)
Source: MoF, CGA, MoSPI, World Bank staff calculations Source: MoF, CGA, MoSPI
The central government’s overall budgetary expenditure on major subsidies has gradually declined
from the peak of 2.5 percent in FY12/13 to about 1.1 percent in FY19/20 (Figure A.67). While the subsidies
were lower in FY18/19, at 1.0 percent of GDP, the increase in FY19/20 was mainly due to the rolling over
of unpaid fuel and fertilizer arrears. While food and fertilizer subsidies remained stable at 0.5 percent and
0.4 percent of GDP respectively, fuel subsidies increased by about 35 percent relative to FY18/19, to 0.2
percent of GDP. However, actual subsidies on both food and fertilizer are likely to have been higher than
the revised estimates suggest due to extra-budgetary resources and borrowing from the NSSF52. The Food
51 Capital expenditures as a share of GDP have firmed up in recent years with the last ten years’ average at 1.7 percent. Except year 2015-16 when capex to GDP ratio stood at 1.5 percent, it has ranged between 1.6 percent and 1.8 percent of GDP, i.e. +/- 0.1 percentage point difference from an average of 1.7 percent every year since 2011-12.
52 A detailed statement on “Extra Budgetary and Other Resources (Government Fully Serviced Bonds and NSSF Loans” has been included in the FY20/21 Budget.
-4
-2
0
2
4
6
8
10
2017 2018 2019 2020 Prov.
Rural Development Health
Agriculture and Allied Activities Major Subsidies
Pension Interest
Education Defence
10.0
10.2
10.4
10.6
10.8
11.0
11.2
11.4
11.6
11.8
0.0
0.2
0.4
0.6
0.8
1.0
1.2
1.4
1.6
1.8
2.0
2017 2018 2019 2020 Prov.
Capital Expenditures
Current Expenditures (RHS)

I n d i a D e v e l o p m e n t U p d a t e - J u l y 2 0 2 0
50
Corporation of India borrowed INR1.1 trillion (about 0.5 percent of GDP) in FY19/20, from the National
Small Savings Fund (NSSF), to fund subsidy claims unfunded by budgetary allocation. Rashtriya Chemicals
and Fertilizers Ltd. (a publicly-owned fertilizer company) and other publicly-owned entities have also
borrowed from the NSSF.53
Figure A.67: Subsidy expenditure remained largely stable
(Expenditure on major subsidies, percent of GDP)
Figure A.68: Expenditure growth outpaced growth in receipts
(Centre’s receipts and expenditures, percent of GDP)
Source: MoF, CGA, MoSPI Source: MoF, CGA, MoSPI
Overall, the centre’s fiscal deficit increased from the revised estimate of 3.8 percent of GDP to 4.6
percent in FY19/20. The provisional estimates reflect information for the whole year but are subject to
revisions when the final fiscal outturn is presented by the government. The provisional data indicate that
the COVID-19 outbreak had a significant negative effect on revenue collection, mainly due to a shortfall
in direct taxes as well as taxes on international trade, which are dependent on consumption and trade
volumes. This was marginally offset by an increase in taxes on fuel as global oil prices declined. The
government could also not meet the revised estimate amount target for disinvestment, as financial markets
recorded sharp declines in March and disinvestment transactions were postponed.
A large shortfall in revenues could lead to an increase in the fiscal deficit in FY20/21. According to
monthly fiscal accounts for April and May, tax revenues in the first two months of the fiscal year declined
by more than 70 percent, compared with the same period in FY19/20. However, spending was only
marginally below last year’s levels. In the context of the nationwide lockdown as well as the extension of
most tax filing deadlines till at least June 30th, the sharp decline in revenues was largely expected.
Nonetheless, the data for April and May highlight the effect of the revenue shortfall on the central
government’s overall fiscal situation as the fiscal deficit increased to nearly 60 percent of the budgeted
amount. The decline in central tax revenues will also have knock-on effects on state government finances
as the divisible pool of central taxes will also shrink.
53 According to the “Statement of Extra Budgetary & other Resources (Govt. fully serviced bonds and NSSF loan)” of the FY20/21 Budget, two companies under the Department of Fertilizers had borrowed INR 31.2 billion from the NSSF in FY19/20 (as per revised estimates).
0.0
0.2
0.4
0.6
0.8
1.0
1.2
2016 2017 2018 2019 2020 Prov.
Fertilizer Petroleum Food
8.2
8.4
8.6
8.8
9.0
9.2
9.4
9.6
11.6
11.8
12.0
12.2
12.4
12.6
12.8
13.0
13.2
13.4
2017 2018 2019 2020 Prov.
Expenditures Non-debt Receipts (RHS)

I n d i a D e v e l o p m e n t U p d a t e - J u l y 2 0 2 0
51
Box A.3: Economic stimulus and reform measures announced by the central government to alleviate the impact of the COVID-19 outbreak
Soon after a nationwide lockdown was announced on March 23rd, the central government announced the Pradhan
Mantri Garib Kalyan Yojana (PMGKY), a package of welfare measures to address the most vulnerable sections of
the population. Following the extension of the lockdown by several weeks, on May 12th, the Prime Minister
announced another economic stimulus package, the Atma Nirbhar Bharat Abhiyan, amounting to INR 20 trillion
(USD 264 billion). The details of the package were announced in several tranches and the economic package includes
the measures announced under the PMGKY, direct fiscal support, indirect government support in the form of
credit guarantees, tax measures, policy reforms and liquidity measures taken by the RBI (discussed separately).
Measures involving direct government spending:
1. Under the Pradhan Mantri Gareeb Kalyan Anna Yojana (PMGKAY), an additional allocation under the
Public Distribution System (PDS) had been made for about 800 million existing beneficiaries for three
months (additional 1kg pulses per household, 5kg wheat or rice per individual in the household) and access
to the benefits has been further extended till November 2020. Also, 5kg food grains per person per month
were given free of cost in May and June to approximately 80 million migrants /stranded migrants who were
not covered under either the National Food Security Act (NFSA) or State Scheme PDS Cards. The
additional cost of both measures will be borne by the central government.
2. Advance release of income support of INR 2000 under the Pradhan Mantri-Kisan Samman Nidhi (PM-
KISAN) for 87 million farmers.
3. Increased budgetary allocation of INR 400 billion for Mahatma Gandhi National Rural Employment
Guarantee Scheme (MGNREGS) and an increase in daily wage rates under the scheme from INR 182 to
INR 202.
4. Transferring INR 1000 to all beneficiaries under the National Social Assistance Programme (NSAP) for
the elderly, widows, and disabled receiving social pensions (35 million beneficiaries).
5. Transferring INR 500 per month to all female Jan Dhan Accounts for three months.
6. Providing free cylinders for three months to poor Pradhan Mantri Ujjwala Yojana beneficiaries (83
million households).
7. The Central Government will pay Employee Provident Fund (EPF) contributions for employees and
employers for six months. This is targeted to establishments with up to 100 workers and where 90% of
workers earn less than INR 15,000 per month. This is expected to cover 1.8 million employees and
400,000 establishments. The rate of EPF contributions has also been reduced from 12 percent to 10
percent for three months (May-July) to provide additional liquidity to both employers and employees.
8. Accelerated release of all payables due from the government to MSMEs within a 45-day timeframe.
9. Infusion of capital into the Credit Guarantee Trust Fund for Micro and Small Enterprises and National
Credit Guarantee Trust Company to support credit guarantee measures for MSMEs.
10. Creation of a new Fund of Funds for equity infusion in viable MSMEs with a corpus of INR 100 billion.
11. Interest subsidy on housing loans and working capital loans under various existing government schemes.
12. New schemes for the modernization of agriculture and allied activities such as farm-gate infrastructure,
micro food enterprises, fisheries, animal husbandry, herbal cultivation, and beekeeping.
13. Investment in evacuation infrastructure in the coal sector to increase production.
14. Increased viability gap funding for social infrastructure projects from the earlier 20 percent to 30 percent.
15. Increased expenditure on health services and equipment being released to the states and implementing
agencies
16. Combining 25 government schemes to provide livelihood opportunities to returning migrant workers and
other rural workers under a rural public works scheme, the Garib Kalyan Rojgar Abhiyaan, in 116 districts
across six states.
17. An interest subvention scheme for a period of 12 months for the smallest category of loans under the
Pradhan Mantri MUDRA Yojana for the benefit of micro and small enterprises.
Measures involving indirect government support:
1. Credit guarantees for the MSME sector to facilitate increased credit off-take, amounting to INR 6.2
trillion.
2. Full government guarantee for investments in non-banking financial companies, housing finance
institutions, and mutual fund institutions (NBFCs, housing finance institutions, and MFIs) under a special
liquidity scheme amounting to INR 300 billion.
3. Partial credit guarantee for borrowings of lower-rated NBFCs, housing finance institutions, and MFIs.

I n d i a D e v e l o p m e n t U p d a t e - J u l y 2 0 2 0
52
4. Special credit facility for street vendors with liquidity provision of INR 50 billion to channelize credit
through banks.
5. Additional refinance support of INR 300 billion for regional rural banks and co-operative banks through
the National Bank for Agriculture and Rural Development.
6. Increased coverage under the Kisan Credit Card scheme for concessional credit for farmers.
7. Liquidity injection of INR 900 billion in power distribution companies at the state level through loans
against receivables given by the Power Finance Corporation and the Rural Electrification Corporation
(both central public sector enterprises).
8. State governments have been advised to use funds in the Building and Other Construction Worker Funds
and Compensatory Afforestation Funds to provide relief and employment opportunities to registered
construction workers and other vulnerable groups.
9. The borrowing limit for state governments has been increased from 3 percent of GSDP to 3.5 percent for
FY 2020-21, unconditionally. This can be increased to as much as 5 percent of GSDP, conditional on
certain reforms.
Tax measures:
1. Extension of the due date for filing income tax returns for previous fiscal years.
2. The tax rate for advance tax collections on certain domestic transactions, in the form of the tax deducted
at source (TDS) and tax collected at source (TCS), was cut by 25 percent.
3. Reduction in the interest rate on late payment of several taxes and no initiation of penalties or
prosecution on non-payment until June 30.
4. Extension of due date for payment under Vivad se Vishwas, a scheme for the resolution of income tax
disputes, until December 31, 2020.
5. The deadline for claiming tax deductions under various laws has been extended.
6. The lockdown period will be excluded for the purpose of determination of tax residency for individuals
whose stay in India has been prolonged due to suspension of normal international air travel.
7. Several tax filing deadlines were extended from March 31 to June 30, including the deadline for Goods
and Services Tax for small taxpayers. Late fees and penalties were also waived for this period.54
Policy reform measures:
1. The definition of MSMEs has been revised with a sizeable increase in the investment limit, and firm
turnover has been introduced as an additional criterion for classification. The classification framework for
the manufacturing and services sectors have been unified. This will allow smaller firms to invest more
without losing access to government programs and concessional credit for MSMEs.
2. Agricultural food commodities have been deregulated under the Essential Commodities Act to enable
better price realization for farmers. The central government will also introduce a law to facilitate barrier-
free inter-state trade and reduce restrictions on how farmers can market their produce. A legal framework
will be established for agricultural product price and quality assurance.
3. Investment regulations have been eased in several sectors that were previously restricted for private firms.
These include coal exploration and mining, minerals, defence production, aerospace activities, and atomic
energy.
4. A revised public sector enterprise policy has been announced wherein all sectors (including strategic ones)
would be opened to the private sector; the number of public sector enterprises in strategic sectors would
be limited to four; public sector enterprises in non-strategic sectors would be privatized in due course.
5. The government is considering expanding the definition of inter-state migrant workers to include all
those workers who are either recruited by a contractor or employer and those who migrate to another
state on their own. It also proposes to provide portability of benefits for building and construction
workers.
Fiscal Impact
While the overall size of the economic stimulus package has been pegged at INR 20 trillion, the fiscal impact of the
package in terms of central government spending in FY 2020-21 is much lower. Market analysts have provided
estimates ranging from 0.7 to 1.2 percent of GDP. Overall, it seems certain that the fiscal deficit outturn would be
much larger than the budgeted 3.5 percent, both due to softer revenue collection and additional expenditure on
54 The list of tax measures is not exhaustive and several other measures have been announced by the Department of Revenue in relation with COVID-19.

I n d i a D e v e l o p m e n t U p d a t e - J u l y 2 0 2 0
53
account of the relief measures. However, it is difficult to estimate the exact size of the fiscal deficit due to the high
level of uncertainty about economic growth.
Box A.4: Financing measures adopted by the central government
In anticipation of the likely shortfall in revenue receipts and increased spending following the COVID-19 outbreak,
several measures have been adopted to ensure adequate financing for the central government:
1. The central government has increased the excise duty on petrol and diesel on two separate occasions
since early March. In total, the excise duty on petrol has increased by INR 13 per litre and that on diesel
by INR 16 per litre (including road and infrastructure cess).
2. The central government’s estimated gross market borrowings for 2020-21 have been increased from the
budget estimate of INR 7.8 trillion (about USD 103 billion) to INR 12 trillion, according to the revised
issuance calendar for government securities
3. The RBI, in consultation with the government has also enhanced the limit on Ways and Means
Advances for April–September 2020-21 to INR 1.2 trillion from INR 750 billion for the same period in
2019-20.
c. State government
The fiscal outcomes of the state governments improved in FY18/19. After two years during which
the states’ combined fiscal deficits increased (in FY15/16 and FY16/17 due to loans extended to power
distribution companies under the UDAY), they outperformed revised estimates, reaching 2.5 percent in
FY18/19. According to preliminary fiscal accounts published by the CAG as well as fiscal accounts
published by the states themselves, the actual fiscal deficit was about 0.4 percentage points lower than the
revised estimate for FY18/19.
However, the opposite happened in FY19/20 due to the slowdown in growth. According to revised
estimates for 18 states (published along with their respective state budgets for FY20/21), the fiscal situation
of sub-nationals worsened. The revised estimates for these 18 states indicate an increase in the fiscal deficit
to at least 3.0 percent of combined GSDP (Figure A.69). However, these revised estimates do not account
for the month of March 2020 and the COVID-19 outbreak and the subsequent nationwide lockdown will
have affected revenue collection during the second half of the month.
Debt fell sharply as a share of GSDP in FY18/19. Consolidated data on outstanding liabilities of states
is only available from the RBI until March 31st, 2019. They indicate a gradual decline in debt in FY18/19.
More recent data is only available for 18 states and indicate that the decline in debt was much sharper in
FY18/19, in line with the better-than-expected fiscal performance of the states lowering the borrowing
requirement (Figure A.70).

I n d i a D e v e l o p m e n t U p d a t e - J u l y 2 0 2 0
54
Figure A.69: The fiscal deficit increased in FY19/20 following two years of relative fiscal prudence…
(Fiscal deficit, percent of GSDP)
Figure A.70: …while the decline in borrowing post-UDAY resulted in lower debt
(total outstanding debt, percent of GSDP)
Source: RBI, CAG, state finance departments and World Bank staff calculations
Note: Figures for FY18/19 are based on data from 18 state budgets
Source: RBI, state finance departments and World Bank staff calculations Note: Figures for FY18/19 are based on data from 18 state budgets
Both revenue shortfalls and increased spending contributed to the increase in the fiscal deficit in
FY19/20. Based on the revised estimates for 18 states, we can establish some stylized facts about fiscal
dynamics in FY19/20. Comparing the revised estimates (RE) for FY19/20 with FY18/19, we see that
growth in spending (16.5 percent) outpaced revenue growth (13.1 percent). As a result, the combined fiscal
deficit increased by over 40 percent in nominal terms.
On the revenue front, there were two main contributing factors to the shortfall — of taxes from the
central government and slow growth in states’ own revenues. First, the central divisible pool of taxes
that is devolved to states declined by almost 20 percent from budget estimates ((BE) to RE and by 6 percent,
compared with FY18/19 (this is largely attributable to the corporate tax cut announced in September 2019
as well as a downward adjustment to account for the excess funds devolved to states in the previous fiscal
year). Second, the states’ own tax revenues lagged behind budget estimates and grew by about11.5 percent
compared with FY18/19, because of the slowdown in economic growth in FY19/20. Transfers, however,
grew significantly as the shortfall in state GST collection was partially compensated by GST compensation
grants from the centre.
While in the past, state governments have cut capital outlays to meet their fiscal deficit targets,
they did not do so in FY19/20. Revised estimates suggest that both capital outlays and current spending
were higher than budgeted in FY19/20. The increase in spending was entirely discretionary, as non-
discretionary spending (expenditure on salaries, pensions, and interest payments) declined relative to BE.
While more granular data on spending that is comparable across states is not available, many states increased
spending on rural welfare programs and the agriculture sector. According to the RBI, nine states had active
farm loan waiver schemes in FY19/20, six states also introduced income support schemes over and above
the centre’s PM-KISAN scheme.
State finances are likely to come under pressure following the COVID-19 outbreak and the
subsequent lockdown. First, on the expenditure front, nearly all states have announced welfare measures
that include increased entitlements of subsidized rations through the PDS (over and above those announced
by the central government) as well as increased direct cash transfers to beneficiaries of pension schemes.
On the revenue front, the states’ capacity to raise revenues has been impacted directly by the nationwide
lockdown, since a large part of own-tax revenue is derived from excise and other taxes on fuel and liquor,
2.6
3.0
3.5
2.4 2.5
2.3
2.8
0.0
0.5
1.0
1.5
2.0
2.5
3.0
3.5
4.0
4.5
5.0
2014/15 2015/16 2016/17 2017/18 2018/19*
Fiscal deficit (incl. UDAY)
Fiscal Deficit (excl. UDAY)
19
20
21
22
23
24
25
26
2014/15 2015/16 2016/17 2017/18 2018/19*

I n d i a D e v e l o p m e n t U p d a t e - J u l y 2 0 2 0
55
whose sales have plunged. The expected decline in growth in incomes and consumption will also affect
state GST collections.
Several measures have been announced to ease fiscal pressures on states. The central government
has released the states’ share of central taxes for the month of April on the basis of budget estimates of
revenue collection for FY20/21, even though it is unlikely that the centre will be able to meet this revenue
target. Coupled with the revenue deficit grants awarded by the 15th Finance Commission, this will partly
compensate for the expected shortfall in states’ own tax revenues. On the borrowing front, the RBI has
increased the limit on ways and means advances for the first half of FY20/21 by 60 percent for all states.
The borrowing limit for all states has been increased from 3 percent to 3.5 percent of GSDP for 2020-21
and can be further increased up to 5 percent if state governments enact a set of reforms outlined by the
centre. According to the Ministry of Finance, although the states could borrow as much as 50 percent of
their borrowing limit for the first half of FY20/21 in April, only 14 percent of the available borrowing limit
for states was utilized.
d. Government Debt55
After declining over the last decade, general government debt has risen in recent years. While the
increase in the general government debt-to-GDP ratio was marginal in FY18/19, debt is estimated to have
increased significantly in FY19/20 to 72.0 percent, due to declining real growth and a rise in the primary
deficit for both the centre and states (Figure A.71).
Figure A.71: The increase in the primary deficit and the slowdown in growth contributed to the increase in debt
(percent)
Source: RBI, MoF, MoSPI and World Bank staff calculations Note: Figures for 2019-20 are World Bank estimates; r-g is the difference between the nominal effective interest rate and
the nominal rate of GDP growth, weighted by the previous period’s debt-to-GDP ratio
The central government’s debt has increased, mainly through domestic borrowing. The centre’s
debt level rose from 49.6 percent of GDP to 51.0 percent (Figure A.72), mainly on account of a rise in
internal liabilities (internal debt, specifically dated securities and treasury bills, and small savings deposits)
from 46.9 percent of GDP in 2018-19 to 48.4 percent in FY19/20. This includes government liabilities on
account of extra-budgetary resources (EBR), which are borrowings by autonomous bodies or central public
sector enterprises that are fully serviced by the central government. These have steadily increased as a share
of GDP from less than 0.1 percent in FY16/17 to an estimated 0.7 percent in FY19/20. External liabilities,
also increased by 0.2 percentage points to 2.9 percent of GDP during the same period.56 Over the last
55 Government debt includes internal, external, and public account liabilities, as well as the extra-budgetary resources (bonds fully serviced by the government) of the central government.
56 External liabilities calculated at current exchange rate.
62.0
64.0
66.0
68.0
70.0
72.0
74.0
76.0
-5.0
-4.0
-3.0
-2.0
-1.0
0.0
1.0
2012/13 2013/14 2014/15 2015/16 2016/17 2017/18 2018/19 2019/20*
Primary Balance (left axis) r-g (left axis)
Debt-to-GDP ratio (right axis)

I n d i a D e v e l o p m e n t U p d a t e - J u l y 2 0 2 0
56
decade, the centre’s debt has gradually declined from 57.3 percent of GDP in FY09/10 and stabilized in
FY18/19 (except for a small increase in FY17/18).57
Off-budget financing of government spending through borrowing by public sector enterprises has
been increasing and been highlighted in the latest budget. The government has also published data
on financial support extended to the Food Corporation of India, two publicly owned companies, and the
Building Materials & Technology Promotion Council through loans from the NSSF. This financial support
covers the gap between these entities’ total requirement for funds and the budgetary provisions made in
that year. The quantum of this support has also steadily increased from 0.5 percent of GDP in FY16/17 to
an estimated 2.0 percent in FY19/20.
Figure A.72: In 2019-20, the rising primary deficit and the decline in real GDP growth have pushed up central government debt
(percent)
Source: MoF, RBI, MoSPI, and World Bank staff calculations Note: Figures for 2019-20 are World Bank estimates; r-g is the difference between the nominal effective interest rate and the nominal rate of GDP
growth, weighted by the previous period’s debt-to-GDP ratio
At the sub-national level, debt levels have risen since FY15/16. While the rise immediately after
FY15/16 was on account of states taking over debt previously held by loss-making electricity distribution
companies, the increase in the last few years can be mainly attributed to slowing growth and a rise in gross
primary deficits.58 After reaching a low of 21.7 percent of GDP in FY14/15, the debt ratio of states has
gradually increased to 25.8 percent in FY19/20.59 However, even this is based on budget estimates for
FY19/20 published between February and April 2019 and revised estimates for the same period are likely
to show an increase in borrowing and debt.
57 Estimates of the center’s outstanding liabilities up to 2018-19 are from the RBI’s Database on Indian Economy and from the Union Budget 2020-21 and the Public Debt Management Quarterly Report for January-March 2020 for the next year. Estimates of the states’ outstanding liabilities up to 2019-20 are from the RBI.
58 As part of the UDAY scheme, state governments realized up to 75 percent of outstanding contingent liabilities owed to loss-making electricity distribution companies, which increased their debt by 3 percentage point to 24.7 percent of GDP in 2016-17.
59 Because of a rise in the debt burden due to UDAY, states faced higher interest expenditure in the succeeding years. Several states
had announced farm loan waivers programs between 2016-17 and 2018-19. As per RBI’s study of state finances 2019-20, while the
magnitude and coverage of loan waivers varies across states, the total fiscal cost of the announced bailouts varied between 0.1
percent and 0.3 percent of GDP in the mentioned years, particularly as they formed more than 1 percent of state governments’
overall expenditure.
47.0
48.0
49.0
50.0
51.0
52.0
53.0
-4.0
-3.0
-2.0
-1.0
0.0
1.0
2012/13 2013/14 2014/15 2015/16 2016/17 2017/18 2018/19 2019/20*
Primary Balance (left axis) r-g (left axis)
Debt-to-GDP ratio (right axis)

I n d i a D e v e l o p m e n t U p d a t e - J u l y 2 0 2 0
57
PART B – Outlook and special topics
1. Global Economic Developments and Outlook
The COVID-19 pandemic has brought a global economic shock of enormous magnitude, with steep recessions in many
advanced and emerging market and developing economies (EMDEs). Global output is expected to contract severely in 2020,
despite strong policy support in many countries. The shock is highly synchronized across the world and it has deeply impacted
financial, goods, services, and commodity markets; with associated implications for trade, capital, and remittance flows. The
outlook remains highly uncertain and there are large downside risks including extended or recurrent infection outbreaks.
a. Global growth
The ongoing COVID-19 pandemic is posing one of the most severe shocks to the world economy since
World War II. The broad reach of the outbreaks – and their consequences on financial markets, commodity
prices, manufacturing, services, tourism, trade, global supply chains, and confidence – has extended to
virtually all regions of the world (Figure B.1). Against this backdrop, the global economy is expected to
contract by 5.2 percent in 2020 (World Bank 2020a). However, the outlook is marked by extreme
uncertainty. Developments continue to be volatile with severe downside risks, such as a delayed revival in
confidence or more permanent disruptions to global value chains, all of which could bear long-term
legacies.
The global growth outlook will be driven by contractions in advanced economies and EMDEs, and will be
highly synchronized across the globe. The contraction in advanced economies will be especially sharp, at 7
percent, while EMDEs are also expected to contract significantly by 2.5 percent. Assuming that the
pandemic will recede later in 2020 and that cross-border spillover effects from contracting global growth
ease somewhat in the second half of 2020, activity is expected to recover somewhat in the second half of
the year. Global growth is expected to resume and experience a moderate recovery of 4.2 percent in 2021.
b. Growth outlook in advanced economies
Advanced economies have experienced an unprecedented collapse in activity. Their output is now projected
to decelerate dramatically, from an expansion in 2019 to a contraction of 7 percent in 2020.
Growth in the US, Euro Area, and Japan is expected to contract substantially in 2020, reflecting the severe
impact of the pandemic in the first half of the year and assuming a gradual recovery in the second half. In
the US, the outbreak has been associated with a sharp collapse in services activity and a rise in
unemployment claims. In the Euro area, all major member countries are expected to experience recessions.
In Japan, outcomes earlier in the year were already weaker-than-expected, and the pandemic will accentuate
the scope of downward revisions.
In 2021, growth in major advanced economies is expected to rebound and return to positive. This assumes
that coronavirus-related effects fade, that the effects of large-scale policy support in the US, Euro Area,
and Japan materialize as planned, and that there is a recovery in consumer and investor confidence.

I n d i a D e v e l o p m e n t U p d a t e - J u l y 2 0 2 0
58
Figure B.1: Global economy under the COVID-19 pandemic
A. Confirmed COVID-19 cases (weekly change, thousands of persons (LHS); Total, millions of
persons (RHS))
B. Global Manufacturing and Services PMI (Index, 50+= expansion)
C. VIX Index D. Consumer confidence in major AEs
(Z score)
Sources: Chicago Board Options Exchange; Haver Analytics, Johns Hopkins University, World Bank. A. Based on weekly data. Last observation is final week of June.
B. Manufacturing and services are measured by Purchasing Managers’ Index (PMI). PMI readings above (below) 50 indicate expansion (contraction) in economic activity. Last observation is June 2020.
C. Market volatility index based on US S&P 500 Options (VIX). X-axis label denotes month-year. 30-trading day moving averages. Last observation is June 30, 2020.
D. AE=advanced economies. Consumer confidence index for each economy is normalized using mean and standard deviation from 2015-19. Denotes period averages of monthly data.
c. Growth outlook in EMDEs
The recovery expected in EMDEs in 2020 has been reversed by the pandemic. After falling to a post GFC-
crisis low in 2019, EMDEs are forecasted to contract by 2.5 percent in 2020. The fall in activity is broad-
based, with the majority of EMDEs expected to fall into recession. The EMDEs most susceptible to global
spillovers, such as economies that are heavily dependent on tourism, deeply embedded in global value
0
1
2
3
4
5
6
7
8
9
10
11
0
150
300
450
600
750
900
1050
1200
Wee
k 1
Wee
k 3
Wee
k 1
Wee
k 3
Wee
k 1
Wee
k 3
Wee
k 1
Wee
k 3
Wee
k 5
Wee
k 2
Wee
k 4
Feb Mar Apr May June
Cases
Cumulative cases (RHS)
20
25
30
35
40
45
50
55
Jun-
18
Oct
-18
Feb
-19
Jun-
19
Oct
-19
Feb
-20
Jun-
20
Manufacturing
Services
-10
10
30
50
70
Jun-
04
Jun-
06
Jun-
08
Jun-
10
Jun-
12
Jun-
14
Jun-
16
Jun-
18
Jun-
20 -8
-6
-4
-2
0
2
2018 2019 2020Jan-Feb
2020Mar-Apr
2020May-Jun
United States
Euro Area
Japan

I n d i a D e v e l o p m e n t U p d a t e - J u l y 2 0 2 0
59
chains, or exporters of industrial commodities, are expected to experience deeper impacts. Many EMDEs
are also suffering from depreciation pressures, straining their balance sheets, and raising debt financing
vulnerabilities (Figure B.2). Activity in EMDEs is expected to recover in 2021, to above 4.5 percent,
supported by an expected pickup in China and a recovery of trade flows and investment. Outside China,
growth is expected to recover modestly in 2021, partly as commodity exporters will continue to grapple
with subdued commodity prices. Moreover, the expected improvement is contingent on improved trade
and investment growth and in some EMDEs, private investment will remain weak due to policy uncertainty
and long-standing structural bottlenecks. COVID-19 can erode these prospects further, as firms respond
to elevated uncertainty by cutting investment and innovation spending.
In China, output contracted sharply in the first quarter. Industrial and services activity and private
consumption were especially depressed by mitigation policies, and exports plummeted more than imports
as a result of temporary factory closures. Activity has been normalizing since Q2 2020 following the
loosening of lockdown measures. The authorities implemented aggressive monetary and fiscal actions, such
as substantial liquidity injections by the central bank to support market confidence and relieve banking
liquidity constraints. Growth is projected to decelerate sharply in 2020 from 6.1 percent in 2019 to below
2 percent in 2020. Growth is expected to rebound in 2021, reflecting significant base effects and a recovery
in global and domestic demand.
Figure B.2: Emerging market and developing economies
A. EMDE currency valuations (Percent change relative to Jan 2, 2020)
B. China PMI (Index, 50+=expansion)
Source: Haver Analytics. A. Figure shows percent change of the J.P. Morgan nominal broad effective exchange rate index for each region relative to Jan 2, 2020. Each
column is based on the period average of daily data during that month. B. Official and Caixin Purchasing Managers Indexes (PMI). PMI readings above 50 indicate expansion in economic activity; readings below 50
indicate contraction.
d. Financial developments
Global financial markets witnessed extremely high volatility in the wake of the COVID-19 outbreak, with
repercussions for all regions. Early in the year, the VIX index of market volatility (a common proxy for
global market volatility) spiked to levels comparable to those of the 2008-09 GFC. Around the same time,
the pressures on many countries’ financial systems increased sharply and investors’ flight to safety was
widespread. Many companies’ cash flows and debt financing became highly strained. Liquidity stress
-20
-15
-10
-5
0
5
10
Uni
ted
Sta
tes
Cen
tral
and
Eas
tern
Eur
ope
Em
ergi
ng A
sia
Lat
in A
mer
ica
Mid
dle
Eas
tan
d A
frica
Mar-20 Apr-20 May-20 Jun-20
20
30
40
50
60
Manu-facturing
Services Manu-facturing
Services
Caixin PMI Official PMI
Jan-20 Feb-20 Mar-Apr 20 May-Jun 20

I n d i a D e v e l o p m e n t U p d a t e - J u l y 2 0 2 0
60
affected various asset classes, including corporate or government debt in major economies like the US
(Figure B.3). However, these pressures have receded somewhat since April, partly reflecting strong policy
support across major advanced economies.
EMDEs initially experienced capital outflows and equity valuation falls to levels multiple times lower than
those near the end of 2019. This brought tightening financing conditions, widening bond spreads, and
depreciation pressures, especially in countries with CADs. The fiscal strains from rising financing costs
were amplified by high government debt in many EMDEs and banking system profitability came under
pressure. Tightening liquidity in many financial markets made it more challenging for large EMDE private
and government borrowers to roll over their debts.
To restore investor confidence and contain financial stress, central banks have injected liquidity into
financial markets through various means – direct provision of business credit, macroprudential measures,
and large-scale asset purchases. Amid the sharp rise in demand for US dollars for hedging and other
purposes, the Federal Reserve arranged access to liquidity swaps for many countries, including major
economies like Brazil, Mexico, and South Korea. Partly supported by these types of measures, capital
outflows from EMDEs as well as equity market valuations stabilized by April.
Figure B.3: Financial markets turmoil
A. US corporate bond yield (Percent)
B. Emerging market capital flows (Index, 100=2019Jan)
Sources: Federal Reserve Bank of St Louis, Haver Analytics, Institute of International Finance. A. Last observation is June 30.
B. Denotes estimated monthly non-resident portfolio debt and equity flows, normalized to 100 in Jan 2020. Last observation is June 2020.
e. Oil market
Driven by a collapse in demand, nearly all commodity prices declined in the first half of the year. Brent oil
prices fell by about 30 percent between late January and end-June 2020. Early in the year, the volatility of
oil prices reached levels unseen since the GFC (Figure B.4). Mitigation measures to slow the spread of the
pandemic have resulted in a sharp decline in travel, which contributes substantially to oil consumption and
demand. To help mitigate the impacts associated with the fall in global demand, a new production cut
agreement was negotiated by OPEC and its partners in April.
4
8
12
16
20
24
1
2
3
4
5
6
Jan-
20
Feb
-20
Mar
-20
Apr
-20
May
-20
Jun-
20
AAA BBB CCC & lower (RHS)
-300
-200
-100
0
100
200
Oct
-19
Nov
-19
Dec
-19
Jan-
20
Feb
-20
Mar
-20
Apr
-20
May
-20
Jun-
20
Debt flows
Equity flows

I n d i a D e v e l o p m e n t U p d a t e - J u l y 2 0 2 0
61
On balance, oil prices are expected to be subdued, around USD 30/bbl on average in 2020. Oil demand is
expected to fall by about 8 mil b/d in 2020, an unprecedented annual fall (IEA 2020). Production is
expected to remain low, in line with the newly renegotiated cut agreement by OPEC+ members. Risks to
the outlook are large in both directions and depend on the speed at which mitigation measures are lifted
and the pace at which producers cut output.
Figure B.4: Oil price volatility and demand dynamics
A. Oil price volatility (Standard deviation)
B. Global oil demand expectations (Millions b/d)
Sources: Haver Analytics, International Energy Agency A. Rolling 60-day standard deviation of Brent oil prices. X-axis label denotes month-year. Last observation is June 30, 2020.
B. Denotes IEA forecasts for global oil demand. X-axis denotes the forecasted quarter of interest. Legend denotes month-year for which forecast is published.
f. Global trade and remittances
Recent indicators suggest that global trade could contract more than it did during the GFC, partly reflecting
the damage COVID-19-related disruptions have posed to international travel and global value chains
(Figure B.5). Furthermore, severance in access to credit markets, which contributed to the contraction in
global trade during the GFC and its anaemic recovery, again emerges as a risk under the current
environment.
The fall in activity has been concentrated in traditionally stable services sectors. In particular, travel
restrictions and concerns about COVID-19 have led to a steep fall in tourism—a sector that typically
accounts for nearly one third of global services exports—with sharp declines in many economies with the
most severe outbreaks.
Global value chains had benefitted from a slight easing in tariffs and tensions between the United States
and China in February. Since the pandemic spread, however, more stringent border controls and production
delays have dented global supply chains, which now account for large share of global trade. Measures to
slow the outbreak have limited or delayed the supply of critical inputs and caused shortages of products in
sectors like automotive and electronics.
The sharp contraction in global activity in the first half of 2020 is expected to contribute to a contraction
of more than 13 percent in global trade, with heavy downside risks. A gradual recovery is expected to start
0
4
8
12
16
20
24
Jun-
04
Jun-
06
Jun-
08
Jun-
10
Jun-
12
Jun-
14
Jun-
16
Jun-
18
Jun-
20
0
20
40
60
80
100
120
2020q1
2020q2
2020q3
2020q4
Feb-20 Mar-20 Apr-20 May-20 Jun-20

I n d i a D e v e l o p m e n t U p d a t e - J u l y 2 0 2 0
62
in the second half of the year as mitigation measures are lifted, travel moves toward more typical levels, and
manufacturers rebuild inventories.
Remittance flows are also expected to fall sharply this year, reflecting a decline in the wages of migrant
workers and lower migration flows (World Bank 2020b). These declines are expected to be especially
pronounced in regions like Europe and Central Asia, South Asia, and Sub-Saharan Africa, which have tight
linkages to remittance source countries heavily impacted by COVID-19 disruptions. The fall in commodity
prices will also affect commodity exporters, such as those in the Gulf Cooperation Council (GCC), which
are important sources of remittances for regions like South Asia.
Figure B.5: Global trade
A. Container shipping and new export orders (Percent, year-on-year (LHS); Index, 50+=expansion
(RHS))
B. Services versus manufacturing new export orders
(Index, 50+=expansion)
Sources: Institute of Shipping Economics and Logistics, Haver Analytics. A. New export orders measured by composite Purchasing Managers’ Index (PMI). PMI readings above 50 indicate expansion in economic activity;
readings below 50 indicate contraction. Last observation is June 2020. 3-month moving average. B. Denotes 3 month moving average. Last observation is June 2020.
g. Risks to the global outlook
The global economy is experiencing one of the sharpest contractions in recent history. Given the
unprecedented nature of the shock, baseline forecasts are subject to extreme uncertainty and to the possible
realization of even worse outcomes.
Downside risks could exacerbate the downturn and/or dampen the pace of recovery. In the near-term, the
recession will be more pronounced if a lingering pandemic requires extended mitigation measures, policy
actions fail to mitigate the economic damage to households and corporations, financial stress catalyses
financial crises, and an extend period of subdued commodity prices triggers deeper financial and real-sector
distress among commodity exporters. The recovery could continue to be derailed even after mitigation
measures are lifted if the pandemic causes more permanent changes in consumer and investor behaviour,
high debt burdens hinder capital investment, crises provoke a retrenchment from global value chains, or
social unrest erupts.
25
30
35
40
45
50
55
-8
-4
0
4
8
Feb
-19
Jun-
19
Oct
-19
Feb
-20
Jun-
20
Container shipping
New export orders (RHS)
25
30
35
40
45
50
55
Jun-
19
Aug
-19
Oct
-19
Dec
-19
Feb
-20
Apr
-20
Jun-
20
Manufacturing Services

I n d i a D e v e l o p m e n t U p d a t e - J u l y 2 0 2 0
63
Economic growth outlook and risks in India
The COVID-19 pandemic has brought about major disruptions to economic activity, including due to deliberate global and
domestic policy actions to contain it. As a result, the Indian economy is now expected to contract in FY20/21. Fiscal outcomes
are expected to be stretched in the wake of the COVID-19 outbreak, both due to its revenue implications and the necessary
policy responses. The CAD is expected to narrow significantly due to the decline in economic activity and the weak external
environment, which are expected to depress both imports and exports.
a. Outlook
India’s economy has been significantly affected by the COVID-19 outbreak, including by policy responses
that entail upfront economic costs to avoid much larger downstream damage. Until mid-March 2020, India
was affected mostly indirectly by the COVID-19 pandemic. External spillover effects dominated, as key
imported inputs to domestic production, especially from China,60 were impeded and supply chains were
disrupted. Thereafter, domestic supply and demand were affected by increasingly stringent restrictions on
the movement of goods and people. The Union government implemented a lockdown of the country to
contain domestic contagion, and several states imposed additional curfew measures. As a result, economic
activity – particularly outside of agriculture – slowed sharply. There was also a large negative impact on
financial markets via a shift in the global investor sentiment, which impacted capital flows and equity
markets negatively.
Extensions to the national lockdown – implemented by the union government with the backing of states –
resulted in a quasi-standstill in economic activity over the first two months of the first quarter of the new
fiscal year FY20/21. Moreover, since it is likely that social distancing provisions of varying stringency will
need to remain in place even beyond the lockdown period, the recovery is expected to be extremely gradual
thereafter. In turn, the lockdown period is likely to adversely impact the balance sheets of households and
firms. These mutually reinforcing disruptions in domestic supply and demand, coming on the back of
particularly weak external trade activity, are expected to result in a growth contraction in FY20/21, with
considerable margins of uncertainty around any point estimate projection. On the supply side, the services
sector will be particularly impacted. On the demand side, any revival in domestic investment is likely to be
significantly delayed, given enhanced risk aversion by lenders (largely offsetting liquidity measures), renewed
concerns about financial sector resilience, and deteriorated corporate and household balance sheets.
Using data available until the end of May the economy is projected to contract by 3.2 percent in FY20/21
(Table B.1)61. In the current, rapidly evolving context these projections are likely to be revised as new
information is incorporated, especially as the daily number of cases continues to increase resulting in several
states and districts re-imposing lockdowns; and available high frequency indicators show that the economy
has not yet reverted to baseline. In our revised projections, which would be available in October 2020, we
would likely project a steeper contraction in the economy. In FY21/22, growth is expected to rebound but
very slowly, reflecting the impact of the crisis not only on India’s current growth but also on potential
output, which is expected to return to trend only over the next several quarters.
With the inflation outlook improving on the back of low oil prices and aggregate demand likely to remain
impaired in coming quarters, the RBI may remain accommodative. Several members of the Monetary Policy
Committee have indicated the importance of taking into account the deteriorating growth outlook and
financial stability considerations, in addition to inflationary dynamics, in the formulation of monetary policy.
60 Which accounts for about 15 percent of total imports and supplies key inputs in pharmaceuticals, auto, electronics and apparels sectors.
61 The latest consensus forecasts are pointing to a contraction of 4.6 percent in FY20/21. This is a downward revision from the average forecast in June 2020 of a contraction 3.4 percent (Consensus Economics, July 13, 2020).

I n d i a D e v e l o p m e n t U p d a t e - J u l y 2 0 2 0
64
Reflecting subpar economic activity, inflation is expected to fall to an average of about 3.0 percent in
FY20/21 before rising gradually in following years.
The current account is expected to be almost balanced at -0.1 percent in FY20/21. Indeed, the decline in
economic activity and the weak external environment are expected to continue to depress both imports
and exports, with the former having a much greater overall impact on the trade balance. The decline in the
CAD, in turn, would ensure that the level of foreign exchange reserves remains comfortable over the
medium term, and withstand modest capital outflows.
Significant fiscal implications are expected in the wake of the COVID-19 outbreak. The Union budget
FY20/21 envisaged that the fiscal deficit of the central government would narrow to 3.5 percent in
FY20/21 and further to 3.3 and 3.1 percent in FY21/22 and FY22/23, respectively. This was to be achieved
through increases in tax revenues (reflecting an anticipated recovery in overall growth62 and private
consumption), and mostly through significant increases in capital receipts, in line with the GoI’s ambitious
disinvestment program. In the wake of the COVID-19 outbreak, this expected scenario no longer appears
possible. The slowdown in growth is now projected to depress revenue collections significantly (relative to
the budget targets). Given unprecedented financial market volatility, planned disinvestment is expected to
proceed more slowly in the near-term. As a result, the fiscal deficit and debt of the central government are
likely to increase sharply over the next two years. In a baseline scenario, which takes into account revised
growth projections, lower-than-expected divestment proceeds, and the fiscal measures adopted to date, the
fiscal deficit of the central government is projected to increase to 6.6 percent of GDP in FY20/21 and
remain at a high 5.5 percent in the following year. Assuming that the combined deficit of the states is
contained within a 3.5–4.5 percent of GDP band (which is in line with recent conditional relaxations
granted by the central government to the limits of borrowing by states)63 the deficit of the general
government may rise to around 11 percent in FY20/21. The deficit and debt numbers may turn out to be
even higher in alternative scenarios.
India’s debt-to-GDP ratio is projected to increase significantly in the short term, reflecting the expected
contraction in GDP growth and a sharp increase in the primary deficit during FY20/21. While there is a
significant level of uncertainty around the projections, the general government debt-to-GDP ratio is
projected to peak at around 89 percent in FY22/23, before gradually declining thereafter. This
notwithstanding, India’s public debt is expected to remain sustainable because it is mostly denominated in
domestic currency, of long/medium-term maturity, and is predominantly held by residents. India’s external
debt (both public and private), at around 20 percent of GDP and predominantly of long duration, is also
assessed to be sustainable.
b. Risks to the outlook
The forecasts presented in this report utilize information available until the end of May. While significant
downside risks stemming from a worse-than-expected global economic downturn remain, the main
downside risk is a large scale and persisting domestic COVID-19 contagion scenario along with the re-
imposition of restrictions. As noted earlier, several states and districts have begun to reimpose lockdowns
as the number of daily cases continues to increase. The significant fiscal and other policy responses
announced by the GoI and state governments are expected to provide some relief – mostly to avoid an
even deeper contraction – but risks are nonetheless tilted to the downside if (i) lockdown measures continue
62 The expected nominal growth rate in the Union Budget was 10 percent for FY20/21.
63 India’s states are required to obtain clearance from the GoI for their borrowing plans, and in doing so – broadly speaking – they
are required to target fiscal deficits not exceeding 3 percent of state GDP. The 15th Finance Commission is expected to finalize its
report and recommendations for the next 5 years, including so called “revenue deficit” grants for those states facing particular and
unavoidable fiscal stress.

I n d i a D e v e l o p m e n t U p d a t e - J u l y 2 0 2 0
65
to be extended and mobility remains significantly constrained over the second quarter of the fiscal year
(July-September), (ii) additional strains on the financial sector materialize and/or (iii) the global outlook
deteriorates further. Given the very significant uncertainties pertaining to the possible epidemiological
developments (in India and in the rest of the world), it is difficult to rule out any of these scenarios and it
is difficult to assess the severity of their impacts. Therefore, risks to forecasts are tilted heavily to the
downside.
Table B.1: Key Economic Indicators
yoy growth in percent in constant (2011-12 prices), unless otherwise indicated
2017/18 2018/19 2019/20 estimate
2020/21 2021/22 2022/23
forecast forecast forecast
GDP, market prices 7.0 6.1 4.2 -3.2 3.1 4.6
Private consumption 7.0 7.2 5.3 -2.8 3.8 4.5
Gross fixed investment 7.2 9.8 -2.8 -8.9 1.4 4.7
Exports, goods and services
4.6 12.3 -3.6 -11.0 5.0 6.5
Imports, goods and services
17.4 8.6 -6.8 -13.5 4.0 5.0
GVA, basic prices 6.6 6.0 3.9 -3.1 3.1 4.6
Agriculture 5.9 2.4 4.0 2.5 2.7 3.5
Industry 6.3 4.9 0.9 -4.0 1.0 3.8
Services 6.9 7.7 5.5 -4.2 4.4 5.3
Consumer price index 3.6 3.4 4.8 3.0 3.0 3.5
Current account balance (percent of GDP)
-1.8 -2.1 -0.9 -0.1 -0.3 -0.3
Fiscal balance (percent of GDP)
-5.8 -5.9 -8.1 -11.1 -9.5 -8.0
General government debt (percent of GDP)
69.5 69.1 72.0 82.7 87.5 89.2
Source: National Statistical Office and World Bank staff calculations.

I n d i a D e v e l o p m e n t U p d a t e - J u l y 2 0 2 0
66
2. Recent Developments in Trade Policy in India
Global trade is showing continued weakness amid heightened economic policy uncertainty. Direct supply disruptions are likely
to affect domestic production and export activities in India and the growth shock in India’s majors trading partners will also
reduce their export demand. India’s goods trade growth has already been slowing steadily since 2013, and its growth decelerated
further at the end of 2019. Services exports, on the other hand, have maintained a healthy growth rate. The Government of
India has introduced several changes to its tariff structure. The changes were in both directions and included increases and
reductions, but the net effect was an increase in simple average tariff rates in 2018 and 2019. Simultaneously, other measures
have been taken to facilitate trade and liberalize investments. The overall trade policy responses to the COVID-19 crisis have
combined four sets of instruments: a) tariffs liberalization; b) export restrictions; c) trade facilitation measures (aiming at
supporting export activities and ensuring business continuity); and d) efforts toward regional cooperation.
a. Trade Policy Development Pre-COVID-1964
In recent years, the Government of India has introduced several changes to its tariff structure.
These included increases and reductions in tariffs, and the net impact was increases ranging, on average,
between 24 to 29 percent between 2017 and 2019. The most significant increases were adopted in the
context of the FY18/19 Budget, but additional changes occurred in the recently approved FY20/21 Budget.
The product coverage affected by the tariff increase is comprehensive, but the most significant increases
took place in specific manufacturing categories (Figure B.6 and Figure B.7). For example, customs duties
on both mobile phones and mobile phone parts were increased from 15 percent to 20 percent. The
FY18/19 budget also doubled the tariff on footwear to 20 percent. Import duties were also doubled to 5
percent for cut and polished diamonds, coloured gemstones, and lab-grown diamonds.
Tariffs on agricultural products were also increased. On February 6, 2018, import duties on sugar were
doubled to 100 percent, and the duty on imports of chana was hiked to 40 percent. In June and July of
2018, import tariffs were raised for several agricultural, chemical, textiles, and steel products (see Figure
B.7). For example, import tariffs on soya-bean oil were increased to 35 percent. There was also a further
rise in import tariffs on certain chickpeas (garbanzos) to 70 percent.
On February 2, 2018, a Social Welfare Surcharge of 10 percent was imposed on imported goods, in
place of the education cess. The “social welfare surcharge” is applied to the aggregate of duties, taxes,
and cesses assessed on imports.65 In the Budget 2020, a new “Health Cess” of 5 percent was introduced on
imports of specified medical devices.
64 Tariff data are from various sources. The World Integrated Trade Solution database is an excellent source of information. Unfortunately, the tariff data is only available up to 2018. Another source of information is the WTO. The data at the aggregate level is available up to 2018, but at a more disaggregate level, data is available until 2019. However, both sources do not provide similar information. There are discrepancies on simple average tariffs rate which may be due to the conversion of non-ad-valorem rates into ad-valorem equivalents. This note uses the WTO data available at the WTO Data Portal to capture information up to 2019.
65 WTO (2018): Overview of Developments in the International Trading Environment Annual Report by The Director-General, WT/TPR/OV/21, 27 November 2018.

I n d i a D e v e l o p m e n t U p d a t e - J u l y 2 0 2 0
67
Figure B.6: Tariff Rates FY17/18
Source: WTO Data Portal, https://timeseries.wto.org/
During 2019, additional increases in tariffs were introduced in specific sectors. The changes
introduced in 2018 and 2019 resulted in an increase of 29 percent on average on tariff rates compared to
2017 (see Figure B.7). Overall, the changes introduced in 2019 had, on average, a marginal impact on the
simple mean rate in 2019 compared with 2018.66
Figure B.7: Tariffs Rates FY17/18
Source: WTO Data Portal, https://timeseries.wto.org/
Meanwhile, the Government of India has continued its modernization and simplification of trade
procedures at the border. The time and cost to export and import were reduced by implementing
electronic sealing of containers, upgrading port infrastructure, and allowing electronic submission of
supporting documents with digital signatures.67 Additional trade facilitation measures were implemented in
66 WTO (2019): Overview of Developments in the International Trading Environment Annual Report by The Director-General, WT/TPR/OV/22, 29 November 2019.
67 https://www.doingbusiness.org/en/data/exploretopics/trading-across-borders/reforms
0
20
40
60
80
100
120
01 -
Liv
e an
imal
s
03 -
Fis
h an
d cr
usta
cean
s,…
05 -
Pro
duct
s of
ani
mal
ori
gin,
…
07 -
Edi
ble
vege
tabl
es a
nd…
09 -
Cof
fee,
tea
, m
ate
and
spic
es
11 -
Pro
duct
s of
the
mill
ing…
13 -
Lac
; gum
s, r
esin
s an
d ot
her…
15 -
Ani
mal
or
vege
tabl
e fa
ts…
17 -
Sug
ars
and
suga
r co
nfec
tion
ery
19 -
Pre
para
tion
s of
cer
eals
,…
21 -
Mis
cella
neou
s ed
ible
…
23 -
Res
idue
s an
d w
aste
fro
m the
…
25 -
Sal
t; s
ulph
ur; ea
rths
and
…
27 -
Min
eral
fue
ls, m
iner
al o
ils…
29 -
Org
anic c
hem
ical
s
31 -
Fer
tilis
ers
33 -
Ess
ential
oils
and
res
inoi
ds;…
35 -
Alb
umin
oida
l su
bsta
nces
;…
37 -
Pho
togr
aphi
c or
…
39 -
Pla
stics
and
articles
the
reof
41 -
Raw
hid
es a
nd s
kin
s (o
ther
…
43 -
Fur
skin
s an
d ar
tific
ial f
ur;…
45 -
Cor
k a
nd a
rtic
les
of c
ork
47 -
Pul
p of
woo
d or
of ot
her…
Per
cent
age
Harmonized System: 01-47
2017
2018
0
5
10
15
20
25
30
35
40
45
48 -
Pap
er a
nd…
50 -
Silk
52 -
Cot
ton
54 -
Man
mad
e…
56 -
Wad
ding
,…
58 -
Spe
cial
…
60 -
Kni
tted
or…
62 -
Art
icle
s of
…
64 -
Foo
twea
r,…
66 -
Um
brel
las,
…
68 -
Art
icle
s of
…
70 -
Gla
ss a
nd…
72 -
Iro
n an
d st
eel
74 -
Cop
per
and…
76 -
Alu
min
ium
…
79 -
Zin
c an
d…
81 -
Oth
er b
ase…
83 -
…
85 -
Ele
ctri
cal…
87 -
Veh
icle
s…
89 -
Shi
ps,…
91 -
Clo
cks
and…
93 -
Arm
s an
d…
95 -
Toy
s, g
ames
…
97 -
Wor
ks
of…
Per
cent
age
Harmonized System: 48-97
2017
2018
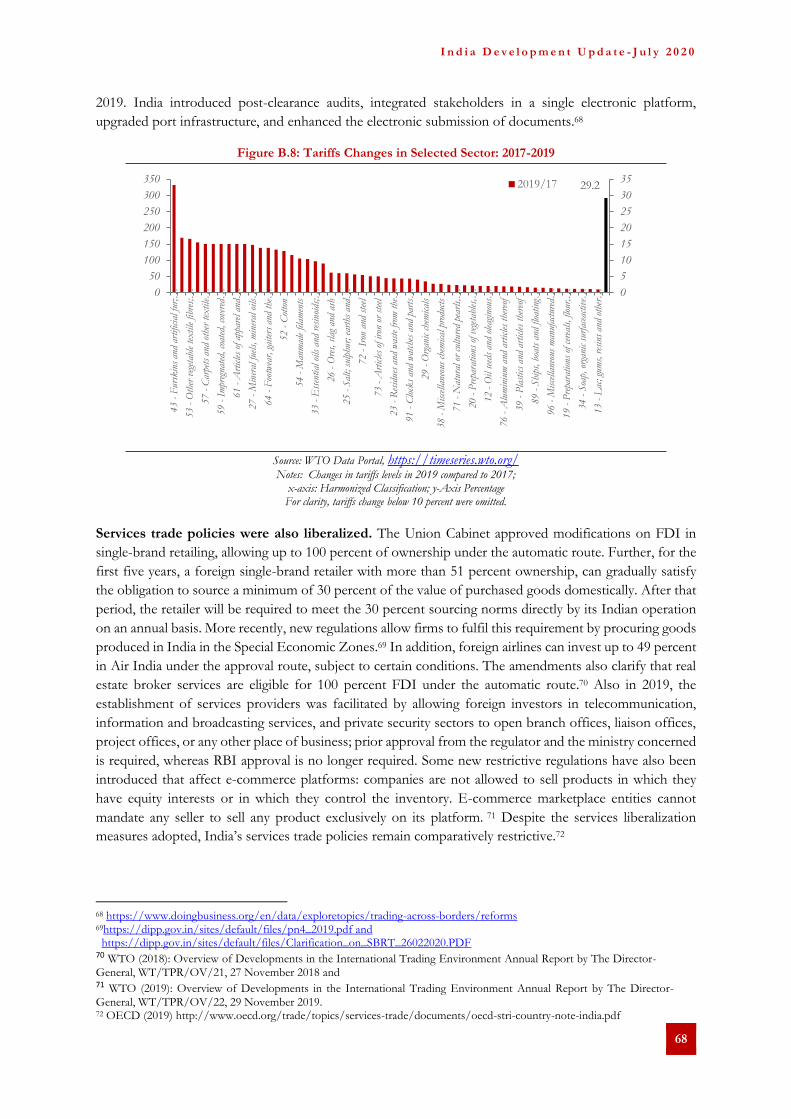
I n d i a D e v e l o p m e n t U p d a t e - J u l y 2 0 2 0
68
2019. India introduced post-clearance audits, integrated stakeholders in a single electronic platform,
upgraded port infrastructure, and enhanced the electronic submission of documents.68
Figure B.8: Tariffs Changes in Selected Sector: 2017-2019
Source: WTO Data Portal, https://timeseries.wto.org/ Notes: Changes in tariffs levels in 2019 compared to 2017;
x-axis: Harmonized Classification; y-Axis Percentage For clarity, tariffs change below 10 percent were omitted.
Services trade policies were also liberalized. The Union Cabinet approved modifications on FDI in
single-brand retailing, allowing up to 100 percent of ownership under the automatic route. Further, for the
first five years, a foreign single-brand retailer with more than 51 percent ownership, can gradually satisfy
the obligation to source a minimum of 30 percent of the value of purchased goods domestically. After that
period, the retailer will be required to meet the 30 percent sourcing norms directly by its Indian operation
on an annual basis. More recently, new regulations allow firms to fulfil this requirement by procuring goods
produced in India in the Special Economic Zones.69 In addition, foreign airlines can invest up to 49 percent
in Air India under the approval route, subject to certain conditions. The amendments also clarify that real
estate broker services are eligible for 100 percent FDI under the automatic route.70 Also in 2019, the
establishment of services providers was facilitated by allowing foreign investors in telecommunication,
information and broadcasting services, and private security sectors to open branch offices, liaison offices,
project offices, or any other place of business; prior approval from the regulator and the ministry concerned
is required, whereas RBI approval is no longer required. Some new restrictive regulations have also been
introduced that affect e-commerce platforms: companies are not allowed to sell products in which they
have equity interests or in which they control the inventory. E-commerce marketplace entities cannot
mandate any seller to sell any product exclusively on its platform. 71 Despite the services liberalization
measures adopted, India’s services trade policies remain comparatively restrictive.72
68 https://www.doingbusiness.org/en/data/exploretopics/trading-across-borders/reforms 69https://dipp.gov.in/sites/default/files/pn4_2019.pdf and https://dipp.gov.in/sites/default/files/Clarification_on_SBRT_26022020.PDF
70 WTO (2018): Overview of Developments in the International Trading Environment Annual Report by The Director-
General, WT/TPR/OV/21, 27 November 2018 and 71 WTO (2019): Overview of Developments in the International Trading Environment Annual Report by The Director-
General, WT/TPR/OV/22, 29 November 2019. 72 OECD (2019) http://www.oecd.org/trade/topics/services-trade/documents/oecd-stri-country-note-india.pdf
29.2
0
5
10
15
20
25
30
35
0
50
100
150
200
250
300
35043 -
Fur
skin
s an
d ar
tific
ial fu
r;…
53 -
Oth
er v
eget
able
tex
tile
fib
res;
…
57 -
Car
pets
and
oth
er tex
tile
…
59 -
Im
preg
nate
d, c
oate
d, c
over
ed…
61 -
Art
icle
s of
app
arel
and
…
27 -
Min
eral
fue
ls, m
iner
al o
ils…
64 -
Foo
twea
r, g
aite
rs a
nd t
he…
52 -
Cot
ton
54 -
Man
mad
e fil
amen
ts
33 -
Ess
ential
oils
and
res
inoi
ds;…
26 -
Ore
s, s
lag
and
ash
25 -
Sal
t; s
ulph
ur; ea
rths
and
…
72 -
Iro
n an
d st
eel
73 -
Art
icle
s of
iro
n or
ste
el
23 -
Res
idue
s an
d w
aste
fro
m the
…
91 -
Clo
cks
and
wat
ches
and
par
ts…
29 -
Org
anic c
hem
ical
s
38 -
Mis
cella
neou
s ch
emical
pro
duct
s
71 -
Nat
ural
or
cultur
ed p
earl
s,…
20 -
Pre
para
tion
s of
veg
etab
les,
…
12 -
Oil
seed
s an
d ol
eagi
nous
…
76 -
Alu
min
ium
and
art
icle
s th
ereo
f
39 -
Pla
stics
and
articles
the
reof
89 -
Shi
ps, bo
ats
and
float
ing…
96 -
Mis
cella
neou
s m
anuf
actu
red…
19 -
Pre
para
tion
s of
cer
eals
, flo
ur,…
34 -
Soa
p, o
rgan
ic s
urfa
ceac
tive
…
13 -
Lac
; gu
ms,
res
ins
and
othe
r…
2019/17

I n d i a D e v e l o p m e n t U p d a t e - J u l y 2 0 2 0
69
The 2020 Budget presented on February 1 included new increases in tariff rates. For example, tariffs
on household products and appliances were increased from 10 to 20 percent. Tariffs on some automobiles
and automobiles parts were raised from 10 to 15 percent, while some furniture items such as seats, mattress
supports, bedding and lamps, and lighting fittings had their duties increased from 20 to 25 percent. Finally,
tricycles, scooters, pedal cars, and similar wheeled toys saw an increase from 20 to 60 percent. In addition,
the Budget reviewed several trade rules; in particular, rules on anticircumvention for anti-dumping duties
and countervailing measures, as well as a revision of the safeguard provisions, which will strengthen the
application of trade remedies. A review of rules of origin in the context of trade agreements will also be
conducted. The objective of this review is to ensure that free trade agreements are aligned with the
government policy directions.73
b. The impact COVID-19 on trade
The impact on Global Trade
Global trade growth was already low, at only 0.9 percent during 201974, due to trade tensions. The
COVID-19 shock will further pull down trade growth by more than 13 percent in 2020.75 The current crisis
differs from the GFC in that it is characterized by simultaneous demand and supply-side shocks.76 Initially,
supply chains were severely disrupted due to the containment measures imposed in China and trade flows
related to these supply chains were negatively affected (impacting production across major economies).
Eventually, with the implementation of lockdowns across countries, the crisis spread to the rest of the
economy, mainly services activities such as retail, entertainment, domestic transport and logistics, and social
services. The impact of the crisis on employment and production will generate domestic demand and
import shocks.
The policy responses adopted in industrialized countries will, in turn, have a negative repercussion
in China and other East Asian Economies, feeding back into value chains, trade, and GDP
growth.77 Global GDP growth will experience a severe 5.2 percent decline in 2020.78 In addition, services
trade is expected to be severely affected by the crisis. On top of the disruption to international transport
services due to the fall in merchandise trade, travel restrictions had a significant impact on both passenger
transport and tourism services. International tourism is expected to decline by 45–70 percent.79
Impact on India’s trade
The direct supply disruptions affected, at least temporarily, domestic production and export
activities in India. About 7.2 percent of Indian manufacturing valued-added depends on direct and
indirect inputs from China. 80 For example, in the case of the pharmaceutical industry, where about 70
percent of inputs are sourced from China, in the initial stages of the pandemic, temporary concerns emerged
due to production/export disruption from China, which translated in a decline of 23 percent in Indian
exports in March. Normalization of supply from China started in late March and converted the April decline
73 Budget Speech, https://www.indiabudget.gov.in/budgetspeech.php 74 Compared to 3.8 percent in the previous year 75 World Bank. 2020. Global Economic Prospects, June 2020. Washington, DC: World Bank. WTO (2020a) estimates a trade
decline of 13-32 percent in 2020. 76 Baldwin (2020) https://voxeu.org/article/greater-trade-collapse-2020 77 Baldwin and Freeman (2020) https://voxeu.org/article/covid-concussion-and-supply-chain-contagion-waves 78 World Bank. 2020. Global Economic Prospects, June 2020. Washington, DC: World Bank. 79 OECD (2020). 80 Baldwin and Freeman (2020) https://voxeu.org/article/covid-concussion-and-supply-chain-contagion-waves

I n d i a D e v e l o p m e n t U p d a t e - J u l y 2 0 2 0
70
into a positive growth in exports of 0.25 percent.81 The global demand shock is expected to impact trade
and India’s majors trading partners are likely to reduce their export demand due to weak economic growth.
For example, the U.S. economy, which represents 16 percent of total merchandise exports, is expected to
decline by 6.1 percent, and China, which represents 5 percent of total exports, is expected to grow 1.0
percent. The Euro Area, with a share of 13 percent of total Indian exports, is projected to fall to 9.1
percent.82
Indian merchandise exports declined 60.3 percent in April 2020 (yoy), to USD 10.4 billion, while
imports fell 58.6 percent to USD 17.1 billion.83 The cumulative decline of total exports and imports was
23.8 and 22.2 percent, respectively, for January–April 2020. The fall in exports and imports was widespread,
except for exports of iron ore, which registered a growth of 17.5 percent, and drugs and pharmaceutical
exports, which registered an increase of 0.25 percent. In the case of services, the latest available data show
a growth of 1.2 percent in total exports in March 2020, much lower than the growth experienced in prior
months. Service Imports experienced a decline of 2.2 percent. The Government of India expects that export
of services in April 2020 will reach USD 17.6 billion, a fall of 2.6 percent, while import of services are
expected to fall 6.3 percent to USD 10.6 billion.84 In other words, services trade remained, at least in the
initial stages of the pandemic, resilient to the shocks, with exports and imports growing in April 2020-
January 2020, 6.3 and 6.1 percent, respectively, compared to same period of 2019.
Table B.2: Average Applied MFN Tariff (%) for Medical Products, 2019.
All
products Medicines
Medical Supplies
Medical equipment
Personal protective products
ALL WTO Members 4.8 2.1 6.2 3.5 11.5
Brazil 9.8 7.8 11 8.4 16.6
China 4.5 2.1 7.4 2.5 7.2
India (1) 11.6 10.0 15.0 9.0 12.0
Indonesia 5.2 3.8 5.5 4.5 10.5
Malaysia 11.7 0 32 0.3 6
Mexico 4.6 5.5 5.1 2.3 8.1
Pakistan 10 10.9 13.4 3.6 13.1
Russian Federation 3.2 2.3 4.8 1.8 4.7
Sri Lanka 11 0 25.6 0 11.2
Source: WTO, https://www.wto.org/english/tratop_e/covid19_e/covid19_e.htm
Note: (1) does not include other charges, such as the custom health CESS.
c. Global Trade Policy Responses
Trade policy responses to the crisis have not been uniform. Initially, the focus was limited to medical
products, and especially products for the prevention, testing/diagnostic, and treatment of the disease. Many
developing countries realized that these products were protected by high tariffs and proposed a temporary
reduction (Table B.2). Subsequently, some countries, fearing supply shortages and price increases, have
adopted restrictions on export of some agricultural products. Trade facilitation measures aiming at
expediting access to imported products and ensuring business continuity to support exports, have also been
81 https://www.theguardian.com/world/2020/mar/04/india-limits-medicine-exports-coronavirus-paracetamol-antibiotics and https://www.thehindubusinessline.com/economy/chinese-firms-resume-export-of-pharma-inputs-to-india/article31166358.ece
82 World Bank. 2020. Global Economic Prospects, June 2020. Washington, DC: World Bank, and World Bank Group calculations. 83 Source: India’s Foreign Trade, Press Release, May 15, 2020, Department of Commerce 84 India’s Foreign Trade, Press Release, May 15, 2020.

I n d i a D e v e l o p m e n t U p d a t e - J u l y 2 0 2 0
71
part of the policy response. Unfortunately, unlike what occurred during the GFC, there have been few
efforts among major economies to design a coordinated response to minimize the negative impacts of the
crisis, especially for poor countries.
d. India’s Trade Policy Responses
The Indian government’s trade policy responses combined four sets of instruments: a) tariffs
liberalization; b) export restrictions; c) trade facilitation measures; and d) efforts toward regional
cooperation.
a) Tariffs liberalization measures. The tariff rates for products and supplies necessary to address the COVID-
19 crisis are relatively high in India, more than double the average of WTO members (see Table B.2).
Temporary liberalization measures were adopted for specific items (see Annex). On March 3, the
government introduced a temporary elimination of import tariffs on certain organic chemicals and
pharmaceutical products; later, on April 1, it decreased import tariffs from 10 to 5 percent for medical and
surgical instruments and apparatus. In addition, these products were exempted from the “custom health
cess.”
b) Temporary export restrictions. Several export restrictions were put in place from the end of January 2020.
On January 31, 2020, the export of all varieties of personal protection equipment (PPE), including clothing
and masks, was prohibited. On February 8, 2020, this prohibition was amended to exclude surgical
masks/disposable masks and all gloves. However, the export of all other PPE, including N-95 and other
PPE accompanying masks and gloves not specified in the exceptions, remain prohibited. On May 16, new
amendments on exports prohibition of mask were introduced allowing exports on non-medical/non-
surgical masks of all types. On March 3, 2020, India adopted export restrictions for 26 active pharmaceutical
ingredients (APIs) and their derived products. The export restrictions included: paracetamol, antibiotics
such as tinidazole and erythromycin, the hormone progesterone, and vitamins B12, B1, and B6. These
provisions were subsequently amended on April 4, 2020, allowing exports of some these products, while
restrictions on the export policy for formulation made from paracetamol were changed from restricted to
free; however, paracetamol APIs remained restricted for export (April 17, 2020). These drugs accounted
for 10 percent of all India’s pharmaceutical exports.85 On March 19, 2020, the export of all ventilators,
surgical/disposable (2/3Ply) masks only, and textile raw material for masks and coveralls were prohibited.
Further, on March 25, Hydroxychloroquine and formulations were added to the list of banned
pharmaceutical exports. Finally, on April 4, the export of diagnostic kits was restricted.
c) Trade facilitation measures. To address the crisis, the GoI adopted a number of important decisions to
facilitate trade and ensure business continuity.86 The Central Board of Indirect Taxes and Customs (CBIC),
in coordination with other agencies, declared that customs operations are an essential service during the
lockdown period. A 24/7 custom clearance facility was implemented to avoid supply chain disruptions. The
CBIC website designed a COVID-19 helpdesk to facilitate quick resolution of problems faced by traders.
Customs offices have been assigned contingency funds to protect the health and safety of frontline
officers, and the use of I.T. solutions has been maximized to contribute to social distancing.
Waivers of fees, including condonation for delays in filing import declarations, have been introduced.
Shipping lines have been instructed to not levy detention charges on containers held up for reasons
attributable to lockdown measures. All major ports have been directed not to levy penalties, demurrage,
charges, fee, or rental on any port user for any delay in berthing, loading/unloading operations, or
evacuation/arrival of cargo caused by reasons attributable to lockdown measures. Airports have also been
85 https://www.theguardian.com/world/2020/mar/04/india-limits-medicine-exports-coronavirus-paracetamol-antibiotics 86 WCO, http://www.wcoomd.org/en/topics/facilitation/activities-and-programmes/natural-disaster/coronavirus.aspx

I n d i a D e v e l o p m e n t U p d a t e - J u l y 2 0 2 0
72
directed to waive similar charges. Importers are being advised to file advance import declaration for speedy
customs clearance, pay duties and collect cleared goods without delay, and avoid clogging the customs area.
Finally, requests and documents from importers/exporters are being accepted via email to avoid physical
visits and contact between the trade and customs officers. Further, additional formalities have been adjusted
to facilitate trade.
d) Regional cooperation. The government of India is leading a coordinated response at the regional level to
discuss the impact of travel restrictions and COVID-19 on intra-regional trade, with a particular focus on
maintaining essential trade within the SAARC region. The discussions among SAARC members included
an analysis of possible trade facilitation measures such as provisional clearance of imports at preferential
duty with suitable conditions, provisional acceptance of digitally signed certificates of origin, acceptance of
scanned copies of documents for clearance of imports by customs and release of payments by banks, and
addressing challenges at the borders.87
The policy responses to a more uncertain global economy should seek to reduce risks and provide
stability for investors. The current crisis can open new opportunities for India. One expected effect of
the crisis is that multinationals will be seeking greater diversification of their activities away from China.
Whether India can seize this opportunity will depend on its capacity to implement economic reforms, where
the use of tariffs is not a recommended policy for India to pursue. 88 On the contrary, trade policy must
be, in the words of K. Subramanian, an enabler.89
87 https://mea.gov.in/press-releases.htm?dtl/32622/Video_Conference_of_senior_trade_officials_of_SAARC_countries_on_dealing_with_the_impact_of_Covid19_on_intraregional_trade
88 https://theprint.in/economy/economic-costs-for-india-may-be-huge-if-covid-19-fallout-lasts-6-months-arvind-panagariya/386975/
89 https://www.businesstoday.in/union-budget-2020/decoding-the-budget/budget-2020-india-goes-protectionist-with-widespread-changes-in-customs-act/story/395280.html

I n d i a D e v e l o p m e n t U p d a t e - J u l y 2 0 2 0
73
3. The implications of the COVID-19 pandemic for India’s social protection system
Given the high rates of labour market informality and vulnerability in India, investments in a strong social protection system
are key to ensure that the country can recover rapidly from the devastating economic impacts of the COIVD-19 pandemic.
These investments are not only important for the current crisis, but for India’s future as well – which will face other shocks
triggered by disasters, structural changes in the labour market, or macroeconomic shifts. The Government’s PMGKY and
PMGRA are important steps in building such a system. We identify three areas for strategic reforms –(i) creating protocols
which empower states to provide cash-based assistance in the context of disasters and financing their social protection needs (ii)
scaling up portable cash and insurance support for the urban poor, and (iii) fostering deeper accountability and institutional
convergence for social protection. These reforms can help India pivot its social protection system to address the needs of a more
urban, mobile, and diverse population.
a. What kind of a social protection system does India need in 2020?90
Social protection programs help people become resilient against the risks they face as they seek to
lead productive lives and expand their capabilities91. This note outlines how India’s overall social
protection system can be strengthened in the context of the ongoing COVID-19 crisis. In triggering a social
protection response program through the Pradhan Mantri Garib Kalyan Yojana (PMGKY) and Pradhan
Mantri Garib-Kalyan Rojgar Yojana (PMGRY), India has relied on public works and in-kind and cash
transfers through its various pre-existing schemes and platforms. In doing so, the country is leveraging
different mechanisms of service delivery, including piggybacking on state government systems in the
context of federal India, large rural safety nets, food distribution outlets, community organizations and self-
help groups, and DBTs into bank accounts. The national government has also taken an important step to
make the PDS portable and near-universal during this time of crisis.
India’s existing social protection measures provide an important foundation to build a modern
social protection system. Future growth and resilience depend on how the social protection system
tackles disasters, decentralized governance, a flexible gig economy, and demographic changes. At this stage
of development, where nearly half of India is precariously close to the poverty line and given the devastating
impacts of COVID-19, India needs an overarching strategy to guide how various innovations, schemes,
staff, and budgets will coordinate to ensure adequate social protection coverage for the poor and vulnerable.
Meeting the diverse needs of states requires an overhaul in India’s social protection financing, disaster
management protocols, and delivery architecture. This is critical to ensure that the centre and states
consolidate delivery costs, avoid administrative duplication, and respond to India’s diverse and changing
risk profile. This note takes stock of the current landscape and suggests key reforms to modernize and
strengthen India’s social protection system at the national and state levels.
b. India’s social protection architecture: from poverty to vulnerability
Typically, a comprehensive social protection system requires three types of risk management
instruments to work together. First, a steady, safe, and well-paid job is the best insurance during
challenging times. Promotional instruments invest in the ability of families to survive shocks on their own
90 The piece was authored by Qaiser Khan, Shrayana Bhattacharya, and Ambrish Shahi, drawing on the World Bank’s Schemes to Systems Publication from 2019.
91 This section is based heavily on Bhattacharya, Shrayana, John Blomquist and Rinku Murgai “Poverty to
Vulnerability: Rebalancing Social Protection in India” published in Schemes to Systems World Bank, 2020. It also draws
from Program Document for Accelarating India’s COVID Response Social Protection, Report No: 147337-IN

I n d i a D e v e l o p m e n t U p d a t e - J u l y 2 0 2 0
74
–by enhancing productivity, access to job opportunities and incomes through human capital infrastructure,
wage legislation, labour policies, skills training, and livelihood interventions. Second, preventive instruments
aim to reduce the impacts of shocks before they occur by enabling households to use their savings from
good times to tackle losses in tough times. This is mainly done through social insurance programs. For
example, health insurance can reduce financial losses faced by families during health crises. Third, protective
instruments mitigate the impacts of shocks after they have occurred through tax-financed redistribution
from the non-poor to the poor. These programs would classically be called anti-poverty measures as they
target social assistance or safety net programs to the poor or destitute, whether in kind or cash. For example,
households can seek wages and work from the Mahatma Gandhi National Rural Employment Guarantee
scheme (MGNREGS) in times of crises. Countries differ in how much they spend on these three types of
instruments within their social protection system. Often, the mix of programs used by a country reflects
the nature of risks and shocks faced by its society.
When social protection schemes and welfare architecture were created in India after
independence, most of the country was reeling from a period of famine, de-industrialization, and
multiple deprivations. Half the population was chronically poor, the country had an aggregate food
deficit, financial and banking networks were under-developed, growth rates were weak, and technology
available for program administration was rudimentary. But that India no longer exists, and the country’s
social protection system needs to evolve and catch up with the needs of its new demography and risk
profile.
As the share of households below the poverty line has fallen (sharply) to 22 percent, the majority
of India is no longer poor. Instead, half of India is vulnerable – these are households that have recently
escaped poverty with consumption levels that are precariously close to the poverty line and remain
vulnerable to the risk of slipping back. Programs must ensure that those who have escaped poverty are able
to sustain improvements. This involves expanding the focus of programs from the chronically poor to
families that are vulnerable to falling into poverty.
c. As poverty becomes spatially clustered and urban vulnerabilities rise, India needs to rebalance its mix of protective and preventive instruments for social protection
The diversity across states (i.e., Bihar will need a different social protection approach than Delhi)
requires an enabling policy and financing regime, whereby state governments have greater
flexibility in shaping context-specific social protection responses, while the national government
focuses on monitoring and coordinating interventions and facilitating cross-state learning. Even
prior to COVID-19, India needed to forge a new relationship between the national government and states
for effective social protection financing and delivery. Despite a decline in poverty levels, India shelters
pockets of deep poverty and these households are geographically clustered. Programs to protect the poor
against further destitution remain critical in low-income states—Chhattisgarh, Madhya Pradesh (MP), Uttar
Pradesh (UP), Odisha, Jharkhand, Rajasthan and Bihar, which account for 45 percent of India’s population
but nearly 62 percent of its poor. These states continue to need strong safety nets programs to protect
them. Finally, inequality across locations and demographic groups has increased. The poverty rate of six of
the poorest states in the country is twice that of other states. Within states, poverty and vulnerability remain
highest amongst Adivasis92, and women are largely missing from the workforce and face serious risks to
their mobility and well-being.
92 Collective term used to describe tribes in India.
I n d i a D e v e l o p m e n t U p d a t e - J u l y 2 0 2 0
75
d. High-growth and urbanized states need portable insurance and urban safety nets
While India’s range of protective programs is impressive for a developing country, the current
social protection architecture, in spending and priorities, remains strongly focused on chronic
poverty alleviation. For example, in 2016, while traditional safety nets such as the Public Distribution
Scheme received nearly USD 7 billons in budget allocations, the life and accident insurance programs
combined spent less than USD 1 million. Programs such as the PDS and MGNREGS constitute 70 percent
of social protection spending in the country. In states which have seen growth and rapid urbanization,
social protection programs can no longer be singularly focused on chronically poor households.
It is critical that programs help those vulnerable to poverty to anticipate and manage risks and
shocks better, and not only attempt to provide aid to relieve the deprivations experienced by the
poor. There are three types of tools needed by India’s new vulnerable class to prevent them from falling
back into poverty and debt traps–health insurance, social insurance (in case of death, accident, and other
calamities), and pensions. At present, only 4 percent of households in India use government social insurance
programs. Use of private sources of insurance is higher, particularly for wealthy households. IHDS 2012
data shows that 27 percent of households report members using or benefitting from private insurance—
unsurprisingly, the bottom 20 percent report very low uptake of private options (5 percent) compared to
the top 20 percent (55 percent). The majority of Indian households—poor and non-poor—rely on personal
savings to deal with health, accidents, or climate shocks. Micro surveys and administrative data also highlight
major gaps in pension and health insurance coverage.
Past policies and recent budgets have taken steps in the right direction. The boost in crop insurance,
social pensions for the elderly, the rise in contributory pensions for those who have the wherewithal to
save, and larger coverage of health insurance programs will help India re-balance its social protection
architecture to match the needs of the rising numbers of its vulnerable people.
e. Decentralizing Social Protection Expenditures
The need to re-balance the mix of programs between protection and prevention does not warrant
a dramatic pan-national drop in expenditures on safety nets for the poor. Given the huge diversity in
the economic profile of India’s states, a variety of approaches is required. For instance, the needs of the
rising middle-class with access to private insurance markets in Delhi and Maharashtra will differ markedly
from the needs of poorer states such as Uttar Pradesh and Bihar. In states where many poor and vulnerable
households are still not able to save enough to insure themselves against crises or inflation, social assistance
will remain a core intervention. In low-income states, traditional anti-poverty programs such as PDS or
MGNREGS, if implemented well, can serve the twin goals of protection and prevention—by ensuring that
India’s vulnerable do not become poor and that the poor live with dignity during times of drought or food
price inflation. Effective safety nets can dramatically reduce the number of poor and the likelihood that
poverty will be transmitted from one generation to the next. Strengthening their delivery systems is key,
while allowing state governments to choose the optimal mix of preventive and protective programs to suit
their state’s needs within an umbrella social protection budget.
The present system of providing social assistance relies on numerous schemes operating at the
state and national level with limited coordination. As per the DBT Mission database, India manages
more than 400 benefit transfer programs at the central level and about 2500 programs at the state level.
This results in cumbersome application processes for citizens, administrative duplication, and expenditure
inefficiencies. India can streamline its myriad CSS and Central Sector (CS) social protection schemes into
an umbrella social protection budget. For example, India can aim for an “X +block” strategy. This could
involve a certain number (say X number) of pan-national portable core CSS or “pillars”, combined with a

I n d i a D e v e l o p m e n t U p d a t e - J u l y 2 0 2 0
76
block grant from which states could finance other safety nets or social security programs best tailored to
their own contexts. The grant size can be linked to performance, disaster-risk profiles, agro-climatic needs,
or poverty and vulnerability rates in each state. Programs such as MGNREGS, NSAP, PDS, PMJJBY
(Pradhan Mantri Jeevan Jyoti Bima Yojana), Pradhan Mantri Swachch Bharat Mission (PMSBM) and
Ayushman Bharat - Pradhan Mantri Jan Arogya Yojana (AB-PMJAY93) could serve as the “pillars” of this
system. The final number and scope of national pillars could be selected based on consultations with states
and ministries through an inter-state dialogue process.
This social protection architecture need not be a massive fiscal burden, if the design is self-financing
by helping to control additional demands on safety nets that might otherwise arise if families are unable to
cope with old age or health crises, which can push households into poverty and debt traps. Thus, an
increased emphasis on interventions that help anticipate risks should be expected, particularly in medium-
and high-growth states such as Delhi or Maharashtra.
f. Impact of COVID-19
By January 2020, India was no longer a largely chronically poor country—but despite its progress
in reducing poverty it became a more unequal country with pockets of deep poverty and lingering
vulnerabilities. The majority of India had seen booming tele-digital and transport connectivity, sharp
declines in income poverty, and new neglected sources of risks related to climate, urbanization and
migration. Even prior to the COVD-19 outbreak, a broader social protection strategy for a more urban,
middle-income, mobile, diverse, and decentralized India was urgently required.
COVID-19 has simply amplified the pre-existing vulnerabilities faced by Indian households
Existing challenges and reforms were brought to the fore by the COVID-19 lockdown. The poverty
and equity impact of COVID-19 are anticipated to amplify the old vulnerabilities of Indian households.
Between FY11/12 and 2015, poverty declined from 21.6 percent to an estimated 13.4 percent at the
international poverty line (2011 PPP US$1.90 per person per day), continuing the earlier trend of rapid
poverty reduction. However, preliminary analysis following the national COVID-19 lockdown suggests
that these gains are eroding. A recent telephonic survey across ten states in India found that poor
households expected to lose around 60 percent of their average monthly income in April following the
national lockdown. The latest Center for Monitoring the Indian Economy (CMIE) survey data for April
2020 finds 45 percent of households report a fall in household income in the post-lockdown period.
India is at risk of losing its hard-won gains against poverty, and pre-existing inequalities will widen
Prior to COVID-19, despite absolute poverty reduction in the past two decades, half of India’s
population was vulnerable, with consumption levels precariously close to the poverty line. A
contraction in high-frequency consumption indicators, such as quarterly sales of two-wheeler vehicles,
FMCG, and retail personal credit disbursements, also suggests increased vulnerabilities for poorer
households. These households are likely to slip back into poverty due to income and job losses triggered
93 AB-PMJAY covers secondary and tertiary hospital care for the bottom 40 percent of India’s population at about 20,000
empanelled public and private hospitals nationwide, up to an annual household limit of INR 5 lakhs. Launched in September 2018,
earlier this year it crossed the 1 crore mark of total claims reimbursed. It provides a solid foundation for ensuring financial risk
protection against high out-of-pocket medical expenses.

I n d i a D e v e l o p m e n t U p d a t e - J u l y 2 0 2 0
77
by COVID-19. National Sample Survey Office data suggest that a 30-day period without work, as created
by the lockdown, can reduce household consumption expenditures for the poorest quintile by 10 percent.
Impacts of the global COVID-19 pandemic will also compound pre-existing concerns that the pace of
poverty reduction had been disrupted by implementation challenges of indirect tax reforms, stress in the
rural economy, and high youth urban unemployment rates. Social inequalities in poverty, well-being, and
access to jobs, particularly for women and tribal communities, are expected to amplify differences in how
the evolving economic crisis impacts different social groups.
Labour market informality compromises the ability of households to protect themselves
90 percent of the Indian workforce is informal, without access to significant savings or workplace-based
social protection benefits such as paid sick leave or social insurance. The latest Indian Periodic Labour
Force Survey (2018-19) finds that only 47.2 percent of urban male workers and about 55 percent of urban
female workers were regular wage/salaried employees in the usual status. These proportions are much lower
in case of rural workers. Even among workers in formal employment in the non-agricultural sector, about
70 percent did not have written job-contracts and about 52 percent were not eligible for any form of social
security benefits. These workers are at risk of (temporarily, depending on the pace of recovery) falling into
poverty due to wage and livelihood losses triggered by shrinking economic activity, government-imposed
closures, and social-distancing protocols.
Migrants face the deepest risks due to a static social protection system
In India, inter-state migrants are at acute risk of increased poverty and destitution. Seasonal
migrants dominate low-paying, hazardous, and informal market jobs, such as construction, in key
sectors in urban areas. Estimates from the Economic Survey highlight that the magnitude of inter-state
labour migration in India was close to 9 million annually between 2011 and 2016. Media reports and civil
society groups are highlighting how migrants relying on ad-hoc construction or service jobs in these states
have been displaced due to the lockdown. Following the loss of employment due to COVID-19 lockdowns,
such migrant workers are at increased risk of falling into poverty. The lack of portability in social protection
benefits across state boundaries exacerbates the risks faced by migrants. With unemployment increasing,
and decline in earnings and remittances, inter-state migrant workers will need targeted support.
Social Protection is a critical bridge to carry the vulnerable through the COVID-19 crisis
Following the first phase of the COVID-19 pandemic in India and the globe, social protection has
emerged as a critical bridge which can help carry vulnerable households through the current and
future crises. As economic impacts of the COVID-19 pandemic sharpen, timely and adequate social
protection measures can help cushion shocks and prevent further destitution. Following the COVID-19
pandemic, nearly 126 countries have scaled-up coverage and benefits for social protection programs.
Evidence shows that timely delivery of social assistance support can forestall losses and protect the poor.
In particular, direct cash transfers to households can serve as an important stimulus for economic stability
following COVID-19 outbreak, especially if these are targeted to informal and lower-income households
who will face disproportionate troubles. Cash transfers can supplement household coping strategies as
income support, help out-of-work workers who fall sick, or help them access essential goods.
I n d i a D e v e l o p m e n t U p d a t e - J u l y 2 0 2 0
78
g. Moving Forward: A Social Protection System for India’s Future
The COVID-19 crisis has highlighted the same issues that the World Bank’s long term analytic
work has indicated are areas in need of major reform: (i) Moving from a scheme-based fragmented
social protection architecture towards an integrated approach, blending multiple instruments to provide a
fast and flexible social protection response, and reducing administrative duplication and inefficiencies (ii)
Building an adaptive social protection system which can quickly provide support to excluded groups and
respond to disasters and the diversity of social protection requirements across states and communities, not
only for COVID-19 but also for any future crisis, (iii) Creating a portable social protection platform in India
to ensure food, social insurance, and cash support for migrants across state boundaries. The GoI is now
attentive to the need for effecting these systemic changes. The World Bank is currently supporting a
government program which not only provides emergency support to households to weather the COVID-
19 crisis, but also simultaneously paves a path for India’s fragmented social protection schemes to become
an integrated and adapative system, which leverages decentralization and community-driven approaches for
last-mile delivery, enables portable benefits for migrants, and incentivizes context-specific solutions.
h. The COVID-19 challenge has highlighted both the strengths and weaknesses of India’s myriad social protection systems.
The strengths of India’s social protection systems lie in the ability to mobilize and deliver food
rations at a globally unparalleled scale through the PDS at a time when transport was disrupted.
The availability of DBT systems to directly transfer support to households. The self-targeted MGNREG
program serves as a core pillar to provide employment to the destitute in rural areas. The principal
weaknesses are in identifying beneficiaries for programs and creating robust systems for last-mile benefit
delivery. Further, eligibility for benefits is linked to places of normal residence and thus even eligible migrant
workers who were stranded at their places of work were not immediately able to access social protection
benefits. Therefore, the national initiatives to provide migrants food and cash-support through the PDS
and SDRF are watershed moments in India’s social protection narrative.
Moving forward, social protection in India is poised for a fundamental transformation
Moving forward, social protection in India is poised for a fundamental transformation from a set
of fragmented schemes to an integrated system. Successive state and central governments in India have
invested in important building blocks. Budgets have been enhanced, more people are being covered, and a
series of new programs have been launched with a focus on rights-based entitlements and technological
innovations. The Socio-Economic Census (SEC) in 2011—which collected new census data on asset and
socio-demographic information—can make the beneficiary identification process more transparent.
Moreover, government-to-person payments have received strong impetus through campaigns to open bank
accounts and to transition to digital payments through the DBT initiative. NITI Aayog and the Fourteenth
Finance Commission have also enabled a framework for consolidation of schemes and for states to gain
greater fiscal autonomy. New portable insurance schemes for health, life, crop failure, and accidents have
been announced and given priority. The recent Gram Swaraj initiative aims at converging scheme delivery
within select aspirational districts. Following the COVID-19 outbreak, the PMGKY and PMGRY allow
for a pan-national and portable social protection system to be built. Three areas of investment will prove
to be foundational.
From Jan-Dhan to Jan-Suraksha: Creating an Urban Social Protection Mission
Migrants and the urban poor are at risk of exclusion from receiving adequate social protection
through PMGKY and India’s overall social protection architecture. This is because none of the six
I n d i a D e v e l o p m e n t U p d a t e - J u l y 2 0 2 0
79
national social assistance programs being leveraged to provide additional support are portable, as they only
provide benefits to state residents. Moreover, the PMGKY package has lower coverage in urban areas.
Programs such as PM-KISAN and MGNREGS only operate in rural India. Programs such as Pradhan
Mantri Ujjwala Yojana (PMUY), NSAP, and PDS report a larger beneficiary base in rural India. Given that
shocks in urban areas are transmitted to rural areas through a drop-in demand and remittances, PMGKY
coverage in rural India remains critical. However, the rural–urban gap is a major service constraint the
number of COVID-19 in urban districts is disproportionately high.
Informal sector workers, especially in urban areas, do not benefit from many programs even
though India’s workforce has grown more informal and urban. Furthermore, many eligible workers
do not have the incentive or information to register for important contributory insurance programs offered
by the government.
While India has an elaborate set of program databases which enable immediate release of cash-
transfers in rural areas due to extensive reach of rural safety nets, parallel platforms in urban areas
are missing. Urban platforms which link beneficiary information with bank details are critical to ensure
rapid delivery of income support in the case of any future crisis. The building blocks for such a platform
already exist through the (i) Department of Financial Services’ ambitious financial inclusion Pradhan Mantri
Jan Dhan Yojana (PMJDY) program (ii) the near-universal PDS database which contains poverty status,
and (iii) community-based organizations which can be enlisted for citizen interface through the Deendayal
Antyodaya Yojana–National Urban Livelihoods Mission (DAY-NULM).
The immediate response to COVID-19 will require direct provision of cash/in-kind transfers and
public works through government financing. However, long-run resilience will necessitate a
reorientation towards more co-contributory approaches. At this time, the government can consider
codifying an Urban Jansuraksha Mission (Social Protection Mission) with detailed implementation
frameworks to link PDS or relevant government databases with beneficiary bank account details through
community-based outreach with urban livelihoods programs, with emphasis on urban poor and female-
headed households94. Recently, the national government has announced an important initiative to provide
rental and housing support to urban residents. This program can also benefit from such a database for
identifying the urban poor and vulnerable. Such an urban social protection initiative could also pursue the
design of incentive mechanisms to bolster demand for core social insurance schemes for life (PMJJBY),
accidents (Pradhan Mantri Suraksha Bima Yojana, PMSBY), and old-age (Atal Pension Yojana, APY) for
all PDS ration card holders. The objective would be to scale-up social insurance coverage and
simultaneously create a delivery platform for urban areas, with focus on slums and low-income settlements,
which can quickly release income-support to vulnerable groups in urban areas at times of crisis.
To succeed, these initiatives need to be paired with improvements in last mile delivery such as building state
and local capability and also incentivizing partners such as banks to open accounts for the poor for DBT
transfers, and to market other financial products such as life insurance which are also part of the same
package to deepen financial sector access for the poor.
i. One Nation One Ration
The idea of creating a portable and pan-national PDS honours the spirit of the National Food
Security Act of India. It will be vital in India’s recovery from the ongoing crisis. The policy decision
to create a “One Nation One Ration” system to expedite migrant access to food and adequate social
protection relief is ambitious and pioneering. However, these will need to be accompanied by clear rules
on how states will compensate each other, if needed, for providing rations to migrants across boundaries.
94 Last Mile Delivery Options for COVID-19 Note World Bank SPJ 2020 and DDU-NULM Mission Document

I n d i a D e v e l o p m e n t U p d a t e - J u l y 2 0 2 0
80
For example, if Delhi provides rations for migrants from Bihar, will Delhi receive an allocation for this
from the centre, or will these be made across states? Such a regulatory structure is important to codify with
clear business rules.
To implement such a national portable system, the databases in each state will need to “talk” to
each other to ensure that ration-benefits provided anywhere can be monitored against state
allocations. Migrant labourers who tend to leave families at home should be able to receive part of the
benefits at a place of their own choosing while the rest of the benefits are provided where their families
live. For the PDS to be portable, migrants should be able to access food supplies through Fair Price Shops
across state boundaries. Such reform in the food subsidy system will not only be beneficial to tackle food
security concerns from the COVID-19 crisis, but any future shocks as well. Portability within the PDS
would require affiliated reforms in procurement of grains and management of food stocks. These shall be
enabled by current modes of digitized grain procurement and deliveries, which can allow the national
government to track and estimate costs per state. These frameworks are being tested in four states since
2019.
Box B.1: Technology and Accountability Tools have Transformed Targeting and Delivery of Social Protection in India since the early 2000s Social protection in India has benefitted from several technology innovations and accountability reforms over the past decade. Successive state and central governments in India have invested in the important building blocks of a social protection system. The biggest challenge impeding the transparency of programs has been the reliance on paper-based
registers for payments and targeting, which enabled abuse and discretion in who received benefits from
the government. In response, state and national governments have aggressively focused on ensuring inclusion and
reduction in leakages through rights-based entitlements, community-based accountability, and technological
innovations.
Three reform areas have been key: (i) Making food, public works, and time-bound service delivery rights-based
entitlements, which has helped balance power asymmetries between clients and service providers as citizens can
complain regarding any abuse or service denial in courts. Further, making core programs near-universal has placed
greater citizen pressure on service providers to improve delivery. This has particularly been the case for India’s PDS
which has witnessed expansion in coverage and simultaneous decline in leakage in low-income states. (ii) SEC in
2011—which collected new census data on asset and socio-demographic information—has made the beneficiary
identification process more transparent. Prior to the SEC, India’s social protection programs largely used
regressively targeted paper-based “Below Poverty Line” cards to identify beneficiaries. The use of these BPL cards
has largely been phased out by state and central programs in favour of digitized targeting tools. Nearly six states
have developed their own social registries for dynamic targeting of programs. (iii) Moreover, government-to-person
payments have received strong impetus through campaigns to open bank accounts and the large-scale transition to
digital payments through the Direct Benefit Transfer (DBT) initiative. In 2010, the GoI launched the Unique
Identification Number (Aadhaar) and Public Financial Management System (PFMS). The introduction of these
platforms enabled India to leapfrog from paper-based identification and payments in schemes to end-to-end
digitization.
These reforms have accelerated transparent and direct delivery of cash into bank accounts: In FY 2019-20,
India transferred over USD 50 billion through digital payments into Aadhaar authenticated beneficiaries’
accounts. The GoI has issued over 1.2 billion Aadhaar numbers and institutionalized digital payments by
onboarding over 400 central for digital payments. GoI has mandated the use of SEC 2011 data for improved
targeting of beneficiaries in respective programs. This is further complemented by the fact that GoI has provided
flexibility to the state governments to include and exclude beneficiaries. India’s COVID-19 Social Protection
Program (PMGKY) includes programs like the PDS and PMUY which are leveraging the SEC data. GoI, in-line
with the Supreme Court judgement on Aadhaar, requires welfare schemes to link Aadhaar numbers from the
respective beneficiaries to ensure uniqueness, thereby reducing ghost and duplicate records.
Programs like NSAP, MGNREGS, PMUY, and PDS leverage digitized databases to identify beneficiaries
and use Aadhaar numbers and digital payments to seamlessly transfer benefits, attempting to minimize
leakages through tech-enabled transparent processes. 70 percent of all food ration delivery is digitized as 85%

I n d i a D e v e l o p m e n t U p d a t e - J u l y 2 0 2 0
81
of Fair Price Shops currently use Aaadhar-enabled point-of-sale devices for authenticated and automated delivery.
Food supply distribution is also digitized and tracked through geo-coding in many states to check against abuse.
j. Even with the best designed measures, implementation and state capability will remain key
Translating the potential of these reforms into impact will require complementary investment
programs focused on implementation support to states. As the Box highlights, India has made
significant strides in using technology and accountability tools to improve payments and targeting. All
programs that are leveraged for PMGKY use digital modes of targeting and delivery. However, there is
great heterogeneity in implementation capacities across states in India, and the proposed policy reforms
will need to be supported through state-level assistance to implement these ambitious proposals.
Development partners and national government agencies will need to ensure states are supported in
designing delivery systems for social assistance, identifying excluded groups and reinforcing linkages
between community-based organizations and social protection programs.

I n d i a D e v e l o p m e n t U p d a t e - J u l y 2 0 2 0
82
4. The short-term distributional impacts of the COVID-19 pandemic
The COVID-19 crisis threatens to reverse the remarkable gains India has experienced in poverty reduction. The economic
and distributional impacts of the crisis are likely to differ depending on the sectors in which households work and the nature
of work arrangements. In the absence of high-frequency data on living standards, we conduct micro-simulation analysis to
assess the short-term distributional impacts of the COVID-19 crisis. The results of such a simulation exercise can provide
useful benchmarks to design specific support policies.
The COVID-19 crisis may lead to a major setback in poverty reduction. In the very short term,
lockdowns and quarantines have left many households who live from hand to mouth without any sources
of income. Many of them have had no other choice than to return to their villages, and to very basic
livelihoods. This setback will represent a major break with the remarkable progress in the reduction of
absolute poverty made by India in recent years. Between 2011 and 2015, poverty declined from 21.6 percent
to an estimated 13.4 percent at the international poverty line (US$1.90 per person per day in 2011
Purchasing Power Parity [PPP]). The COVID-19 crisis may reverse these incredible gains in poverty
reduction. By one estimate, the number of South Asians living on less than US$1.90 could increase by 42
million as a consequence of the COVID-19 crisis (Mahler et al. 2020).
Rigorously assessing the poverty impact of the crisis is challenging in India’s case due to data
constraints. In a country as populous and diverse as India, the effects will differ depending on the sectors
in which households work, the formal or informal nature of their work arrangements, and the existing and
newly implemented social protection policies. The COVID-19 crisis is expected to have distributional
impacts, in addition to poverty impacts. Getting a clear and granular grasp on these changes is important
to design appropriate policy responses, given the fiscal and institutional constraints under which
government operates. In the absence of reliable high-frequency data on living standards, an assessment
based on a microsimulation exercise is proposed here.
The analysis presented here focuses on two of the three main channels through which the
COVID-19 crisis can affect Indian households (Figure B.9). The first is the direct health impact:
many individuals will get sick and a fraction of them will die. This will undoubtedly entail a huge cost for
the affected households, and such cost should be included in a thorough assessment of the costs of the
epidemic. However, this impact may not be the largest at the aggregate level. The COVID-19 crisis will
result in lower rates of economic growth, hence in fewer employment and earnings opportunities. Given
that most household income in India is from work, rather than transfers, these short- and medium-term
impacts will necessarily lead to a deterioration in living standards (Chatterjee et al. 2016). Therefore, the
main focus of the discussion below is on the economic impacts, and the immediate policy response of the
government to mitigate the impacts on the poor.

I n d i a D e v e l o p m e n t U p d a t e - J u l y 2 0 2 0
83
Figure B.9: The main channels for short-term impacts of COVID-19 on household earnings
Micro-simulations are regularly used by the World Bank to estimate poverty rates in the years for
which household expenditure surveys are not available. This is done by applying the estimated growth
rate of GDP per capita to the expenditure per capita of households. The growth rate of GDP per capita
is obtained from macroeconomic forecasts and the distribution of expenditures per capita comes from
the latest available household expenditure survey. Despite their apparent simplicity, micro-simulations
yield a rich picture of the short-term distributional impacts of the COVID-19 crisis. Methodologically,
micro-simulations involve shifting household expenditure per capita differently depending on household
characteristics. Key among them are the main sector of activity and the formal or informal nature of
employment, which affect labour earnings.
To assess the expected impact of the COVID-19 crisis, we rely on the change in the growth rate
of GDP per capita before the crisis and the expected growth rate after. The COVID-19 impact is
defined here as the difference between the GDP growth rate for FY2019/20 obtained from the National
Statistical Office and the most recent World Bank forecast for FY2020/21, from May 2020. Different
assumptions can be made on how the predicted change in growth will affect households with different
characteristics. They range from perfect neutrality to variations that take into account the sector of activity
that households are engaged in and their degree of formality. The analysis here implicitly deals with the
impact of the crisis on household earnings. The results are based on changes in income at the aggregate
level and by sector. But these changes are applied to household consumption based on the sector from
which the household derives most of its earnings. There are certain limitations too. The main one is that,
while this exercise accounts for existing social protection schemes, it does not account for the
announcements made in the wake of the pandemic. It also does not fully account for the large mobility of
workers from urban to rural areas. However, the exercise we present here is illustrative, and can be
extended suitably to account for these nuances.
More specifically, three scenarios are considered in what follows:
• Scenario 1 – Aggregate. The change in household expenditures per capita is the same, in percentage
terms, for all households. That change is based on the expected decline in the GDP growth rate
between FY2019/20 and FY2020/21.
• Scenario 2 – Sectoral. The change in household expenditures per capita varies by sector of activity.
The logic is the same as before, except that the expected impact of the crisis on sectoral GDP is
different in agriculture, manufacturing, and services. That change is based on the expected decline in
the sectoral GDP growth rate between FY2019/20 and FY2020/21.

I n d i a D e v e l o p m e n t U p d a t e - J u l y 2 0 2 0
84
• Scenario 3 – Institutional. The sectoral impact is the same as in the Scenario 2, but formal households
with regular wage earnings are assumed to experience no loss relative to the baseline. The full impact
of the crisis in a sector is borne entirely by the informal households engaged in that sector.
Data on household consumption per capita, main sector of activity, and formality comes from the 2011/12
National Sample Survey (NSS) on Consumption Expenditure. Consumption expenditure per capita is
adjusted to reflect the current 2019 Rupees. The adjustment combines a change in quantities and a change
in prices. The cumulative inflation rate between 2011 and 2019, as measured by the CPI, is used for the
change in prices. The change in quantities is based on the growth of real GDP per capita during the same
period, corrected by a passthrough factor of 0.70 for all households.
The passthrough factor is the fraction of the growth in GDP per capita from the National Accounts that
is passed through to growth in the consumption expenditure per capita in the NSS. This passthrough
factor of 0.7 comes from the most recent estimates of the relationship between the growth rates of
household expenditure per capita and GDP per capita in India (Newhouse and Vyas 2019). Sensitivity
analysis is performed using an earlier estimate of 0.57 passthrough factor (Ravallion 2003). While the
magnitude of the impact on consumption expenditures is marginally smaller, the distributional impacts
are very similar. Simple, short-run estimates are thus arrived at assuming no change in household behaviour,
no direct health impacts, and no mitigation measures. Households may draw upon their savings to cope
with a shock to their incomes. But it is equally possible that households may resort to precautionary saving
during an economic crisis. The analysis here assumes no change in the savings behavior and, therefore, no
change in the marginal propensity to consume.
The definition of formality used for this simulation exercise does not perfectly overlap with more
institutional variants of the concept, which emphasize being affiliated with social security or having a
written contract. The formal group, as considered here, comprises households whose major source of
income is from a regular or salaried job, regardless of whether that job meets the institutional criteria. This
definition excludes the self-employed, who would qualify as formal from an institutional point of view
such as registered businesses, as they are likely to be affected by the COVID-19 crisis.
The growth rates used for household expenditure per capita in each of the three scenarios are presented
in Table B.3. The first column in this table shows the growth rate of GDP for FY2019/20. The second
column shows the forecasted growth rate of GDP for FY2020/21. The third column, the difference
between the previous two, is the estimated macroeconomic impact of the COVID-19 crisis. In the fourth
column, this macroeconomic impact is adjusted for the passthrough factor to estimate impact at the
household level. The fifth column reports the share of household consumption expenditures that are
affected by this impact. In scenarios 1 and 2, it is assumed that all households in the group are equally
affected, while in scenario 3, the burden of the crisis falls entirely on informal households in each sector.
The last column is the ratio of the fourth divided by the fifth. The smaller the informal household’s initial
share of total household expenditures in a given sector, the larger the impact of the crisis on it.

I n d i a D e v e l o p m e n t U p d a t e - J u l y 2 0 2 0
85
Table B.3: Impact on household expenditure per capita for different household types
Expected change in average household earnings (%)
Expected change by type of household (%)
(1) (2) (3) (4) (5) (6) (7)
2019/20 2020/21f Expect drop
(3)=(2)-(1)
Passthrough adjustment (4)=(3)x0.7
Household consumption
affected (share in
total)
Formal households
Informal households (7)=(4)/(5)
Scenario 1 Aggregate 4.2 -3.2 7.4 5.2 100 5.2 5.2
Scenario 2
Agriculture 4.0 2.5 1.5 1.1 100 1.1 1.1
Manufacturing 0.9 -4.0 4.9 3.4 100 3.4 3.4
Services 5.5 -4.2 9.7 6.8 100 6.8 6.8
Scenario 3
Agriculture 4.0 2.5 1.5 1.1 98 0 1.1
Manufacturing 0.9 -4.0 4.9 3.4 65 0 5.3
Services 5.5 -4.2 9.7 6.8 50 0 13.6
Source: Based on consumption expenditure data from the 2011/12 NSS household survey adjusted to the 2019 Rupee, GDP growth estimates from the National Statistical Office, and projections from World Bank staff calculations in May 2020.
At the aggregate level, under the scenario considered, the COVID-19 crisis is expected to result
in a 5.2-percent decline in monthly per-capita expenditures (mpce) on average. The simulations
show that the impact of the crisis on household expenditure per capita will be similar, in relative terms,
across the distribution. As Figure B.10 shows, this is the case with construction in Scenario 1. The deciles
are drawn using expenditures per capita at the all-India level. Scenario 2 suggests a progressive impact of
the crisis, in the sense that richer households are likely to experience a bigger loss in relative terms (Figure
B.11). The expected decline in mpce is 2.3 percent for households in the bottom decile compared to 5.3
percent for those in the top decile. This result is not surprising, as the impact of the crisis on agriculture—
where a large share of the poor work—is muted. But Scenario 2 does not take into account that richer
households tend to be more formal, hence better protected from an economic shock.
Figure B. 10: Impact of the COVID-19 crisis by expenditure decile in Scenario 1 – Aggregate
Figure B.11: Impact of the Covid-19 crisis by expenditure decile in Scenario 2 – Sectoral
Most formal workers work in manufacturing and services, and so the overall impact of the crisis
on the real GDP growth of these two sectors hides very heterogenous impacts within the sectors.
While overall the impact appears distributionally neutral in Scenario 3, this is the result of ignoring the
-8
-7
-6
-5
-4
-3
-2
-1
0
-600
-500
-400
-300
-200
-100
0
1 2 3 4 5 6 7 8 9 10
Decline in Monthly Consumption Per Capita by Decile
Absolute Decline in MPCE (Rupees)
Percent Decline in MPCE (%)
-8.0
-7.0
-6.0
-5.0
-4.0
-3.0
-2.0
-1.0
0.0
-600
-500
-400
-300
-200
-100
0
1 2 3 4 5 6 7 8 9 10
Decline in Monthly Consumption Per Capita by Decile
Absolute Decline in MPCE (Rupees)
Percent Decline in MPCE (%)

I n d i a D e v e l o p m e n t U p d a t e - J u l y 2 0 2 0
86
place of residence. With most formal workers living in urban areas, the impact turns out to be regressive
in urban areas. In other words, the expected decline in mpce for the urban poor—who are typically
informal—is more than the expected decline for the urban rich in relative terms.
In response to the crisis, the Government of India announced a relief package to provide
immediate support to the poor and vulnerable (Box B.2). The package is a combination of direct
employment support and in-kind and cash transfers, and relies on existing institutions and safety nets
programs for delivery. The extent to which the relief package can help mitigate the adverse impacts of the
economic shock will also depend on the effectiveness of its implementation. The direct employment
support programs in the relief package target only those living in rural areas, including returning rural
migrants.
Figure B.12: Impact of the COVID-19 crisis by expenditure decile in Scenario 3 – Institutional All
Figure B.13: Impact of the COVID-19 crisis by expenditure decile in Scenario 3 – Institutional
Urban
Box B.2: Unpacking the immediate policy response for the poor
On 24th March 2020, the Government of India (GoI) announced a nation-wide lockdown limiting the movement
of its 1.3 billion people as a preventive measure aimed at limiting the spread of the COVID-19 virus. Several
countries across the globe have implemented similar measures, resulting in disruptions in trade and supply chains.
As a result, the livelihood of millions of Indians was impacted. 95 The GoI announced its first relief package on
26th March 2020 – the Pradhan Mantri Garib Kalyan Yojana (PMGKY) – to provide immediate support to the
poor and vulnerable. With a notional cost of INR 1.7 trillion (USD 22.7 billion), the announced package included
both in-kind and direct cash transfers. Subsequently, the government extended the duration of some of the
schemes included in the PMGKY and has launched a new scheme called the Prime Minister’s Garib Kalyan
Rojgar Abhiyaan (PMGKRA) to boost livelihood opportunities for returning migrants, resulting in an increase in
the overall budget allocated to the relief package to INR 3.3 trillion (USD 44 billion). A brief description of the
key schemes included in the relief package, intended benefits, coverage, and notional allocation is presented below.
• Pradhan Mantri Garib Kalyan Anna Yojana (PMGKAY): 5kg of free wheat or rice to every individual and 1 kg
of pulses to every household, covering 800 million people in April–June 2020. In an announcement made
95 Using the international poverty line - $1.90 per person per day in 2011 Purchasing Power Parity (PPP) terms – nearly 176 million Indians were poor in 2015.
-8.0
-7.0
-6.0
-5.0
-4.0
-3.0
-2.0
-1.0
0.0
-700
-600
-500
-400
-300
-200
-100
0
1 2 3 4 5 6 7 8 9 10
Decline in Monthly Consumption Per Capita by DecileAll Households
Absolute Decline in MPCE (Rupees)
Percent Decline in MPCE (%)
-7.0
-6.0
-5.0
-4.0
-3.0
-2.0
-1.0
0.0
-500
-450
-400
-350
-300
-250
-200
-150
-100
-50
0
1 2 3 4 5 6 7 8 9 10
Decline in Monthly Consumption Per Capita by DecileUrban Households
Absolute Decline in MPCE (Rupees)
Percent Decline in MPCE (%)

I n d i a D e v e l o p m e n t U p d a t e - J u l y 2 0 2 0
87
on 30th June 2020, this scheme was
extended till November 2020. The total
budget allocation for this scheme is INR
1.4 trillion (USD 18.8 billion).
• Pradhan Mantri Garib Kalyan Rojgar Abhiyaan
(PMGKRA): 125 days of employment to
returning migrants in 116 select districts of
six states (Bihar, Uttar Pradesh, Madhya
Pradesh, Rajasthan, and Odisha). The total
budget allocated for this scheme is INR
500 billion (USD 6.7 billion).
• Mahatma Gandhi National Rural Employment
Act (MGNREGA): Increase in
MGNREGA wages from INR 182 per day
to Rupees 202 a day to provide additional
benefit of INR 2000 to 136 million
families. To finance this additional benefit,
the government has allocated INR 400
billion (USD 5.4 billion).96
• Pradhan Mantri Jan-Dhan Yojana (PMJDY):
Three installments of INR 500 each to 204 million women account holders for three months in April–June
2020. Budget allocation of this component is INR 310 billion (USD 4.1 billion).
• Pradhan Mantri Kisan Samman Nidhi (PM-KSN): The release of the first installment of INR 2000 to 87 million
farmers in April 2020. Total budget allocation for this component is INR 170 billion (USD 2.3 billion).
• Pradhan Mantri Ujjwala Yojana (PMUY): Three installments of cash transfers amounting to roughly INR 660
each to 80 million existing beneficiaries of the scheme to buy LPG cylinders for three months in April–June
2020. The second installment of the cash transfer will be made conditional on the use of the first installment
to buy an LPG cylinder in April. The total budget allocation for this scheme is INR 160 billion (USD 2.1
billion).
• Support to senior citizens, widows, and the disabled: Three installments of INR 1000 each for 30 million senior
citizens, widows, and disabled persons for three months in April–June 2020. The total budget allocation for
this is INR 90 billion (USD 1.2 billion).
• Other Elements: Insurance cover of INR 50 lakhs (USD 67 thousand) per health worker fighting COVID-19,
relief to 35 million construction workers, support to low wage earners in the organized sector, and an increase
in the limit of collateral free lending for Self-Help Groups from INR 10 lakhs to 20 lakhs (USD 27,000) to
support roughly 69 million families. The total budget allocation for these components is INR 270 billion
(USD 3.6 billion).
Figure B.14: Unpacking the relief package
(% share of total budget allocation)
Source: World Bank staff calculations based on public
announcements
96 Announcement made 17th May 2020.
42
15
12
9
5
53
8
PM Garib Kalyan AnnYojana (PMGKAY)
PM Garib Kalyan RojgarAbhiyaan (PMGKRA)
MGNREGA
Pradhan MantruJandhan Yojana (PMJY)
PM-KISAN
Pradhan Mantri UjjwalaYojana (PMUY)
Support to seniorcitizens, widows anddisabledOther

I n d i a D e v e l o p m e n t U p d a t e - J u l y 2 0 2 0
88
5. India’s financial sector: the impact of COVID-19 and the long-term policy agenda
Multiple reforms in recent years have improved India’s financial sector oversight and financial inclusion, but more needs to be
done to cope with the current headwinds and improve the depth and efficiency of financial intermediation. The impact of the
COVID-19 pandemic risks exacerbating long-standing structural issues such as slowing credit growth, liquidity shortages in
the NBFC sector, and a high level of NPLs. The authorities’ anti-crisis response in recent months focused on injecting
liquidity into the financial system through policy rate cuts and special liquidity and credit support windows to MSMEs and
NBFCs, among others. Borrowers were also provided temporary relief through a loan moratorium and suspension of insolvency
procedures, while lenders benefit from regulatory forbearance. While these extraordinary steps help mitigate the immediate
crisis impact, preparations should be made to cope with increased NPLs and potential solvency issues for banks and NBFCs
after the measures expire.
a. Impact of COVID-19 and immediate policy response
The Indian financial sector had been in a tumultuous period since late 2018. Even before the onset
of the COVID-19 pandemic, the default of several large NBFCs (such as IL&FS, DHFL, and Altico
Capital), the failure of a large cooperative bank (PMC), the resolution of India’s fourth largest private bank
(Yes Bank), and persistent overhang of legacy NPLs across commercial banks—all in the context of an
economic slowdown—had been contributing to slowing credit growth and decreasing market confidence.
Credit growth has slowed down in recent years.
Since 2017, it decelerated sharply from historical
averages, mainly due to a slowdown in activity of
the PSBs97, many of which faced capital shortages
and some of which were placed by the RBI under
the Prompt Corrective Action (PCA) program,
with their lending restricted. Credit growth in the
NBFC segment also declined after 2018 due to
liquidity issues, leading to a credit crunch for
MSMEs and other sectors dependent on NBFC
financing. Despite an infusion of liquidity by the
RBI, non-food credit growth for banks in FY
2019–20 was only 6.7 percent (compared to 12.3
percent in FY 2018-19), which was a five-decade
low. The MFI sector was an exception in 2019-20,
with credit growth of 31 percent (down from 38
percent in 2018-19), but also experienced a
decrease recently due to liquidity constraints and rising NPLs.
Bank NPLs remain high despite recent resolution efforts, and NBFC NPLs increased. NPL
resolution made significant progress in the banking sector due to the implementation of the new Insolvency
and Bankruptcy Code (IBC) and other measures. The gross NPL ratio of scheduled commercial banks
declined from 11.6 percent in March 2018 to 8.5 percent in March 2020. Meanwhile, NBFC NPLs have
increased from 4.5 percent in 2015-16 to 6.4 percent in March 2020. The NBFC liquidity crisis in the past
eighteen months has given rise to a “triple balance sheet” problem, with banks, NBFCs, and the corporate
97 Non-food credit growth for banks slowed from a CAGR of 13 percent between 2010-2017 to a CAGR of 8.9 percent between 2017-2020.
Figure B.15: Share of credit, March 2020
Source: RBI
Notes: Data for NBFCS are for September 2019. SFBs – small finance banks
NBFCs
Private banks
PSBs
SBFs

I n d i a D e v e l o p m e n t U p d a t e - J u l y 2 0 2 0
89
sector (especially real estate firms) trapped in a vicious cycle of deteriorating asset quality and liquidity
shortages.
The large PSB sector requires significant fiscal outlays and has been outperformed by private
banks. The recent clean-up of PSBs has come at a significant cost to the state budget, with US$38.68 billion
spent on recapitalization in the past four years. The cost of funds for private banks has been consistently
higher than for PSBs in recent years (e.g., 5.4 percent vis-à-vis 5.0 percent in 2018-19). At the same time,
PSBs reported negative RoAs and RoEs from March 2017 to March 2020, as compared to consistently
positive RoAs and RoEs for private banks during that period. Private banks also display much lower NPL
levels than PSBs98. These differences in performance suggest that a large public sector footprint in the
banking sector may adversely impact efficient allocation of capital.
The NBFC sector provided an alternate channel of credit for the real sector, especially MSMEs, in
recent years but faced funding challenges. The default of several large NBFCs in 2018 led to capital
market funding drying up, even for NBFCs which were not in distress. Since NBFCs relied heavily on
short-term funding to finance long term assets, the sudden withdrawal of liquidity was especially
problematic. Although banks have stepped in to provide funding to NBFCs (in large part responding to
incentives from the government and the RBI), it came at a cost to NBFCs, of more onerous funding terms
for securitized loans, such as banks’ requirements for higher collateralization levels and high quality of
securitized assets.
While India’s equity market has been growing rapidly, the corporate bond market is
underdeveloped and contributes to the lack of diversity in funding sources. The debt market remains
highly skewed toward government securities, while the corporate bond market is dominated by top-rated
financial and public-sector issuers. Corporate bond issuance amounts to roughly 3.9 percent of GDP, much
less than in other emerging markets, and has remained flat over the past three years. The institutional
investor base is relatively small, which is partially explained by conservative investment policies adopted by
regulators.
b. Impact of COVID-19 and immediate policy response
Since the onset of the COVID-19 crisis in India in March 2020, the authorities have taken a wide
range of actions to mitigate the impact on financial institutions and borrowers. To offset the
precipitous decline in credit growth due to a confidence shock, the RBI announced (almost immediately) a
series of measures, including a large policy rate cut, a reduction in the CRR, increased overnight borrowing
limits for banks, and increased borrowing limits for the federal and state governments. RBI has also
introduced sector-specific liquidity windows, including TLTROs covering NBFCs, a special liquidity facility
for mutual funds (SLF MF), and a refinance window for the all-India DFIs.99 Finally, the RBI has
announced a six-month loan moratorium and a standstill on loan reclassification till end of August 2020,
which will defer the impact of fresh NPLs on capital adequacy and provisioning requirements.
The government announced additional measures to support MSMEs and NBFC liquidity, as part
of the economic recovery program announced in May 2020. These measures mostly comprised
liquidity facilities from the RBI and lenders, with partial or full guarantee by the government. The
98 Between March 2017 and March 2020, PSBs reported RoA of -0.1 to -1.0 percent, and RoE of -1.2 to -14 percent. Private banks reported a RoA of 1.0 to 1.5 percent and a RoE of 9.1 to 14 percent during the same period. PSBs reported NPAs of 11.3 percent as compared to 4.2 percent for private banks in March 2020.
99 RBI reduced the policy rate by 115 bps in April–May 2020, reduced the Cash reserve ratio (CRR) by 100 bps, increased the borrowing limits for states by 60 percent and from Rs.1.2 trillion to Rs.2 trillion for the central government. The RBI also implemented the TLTRO of INR 1 trillion followed by the TLTRO 2.0 of INR 250 billion for NBFCs, a refinance facility of INR 500 billion for DFIs (NABARD, SIDBI and NHB) and a refinance facility of INR 500 billion for mutual funds.

I n d i a D e v e l o p m e n t U p d a t e - J u l y 2 0 2 0
90
government has initiated the implementation of these facilities. Banks and NBFCs have started sanctioning
credit to beneficiaries under these facilities, with a few initial roadblocks (low initial disbursement to
MSMEs and concerns over end use of additional credit). The liquidity measures announced so far have low
immediate fiscal outlays but substantial calls on the guarantees included in these measures could result in
additional fiscal costs over the medium term. The government also suspended fresh insolvency proceedings
for debtor defaults occurring on or after March 25, 2020, for a period of six months (can be extended up
to one year).
The measures by the government and the RBI have mitigated immediate liquidity concerns, but
their impact on credit growth remains to be seen. Credit growth remains low at 6.2 percent for the
fortnight ended June 19, 2020 compared to 12.3 percent during the same period last year. Commercial
banks have lately kept very high liquid balances with the RBI, in the region of Rupees 6-7 trillion (around
US$80-93 billion) which are substantially in excess of the required minimum reserves. This is for two key
reasons. Firstly, financial institutions and other creditors have turned highly risk-averse towards funding
economic activities given the uncertainty about the current environment. Secondly, the financial sector still
has not fully embraced innovations in financial technologies that could accelerate credit and payment
delivery to MSMEs.
c. Emerging risks post lockdown
The banking sector is facing increased, long-term asset quality and profitability pressures given
the negative economic outlook. A significant spike in NPLs should be expected once regulatory
forbearance is phased out in late 2020. Loans to MSMEs, NBFCs, and retail lending, accounting for more
than 40 per cent of banks’ overall portfolio, are particularly at risk. In the meantime, the recent suspension
of insolvency proceedings would limit the lenders’ ability to deal with new defaults. Banks’ profits are also
under pressure due to reduced disbursement of credit, increased delinquencies post lockdown, depressed
net interest margins, and a decrease in fee-based income. The strain on all lenders could ultimately be
profound, through second-order effects of insolvencies and NPLs in the enterprise sector.
NBFC and MFI balance sheets are stressed on both the liabilities and asset sides. The NBFC sector
is facing exacerbated liquidity risks as the volatility in financing from both banks and capital markets has
increased since the onset of the COVID-19 pandemic. Debt moratoriums provided by NBFCs to their
borrowers may not be uniformly counter-balanced by moratoriums on their own borrowings (banks can
provide moratorium to NBFCs on a case by case basis) or direct access to RBI liquidity windows. An
attempt to improve NBFC liquidity through TLRTO 2.0, a targeted repo operation to channel liquidity to
NBFCs through banks, was only partially successful as banks availed only 25 percent of the total amount100.
While the various liquidity facilities have partially eased funding for NBFCs in the past two months, the
spread remains high. On the asset side, the capacity of borrowers (mostly real estate, MSME, retail) to repay
after the moratorium is uncertain. Likewise, the expected increase in loan delinquencies and slippages in
repayment rate for the MFI sector due to a collapse in clients’ revenues could threaten the viability of many
institutions.
Small private banks and NBFCs could be more severely impacted than larger banks. The lack of a
strong depositor base, exacerbated by the migration of deposits to larger banks post the Yes Bank crisis,
could weaken the liquidity position and stability of small private banks. Customer confidence in small
private banks has declined and may deteriorate further due to COVID-19, as customers might prefer PSBs
with implied sovereign guarantees or larger, more stable private banks. The preference for larger banks is
evident from the fact that while deposit growth increased sharply between January and May 2020,
100 The first tranche of TLTRO 2.0 of INR 250 billion was utilized to the extent of 51 percent. The RBI has yet to implement the second tranche of TLTRO 2.0.

I n d i a D e v e l o p m e n t U p d a t e - J u l y 2 0 2 0
91
depositors are now focusing on quality and safety to differentiate between banks. Banks with AAA ratings
have witnessed an increase in the deposit accretion rate, whereas new-age private banks, regional banks,
and small finance banks (SFBs) have mostly seen a slow down.
Banks’ and NBFCs’ capital adequacy could come under stress as asset quality deteriorates and
profitability declines. The CRAR for banks was 14.8 percent as of the end of March 2020, as compared
to the regulatory minimum of 10.9 percent. For NBFCs, CRAR stood at 19.6 percent as of the same date,
down from 22.1 percent in March 2018 but was still above the regulatory minimum of 15 percent. It should
be kept in mind, however, that aggregate capital buffers may mask weaknesses in some financial institutions.
While insolvency of an individual bank, NBFC, or MFI is not likely to lead to a systemic crisis, it could still
have a lasting impact on market confidence for the entire sector, as seen in the case of large NBFC failures
in recent years.
The volatility of investment flows remains a risk for both stock and bond markets. Along with other
emerging market economies, India experienced large capital outflows in March 2020 (US$15.9 billion, the
largest among emerging markets in Asia). Mutual funds (MFs), especially debt mutual funds, have been
facing redemption pressures which led to a decrease in MFs’ assets under management (AUM) and
contributed to the closure of Franklin Templeton’s six credit funds in April 2020. Mutual funds’ AUM
decreased by 21.1 percent between January and March 2020.While the capital inflows resumed in recent
weeks, the risk of volatility remains high given the uncertain global and domestic economic outlook.
d. Reform agenda going forward
India lags many of its peers on financial development indicators such as financial sector depth and
efficiency. While India’s savings-to-Gross Domestic Product (GDP) ratio (30 percent) is in line with that
of peers (e.g., Malaysia and Brazil), its credit-to-GDP ratio at 51 percent is much lower101. India has a very
particular financial sector structure with numerous but overly fragmented institutions which depend heavily
on domestic deposits for funding. The public sector footprint in the financial sector is notably higher than
in other emerging markets, which results in high fiscal costs, contingent liabilities, and inefficiencies in credit
allocation. To support the country’s ambitious long-term growth goals, the large financing gaps in
infrastructure (US$1.2 trillion through 2040) as well as in SME and housing finance will need to be closed,
requiring stronger capabilities of the financial system.
The recent liquidity and performance issues in the sector, exacerbated by the COVID-19 crisis,
present policymakers with a strong reason—and an opportunity—to accelerate efforts towards
building a more efficient, stable, and market-oriented financial system. Progress in the following
broad reform areas is needed to boost the market confidence and financing of productive firms in the short
term (“keep the lights on”), and to deepen and diversify financial intermediation in the longer term.
1) Maintaining financial sector stability is a critical challenge in the light of increased risks. The
RBI’s continued focus on risk-based regulation and supervision will be important as the temporary
forbearance measures are phased out. Further strengthening of financial sector safety nets (inter alia the
resolution regime, deposit insurance, coordination between safety net players, and dealing with systemically
important institutions) could be considered. Liquidity and capital buffers should be closely monitored and
replenished if necessary. The regulatory and institutional framework for debt restructuring and insolvency
needs to be ready to deal with the expected spike in NPLs.
2) Reforms in the NBFC sector are needed to support its role in channelling credit to the real
sector. The government has recognized the important role of NBFCs in serving the needs of niche
101 Malaysia’s and Brazil’s are 136 per cent, and 70 per cent, respectively.

I n d i a D e v e l o p m e n t U p d a t e - J u l y 2 0 2 0
92
geographies and sectors and has recently launched several liquidity schemes for NBFCs as part of the
COVID-19 economic recovery program. These temporary measures could be institutionalized through
sustainable market instruments like a risk sharing facility, Residential Mortgage Backed Securities (RMBS),
and a platform (housing) and credit enhancement company (infrastructure) to diversify the funding base
and serve the liquidity needs of NBFCs, including smaller ones102. It would also be important to continue
strengthening the risk-based regulation and oversight of NBFCs, with the focus on systemically important
institutions. Further consolidation in the very fragmented sector should be encouraged through changes in
NBFC regulations by the RBI. The funding model for small and medium NBFCs, which cannot access
capital markets and depend on refinancing and sale of asset portfolios, leads to cherry picking of NBFC
assets by banks, and is not a sustainable model.
3) Deeper capital markets are critical for increasing the availability of long-term finance, especially
given the asset-liability mismatches in the banking sector. Once market conditions normalize, several
measures could be implemented to ease demand-side constraints. Changes in investment policies for
institutional investors (inter alia pension funds and insurance companies) could be considered as part of
the solution for crowding in long-term finance. The role of DFIs (such as SIDBI) could be reimagined to
crowd in market-based funding, and the supply of new infrastructure-finance instruments needs to increase
to attract more institutional investors (especially in sectors such as energy generation and renewable energy).
Another important measure could be the introduction of a risk-based capital framework for the insurance
sector; issuing Environmental, Social, and Governance (ESG) guidelines for issuers and investors. Other
recommendations for capital markets and issuers include: establishing a high-level committee on the
development of the corporate bond market; regulatory simplifications for corporate issuers; introducing
covered bonds for issuing banks/NBFCs; strengthened supervision of credit rating agencies; harmonized
tax treatment of bond Exchange Traded Funds(ETFs), debt mutual funds, equity, and equity mutual funds;
and actions to improve the yield curve and to include India in global bond indexes.
4) The role of fintech in accelerating financial inclusion in India has been impressive, but the
nexus between fintech and MSMEs has yet to be fully exploited. Fintech lenders have lower
origination costs and turnaround time than traditional lenders and could help borrowers, especially MSMEs,
restart business activities post lockdown. However, fintech lenders will need to improve their presence at
ground level to effectively increase collections from smaller borrowers. Co-origination with banks could be
a useful mechanism for fintech NBFCs to scale up lending, given the liquidity constraints they face. Further
operationalization and improved coordination of various regulatory sandboxes would increase efficiency
and innovation among fintech firms.
5) Last but not least, it is encouraging that the government seems to be moving to a more selective
and strategic public-sector footprint in the financial sector, as witnessed by the consolidation of
PSBs and strengthening their corporate governance and oversight. Gradually scaling back the
statutory requirement for state banks to provide liquidity, as well as the priority-sector lending policy, would
be helpful to reduce market distortion. In the longer run, when the market conditions improve, a mix of
private capital injections into state banks and, in some cases, full privatization could be considered. PSBs
would also benefit from a strengthening of their corporate governance frameworks, reduced reliance on
government for recapitalization, a more active role of the government as a shareholder, and a more strategic
role in the financial sector. As shown by international experience, this could boost the banking sector’s
ability to support credit, facilitate effective financial intermediation, and reduce moral hazard and fiscal
exposure.
102 The risk-sharing facility will allow NBFCs to diversify funding sources and involve funding, guarantees, etc. for NBFCs to lend to sectors such as MSMEs. The RMBS platform will help HFCs, especially smaller HFCs, to improve liquidity through securitization. The credit enhancement company (CEC) will support de-risking of debt issuances for infrastructure.

I n d i a D e v e l o p m e n t U p d a t e - J u l y 2 0 2 0
93
6. Electricity consumption and night-time lights: two promising proxies for economic activity in India103
The COVID-19 pandemic has disrupted economic activity in India. Traditional measures of economic activity are unable to
measure the disruption in real time and instead other proxies are needed. High-frequency indicators like industrial production
or the services PMI have gained prominence and new measures, for example related to mobility, are frequently reported. Two
new measures are employed to gauge the economic impact of the COVID-19 pandemic and the containment measures. First,
daily electricity consumption, which is available in near-real time and strongly related to overall economic activity, is studied to
assess the economic activity at high frequency. Second, data on monthly night-time light intensity, which is also related to overall
economic activity, is used to analyse economic activity at a high spatial granularity. Electricity consumption was nearly 30
percent below normal levels at the end of March, remained a quarter below normal levels in April, 14 percent below normal
in May, and was still 8 percent below normal in June. In April, night-time light intensity declined in more than two thirds of
the districts and the average decline was 12 percent. Local infection rates have an impact on night-time light intensity, with
more cases resulting in larger declines. This has strong implications for the rebound of the economy. Without effectively reducing
the risk of a COVID-19 infection, voluntary reductions of mobility make it unlikely that the economy will return to full
potential even when restrictions are relaxed. In the current context, daily electricity data and information on night-time light
intensity are helpful to monitor the economic situation, but they may also be able to complement national account estimates
more generally.
In India, as in so many other countries, the COVID-19 pandemic has disrupted economic activity.
However, quantifying this disruption is challenging. To monitor economic activity in times like these, needs
measures are needed that are available at high frequency, high spatial granularity (i.e. down to the district
level), and with only a short publication lag (i.e. nearly in real time). Many indicators that are traditionally
used to assess the economic situation are not well suited to quantify the current disruption. For example,
national account estimates of economic activity are only available quarterly only at the national level and
that too with a substantial lag. State-level estimates are only annual. With states having some discretion in
implementing non-pharmaceutical interventions to contain the spread of COVID-19 and the separation of
districts in different zones, national accounts data are now even less helpful to examine the economic
disruption caused by COVID-19.
Traditional and new high-frequency indicators have hence gained prominence. These include many
high-frequency indicators related to financial markets, such as interest rates (and interest rate spreads), and
growth in bank credit. In addition, high-frequency data related to both exports and imports are also
available. There are also some that measures economic activity more directly, for example the Index of
Industrial Production and the different Purchasing Managers Indices. In addition, some new indicators are
widely used to assess the current economic situation. GST revenue, for example, is available monthly and
allows for insights in formal sector activity.104 Since the economy is impacted by lockdown measures
intended to reduce mobility, data on the latter is used to see how much bite the restrictions still have.
In this short note, two additional proxies of economic activity are discussed that are available at a
high frequency, with short publication lags, and at a high spatial granularity: electricity
consumption and night-time light intensity. Both have been shown to closely track economic activity
around the globe and have hence been used to improve national account estimates of economic activity
(e.g. Henderson et al. 2012, Lyu et al. 2018, Chen et al. 2019). Electricity is an input to activities throughout
the economy, from industrial production to commerce and household activity, and changes in its
103 The authors, Robert Beyer, Sebastian Franco-Bedoya and Virgilio Galdo are from the World Bank’s South Asia Region Chief
Economist’s office. 104 In the first quarter of FY21, GST revenue was 40 percent below the level in FY20.

I n d i a D e v e l o p m e n t U p d a t e - J u l y 2 0 2 0
94
consumption thus reveal information about these activities. In the United States, high-frequency data on
electricity consumption revealed the economic collapse during the GFC much earlier than national account
estimates (Cicala 2020a) and such data has already been employed to assess the economic disruption due
to COVID-19 in Europe (Cicala 2020b). Similarly, night-time light intensity contains information about
economic activity at high spatial granularity. Night-time light data has been extensively used in a wide array
of economic studies ranging from monitoring economic activity (Henderson et al. 2012, Keola et al. 2015,
Henderson et al. 2018) to assessing regional economic convergence and identifying urban spaces and
markets (Gibson et al. 2017, Baragwanath et al. 2019, Ch et al. 2020) to predicting welfare (Jean et al. 2016),
and to assessing the quality of national account statistics (Pinkovskiy et al. 2016, Morris and Zhang 2019).
Night-time light data has proven to be a very helpful source of information in India as well. For example,
night-time light data has been used to evaluate the economic impact of India’s demonetization in November
2016 (Beyer et al. 2018, Chodorow-Reich et al. 2020), to approximate state-level economic activity (Prakash,
Shukla, Bhowmick, and Beyer 2019), to assess regional convergence in India (Chanda and Kabiraj 2020),
and to analyse urban growth (Gibson, Datt, Murgai, Ravallion 2017, Galdo et al. 2020). Both electricity
consumption and night-time light track overall economic activity, including activity in the informal sector.
Figure B.16: GDP, electricity consumption, and night-time light intensity
Note: The night-time light data is cleaned according to Beyer, Franco-Bedoya, and Galdo (2020). Source: National Statistical Office, POSOCO, and Earth Observation Group (Colorado School of Mines), and World Bank staff
calculations.
Gross value added (GVA), the national account estimate of economic activity, electricity
consumption, and light intensity all increased over the last few years (Figure B.17). On average,
GVA increased 6.4 percent a year, electricity consumption 3.2 percent, and light intensity 5.6 percent. There
is vast literature on the long-run relationship of these variables and the causal relationship between them
across the world (Ferguson, Wilkinson, and Hill 2000). Chen, Kuo, and Chen (2007) find a bi-directional
long-run causality between the two variables in 10 Asian countries and a short-run causality from GDP
growth to electricity consumption. Note that the different series exhibit different seasonal patterns.
Electricity consumption tends to be lower in winter than in summer and for night-time light intensity, it is
the opposite, with winters being brighter than summers. In order to analyse the short-run relationship of
these variables, they are detrended to abstract from the different seasonal patterns.
0
5000
10000
15000
20000
25000
30000
35000
40000
Quarterly gross value addedMillion rupees
0
50000
100000
150000
200000
250000
300000
350000
400000
Electricity consumptionMega units
0
0.5
1
1.5
2
2.5
3
Nighttime light intensityNW per km²

I n d i a D e v e l o p m e n t U p d a t e - J u l y 2 0 2 0
95
Figure B.17: GDP, electricity consumption, and nighttime light intensity
Note: The dots show qoq growth rates from Q2 2013 to Q1 2020 after detrending and seasonally adjusting the data. The night-time light data is
cleaned according to Beyer, Franco-Bedoya, and Galdo (2020). Sources: National Statistical Office, POSOCO, and Earth Observation Group (Colorado School of Mines), and World Bank staff calculations.
Both proxies are positively related to economic activity also in the short run. Figure B.17 plots the
relationship of the detrended and seasonally adjusted variables. As can be clearly seen in the left panel,
electricity consumption and economic activity are closely related. The right panel shows that the same is
true for night-time light intensity and economic activity. These relationships are statistically significant at
the 1 percent level and hold for different subsamples as well. The elasticity between GVA and night-time
light intensity has been very stable during the first and second half of the sample.105 The elasticity of
electricity consumption has weakened somewhat but was statistically significant at the 10-percent level in
both periods.
Table B.4: Monthly co-movement of electricity and night-time lights with other indicators
Electricity consumption
(1) (2) (3) (4) (5) (6) (7) (8) (9) (10) (11)
Trade Generation/production Traffic Tourism
Exports Imports IP Auto Steel Electricity Textile Freight Cargo Passenger
Foreign Tourist Arrivals
Coefficient 0.182*** 0.227*** 0.432*** 0.241*** 0.313*** 0.928*** 0.216* 0.705*** 1.165*** 0.0413*** 0.188*** Standard error (0.0383) (0.0326) (0.0397) (0.0333) (0.0335) (0.0344) (0.115) (0.0746) (0.134) (0.00544) (0.0274)
N 85 85 85 84 85 85 66 85 85 85 84
R2 0.854 0.885 0.928 0.932 0.913 0.983 0.962 0.915 0.907 0.893 0.929
Nighttime light intensity
Coefficient 0.0428 0.0220 0.143 0.223** 0.134 0.690*** 0.666** 0.394* -0.120 0.0154 0.140* Standard error (0.0809) (0.0746) (0.118) (0.0979) (0.0912) (0.185) (0.310) (0.198) (0.338) (0.0134) (0.0814)
N 97 97 97 96 97 97 78 97 97 97 96
R2 0.830 0.829 0.832 0.841 0.833 0.854 0.858 0.837 0.829 0.832 0.837
Notes: All regressions are in logs and include a time trend and month fixed effects. * p<.1, ** p<.05 and *** p<.01 Sources: CEIC, POSOCO, Earth Observation Group (Colorado School of Mines), and World Bank staff calculations.
105 The first half goes from Q2 2013 to Q3 2016 and the second half, from Q4 2016 to Q1 2020.
-3
-2
-1
0
1
2
-3 -2 -1 0 1 2
Δqu
arte
rly
elec
tricity
Δquarterly GVA
-3
-2
-1
0
1
2
-3 -2 -1 0 1 2
Δqu
arte
rly
light
inte
nsity
Δquarterly GVA

I n d i a D e v e l o p m e n t U p d a t e - J u l y 2 0 2 0
96
Both are also related to other monthly high-frequency indicators. To confirm this, we aggregate the
daily electricity data to monthly frequency. Table B.2 shows the monthly relationships of our two proxies
with other high-frequency indicators after detrending and seasonally adjusting them. Electricity
consumption is strongly related to trade, both to exports and imports (first two columns). It is also strongly
related to industrial production and similar activities (next six columns). The near one-to-one relationship
with electricity generation, which comes from an entirely different source than our daily measure, validates
our data. Electricity consumption is also related to traffic, whether that is from freight, cargo, or passengers.
Last but not least, it even comoves with tourist arrivals. The monthly fluctuations in night-time light
intensity are not as strongly related to the other high-frequency indicators, but the relationship is still
statistically significant at least at the ten percent level for half of the indicators. Both variables are noisy
measures of economic activity. This is both because of measurement errors in electricity consumption and
especially in night-time light intensity, and because both are only proxies of economic activity. Electricity
consumption data has some advantages over night-time light intensity. In our analysis of monthly
indicators, electricity consumption has a stronger relationship with other high-frequency indicators. When
both are available, electricity consumption is the better proxy for GVA and night-time lights do not add
much information (Beyer, Franco-Bedoya, and Galdo 2020). And at the state level, electricity consumption
relates much stronger to GVA then does night-time light intensity, for which the relationship is weak
(Prakash et al. 2019). In addition, electricity consumption is available at higher frequency. Night-time lights,
on the other hand, are available at much higher spatial granularity. The two proxies are hence
complementary.
Figure B.18: Deviation of electricity consumption from normal levels
Note: The prediction model of electricity consumption is presented in Beyer, Franco-Bedoya, and Galdo (2020) and accounts for seasonal patterns, varying consumption over the course of the week, holidays, and temperature. It explains over 90 percent of the variation in India’s electricity consumption. The plotted deviations are the coefficients of daily fixed effects that are included in the
estimation. Sources: Update based on Beyer, Franco-Bedoya, and Galdo (2020).
Electricity consumption may vary for other reasons than seasonal patterns and changes in
economic activity. For example, it tends to be lower at holidays and higher if temperatures are very high.
A recent World Bank Policy Research Paper estimates an electricity consumption model that takes these
factors into account and can explain 90 percent of the daily variation in electricity consumption in India
(Beyer, Franco-Bedoya, and Galdo 2020). One can then compare the actual electricity consumption to that
predicted by the model.106 The first meaningful deviation from normal levels was on March 22, when India
106 This can be either done by including daily fixed effects in the estimation of the model or by doing an out-of-sample prediction. In both cases, the deviations from normal are the same.
-100
-80
-60
-40
-20
0
-0.3
-0.2
-0.1
0
Percent Deviation from predicted electricity consumption
Oxford Government Response Stringency Index
Index
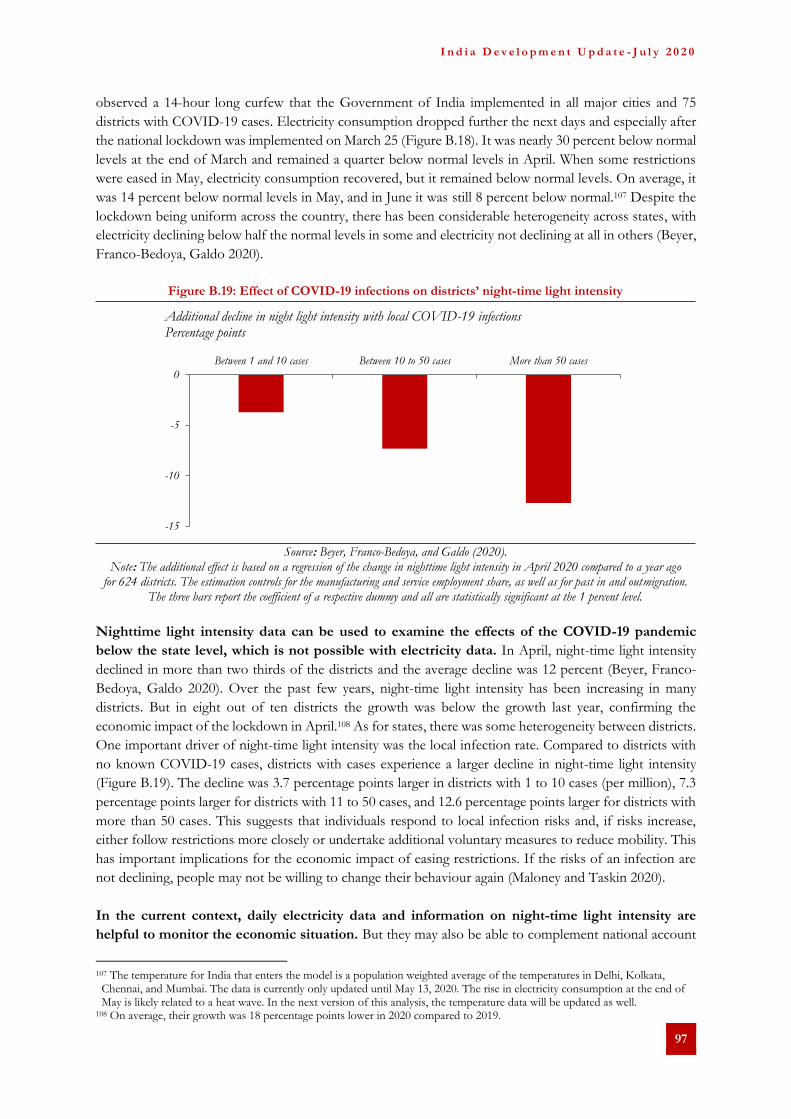
I n d i a D e v e l o p m e n t U p d a t e - J u l y 2 0 2 0
97
observed a 14-hour long curfew that the Government of India implemented in all major cities and 75
districts with COVID-19 cases. Electricity consumption dropped further the next days and especially after
the national lockdown was implemented on March 25 (Figure B.18). It was nearly 30 percent below normal
levels at the end of March and remained a quarter below normal levels in April. When some restrictions
were eased in May, electricity consumption recovered, but it remained below normal levels. On average, it
was 14 percent below normal levels in May, and in June it was still 8 percent below normal.107 Despite the
lockdown being uniform across the country, there has been considerable heterogeneity across states, with
electricity declining below half the normal levels in some and electricity not declining at all in others (Beyer,
Franco-Bedoya, Galdo 2020).
Figure B.19: Effect of COVID-19 infections on districts’ night-time light intensity
Source: Beyer, Franco-Bedoya, and Galdo (2020).
Note: The additional effect is based on a regression of the change in nighttime light intensity in April 2020 compared to a year ago for 624 districts. The estimation controls for the manufacturing and service employment share, as well as for past in and outmigration.
The three bars report the coefficient of a respective dummy and all are statistically significant at the 1 percent level.
Nighttime light intensity data can be used to examine the effects of the COVID-19 pandemic
below the state level, which is not possible with electricity data. In April, night-time light intensity
declined in more than two thirds of the districts and the average decline was 12 percent (Beyer, Franco-
Bedoya, Galdo 2020). Over the past few years, night-time light intensity has been increasing in many
districts. But in eight out of ten districts the growth was below the growth last year, confirming the
economic impact of the lockdown in April.108 As for states, there was some heterogeneity between districts.
One important driver of night-time light intensity was the local infection rate. Compared to districts with
no known COVID-19 cases, districts with cases experience a larger decline in night-time light intensity
(Figure B.19). The decline was 3.7 percentage points larger in districts with 1 to 10 cases (per million), 7.3
percentage points larger for districts with 11 to 50 cases, and 12.6 percentage points larger for districts with
more than 50 cases. This suggests that individuals respond to local infection risks and, if risks increase,
either follow restrictions more closely or undertake additional voluntary measures to reduce mobility. This
has important implications for the economic impact of easing restrictions. If the risks of an infection are
not declining, people may not be willing to change their behaviour again (Maloney and Taskin 2020).
In the current context, daily electricity data and information on night-time light intensity are
helpful to monitor the economic situation. But they may also be able to complement national account
107 The temperature for India that enters the model is a population weighted average of the temperatures in Delhi, Kolkata, Chennai, and Mumbai. The data is currently only updated until May 13, 2020. The rise in electricity consumption at the end of May is likely related to a heat wave. In the next version of this analysis, the temperature data will be updated as well.
108 On average, their growth was 18 percentage points lower in 2020 compared to 2019.
-15
-10
-5
0
Between 1 and 10 cases Between 10 to 50 cases More than 50 cases
Additional decline in night light intensity with local COVID-19 infectionsPercentage points

I n d i a D e v e l o p m e n t U p d a t e - J u l y 2 0 2 0
98
estimates more generally. National account measures face specific challenges related to the COVID-19
pandemic, which makes data collection through surveys even more difficult. In line, the National Statistical
Office mentioned data collection challenges related to the lockdown and warned of the revisions to its
growth estimate for the fourth quarter of 2019/20. In future work, it will be interesting to analyse how this
data can be employed to amend traditional measures of economic activity and how helpful this information
is to improve nowcasts of economic activity.

I n d i a D e v e l o p m e n t U p d a t e - J u l y 2 0 2 0
99
ANNEX
Import and Export Measures Adopted by India January-April 2020
Import Measures Export Measures
Temporary el imination of import tari ffs on: (i ) arti ficia l
respiration or other therapeutic respiration apparatus
(venti lators ) (HS 9018; 9019); (i i ) face masks and surgica l
masks (HS Chapter 63); (i i i ) personal protection equipment
(HS Chapter 62); (iv) COVID-19 testing ki ts (HS Chapters 30
and 38); and (v) inputs for manufacture of i tems (i to iv)
subject to the condition that the importer fol lows the
procedure set out in the Customs (Import of Goods at
Concess ional Rate of Duty) Rules , 2012, due to the COVID-19
pandemic. Imports a lso exempted from the Health Cess
Further amendments introduced to the export pol icy of Active Pharmaceutica l Ingredients (APIs ) and formulations made from
these APIs (HS 2933.29.10; 2933.29.20; 2933.59.90; 2936.22.10; 2936.25.00; 2936.26.10; 2937.23.00; 2941.40.00; 2941.50.00; 2941.90.90;
2942.00.90; 3004.20.50; 3004.20.61; 3004.20.95; 3004.39.19; 3004.50.32; 3004.50.34; 3004.50.39; 3004.90.15; 3004.90.21; 3004.90.22;
3004.90.23; 3004.90.99), changing from restricted to free, due to the COVID-19 pandemic
Imports of certa in medica l and surgica l instruments and
apparatus (HS 9018; 9019; 9020; 9021; 9022) exempted from
the "health cess"
Certa in products (e.g. surgica l masks/disposable mask (2/3 ply); a l l gloves except NBR gloves ; a l l ophthalmic instruments and
appl iances under ITCHS 9018.50 except medica l goggles ; surgica l blades ; non-woven shoes (disposable); breathing appl iances
used by a i rmen, divers , mountaineers and fi remen; gas masks with chemica l absorbent for fi l tration against poisonous vapour,
smoke, gases ; HPDE tarpaul in/plastic tarpaul in; PVD conveyor belts ; and biopsy punch) exempted from the export ban
implemented due to the COVID-19 pandemic
Decrease of import tari ffs (from 10% to 5%) on medica l or
surgica l instruments and apparatus (HS 9018; 9019; 9020;
9021; 9022)
Amendments introduced to the export pol icy of venti lators , including any arti ficia l respiratory apparatus or oxygen therapy or any
other breathing appl iances/devices and sanitizers (HS 3004.90.87; 3401; 3402; 3808.94; 9018; 9019; 9020), resulting in an export
restriction due to the COVID-19 pandemic
Amendments introduced to the import pol icy of i ron and
s teel and incorporation of pol icy condition in HS Chapters
72; 73; 86, Schedule-I (import pol icy), resulting in an
extens ion of va l idi ty to 135 days to automatic regis tration
number generated under the Steel Import Monitoring
System "SIMS" unti l 31 March 2020, due to the COVID-19
pandemic
Amendments introduced to the export pol icy of Personal Protective Equipment/Masks-reg (HS 3926.90; 6217.90; 6307.90; 9018.50;
9018.90; 9020), resulting in an export restriction due to the COVID-19 pandemic
Amendments introduced to the export pol icy of masks , venti lators , and texti le raw materia ls for masks and covera l l s (HS 3926.90;
6217.90; 6307.90; 9018; 9020; 5603.11; 5603.12; 5603.13; 5603.14; 5603.91; 5603.92; 5603.93; 5603.94), resulting in an export restriction
due to the COVID-19 pandemic
Amendments introduced to the export pol icy of hydroxychloroquine (HS 3004.90.87; 3401; 3402; 3808.94; 9018; 9019; 9020), resulting
in an export restriction (subject to some exceptions), due to the COVID-19 pandemic. On 4 Apri l 2020, exceptions el iminated
resulting in an export prohibi tion of hydroxychloroquine
Amendments introduced to the export pol icy of diagnostic ki ts (diagnostic or laboratory reagents on a backing, preparation
diagnostic or laboratory reagents whether or not on a backing, other than those of heading HS 3006 or 3008; certi fied reference
materia ls ) (HS 3822), resulting in an export restriction due to the COVID-19 pandemic
Amendments introduced to the export pol icy of Active Pharmaceutica l Ingredients (APIs ) and formulations made from these APIs
(HS 2922.29.33; 2933.29.10; 2933.29.20; 2933.59.90; 2936.22.10; 2936.25.00; 2936.26.10; 2937.23.00; 2941.40.00; 2941.50.00; 2941.90.50;
2941.90.90; 2942.00.90; 3004.20.50; 3004.20.61; 3004.20.95; 3004.39.19; 3004.50.32; 3004.50.34; 3004.50.39; 3004.90.15; 3004.90.21;
3004.90.22; 3004.90.23; 3004.90.99), resulting in an export restriction due to the COVID-19 pandemic
Further amendments introduced to the export pol icy of formulation made from paracetamol (including FDCs) (HS 3004.90.99),
changing from restricted to free, due to the COVID-19 pandemic. Paracetamol APIs wi l l remain restricted for export
Amendments introduced in the Export Policy of Sanitizers. Only "alcohol based hand sanitizers" are prohibited for
export (HS 3004; 3401; 3402; 3808.94), due to the COVID-19 pandemic. All other items falling under the HS Codes
mentioned are freely exportable
Amendments introduced in the Export Policy of Masks, allowing the export of non-medical/non-surgical masks of
all types (cotton, silk, wool, knitted) (HS 3926.90; 6217.90; 6307.90; 9018.90; 90209. All other types of masks falling
under any HS Codes continued to remain prohibited for exports
Source: WTO, https://www.wto.org/english/tratop_e/covid19_e/trade_related_goods_measure_e.htm, latest data May 20, 2020.
I n d i a D e v e l o p m e n t U p d a t e - J u l y 2 0 2 0
100
References
Baldwin, R. (2020): The Greater Trade Collapse of 2020: Learnings from the 2008-09 Great Trade
Collapse, VoxEu.org, April 7, 2020. https://voxeu.org/article/greater-trade-collapse-2020
Baldwin, R. and R. Freeman (2020): Supply chain contagion waves: Thinking ahead on manufacturing
‘contagion and reinfection’ from the COVID concussion, VoxEU.org, April 1, 2020.
https://voxeu.org/article/covid-concussion-and-supply-chain-contagion-waves
Baragwanath, K., Goldblatt, R., Hanson, G. and Khandelwal, A.K. (2019). Detecting urban markets with
satellite imagery: An application to India. Journal of Urban Economics, In press.
Beyer, R. C. N., Chhabra, E., Galdo, V., and Rama, M. (2018). Measuring districts’ monthly economic activity from
outer space (No. 8523). World Bank Policy Research Working Paper.
Beyer, R.C.M., Franco-Bedoya S., and Galdo, V. (2020). Examining the economic impact of COVID-19 in India
through daily electricity consumption and nighttime light intensity (No. 9291). World Bank Policy Research
Working Paper.
Ch, R., Martin, D.A. and Vargas, J.F. (2020). Measuring the size and growth of cities using nighttime light.
Journal of Urban Economics, p.103254.
Chanda, A. and Kabiraj, S. (2020). Shedding light on regional growth and convergence in India. World
Development, 133, 104961.
Chatterjee, U., Murgai, R., Narayan, A. and; Rama, M. (2016). Pathways to Reducing Poverty and Sharing
Prosperity in India: Lessons from the Last Two Decades. World Bank, Washington, DC. © World
Bank. https://openknowledge.worldbank.org/handle/10986/24988
Chen, S. T., Kuo, H. I., Chen, C. C. (2007). The relationship between GDP and electricity consumption in
10 Asian countries. Energy Policy, 35(4), 2611-2621.
Chen, W., Chen, X., Hsieh, C. T., Song, Z. (2019). A Forensic Examination of China’s National Accounts.
Brookings Papers on Economic Activity, 77-127.
Chodorow-Reich, G., Gopinath, G., Mishra, P., Narayanan, A. (2020). Cash and the economy: Evidence
from India’s demonetization. The Quarterly Journal of Economics, 135(1), 57-103.
Cicala, S. (2020a). Electricity Consumption as a Real Time Indicator of Economic Activity. Unpublished Manuscript.
Cicala, S. (2020b). Early Economic Impacts of COVID-19 in Europe: A View from the Grid. Unpublished
Manuscript.
Elvidge, C. D., Baugh K. E., Zhizhin, M., Chi, F., Ghosh, T. (2017). VIIRS night-time lights. International
Journal of Remote Sensing, 38(21): 5860-5879.
Elvidge, C. D., Baugh, K. E., Zhizhin, M., Hsu, F. C. (2013). Why VIIRS data are superior to DMSP for
mapping nighttime lights. Proceedings of the Asia-Pacific Advanced Network, 35, 62-69.
Ferguson, R., Wilkinson, W., Hill, R. (2000). Electricity use and economic development. Energy Policy,
28(13), 923-934.
Galdo, V., Li, Y. and Rama, M., (2020). Identifying urban areas by combining human judgment and machine
learning: An application to India. Journal of Urban Economics, In press.
Gibson, J., Datt, G., Murgai, R., Ravallion, M. (2017). For India’s rural poor, growing towns matter more
than growing cities. World Development, 98, 413-429.
Henderson, J. V., Storeygard, A., Weil, D. N. (2012). Measuring economic growth from outer space.
American Economic Review, 102(2), 994-1028.
Henderson, J.V., Squires, T., Storeygard, A. and Weil, D. (2018). The global distribution of economic
activity: Nature, history, and the role of trade. The Quarterly Journal of Economics, 133:357-406.
IMF (2020). World Economic Outlook, Chapter 1, Washington, D.C.
International Energy Agency. Oil Market Report. June. International Energy Agency: Paris.
I n d i a D e v e l o p m e n t U p d a t e - J u l y 2 0 2 0
101
Jean, N., Burke, M., Xie, M., Davis, W.M., Lobell, D.B. and Ermon, S. (2016). Combining satellite imagery
and machine learning to predict poverty. Science, 353(6301),790-794.
Keola, S., Andersson, M. and Hall, O. (2015). Monitoring economic development from space: using
nighttime light and land cover data to measure economic growth. World Development, 66, 322-334
Lyu, C., Wang, K., Zhang, F., Zhang, X. (2018). GDP management to meet or beat growth targets. Journal
of Accounting and Economics, 66(1), 318-338.
Mahler, D. G., Lakner, C., R, A. C. A. and Wu, H., (2020). Updated estimates of the impact of COVID-19
on global poverty. World Bank Blogs
https://blogs.worldbank.org/opendata/updated-estimates-impact-covid-19-global-poverty
Maloney, W. Taskin, T. (2020). Determinants of Social Distancing during COVID-19: A Global View.
Unpublished Manuscript.
Morris, S.D. and Zhang, J. (2019). Validating China’s Output Data Using Satellite Observations.
Macroeconomic Dynamics, 23(8), 3327-3354.
Newhouse, D. and Vyas, P., (2019. Estimating Poverty in India without Expenditure Data: A Survey-to-
Survey Imputation Approach. Policy Research Working Paper, No. WPS 8878; World Bank,
Washington, DC. https://openknowledge.worldbank.org/handle/10986/31868
OECD (2019). OECD Services Trade Restrictiveness Index (STRI): India 2019,
http://www.oecd.org/trade/topics/services-trade/documents/oecd-stri-country-note-india.pdf
OECD (2020). Tourism Policy Responses, updated April 15, 2020.
Pinkovskiy, M. and Sala-i-Martin, X. (2016). Lights, camera. . . income! Illuminating the national accounts-
household surveys debate. The Quarterly Journal of Economics, 131(2), 579-631.
Prakash, A., Shukla, A. K., Bhowmick, C., Beyer, R. (2019). Night-time luminosity: Does it brighten
understanding of economic activity in India? Reserve Bank of India Occasional Papers, Vol. 40, No. 1.
Ravallion, M., (2003). Measuring Aggregate Welfare in Developing Countries: How well Do National
Accounts and Surveys Agree? The Review of Economics and Statistics 85(3): 645-52.
World Bank. 2020a. Global Economic Prospects. June. Washington, DC: World Bank.
World Bank. 2020b. Migration and Development Brief 32: COVID-19 Crisis through a Migration Lens. Washington,
DC: World Bank.
WTO (2018): Overview of Developments in the International Trading Environment Annual Report by
The Director-General, WT/TPR/OV/21, November 27, 2018.
WTO (2019): Overview of Developments in the International Trading Environment Annual Report by
The Director-General, WT/TPR/OV/22, November 29, 2019
WTO (2020a). Trade set to plunge as COVID-19 pandemic upends global economy, Press Release
https://www.wto.org/english/news_e/pres20_e/pr855_e.pdf
WTO (2020b). COVID-19: Trade and trade-related measures,
https://www.wto.org/english/tratop_e/covid19_e/trade_related_goods_measure_e.htm

I n d i a D e v e l o p m e n t U p d a t e - J u l y 2 0 2 0
102
Related Documents