APPENDIX
Report of the State of Nevada Economic Forum
Forecast of Future State Revenues December 1, 2004
231
STATE OF NEVADA
ECONOMIC FORUM
FORECAST OF FUTURE
STATE REVENUES
December 1, 2004
232

THE STATE OF NEVADA ECONOMIC FORUM
Michael Small, Chairman Deborah Pierce, Vice Chairman
Cary Fisher Leo Seevers
William Martin
December 1, 2004 Members of the 73rd Legislature Legislative Building Capitol Complex Carson City, Nevada 89701-4747 Dear Nevada Legislator: Enclosed is the Economic Forum's report on future state revenues prepared pursuant to Nevada Revised Statutes 353.228. This report, which must be presented by December 1, 2004, includes a description of the purpose of the Economic Forum, the methodology employed in arriving at the estimated general fund revenues, economic assumptions and the final revenue projections. As required by statute, the Economic Forum plans to revisit these projections before May 1, 2005 to determine if any adjustment is necessary.
Enclosure
233
THE STATE OF NEVADA ECONOMIC FORUM
Michael Small, Chairman Deborah Pierce, Vice Chairman
Cary Fisher Leo Seevers
William Martin
December 1, 2004 The Honorable Kenny Guinn Governor of Nevada Capitol Building Carson City, Nevada 89701-4747 Dear Governor Guinn: Enclosed is the Economic Forum's report on future state revenues prepared pursuant to Nevada Revised Statutes 353.228. This report, which must be presented by December 1, 2004, includes a description of the purpose of the Economic Forum, the methodology employed in arriving at the estimated general fund revenues, economic assumptions and the final revenue projections. As required by statute, the Economic Forum plans to revisit these projections before May 1, 2005 to determine if any adjustment is necessary.
Enclosure
234
1
REPORT TO THE GOVERNOR AND THE LEGISLATURE ON FUTURE STATE REVENUES December 1, 2004
Senate Bill 23 (1993) provided for the creation of an Economic Forum to forecast future
state general fund revenues. The Forum, a panel of five economic and taxation experts
from the private sector, is required to adopt an official forecast of unrestricted general fund
revenues for the biennial budget cycle. All agencies of the state, including the Governor
and the Legislature, must use the Forum's forecast. A seven-member Technical Advisory
Committee made up of Executive and Legislative Branch staff members as well as a
representative of local government was also created in SB 23 to provide whatever
assistance and resources the Forum required.
The Forum must present its forecast to the Governor and the Legislature by
December 1, 2004, and any required revisions by May 1, 2005. This report includes
forecasts of unrestricted general fund revenues for fiscal years 2004-05, 2005-06 and
2006-07.
Methodology and Procedures
The Governor appointed the five members of the Economic Forum in 2004 for a two-year
term. These appointments include two members nominated by the leadership of the
Senate and Assembly. The Forum has since met in open meeting three times between
September 29 and December 1, 2004.
The first meeting of the Forum was devoted to organizing, reviewing the assigned task,
reviewing the tax changes and new taxes approved during the 21st Special Session,
reviewing previous forecasts and outcomes and determining a course of action. At that
235
2
time, the Forum directed the Technical Advisory Committee to prepare independent
forecasts for those revenues normally projected by each agency, the Budget Division of the
Department of Administration and the Fiscal Analysis Division of the Legislative Counsel
Bureau. The Forum also requested that the economic assumptions underlying the
projections be provided. In addition, the Forum solicited information from others known to
develop such data and asked for commentary from economic experts not directly involved
in the forecast process.
In response to this request, the Budget Division and the Fiscal Analysis Division,
respectively, provided projections and economic analyses for seven major general fund
revenues and economic forecasts at the second meeting of the Forum on November 2,
2004. The Department of Taxation and the Gaming Control Board also provided
projections and economic analysis concerning the major revenues they have the
responsibility to collect. The Forum also received forecasts of all minor general fund
revenues developed by the Technical Advisory Committee for its review and consideration.
In addition to the state agency information, the Economic Forum received forecasts of
gaming percentage fees and sales taxes and state and national economic analysis from
Global Insight, an economic and information consulting firm under contract to the state.
Other public and private experts provided various economic and revenue analysis to the
Forum. This process allowed the Forum to review results from a variety of econometric
models and other analytical approaches to revenue estimation. The Economic Forum
reviewed the forecast information and developed preliminary forecasts of general fund
revenues and requested that updated forecasts and information be provided at the meeting
on December 1, 2004.
At its December 1, 2004 meeting, the Economic Forum received the updated economic and
revenue information from the state agencies, the Technical Advisory Committee, Global
Insight and others to produce the binding forecast of all unrestricted general fund revenue.
A copy of that forecast is attached. A final meeting of the Forum will be scheduled on or
before May 1, 2005, to make any necessary revisions to the December forecast.
236
3
Economic Review and Outlook
The U.S. economy has been expanding for three years since the official end of the last
economic recession in November 2001. While there has been much discussion about the
sluggishness of the current recovery, average growth of 3.5 percent in Gross Domestic
Product (GDP) for the first eleven reported quarters since the end of the recession
compares favorably with the growth rate of 3.0 percent for the comparable period following
the 1990-91 recession. In both cases, these growth rates have followed a short, shallow
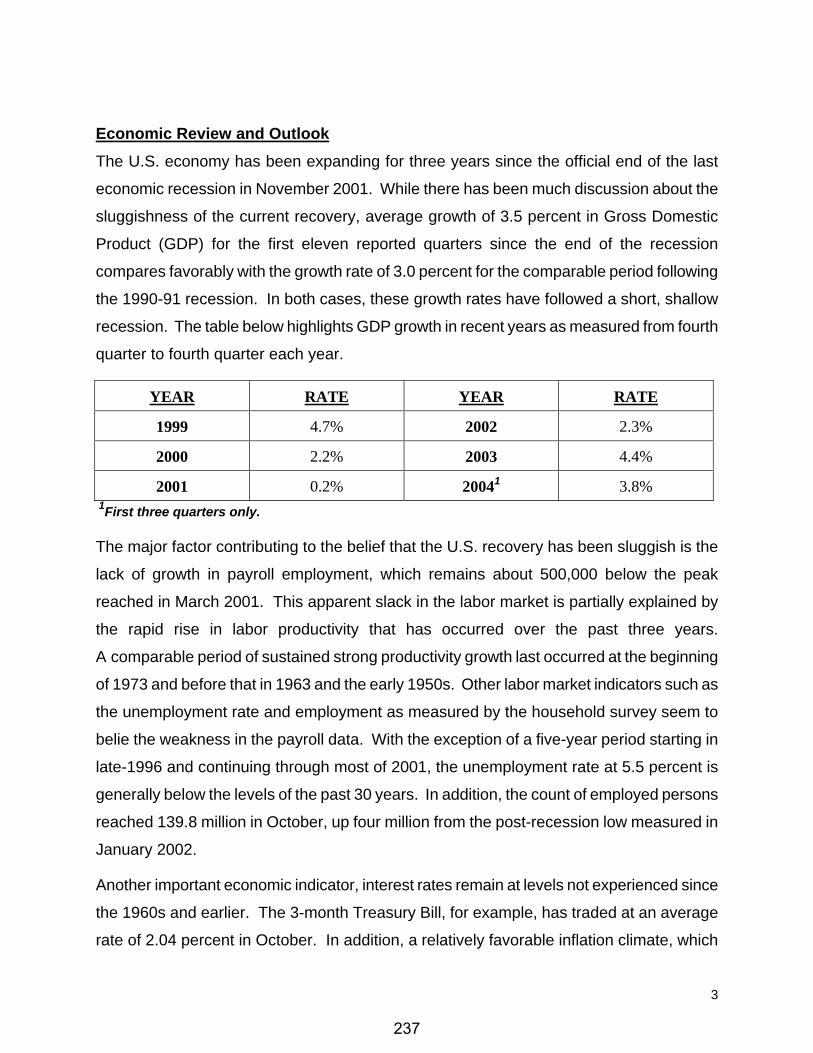
recession. The table below highlights GDP growth in recent years as measured from fourth
quarter to fourth quarter each year.
YEAR RATE YEAR RATE
1999 4.7% 2002 2.3%
2000 2.2% 2003 4.4%
2001 0.2% 20041 3.8% 1First three quarters only.
The major factor contributing to the belief that the U.S. recovery has been sluggish is the
lack of growth in payroll employment, which remains about 500,000 below the peak
reached in March 2001. This apparent slack in the labor market is partially explained by
the rapid rise in labor productivity that has occurred over the past three years.
A comparable period of sustained strong productivity growth last occurred at the beginning
of 1973 and before that in 1963 and the early 1950s. Other labor market indicators such as
the unemployment rate and employment as measured by the household survey seem to
belie the weakness in the payroll data. With the exception of a five-year period starting in
late-1996 and continuing through most of 2001, the unemployment rate at 5.5 percent is
generally below the levels of the past 30 years. In addition, the count of employed persons
reached 139.8 million in October, up four million from the post-recession low measured in
January 2002.
Another important economic indicator, interest rates remain at levels not experienced since
the 1960s and earlier. The 3-month Treasury Bill, for example, has traded at an average
rate of 2.04 percent in October. In addition, a relatively favorable inflation climate, which
237
4
has remained in the range of two to three percent over the last decade, has helped keep
long-term interest rates at 1958 levels. The 10-year Treasury Bond, which is a key
determinant of mortgage rates, has traded in the range of 4 to 4.25 percent in recent
months. The low mortgage rates for original home loans and refinancings have fueled both
the housing market and consumer demand over the past three years. The downside of the
low market rates has been a run up in home prices in many markets, as demand has
outstripped supply.
The Nevada economy has bounced back from the 2001 recession, particularly the sharp
turndown in the tourist economy following the terrorist attacks of September 11. In
Las Vegas, for example, visitor volume, after increasing only 1.3 percent in 2003, is up
another 5.5 percent through September 2004. The opening of the new Wynn mega-resort
in spring 2005 should ensure that this favorable trend continues. The rebound in other
economic indicators has been even more dramatic. The state’s unemployment rate, which
peaked at 6.6 percent in the December and January following the September 11 attacks,
stands at 3.6 percent as of September 2004. According to the Nevada Department of
Employment, Training and Rehabilitation (DETR), that rate is the lowest in the more than
25 years the department has been calculating the rate using current methods. In addition,
unlike the national numbers, Nevada payroll employment is now 8.6 percent higher than it
was in September 2001.
The rebound in Nevada’s economic performance has produced commensurate increases in
state revenue since the Economic Forum’s May 2003 forecast. Sales tax revenues, for
example, were up 5.9 percent in FY 2003 compared to the forecast of 5.0 percent.
In FY 2004, sales tax revenue growth roared ahead, rising 13.9 percent from FY 2003
levels, compared to a forecast of just 5.6 percent. Many other important state revenues
including the mining tax, the insurance premium tax, the liquor tax, the gaming tax and the
tax on tobacco products other than cigarettes are doing better than expected. A new state
revenue source, the real property transfer tax, has also generated more revenues than
expected as a booming housing market for both new and existing homes has fueled record
sales and prices in the urban areas of the state.
238
5
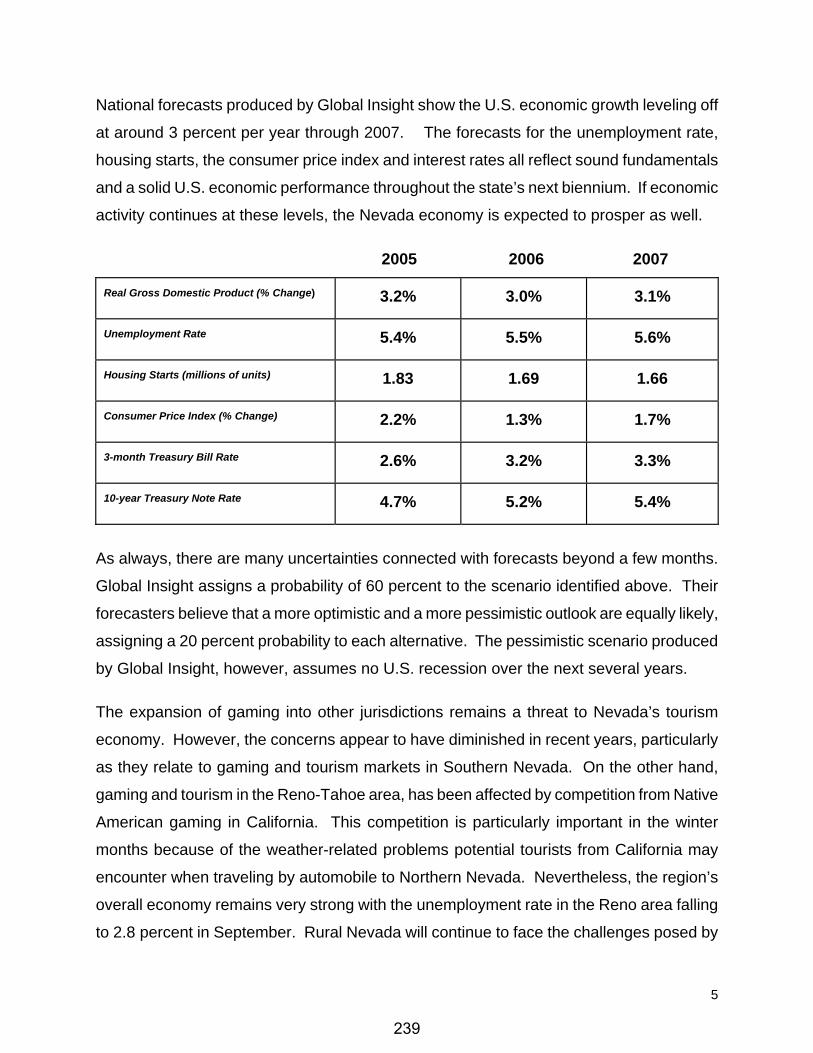
National forecasts produced by Global Insight show the U.S. economic growth leveling off
at around 3 percent per year through 2007. The forecasts for the unemployment rate,
housing starts, the consumer price index and interest rates all reflect sound fundamentals
and a solid U.S. economic performance throughout the state’s next biennium. If economic
activity continues at these levels, the Nevada economy is expected to prosper as well.
2005 2006 2007 Real Gross Domestic Product (% Change)
3.2%
3.0%
3.1%
Unemployment Rate
5.4%
5.5%
5.6%
Housing Starts (millions of units)
1.83
1.69
1.66
Consumer Price Index (% Change)
2.2%
1.3%
1.7%
3-month Treasury Bill Rate
2.6%
3.2%
3.3%
10-year Treasury Note Rate
4.7%
5.2%
5.4%
As always, there are many uncertainties connected with forecasts beyond a few months.
Global Insight assigns a probability of 60 percent to the scenario identified above. Their
forecasters believe that a more optimistic and a more pessimistic outlook are equally likely,
assigning a 20 percent probability to each alternative. The pessimistic scenario produced
by Global Insight, however, assumes no U.S. recession over the next several years.
The expansion of gaming into other jurisdictions remains a threat to Nevada’s tourism
economy. However, the concerns appear to have diminished in recent years, particularly
as they relate to gaming and tourism markets in Southern Nevada. On the other hand,
gaming and tourism in the Reno-Tahoe area, has been affected by competition from Native
American gaming in California. This competition is particularly important in the winter
months because of the weather-related problems potential tourists from California may
encounter when traveling by automobile to Northern Nevada. Nevertheless, the region’s
overall economy remains very strong with the unemployment rate in the Reno area falling
to 2.8 percent in September. Rural Nevada will continue to face the challenges posed by
239
6
the ups and downs of the mining industry. However, the recent increase in gold prices to
around $440 an ounce, due in part to the uncertainty caused by war and terrorism, bodes
well for the prosperity of many rural counties over the next two or three years.
The few available statewide forecasts support a healthy economic outlook for the next few
years. The Nevada Blue Chip consensus projects personal income to grow by 6.6 percent,
employment by 3.8 percent and the number of housing permits by 1.7 percent in 2005.
Separately, the Bureau of Research and Analysis in DETR forecasts that employment will
grow at robust rates of 4.1, 3.7 and 4.1 percent in 2005, 2006 and 2007, respectively.
Global Insight’s own forecast of the Nevada economy is a bit less optimistic because it
expects housing and other construction activity to slow from the recent extraordinary levels.
The independent analysts who have supplied information to the Forum also see a favorable
outlook for Nevada’s economy over the next several years.
For Southern Nevada, the Center for Business and Economic Research (CBER) at UNLV is
optimistic. The Center forecasts, for example, that visitor volume will grow by 4.2 percent
in 2005, which is on the heels of an estimated 5.3 percent growth in 2004. Also, CBER’s
Index of Leading Indicators for Southern Nevada has increased 1.15 percent over the past
year, continuing the upward trend since September 11.
The Nevada economy appears to be poised for a continuation of its recent strong economic
performance through the forecast period and the state’s revenue picture should benefit.
The adoption of the modified business tax in place of the business license tax, the addition
of the real property transfer tax, and continued strength in the sales tax, live entertainment
tax and insurance premium strength are favorable for the revenue picture. However,
revenue from gaming percentage fees, due principally to a one-time revenue windfall in FY
2003-04 due to the recent rate increase, the per device gaming fees, cigarette and liquor
excise taxes and various non-tax revenue sources are expected to keep revenue growth at
less than the rate of state personal income growth.
240
7
General Fund Revenue Forecast
Following is a summary of the general fund revenue forecast by the Nevada Economic
Forum. This forecast should be considered neither optimistic nor pessimistic, but has been
developed based on the economic conditions and available economic data at the time the
forecast was made. Due consideration, however, was given to the increasing uncertainty of
economic circumstances two and a half years into the future. All forecasts have been
made on the basis of existing law; thus, no assumptions are included for any proposed law
changes.
Total General Fund Revenues
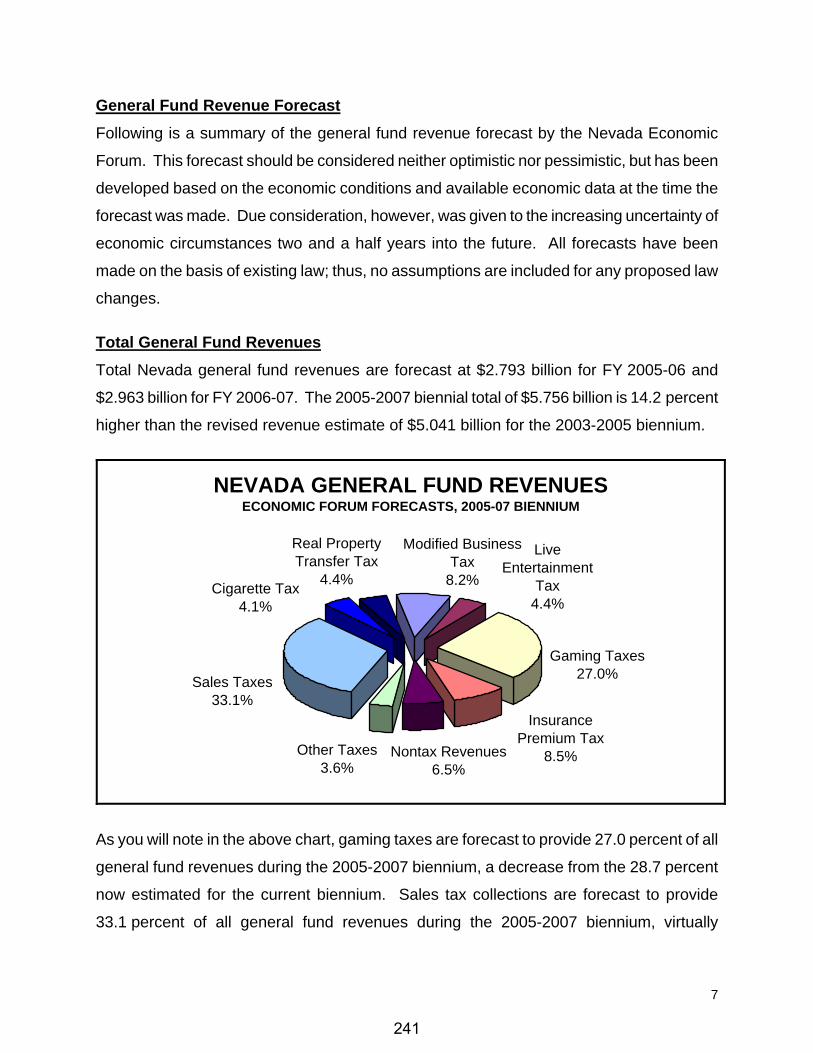
Total Nevada general fund revenues are forecast at $2.793 billion for FY 2005-06 and
$2.963 billion for FY 2006-07. The 2005-2007 biennial total of $5.756 billion is 14.2 percent
higher than the revised revenue estimate of $5.041 billion for the 2003-2005 biennium.
NEVADA GENERAL FUND REVENUESECONOMIC FORUM FORECASTS, 2005-07 BIENNIUM
Real Property Transfer Tax
4.4%
Sales Taxes33.1%
Nontax Revenues6.5%
Gaming Taxes27.0%
Insurance Premium Tax
8.5%Other Taxes3.6%
Modified Business Tax
8.2%Cigarette Tax4.1%
Live Entertainment
Tax4.4%
As you will note in the above chart, gaming taxes are forecast to provide 27.0 percent of all
general fund revenues during the 2005-2007 biennium, a decrease from the 28.7 percent
now estimated for the current biennium. Sales tax collections are forecast to provide
33.1 percent of all general fund revenues during the 2005-2007 biennium, virtually
241
8
unchanged from the 33.0 percent now estimated for the current biennium. More detailed
information on specific revenues in addition to gaming and sales taxes is available in the
accompanying table.
Sales Taxes Sales taxes have been forecast consistent with increased consumption due
to increased employment and population gains and tourism activity. Sales tax collections
are forecast to reach $873.3 million in FY 2004-05, a 10.5 percent increase from
FY 2003-2004 levels. Sales taxes are expected to grow by 6.0 percent in FY 2005-06 and
by another 6.0 percent in FY 2006-07. These increases result in total sales tax receipts of
$1.907 billion during the 2005-2007 biennium.
Gaming Percentage Fee Taxes The revenue estimates for gaming percentage fees, while
consistent with the expectations for the state economy and the opening of several new
properties in Southern Nevada over the next few years, are negatively affected by a one-
shot revenue gain in FY 2003-04 as a result of a quirk in revenue collections when gaming
percentage fees are increased. The forecasts for percentage fees rely, in part, on the
expertise of the Gaming Control Board in identifying market developments throughout the
forecast period. Total gaming percentage fee tax revenues are forecast to reach $683.2
million in FY 2004-05, an increase of only 0.9 percent from actual FY 2003-04 collections.
From this base, gaming taxes are estimated to grow by 5.4 percent in FY 2005-06 and 5.1
percent in FY 2006-07 to yield revenues of $1.476 billion for the general fund during the
2005-2007 biennium.
242
GL NO. DESCRIPTIONFY 2001 ACTUAL
% Change
FY 2002 ACTUAL
% Change
FY 2003 ACTUAL
% Change
FY 2004 ACTUAL [a.]
% Change FY 2005 %
Change FY 2006 % Change FY 2007 %
ChangeTAXES
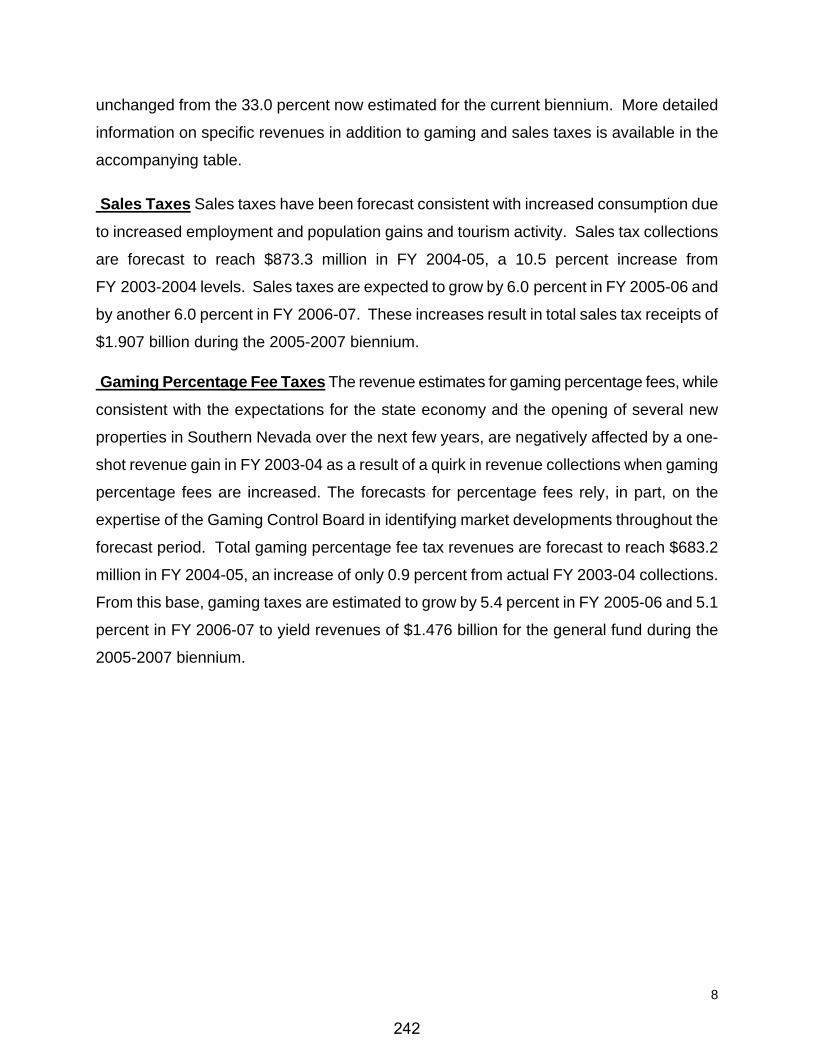
TOTAL MINING TAXES $14,672,692 9.1% $9,418,008 -35.8% $10,641,100 13.0% $16,817,927 58.0% $17,146,000 2.0% $17,086,000 -0.3% $17,284,000 1.2%TOTAL SALES AND USE TAX [1-FY04] $645,767,621 5.9% $655,068,480 1.4% $693,528,823 5.9% $790,602,667 14.0% $873,282,000 10.5% $925,680,000 6.0% $981,221,000 6.0%TOTAL GAMING TAXES [2-FY04][3-FY04] $604,464,065 2.0% $589,803,811 -2.4% $596,260,210 1.1% $714,653,673 19.9% $732,314,300 2.5% $758,657,800 3.6% $796,701,800 5.0%CASINO/LIVE ENTERTAINMENT TAX [4a-FY04][4b-FY04] $63,919,196 9.2% $64,817,715 1.4% $70,212,815 8.3% $89,201,827 27.0% $105,954,000 18.8% $131,108,000 23.7% $142,976,000 9.1%INSURANCE PREMIUM TAX $146,925,032 13.6% $156,550,893 6.6% $174,135,736 11.2% $194,457,058 11.7% $213,797,000 9.9% $234,980,000 9.9% $258,061,000 9.8%LIQUOR TAX [5-FY04] $15,745,514 0.5% $15,995,650 1.6% $16,531,358 3.3% $33,025,941 99.8% $35,865,000 8.6% $36,818,000 2.7% $37,771,000 2.6%CIGARETTE TAX [6-FY04] $43,691,552 3.5% $41,843,892 -4.2% $44,019,969 5.2% $106,770,729 142.6% $117,600,000 10.1% $117,600,000 $117,600,000OTHER TOBACCO TAX [7-FY04] $5,602,823 -6.0% $5,557,893 -0.8% $5,916,301 6.4% $6,927,276 17.1% $7,342,900 6.0% $7,746,800 5.5% $8,134,100 5.0%LAETRILE & GEROVITAL MFG. $2,692 -28.7%HECC TRANSFER $5,000,000 $5,000,000 $5,000,000 $5,000,000 $5,000,000 $5,000,000 $5,000,000BUSINESS LICENSE FEE [8-FY04] $523,072 1.8% $680,845 30.2% $739,561 8.6% $11,851,752 $18,000,000 51.9% $22,000,000 22.2% $26,000,000 18.2%BUSINESS LICENSE TAX [9-FY04] $77,270,722 1.8% $78,394,651 1.5% $79,026,132 0.8% $22,216,500 -71.9% $250,000MODIFIED BUSINESS TAX - NONFINANCIAL INSTITUTIONS [10-FY04 $146,161,812 $194,404,000 33.0% $207,152,000 6.6% $220,297,000 6.3%MODIFIED BUSINESS TAX - FINANCIAL INSTITUTIONS [11-FY04] $15,487,677 $20,000,000 29.1% $22,000,000 10.0% $25,000,000 13.6%BRANCH BANK EXCISE TAX [12-FY04] $1,508,192 $3,024,000 100.5% $3,059,000 1.2% $3,094,000 1.1%REAL PROPERTY TRANSFER TAX [13-FY04] $88,024,738 $116,734,000 32.6% $121,279,000 3.9% $133,407,000 10.0%
TOTAL TAXES $1,623,584,982 4.8% $1,623,131,839 0.0% $1,696,012,005 4.5% $2,242,707,768 32.2% $2,460,713,200 9.7% $2,610,166,600 6.1% $2,772,546,900 6.2%
LICENSESINSURANCE LICENSES $6,889,858 6.2% $7,806,594 13.3% $10,076,143 29.1% $10,578,744 5.0% $11,128,800 5.2% $12,241,700 10.0% $12,878,300 5.2%BANKING LICENSES [1-FY01][16-FY04] $23,785 35.7% $23,600 -0.8% $20,400 -13.6%MARRIAGE LICENSES $638,691 3.5% $587,774 -8.0% $587,712 0.0% $594,588 1.2% $609,800 2.6% $629,700 3.3% $645,300 2.5%TOTAL SECRETARY OF STATE [1-FY02][14-FY04] $36,442,206 3.4% $50,064,820 37.4% $54,026,461 7.9% $75,312,846 39.4% $83,119,000 10.4% $89,216,000 7.3% $95,912,000 7.5%PRIVATE SCHOOL LICENSES $156,485 9.8% $181,009 15.7% $207,145 14.4% $251,705 21.5% $268,600 6.7% $288,900 7.6% $309,400 7.1%PRIVATE EMPLOYMENT AGENCY $29,800 -5.4% $29,000 -2.7% $29,100 0.3% $26,000 -10.7% $13,800 -46.9% $13,800 $13,800TOTAL REAL ESTATE [2-FY02][15-FY04][16-FY04] $1,451,867 -4.4% $1,690,734 16.5% $1,548,788 -8.4% $2,653,740 71.3% $2,429,000 -8.5% $2,804,000 15.4% $2,567,000 -8.5%TOTAL FINANCIAL INSTITUTIONS [1-FY01] [16-FY04] $1,626,149 7.5% $1,795,162 10.4% $1,926,415 7.3%ATHLETIC COMMISSION FEES [5-FY02] $2,853,655 1.2% $1,706,730 -40.2% $1,901,357 11.4% $2,258,306 18.8% $1,700,000 -24.7% $1,700,000 $1,700,000
TOTAL LICENSES $50,112,496 3.6% $63,885,422 27.5% $70,323,520 10.1% $91,675,929 30.4% $99,269,000 8.3% $106,894,100 7.7% $114,025,800 6.7%
FEES AND FINESVITAL STATISTICS FEES [17-FY04] $534,243 2.1% $576,967 8.0% $647,213 12.2% $759,587 17.4% $784,700 3.3% $809,800 3.2% $834,100 3.0%DIVORCE FEES $203,454 1.4% $196,953 -3.2% $201,070 2.1% $205,535 2.2% $209,100 1.7% $215,000 2.8% $220,900 2.7%CIVIL ACTION FEES $1,215,362 2.0% $1,250,147 2.9% $1,322,518 5.8% $1,376,653 4.1% $1,423,000 3.4% $1,469,300 3.3% $1,515,700 3.2%INSURANCE FEES $537,507 -27.2% $719,183 33.8% $617,132 -14.2% $624,149 1.1% $624,100 0.0% $624,100 $624,100TOTAL REAL ESTATE FEES $388,128 -10.9% $397,274 2.4% $436,415 9.9% $1,097,847 151.6% $1,154,000 5.1% $1,245,300 7.9% $1,313,300 5.5%SHORT-TERM CAR LEASE [2-FY02] $8,288,217 0.2% $19,662,998 137.2% $22,208,165 12.9% $25,638,556 15.4% $27,177,000 6.0% $28,672,000 5.5% $30,105,000 5.0%ATHLETIC COMMISSION LICENSES/FINES [5-FY02] $122,908 $210,920 71.6% $109,825 -47.9% $110,000 0.2% $110,000 $110,000WATER PLANNING FEES [4-FY02] $21,069 31.6%STATE ENGINEER SALES $1,588,378 4.6% $1,572,066 -1.0% $1,590,428 1.2% $1,698,473 6.8% $1,532,000 -9.8% $1,532,000 $1,532,000SUPREME COURT FEES $204,075 -12.2% $207,830 1.8% $212,035 2.0% $219,042 3.3% $223,000 1.8% $227,000 1.8% $231,100 1.8%MISC. FINES/FORFEITURES $136,957 16.4% $172,541 26.0% $350,947 103.4% $261,421 -25.5% $250,200 -4.3% $261,200 4.4% $272,300 4.2%
TOTAL FEES AND FINES $13,117,391 -1.0% $24,878,868 89.7% $27,796,842 11.7% $31,991,088 15.1% $33,487,100 4.7% $35,165,700 5.0% $36,758,500 4.5%
USE OF MONEY AND PROPERTYLYON COUNTY REPAYMENTS $177,450OTHER REPAYMENTS [7-FY02][8-FY02][18-FY04] $1,118,866 -2.4% $931,938 -16.7% $2,405,277 158.1% $2,008,738 -16.5% $2,009,503 0.0% $2,110,318 5.0% $2,161,185 2.4%MARLETTE REPAYMENT $10,483 65.4% $10,512 0.3% $10,512 $10,512 $10,512 $10,512 $10,512INTEREST INCOME $26,333,458 34.0% $12,501,357 -52.5% $5,990,047 -52.1% $4,528,633 -24.4% $10,570,000 133.4% $11,339,000 7.3% $10,090,000 -11.0%
TOTAL USE OF MONEY AND PROPERTY $27,640,257 32.9% $13,443,808 -51.4% $8,405,836 -37.5% $6,547,883 -22.1% $12,590,015 92.3% $13,459,830 6.9% $12,261,697 -8.9%
OTHER REVENUEHOOVER DAM REVENUE $300,000 $300,000 $300,000 $300,000 $300,000 $300,000 $300,000MISC. SALES AND REFUNDS $4,515,462 84.6% $1,431,898 -68.3% $932,709 -34.9% $899,132 -3.6% $871,050 -3.1% $921,550 5.8% $881,650 -4.3%COST RECOVERY PLAN $4,251,236 -2.9% $5,006,463 17.8% $5,004,477 0.0% $9,714,586 94.1% $9,856,700 1.5% $9,856,700 $9,856,700PETROLEUM INSPECTION FEES $516,320 -3.5% $550,736 6.7% $563,727 2.4% $557,966 -1.0% $558,000 0.0% $558,000 $558,000UNCLAIMED PROPERTY [9-FY02] $10,078,369 30.4% $19,328,933 91.8% $16,014,824 -17.1% $19,611,605 22.5% $19,604,500 0.0% $16,076,900 -18.0% $16,236,500 1.0%
TOTAL OTHER REVENUE $19,661,386 27.8% $26,618,030 35.4% $22,815,737 -14.3% $31,083,289 36.2% $31,190,250 0.3% $27,713,150 -11.1% $27,832,850 0.4%
TOTAL GENERAL FUND REVENUE $1,734,116,512 5.3% $1,751,957,967 1.0% $1,825,353,940 4.2% $2,404,005,956 31.7% $2,637,249,565 9.7% $2,793,399,380 5.9% $2,963,425,747 6.1%
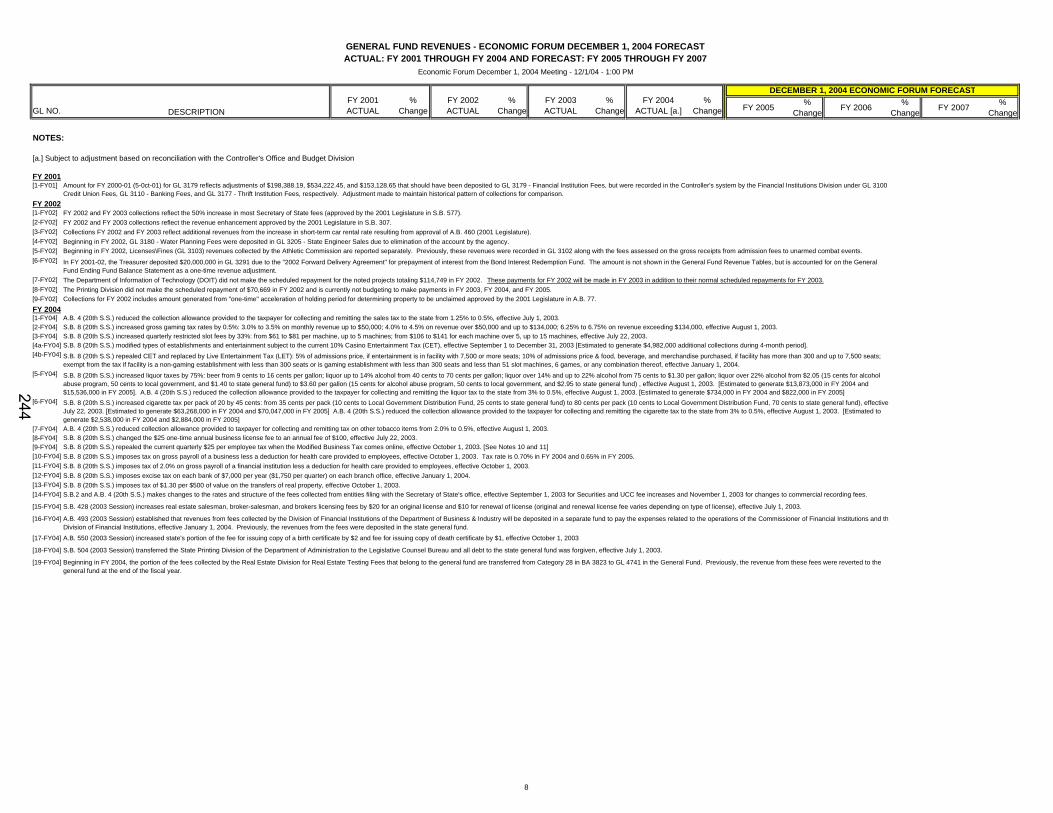
GENERAL FUND REVENUES - ECONOMIC FORUM DECEMBER 1, 2004 FORECAST
DECEMBER 1, 2004 ECONOMIC FORUM FORECAST
ACTUAL: FY 2001 THROUGH FY 2004 AND FORECAST: FY 2005 THROUGH FY 2007Economic Forum December 1, 2004 Meeting - 12/1/04 - 1:00 PM
1
243
GL NO. DESCRIPTIONFY 2001 ACTUAL
% Change
FY 2002 ACTUAL
% Change
FY 2003 ACTUAL
% Change
FY 2004 ACTUAL [a.]
% Change FY 2005 %
Change FY 2006 % Change FY 2007 %
Change
GENERAL FUND REVENUES - ECONOMIC FORUM DECEMBER 1, 2004 FORECAST
DECEMBER 1, 2004 ECONOMIC FORUM FORECAST
ACTUAL: FY 2001 THROUGH FY 2004 AND FORECAST: FY 2005 THROUGH FY 2007Economic Forum December 1, 2004 Meeting - 12/1/04 - 1:00 PM
NOTES:
[a.] Subject to adjustment based on reconciliation with the Controller's Office and Budget Division
FY 2001[1-FY01]
FY 2002[1-FY02] FY 2002 and FY 2003 collections reflect the 50% increase in most Secretary of State fees (approved by the 2001 Legislature in S.B. 577).[2-FY02] FY 2002 and FY 2003 collections reflect the revenue enhancement approved by the 2001 Legislature in S.B. 307.[3-FY02][4-FY02][5-FY02][6-FY02]
[7-FY02][8-FY02][9-FY02]FY 2004[1-FY04] A.B. 4 (20th S.S.) reduced the collection allowance provided to the taxpayer for collecting and remitting the sales tax to the state from 1.25% to 0.5%, effective July 1, 2003.[2-FY04] S.B. 8 (20th S.S.) increased gross gaming tax rates by 0.5%: 3.0% to 3.5% on monthly revenue up to $50,000; 4.0% to 4.5% on revenue over $50,000 and up to $134,000; 6.25% to 6.75% on revenue exceeding $134,000, effective August 1, 2003.[3-FY04] S.B. 8 (20th S.S.) increased quarterly restricted slot fees by 33%: from $61 to $81 per machine, up to 5 machines; from $106 to $141 for each machine over 5, up to 15 machines, effective July 22, 2003.[4a-FY04] S.B. 8 (20th S.S.) modified types of establishments and entertainment subject to the current 10% Casino Entertainment Tax (CET), effective September 1 to December 31, 2003 [Estimated to generate $4,982,000 additional collections during 4-month period].[4b-FY04]
[5-FY04]
[6-FY04]
[7-FY04][8-FY04][9-FY04][10-FY04][11-FY04][12-FY04][13-FY04][14-FY04]
[15-FY04]
[16-FY04]
[17-FY04]
[18-FY04]
[19-FY04]
A.B. 493 (2003 Session) established that revenues from fees collected by the Division of Financial Institutions of the Department of Business & Industry will be deposited in a separate fund to pay the expenses related to the operations of the Commissioner of Financial Institutions and thDivision of Financial Institutions, effective January 1, 2004. Previously, the revenues from the fees were deposited in the state general fund.A.B. 550 (2003 Session) increased state's portion of the fee for issuing copy of a birth certificate by $2 and fee for issuing copy of death certificate by $1, effective October 1, 2003
S.B. 504 (2003 Session) transferred the State Printing Division of the Department of Administration to the Legislative Counsel Bureau and all debt to the state general fund was forgiven, effective July 1, 2003.
Beginning in FY 2004, the portion of the fees collected by the Real Estate Division for Real Estate Testing Fees that belong to the general fund are transferred from Category 28 in BA 3823 to GL 4741 in the General Fund. Previously, the revenue from these fees were reverted to the general fund at the end of the fiscal year.
S.B. 8 (20th S.S.) repealed the current quarterly $25 per employee tax when the Modified Business Tax comes online, effective October 1, 2003. [See Notes 10 and 11]S.B. 8 (20th S.S.) imposes tax on gross payroll of a business less a deduction for health care provided to employees, effective October 1, 2003. Tax rate is 0.70% in FY 2004 and 0.65% in FY 2005.
S.B.2 and A.B. 4 (20th S.S.) makes changes to the rates and structure of the fees collected from entities filing with the Secretary of State's office, effective September 1, 2003 for Securities and UCC fee increases and November 1, 2003 for changes to commercial recording fees.
S.B. 428 (2003 Session) increases real estate salesman, broker-salesman, and brokers licensing fees by $20 for an original license and $10 for renewal of license (original and renewal license fee varies depending on type of license), effective July 1, 2003.
S.B. 8 (20th S.S.) imposes tax of $1.30 per $500 of value on the transfers of real property, effective October 1, 2003.
S.B. 8 (20th S.S.) imposes tax of 2.0% on gross payroll of a financial institution less a deduction for health care provided to employees, effective October 1, 2003.S.B. 8 (20th S.S.) imposes excise tax on each bank of $7,000 per year ($1,750 per quarter) on each branch office, effective January 1, 2004.
The Printing Division did not make the scheduled repayment of $70,669 in FY 2002 and is currently not budgeting to make payments in FY 2003, FY 2004, and FY 2005.Collections for FY 2002 includes amount generated from "one-time" acceleration of holding period for determining property to be unclaimed approved by the 2001 Legislature in A.B. 77.
S.B. 8 (20th S.S.) repealed CET and replaced by Live Entertainment Tax (LET): 5% of admissions price, if entertainment is in facility with 7,500 or more seats; 10% of admissions price & food, beverage, and merchandise purchased, if facility has more than 300 and up to 7,500 seats; exempt from the tax if facility is a non-gaming establishment with less than 300 seats or is gaming establishment with less than 300 seats and less than 51 slot machines, 6 games, or any combination thereof, effective January 1, 2004.S.B. 8 (20th S.S.) increased liquor taxes by 75%: beer from 9 cents to 16 cents per gallon; liquor up to 14% alcohol from 40 cents to 70 cents per gallon; liquor over 14% and up to 22% alcohol from 75 cents to $1.30 per gallon; liquor over 22% alcohol from $2.05 (15 cents for alcohol abuse program, 50 cents to local government, and $1.40 to state general fund) to $3.60 per gallon (15 cents for alcohol abuse program, 50 cents to local government, and $2.95 to state general fund) , effective August 1, 2003. [Estimated to generate $13,873,000 in FY 2004 and $15,536,000 in FY 2005]. A.B. 4 (20th S.S.) reduced the collection allowance provided to the taxpayer for collecting and remitting the liquor tax to the state from 3% to 0.5%, effective August 1, 2003. [Estimated to generate $734,000 in FY 2004 and $822,000 in FY 2005]
Beginning in FY 2002, GL 3180 - Water Planning Fees were deposited in GL 3205 - State Engineer Sales due to elimination of the account by the agency.Beginning in FY 2002, Licenses\Fines (GL 3103) revenues collected by the Athletic Commission are reported separately. Previously, these revenues were recorded in GL 3102 along with the fees assessed on the gross receipts from admission fees to unarmed combat events.
In FY 2001-02, the Treasurer deposited $20,000,000 in GL 3291 due to the "2002 Forward Delivery Agreement" for prepayment of interest from the Bond Interest Redemption Fund. The amount is not shown in the General Fund Revenue Tables, but is accounted for on the General Fund Ending Fund Balance Statement as a one-time revenue adjustment.The Department of Information of Technology (DOIT) did not make the scheduled repayment for the noted projects totaling $114,749 in FY 2002. These payments for FY 2002 will be made in FY 2003 in addition to their normal scheduled repayments for FY 2003.
S.B. 8 (20th S.S.) increased cigarette tax per pack of 20 by 45 cents: from 35 cents per pack (10 cents to Local Government Distribution Fund, 25 cents to state general fund) to 80 cents per pack (10 cents to Local Government Distribution Fund, 70 cents to state general fund), effectiveJuly 22, 2003. [Estimated to generate $63,268,000 in FY 2004 and $70,047,000 in FY 2005] A.B. 4 (20th S.S.) reduced the collection allowance provided to the taxpayer for collecting and remitting the cigarette tax to the state from 3% to 0.5%, effective August 1, 2003. [Estimated to generate $2,538,000 in FY 2004 and $2,884,000 in FY 2005]A.B. 4 (20th S.S.) reduced collection allowance provided to taxpayer for collecting and remitting tax on other tobacco items from 2.0% to 0.5%, effective August 1, 2003.S.B. 8 (20th S.S.) changed the $25 one-time annual business license fee to an annual fee of $100, effective July 22, 2003.
Amount for FY 2000-01 (5-0ct-01) for GL 3179 reflects adjustments of $198,388.19, $534,222.45, and $153,128.65 that should have been deposited to GL 3179 - Financial Institution Fees, but were recorded in the Controller's system by the Financial Institutions Division under GL 3100 Credit Union Fees, GL 3110 - Banking Fees, and GL 3177 - Thrift Institution Fees, respectively. Adjustment made to maintain historical pattern of collections for comparison.
Collections FY 2002 and FY 2003 reflect additional revenues from the increase in short-term car rental rate resulting from approval of A.B. 460 (2001 Legislature).
8
244