STATE OF NEVADA ECONOMIC FORUM FORECAST OF FUTURE STATE REVENUES December 6, 2016

Welcome message from author
This document is posted to help you gain knowledge. Please leave a comment to let me know what you think about it! Share it to your friends and learn new things together.
Transcript
STATE OF NEVADA
ECONOMIC FORUM
FORECAST OF FUTURE
STATE REVENUES
December 6, 2016


1
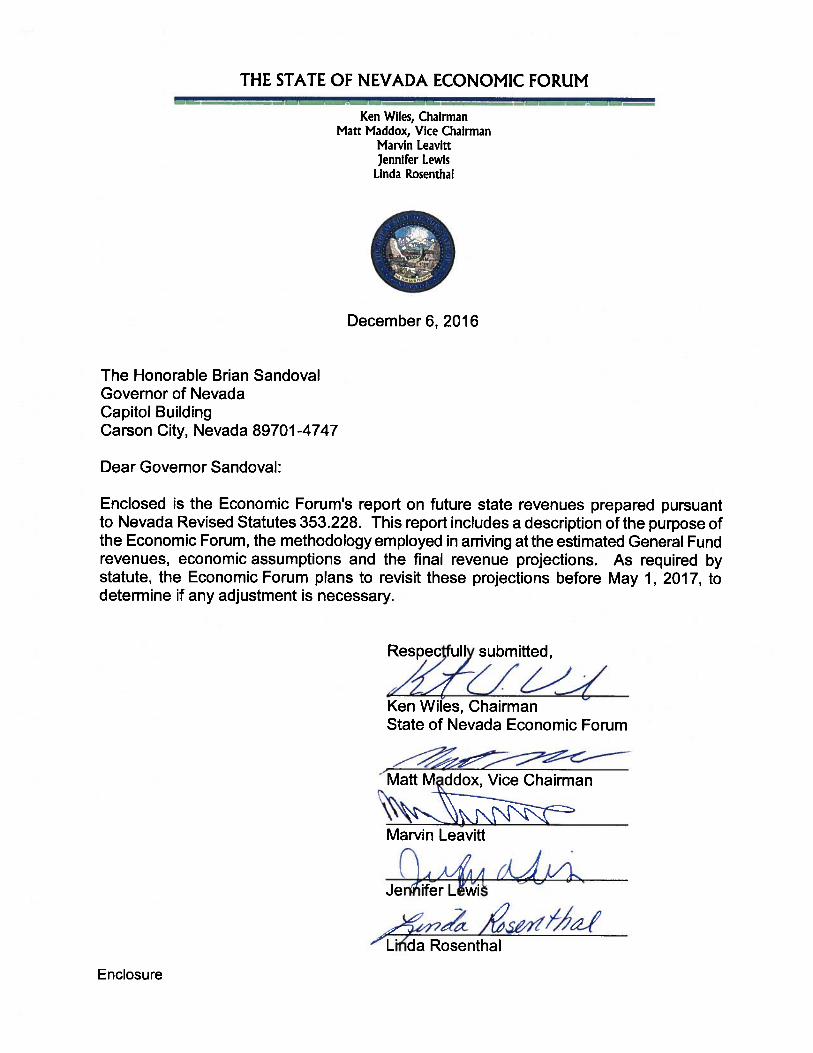
REPORT TO THE GOVERNOR AND THE LEGISLATURE ON FUTURE STATE REVENUES December 6, 2016
Senate Bill 23 (1993) provided for the creation of an Economic Forum to forecast future
State General Fund revenues. The Forum, a panel of five representatives from the
private sector with backgrounds in economics, business, and taxation, is required to
adopt an official forecast of unrestricted General Fund revenues for the biennial budget
cycle. All agencies of the state, including the Governor and the Legislature, must use
the Forum's forecast. A seven-member Technical Advisory Committee made up of
Executive and Legislative Branch staff members as well as a representative of local
government was also created in S.B. 23 to provide assistance and resources to the
Forum.
The Forum must submit its forecast to the Governor and the Legislature by December 3
of each even-numbered year, and any required revisions by May 1 of each
odd-numbered year; however, if either of these dates falls on a weekend or a holiday,
the Forum must submit its forecast to the Governor and the Legislature no later than the
second business day following these dates. Since December 3, 2016, falls on a
Saturday, the Forum must submit its forecast to the Governor and the Legislature by
December 6, 2016.
This report includes the December 6, 2016, forecast of unrestricted General Fund
revenues for Fiscal Years 2017, 2018, and 2019.
2
Methodology and Procedures Based on the provisions of Assembly Bill 332 (2011), the Forum is required to hold
two additional informational meetings during each biennium to consider current
economic indicators and update the status of actual General Fund revenues compared
to the most recent revenue estimates made by the Forum. These two informational
meetings of the Forum were held on December 10, 2015, and June 9, 2016. These
interim meetings allowed the Forum to receive regular updates on current economic
conditions and the outlook for the state’s economy while also tracking the actual
FY 2015 and FY 2016 revenues against the Forum’s May 2015 forecast. During these
meetings, the Forum reviewed various economic indicators and received a series of
presentations from Legislative Counsel Bureau staff and several Executive Branch
agencies, including the Department of Taxation; the Department of Employment,
Training and Rehabilitation; the Department of Business and Industry; and the
Governor’s Office of Economic Development.
Governor Sandoval appointed the five members of the Economic Forum in 2016 for a
two-year term. These appointments include two members nominated by the leadership
of the Senate and Assembly. The Forum has since held public meetings three times on
October 7, 2016, November 10, 2016, and December 6, 2016, to complete its assigned
responsibilities and duties regarding the approval of forecasts of unrestricted
General Fund revenues for Fiscal Years 2017, 2018, and 2019.
The first meeting of the Forum on October 7, 2016, was devoted to organizing and
reviewing the assigned tasks; reviewing the accuracy of forecasts prepared in
December 2014 and May 2015; and determining a course of action for future meetings.
The Forum also reviewed historical taxable sales and gaming market statistics and
received presentations on a variety of subjects related to the Nevada economy, such as
residential real estate trends; economic development programs available through the
Governor’s Office of Economic Development; state Medicaid enrollment and health
insurance trends related to the Affordable Care Act; and the Nevada New Markets Jobs
Act.
3
During the November 10, 2016, meeting, the Forum received presentations on the
outlook for the national, state, and local economies. Daniel White, Economist,
Moody’s Analytics (an economic consulting firm under contract with the state), provided
a national, regional and Nevada economic outlook; Bill Anderson, Chief Economist,
Nevada Department of Employment, Training and Rehabilitation, provided an update to
Nevada’s employment and unemployment outlook; and Jeff Hardcastle,
State Demographer, provided an outlook for Nevada’s population.
At the meeting of the Forum on November 10, 2016, the Budget Division of the
Governor’s Office of Finance (Budget Division) and the Fiscal Analysis Division of the
Legislative Counsel Bureau (Fiscal Analysis Division) provided preliminary projections
and economic analysis for eight major General Fund revenues. The Department of
Taxation and the Gaming Control Board also provided projections and analysis
concerning the major revenues for which they are responsible to collect. In addition to
the state agency information, the Forum received forecasts of gaming percentage fees
and sales taxes from Moody’s Analytics (Moody’s). The Forum also received forecasts
of all non-major General Fund revenues developed by the Technical Advisory
Committee for the Forum’s review and consideration.
The Economic Forum reviewed the forecast information and requested that any updated
forecasts and information be provided at the meeting on December 6, 2016. At that
time, the Forum directed the Technical Advisory Committee to prepare forecasts for
non-major revenues based on projections by individual state agencies, the
Budget Division, and the Fiscal Analysis Division.
At the December 6, 2016, meeting, the Forum received revised forecasts and economic
analysis from the Budget Division, Fiscal Analysis Division, Department of Taxation,
Gaming Control Board and the Technical Advisory Committee, which were used to
produce the binding forecast of all unrestricted General Fund revenue. A copy of the
Economic Forum’s official December 6, 2016, forecast is provided in the attached table.
A final meeting of the Forum will be scheduled during the 79th Legislative Session, on or
before May 1, 2017, to make any necessary revisions to the December 6, 2016,
forecast.
4
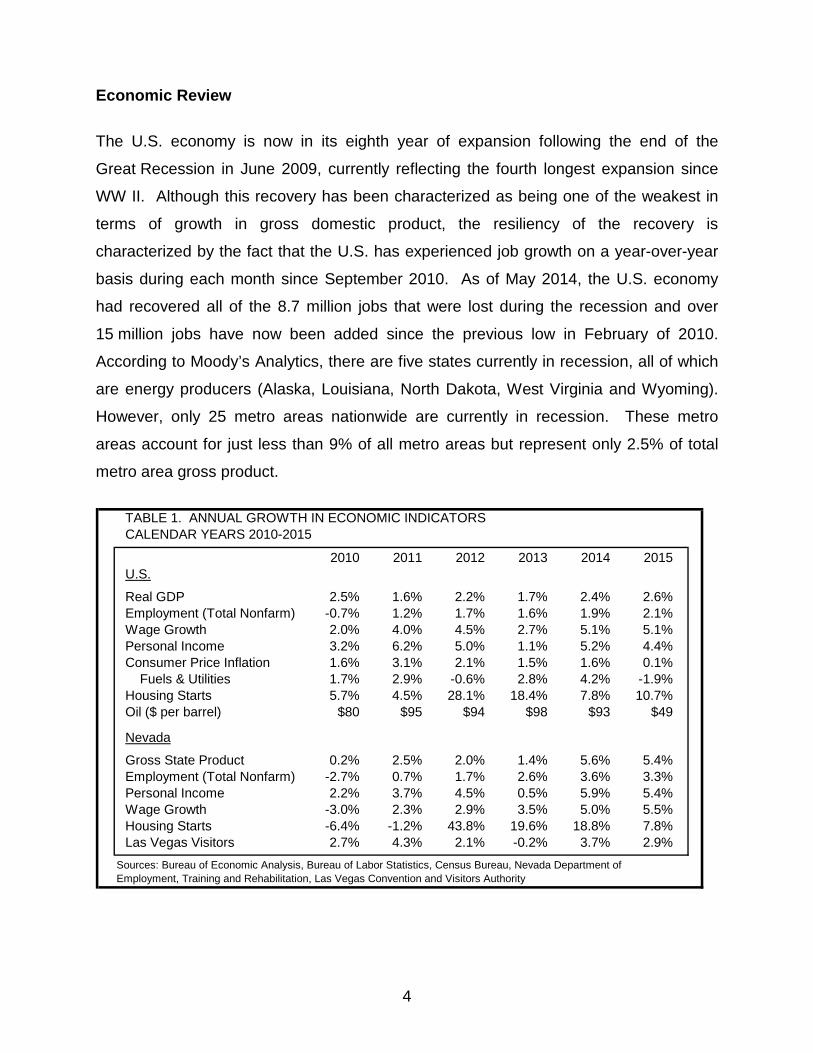
Economic Review
The U.S. economy is now in its eighth year of expansion following the end of the
Great Recession in June 2009, currently reflecting the fourth longest expansion since
WW II. Although this recovery has been characterized as being one of the weakest in
terms of growth in gross domestic product, the resiliency of the recovery is
characterized by the fact that the U.S. has experienced job growth on a year-over-year
basis during each month since September 2010. As of May 2014, the U.S. economy
had recovered all of the 8.7 million jobs that were lost during the recession and over
15 million jobs have now been added since the previous low in February of 2010.
According to Moody’s Analytics, there are five states currently in recession, all of which
are energy producers (Alaska, Louisiana, North Dakota, West Virginia and Wyoming).
However, only 25 metro areas nationwide are currently in recession. These metro
areas account for just less than 9% of all metro areas but represent only 2.5% of total
metro area gross product.
TABLE 1. ANNUAL GROWTH IN ECONOMIC INDICATORSCALENDAR YEARS 2010-2015
2010 2011 2012 2013 2014 2015U.S.
Real GDP 2.5% 1.6% 2.2% 1.7% 2.4% 2.6%Employment (Total Nonfarm) -0.7% 1.2% 1.7% 1.6% 1.9% 2.1%Wage Growth 2.0% 4.0% 4.5% 2.7% 5.1% 5.1%Personal Income 3.2% 6.2% 5.0% 1.1% 5.2% 4.4%Consumer Price Inflation 1.6% 3.1% 2.1% 1.5% 1.6% 0.1% Fuels & Utilities 1.7% 2.9% -0.6% 2.8% 4.2% -1.9%Housing Starts 5.7% 4.5% 28.1% 18.4% 7.8% 10.7%Oil ($ per barrel) $80 $95 $94 $98 $93 $49
Nevada
Gross State Product 0.2% 2.5% 2.0% 1.4% 5.6% 5.4%Employment (Total Nonfarm) -2.7% 0.7% 1.7% 2.6% 3.6% 3.3%Personal Income 2.2% 3.7% 4.5% 0.5% 5.9% 5.4%Wage Growth -3.0% 2.3% 2.9% 3.5% 5.0% 5.5%Housing Starts -6.4% -1.2% 43.8% 19.6% 18.8% 7.8%Las Vegas Visitors 2.7% 4.3% 2.1% -0.2% 3.7% 2.9%
Sources: Bureau of Economic Analysis, Bureau of Labor Statistics, Census Bureau, Nevada Department of Employment, Training and Rehabilitation, Las Vegas Convention and Visitors Authority
5
During 2012 and 2013, economic growth was at times sluggish and uncertainty lingered
regarding the speed at which the economy would recover from the recession as real
GDP growth slowed from to 2.2% in 2012 to 1.7% in 2013. The slower pace of growth
nationally in 2013 was also evident in other economic indicators including employment,
wages, and personal income. The slower growth in both wages and personal income
was due in part to several policy changes, such as a 2.0 percent increase in the federal
payroll tax, mandatory federal spending cuts, and the expiration of federal
unemployment benefits, all of which took effect in January 2013. The impacts of the
federal government shutdown at the end of 2013 also contributed to the slower overall
growth in 2013 compared to 2012.
Although unemployment continued to decline, concerns regarding the labor force
participation rate impacted the outlook regarding long-term job growth. Concerns were
also raised about the risks of higher inflation after several rounds of quantitative easing
by the Federal Reserve which caused significant increases in the money supply
between late 2008 and 2012. However, through 2014 those concerns were not
actualized as job growth accelerated to 1.9 percent and price increases remained
relatively low. In fact, by 2015 a considerable drop in oil prices from over $90 per barrel
to just $49 per barrel contributed to lower prices for goods and services throughout the
rest of the economy and helped to push the Consumer Price Index (CPI) down to just
0.1 percent.
Job growth nationwide started to occur in the fourth quarter of 2011 and has been
gaining momentum throughout the recovery. In 2012 and 2013, job growth averaged
186,000 and 194,000 jobs per month, respectively. Annual job growth increased from
1.6 percent in 2013 to 1.9 percent in 2014 with an average of 213,000 jobs created per
month in 2014. The rate of job growth increased to 2.1 percent in 2015 with an average
of 241,000 jobs created per month in 2015.
Commensurate with the increases in employment, wage growth nationally exceeded
5.0 percent in both 2014 and 2015, and growth in personal income has been above
4.0 percent in three out of the previous 4 years, in spite of a relatively low inflation rate
during the last several years. (The Consumer Price Index, or CPI, grew by only
6
0.1 percent in 2015, after growing by 2.1 percent in 2012, 1.5 percent in 2013, and
1.6 percent in 2014.) With inflation expected to increase by rates in excess of
2.0 percent in 2017, 2018, and 2019, wages and personal income are expected to see
continued increases as well. Growth Moderates in 2016
After several years of moderate gains, a slowing pace of job growth in the U.S. has
been occurring for nearly the past two years as the monthly average job growth
nationwide slowed from 251,000 per month in 2014 to 229,000 in 2015 and 181,000 so
far in 2016. Although the economy continues to create jobs at a relatively solid pace,
some industries are beginning to face challenges combined with the diminishing
availability of qualified workers as the economy continues to edge toward full
employment.
In Nevada, where economic recovery started later than the other 49 states and was
initially considerably slower than what was seen elsewhere in the nation, signs of
recovery have become more evident in 2016. Though it took more than two years
longer than the nation as a whole to do so, Nevada’s job market finally recovered the
186,400 jobs lost during the Great Recession by September 2016. These job gains,
coupled with increases in wages and visitor growth, have led to continued moderate
growth in Nevada’s economy during the current year.
When the Economic Forum last produced a report in December 2014, the state of
Nevada had added nearly 90,000 jobs since the end of the recession, but was still more
than 8.0 percent, or close to 100,000 jobs, below the pre-recession peak of 1.3 million
jobs during the second quarter of 2007. The job growth that had started at the
beginning of 2011, and which continued through 2012 and 2013, continued through
2014 and beyond, with total employment increasing by 3.6 percent in 2014 and
3.3 percent in 2015. Average statewide employment increased by approximately
42,500 jobs in 2014 and 40,600 jobs in 2015, driven by increases in several sectors,
including professional services; trade, transportation, and utilities; leisure and
hospitality; education and health services; and construction.
7
The job growth seen in Nevada since 2011, and particularly during 2014 and 2015, has
also translated to increases in wages for Nevada employees. Total Nevada wages,
after having increased by 2.9 percent in 2012 and 3.5 percent in 2013, increased by
5.0 percent in 2014 and 5.5 percent in 2015. As observed at the federal level, with the
low rates of increase in the CPI (1.6 percent in 2014 and 0.1 percent in 2015), these
increases in total Nevada wages indicate that the wages are also increasing in
inflation-adjusted terms.
Further contributing to the economic recovery in Nevada is the growth in visitors since
the end of the Great Recession. After hitting a pre-recession peak of 39.2 million
visitors to Las Vegas in 2007, annual visitation fell to a low of 36.4 million in 2009 before
climbing steadily upward. By 2012, annual visitation had surpassed the pre-recession
peak, and in 2015, more than 42 million visitors to Las Vegas were reported by the
Las Vegas Convention and Visitors Authority. Visitation for the first nine months of
2016 are also continuing this upward trend, with 1.8 percent more visitors reported
compared to the same period in 2015.
Though present economic conditions, as well as the prospects of future growth resulting
from economic development projects in both Northern and Southern Nevada, are
encouraging signs for the near future in Nevada, housing affordability and supply
remain concerns for residents of the state, particularly in the urban areas around
Las Vegas and Reno. Additionally, current uncertainty in the national and global
economy resulting from the Brexit vote and the U.S. federal elections in 2016 may affect
growth in the national economy as well as at the regional and state level. Changes in
U.S. monetary policy may impact inflation and interest rates which can affect the
economic growth in both the consumer and business sectors.
8
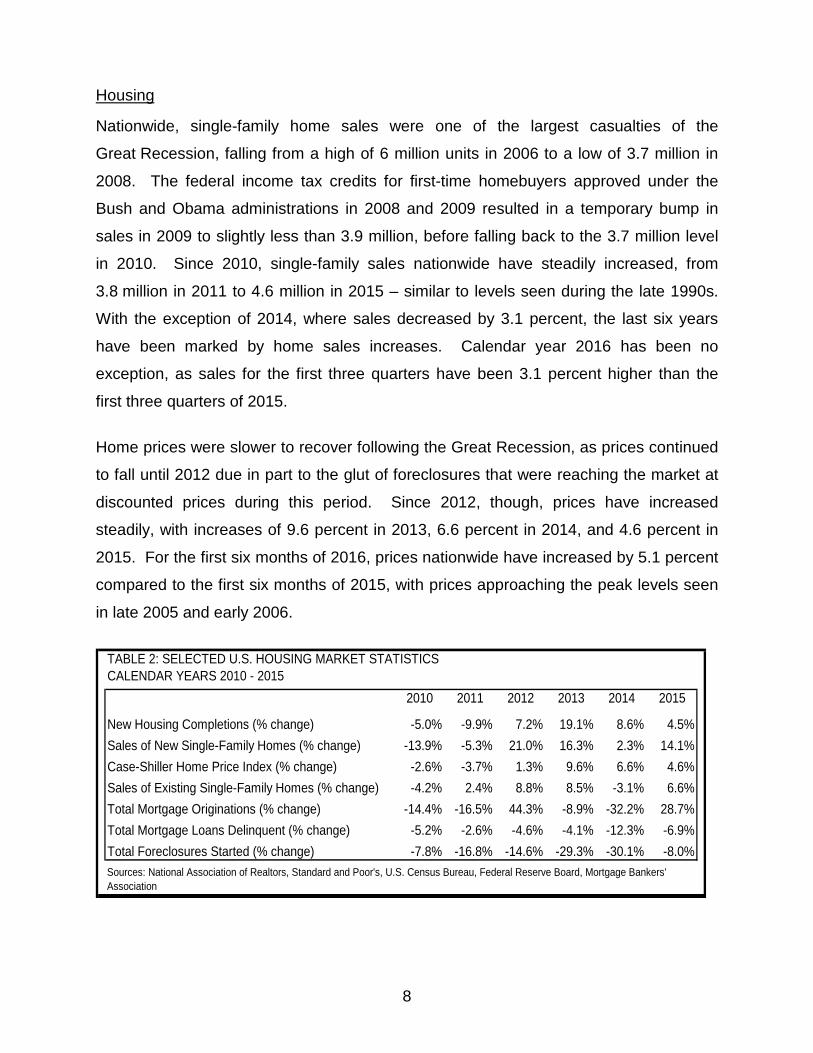
Housing Nationwide, single-family home sales were one of the largest casualties of the
Great Recession, falling from a high of 6 million units in 2006 to a low of 3.7 million in
2008. The federal income tax credits for first-time homebuyers approved under the
Bush and Obama administrations in 2008 and 2009 resulted in a temporary bump in
sales in 2009 to slightly less than 3.9 million, before falling back to the 3.7 million level
in 2010. Since 2010, single-family sales nationwide have steadily increased, from
3.8 million in 2011 to 4.6 million in 2015 – similar to levels seen during the late 1990s.
With the exception of 2014, where sales decreased by 3.1 percent, the last six years
have been marked by home sales increases. Calendar year 2016 has been no
exception, as sales for the first three quarters have been 3.1 percent higher than the
first three quarters of 2015.
Home prices were slower to recover following the Great Recession, as prices continued
to fall until 2012 due in part to the glut of foreclosures that were reaching the market at
discounted prices during this period. Since 2012, though, prices have increased
steadily, with increases of 9.6 percent in 2013, 6.6 percent in 2014, and 4.6 percent in
2015. For the first six months of 2016, prices nationwide have increased by 5.1 percent
compared to the first six months of 2015, with prices approaching the peak levels seen
in late 2005 and early 2006.
TABLE 2: SELECTED U.S. HOUSING MARKET STATISTICSCALENDAR YEARS 2010 - 2015
2010 2011 2012 2013 2014 2015 New Housing Completions (% change) -5.0% -9.9% 7.2% 19.1% 8.6% 4.5%Sales of New Single-Family Homes (% change) -13.9% -5.3% 21.0% 16.3% 2.3% 14.1%Case-Shiller Home Price Index (% change) -2.6% -3.7% 1.3% 9.6% 6.6% 4.6%Sales of Existing Single-Family Homes (% change) -4.2% 2.4% 8.8% 8.5% -3.1% 6.6%Total Mortgage Originations (% change) -14.4% -16.5% 44.3% -8.9% -32.2% 28.7%Total Mortgage Loans Delinquent (% change) -5.2% -2.6% -4.6% -4.1% -12.3% -6.9%Total Foreclosures Started (% change) -7.8% -16.8% -14.6% -29.3% -30.1% -8.0%Sources: National Association of Realtors, Standard and Poor's, U.S. Census Bureau, Federal Reserve Board, Mortgage Bankers' Association
9
As a result of the Great Recession, new single-family home completions in 2011 were at
their lowest level in nearly fifty years with a total of only 443,000 units completed.
This total has steadily increased since that year – to 478,000 in 2012; 569,000 in 2013;
619,000 in 2014; and nearly 647,000 in 2015. For calendar year 2016, Moody’s
forecasts continued growth in single-family home completions nationwide – growth of
14.9 percent for 2016 corresponds to approximately 743,000 units completed; however,
this total is still lower than any year since 1982, when single-family home completions
were slightly more than 630,000.
In contrast to the national housing market, where single-family home sales have trended
upwards, Nevada existing single-family home sales have steadily decreased. Due to a
high level of foreclosures hitting the market during the early part of this decade, sales in
Nevada reached an all-time high of 91,000 in 2011. As these foreclosed homes have
cleared the market, though, the number of sales has steadily decreased, reaching a
level of slightly less than 68,000 sales in 2015. For 2016, Moody’s forecasts that sales
in Nevada will be 61,000 units, a 10.7 percent decrease compared to 2015, further
continuing the downward trend.
During 2011 and 2012, single-family home prices were at mid-1990s levels in Nevada,
due in part to the effect of foreclosures on the market. As these homes have cleared
the market, prices have predictably increased – the Case-Shiller index has increased for
three consecutive years (2013, 2014, and 2015), reaching an average price level
equivalent to home prices in late 2003 and early 2004. Thus far in 2016, the index is
continuing to increase, which has led to renewed concerns relating to affordability of
single-family homes in the state; however, the data from the second quarter of 2016
suggests that home prices are still closer to the prices seen in 2004 than to the peak
levels seen in mid-2006.
Single-family home completions, which had decreased from a high of 38,000 units in
2004 to a low of 5,100 units in 2011, have steadily increased since reaching bottom,
with increases of 12.7 percent in 2012, 40.9 percent in 2013, 6.4 percent in 2014, and
14.9 percent in 2015. Despite four straight years of increases, however, statewide
10
completions barely reached 10,000 units by the end of 2015, which is still one quarter of
the 2006 peak and less than half of the completion levels seen during the mid-1990s. Inflation
Shortly before the December 2014 meeting of the Economic Forum, the Federal
Reserve ended its third round of “quantitative easing” – the creation of additional
U.S. currency for the purposes of repurchasing debt held by the U.S. The repurchase
of trillions of dollars of federal debt and securities over the three rounds of quantitative
easing led to concerns of inflation increases; however, those concerns ended up being
unfounded, as inflation has grown only modestly since 2010. Following a decrease of
0.3 percent in 2009, inflation grew by only 1.6 percent in 2010, 3.1 percent in 2011,
2.1 percent in 2012, 1.3 percent in 2013, and 1.6 percent in 2014.
In December of 2015, the Federal Reserve’s Open Markets Committee increased the
federal funds rate – the rate at which banks may borrow money from the Federal
Reserve Bank – by 0.25 percent, which was the first increase in the rate since 2006,
and the first actions taken by the Fed to tighten monetary policy since before the first
round of quantitative easing began in 2008. This action came at the end of a year in
which inflation increased by only 0.1 percent compared to 2014. The low rate of inflation in 2015 also was greatly affected by the price of oil. Average
crude oil prices, as measured by the West Texas Intermediate Spot rate, decreased
from a high of $106 per barrel in the third quarter of 2013 to an average of $42 per
barrel by the fourth quarter of 2015, with the average price decreasing from $98 in 2013
to $48 in 2015. The average price continued to fall in 2016 to an average of less than
$34 in the first quarter, but increased into the mid-$40 range through the second and
third quarters and reached above $50 per barrel by October of this year. Moody’s has
forecasted oil to continue increasing in 2017 and 2018 to prices in excess of $60 per
barrel; however, short-term price fluctuations after the November elections in the U.S.
have resulted in price decreases that may affect subsequent forecasts.
11
Through the first three quarters of 2016, the CPI has increased by 1.1 percent. With a
projected increase of 1.4 percent in the fourth quarter, Moody’s forecasts that the CPI
will increase by 1.2 percent for calendar year 2016. Moody’s is forecasting the CPI to
increase by 2.5 percent in 2017, 2.7 percent in 2018, and 2.8 percent in 2019.
Employment After six years of steady declines, the U.S. unemployment rate, which hit a high of
10.0 percent in October 2009, fell below 5.0 percent in January 2016, falling to a rate of
4.9 percent in January. The rate has slightly fluctuated since then, increasing again to
5.0 percent in February and March, decreasing to 4.7 percent in April, before increasing
again in the third quarter of 2016 to its current rate of 4.9 percent in October.
Despite the fluctuations in the unemployment rate, the number of persons employed
nationwide has increased during 2016. According to the Bureau of Labor Statistics,
approximately 2.5 million more people nationwide were employed at the end of the
third quarter of 2016 than were employed during the third quarter of 2015. The gains
during that period were primarily in the education and health services sector, which
added nearly 630,000 jobs; the professional and business services sector, which added
nearly 610,000 jobs; the trade, transportation, and utilities sector, which added
400,000 jobs; the leisure and hospitality sector, which added 380,000 jobs;
the construction sector, which added 210,000 jobs; and the financial sector, which
added nearly 170,000 jobs. A smaller increase has been seen in the information sector,
which added 18,000 jobs. Sectors experiencing negative job growth during those
four quarters include the natural resources and mining sector, which lost 120,000 jobs,
and the manufacturing sector, which lost 43,000 jobs.
Between the third quarter of 2015 and the third quarter of 2016, the government sector
has added a total of 167,000 jobs. The bulk of the increase in public sector jobs during
this time period is attributable to local governments, which gained about 110,000 jobs
during this period; however, federal employment increased by approximately
37,000 and state employment increased by approximately 20,000 during the same time
period.
12
In October 2014, Nevada’s unemployment rate, at 7.1 percent, was higher than all but
five other states, and 1.3 percent higher than the national rate at the time. Two years
later, Nevada’s unemployment rate is at 5.5 percent, only 0.6 percent above the
national rate. Though Nevada’s rate is still above the national rate, it fares more
comparably against other states – currently, eight states and the District of Columbia
have a higher unemployment rate, and the current rate of 5.5 percent is equivalent to
the most recent rates observed in two other states (California and Rhode Island).
For comparison to the U.S., from the third quarter of 2015 to the third quarter of 2016,
Nevada’s total nonfarm employment has gained 36,500 jobs, with the most significant
gains in trade, transportation, and utilities (10,500 jobs gained); leisure and hospitality
services (8,100 jobs gained); construction (4,900 jobs gained); professional services
(3,600 jobs gained); government (3,600 jobs gained); and education and health services
(3,300 jobs gained). For the government sector, local governments had a net gain of
2,600 jobs, with the state and federal governments also gaining over that period, by
600 and 400 jobs, respectively.
Among the major sectors that lost jobs during this period were information services
(1,400 jobs lost) and natural resources and mining (770 jobs lost).
One industry that has seen minimal growth in the last four quarters has been the
manufacturing industry, which added only 130 jobs between the third quarter of 2015
and the third quarter of 2016. Looking forward, though, the continued expansion of the
Tesla gigafactory in Storey County, as well as the potential Faraday Future project in
Clark County, should bring the net increase in manufacturing jobs higher in 2017 and
future years. Additionally, other sectors – particularly the construction and leisure and
hospitality industries – should see benefit from the Las Vegas Convention Center
expansion project that will occur as a result of legislative action during the 30th Special
Session in October 2016, as well as other projects that are scheduled to open in the
next several years.
13
Consumer Spending
As already noted, the relative weakness of the current recovery, in terms of growth in
the U.S. gross domestic product, has been mitigated by monthly job growth in each
month since September 2010. This job growth, along with increases in wages and
personal income, has translated into growth in consumer spending for most of the same
period.
Consumer spending, which fell by nearly $170 billion between 2008 and 2009 as a
result of the Great Recession, has increased every year since 2010 and continues to
increase into 2016. In the first three quarters of 2016, total consumer expenditures
have increased on average by 3.5 percent compared to the first three quarters in 2015.
This increase is primarily driven by expenditures on services, which increased by
4.5 percent during this period, but was offset by expenditures on nondurable goods,
which only increased by 0.8 percent during this period. An increase in expenditures on
durable goods of 2.8 percent also contributed to these gains.
In addition, in 2014 and 2015, the amount of personal income that is being saved by
Americans increased. This trend has continued into 2016, with an increase in the total
personal saving of 5.7 percent in the first three quarters of 2016 compared to the same
period in 2015.
Going forward into 2017, Moody’s Analytics is forecasting continued recovery and
expansion of the U.S. economy, with modest increases in the GDP, consumer
spending, employment, wages, and personal income. Uncertainty following the
2016 election, however, may pose risks to the economy, particularly depending on the
actions that the Trump administration may take with respect to existing trade
agreements, such as the North American Free Trade Agreement, or other laws passed
during previous administrations, such as the Affordable Care Act.
Additional uncertainty in foreign financial markets, such as those in Europe related to
the referendum approved in the U.K. to leave the European Union, may also lead to an
increased risk of instability in the U.S. economy.
14
General Fund Revenue Forecast – Fiscal Years 2017, 2018, and 2019
At the December 6, 2016, meeting, the Economic Forum took into consideration
presentations made at the meeting on November 10, 2016. These presentations
included the Nevada employment outlook made by Bill Anderson from the Nevada
Department of Employment, Training, and Rehabilitation; the Nevada population outlook
by Jeff Hardcastle, State Demographer; and the U.S. and Nevada general economic
outlook by Daniel White from Moody’s Analytics. The Forum also took into consideration
the economic outlooks used to derive the General Fund revenue forecasts made by the
Budget Division, the Department of Taxation, the Gaming Control Board,
Moody’s Analytics, and the Fiscal Analysis Division.
(Exhibits presented to the Economic Forum at its meetings are available from the
Fiscal Analysis Division upon request, or on the Legislative Counsel Bureau’s website:
https://www.leg.state.nv.us/App/InterimCommittee/REL/Interim2015/Committee/284.)
Based on consideration of the information that was provided to the Forum at these
meetings, the following forecast was approved at the December 6, 2016, meeting.
Total Nevada General Fund revenues, before the application of any tax credits approved
by the Legislature, are forecast at $3.939 billion for FY 2018 and $4.091 billion for
FY 2019. The 2017-2019 biennial total of $8.030 billion is 5.7 percent higher than the
current revised estimate for FY 2017 and the actual collections for FY 2016 of
$7.594 billion for the 2015-2017 biennium.
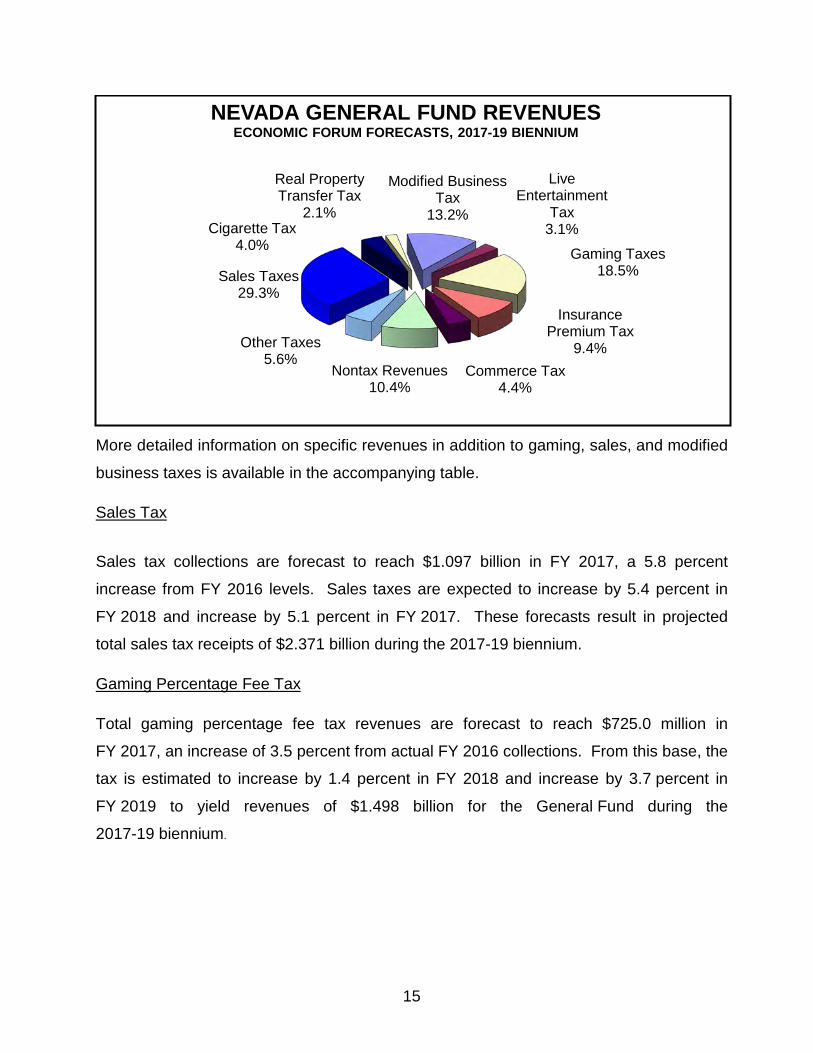
As you will note in the chart below, gaming taxes are forecast to provide 18.5 percent of
all General Fund revenues during the 2017-19 biennium, a decrease from the
18.8 percent now estimated for the current biennium. Sales tax collections are forecast
to provide 29.3 percent of all General Fund revenues during the 2017-19 biennium, an
increase from the 28.0 percent currently estimated for the 2015-17 biennium. Modified
business tax collections are forecast to provide 13.2 percent of all General Fund
revenues during the 2017-19 biennium, a decrease from the 13.5 percent currently
estimated for the 2015-17 biennium.
15
More detailed information on specific revenues in addition to gaming, sales, and modified
business taxes is available in the accompanying table. Sales Tax
Sales tax collections are forecast to reach $1.097 billion in FY 2017, a 5.8 percent
increase from FY 2016 levels. Sales taxes are expected to increase by 5.4 percent in
FY 2018 and increase by 5.1 percent in FY 2017. These forecasts result in projected
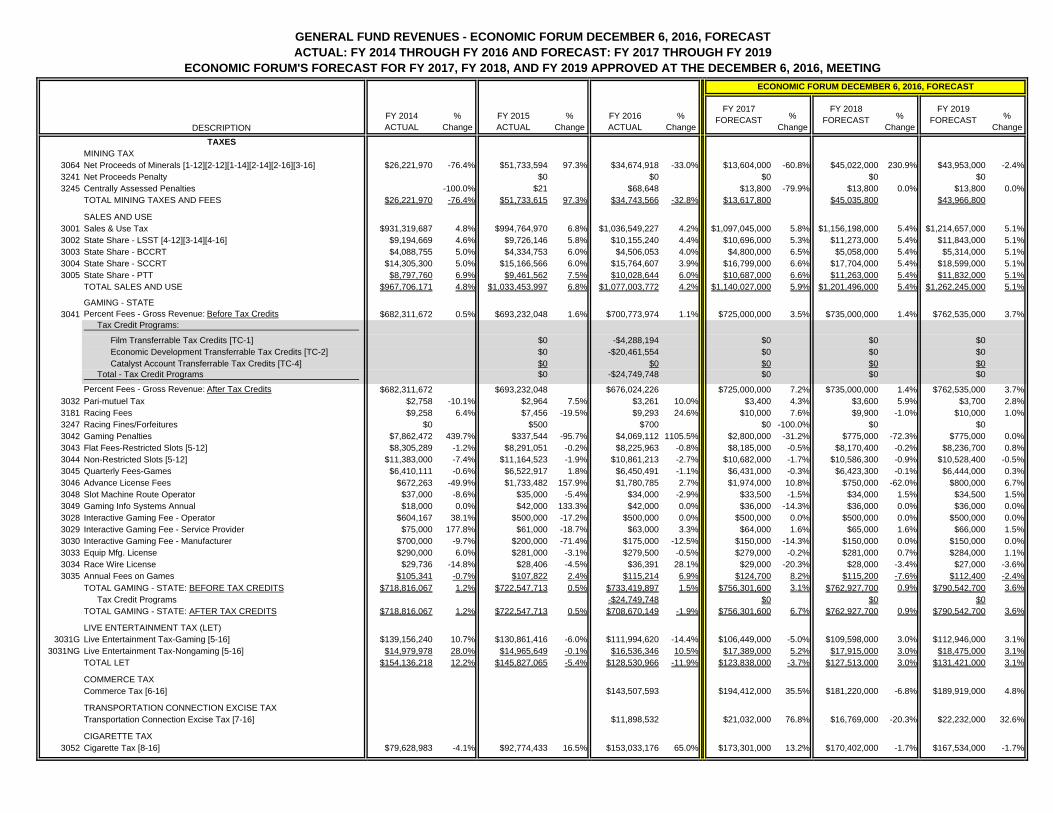
total sales tax receipts of $2.371 billion during the 2017-19 biennium. Gaming Percentage Fee Tax Total gaming percentage fee tax revenues are forecast to reach $725.0 million in
FY 2017, an increase of 3.5 percent from actual FY 2016 collections. From this base, the
tax is estimated to increase by 1.4 percent in FY 2018 and increase by 3.7 percent in
FY 2019 to yield revenues of $1.498 billion for the General Fund during the
2017-19 biennium.
Modified Business Tax
13.2%
Live Entertainment
Tax 3.1%
Gaming Taxes 18.5%
Insurance Premium Tax
9.4% Commerce Tax
4.4%
Other Taxes 5.6%
Nontax Revenues 10.4%
Sales Taxes 29.3%
Cigarette Tax 4.0%
Real Property Transfer Tax
2.1%
NEVADA GENERAL FUND REVENUES ECONOMIC FORUM FORECASTS, 2017-19 BIENNIUM
16
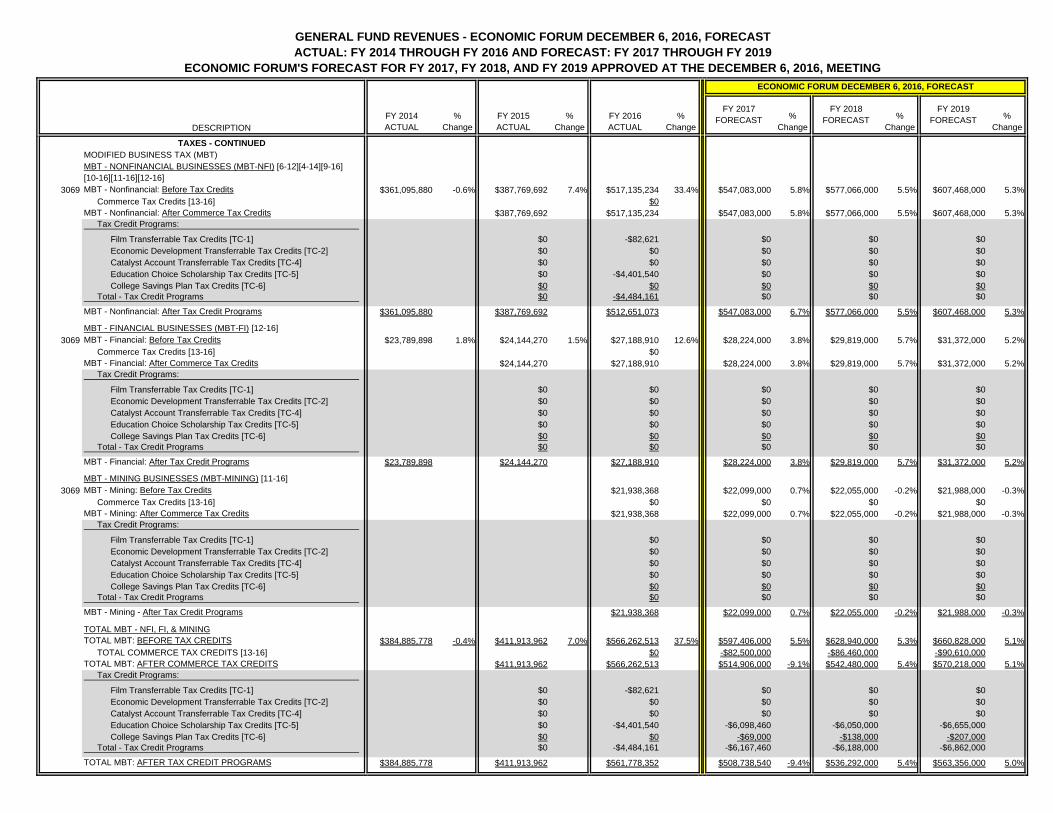
Modified Business Tax Total modified business tax revenues, before the effect of the credit that may be taken
against this tax by persons who pay the commerce tax, are forecast to reach
$597.4 million in FY 2017, an increase of 5.5 percent from actual FY 2016 collections.
Modified business taxes are estimated to increase by 5.3 percent in FY 2018 and
increase by 5.1 percent in FY 2019 to yield revenues of $1.290 billion for the
General Fund during the 2017-19 biennium.
Collections for the modified business tax are additionally estimated to be reduced by
$82.5 million in FY 2017, $86.5 million in FY 2018, and $90.6 million in FY 2019, as a
result of the commerce tax credit allowed against the modified business tax.
The commerce tax credit is discussed in greater detail on the next page.
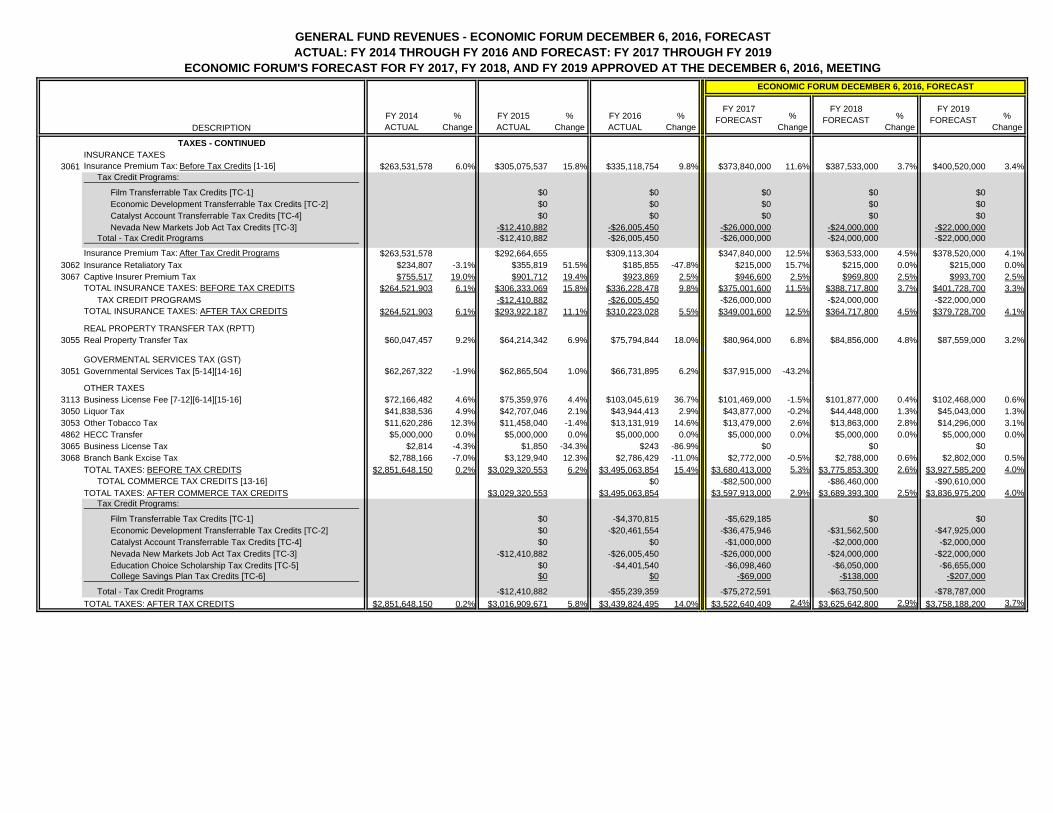
Insurance Premium Tax Total insurance premium tax revenues are forecast to reach $373.8 million in FY 2017,
an increase of 11.6 percent from actual FY 2016 collections. From this base, the tax is
estimated to increase by 3.7 percent in FY 2018 and increase by 3.4 percent in FY 2019
to yield revenues of $788.1 million for the General Fund during the 2017-19 biennium.
Live Entertainment Tax - Gaming Total live entertainment tax revenues from gaming establishments are forecast to reach
$106.4 million in FY 2017, a decrease of 5.0 percent from actual FY 2016 collections.
From this base, the tax is estimated to increase by 3.0 percent in FY 2018 and increase
by 3.1 percent in FY 2019 to yield revenues of $222.5 million for the General Fund during
the 2017-19 biennium.
Real Property Transfer Tax
Total real property transfer tax revenues are forecast to reach $81.0 million in FY 2017,
an increase of 6.8 percent from actual FY 2016 collections. From this base, the tax is
estimated to increase by 4.8 percent in FY 2018 and increase by 3.2 percent in FY 2019
to yield revenues of $172.4 million for the General Fund during the 2017-19 biennium.
17
Cigarette Tax Total cigarette tax revenues are forecast to reach $173.3 million in FY 2017, an increase
of 13.2 percent from actual FY 2016 collections. From this base, the tax is estimated to
decrease by 1.7 percent in FY 2018 and decrease by 1.7 percent in FY 2019 to yield
revenues of $337.9 million for the General Fund during the 2017-19 biennium.
Commerce Tax Total commerce tax revenues are forecast to reach $194.4 million in FY 2017, an
increase of 35.5 percent from actual FY 2016 collections. From this base, the tax is
estimated to decrease by 6.8 percent in FY 2018 and increase by 4.8 percent in FY 2019
to yield revenues of $371.1 million for the General Fund during the 2017-19 biennium.
As approved by the Legislature during the 2015 Session, taxpayers who have a
commerce tax liability in a preceding fiscal year are entitled to take a credit of up to
50 percent of that liability against the modified business tax in the current fiscal year.
Based on the actual FY 2016 collections of $143.5 million, as well as actual and
projected revenue based on FY 2016 taxable activity but not collected until FY 2017, the
commerce tax credit is estimated to reduce modified business tax revenues by
$82.5 million in FY 2017.
The commerce tax credit is estimated to reduce modified business tax revenues by
$86.5 million in FY 2018 and by $90.6 million in FY 2019.
DESCRIPTIONFY 2014 ACTUAL
% Change
FY 2015 ACTUAL
% Change
FY 2016 ACTUAL
% Change
% Change
% Change
% Change
TAXESMINING TAX
3064 Net Proceeds of Minerals [1-12][2-12][1-14][2-14][2-16][3-16] $26,221,970 -76.4% $51,733,594 97.3% $34,674,918 -33.0% $13,604,000 -60.8% $45,022,000 230.9% $43,953,000 -2.4%3241 Net Proceeds Penalty $0 $0 $0 $0 $03245 Centrally Assessed Penalties -100.0% $21 $68,648 $13,800 -79.9% $13,800 0.0% $13,800 0.0%
TOTAL MINING TAXES AND FEES $26,221,970 -76.4% $51,733,615 97.3% $34,743,566 -32.8% $13,617,800 $45,035,800 $43,966,800
SALES AND USE3001 Sales & Use Tax $931,319,687 4.8% $994,764,970 6.8% $1,036,549,227 4.2% $1,097,045,000 5.8% $1,156,198,000 5.4% $1,214,657,000 5.1%3002 State Share - LSST [4-12][3-14][4-16] $9,194,669 4.6% $9,726,146 5.8% $10,155,240 4.4% $10,696,000 5.3% $11,273,000 5.4% $11,843,000 5.1%3003 State Share - BCCRT $4,088,755 5.0% $4,334,753 6.0% $4,506,053 4.0% $4,800,000 6.5% $5,058,000 5.4% $5,314,000 5.1%3004 State Share - SCCRT $14,305,300 5.0% $15,166,566 6.0% $15,764,607 3.9% $16,799,000 6.6% $17,704,000 5.4% $18,599,000 5.1%3005 State Share - PTT $8,797,760 6.9% $9,461,562 7.5% $10,028,644 6.0% $10,687,000 6.6% $11,263,000 5.4% $11,832,000 5.1%
TOTAL SALES AND USE $967,706,171 4.8% $1,033,453,997 6.8% $1,077,003,772 4.2% $1,140,027,000 5.9% $1,201,496,000 5.4% $1,262,245,000 5.1%
GAMING - STATE3041 Percent Fees - Gross Revenue: Before Tax Credits $682,311,672 0.5% $693,232,048 1.6% $700,773,974 1.1% $725,000,000 3.5% $735,000,000 1.4% $762,535,000 3.7%
Tax Credit Programs:
Film Transferrable Tax Credits [TC-1] $0 -$4,288,194 $0 $0 $0Economic Development Transferrable Tax Credits [TC-2] $0 -$20,461,554 $0 $0 $0Catalyst Account Transferrable Tax Credits [TC-4] $0 $0 $0 $0 $0
Total - Tax Credit Programs $0 -$24,749,748 $0 $0 $0
Percent Fees - Gross Revenue: After Tax Credits $682,311,672 $693,232,048 $676,024,226 $725,000,000 7.2% $735,000,000 1.4% $762,535,000 3.7%3032 Pari-mutuel Tax $2,758 -10.1% $2,964 7.5% $3,261 10.0% $3,400 4.3% $3,600 5.9% $3,700 2.8%3181 Racing Fees $9,258 6.4% $7,456 -19.5% $9,293 24.6% $10,000 7.6% $9,900 -1.0% $10,000 1.0%3247 Racing Fines/Forfeitures $0 $500 $700 $0 -100.0% $0 $03042 Gaming Penalties $7,862,472 439.7% $337,544 -95.7% $4,069,112 1105.5% $2,800,000 -31.2% $775,000 -72.3% $775,000 0.0%3043 Flat Fees-Restricted Slots [5-12] $8,305,289 -1.2% $8,291,051 -0.2% $8,225,963 -0.8% $8,185,000 -0.5% $8,170,400 -0.2% $8,236,700 0.8%3044 Non-Restricted Slots [5-12] $11,383,000 -7.4% $11,164,523 -1.9% $10,861,213 -2.7% $10,682,000 -1.7% $10,586,300 -0.9% $10,528,400 -0.5%3045 Quarterly Fees-Games $6,410,111 -0.6% $6,522,917 1.8% $6,450,491 -1.1% $6,431,000 -0.3% $6,423,300 -0.1% $6,444,000 0.3%3046 Advance License Fees $672,263 -49.9% $1,733,482 157.9% $1,780,785 2.7% $1,974,000 10.8% $750,000 -62.0% $800,000 6.7%3048 Slot Machine Route Operator $37,000 -8.6% $35,000 -5.4% $34,000 -2.9% $33,500 -1.5% $34,000 1.5% $34,500 1.5%3049 Gaming Info Systems Annual $18,000 0.0% $42,000 133.3% $42,000 0.0% $36,000 -14.3% $36,000 0.0% $36,000 0.0%3028 Interactive Gaming Fee - Operator $604,167 38.1% $500,000 -17.2% $500,000 0.0% $500,000 0.0% $500,000 0.0% $500,000 0.0%3029 Interactive Gaming Fee - Service Provider $75,000 177.8% $61,000 -18.7% $63,000 3.3% $64,000 1.6% $65,000 1.6% $66,000 1.5%3030 Interactive Gaming Fee - Manufacturer $700,000 -9.7% $200,000 -71.4% $175,000 -12.5% $150,000 -14.3% $150,000 0.0% $150,000 0.0%3033 Equip Mfg. License $290,000 6.0% $281,000 -3.1% $279,500 -0.5% $279,000 -0.2% $281,000 0.7% $284,000 1.1%3034 Race Wire License $29,736 -14.8% $28,406 -4.5% $36,391 28.1% $29,000 -20.3% $28,000 -3.4% $27,000 -3.6%3035 Annual Fees on Games $105,341 -0.7% $107,822 2.4% $115,214 6.9% $124,700 8.2% $115,200 -7.6% $112,400 -2.4%
TOTAL GAMING - STATE: BEFORE TAX CREDITS $718,816,067 1.2% $722,547,713 0.5% $733,419,897 1.5% $756,301,600 3.1% $762,927,700 0.9% $790,542,700 3.6%Tax Credit Programs -$24,749,748 $0 $0 $0
TOTAL GAMING - STATE: AFTER TAX CREDITS $718,816,067 1.2% $722,547,713 0.5% $708,670,149 -1.9% $756,301,600 6.7% $762,927,700 0.9% $790,542,700 3.6%
LIVE ENTERTAINMENT TAX (LET)3031G Live Entertainment Tax-Gaming [5-16] $139,156,240 10.7% $130,861,416 -6.0% $111,994,620 -14.4% $106,449,000 -5.0% $109,598,000 3.0% $112,946,000 3.1%
3031NG Live Entertainment Tax-Nongaming [5-16] $14,979,978 28.0% $14,965,649 -0.1% $16,536,346 10.5% $17,389,000 5.2% $17,915,000 3.0% $18,475,000 3.1%TOTAL LET $154,136,218 12.2% $145,827,065 -5.4% $128,530,966 -11.9% $123,838,000 -3.7% $127,513,000 3.0% $131,421,000 3.1%
COMMERCE TAXCommerce Tax [6-16] $143,507,593 $194,412,000 35.5% $181,220,000 -6.8% $189,919,000 4.8%
TRANSPORTATION CONNECTION EXCISE TAXTransportation Connection Excise Tax [7-16] $11,898,532 $21,032,000 76.8% $16,769,000 -20.3% $22,232,000 32.6%
CIGARETTE TAX3052 Cigarette Tax [8-16] $79,628,983 -4.1% $92,774,433 16.5% $153,033,176 65.0% $173,301,000 13.2% $170,402,000 -1.7% $167,534,000 -1.7%
GENERAL FUND REVENUES - ECONOMIC FORUM DECEMBER 6, 2016, FORECASTACTUAL: FY 2014 THROUGH FY 2016 AND FORECAST: FY 2017 THROUGH FY 2019
ECONOMIC FORUM'S FORECAST FOR FY 2017, FY 2018, AND FY 2019 APPROVED AT THE DECEMBER 6, 2016, MEETINGECONOMIC FORUM DECEMBER 6, 2016, FORECAST
FY 2017 FORECAST
FY 2018 FORECAST
FY 2019 FORECAST
DESCRIPTIONFY 2014 ACTUAL
% Change
FY 2015 ACTUAL
% Change
FY 2016 ACTUAL
% Change
% Change
% Change
% Change
GENERAL FUND REVENUES - ECONOMIC FORUM DECEMBER 6, 2016, FORECASTACTUAL: FY 2014 THROUGH FY 2016 AND FORECAST: FY 2017 THROUGH FY 2019
ECONOMIC FORUM'S FORECAST FOR FY 2017, FY 2018, AND FY 2019 APPROVED AT THE DECEMBER 6, 2016, MEETINGECONOMIC FORUM DECEMBER 6, 2016, FORECAST
FY 2017 FORECAST
FY 2018 FORECAST
FY 2019 FORECAST
TAXES - CONTINUEDMODIFIED BUSINESS TAX (MBT)MBT - NONFINANCIAL BUSINESSES (MBT-NFI) [6-12][4-14][9-16] [10-16][11-16][12-16]
3069 MBT - Nonfinancial: Before Tax Credits $361,095,880 -0.6% $387,769,692 7.4% $517,135,234 33.4% $547,083,000 5.8% $577,066,000 5.5% $607,468,000 5.3%Commerce Tax Credits [13-16] $0
MBT - Nonfinancial: After Commerce Tax Credits $387,769,692 $517,135,234 $547,083,000 5.8% $577,066,000 5.5% $607,468,000 5.3%Tax Credit Programs:
Film Transferrable Tax Credits [TC-1] $0 -$82,621 $0 $0 $0Economic Development Transferrable Tax Credits [TC-2] $0 $0 $0 $0 $0Catalyst Account Transferrable Tax Credits [TC-4] $0 $0 $0 $0 $0Education Choice Scholarship Tax Credits [TC-5] $0 -$4,401,540 $0 $0 $0College Savings Plan Tax Credits [TC-6] $0 $0 $0 $0 $0
Total - Tax Credit Programs $0 -$4,484,161 $0 $0 $0
MBT - Nonfinancial: After Tax Credit Programs $361,095,880 $387,769,692 $512,651,073 $547,083,000 6.7% $577,066,000 5.5% $607,468,000 5.3%
MBT - FINANCIAL BUSINESSES (MBT-FI) [12-16]3069 MBT - Financial: Before Tax Credits $23,789,898 1.8% $24,144,270 1.5% $27,188,910 12.6% $28,224,000 3.8% $29,819,000 5.7% $31,372,000 5.2%
Commerce Tax Credits [13-16] $0MBT - Financial: After Commerce Tax Credits $24,144,270 $27,188,910 $28,224,000 3.8% $29,819,000 5.7% $31,372,000 5.2%
Tax Credit Programs:
Film Transferrable Tax Credits [TC-1] $0 $0 $0 $0 $0Economic Development Transferrable Tax Credits [TC-2] $0 $0 $0 $0 $0Catalyst Account Transferrable Tax Credits [TC-4] $0 $0 $0 $0 $0Education Choice Scholarship Tax Credits [TC-5] $0 $0 $0 $0 $0College Savings Plan Tax Credits [TC-6] $0 $0 $0 $0 $0
Total - Tax Credit Programs $0 $0 $0 $0 $0
MBT - Financial: After Tax Credit Programs $23,789,898 $24,144,270 $27,188,910 $28,224,000 3.8% $29,819,000 5.7% $31,372,000 5.2%
MBT - MINING BUSINESSES (MBT-MINING) [11-16]3069 MBT - Mining: Before Tax Credits $21,938,368 $22,099,000 0.7% $22,055,000 -0.2% $21,988,000 -0.3%
Commerce Tax Credits [13-16] $0 $0 $0 $0MBT - Mining: After Commerce Tax Credits $21,938,368 $22,099,000 0.7% $22,055,000 -0.2% $21,988,000 -0.3%
Tax Credit Programs:
Film Transferrable Tax Credits [TC-1] $0 $0 $0 $0Economic Development Transferrable Tax Credits [TC-2] $0 $0 $0 $0Catalyst Account Transferrable Tax Credits [TC-4] $0 $0 $0 $0Education Choice Scholarship Tax Credits [TC-5] $0 $0 $0 $0College Savings Plan Tax Credits [TC-6] $0 $0 $0 $0
Total - Tax Credit Programs $0 $0 $0 $0
MBT - Mining - After Tax Credit Programs $21,938,368 $22,099,000 0.7% $22,055,000 -0.2% $21,988,000 -0.3%
TOTAL MBT - NFI, FI, & MININGTOTAL MBT: BEFORE TAX CREDITS $384,885,778 -0.4% $411,913,962 7.0% $566,262,513 37.5% $597,406,000 5.5% $628,940,000 5.3% $660,828,000 5.1%
TOTAL COMMERCE TAX CREDITS [13-16] $0 -$82,500,000 -$86,460,000 -$90,610,000TOTAL MBT: AFTER COMMERCE TAX CREDITS $411,913,962 $566,262,513 $514,906,000 -9.1% $542,480,000 5.4% $570,218,000 5.1%
Tax Credit Programs:
Film Transferrable Tax Credits [TC-1] $0 -$82,621 $0 $0 $0Economic Development Transferrable Tax Credits [TC-2] $0 $0 $0 $0 $0Catalyst Account Transferrable Tax Credits [TC-4] $0 $0 $0 $0 $0Education Choice Scholarship Tax Credits [TC-5] $0 -$4,401,540 -$6,098,460 -$6,050,000 -$6,655,000College Savings Plan Tax Credits [TC-6] $0 $0 -$69,000 -$138,000 -$207,000
Total - Tax Credit Programs $0 -$4,484,161 -$6,167,460 -$6,188,000 -$6,862,000
TOTAL MBT: AFTER TAX CREDIT PROGRAMS $384,885,778 $411,913,962 $561,778,352 $508,738,540 -9.4% $536,292,000 5.4% $563,356,000 5.0%
DESCRIPTIONFY 2014 ACTUAL
% Change
FY 2015 ACTUAL
% Change
FY 2016 ACTUAL
% Change
% Change
% Change
% Change
GENERAL FUND REVENUES - ECONOMIC FORUM DECEMBER 6, 2016, FORECASTACTUAL: FY 2014 THROUGH FY 2016 AND FORECAST: FY 2017 THROUGH FY 2019
ECONOMIC FORUM'S FORECAST FOR FY 2017, FY 2018, AND FY 2019 APPROVED AT THE DECEMBER 6, 2016, MEETINGECONOMIC FORUM DECEMBER 6, 2016, FORECAST
FY 2017 FORECAST
FY 2018 FORECAST
FY 2019 FORECAST
TAXES - CONTINUEDINSURANCE TAXES
3061 Insurance Premium Tax: Before Tax Credits [1-16] $263,531,578 6.0% $305,075,537 15.8% $335,118,754 9.8% $373,840,000 11.6% $387,533,000 3.7% $400,520,000 3.4%Tax Credit Programs:
Film Transferrable Tax Credits [TC-1] $0 $0 $0 $0 $0Economic Development Transferrable Tax Credits [TC-2] $0 $0 $0 $0 $0Catalyst Account Transferrable Tax Credits [TC-4] $0 $0 $0 $0 $0Nevada New Markets Job Act Tax Credits [TC-3] -$12,410,882 -$26,005,450 -$26,000,000 -$24,000,000 -$22,000,000
Total - Tax Credit Programs -$12,410,882 -$26,005,450 -$26,000,000 -$24,000,000 -$22,000,000
Insurance Premium Tax: After Tax Credit Programs $263,531,578 $292,664,655 $309,113,304 $347,840,000 12.5% $363,533,000 4.5% $378,520,000 4.1%3062 Insurance Retaliatory Tax $234,807 -3.1% $355,819 51.5% $185,855 -47.8% $215,000 15.7% $215,000 0.0% $215,000 0.0%3067 Captive Insurer Premium Tax $755,517 19.0% $901,712 19.4% $923,869 2.5% $946,600 2.5% $969,800 2.5% $993,700 2.5%
TOTAL INSURANCE TAXES: BEFORE TAX CREDITS $264,521,903 6.1% $306,333,069 15.8% $336,228,478 9.8% $375,001,600 11.5% $388,717,800 3.7% $401,728,700 3.3%TAX CREDIT PROGRAMS -$12,410,882 -$26,005,450 -$26,000,000 -$24,000,000 -$22,000,000
TOTAL INSURANCE TAXES: AFTER TAX CREDITS $264,521,903 6.1% $293,922,187 11.1% $310,223,028 5.5% $349,001,600 12.5% $364,717,800 4.5% $379,728,700 4.1%
REAL PROPERTY TRANSFER TAX (RPTT)3055 Real Property Transfer Tax $60,047,457 9.2% $64,214,342 6.9% $75,794,844 18.0% $80,964,000 6.8% $84,856,000 4.8% $87,559,000 3.2%
GOVERMENTAL SERVICES TAX (GST)3051 Governmental Services Tax [5-14][14-16] $62,267,322 -1.9% $62,865,504 1.0% $66,731,895 6.2% $37,915,000 -43.2%
OTHER TAXES3113 Business License Fee [7-12][6-14][15-16] $72,166,482 4.6% $75,359,976 4.4% $103,045,619 36.7% $101,469,000 -1.5% $101,877,000 0.4% $102,468,000 0.6%3050 Liquor Tax $41,838,536 4.9% $42,707,046 2.1% $43,944,413 2.9% $43,877,000 -0.2% $44,448,000 1.3% $45,043,000 1.3%3053 Other Tobacco Tax $11,620,286 12.3% $11,458,040 -1.4% $13,131,919 14.6% $13,479,000 2.6% $13,863,000 2.8% $14,296,000 3.1%4862 HECC Transfer $5,000,000 0.0% $5,000,000 0.0% $5,000,000 0.0% $5,000,000 0.0% $5,000,000 0.0% $5,000,000 0.0%3065 Business License Tax $2,814 -4.3% $1,850 -34.3% $243 -86.9% $0 $0 $03068 Branch Bank Excise Tax $2,788,166 -7.0% $3,129,940 12.3% $2,786,429 -11.0% $2,772,000 -0.5% $2,788,000 0.6% $2,802,000 0.5%
TOTAL TAXES: BEFORE TAX CREDITS $2,851,648,150 0.2% $3,029,320,553 6.2% $3,495,063,854 15.4% $3,680,413,000 5.3% $3,775,853,300 2.6% $3,927,585,200 4.0%TOTAL COMMERCE TAX CREDITS [13-16] $0 -$82,500,000 -$86,460,000 -$90,610,000
TOTAL TAXES: AFTER COMMERCE TAX CREDITS $3,029,320,553 $3,495,063,854 $3,597,913,000 2.9% $3,689,393,300 2.5% $3,836,975,200 4.0%Tax Credit Programs:
Film Transferrable Tax Credits [TC-1] $0 -$4,370,815 -$5,629,185 $0 $0Economic Development Transferrable Tax Credits [TC-2] $0 -$20,461,554 -$36,475,946 -$31,562,500 -$47,925,000Catalyst Account Transferrable Tax Credits [TC-4] $0 $0 -$1,000,000 -$2,000,000 -$2,000,000Nevada New Markets Job Act Tax Credits [TC-3] -$12,410,882 -$26,005,450 -$26,000,000 -$24,000,000 -$22,000,000Education Choice Scholarship Tax Credits [TC-5] $0 -$4,401,540 -$6,098,460 -$6,050,000 -$6,655,000College Savings Plan Tax Credits [TC-6] $0 $0 -$69,000 -$138,000 -$207,000
Total - Tax Credit Programs -$12,410,882 -$55,239,359 -$75,272,591 -$63,750,500 -$78,787,000TOTAL TAXES: AFTER TAX CREDITS $2,851,648,150 0.2% $3,016,909,671 5.8% $3,439,824,495 14.0% $3,522,640,409 2.4% $3,625,642,800 2.9% $3,758,188,200 3.7%
DESCRIPTIONFY 2014 ACTUAL
% Change
FY 2015 ACTUAL
% Change
FY 2016 ACTUAL
% Change
% Change
% Change
% Change
GENERAL FUND REVENUES - ECONOMIC FORUM DECEMBER 6, 2016, FORECASTACTUAL: FY 2014 THROUGH FY 2016 AND FORECAST: FY 2017 THROUGH FY 2019
ECONOMIC FORUM'S FORECAST FOR FY 2017, FY 2018, AND FY 2019 APPROVED AT THE DECEMBER 6, 2016, MEETINGECONOMIC FORUM DECEMBER 6, 2016, FORECAST
FY 2017 FORECAST
FY 2018 FORECAST
FY 2019 FORECAST
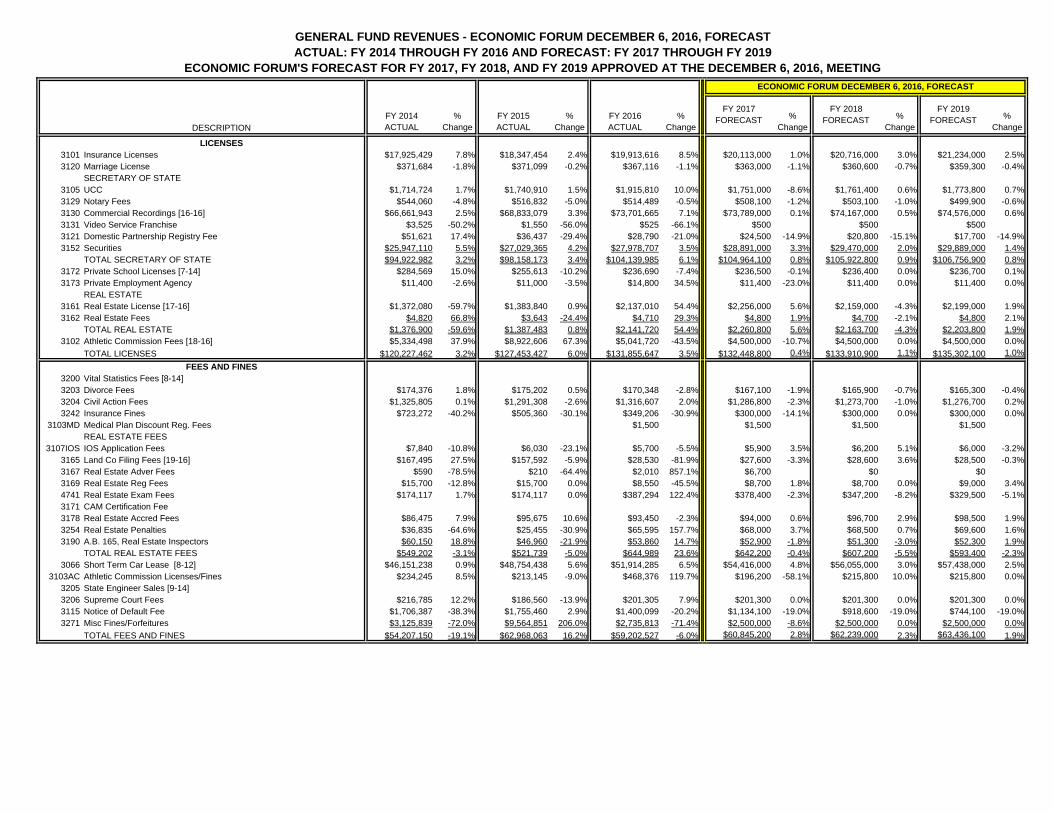
LICENSES3101 Insurance Licenses $17,925,429 7.8% $18,347,454 2.4% $19,913,616 8.5% $20,113,000 1.0% $20,716,000 3.0% $21,234,000 2.5%3120 Marriage License $371,684 -1.8% $371,099 -0.2% $367,116 -1.1% $363,000 -1.1% $360,600 -0.7% $359,300 -0.4%
SECRETARY OF STATE3105 UCC $1,714,724 1.7% $1,740,910 1.5% $1,915,810 10.0% $1,751,000 -8.6% $1,761,400 0.6% $1,773,800 0.7%3129 Notary Fees $544,060 -4.8% $516,832 -5.0% $514,489 -0.5% $508,100 -1.2% $503,100 -1.0% $499,900 -0.6%3130 Commercial Recordings [16-16] $66,661,943 2.5% $68,833,079 3.3% $73,701,665 7.1% $73,789,000 0.1% $74,167,000 0.5% $74,576,000 0.6%3131 Video Service Franchise $3,525 -50.2% $1,550 -56.0% $525 -66.1% $500 $500 $5003121 Domestic Partnership Registry Fee $51,621 17.4% $36,437 -29.4% $28,790 -21.0% $24,500 -14.9% $20,800 -15.1% $17,700 -14.9%3152 Securities $25,947,110 5.5% $27,029,365 4.2% $27,978,707 3.5% $28,891,000 3.3% $29,470,000 2.0% $29,889,000 1.4%
TOTAL SECRETARY OF STATE $94,922,982 3.2% $98,158,173 3.4% $104,139,985 6.1% $104,964,100 0.8% $105,922,800 0.9% $106,756,900 0.8%3172 Private School Licenses [7-14] $284,569 15.0% $255,613 -10.2% $236,690 -7.4% $236,500 -0.1% $236,400 0.0% $236,700 0.1%3173 Private Employment Agency $11,400 -2.6% $11,000 -3.5% $14,800 34.5% $11,400 -23.0% $11,400 0.0% $11,400 0.0%
REAL ESTATE3161 Real Estate License [17-16] $1,372,080 -59.7% $1,383,840 0.9% $2,137,010 54.4% $2,256,000 5.6% $2,159,000 -4.3% $2,199,000 1.9%3162 Real Estate Fees $4,820 66.8% $3,643 -24.4% $4,710 29.3% $4,800 1.9% $4,700 -2.1% $4,800 2.1%
TOTAL REAL ESTATE $1,376,900 -59.6% $1,387,483 0.8% $2,141,720 54.4% $2,260,800 5.6% $2,163,700 -4.3% $2,203,800 1.9%3102 Athletic Commission Fees [18-16] $5,334,498 37.9% $8,922,606 67.3% $5,041,720 -43.5% $4,500,000 -10.7% $4,500,000 0.0% $4,500,000 0.0%
TOTAL LICENSES $120,227,462 3.2% $127,453,427 6.0% $131,855,647 3.5% $132,448,800 0.4% $133,910,900 1.1% $135,302,100 1.0%FEES AND FINES
3200 Vital Statistics Fees [8-14]3203 Divorce Fees $174,376 1.8% $175,202 0.5% $170,348 -2.8% $167,100 -1.9% $165,900 -0.7% $165,300 -0.4%3204 Civil Action Fees $1,325,805 0.1% $1,291,308 -2.6% $1,316,607 2.0% $1,286,800 -2.3% $1,273,700 -1.0% $1,276,700 0.2%3242 Insurance Fines $723,272 -40.2% $505,360 -30.1% $349,206 -30.9% $300,000 -14.1% $300,000 0.0% $300,000 0.0%
3103MD Medical Plan Discount Reg. Fees $1,500 $1,500 $1,500 $1,500REAL ESTATE FEES
3107IOS IOS Application Fees $7,840 -10.8% $6,030 -23.1% $5,700 -5.5% $5,900 3.5% $6,200 5.1% $6,000 -3.2%3165 Land Co Filing Fees [19-16] $167,495 27.5% $157,592 -5.9% $28,530 -81.9% $27,600 -3.3% $28,600 3.6% $28,500 -0.3%3167 Real Estate Adver Fees $590 -78.5% $210 -64.4% $2,010 857.1% $6,700 $0 $03169 Real Estate Reg Fees $15,700 -12.8% $15,700 0.0% $8,550 -45.5% $8,700 1.8% $8,700 0.0% $9,000 3.4%4741 Real Estate Exam Fees $174,117 1.7% $174,117 0.0% $387,294 122.4% $378,400 -2.3% $347,200 -8.2% $329,500 -5.1%3171 CAM Certification Fee3178 Real Estate Accred Fees $86,475 7.9% $95,675 10.6% $93,450 -2.3% $94,000 0.6% $96,700 2.9% $98,500 1.9%3254 Real Estate Penalties $36,835 -64.6% $25,455 -30.9% $65,595 157.7% $68,000 3.7% $68,500 0.7% $69,600 1.6%3190 A.B. 165, Real Estate Inspectors $60,150 18.8% $46,960 -21.9% $53,860 14.7% $52,900 -1.8% $51,300 -3.0% $52,300 1.9%
TOTAL REAL ESTATE FEES $549,202 -3.1% $521,739 -5.0% $644,989 23.6% $642,200 -0.4% $607,200 -5.5% $593,400 -2.3%3066 Short Term Car Lease [8-12] $46,151,238 0.9% $48,754,438 5.6% $51,914,285 6.5% $54,416,000 4.8% $56,055,000 3.0% $57,438,000 2.5%
3103AC Athletic Commission Licenses/Fines $234,245 8.5% $213,145 -9.0% $468,376 119.7% $196,200 -58.1% $215,800 10.0% $215,800 0.0%3205 State Engineer Sales [9-14]3206 Supreme Court Fees $216,785 12.2% $186,560 -13.9% $201,305 7.9% $201,300 0.0% $201,300 0.0% $201,300 0.0%3115 Notice of Default Fee $1,706,387 -38.3% $1,755,460 2.9% $1,400,099 -20.2% $1,134,100 -19.0% $918,600 -19.0% $744,100 -19.0%3271 Misc Fines/Forfeitures $3,125,839 -72.0% $9,564,851 206.0% $2,735,813 -71.4% $2,500,000 -8.6% $2,500,000 0.0% $2,500,000 0.0%
TOTAL FEES AND FINES $54,207,150 -19.1% $62,968,063 16.2% $59,202,527 -6.0% $60,845,200 2.8% $62,239,000 2.3% $63,436,100 1.9%
DESCRIPTIONFY 2014 ACTUAL
% Change
FY 2015 ACTUAL
% Change
FY 2016 ACTUAL
% Change
% Change
% Change
% Change
GENERAL FUND REVENUES - ECONOMIC FORUM DECEMBER 6, 2016, FORECASTACTUAL: FY 2014 THROUGH FY 2016 AND FORECAST: FY 2017 THROUGH FY 2019
ECONOMIC FORUM'S FORECAST FOR FY 2017, FY 2018, AND FY 2019 APPROVED AT THE DECEMBER 6, 2016, MEETINGECONOMIC FORUM DECEMBER 6, 2016, FORECAST
FY 2017 FORECAST
FY 2018 FORECAST
FY 2019 FORECAST
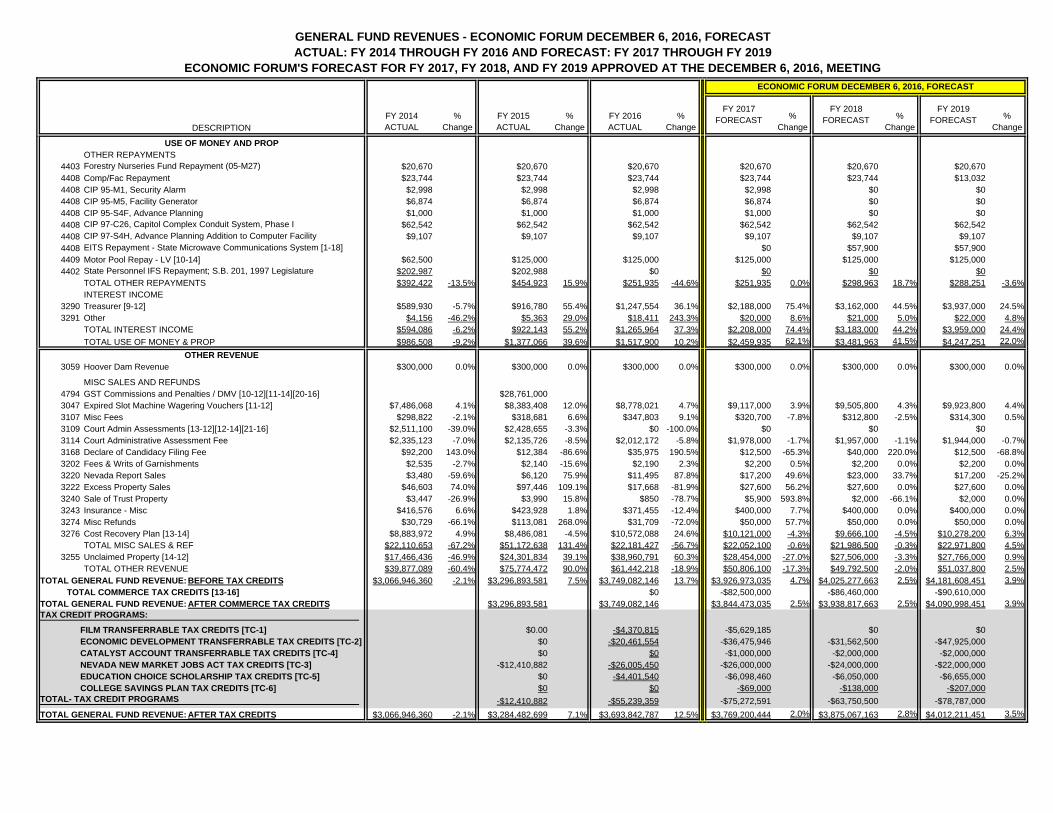
USE OF MONEY AND PROPOTHER REPAYMENTS
4403 Forestry Nurseries Fund Repayment (05-M27) $20,670 $20,670 $20,670 $20,670 $20,670 $20,6704408 Comp/Fac Repayment $23,744 $23,744 $23,744 $23,744 $23,744 $13,0324408 CIP 95-M1, Security Alarm $2,998 $2,998 $2,998 $2,998 $0 $04408 CIP 95-M5, Facility Generator $6,874 $6,874 $6,874 $6,874 $0 $04408 CIP 95-S4F, Advance Planning $1,000 $1,000 $1,000 $1,000 $0 $04408 CIP 97-C26, Capitol Complex Conduit System, Phase I $62,542 $62,542 $62,542 $62,542 $62,542 $62,5424408 CIP 97-S4H, Advance Planning Addition to Computer Facility $9,107 $9,107 $9,107 $9,107 $9,107 $9,1074408 EITS Repayment - State Microwave Communications System [1-18] $0 $57,900 $57,9004409 Motor Pool Repay - LV [10-14] $62,500 $125,000 $125,000 $125,000 $125,000 $125,0004402 State Personnel IFS Repayment; S.B. 201, 1997 Legislature $202,987 $202,988 $0 $0 $0 $0
TOTAL OTHER REPAYMENTS $392,422 -13.5% $454,923 15.9% $251,935 -44.6% $251,935 0.0% $298,963 18.7% $288,251 -3.6%INTEREST INCOME
3290 Treasurer [9-12] $589,930 -5.7% $916,780 55.4% $1,247,554 36.1% $2,188,000 75.4% $3,162,000 44.5% $3,937,000 24.5%3291 Other $4,156 -46.2% $5,363 29.0% $18,411 243.3% $20,000 8.6% $21,000 5.0% $22,000 4.8%
TOTAL INTEREST INCOME $594,086 -6.2% $922,143 55.2% $1,265,964 37.3% $2,208,000 74.4% $3,183,000 44.2% $3,959,000 24.4%TOTAL USE OF MONEY & PROP $986,508 -9.2% $1,377,066 39.6% $1,517,900 10.2% $2,459,935 62.1% $3,481,963 41.5% $4,247,251 22.0%
OTHER REVENUE3059 Hoover Dam Revenue $300,000 0.0% $300,000 0.0% $300,000 0.0% $300,000 0.0% $300,000 0.0% $300,000 0.0%
MISC SALES AND REFUNDS4794 GST Commissions and Penalties / DMV [10-12][11-14][20-16] $28,761,0003047 Expired Slot Machine Wagering Vouchers [11-12] $7,486,068 4.1% $8,383,408 12.0% $8,778,021 4.7% $9,117,000 3.9% $9,505,800 4.3% $9,923,800 4.4%3107 Misc Fees $298,822 -2.1% $318,681 6.6% $347,803 9.1% $320,700 -7.8% $312,800 -2.5% $314,300 0.5%3109 Court Admin Assessments [13-12][12-14][21-16] $2,511,100 -39.0% $2,428,655 -3.3% $0 -100.0% $0 $0 $03114 Court Administrative Assessment Fee $2,335,123 -7.0% $2,135,726 -8.5% $2,012,172 -5.8% $1,978,000 -1.7% $1,957,000 -1.1% $1,944,000 -0.7%3168 Declare of Candidacy Filing Fee $92,200 143.0% $12,384 -86.6% $35,975 190.5% $12,500 -65.3% $40,000 220.0% $12,500 -68.8%3202 Fees & Writs of Garnishments $2,535 -2.7% $2,140 -15.6% $2,190 2.3% $2,200 0.5% $2,200 0.0% $2,200 0.0%3220 Nevada Report Sales $3,480 -59.6% $6,120 75.9% $11,495 87.8% $17,200 49.6% $23,000 33.7% $17,200 -25.2%3222 Excess Property Sales $46,603 74.0% $97,446 109.1% $17,668 -81.9% $27,600 56.2% $27,600 0.0% $27,600 0.0%3240 Sale of Trust Property $3,447 -26.9% $3,990 15.8% $850 -78.7% $5,900 593.8% $2,000 -66.1% $2,000 0.0%3243 Insurance - Misc $416,576 6.6% $423,928 1.8% $371,455 -12.4% $400,000 7.7% $400,000 0.0% $400,000 0.0%3274 Misc Refunds $30,729 -66.1% $113,081 268.0% $31,709 -72.0% $50,000 57.7% $50,000 0.0% $50,000 0.0%3276 Cost Recovery Plan [13-14] $8,883,972 4.9% $8,486,081 -4.5% $10,572,088 24.6% $10,121,000 -4.3% $9,666,100 -4.5% $10,278,200 6.3%
TOTAL MISC SALES & REF $22,110,653 -67.2% $51,172,638 131.4% $22,181,427 -56.7% $22,052,100 -0.6% $21,986,500 -0.3% $22,971,800 4.5%3255 Unclaimed Property [14-12] $17,466,436 -46.9% $24,301,834 39.1% $38,960,791 60.3% $28,454,000 -27.0% $27,506,000 -3.3% $27,766,000 0.9%
TOTAL OTHER REVENUE $39,877,089 -60.4% $75,774,472 90.0% $61,442,218 -18.9% $50,806,100 -17.3% $49,792,500 -2.0% $51,037,800 2.5%TOTAL GENERAL FUND REVENUE: BEFORE TAX CREDITS $3,066,946,360 -2.1% $3,296,893,581 7.5% $3,749,082,146 13.7% $3,926,973,035 4.7% $4,025,277,663 2.5% $4,181,608,451 3.9%
TOTAL COMMERCE TAX CREDITS [13-16] $0 -$82,500,000 -$86,460,000 -$90,610,000TOTAL GENERAL FUND REVENUE: AFTER COMMERCE TAX CREDITS $3,296,893,581 $3,749,082,146 $3,844,473,035 2.5% $3,938,817,663 2.5% $4,090,998,451 3.9%
FILM TRANSFERRABLE TAX CREDITS [TC-1] $0.00 -$4,370,815 -$5,629,185 $0 $0ECONOMIC DEVELOPMENT TRANSFERRABLE TAX CREDITS [TC-2] $0 -$20,461,554 -$36,475,946 -$31,562,500 -$47,925,000CATALYST ACCOUNT TRANSFERRABLE TAX CREDITS [TC-4] $0 $0 -$1,000,000 -$2,000,000 -$2,000,000NEVADA NEW MARKET JOBS ACT TAX CREDITS [TC-3] -$12,410,882 -$26,005,450 -$26,000,000 -$24,000,000 -$22,000,000EDUCATION CHOICE SCHOLARSHIP TAX CREDITS [TC-5] $0 -$4,401,540 -$6,098,460 -$6,050,000 -$6,655,000COLLEGE SAVINGS PLAN TAX CREDITS [TC-6] $0 $0 -$69,000 -$138,000 -$207,000
-$12,410,882 -$55,239,359 -$75,272,591 -$63,750,500 -$78,787,000TOTAL GENERAL FUND REVENUE: AFTER TAX CREDITS $3,066,946,360 -2.1% $3,284,482,699 7.1% $3,693,842,787 12.5% $3,769,200,444 2.0% $3,875,067,163 2.8% $4,012,211,451 3.5%
TAX CREDIT PROGRAMS:
TOTAL- TAX CREDIT PROGRAMS
DESCRIPTIONFY 2014 ACTUAL
% Change
FY 2015 ACTUAL
% Change
FY 2016 ACTUAL
% Change
% Change
% Change
% Change
GENERAL FUND REVENUES - ECONOMIC FORUM DECEMBER 6, 2016, FORECASTACTUAL: FY 2014 THROUGH FY 2016 AND FORECAST: FY 2017 THROUGH FY 2019
ECONOMIC FORUM'S FORECAST FOR FY 2017, FY 2018, AND FY 2019 APPROVED AT THE DECEMBER 6, 2016, MEETINGECONOMIC FORUM DECEMBER 6, 2016, FORECAST
FY 2017 FORECAST
FY 2018 FORECAST
FY 2019 FORECAST
NOTES:
[1-12]
[2-12]
[3-12]
[4-12]
[5-12]
[6-12]
[7-12]
[8-12]
[9-12]
[10-12]
[11-12]
[12-12][13-12][14-12]
[1-14]
[2-14]
[3-14]
[4-14]
S.B. 503 requires the proceeds from the commission retained by the Department of Motor Vehicles from the amount of Governmental Services Tax (GST) collected and any penalties for delinquent payment of the GST to be transferred to the State General Fund in FY 2012 and FY 2013. S.B. 503 specifies that the amount transferred shall not exceed $20,894,228 from commissions and $4,672,213 from penalties in both FY 2012 and FY 2013.
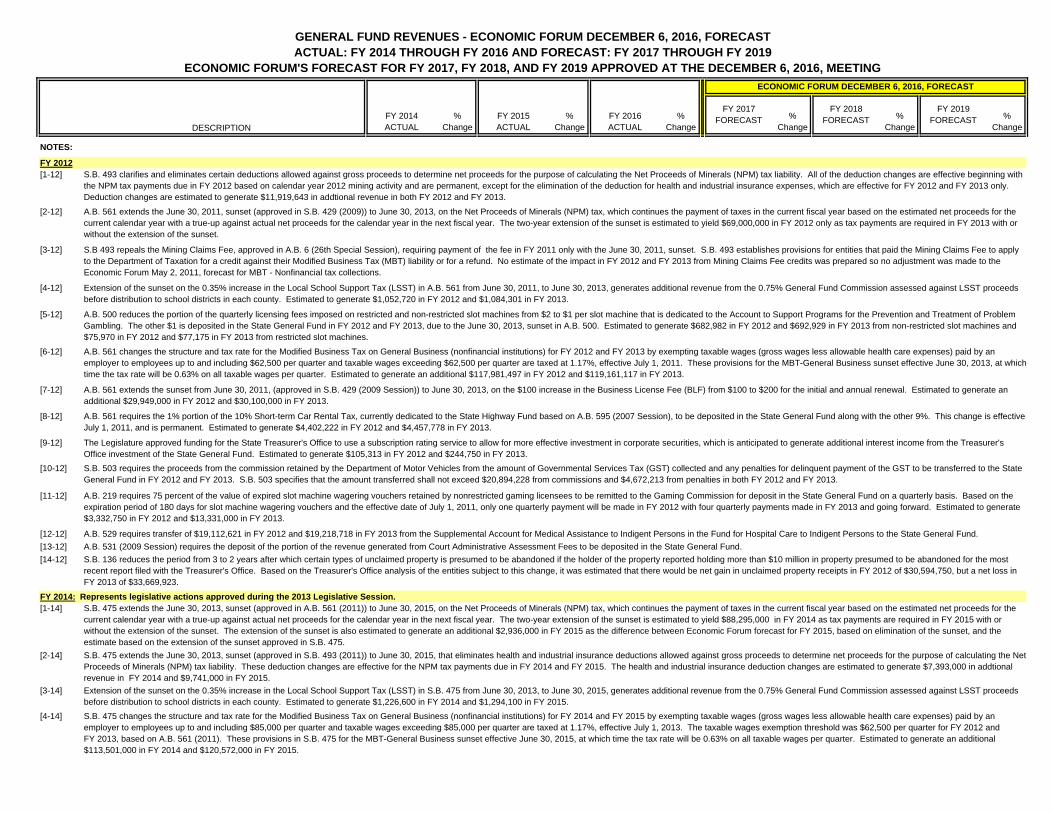
FY 2012S.B. 493 clarifies and eliminates certain deductions allowed against gross proceeds to determine net proceeds for the purpose of calculating the Net Proceeds of Minerals (NPM) tax liability. All of the deduction changes are effective beginning with the NPM tax payments due in FY 2012 based on calendar year 2012 mining activity and are permanent, except for the elimination of the deduction for health and industrial insurance expenses, which are effective for FY 2012 and FY 2013 only. Deduction changes are estimated to generate $11,919,643 in addtional revenue in both FY 2012 and FY 2013.
A.B. 561 extends the June 30, 2011, sunset (approved in S.B. 429 (2009)) to June 30, 2013, on the Net Proceeds of Minerals (NPM) tax, which continues the payment of taxes in the current fiscal year based on the estimated net proceeds for the current calendar year with a true-up against actual net proceeds for the calendar year in the next fiscal year. The two-year extension of the sunset is estimated to yield $69,000,000 in FY 2012 only as tax payments are required in FY 2013 with or without the extension of the sunset.
S.B 493 repeals the Mining Claims Fee, approved in A.B. 6 (26th Special Session), requiring payment of the fee in FY 2011 only with the June 30, 2011, sunset. S.B. 493 establishes provisions for entities that paid the Mining Claims Fee to apply to the Department of Taxation for a credit against their Modified Business Tax (MBT) liability or for a refund. No estimate of the impact in FY 2012 and FY 2013 from Mining Claims Fee credits was prepared so no adjustment was made to the Economic Forum May 2, 2011, forecast for MBT - Nonfinancial tax collections.
Extension of the sunset on the 0.35% increase in the Local School Support Tax (LSST) in A.B. 561 from June 30, 2011, to June 30, 2013, generates additional revenue from the 0.75% General Fund Commission assessed against LSST proceeds before distribution to school districts in each county. Estimated to generate $1,052,720 in FY 2012 and $1,084,301 in FY 2013.
A.B. 500 reduces the portion of the quarterly licensing fees imposed on restricted and non-restricted slot machines from $2 to $1 per slot machine that is dedicated to the Account to Support Programs for the Prevention and Treatment of Problem Gambling. The other $1 is deposited in the State General Fund in FY 2012 and FY 2013, due to the June 30, 2013, sunset in A.B. 500. Estimated to generate $682,982 in FY 2012 and $692,929 in FY 2013 from non-restricted slot machines and $75,970 in FY 2012 and $77,175 in FY 2013 from restricted slot machines.
A.B. 561 changes the structure and tax rate for the Modified Business Tax on General Business (nonfinancial institutions) for FY 2012 and FY 2013 by exempting taxable wages (gross wages less allowable health care expenses) paid by an employer to employees up to and including $62,500 per quarter and taxable wages exceeding $62,500 per quarter are taxed at 1.17%, effective July 1, 2011. These provisions for the MBT-General Business sunset effective June 30, 2013, at whichtime the tax rate will be 0.63% on all taxable wages per quarter. Estimated to generate an additional $117,981,497 in FY 2012 and $119,161,117 in FY 2013.
A.B. 561 extends the sunset from June 30, 2011, (approved in S.B. 429 (2009 Session)) to June 30, 2013, on the $100 increase in the Business License Fee (BLF) from $100 to $200 for the initial and annual renewal. Estimated to generate an additional $29,949,000 in FY 2012 and $30,100,000 in FY 2013.
A.B. 561 requires the 1% portion of the 10% Short-term Car Rental Tax, currently dedicated to the State Highway Fund based on A.B. 595 (2007 Session), to be deposited in the State General Fund along with the other 9%. This change is effective July 1, 2011, and is permanent. Estimated to generate $4,402,222 in FY 2012 and $4,457,778 in FY 2013.
The Legislature approved funding for the State Treasurer's Office to use a subscription rating service to allow for more effective investment in corporate securities, which is anticipated to generate additional interest income from the Treasurer's Office investment of the State General Fund. Estimated to generate $105,313 in FY 2012 and $244,750 in FY 2013.
A.B. 219 requires 75 percent of the value of expired slot machine wagering vouchers retained by nonrestricted gaming licensees to be remitted to the Gaming Commission for deposit in the State General Fund on a quarterly basis. Based on the expiration period of 180 days for slot machine wagering vouchers and the effective date of July 1, 2011, only one quarterly payment will be made in FY 2012 with four quarterly payments made in FY 2013 and going forward. Estimated to generate $3,332,750 in FY 2012 and $13,331,000 in FY 2013.
A.B. 529 requires transfer of $19,112,621 in FY 2012 and $19,218,718 in FY 2013 from the Supplemental Account for Medical Assistance to Indigent Persons in the Fund for Hospital Care to Indigent Persons to the State General Fund. A.B. 531 (2009 Session) requires the deposit of the portion of the revenue generated from Court Administrative Assessment Fees to be deposited in the State General Fund. S.B. 136 reduces the period from 3 to 2 years after which certain types of unclaimed property is presumed to be abandoned if the holder of the property reported holding more than $10 million in property presumed to be abandoned for the most recent report filed with the Treasurer's Office. Based on the Treasurer's Office analysis of the entities subject to this change, it was estimated that there would be net gain in unclaimed property receipts in FY 2012 of $30,594,750, but a net loss in FY 2013 of $33,669,923.
FY 2014: Represents legislative actions approved during the 2013 Legislative Session.S.B. 475 extends the June 30, 2013, sunset (approved in A.B. 561 (2011)) to June 30, 2015, on the Net Proceeds of Minerals (NPM) tax, which continues the payment of taxes in the current fiscal year based on the estimated net proceeds for the current calendar year with a true-up against actual net proceeds for the calendar year in the next fiscal year. The two-year extension of the sunset is estimated to yield $88,295,000 in FY 2014 as tax payments are required in FY 2015 with or without the extension of the sunset. The extension of the sunset is also estimated to generate an additional $2,936,000 in FY 2015 as the difference between Economic Forum forecast for FY 2015, based on elimination of the sunset, and the estimate based on the extension of the sunset approved in S.B. 475.S.B. 475 extends the June 30, 2013, sunset (approved in S.B. 493 (2011)) to June 30, 2015, that eliminates health and industrial insurance deductions allowed against gross proceeds to determine net proceeds for the purpose of calculating the Net Proceeds of Minerals (NPM) tax liability. These deduction changes are effective for the NPM tax payments due in FY 2014 and FY 2015. The health and industrial insurance deduction changes are estimated to generate $7,393,000 in addtional revenue in FY 2014 and $9,741,000 in FY 2015.Extension of the sunset on the 0.35% increase in the Local School Support Tax (LSST) in S.B. 475 from June 30, 2013, to June 30, 2015, generates additional revenue from the 0.75% General Fund Commission assessed against LSST proceeds before distribution to school districts in each county. Estimated to generate $1,226,600 in FY 2014 and $1,294,100 in FY 2015.S.B. 475 changes the structure and tax rate for the Modified Business Tax on General Business (nonfinancial institutions) for FY 2014 and FY 2015 by exempting taxable wages (gross wages less allowable health care expenses) paid by an employer to employees up to and including $85,000 per quarter and taxable wages exceeding $85,000 per quarter are taxed at 1.17%, effective July 1, 2013. The taxable wages exemption threshold was $62,500 per quarter for FY 2012 and FY 2013, based on A.B. 561 (2011). These provisions in S.B. 475 for the MBT-General Business sunset effective June 30, 2015, at which time the tax rate will be 0.63% on all taxable wages per quarter. Estimated to generate an additional $113,501,000 in FY 2014 and $120,572,000 in FY 2015.
DESCRIPTIONFY 2014 ACTUAL
% Change
FY 2015 ACTUAL
% Change
FY 2016 ACTUAL
% Change
% Change
% Change
% Change
GENERAL FUND REVENUES - ECONOMIC FORUM DECEMBER 6, 2016, FORECASTACTUAL: FY 2014 THROUGH FY 2016 AND FORECAST: FY 2017 THROUGH FY 2019
ECONOMIC FORUM'S FORECAST FOR FY 2017, FY 2018, AND FY 2019 APPROVED AT THE DECEMBER 6, 2016, MEETINGECONOMIC FORUM DECEMBER 6, 2016, FORECAST
FY 2017 FORECAST
FY 2018 FORECAST
FY 2019 FORECAST
[5-14]
[6-14]
[7-14]
[8-14]
[9-14]
[10-14]
[11-14]
[12-14]
[13-14]
[1-16]
[2-16]
[3-16]
[4-16]
[5-16]
[6-16]
[7-16]
[8-16]
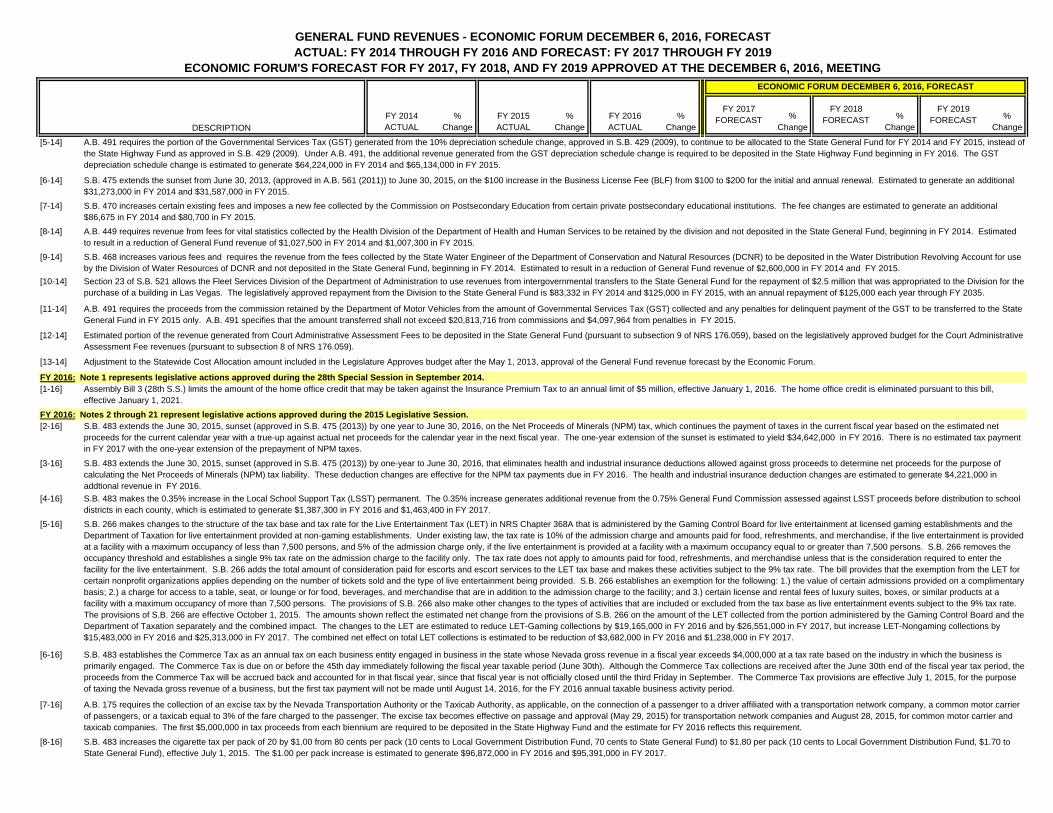
S.B. 470 increases certain existing fees and imposes a new fee collected by the Commission on Postsecondary Education from certain private postsecondary educational institutions. The fee changes are estimated to generate an additional $86,675 in FY 2014 and $80,700 in FY 2015.
A.B. 491 requires the portion of the Governmental Services Tax (GST) generated from the 10% depreciation schedule change, approved in S.B. 429 (2009), to continue to be allocated to the State General Fund for FY 2014 and FY 2015, instead of the State Highway Fund as approved in S.B. 429 (2009). Under A.B. 491, the additional revenue generated from the GST depreciation schedule change is required to be deposited in the State Highway Fund beginning in FY 2016. The GST depreciation schedule change is estimated to generate $64,224,000 in FY 2014 and $65,134,000 in FY 2015.
S.B. 475 extends the sunset from June 30, 2013, (approved in A.B. 561 (2011)) to June 30, 2015, on the $100 increase in the Business License Fee (BLF) from $100 to $200 for the initial and annual renewal. Estimated to generate an additional $31,273,000 in FY 2014 and $31,587,000 in FY 2015.
S.B. 483 makes the 0.35% increase in the Local School Support Tax (LSST) permanent. The 0.35% increase generates additional revenue from the 0.75% General Fund Commission assessed against LSST proceeds before distribution to school districts in each county, which is estimated to generate $1,387,300 in FY 2016 and $1,463,400 in FY 2017.
A.B. 449 requires revenue from fees for vital statistics collected by the Health Division of the Department of Health and Human Services to be retained by the division and not deposited in the State General Fund, beginning in FY 2014. Estimated to result in a reduction of General Fund revenue of $1,027,500 in FY 2014 and $1,007,300 in FY 2015.S.B. 468 increases various fees and requires the revenue from the fees collected by the State Water Engineer of the Department of Conservation and Natural Resources (DCNR) to be deposited in the Water Distribution Revolving Account for use by the Division of Water Resources of DCNR and not deposited in the State General Fund, beginning in FY 2014. Estimated to result in a reduction of General Fund revenue of $2,600,000 in FY 2014 and FY 2015.Section 23 of S.B. 521 allows the Fleet Services Division of the Department of Administration to use revenues from intergovernmental transfers to the State General Fund for the repayment of $2.5 million that was appropriated to the Division for the purchase of a building in Las Vegas. The legislatively approved repayment from the Division to the State General Fund is $83,332 in FY 2014 and $125,000 in FY 2015, with an annual repayment of $125,000 each year through FY 2035.
A.B. 491 requires the proceeds from the commission retained by the Department of Motor Vehicles from the amount of Governmental Services Tax (GST) collected and any penalties for delinquent payment of the GST to be transferred to the State General Fund in FY 2015 only. A.B. 491 specifies that the amount transferred shall not exceed $20,813,716 from commissions and $4,097,964 from penalties in FY 2015.
Estimated portion of the revenue generated from Court Administrative Assessment Fees to be deposited in the State General Fund (pursuant to subsection 9 of NRS 176.059), based on the legislatively approved budget for the Court Administrative Assessment Fee revenues (pursuant to subsection 8 of NRS 176.059).
Adjustment to the Statewide Cost Allocation amount included in the Legislature Approves budget after the May 1, 2013, approval of the General Fund revenue forecast by the Economic Forum.
FY 2016: Note 1 represents legislative actions approved during the 28th Special Session in September 2014.Assembly Bill 3 (28th S.S.) limits the amount of the home office credit that may be taken against the Insurance Premium Tax to an annual limit of $5 million, effective January 1, 2016. The home office credit is eliminated pursuant to this bill, effective January 1, 2021.
FY 2016: Notes 2 through 21 represent legislative actions approved during the 2015 Legislative Session.S.B. 483 extends the June 30, 2015, sunset (approved in S.B. 475 (2013)) by one year to June 30, 2016, on the Net Proceeds of Minerals (NPM) tax, which continues the payment of taxes in the current fiscal year based on the estimated net proceeds for the current calendar year with a true-up against actual net proceeds for the calendar year in the next fiscal year. The one-year extension of the sunset is estimated to yield $34,642,000 in FY 2016. There is no estimated tax payment in FY 2017 with the one-year extension of the prepayment of NPM taxes.
S.B. 483 extends the June 30, 2015, sunset (approved in S.B. 475 (2013)) by one-year to June 30, 2016, that eliminates health and industrial insurance deductions allowed against gross proceeds to determine net proceeds for the purpose of calculating the Net Proceeds of Minerals (NPM) tax liability. These deduction changes are effective for the NPM tax payments due in FY 2016. The health and industrial insurance deduction changes are estimated to generate $4,221,000 in addtional revenue in FY 2016.
S.B. 266 makes changes to the structure of the tax base and tax rate for the Live Entertainment Tax (LET) in NRS Chapter 368A that is administered by the Gaming Control Board for live entertainment at licensed gaming establishments and the Department of Taxation for live entertainment provided at non-gaming establishments. Under existing law, the tax rate is 10% of the admission charge and amounts paid for food, refreshments, and merchandise, if the live entertainment is provided at a facility with a maximum occupancy of less than 7,500 persons, and 5% of the admission charge only, if the live entertainment is provided at a facility with a maximum occupancy equal to or greater than 7,500 persons. S.B. 266 removes the occupancy threshold and establishes a single 9% tax rate on the admission charge to the facility only. The tax rate does not apply to amounts paid for food, refreshments, and merchandise unless that is the consideration required to enter the facility for the live entertainment. S.B. 266 adds the total amount of consideration paid for escorts and escort services to the LET tax base and makes these activities subject to the 9% tax rate. The bill provides that the exemption from the LET for certain nonprofit organizations applies depending on the number of tickets sold and the type of live entertainment being provided. S.B. 266 establishes an exemption for the following: 1.) the value of certain admissions provided on a complimentary basis; 2.) a charge for access to a table, seat, or lounge or for food, beverages, and merchandise that are in addition to the admission charge to the facility; and 3.) certain license and rental fees of luxury suites, boxes, or similar products at a facility with a maximum occupancy of more than 7,500 persons. The provisions of S.B. 266 also make other changes to the types of activities that are included or excluded from the tax base as live entertainment events subject to the 9% tax rate. The provisions of S.B. 266 are effective October 1, 2015. The amounts shown reflect the estimated net change from the provisions of S.B. 266 on the amount of the LET collected from the portion administered by the Gaming Control Board and the Department of Taxation separately and the combined impact. The changes to the LET are estimated to reduce LET-Gaming collections by $19,165,000 in FY 2016 and by $26,551,000 in FY 2017, but increase LET-Nongaming collections by $15,483,000 in FY 2016 and $25,313,000 in FY 2017. The combined net effect on total LET collections is estimated to be reduction of $3,682,000 in FY 2016 and $1,238,000 in FY 2017.
S.B. 483 establishes the Commerce Tax as an annual tax on each business entity engaged in business in the state whose Nevada gross revenue in a fiscal year exceeds $4,000,000 at a tax rate based on the industry in which the business is primarily engaged. The Commerce Tax is due on or before the 45th day immediately following the fiscal year taxable period (June 30th). Although the Commerce Tax collections are received after the June 30th end of the fiscal year tax period, the proceeds from the Commerce Tax will be accrued back and accounted for in that fiscal year, since that fiscal year is not officially closed until the third Friday in September. The Commerce Tax provisions are effective July 1, 2015, for the purpose of taxing the Nevada gross revenue of a business, but the first tax payment will not be made until August 14, 2016, for the FY 2016 annual taxable business activity period.
A.B. 175 requires the collection of an excise tax by the Nevada Transportation Authority or the Taxicab Authority, as applicable, on the connection of a passenger to a driver affiliated with a transportation network company, a common motor carrier of passengers, or a taxicab equal to 3% of the fare charged to the passenger. The excise tax becomes effective on passage and approval (May 29, 2015) for transportation network companies and August 28, 2015, for common motor carrier and taxicab companies. The first $5,000,000 in tax proceeds from each biennium are required to be deposited in the State Highway Fund and the estimate for FY 2016 reflects this requirement.
S.B. 483 increases the cigarette tax per pack of 20 by $1.00 from 80 cents per pack (10 cents to Local Government Distribution Fund, 70 cents to State General Fund) to $1.80 per pack (10 cents to Local Government Distribution Fund, $1.70 to State General Fund), effective July 1, 2015. The $1.00 per pack increase is estimated to generate $96,872,000 in FY 2016 and $95,391,000 in FY 2017.
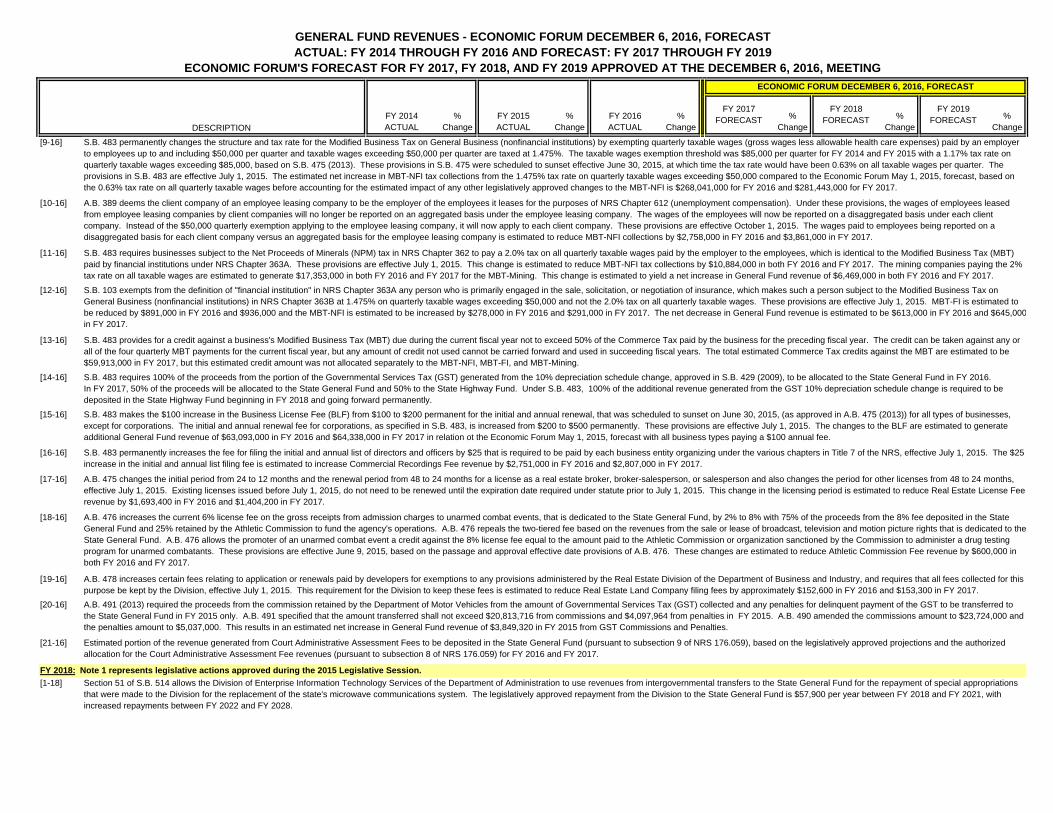
DESCRIPTIONFY 2014 ACTUAL
% Change
FY 2015 ACTUAL
% Change
FY 2016 ACTUAL
% Change
% Change
% Change
% Change
GENERAL FUND REVENUES - ECONOMIC FORUM DECEMBER 6, 2016, FORECASTACTUAL: FY 2014 THROUGH FY 2016 AND FORECAST: FY 2017 THROUGH FY 2019
ECONOMIC FORUM'S FORECAST FOR FY 2017, FY 2018, AND FY 2019 APPROVED AT THE DECEMBER 6, 2016, MEETINGECONOMIC FORUM DECEMBER 6, 2016, FORECAST
FY 2017 FORECAST
FY 2018 FORECAST
FY 2019 FORECAST
[9-16]
[10-16]
[11-16]
[12-16]
[13-16]
[14-16]
[15-16]
[16-16]
[17-16]
[18-16]
[19-16]
[20-16]
[21-16]
[1-18]
S.B. 483 permanently increases the fee for filing the initial and annual list of directors and officers by $25 that is required to be paid by each business entity organizing under the various chapters in Title 7 of the NRS, effective July 1, 2015. The $25 increase in the initial and annual list filing fee is estimated to increase Commercial Recordings Fee revenue by $2,751,000 in FY 2016 and $2,807,000 in FY 2017.
S.B. 483 permanently changes the structure and tax rate for the Modified Business Tax on General Business (nonfinancial institutions) by exempting quarterly taxable wages (gross wages less allowable health care expenses) paid by an employer to employees up to and including $50,000 per quarter and taxable wages exceeding $50,000 per quarter are taxed at 1.475%. The taxable wages exemption threshold was $85,000 per quarter for FY 2014 and FY 2015 with a 1.17% tax rate on quarterly taxable wages exceeding $85,000, based on S.B. 475 (2013). These provisions in S.B. 475 were scheduled to sunset effective June 30, 2015, at which time the tax rate would have been 0.63% on all taxable wages per quarter. The provisions in S.B. 483 are effective July 1, 2015. The estimated net increase in MBT-NFI tax collections from the 1.475% tax rate on quarterly taxable wages exceeding $50,000 compared to the Economic Forum May 1, 2015, forecast, based on the 0.63% tax rate on all quarterly taxable wages before accounting for the estimated impact of any other legislatively approved changes to the MBT-NFI is $268,041,000 for FY 2016 and $281,443,000 for FY 2017.
A.B. 389 deems the client company of an employee leasing company to be the employer of the employees it leases for the purposes of NRS Chapter 612 (unemployment compensation). Under these provisions, the wages of employees leased from employee leasing companies by client companies will no longer be reported on an aggregated basis under the employee leasing company. The wages of the employees will now be reported on a disaggregated basis under each client company. Instead of the $50,000 quarterly exemption applying to the employee leasing company, it will now apply to each client company. These provisions are effective October 1, 2015. The wages paid to employees being reported on a disaggregated basis for each client company versus an aggregated basis for the employee leasing company is estimated to reduce MBT-NFI collections by $2,758,000 in FY 2016 and $3,861,000 in FY 2017.
S.B. 483 requires businesses subject to the Net Proceeds of Minerals (NPM) tax in NRS Chapter 362 to pay a 2.0% tax on all quarterly taxable wages paid by the employer to the employees, which is identical to the Modified Business Tax (MBT) paid by financial institutions under NRS Chapter 363A. These provisions are effective July 1, 2015. This change is estimated to reduce MBT-NFI tax collections by $10,884,000 in both FY 2016 and FY 2017. The mining companies paying the 2% tax rate on all taxable wages are estimated to generate $17,353,000 in both FY 2016 and FY 2017 for the MBT-Mining. This change is estimated to yield a net increase in General Fund revenue of $6,469,000 in both FY 2016 and FY 2017.
S.B. 103 exempts from the definition of "financial institution" in NRS Chapter 363A any person who is primarily engaged in the sale, solicitation, or negotiation of insurance, which makes such a person subject to the Modified Business Tax on General Business (nonfinancial institutions) in NRS Chapter 363B at 1.475% on quarterly taxable wages exceeding $50,000 and not the 2.0% tax on all quarterly taxable wages. These provisions are effective July 1, 2015. MBT-FI is estimated to be reduced by $891,000 in FY 2016 and $936,000 and the MBT-NFI is estimated to be increased by $278,000 in FY 2016 and $291,000 in FY 2017. The net decrease in General Fund revenue is estimated to be $613,000 in FY 2016 and $645,000in FY 2017.
S.B. 483 provides for a credit against a business's Modified Business Tax (MBT) due during the current fiscal year not to exceed 50% of the Commerce Tax paid by the business for the preceding fiscal year. The credit can be taken against any or all of the four quarterly MBT payments for the current fiscal year, but any amount of credit not used cannot be carried forward and used in succeeding fiscal years. The total estimated Commerce Tax credits against the MBT are estimated to be $59,913,000 in FY 2017, but this estimated credit amount was not allocated separately to the MBT-NFI, MBT-FI, and MBT-Mining.
S.B. 483 requires 100% of the proceeds from the portion of the Governmental Services Tax (GST) generated from the 10% depreciation schedule change, approved in S.B. 429 (2009), to be allocated to the State General Fund in FY 2016. In FY 2017, 50% of the proceeds will be allocated to the State General Fund and 50% to the State Highway Fund. Under S.B. 483, 100% of the additional revenue generated from the GST 10% depreciation schedule change is required to be deposited in the State Highway Fund beginning in FY 2018 and going forward permanently.
S.B. 483 makes the $100 increase in the Business License Fee (BLF) from $100 to $200 permanent for the initial and annual renewal, that was scheduled to sunset on June 30, 2015, (as approved in A.B. 475 (2013)) for all types of businesses, except for corporations. The initial and annual renewal fee for corporations, as specified in S.B. 483, is increased from $200 to $500 permanently. These provisions are effective July 1, 2015. The changes to the BLF are estimated to generate additional General Fund revenue of $63,093,000 in FY 2016 and $64,338,000 in FY 2017 in relation ot the Economic Forum May 1, 2015, forecast with all business types paying a $100 annual fee.
A.B. 475 changes the initial period from 24 to 12 months and the renewal period from 48 to 24 months for a license as a real estate broker, broker-salesperson, or salesperson and also changes the period for other licenses from 48 to 24 months, effective July 1, 2015. Existing licenses issued before July 1, 2015, do not need to be renewed until the expiration date required under statute prior to July 1, 2015. This change in the licensing period is estimated to reduce Real Estate License Fee revenue by $1,693,400 in FY 2016 and $1,404,200 in FY 2017.
A.B. 476 increases the current 6% license fee on the gross receipts from admission charges to unarmed combat events, that is dedicated to the State General Fund, by 2% to 8% with 75% of the proceeds from the 8% fee deposited in the State General Fund and 25% retained by the Athletic Commission to fund the agency's operations. A.B. 476 repeals the two-tiered fee based on the revenues from the sale or lease of broadcast, television and motion picture rights that is dedicated to theState General Fund. A.B. 476 allows the promoter of an unarmed combat event a credit against the 8% license fee equal to the amount paid to the Athletic Commission or organization sanctioned by the Commission to administer a drug testing program for unarmed combatants. These provisions are effective June 9, 2015, based on the passage and approval effective date provisions of A.B. 476. These changes are estimated to reduce Athletic Commission Fee revenue by $600,000 in both FY 2016 and FY 2017.
A.B. 478 increases certain fees relating to application or renewals paid by developers for exemptions to any provisions administered by the Real Estate Division of the Department of Business and Industry, and requires that all fees collected for this purpose be kept by the Division, effective July 1, 2015. This requirement for the Division to keep these fees is estimated to reduce Real Estate Land Company filing fees by approximately $152,600 in FY 2016 and $153,300 in FY 2017.A.B. 491 (2013) required the proceeds from the commission retained by the Department of Motor Vehicles from the amount of Governmental Services Tax (GST) collected and any penalties for delinquent payment of the GST to be transferred to the State General Fund in FY 2015 only. A.B. 491 specified that the amount transferred shall not exceed $20,813,716 from commissions and $4,097,964 from penalties in FY 2015. A.B. 490 amended the commissions amount to $23,724,000 and the penalties amount to $5,037,000. This results in an estimated net increase in General Fund revenue of $3,849,320 in FY 2015 from GST Commissions and Penalties.
Estimated portion of the revenue generated from Court Administrative Assessment Fees to be deposited in the State General Fund (pursuant to subsection 9 of NRS 176.059), based on the legislatively approved projections and the authorized allocation for the Court Administrative Assessment Fee revenues (pursuant to subsection 8 of NRS 176.059) for FY 2016 and FY 2017.
FY 2018: Note 1 represents legislative actions approved during the 2015 Legislative Session.Section 51 of S.B. 514 allows the Division of Enterprise Information Technology Services of the Department of Administration to use revenues from intergovernmental transfers to the State General Fund for the repayment of special appropriations that were made to the Division for the replacement of the state's microwave communications system. The legislatively approved repayment from the Division to the State General Fund is $57,900 per year between FY 2018 and FY 2021, with increased repayments between FY 2022 and FY 2028.
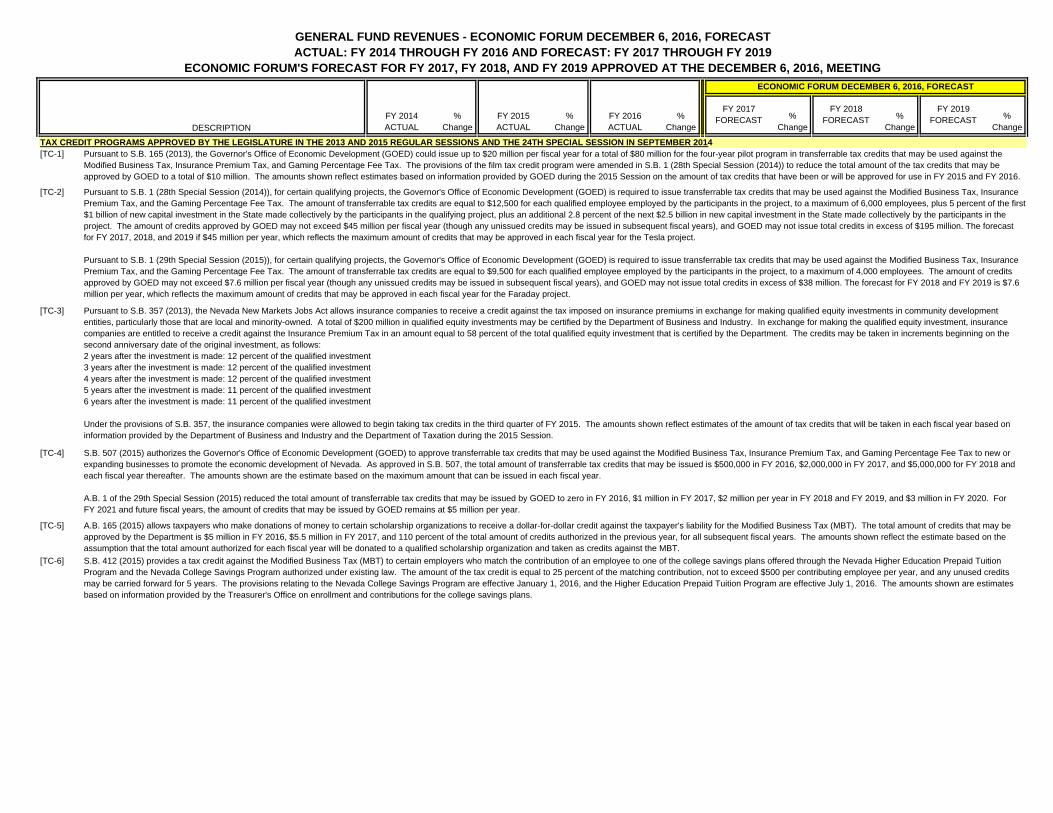
DESCRIPTIONFY 2014 ACTUAL
% Change
FY 2015 ACTUAL
% Change
FY 2016 ACTUAL
% Change
% Change
% Change
% Change
GENERAL FUND REVENUES - ECONOMIC FORUM DECEMBER 6, 2016, FORECASTACTUAL: FY 2014 THROUGH FY 2016 AND FORECAST: FY 2017 THROUGH FY 2019
ECONOMIC FORUM'S FORECAST FOR FY 2017, FY 2018, AND FY 2019 APPROVED AT THE DECEMBER 6, 2016, MEETINGECONOMIC FORUM DECEMBER 6, 2016, FORECAST
FY 2017 FORECAST
FY 2018 FORECAST
FY 2019 FORECAST
[TC-1]
[TC-2]
[TC-3]
[TC-4]
[TC-5]
[TC-6] S.B. 412 (2015) provides a tax credit against the Modified Business Tax (MBT) to certain employers who match the contribution of an employee to one of the college savings plans offered through the Nevada Higher Education Prepaid Tuition Program and the Nevada College Savings Program authorized under existing law. The amount of the tax credit is equal to 25 percent of the matching contribution, not to exceed $500 per contributing employee per year, and any unused credits may be carried forward for 5 years. The provisions relating to the Nevada College Savings Program are effective January 1, 2016, and the Higher Education Prepaid Tuition Program are effective July 1, 2016. The amounts shown are estimates based on information provided by the Treasurer's Office on enrollment and contributions for the college savings plans.
TAX CREDIT PROGRAMS APPROVED BY THE LEGISLATURE IN THE 2013 AND 2015 REGULAR SESSIONS AND THE 24TH SPECIAL SESSION IN SEPTEMBER 2014Pursuant to S.B. 165 (2013), the Governor's Office of Economic Development (GOED) could issue up to $20 million per fiscal year for a total of $80 million for the four-year pilot program in transferrable tax credits that may be used against the Modified Business Tax, Insurance Premium Tax, and Gaming Percentage Fee Tax. The provisions of the film tax credit program were amended in S.B. 1 (28th Special Session (2014)) to reduce the total amount of the tax credits that may be approved by GOED to a total of $10 million. The amounts shown reflect estimates based on information provided by GOED during the 2015 Session on the amount of tax credits that have been or will be approved for use in FY 2015 and FY 2016.
Pursuant to S.B. 1 (28th Special Session (2014)), for certain qualifying projects, the Governor's Office of Economic Development (GOED) is required to issue transferrable tax credits that may be used against the Modified Business Tax, Insurance Premium Tax, and the Gaming Percentage Fee Tax. The amount of transferrable tax credits are equal to $12,500 for each qualified employee employed by the participants in the project, to a maximum of 6,000 employees, plus 5 percent of the first $1 billion of new capital investment in the State made collectively by the participants in the qualifying project, plus an additional 2.8 percent of the next $2.5 billion in new capital investment in the State made collectively by the participants in the project. The amount of credits approved by GOED may not exceed $45 million per fiscal year (though any unissued credits may be issued in subsequent fiscal years), and GOED may not issue total credits in excess of $195 million. The forecast for FY 2017, 2018, and 2019 if $45 million per year, which reflects the maximum amount of credits that may be approved in each fiscal year for the Tesla project.
Pursuant to S.B. 1 (29th Special Session (2015)), for certain qualifying projects, the Governor's Office of Economic Development (GOED) is required to issue transferrable tax credits that may be used against the Modified Business Tax, Insurance Premium Tax, and the Gaming Percentage Fee Tax. The amount of transferrable tax credits are equal to $9,500 for each qualified employee employed by the participants in the project, to a maximum of 4,000 employees. The amount of credits approved by GOED may not exceed $7.6 million per fiscal year (though any unissued credits may be issued in subsequent fiscal years), and GOED may not issue total credits in excess of $38 million. The forecast for FY 2018 and FY 2019 is $7.6 million per year, which reflects the maximum amount of credits that may be approved in each fiscal year for the Faraday project.
Pursuant to S.B. 357 (2013), the Nevada New Markets Jobs Act allows insurance companies to receive a credit against the tax imposed on insurance premiums in exchange for making qualified equity investments in community development entities, particularly those that are local and minority-owned. A total of $200 million in qualified equity investments may be certified by the Department of Business and Industry. In exchange for making the qualified equity investment, insurance companies are entitled to receive a credit against the Insurance Premium Tax in an amount equal to 58 percent of the total qualified equity investment that is certified by the Department. The credits may be taken in increments beginning on the second anniversary date of the original investment, as follows:2 years after the investment is made: 12 percent of the qualified investment3 years after the investment is made: 12 percent of the qualified investment4 years after the investment is made: 12 percent of the qualified investment5 years after the investment is made: 11 percent of the qualified investment6 years after the investment is made: 11 percent of the qualified investment
Under the provisions of S.B. 357, the insurance companies were allowed to begin taking tax credits in the third quarter of FY 2015. The amounts shown reflect estimates of the amount of tax credits that will be taken in each fiscal year based on information provided by the Department of Business and Industry and the Department of Taxation during the 2015 Session.
S.B. 507 (2015) authorizes the Governor's Office of Economic Development (GOED) to approve transferrable tax credits that may be used against the Modified Business Tax, Insurance Premium Tax, and Gaming Percentage Fee Tax to new or expanding businesses to promote the economic development of Nevada. As approved in S.B. 507, the total amount of transferrable tax credits that may be issued is $500,000 in FY 2016, $2,000,000 in FY 2017, and $5,000,000 for FY 2018 and each fiscal year thereafter. The amounts shown are the estimate based on the maximum amount that can be issued in each fiscal year.
A.B. 1 of the 29th Special Session (2015) reduced the total amount of transferrable tax credits that may be issued by GOED to zero in FY 2016, $1 million in FY 2017, $2 million per year in FY 2018 and FY 2019, and $3 million in FY 2020. For FY 2021 and future fiscal years, the amount of credits that may be issued by GOED remains at $5 million per year.
A.B. 165 (2015) allows taxpayers who make donations of money to certain scholarship organizations to receive a dollar-for-dollar credit against the taxpayer's liability for the Modified Business Tax (MBT). The total amount of credits that may be approved by the Department is $5 million in FY 2016, $5.5 million in FY 2017, and 110 percent of the total amount of credits authorized in the previous year, for all subsequent fiscal years. The amounts shown reflect the estimate based on the assumption that the total amount authorized for each fiscal year will be donated to a qualified scholarship organization and taken as credits against the MBT.
Related Documents