


An Integrated Analysis of Molecular Acclimation to HighLight in the Marine Diatom Phaeodactylum tricornutumMarianne Nymark, Kristin C. Valle, Tore Brembu, Kasper Hancke, Per Winge, Kjersti Andresen, Geir
Johnsen, Atle M. Bones*
Department of Biology, Norwegian University of Science and Technology, Trondheim, Norway
Abstract
Photosynthetic diatoms are exposed to rapid and unpredictable changes in irradiance and spectral quality, and must beable to acclimate their light harvesting systems to varying light conditions. Molecular mechanisms behind light acclimationin diatoms are largely unknown. We set out to investigate the mechanisms of high light acclimation in Phaeodactylumtricornutum using an integrated approach involving global transcriptional profiling, metabolite profiling and variablefluorescence technique. Algae cultures were acclimated to low light (LL), after which the cultures were transferred to highlight (HL). Molecular, metabolic and physiological responses were studied at time points 0.5 h, 3 h, 6 h, 12 h, 24 h and 48 hafter transfer to HL conditions. The integrated results indicate that the acclimation mechanisms in diatoms can be dividedinto an initial response phase (0–0.5 h), an intermediate acclimation phase (3–12 h) and a late acclimation phase (12–48 h).The initial phase is recognized by strong and rapid regulation of genes encoding proteins involved in photosynthesis,pigment metabolism and reactive oxygen species (ROS) scavenging systems. A significant increase in light protectingmetabolites occur together with the induction of transcriptional processes involved in protection of cellular structures atthis early phase. During the following phases, the metabolite profiling display a pronounced decrease in light harvestingpigments, whereas the variable fluorescence measurements show that the photosynthetic capacity increases stronglyduring the late acclimation phase. We show that P. tricornutum is capable of swift and efficient execution of photoprotectivemechanisms, followed by changes in the composition of the photosynthetic machinery that enable the diatoms to utilizethe excess energy available in HL. Central molecular players in light protection and acclimation to high irradiance have beenidentified.
Citation: Nymark M, Valle KC, Brembu T, Hancke K, Winge P, et al. (2009) An Integrated Analysis of Molecular Acclimation to High Light in the Marine DiatomPhaeodactylum tricornutum. PLoS ONE 4(11): e7743. doi:10.1371/journal.pone.0007743
Editor: Markus Grebe, Umea Plant Science Centre, Sweden
Received July 5, 2009; Accepted October 6, 2009; Published November 3, 2009
Copyright: � 2009 Nymark et al. This is an open-access article distributed under the terms of the Creative Commons Attribution License, which permitsunrestricted use, distribution, and reproduction in any medium, provided the original author and source are credited.
Funding: This work was supported by the Functional Genomics (FUGE) program of the Norwegian Research Council (grant # 184146/S10) and a PhD grant fromthe Norwegian University of Science and Technology. The funders had no role in study design, data collection and analysis, decision to publish, or preparation ofthe manuscript.
Competing Interests: The authors have declared that no competing interests exist.
* E-mail: [email protected]
Introduction
The planktonic diatoms (Bacillariophyceae) account for ap-
proximately 40% of the primary production in the world oceans
[1]. They are the dominant group of phytoplankton in cold waters
[2] and have to cope with highly unpredictable and rapid changes
in irradiances (PAR) and spectral quality (El). In low light it is
necessary to collect photons as efficiently as possible, and when the
light intensity becomes supersaturating for photosynthesis, it
becomes necessary to protect the organism from potential photo-
oxidative damage to the photosynthetic machinery. In order to
optimize growth and reproduction and to minimize photodamage,
phytoplankton has developed a number of mechanisms to
modulate the rate of photosynthesis in situ. The photoacclimational
mechanisms describe the short-term adjustments in response to
changing light climate (physiological acclimation), while the
photoadaptational mechanisms indicate a long-term evolutionary
outcome based on the genes of the given species (genetic
adaptation). Both processes work together to maximize evolution-
ary fitness under a given set of environmental conditions [3]. Over
the last four decades, progress in understanding photosynthesis is
gradually moving from a descriptive and physiological approach to
a molecular one. The whole-genome sequencing of Thalassiosira
pseudonana [4] and Phaeodactylum tricornutum [5] has made possible
detailed studies of the genetic basis of the unique properties
underlying the ecological and evolutionary success of diatoms.
Functional genomics have currently made it possible to investigate
the molecular processes behind acclimation to changing environ-
mental conditions in marine organisms. Genomic approaches to
this field of investigation are expected to provide new and essential
information for studying and monitoring biodiversity, acclimation
and adaptations to life in the ocean.
Important and well-known short-term acclimational mecha-
nisms include photochemical quenching (PQ) related to fraction of
open reaction centres in PSII [6] and non-photochemical
quenching (NPQ) of chlorophyll fluorescence related to pH and
photoprotective carotenoids (PPCs), changes in the distribution of
excitation energy between photosystems I (PSI) and II (PSII), and
damage and repair of PSII [7]. NPQ is the most important short-
term ‘‘safety valve’’ that is activated by a sudden increase in
irradiance, and can be measured by a decrease in chlorophyll a
(Chl a) fluorescence intensity under HL [8]. In this process,
harmful excess energy is dissipated as heat radiation. It is
established that NPQ occurs in the light harvesting system of
PLoS ONE | www.plosone.org 1 November 2009 | Volume 4 | Issue 11 | e7743
PSII, is triggered by DpH and modulated by de-epoxidation of
xanthophylls [9–11]. In diatoms, the main xanthophyll cycle is the
diadinoxanthin (DD) cycle, which involves a forward reaction that
converts DD, a carotenoid with low light energy transfer efficiency
[12,13] into diatoxanthin (DT) under conditions of HL. The high
photosynthetic flexibility of diatoms is strongly related to their high
capacity of NPQ, which can reach a 5-fold higher level than in
plants [14]. In addition, the intensity dependence of a rise in
variable fluorescence in P. tricornutum suggests that light absorbed
by the light-harvesting Chl a/c-Fucoxanthin complex is not
preferentially delivered to PSII, but is more equally distributed
between the photosystems. These results described by Owens [15]
imply that, under both low and high irradiances, adjustments are
made in the transfer of excitation energy to the PSII reaction
centre which prevents prolonged loss of photosynthetic capacity.
These differences in the photosynthetic mechanism of diatoms
compared to higher plants may be central to the ecological success
of diatoms in a variable light environment. Despite the different
photoprotective mechanisms evolved by photosynthetic organisms,
light above the saturation point for photosynthesis (the light-
saturation index, Ek) can cause fatal oxidative damage to the PSII
reaction centre and result in a decrease in photosynthetic
efficiency or photoinhibition [16–18]. Photoinhibition occurs
when the rate of damage exceeds the capacity of the PSII repair
mechanisms [19]. The reaction centre-binding D1 protein is the
PSII component most prone to photooxidative damage [20]. The
complex mechanisms behind the degradation and repair of PSII
and its components have been a subject of investigation for several
decades [19, 21). Damaged D1 proteins must be removed and
replaced by newly synthesized molecules for the PSII to recover,
and an increased rate of D1 synthesis has been reported for several
photosynthetic organisms in conditions of HL [19,22,23].
Established long-term acclimation responses to shifts in light
conditions include adjustments of the amount and ratios of light
harvesting pigments (LHPs) and alterations of the size of the
photosynthetic unit (PSU), which are reflected in changes of the
maximum photosynthetic capacity of the organism. HL-acclimat-
ed cells generally have a low LHP content and a high amount of
photoprotective carotenoids; the relationship is inversed for LL-
acclimated cells [7,12,24,25]. Some species of phytoplankton
acclimate to low irradiances by increasing the size of the PSU [26],
defined as the ratio of light-harvesting pigments to P700 reaction
centre Chl a [27]. Diatoms tend to have large PSU sizes when
grown at high, growth-rate-saturating irradiances; in contrast to
the smaller units reported for green algae [28] grown at optimal
irradiances. When rates of photosynthesis are not limited by light
[26], the larger PSU sizes observed for diatoms could represent an
evolutionary adaptation to large, daily fluctuating light environ-
ments in the ocean. Species with large PSU size growing in HL
should respond rapidly when mixed vertically down to low light in
deeper water.
Axenically cultured P. tricornutum was used to investigate the
processes of light acclimation in diatoms. We hypothesised that
algae should have a dynamic and fast responding regulatory
system that make acclimation to changing light conditions swift
and consistent. To study the molecular mechanisms of light
acclimation, we performed an integrated analysis combining time
series studies of pigment metabolites, fluorometry-based analyses
of activity and efficiency of photosystems, and studies of global
transcriptional regulation through genome wide transcriptional
profiling. The photoprotective carotenoids DD and DT were
detected and transcriptional profiles changed dramatically after
exposure to HL for only 0.5 h. Pulse Amplitude Modulated (PAM)
fluorometry analyses of the photosynthetic capacity showed that
significant acclimation to HL conditions were apparent some 12 h
after start of the HL treatment. The acclimation processes
continued during the next 36 h of exposure to HL conditions.
We have identified and categorised transcripts involved in the
various phases of light acclimation at a genomic scale.
Results
To study the mechanisms of protection and acclimation to high
irradiances in diatoms, LL acclimated cells were subjected to HL for
0.5 h, 3 h, 6 h, 12 h, 24 h and 48 h. Global transcriptional
regulation, change in pigment metabolites and efficiency and
capacity of photosynthesis were analyzed in the material harvested
from the six time-points. Based on the resulting measurements, the
cells seemed to respond to the treatment in three different phases
designated the initial response phase (0–0.5 h), the intermediate
acclimation phase (3–12 h) and the late acclimation phase (12–48 h).
Transcriptional profiling of nuclear and plastid transcriptsIn addition to the signals from probes representing nuclear-
encoded genes, signals from all probes representing chloroplast
genes were also detected on the microarrays. This observation
indicates that the oligo dT-promoter primer used during the
cDNA synthesis step included in the cRNA amplification
procedure has been able to hybridize to the poly(A)-rich tail
added to endonucleolytically cleaved mature transcripts from
chloroplast genes [29]. The poly(A) tail stabilizes nuclear-encoded
mRNAs in eukaryotic cells, whereas the poly(A)-rich tail serves as a
degradation signal in the chloroplast [29]. The ability to hybridize
not only to the poly(A)-tails of the nuclear-encoded mRNAs, but
also to the poly(A)-rich tails of the chloroplast-encoded mRNAs
has thereby facilitated the generation of cDNA from both types of
transcripts. Several chloroplast genes were found to be differen-
tially regulated based on the microarray analyses. If the
degradation rates of the chloroplast-encoded mRNAs are the
same in cells grown in LL and HL, the expression ratios calculated
from probes representing chloroplast genes will be indicative of the
regulation of these genes.
To determine the reliability of the microarray data from the
chloroplast genes, a two-step qRT-PCR was performed on the
RNA material used in the microarray analyses for time points
0.5 h, 3 h, 12 h and 24 h. The relative expression levels of eight
chloroplast-encoded genes considered to be of great importance
during the photoacclimation process were investigated by qRT-
PCR using random primers during the cDNA synthesis. The
results showed that relative expression levels obtained from the
qRT-PCR analysis correlated well with those produced by the
microarray analysis (Supplementary Figure S1). These results
imply that the expression ratios obtained from probes representing
chloroplast genes actually reflect the relative amounts of the
chloroplast gene products.
Synthesis of chlorophyll a and steroids. An immediate
response after transfer to HL conditions was a dramatic reduction
in expression of transcripts encoding enzymes in the Chl a
biosynthesis. In higher plants, Chl a is synthesized from glutamate
in a 15 step biosynthetic pathway [30] through the cooperative
action of a range of different enzymes. Transcripts for all genes
encoding enzymes involved in the Chl a synthesis of higher plants,
except for the gene encoding Mg-protoporphyrin IX monomethyl
ester cyclase (MgCy), were identified in P. tricornutum (Figure 1).
MgCy is also absent in Thalassiosira pseudonana [31]. In higher
plants, MgCy is responsible for converting Mg-protoporphyrin IX
monomethyl ester to divinyl protochlorophyllide. The majority of
the enzymes involved in the Chl a biosynthetic pathway are
Genomics of Light Acclimation
PLoS ONE | www.plosone.org 2 November 2009 | Volume 4 | Issue 11 | e7743
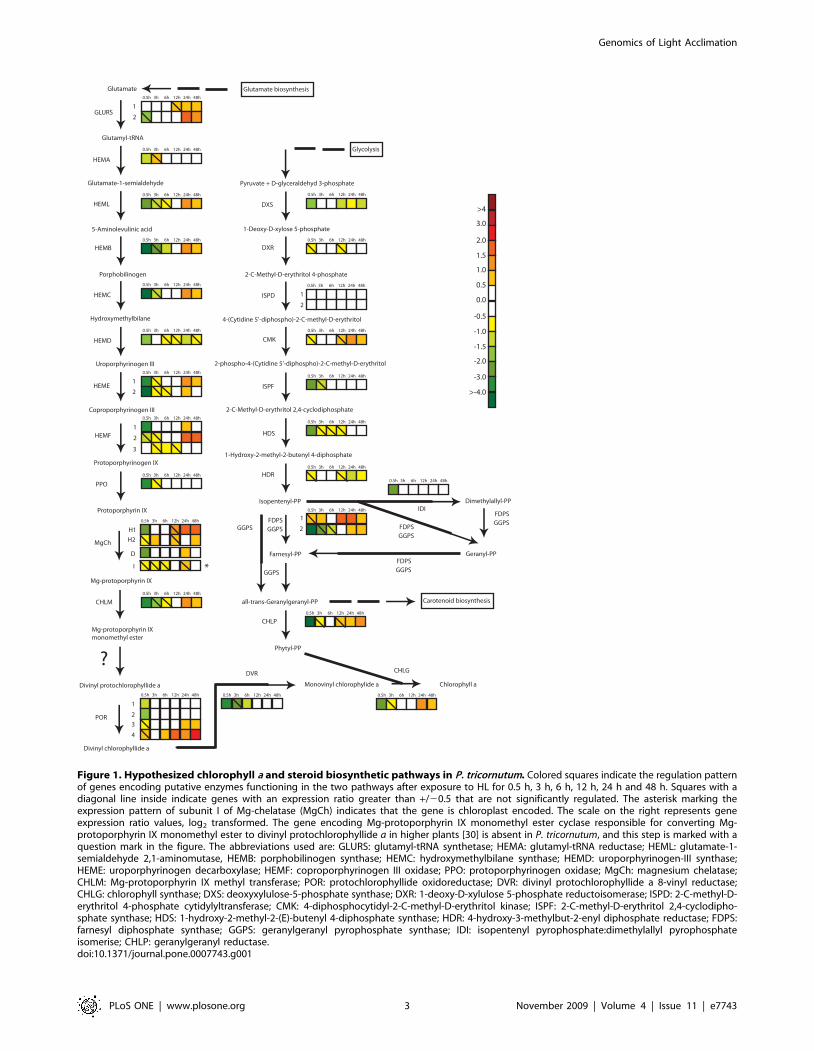
Figure 1. Hypothesized chlorophyll a and steroid biosynthetic pathways in P. tricornutum. Colored squares indicate the regulation patternof genes encoding putative enzymes functioning in the two pathways after exposure to HL for 0.5 h, 3 h, 6 h, 12 h, 24 h and 48 h. Squares with adiagonal line inside indicate genes with an expression ratio greater than +/20.5 that are not significantly regulated. The asterisk marking theexpression pattern of subunit I of Mg-chelatase (MgCh) indicates that the gene is chloroplast encoded. The scale on the right represents geneexpression ratio values, log2 transformed. The gene encoding Mg-protoporphyrin IX monomethyl ester cyclase responsible for converting Mg-protoporphyrin IX monomethyl ester to divinyl protochlorophyllide a in higher plants [30] is absent in P. tricornutum, and this step is marked with aquestion mark in the figure. The abbreviations used are: GLURS: glutamyl-tRNA synthetase; HEMA: glutamyl-tRNA reductase; HEML: glutamate-1-semialdehyde 2,1-aminomutase, HEMB: porphobilinogen synthase; HEMC: hydroxymethylbilane synthase; HEMD: uroporphyrinogen-III synthase;HEME: uroporphyrinogen decarboxylase; HEMF: coproporphyrinogen III oxidase; PPO: protoporphyrinogen oxidase; MgCh: magnesium chelatase;CHLM: Mg-protoporphyrin IX methyl transferase; POR: protochlorophyllide oxidoreductase; DVR: divinyl protochlorophyllide a 8-vinyl reductase;CHLG: chlorophyll synthase; DXS: deoxyxylulose-5-phosphate synthase; DXR: 1-deoxy-D-xylulose 5-phosphate reductoisomerase; ISPD: 2-C-methyl-D-erythritol 4-phosphate cytidylyltransferase; CMK: 4-diphosphocytidyl-2-C-methyl-D-erythritol kinase; ISPF: 2-C-methyl-D-erythritol 2,4-cyclodipho-sphate synthase; HDS: 1-hydroxy-2-methyl-2-(E)-butenyl 4-diphosphate synthase; HDR: 4-hydroxy-3-methylbut-2-enyl diphosphate reductase; FDPS:farnesyl diphosphate synthase; GGPS: geranylgeranyl pyrophosphate synthase; IDI: isopentenyl pyrophosphate:dimethylallyl pyrophosphateisomerise; CHLP: geranylgeranyl reductase.doi:10.1371/journal.pone.0007743.g001
Genomics of Light Acclimation
PLoS ONE | www.plosone.org 3 November 2009 | Volume 4 | Issue 11 | e7743
represented in the P. tricornutum genome by a single gene. The
enzymes encoded by multi-gene families are glutamyl-tRNA
synthetase (two genes, GLURS_1-2), uroporphyrinogen decar-
boxylase(HEME_1-2), coproporphyrinogen III oxidase (HEMF_1-
3), protochlorophyllide oxidoreductase (POR_1-4), and the H
subunit (CHLH_1-2) of Magnesium-chelatase (MgCh). All genes
encoding enzymes in the Chl a pathway are found in the nucleus,
with the exception of the CHLI gene encoding the MgCh I
subunit, which is chloroplast-encoded. The expression of all
nuclear single copy genes and at least one of each type of the
nuclear-encoded multi-copy genes involved in Chl a biosynthesis
dropped dramatically after 0.5 h (Figure 1), indicating a strong
down-regulation of every step in the synthesis of Chl a at this initial
response phase. The gene encoding CHLI was not significantly
affected by the HL treatment. Phytyl diphosphate produced by the
steroid biosynthesis pathway functions together with monovinyl
chlorophyllide a from the Chl a biosynthesis pathway as a substrate
for chlorophyll synthetase in the last step in the formation of Chl a.
The genes encoding putative geranylgeranyl diphosphate synthase
(GGPS) and geranylgeranyl reductase (CHLP), responsible for
converting isopentenyl diphosphate through several possible
intermediates to phytyl diphosphate, were also strongly down-
regulated at the initial phase (Figure 1). During the intermediate
acclimation phase, the transcript levels of the above mentioned
nuclear encoded genes gradually recovered, and after 12 h most
genes were back to LL levels. The majority of these genes were
found to be moderately up-regulated in the late acclimation phase.
Synthesis of carotenoids. A hypothetical carotenoid
biosynthetic pathway is presented in Figure 2, according to
Coesel et al. [32]. The genes identified and proposed to be involved
in the synthesis of carotenoids in P. tricornutum by Coesel et al. are
indicated on the figure. With a few intriguing exceptions the
transcript levels of these genes were in general little affected by the
exposure to HL. The most interesting and specific responses were
the immediate regulation of genes that might be involved in
controlling the forward reactions of the two xanthophyll cycles in
P. tricornutum. The P. tricornutum genome has been found to contain
three genes encoding zeaxanthin epoxidase (ZEP1-3), but it is not
known whether these genes encode enzymes involved in the
violaxanthin cycle, the diadinoxanthin cycle or possible both
cycles. After exposure to HL for 0.5 h, the expression level of
ZEP1 was clearly down-regulated, while ZEP3 gene expression
was clearly up-regulated, indicating that these two genes encode
enzymes with different functions. One possibility is that the ZEP1
gene encodes the enzyme responsible for converting zeaxanthin to
violaxanthin in LL, while the ZEP3 gene encodes the enzyme that
converts DD to DT in HL. ZEP1 and ZEP3 both showed little or
no regulation during the intermediate phase. At the late
acclimation phase, the ZEP1 gene expression was moderately
increased, while the ZEP3 gene expression level was maintained at
LL levels.
Light harvesting antenna proteins. The P. tricornutum
genome is predicted to encode at least 40 genes belonging to the
light-harvesting complex (LHC) superfamily. These gene
transcripts were all detected by the whole-genome array, and 37
out of the 40 genes were found to be significantly regulated at least
at one time point (Figure 3). The diatom light harvesting genes are
divided into three main groups [33]: the LHCF’s, encoding the
major fucoxanthin Chl a/c proteins, the red algal-like LHCR’s and
the LI818-like LHCX’s.
From the results presented in Figure 3 it is evident that most of
the transcripts encoding putative light harvesting antenna proteins
are continuously down-regulated during all three phases, reflecting
the expected acclimation to higher light irradiances. However, a
handful of transcripts in the same families are strongly up-
regulated, especially at the initial phase, indicating a role in
photoprotection. The most strongly induced genes, LHCR6,
LHCR8, LHCX2 and LHCX3, increased dramatically after
exposure to HL and were up-regulated as much as 13-36 times
already after 0.5 h. The expression of the LHCX2 gene remained
at almost the same high level during the entire length of the
experiment, while the expression of LHCR6 and LHCR8 dropped
during the intermediate phase and stabilized at a lower level. The
LHCX3 transcript level decreased gradually with time and was
back to LL levels at the late acclimation phase.
Photosystems and electron transport chain. Oxidative
photosynthesis is catalyzed by the four multi-subunit complexes
PSI, PSII, the cytochrome b6f complex and F-ATPase [34]. In P.
tricornutum the vast majority of the genes encoding subunits of the
mentioned membrane-protein complexes are localized to the
chloroplast genome [35], while some genes have been transferred
to the nucleus. The transcript levels of eight genes localized to the
chloroplast genome were analyzed by qRT-PCR, including two
PSII genes (psbA and psbV), two PSI genes (psaA and psaE), and an
ATP-dependent metalloprotease (ftsH_2). Both chloroplast- and
nuclear-encoded genes representing proteins involved in
photosynthesis and repair of photo-damaged PSII were
differentially expressed during the acclimation period, as
indicated on Figure 3.
The nuclear-encoded genes PSBO, OEE3 (PSBQ’) and PSBU and
the chloroplast encoded psbV, encoding putative subunits of the
oxygen evolving complex of PSII [36], were all found to be
constitutively repressed under HL conditions (Figure 3). This was
also evident for the nuclear-encoded PSBM gene, encoding one of
the small transmembrane proteins of the PSII reaction center [36].
The microarray data based on signals from polyadenylated
chloroplast transcripts also indicated that PSII genes like psbE,
psbH, psbY and psbX were down-regulated as a response to the HL
treatment during some or all of the acclimation phases. These
genes are all predicted to encode small transmembrane proteins
located in the reaction center of PSII [36]. In addition, a
conserved open-reading frame named ycf66 [35], positioned in a
gene cluster between the chloroplast-encoded psbV and psbX genes,
displayed the same regulation pattern as the two psb genes, being
down-regulated at all times (data not shown). Two genes assumed
to encode the PSB27 and the HCF136 proteins that function in
assembly and repair of PSII in both chloroplasts [37,38] and
cyanobacteria [39,40) showed an increase in expression level at the
initial response phase. During the intermediate phase, the PSB27
and HCF136 genes both displayed a slight down-regulation,
whereas the expression levels at the late acclimation phase was
back to LL levels. Two genes encoding ATP-dependent metallo-
proteases (FTSH1 and FTSH2) found to be involved in the
degradation of photodamaged D1 protein in plants and cyano-
bacteria [21], were also significantly induced immediately after
transfer to HL. At the two latest phases of the acclimation period
the FTSH genes were unaffected or slightly up-regulated. The psbA
and psbD genes, encoding the D1 and D2 proteins that together
form the core of the PSII reaction center [34], showed no
significant response to the HL treatment. This heterodimer binds
several cofactors, including chlorophylls, pheophytin a molecules
and the plastoquinones QA and QB involved in the electron
transfer in PSII.
Among the chloroplast-localized psa genes encoding subunits of
PSI, the psaE gene was confirmed by qRT-PCR to be continuously
repressed when subjected to HL. PsaE is one of the subunits of the
PSI core complex and functions as a binding site for soluble
ferredoxin, and is also involved in cyclic electron transport [41].
Genomics of Light Acclimation
PLoS ONE | www.plosone.org 4 November 2009 | Volume 4 | Issue 11 | e7743

Figure 2. Hypothesized carotenoid biosynthetic pathway in P. tricornutum according to Coesel et al. [32]. Colored squares indicate theregulation pattern of genes encoding putative enzymes involved in the synthesis of carotenoids after exposure to HL for 0.5 h, 3 h, 6 h, 12 h, 24 hand 48 h. Squares with a diagonal line inside indicate genes with an expression ratio (log2 transformed) greater than +/20.5 that are not significantlyregulated. The scale on the right represents gene expression ratio values, log2 transformed. The violaxanthin cycle (A) and the diadinoxanthin cycle(B) are boxed. Dashed arrows indicate the hypothetical conversion of violaxanthin to diadinoxanthin and the formation of fucoxanthin fromdiadinoxanthin, as proposed by Lohr and Wilhelm [52,53]. The abbreviations used are PSY: phytoene synthase; PDS: phytoene desaturase; ZDS: f-carotene desaturase, CRTISO: carotenoid isomerase; crtI: bacterial-like desaturase; LCYB: lycopene b-cyclase; LUT: lutein deficient-like; ZEP: zeaxanthinepoxidase; VDE: violaxanthin de de-epoxidase; VDL: violaxanthin de de-epoxidase-like; VDR: violaxanthin de de-epoxidase related.doi:10.1371/journal.pone.0007743.g002
Genomics of Light Acclimation
PLoS ONE | www.plosone.org 5 November 2009 | Volume 4 | Issue 11 | e7743

Figure 3. Regulation pattern of HL affected genes during the acclimation period. The differentially regulated genes encode proteinsinvolved in light sensing, antenna proteins, photoreceptors, components involved in oxidative photosynthesis, carbon metabolism, Calvin cycle andROS scavenging systems after exposure to HL for 0.5 h, 3 h, 6 h, 12 h, 24 h and 48 h. The color code indicates expression values. Squares with adiagonal line inside indicate genes with an expression ratio (log2 transformed) greater than +/20.5 that are not significantly regulated. Genes whereat least one of the probes representing the genes were significantly regulated by .2-fold at least at one time point during the acclimation period,were included in the figure. The expression patterns of genes marked with an asterisk are chloroplast encoded. The scale on the right represents geneexpression ratio values, log2 transformed. The abbreviations used are LHCF: major fucoxanthin Chl a/c proteins; LHCR: red algal-like proteins; LHCX:LI818-like proteins; LHC#: unclassified light harvesting proteins; Psa: PSI proteins; PETJ: cytochrome c6; Psb: PSII proteins; HCF: high Chl fluorescence;FtsH: Filamentation temperature sensitive H; AUR: aureochrome; CRYL: cryptochrome-like protein; CPF: cryptochrome; SKP3: Sensor Kinase Protein 3;PPDK: pyruvate-phosphate dikinase; PEPCase: phosphoenolpyruvate carboxylase; MDH: malate dehydrogenase; PEPCK: phosphoenolpyruvatecarboxykinase; PK: pyruvate kinase; PYC: pyruvate carboxylase; CA: carbonic anhydrase; SLC4A: bicarbonate transporter; OMT: oxoglutarate/malatetransporter; FBPC: fructose-1,6-bisphosphatase; FBAC: fructose-1,6-bisphosphate aldolase; GPI: glucose-6-phosphate isomerase; TPI: triosephosphateisomerase; GLRXC: glutaredoxin; TRX: thioredoxin; TRXLl: thioredoxin-like; PRX: peroxiredoxin; GPX: glutathione peroxidase; APX: ascorbateperoxidise; SOD: superoxide dismutase; GST: glutathione S-transferase; TMT: gamma-tocopherol methyltransferase; TYPA: tyrosine phosphorylationprotein A.doi:10.1371/journal.pone.0007743.g003
Genomics of Light Acclimation
PLoS ONE | www.plosone.org 6 November 2009 | Volume 4 | Issue 11 | e7743

The microarray data indicated that the expression of the psaF and
psaI genes, encoding two additional core proteins, was also down-
regulated in the HL cultures. In higher plants, the PsaF protein
binds the electron donor plastocyanin and an antenna protein
dimer, whereas PsaI stabilizes another core subunit [41].
Photoreceptors. Genes predicted to encode photoreceptors
like blue-light sensing aureochromes and cryptochromes, and red/
far-red perceiving phytochromes have been identified in P.
tricornutum [5]. As indicated on Figure 3, most of the regulated
photoreceptor genes displayed a moderate response to the HL
treatment, with the exception of one of the cryptochromes (CPF2).
CPF2 expression levels increased up to 4–5 fold in HL compared
to LL cultures cells at the beginning of the intermediate phase and
also during the late acclimation phase.
Carbon metabolism and Calvin cycle. Kroth et al. [42] has
identified 16 genes putatively involved in a C4-like photosynthesis
in P. tricornutum. The protein products of these genes were
predicted to be localized to three different cell compartments;
endoplasmatic reticulum (ER), mitochondria and plastid. In our
experiment, 13 of the mentioned genes were found to be
significantly regulated by HL at one or several time points
(Figure 3). Among the most pronounced down-regulated genes
were PYC1, encoding a mitochondrial-localized pyruvate
carboxylase, and SLC4A_1, encoding a bicarbonate transporter
predicted to be localized to the plastid [42]. PYC1 and SLC4A_1
displayed a decrease in expression levels during the entire
acclimation period as a response to the HL treatment. The gene
encoding phosphoenolpyruvate carboxylase (PEPCase_2),
predicted to be targeted to the ER, mitochondrial-localized
malate dehydrogenase (MDH), a pyruvate kinase (PK6), an
oxoglutarate/malate transporter (OMT1), and the chloroplast-
targeted pyruvate carboxylase (PYC2) all showed a similar
regulation pattern after being subjected to HL conditions. These
genes were all unaffected or only slightly regulated during the first
hours of HL exposure, and up-regulated 2–11 times at the late
acclimation phase.
Kroth et al. [42] has also identified 26 genes possibly encoding
Calvin cycle enzymes, which are predicted to be distributed
between the plastid, mitochondria and the cytosol. These genes,
including the chloroplast-encoded subunits of ribulose-bispho-
sphate carboxylase oxygenase (RUBISCO), showed in general
little or no response to the HL treatment. A gene presumed to
encode a triosephosphate isomerase (TPI_2) predicted to be
targeted to the plastid, was among the most regulated Calvin cycle
genes. The TPI_2 gene displayed a 3–6 fold up-regulation in HL
at the late acclimation phase (Figure 3).
ROS scavenging systems. Reactive oxygen species (ROS)
form as by-products during photosynthesis and can result in
significant damage to cellular components [43]. Genes encoding
known enzymatic antioxidants like catalases, superoxide
dismutases (SOD), ascorbate peroxidases (APX), gluthatione S-
transferases (GST) and glutathione peroxidases (GPX) were
unaffected, slightly up-regulated or even down-regulated during
the two first response and acclimation phases (Figure 3). At the late
acclimation phase, only a few of these genes showed a significant
increase in expression levels. SOD3, encoding a CuZn superoxide
dismutase, APX2, GPX1, GST3 and GST4 displayed a 2–3 fold up-
regulation at these time points. A gene encoding a putative
gamma-tocopherol methyltransferase (TMT) responsible for
converting gamma-tocopherol to the non-enzymatic antioxidant
alpha-tocopherol [44] was also moderately up-regulated at the
latest time points.
In contrast, a gene similar to the antioxidant peroxiredoxin Q
(PRX Q) in Arabidopsis thaliana was among the strongest and most
consistent up-regulated genes of the entire data set. PRX Q showed
an immediate response to the HL treatment and was up-regulated
as much as 24 times after just 0.5 h in HL. During the
intermediate phase the expression levels dropped, but increased
again after 12 hours and stayed high at the late acclimation phase.
The A. thaliana PRX Q is targeted to the plastid and has been
suggested to be involved in protection of ROS generated in
photosynthesis [45]. PRX Q reduces H2O2 using a thiol and is
reactivated by thioredoxins. Other peroxiredoxins have been
shown to be reactivated by glutaredoxins [46]. Genes encoding a
glutaredoxin (GLRXC2), a thioredoxin (TRX Y) and several
genes possibly encoding thioredoxin-like (TRXL_1-3) proteins
were differentially regulated as a response to HL. GLRXC2 are
predicted to be targeted to the plastid [42], and showed a similar
regulation pattern as PRX Q. GLRXC2 displayed a 20-fold increase
in expression level at the initial response phase, a drop in the
expression level during the next hours and a subsequent increase
at the late acclimation phase. TRXL_2 and TRXL_3 were also up-
regulated at several time points. TRX Y, predicted to be plastid
localized [42], and TRXL_1 were down-regulated and might be
involved in enzyme regulation [47] instead of stress response.
Based on experiments with the halophytic plant Suaeda salsa,
Wang et al. [48] has suggested that a member of the TypA/BipA
GTPase family named SsTypA1 might play a crucial role in the
defence against ROS damage, possibly functioning as a transla-
tional regulator of the stress-responsive proteins involved in ROS
scavenging in chloroplast. Two genes identified in P. tricornutum
(designated TypA1-2) encoding putative TypA GTP-binding
proteins were up-regulated for all, or all but one time-point
during the HL experiment. The transcriptional analyses of the
TypA genes revealed that the expression of the TypA1 gene reached
its maximum level during the late acclimation phase, where the
transcription was up-regulated almost 15 times in the HL-cultures
compared to the LL-cultures, whereas the TypA2 gene peaked
after only 0.5 h in HL (Figure 3).
Pigment analysisThe pigmentation in P. tricornutum comprises the major light
harvesting pigments (LHPs) Chl a, Chl c1 and c2, Fucoxanthin
(Fuco), the photoprotective carotenoid diadinoxanthin (DD) which
can be de-epoxidized to diatoxanthin (DT) in addition to the
ubiquitous b -carotene found in all photosynthetic organisms [49].
As expected, the HPLC analyses showed that Chls a and c, Fuco,
DD and DT (the latter not found in the LL cultures) were the
dominating pigments in the algae. Violaxanthin, bb-carotene and
a few derivatives of Chl a and Fuco were present in trace amounts.
Chlorophyll and Fucoxanthin. The concentration of Chl a
per cell ([Chl a]) remained unchanged during the initial response
phase, after which [Chl a] decreased gradually during the next two
acclimation phases (Figure 4). Although present in much lower
concentrations, the measurements of Chl c per cell ([Chl c])
showed a similar pattern. Concentrations of Fuco per cell ([Fuco])
showed an immediate decline from the onset of HL and
throughout the experiment. The ratio between the LHPs
[Fuco+Chl c] and [Chl a] was stable during the experiment,
ranging between 0.8 and 0.9. These results imply a highly effective
acclimation to changed light climate, as the concentration of LHPs
are down-regulated to adjust to the Chl a concentration.
Diadinoxanthin, diatoxanthin and NPQ. 0.5 h after HL
exposure of LL acclimated cells, de-epoxidation of DD to form DT
had started to take place, thereby facilitating the dissipation of
excess light energy by NPQ. The increasing de-epoxidation state
(DES) index during the initial and intermediate acclimation phases
describes the rapid conversion of DD to DT (Figure 5A). At the
Genomics of Light Acclimation
PLoS ONE | www.plosone.org 7 November 2009 | Volume 4 | Issue 11 | e7743

shift from the intermediate to the late acclimation phase there was
a decrease in DES, after which the algae seemed to have
acclimated to the increased irradiance, reflected by the small
decrease in DES from 24 to 48 h. The changes in the fractions of
cellular DD, DT and Fuco from the original LL pool sizes as a
function of HL exposure time is shown in Figure 5B. From the
decrease in the DD fraction and the increase of the DT fraction
measured in cultures that had been subjected to HL for 0.5 h, it is
evident that these two pigments are in an inverse relationship with
each other (Figure 5B). In the intermediate acclimation face the
3 h HL exposure time resulted in increased production of DD as a
response to an increased need for photoprotection. From 3 h to
12 h the cellular [DD] pool size decreased while cellular [DT],
from de-epoxidation of DD, increased simultaneously. The late
acclimation phase showed a new peak in cellular DD after 24 h,
indicating cell division. As the algae acclimated to HL (48 h) [DT]
per cell was reduced. From onset of HL the cellular Fuco fraction
started to decrease, and continued to do so during the
experimental period. This suggests that DD might be the
precursor of both DT and Fuco.
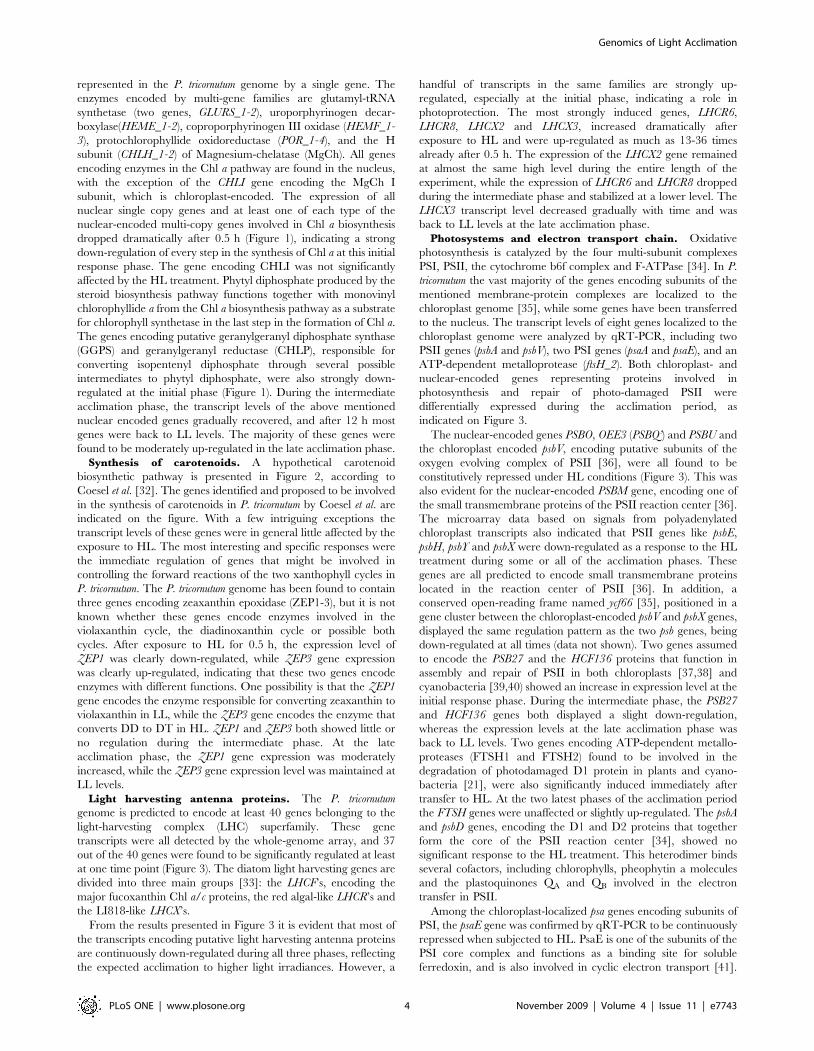
Variable Chl fluorescenceThe Chl a variable fluorescence illustrate the overall physiolog-
ical response of P. tricornutum, and the data can be read as a proxy
for the photosynthetic efficiency and capacity of the cell. The
photosynthetic (PSII) efficiency, measured from the maximum
quantum yield, Fv/Fm, showed a decrease in the initial and
intermediate phase (,12 h) after exposure to HL, illustrating that
the ratio of electrons generated in PSII to photons absorbed by
light-harvesting pigments decrease (Figure 6). During the late
acclimation phase (.12 h), Fv/Fm increased again to a level
similar to the initial phase. The HL treated culture overall showed
a lower Fv/Fm than the LL samples.
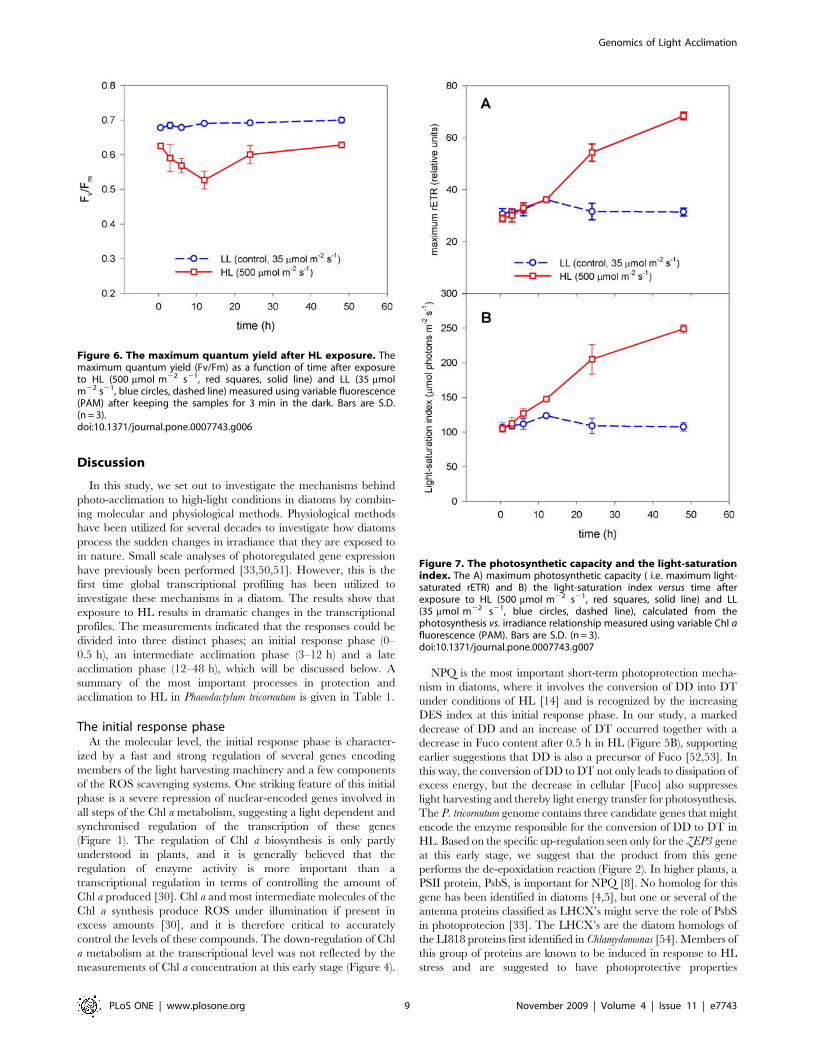
The maximum photosynthetic capacity (i.e. the maximum
relative light-saturated electron transfer rate, rETR) calculated
from the P vs. E relationship was not significantly altered by HL
treatment during the initial and intermediate phase; however, it
markedly increased during the late acclimation phase (.12 h)
compared to the control (LL treatment, Figure 7A). The
maximum rETR express the maximum amount of electrons
generated in PSII that is available to the ATP and NADPH2
synthesis at ambient light, and thus is an estimate of the maximum
photosynthetic capacity. At 48 h, the maximum rETR had
increased .2 fold in the HL treatment culture compared to the
LL acclimated culture.
The light-saturation index, which is an indicator for the photo-
acclimation status of the cell, showed a linear increasing trend as a
function of time after HL exposure (Figure 7B). Data indicated
that the physiological acclimation status of P. tricornutum increased
from the initial phase throughout the late acclimation phase, with
no sign of reaching an upper limit within the investigated 48 h
time frame. The light saturation index is a proxy for the irradiance
that is needed to saturate photosynthesis, i.e. the threshold
irradiance that separates light-limited and light-saturated photo-
synthesis.
Figure 4. Main [LHPs] per cell and their ratio as a function of HLexposure time. The Chl a, Chl c and Fuco concentrations per cell andthe ratio of Fuco plus Chl c to Chl a as a function of high-light(500 mmol m22s21) exposure time. Incubation was performed in a LL(35 mmol m22s21) exponentially growing 10L batch culture 3 weeksprior to HL exposure. The 0 h sample value is the mean of the 18 LLcontrol samples (blue symbol). HL exposure values are the mean ofthree biological parallels. Values are presented with6SD bars.doi:10.1371/journal.pone.0007743.g004
Figure 5. De-epoxidation state index (DES) and change in[Fuco], [DD] and [DT] per cell. A) De-epoxidation state index (DES)index calculated from the HPLC pigment data. The 0 h sample value isthe mean of the 18 LL control samples (blue symbol). HL exposurevalues are the mean of three biological parallels. Incubations as inFigure 4. Values are presented with6SD bars. (B) Change inFucoxanthin, Diadinoxanthin and Diatoxanthin cell concentration as afunction of high light exposure time. Change in pigment concentrationfor Fuco (normalized to LL, t = 0 h), DD (as for Fuco) and DT (normalizedto HL at 0.5 h) as a function of time after HL exposure. Values areaverage of three parallel HPLC samples. Incubations as in Figure 4.doi:10.1371/journal.pone.0007743.g005
Genomics of Light Acclimation
PLoS ONE | www.plosone.org 8 November 2009 | Volume 4 | Issue 11 | e7743
Discussion
In this study, we set out to investigate the mechanisms behind
photo-acclimation to high-light conditions in diatoms by combin-
ing molecular and physiological methods. Physiological methods
have been utilized for several decades to investigate how diatoms
process the sudden changes in irradiance that they are exposed to
in nature. Small scale analyses of photoregulated gene expression
have previously been performed [33,50,51]. However, this is the
first time global transcriptional profiling has been utilized to
investigate these mechanisms in a diatom. The results show that
exposure to HL results in dramatic changes in the transcriptional
profiles. The measurements indicated that the responses could be
divided into three distinct phases; an initial response phase (0–
0.5 h), an intermediate acclimation phase (3–12 h) and a late
acclimation phase (12–48 h), which will be discussed below. A
summary of the most important processes in protection and
acclimation to HL in Phaeodactylum tricornutum is given in Table 1.
The initial response phaseAt the molecular level, the initial response phase is character-
ized by a fast and strong regulation of several genes encoding
members of the light harvesting machinery and a few components
of the ROS scavenging systems. One striking feature of this initial
phase is a severe repression of nuclear-encoded genes involved in
all steps of the Chl a metabolism, suggesting a light dependent and
synchronised regulation of the transcription of these genes
(Figure 1). The regulation of Chl a biosynthesis is only partly
understood in plants, and it is generally believed that the
regulation of enzyme activity is more important than a
transcriptional regulation in terms of controlling the amount of
Chl a produced [30]. Chl a and most intermediate molecules of the
Chl a synthesis produce ROS under illumination if present in
excess amounts [30], and it is therefore critical to accurately
control the levels of these compounds. The down-regulation of Chl
a metabolism at the transcriptional level was not reflected by the
measurements of Chl a concentration at this early stage (Figure 4).
NPQ is the most important short-term photoprotection mecha-
nism in diatoms, where it involves the conversion of DD into DT
under conditions of HL [14] and is recognized by the increasing
DES index at this initial response phase. In our study, a marked
decrease of DD and an increase of DT occurred together with a
decrease in Fuco content after 0.5 h in HL (Figure 5B), supporting
earlier suggestions that DD is also a precursor of Fuco [52,53]. In
this way, the conversion of DD to DT not only leads to dissipation of
excess energy, but the decrease in cellular [Fuco] also suppresses
light harvesting and thereby light energy transfer for photosynthesis.
The P. tricornutum genome contains three candidate genes that might
encode the enzyme responsible for the conversion of DD to DT in
HL. Based on the specific up-regulation seen only for the ZEP3 gene
at this early stage, we suggest that the product from this gene
performs the de-epoxidation reaction (Figure 2). In higher plants, a
PSII protein, PsbS, is important for NPQ [8]. No homolog for this
gene has been identified in diatoms [4,5], but one or several of the
antenna proteins classified as LHCX’s might serve the role of PsbS
in photoprotecion [33]. The LHCX’s are the diatom homologs of
the LI818 proteins first identified in Chlamydomonas [54]. Members of
this group of proteins are known to be induced in response to HL
stress and are suggested to have photoprotective properties
Figure 6. The maximum quantum yield after HL exposure. Themaximum quantum yield (Fv/Fm) as a function of time after exposureto HL (500 mmol m22 s21, red squares, solid line) and LL (35 mmolm22 s21, blue circles, dashed line) measured using variable fluorescence(PAM) after keeping the samples for 3 min in the dark. Bars are S.D.(n = 3).doi:10.1371/journal.pone.0007743.g006
Figure 7. The photosynthetic capacity and the light-saturationindex. The A) maximum photosynthetic capacity ( i.e. maximum light-saturated rETR) and B) the light-saturation index versus time afterexposure to HL (500 mmol m22 s21, red squares, solid line) and LL(35 mmol m22 s21, blue circles, dashed line), calculated from thephotosynthesis vs. irradiance relationship measured using variable Chl afluorescence (PAM). Bars are S.D. (n = 3).doi:10.1371/journal.pone.0007743.g007
Genomics of Light Acclimation
PLoS ONE | www.plosone.org 9 November 2009 | Volume 4 | Issue 11 | e7743

[33,50,55]. The transcription of the P. tricornutum LHCX2 and
LHCX3 genes were found to be strongly induced after only 0.5 h in
HL, suggesting that there might be a connection between these
results and the other mechanisms involved in NPQ in diatoms
(Figure 3). The expression level of both LHCX’s peaked at this initial
response phase. The transcription of the LHCX2 gene stayed high
throughout the experiment, whereas the LHCX3 expression
decreased with time. The fast and drastic up-regulation of two of
the LHCX’s and also two of the LHCR’s at this early time-point are
in sharp contrast to the decrease in transcription level observed for
almost all other genes encoding diatom antenna proteins, implying
different roles for these proteins in protection and acclimation to HL
(Figure 3).
Although photosynthetic organisms are in the possession of
numerous light sensing and acclimation mechanisms [56], excess
light can generate ROS, causing damage especially to the PSII,
where the D1 core protein is particularly vulnerable [20]. Excess
light usually leads to an enhanced synthesis of D1 protein to replace
the damaged ones [19]. In our study, several genes encoding
subunits of PSII was continuously down-regulated as a response to
HL, whereas the psbA gene encoding the D1 protein was maintained
at LL levels, indicating a greater demand for this PSII transcript. In
green algae the increase in D1 protein synthesis far exceeded the
accumulation of the corresponding mRNA [22], suggesting that the
D1 protein synthesis might also be up-regulated by HL in our study
despite the lack of regulation at the transcriptional level. The early
phase specific up-regulation of the two ftsH genes encoding
proteases functioning in degradation of photodamaged D1 protein
[21], and also of two genes (HCF136 and PSB27) encoding proteins
involved in assembly and repair of PSII [37–40] implies that the HL
treatment has caused photodamage to the complex and that
mechanisms necessary for the PSII to recover have been executed.
Another protection mechanism initiated in the HL subjected cells is
the severe induction of the H2O2 peroxidase gene PRX Q, encoding
a protein similar to the A. thaliana peroxiredoxin Q that is suggested
to be involved in protection of PSII [45]. The up-regulation of the
PRX Q gene was accompanied with an almost equally strong
increase in the transcription level of a glutaredoxin (GLRXC2)
predicted to be targeted to the chloroplast [42]. The expression of
PRX Q and GLRXC2 displays a similar regulation pattern
throughout the entire length of the experiment. This observation
indicates that the diatom PRX Q might be reduced and thereby
reactivated by glutaredoxin instead of thioredoxins, which is the
case in A. thaliana [45].
At the initial response phase, neither the maximum rETR
(Figure 7A) nor the light-saturation index (Figure 7B) changed
significantly in the HL exposed cultures compared to the LL
cultures. This shows that the P. tricornutum cells are able to maintain
their photosynthetic efficiency despite the HL stress and that their
capability to utilise incoming photons remain unchanged.
The intermediate acclimation phaseThe global transcriptional profiling revealed a strong and rapid
response to the change in irradiance already after 0.5 h, whereas
Table 1. Summary of the most important processes in protection and acclimation to high light (HL) in P. tricornutum.
Level Initial response phaseIntermediate acclimationphase Late acclimation phase
Molecular Genes encoding antenna proteins possiblyinvolved in photoprotection
+ + + + + + +
Genes encoding proteins involved in degrad-ation, assembly and repair of PSII components
+
Genes encoding specific proteins involvedin ROS scavenging
+ + + + + +
Genes encoding additional proteins involvedin ROS scavenging
+
Zeaxanthin epoxidase gene possibly encoding theenzyme responsible for conversion of DD to DT
+ +
Genes encoding enzymes involved in Chl abiosynthesis
4 4 4 +
Genes encoding components of the lightharvesting and photosynthetic apparatus
4 4 4 4
Metabolic DES index + + + + + +
Fuco content per cell 4 4 4 4 4 4
Chl a content per cell 4 4 4 4 4
Physiological Photosynthetic efficiency and capacity + +
Summary Photoprotection mechanisms Execution ofphotoprotectionmechanisms
Photoprotection mechanisms stillactive, but not as pronounced asin the early phase
Photoprotection mechanisms stillactive, but not as pronounced asin the early phase
HL acclimation processes HL acclimation processesinitiated at the transcrip-tional level.
HL acclimation processesobserved at the transcriptionaland metabolic level, but not atthe physiological level
HL acclimation processes observedat all levels. Changes in the com-position of the photosyntheticapparatus enable the diatoms toperform highly efficientphotosynthesis in HL
Plus (+) and minus (4) symbols indicate an increase or decrease in HL compared to LL levels. The abbreviations used are PSII: photosystem II; ROS: reactive oxygenspecies; DD: diadinoxanthin; DT: diatoxanthin; Chl: chlorophyll; DES de-epoxidation state; Fuco: fucoxanthin.doi:10.1371/journal.pone.0007743.t001
Genomics of Light Acclimation
PLoS ONE | www.plosone.org 10 November 2009 | Volume 4 | Issue 11 | e7743

most physiological responses first became apparent at the
intermediate acclimation phase (Figure 7A and B). This phase is
characterised by a marked decline in cellular LHPs, where the
decrease in Fuco levels observed after 0.5 h in HL continues, and
is now also followed by a significant fall in Chl a level. The
expression of the genes involved in the synthesis of Chl a return to
LL levels during this period (Figure 1). This observation suggests
that the reduction of the amount of Chl a might be caused not only
by the down-regulation at the transcriptional level seen at the
initial response phase, but also by other mechanisms like
repression of the corresponding enzyme activity [30] and
regulation of Chl a degradation. The decrease in LHPs also
lowers the need for the antenna proteins that bind Chls and Fuco
and thereby anchor them to the thylakoid membranes. This is
reflected at the transcriptional level by the repression of most genes
encoding antenna proteins seen throughout the experiment
(Figure 3). Down-regulation of members of the LHC family have
also been observed in several other HL experiments with diatoms,
green algae and higher plants [33,56,57]. Several of the
continuously repressed genes involved in the light harvesting
machinery, including components of the photosystems, display the
strongest down-regulation at the beginning of this phase.
The continuous up-regulation of the LHCX’s that might
function in the role of psbS and the still increasing DES index
implies that the diatoms continues to dissipate the excess light
energy as heat dissipation by NPQ at this intermediate phase.
The late acclimation phaseDuring the first 12 hours of the HL treatment, the diatom cells
seem to protect and adjust the photosynthetic apparatus to the
new light regime without being able to make use of the increased
amounts of light energy available for photosynthesis and growth.
After 12 hours in HL, the acclimation mechanisms observed at the
molecular level are replaced or supplemented with changes
supporting the shorter generation time (data not shown) and
thereby an accelerated protein synthesis, and responses charac-
teristic for the late acclimation phase. The characteristic responses
include an increase of the transcript levels of genes involved in the
removal of potentially harmful ROS (Figure 3), in particular a
strong induction of TypA1 encoding a member of the TypA/BipA
GTPase family suggested to function as a translational regulator of
stress-responsive proteins involved in ROS scavenging in chloro-
plast [48]. ROS are inevitable by-products of photosynthesis, and
the increased demand of antioxidants might be explained by the
strongly increasing maximum rETR measured in this late phase of
acclimation (Figure 7A). A moderate increase in expression levels
of several genes encoding enzymes functioning in xanthophyll and
Chl a metabolism was also observed during the late acclimation
phase (Figure 1). The rise in expression levels of the genes
connected to the formation of pigments is not reflected at the
metabolic level, but might be explained by an increased demand of
newly synthesized pigments in the HL cultures due to the shorter
generation time at these light conditions (data not shown).
The vast majority of the genes predicted to be involved in
carbon metabolism were affected by HL, and showed the strongest
regulation during the late phase. Kroth et al. [42] suggested that a
futile and energy demanding C4-like cycle might occur in P.
tricornutum that possibly functions as a way to dissipate excess light
energy. The results achieved in this experiment support a light
regulated carbon metabolism; however, the complexity of the
proposed model and the uncertainties connected to the localiza-
tion of the proteins involved make interpretation of single gene
regulation difficult. The regulation mechanisms of the Calvin cycle
in diatoms are largely unknown. The modest regulation of a few
genes believed to be involved in the Calvin cycle does not bring
greater insight into this question, especially since most genes of the
Calvin cycle are also involved in other pathways.
The late acclimation phase is recognized by low levels of light-
harvesting pigments (Fuco and Chl a+c) occurring together with a
pronounced increase in the photosynthetic capacity compared to
the LL acclimated cultures (Figure 7). These measurements
indicate that although the light-harvesting machinery has been
downsized during the acclimation period, the adjustments made at
the transcriptional and metabolic levels facilitate highly effective
photosynthesis in HL-acclimated diatoms.
Materials and Methods
An axenic culture of P. tricornutum Bohlin clone Pt 1 8.6
(CCMP632) was obtained from the culture collection of the
Provasoli-Guillard National Center for Culture of Marine
Phytoplankton, Bigelow Laboratory for Ocean Sciences, USA.
Cultures were grown in f/2 medium [58] made with 0.2 mm-
filtered and autoclaved local seawater supplemented with f/2
vitamins and inorganic nutrients [58], filter sterilized and added
after autoclaving. Cultures were incubated at 15uC under cool
white fluorescent light at scalar irradiance (EPAR) of approximately
35 mmol m22s21 (LL) on a rotary table in continuous light (control
conditions), and were kept in exponential growth phase under
these conditions for 3 weeks to ensure that all cells were
acclimated. Scalar irradiance (Photosynthetic Active Radiance,
400–700 nm) in culture flasks was measured with a Biospherical
QSL-100 irradiance sensor (San Diego, US). According to the
growth curve based on cell counting and in vivo Chl a fluorescence
with and without addition of DCMU (3-(3,4-dichlorophenyl)-1,1-
dimethylurea), the cells divided once a day under these conditions.
Sterility was monitored by occasional inoculation into peptone-
enriched f/2 medium to check for bacterial growth [59]. Cells for
the experiments were grown in batch cultures, and growth was
monitored by cell counting using a Burker-Turk counting
chamber, counting 4–500 cells per volume-unity. The cells were
first grown axenically in a 10-litre batch culture to reach an
approximate density of 106 cells mL21, then volumes of 250 ml
were transferred to 75 cm2 sterile Falcon polystyrene flasks to
reach cell densities of 0.15–1.06106 cells mL21 on the day of the
experiment. The cultures were transferred to EPAR irradiance
conditions of 500 mmol m22s21 (HL = high light) and sampled at
incubation times of 0.5 h, 3 h, 6 h, 12 h, 24 h and 48 h. In
addition, LL control cultures were kept for each of the HL
exposures and parallels. Three biological replica and two parallels
for each treatment and control culture were harvested (6 samples)
to ensure statistical validation. The two parallels for each of the
biological replicas destined to be used for isolation of RNA were
merged during harvesting to get enough starting material for the
microarray analyses. The maximum cell density of 1.06106 cells
mL21 was chosen and carefully monitored and diluted to
minimize effects like intercellular shading, rapid depletion of
nutrients and increase in pH above 9. Material from the same cell
cultures were utilized in the different analyses described below.
RNA isolation and processingDiatom cultures were centrifuged at 4000 g for 10 min at 15uC.
The supernatant was removed and the cell pellet was resuspended
in 1 ml f/2 medium. The suspension was transferred to 2 ml tubes
and centrifuged at 18000 g for 1 min at 4uC. Supernatants were
removed and the cell pellets were flash frozen in liquid nitrogen
and stored at 280uC. Precooled (280uC) 5 mm stainless steel
beads (QIAGEN) were added to the tubes with frozen cell pellets,
Genomics of Light Acclimation
PLoS ONE | www.plosone.org 11 November 2009 | Volume 4 | Issue 11 | e7743

and the samples were mechanically disrupted and homogenized
using the TissueLyser system (QIAGEN). Disruption was carried
out for 262 min at 25 Hz. The samples were placed in a
precooled (280uC) adapter set for the first shaking step. Before the
second shaking step, the samples were transferred to a room
temperate adapter set and 0.5 ml lysis buffer (SpectrumTM Plant
Total RNA kit, Sigma-Aldrich) was added to each tube. Total
RNA was isolated from the homogenized lysate using the
SpectrumTM Plant Total RNA kit (Sigma-Aldrich). On-column
digestion of DNA with DNase I (QIAGEN) was included for all
RNA preparations. The concentration of the RNA was deter-
mined by measuring the absorbance at 260 nm with the
NanoDrop ND-1000 Spectrophotometer (NanoDrop Technolo-
gies), and the purity of the RNA was estimated by the OD260/
OD280 nm absorption ratio (all ratios were .2.0). The integrity of
the RNA was verified by denaturing agarose gel electrophoresis
and ethidium bromide staining following the protocol described in
the RNeasy Mini handbook (QIAGEN).
DNA microarray experimentsTotal RNA was isolated from three biological replicas of
diatoms cultured under LL and HL conditions at time points
0.5 h, 3 h, 6 h, 12 h, 24 h and 48 h. The RNA (0.36–1 mg) was
reverse transcribed, amplified and labelled using the Quick Amp
Labelling Kit, Two-Color (Agilent p/n 5190-0444). Hybridization
was performed with the Gene Expression Hybridization Kit
(Agilent p/n 5188-5242). 825 ng cRNA from HL exposed cells
were mixed with 825 ng cRNA from low light acclimated cells
from the corresponding time point. The cRNA mixture was
fragmented and hybridized on 4x44K Phaeodactylum tricornutum
whole-genome 60-mer oligonucleotide microarrays (Agilent Tech-
nologies) in a rotary oven (10 rpm, 65uC, 17 h). The slides were
washed with Gene Expression Wash Buffer 1 (Agilent p/n 5188-
5325), Gene Expression Wash Buffer 2 (Agilent p/n 5188-5326),
acetonitrile (VWR International) and Stabilization and Drying
Solution (Agilent Technologies) according to the manufacturer’s
instructions. The slides were scanned at 5 mm resolution on an
Agilent DNA microarray scanner (Agilent Technologies). The
resulting images were processed using GenePix 5.1 software (Axon
Instruments, Union City, USA).
Statistical analysis. The GenePix processed data were
filtered to remove spots that had been flagged ‘Absent’, ‘Not
Found’ or ‘Bad’, by the GenePix program or by manual flagging.
Spots with more than 50% saturated pixels, or had median
foreground intensity less than the local median background
intensity were excluded from the analysis. No background
subtraction was performed. For making statistical inference
about differentially regulated genes the limma package [60] and
the R statistical data analysis program package (R 2.7.1) was used.
The limma approach is based on fitting a linear model to the
expression data of each probe on a microarray. In this experiment
each time point consists of 3 sets of biological replicates (test and
control samples) which are dye swapped and adjusted for probe-
specific dye effects. Due to some scale differences in the responses
between samples, identified as differences in spread of M-values
between the arrays, scale normalization between the arrays was
performed. The Benjamini and Hochberg’s method to control the
false discovery rate (fdr) was used to identify differentially
regulated genes [61]. Genes with adjusted P-values less than
0.05 were regarded as statistical significantly differentially
expressed. If a gene was identified by less than 3 spots it was
excluded from the result tables. Genes are represented by 1–5
different probes on each microarray. Expression ratios discussed in
the text are an average of values obtained from all probes
representing the genes in question. Supplementary information on
the P. tricornutum genes are given in Table S1. The study is
MIAME compliant. Raw data has been deposited in GEO
(accession GSE 17237).
Quantitative real-time PCRA two-step quantitative real-time PCR (qRT-PCR) was
performed on total RNA isolated from three biological replicas
of diatom cultures grown in LL and HL at time points 0.5 h, 3 h,
12 h and 24 h. Reverse transcription of the RNA was performed
with the PrimeScriptTM 1st strand cDNA Synthesis Kit (TaKaRa)
following the recommended protocol for synthesis of real-time
PCR template using random primers. 300 ng of total RNA was
used in each reaction. 20 ml qRT-PCR mixtures were prepared
containing forward and reverse primers listed in Supplementary
Table S2, with a final concentration of 0.5 mM each, 5 ml cDNA
template diluted 1:10 and 2x LightCyclerH 480 SYBR Green I
Master mix (Roche). The qRT-PCR reactions were run in a
LightCyclerH 480 Multiwell Plate 96 (Roche) in a LightCycler 480
instrument (Roche). No template controls, where the cDNA
template was replaced with PCR-grade water, were included in
each run to ensure that no reagents were contaminated with DNA.
To detect the level of genomic DNA still present in the 24 RNA
samples after the DNase I treatment, qRT-PCR was performed
using 7.5 ng of isolated RNA as template, and three different
primer pairs listed in Supplementary Table S2. The PCR
parameters were programmed according to the manufacturer’s
instructions for a LightCycler 480 System PCR run with the
LightCyclerH 480 SYBR Green I Master: 5 min preincubation at
95uC, followed by 35 cycles with 10 s at 95uC, 10 s at 55uC and
10 s at 72uC. After 35 cycles the specificity of the amplified PCR
products was tested by heating from 65uC up to 95uC with a ramp
rate of 2.2uC/s, resulting in melting curves. The Second
Derivative Maximum Method of the LightCycler 480 software
was used to identify the crossing points (CPs) of the samples.
LinRegPCR software [62] was used to determine the PCR
efficiency for each sample. The primer set efficiency was
determined by calculating the mean of the efficiency values
obtained from the individual samples. Relative expression ratios of
the target genes normalized to a reference gene encoding a
putative hiv-1 rev binding protein (Phatr2_42776) were calculated
using the REST 2005 software [63]. The primer efficiencies
determined by LinRegPCR were included in the calculations.
REST 2005 was also used to test significance of the expression
ratio results of the investigated transcripts by a Pair Wise Fixed
Reallocation Randomisation Test. The gene encoding the hiv-1
rev binding protein that was chosen to function as a reference gene
is represented by five different probes on the microarray and
showed no response to the HL treatment at any time point.
Pigment analysisHPLC pigment analyses were performed as described in
Rodriguez et al. [25] using a Hewlett-Packard HPLC 1100 Series
system. The pigment values from the HPLC analyses were
calculated as femtogram (fg) pigment per cell. De-epoxidation state
index (DES) was calculated as in Ruban et al. [14]: DES = (DT)/
((DD)+(DT)).
Variable Chl fluorescenceVariable Chl a fluorescence was measured using a PhytoPAM
(System I, Walz, Germany), equipped with a sensitive Photo-
multiplier-Detector (PM-101P, Walz). Fluorescence was excited by
a weak and nonactinic modulated light supplied by a LED (light
emitting diode, Array-Cone PHYTO-ML, Walz, Germany) and a
Genomics of Light Acclimation
PLoS ONE | www.plosone.org 12 November 2009 | Volume 4 | Issue 11 | e7743

saturating flash by a strong red LED (.2000 mmol m22 s21,
Actinic LED-Array-Cone PHYTO-AL, Walz) to ensure that all
reaction centres of PSII were closed during the flash period. The
instrument light source excites fluorescence at four different
wavelengths; however, only results from 665 nm excitation were
used. Nomenclature of van Kooten and Snell [64] was used. The
minimum (F0) and maximum fluorescence (Fm) was measured at
the end of a dark-acclimation period (3 min) and the maximum
quantum yield (the PSII efficiency) was calculated from Fv/Fm,
where Fv is the variable part of fluorescence emission and equal to
Fm–F0. The photosynthesis vs. irradiance (P vs. E) relationship was
obtained by exposing the samples (after the 3 min dark-
acclimation) to 12 step-wise increasing irradiances (1 and
1200 mmol photons m22 s21) at intervals of 30 s each. The
operational quantum yield of PSII (WPSII) was calculated from the
steady-state fluorescence (Fs) at each irradiance and the maximum
fluorescence measured after a saturation pulse (Fm9) at the end of
each irradiance interval, from (Fm9–Fs)/Fm9 [6]. The relative
electron transport rates (rETR) was then calculated from
multiplying WPSII with the incubation irradiance, and the
relationship was fitted using the build-in hyperbolic fitting routine
in the PhytoWin software package (ver. 2.00a) to determine the
maximum light utilization coefficient (a) and the maximum rETR.
The light saturation index was calculated from rETR divided by a[65,66]. A Peltier cell (US-T/S, Walz) kept the temperature
constant (60.2uC) during incubations.
Supporting Information
Figure S1 Regulation pattern of eight chloroplast-encoded
genes during the HL acclimation period. Expression ratios are
investigated by both microarray analyses (A) and qRT-PCR (B).
The color code indicates expression values and squares with a
diagonal line inside indicate genes with an expression ratio (log2
transformed) greater than +/2 0.5 that are not significantly
regulated. The scale on the right represents gene expression ratio
values, log2 transformed. The abbreviations used are NA: not
assessed; ChlI: subunit I of magnesium chelatase; FtsH: Filamen-
tation temperature sensitive H; Psa: PSI proteins; Psb: PSII
proteins; RbcS: ribulose-bisphosphate carboxylase oxygenase
small subunit; RbcL: ribulose-bisphosphate carboxylase oxygenase
large subunit.
Found at: doi:10.1371/journal.pone.0007743.s001 (0.69 MB EPS)
Table S1 Information on P. tricornutum genes discussed in the
text. Parameters given are the protein identification number (ID),
chromosome location, best NCBI hit (BLASTP search) outside the
Bacillariophyceae, the identity/similarity with respect to the
corresponding P. tricornutum protein and respective NCBI
accession numbers.
Found at: doi:10.1371/journal.pone.0007743.s002 (0.13 MB
XLS)
Table S2 Primers used for quantitative real-time PCR.
Found at: doi:10.1371/journal.pone.0007743.s003 (0.03 MB
XLS)
Acknowledgments
The custom made Agilent microarrays was made available by Dr. Chris
Bowler and colleagues, which we also thank for generously sharing
methods and materials used in their laboratories. The authors would also
like to thank Torfinn Sparstad and Bente U. Halvorsen for help with the
microarray hybridization and Mari-Ann Østensen for great help with the
axenic cultures.
Author Contributions
Conceived and designed the experiments: MN KCV TB GJ AMB.
Performed the experiments: MN KCV TB KH KA GJ. Analyzed the data:
MN KCV KH PW KA AMB. Contributed reagents/materials/analysis
tools: GJ AMB. Wrote the paper: MN KCV TB KH PW AMB. Initiated
and started the project: AMB.
References
1. Field CB, Behrenfeld MJ, Randerson JT, Falkowski P (1998) Primary production
of the biosphere: integrating terrestrial and oceanic components. Science 281:
237–240.
2. Long S, Humphries S, Falkowski P (1994) Photoinhibition of photosynthesis in
nature. Annu Rev Plant Physiol Plant Mol Biol 45: 633–662.
3. Raven JA, Geider RJ (2003) Adaptation, acclimation and regulation in algal
photosynthesis. In: Larkum AW, Douglas SE, Raven JA, eds. Photosynthesis in
algae. Dordrecht: Kluwer academic publ. pp 386–412.
4. Armbrust V, Berges JA, Bowler C, Green B, Martinez D, et al. (2004) The
genome of the diatom Thalassiosira pseudonana: ecology, evolution, and
metabolism. Science 306: 79–85.
5. Bowler C, Allen AE, Badger JH, Grimwood J, Jabbari K, et al. (2008) The
Phaeodactylum genome reveals the evolutionary history of diatom genomes.
Nature 456: 239–244.
6. Genty B, Briantais JM, Baker NR (1989) The relationship between the quantum
yield of photosynthetic electron-transport and quenching of chlorophyll
fluorescence. Biochim Biophys Acta 990: 87–92.
7. Falkowski PG, Chen YB (2003) Photoacclimation of light harvesting systems in
eukaryotic algae. In: Green BR, Parson WW, eds. Light harvesting antennas in
photosynthesis. Dordrecht: Kluwer Academic Publ. pp 423–447.
8. Muller P, Li XP, Niyogi KK (2001) Non-photochemical quenching. A response
to excess light energy. Plant Physiol 125: 1558–1566.
9. Horton P, Ruban AV, Walters RG (1996) Regulation of light harvesting in green
plants. Ann Rev Plant Physiol Plant Mol Biol 47: 655–684.
10. Gilmore AM (1997) Mechanistic aspects of xanthophyll cycle-dependent
photoprotection in higher plant chloroplasts and leaves. Physiol Planta 99:
197–209.
11. Lavaud J, Rousseau B, Etienne AL (2004) General features of photoprotection
by energy dissipation in planktonic diatoms (Bacillariophyceae). J Phycol 40:
130–137.
12. Johnsen G, Prezelin BB, Jovine RVM (1997) Fluorescence excitation spectra
and light utilization in two red tide dinoflagellates. Limnol Oceanogr 42:
1166–1177.
13. Brunet C, Johnsen G, Lavaud J, Roy S (2009) Pigments and photoacclimation
processes. In: Roy S, Egeland E, Johnsen G, Llewellyn C, eds. Pigments inOceanography. Cambridge: Cambridge University Press, In press.
14. Ruban AV, Lavaud J, Rousseau B, Guglielmi G, Horton P, Etienne AL (2004)
The super-excess energy dissipation in diatom algae: comparative analysis with
higher plants. Photosynth Res 82: 165–175.
15. Owens TG (1986) Light-harvesting function in the diatom Phaeodactylum
tricornutum. II. Distribution of excitation energy between the photosystems. Plant
Physiol 80: 739–746.
16. Horton P, Ruban AV (1992) Regulation of photosystem II. Photosynth Res 34:375–385.
17. Barber J (1995) Molecular basis of the vulnerability of photosystem-II to damage
by light. Aust J Plant Physiol 22: 201–208.
18. Niyogi KK (1999) Photoprotection revisited: genetic and molecular approaches.
Annu Rev Plant Physiol Lant Mol Biol 50: 333–359.
19. Adir N, Zer H, Shochat S, Ohad I (2003) Photoinhibition – a historicalperspective. Photosynth Res 76: 343–370.
20. Ohad I, Adir N, Koike H, Kyle DJ, Inoue Y (1990) Mechanism of
photoinhibition in vivo. A reversible light-induced conformational change ofreaction center II is related to an irreversible modification of the D1 protein.
J Biol Chem 265: 1972–1979.
21. Yamamoto Y, Aminaka R, Yoshioka M, Khatoon M, Komayama K, et al.
(2008) Quality control of photosystem II: impact of light and heat stresses.Photosynth Res 98: 589–608.
22. Shapira M, Lers A, Heifetz PH, Irihimovitz V, Osmond CB, et al. (1997)
Differential regulation of chloroplast gene expression in Chlamydomonas reinhardtii
during photoacclimation: light stress transiently suppresses synthesis of the
Rubisco LSU protein while enhancing synthesis of the PS II D1 protein. Plant
Mol Biol 33: 1001–1011.
23. Hihara Y, Kamei A, Kanehisa M, Kaplan A, Ikeuchi M (2001) DNA microarrayanalysis of cyanobacterial gene expression during acclimation to high light. Plant
Cell 13: 793–806.
24. Stolte W, Kraay GW, Noordeloos AAM, Riegman R (2000) Genetic andphysiological variation in pigment composition of Emiliania huxleyi (Prymnesio-
Genomics of Light Acclimation
PLoS ONE | www.plosone.org 13 November 2009 | Volume 4 | Issue 11 | e7743

phyceae) and the potential use of its pigment ratios as a quantitative
physiological marker. J Phycol 36: 529–539.25. Rodriguez F, Chauton M, Johnsen G, Andresen K, Olsen LM, Zapata M (2006)
Photoacclimation in phytoplankton: implications for biomass estimates, pigment
functionality and chemotaxonomy. Mar Biol 148: 963–971.26. Perry MJ, Talbot MC, Alberte RS (1981) Photoadaptation in marine
phytoplankton: Response of the photosynthetic unit. Mar Biol 62: 91–101.27. Clayton RK, Wang RT (1971) Photochemical reaction centers from
Rhodopseudomonas-spheroids. In: Methods in Enzymology, Vol. 23. Photo-
synthesis, part A. New York: Academic Press. pp 696–704.28. Nakamura K, Ogawa T, Shibata K (1976) Chlorophyll and peptide
compositions in the two photosystems of marine green algae. Biochim BiophysActa 423: 227–236.
29. Schuster G, Lisitsky I, Klaff P (1999) Polyadenylation and degradation of mRNAin the chloroplast. Plant Physiol 120: 937–944.
30. Tanaka R, Tanaka A (2007) Tetrapyrrole biosynthesis in higher plants. Annu
Rev Plant Biol 58: 321–346.31. Wilhelm C, Buchel C, Fisahn J, Goss R, Jakob T, et al. (2006) The regulation of
carbon and nutrient assimilation in diatoms is significantly different from greenalgae. Protist 157: 91–124.
32. Coesel S, Obornik M, Varela J, Falciatore A, Bowler C (2008) Evolutionary
origins and functions of the carotenoid biosynthetic pathway in marine diatoms.PLoS ONE 3: e2896.
33. Zhu SH, Green B (2008) Light-harvesting and photoprotection in diatoms:identification and expression of L818-like proteins in photosynthesis. In: Allen JF,
Gantt E, Golbeck JH, eds. Energy from the Sun, 14th International Congress onPhotosynthesis. Dordrecht: Springer. pp 261–264.
34. Nelson N, Yocum CF (2006) Structure and function of photosystems I and II.
Annu Rev Plant Biol 57: 521–565.35. Oudot-Le Secq MP, Grimwood J, Shapiro H, Armbrust EV, Bowler C,
Green BR (2007) Chloroplast genomes of the diatoms Phaeodactylum tricornutum
and Thalassiosira pseudonana: comparison with other plastid genomes of the red
lineage. Mol Genet Genomics 277: 427–439.
36. Enami I, Okumura A, Nagao R, Suzuki T, Iwai M, Shen JR (2008) Structuresand functions of the extrinsic proteins of photosystem II from different species.
Photosynth Res 98: 349–363.37. Chen H, Zhang D, Guo J, Wu H, Jin M, et al. (2006) A Psb27 homologue in
Arabidopsis thaliana is required for efficient repair of photodamaged photosystemII. Plant Mol Biol 61: 567–575.
38. Plucken H, Muller B, Grohmann D, Westhoff P, Eichacker LA (2002) The
HCF136 protein is essential for assembly of the photosystem II reaction center inArabidopsis thaliana. FEBS lett 532: 85–90.
39. Roose JL, Pakrasi HB (2008) The Psb27 protein facilitates manganese clusterassembly in photosystem II. J Biol Chem 283: 4044–4050.
40. Komenda J, Nickelsen J, Tichy M, Prasil O, Eichacker LA, et al. (2008) The
cyanobacterial homologue of HCF136/YCF48 is a component of an earlyphotosystem II assembly complex and is important for both the efficient
assembly and repair of photosystem II in Synechocyctis sp. PCC 6803. J BiolChem 283: 22390–22399.
41. Jensen PE, Bassi R, Boekema EJ, Dekker JP, Jansson S, et al. (2007) Structure,function and regulation of plant photosystem I. Biochim Biophys Acta 1767:
335–352.
42. Kroth PG, Chiovitti A, Gruber A, Martin-Jezequel V, Mock T, et al. (2008) Amodel for carbohydrate metabolism in the diatom Phaeodactylum tricornutum
deduced from comparative whole genome analysis. PLoS ONE 3: e1426.43. Krieger-Liszkay A, Fufezan C, Trebst A (2008) Singlet oxygen production in
photosystem II and related protection mechanism. Photosynth Res 98: 551–564.
44. Li Y, Wang Z, Sun X, Tang K (2008) Current opinions on the functions oftocopherol based on the genetic manipulation of tocopherol biosynthesis in
plants. J Integr Plant Biol 50: 1057–1069.
45. Lamkemeyer P, Laxa M, Collin V, Li W, Finkemeier I, et al. (2006)Peroxiredoxin Q of Arabidopsis thaliana is attached to the thylakoids and functions
in context of photosynthesis. Plant J 45: 968–981.
46. Meyer Y, Siala W, Bashandy T, Riondet C, Vignols F, et al. (2008)Glutaredoxins and thioredoxins in plants. Biochim Biophys Acta 1783: 589–600.
47. Schurmann P, Buchanan BB (2008) The ferredoxin/thioredoxin system of
oxygenic photosynthesis. Antioxid Redox Signal 10: 1235–1273.
48. Wang F, Zhong NQ, Gao P, Wang GL, Wang HY, et al. (2008) SsTypA1, a
chloroplast-specific TypA/BipA-type GTPase from the halophytic plant Suaeda
salsa, plays a role in oxidative stress tolerance. Plant Cell Environ 31: 982–994.
49. Brown JS (1988) Photosynthetic pigment organization in diatoms (Bacillar-
iophyceae). J Phycol 24: 96–102.
50. Oeltjen A, Krumbein WE, Rhiel E (2002) Investigations on transcript sizes,
steady state mRNA concentrations and diurnal expression of genes encodingfucoxanthin chlorophyll a/c light harvesting polypeptides in the centric diatom
Cyclotella cryptica. Plant Biol 4: 250–257.
51. Mock T, Valentin K (2004) Photosynthesis and cold acclimation: molecular
evidence from a polar diatom. J Phycol 40: 732–741.
52. Lohr M, Wilhelm C (1999) Algae displaying the diadinoxanthin cycle alsopossess the violaxanthin cycle. Proc Natl Acad Sci U S A 96: 8784–8789.
53. Lohr M, Wilhelm C (2001) Xanthophyll synthesis in diatoms: quantification of
putative intermediates and comparison of pigment conversion kinetics with rate
constants derived from a model. Planta 212: 382–391.
54. Savard F, Richard C, Guertin M (1996) The Chlamydomonas reinhardtii LI818 generepresents a distant relative of the cabI/II genes that is regulated during the cell
cycle and in response to illumination. Plant Mol Biol 32: 461–473.
55. Richard C, Ouellet H, Guertin M (2000) Characterization of the LI818
polypeptide from the green unicellular alga Chlamydomonas reinhardtii. Plant MolBiol 42: 303–316.
56. Zhirong L, Wakao S, Fischer BB, Niyogi KK (2009) Sensing and responding to
excess light. Annu Rev Plant Biol 60: 239–260.
57. Ballottari M, Dall’Osto L, Morosinotto T, Bassi R (2007) Contrasting behaviour
of higher plant photosystem I and II antenna systems during acclimation. J BiolChem 282: 8947–8958.
58. Guillard RRL (1975) Culture of phytoplankton for feeding marine invertebrates.
In: Smith WL, Chanley MH, eds. Culture of marine invertebrate animals. NewYork: Plenum Press. pp 26–60.
59. Andersen RA, Morton SL, Sexton JP (1997) Provasoli-Guillard National Centerfor culture of marine phytoplankton 1997 list of strains. J Phycol 33: 1–75.
60. Smyth GK (2004) Linear models and empirical Bayes methods for assessing
differential expression in microarray experiments. Statistical Applications inGenetics and Molecular Biology 3, No. 1, Article 3.
61. Benjamini Y, Hochberg Y (1995) Controlling the false discovery rate: a practicaland powerful approach to multiple testing. J R Statist Soc B 57: 289–300.
62. Ramakers C, Ruijter JM, Deprez RH, Moorman AFM (2003) Assumption-free
analysis of quantitative real-time polymerase chain reaction (PCR) data.Neurosci Lett 339: 62–66.
63. Pfaffl MW, Horgan GW, Dempfle L (2002) Relative expression software tool(REST�) for group-wise comparison and statistical analysis of relative
expression results in real-time PCR. Nucleic Acids Res 30: e36.
64. Van Kooten O, Snell JFH (1990) The use of chlorophyll fluorescencenomenclature in plant stress physiology. Photosynth Res 25: 147–150.
65. Hancke K, Hancke TB, Olsen LM, Johnsen G, Glud R (2008) Temperatureeffects on microalgae photosynthesis-light responses measured by O2 production,
pulse-amplitude-modulated fluorescence and 14C assimilation. J Phycol 44:501–514.
66. Sakshaug E, Bricaud A, Dandonneau Y, Falkowski PG, Kiefer DA, et al. (1997)
Parameters of photosynthesis: definitions, theory and interpretation of results.
J Plankton Res 19: 1637–1670.
Genomics of Light Acclimation
PLoS ONE | www.plosone.org 14 November 2009 | Volume 4 | Issue 11 | e7743


![New Insight into Phaeodactylum tricornutum Fatty Acid Metabolism… · acid metabolism of P. tricornutum were obtained from labeling experiments. Incubation of the diatom with [14C]acetate](https://static.cupdf.com/doc/110x72/5e99fb3cf9afa538077bed2b/new-insight-into-phaeodactylum-tricornutum-fatty-acid-acid-metabolism-of-p-tricornutum.jpg)


