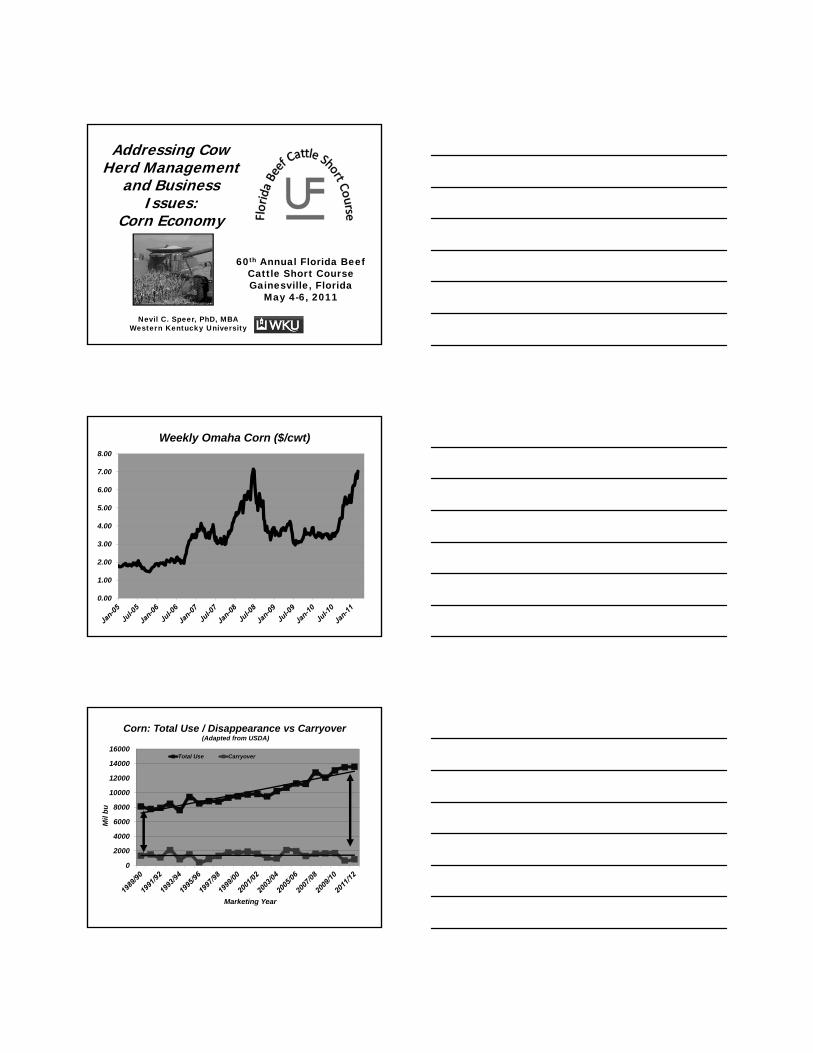
Nevil C. Speer, PhD, MBAWestern Kentucky University
Addressing Cow Herd Management
and Business Issues:
Corn Economy
60th Annual Florida Beef Cattle Short CourseGainesville, Florida
May 4-6, 2011
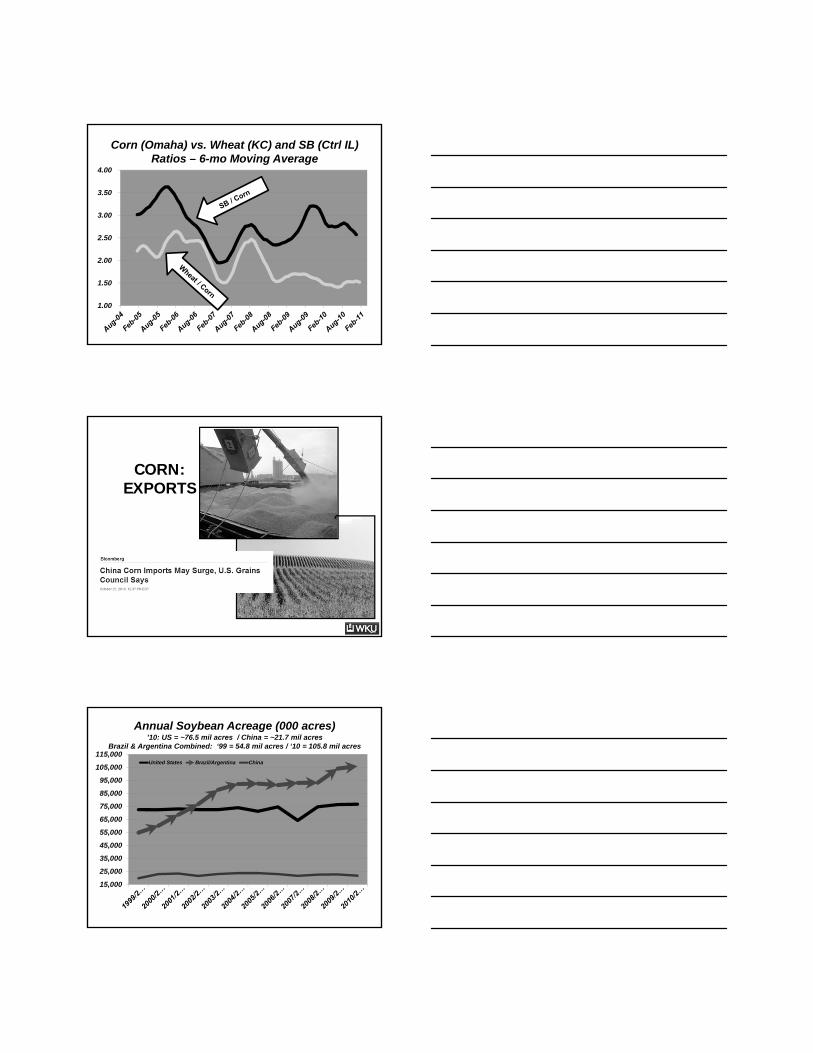
Weekly Omaha Corn ($/cwt)
0.00
1.00
2.00
3.00
4.00
5.00
6.00
7.00
8.00
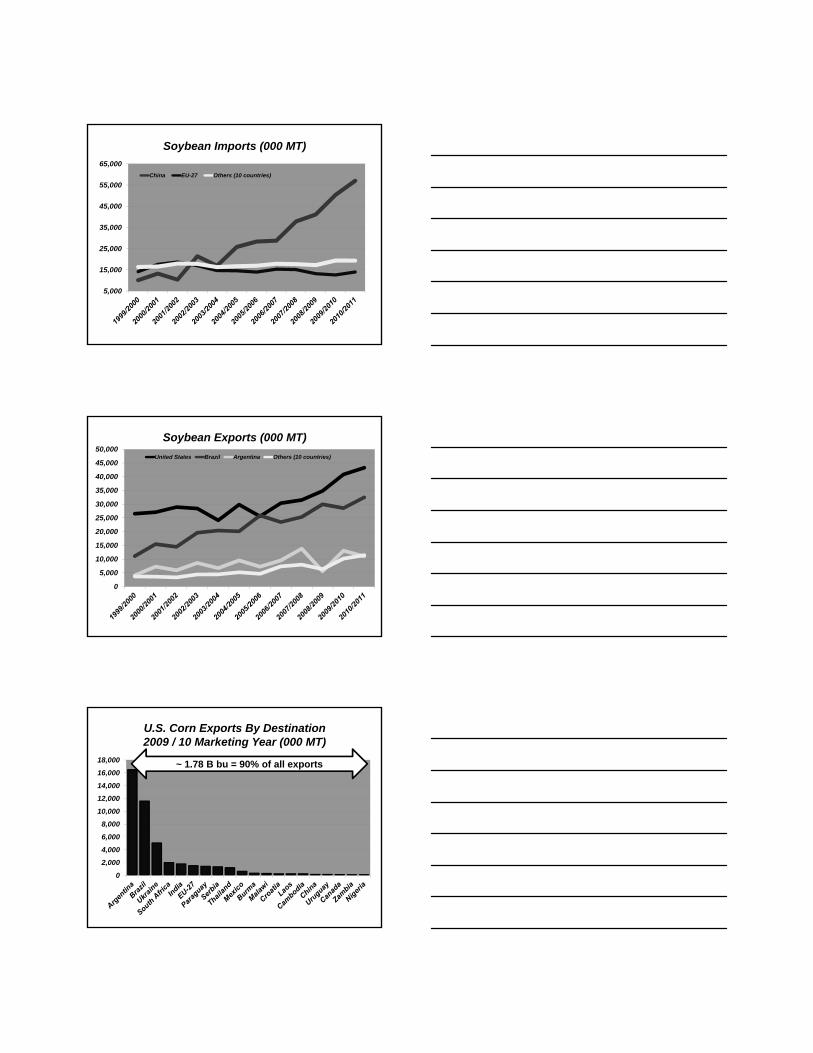
Corn: Total Use / Disappearance vs Carryover(Adapted from USDA)
0
2000
4000
6000
8000
10000
12000
14000
16000
Mil
bu
Marketing Year
Total Use Carryover

Feed/Residual vs. Ethanol Utilization
0
1000
2000
3000
4000
5000
6000
7000
Mil Bu
Feed/Residual Ethanol
Corn Utilization Feed/Residual vs. Ethanol
74.1%70.4% 69.6% 69.6%
67.4%
61.6%57.8%
50.8%46.4% 45.0% 44.6%
0.0%
12.6% 14.0% 15.0%17.5%
23.3%
29.3%
36.3%41.2% 42.9% 43.3%
Feed/Residual Ethanol
Carryover vs. Price(89/90-05/06 vs 06/07-11/12)
1.50
2.50
3.50
4.50
5.50
6.50
4% 8% 12% 16% 20% 24%
Co
rn P
rice
($/
bu
)
Stocks/Use
89/90 - 05/06 06/07 - 11/12
Steeper regression?More volatility?

Actual Carryover vs. Price1.7 vs .63!!!!
y = -0.63x + 3.17
y = -1.70x + 6.53
1.50
2.00
2.50
3.00
3.50
4.00
4.50
5.00
5.50
6.00
0.25 0.75 1.25 1.75 2.25
Co
rn P
rice
($/
bu
)
Carryover (bil bu)
89/90 - 05/06 06/07 - 11/12
Steeper regression!More volatility!
Corn Futures Weekly Change (Nearby Contract)
0.00
0.10
0.20
0.30
0.40
0.50
0.60
0.70
0.80
0.90
1.00
2000‐2005 Average Weekly Move: 5.8 cents
Average Weekly Move: 2006 = 9 cents2007 = 16 cents2008 = 28 cents2009 = 14 cents2010 = 13 cents
2011 to date: 19 cents
Commitment of TradersCorn Futures (CBOT / CME Group)
Open Interest, Commercial Short, Non-commercial Long
0
200
400
600
800
1,000
1,200
1,400
1,600
1,800
2,000
Th
ou
san
ds
Futures Open Interest Commercial Short Non-Commercial Long
Corn (Omaha) vs. Wheat (KC) and SB (Ctrl IL)Ratios – 6-mo Moving Average
1.00
1.50
2.00
2.50
3.00
3.50
4.00
CORN:EXPORTS
Annual Soybean Acreage (000 acres)’10: US = ~76.5 mil acres / China = ~21.7 mil acres
Brazil & Argentina Combined: ‘99 = 54.8 mil acres / ‘10 = 105.8 mil acres
15,000
25,000
35,000
45,000
55,000
65,000
75,000
85,000
95,000
105,000
115,000United States Brazil/Argentina China
Soybean Imports (000 MT)
5,000
15,000
25,000
35,000
45,000
55,000
65,000
China EU-27 Others (10 countries)
Soybean Exports (000 MT)
0
5,000
10,000
15,000
20,000
25,000
30,000
35,000
40,000
45,000
50,000United States Brazil Argentina Others (10 countries)
U.S. Corn Exports By Destination2009 / 10 Marketing Year (000 MT)
0
2,000
4,000
6,000
8,000
10,000
12,000
14,000
16,000
18,000 ~ 1.78 B bu = 90% of all exports

World Corn Supply and Use (09/10) Million Metric Tons
(MMT)Beginning
Stocks Production ImportsDomestic
Feed 2/Domestic
Total 2/ ExportsEndingStocks
World 3/ 147.82 812.38 89.79 482.7 815.66 96.89 144.54United States 42.5 332.55 0.21 130.57 281.42 50.46 43.38Total Foreign 105.32 479.83 89.58 352.12 534.24 46.43 101.16
Major Exporters 5.11 36.22 0.28 9.7 17.3 18.5 5.8Argentina 0.99 22.8 0.25 5 6.9 16.5 0.64South Africa 4.11 13.42 0.03 4.7 10.4 2 5.16
Major Importers 18.22 107.06 52.24 112.16 160.36 3.42 13.74Egypt 1.4 6.82 5.83 10.1 12.5 0.02 1.53EU-27 6/ 6.15 57.15 2.93 45 60 1.52 4.71Japan 1 0 15.98 11.4 16 0 0.98Mexico 3.56 20.37 8.3 14.2 30.2 0.64 1.39Southeast Asia 7/ 4 22.61 6.22 20.6 28.6 1.24 2.99South Korea 1.47 0.08 8.46 6.36 8.41 0 1.59
Selected Other 0Brazil 12.08 56.1 0.55 40 47 11.6 10.13Canada 1.83 9.56 2.1 7.65 11.61 0.13 1.76China 53.17 158 1.3 112 159 0.15 53.31
FSU-12 1.58 18.04 0.23 11.3 12.92 5.6 1.34Ukraine 0.73 10.5 0.01 4.8 5.5 5.07 0.67
China: Commercial Hog Production (Rebecca Bratter, Director Trade Development, U.S. Grains Council,
USDA Outlook Forum Presentation, 2011)
0%
10%
20%
30%
40%
50%
60%
70%
80%
90%
THEINFLUENCE
OFETHANOL

Ethanol – General Observations
• Profitability / Sustainability
– Mandates
– Corn Price
– Ethanol / Gas Margin
• 45-cent / gal tax credit
• Ethanol π up to a 45-cent premium over gas
• 150 B gal annual fuel use
– E10 represents 15 B gal
– Nearing blend wall
Jan. 1 Annual Ethanol Capacity (mil gal)Adapted from Renewable Fuels Association (RFA)
1500
3500
5500
7500
9500
11500
13500
Ethanol Plant Alternative Scenarios:Crude, Gasoline and Shutdown Price of Corn
Source: Darrell Good and Scott Irwin, UofI (March , 2011)
Crude Oil Price($/bbl)
Wholesale Gasoline Price
($/gal)
Shutdown Price of Corn for Ethanol
Plants ($/bu)
75 2.00 5.89
95 2.50 7.84
110 3.00 9.78
130 3.50 11.72
150 4.00 13.66

Ethanol ProfitabilitySource: USDA AMS Iowa Ethanol Report, EIA
$(0.50)
$-
$0.50
$1.00
$1.50
$2.00
$2.50
$3.00
$ p
er g
allo
n
Return Over Total Cost
Return Over Variable Cost
Return Over Grind Margin
Ethanol Plant Locations (Source: RFA)(Implications for E85)
NEW DYNAMICS
Financial RamificationsMarkets Always Uncertain…
What’s New is Amplified Volatility!
• 25,000 head feedyard
• Daily corn usage: 7‐8,000 bu
• Equivalent to 675,000 quarterly
• Current moving average = 30 cents
• Wrong decision: ~$200,000+
– For just one quarter!!!!
– $4/head over 2 turns
– Potentially wipes out
annual profit
Purchasing inputs is increasingly time consuming and complex
Capital Requirements
• $1/bu = ~$55/head (750-lb yearling)
• 30,000 head feedyard = $1.65 mil!!!
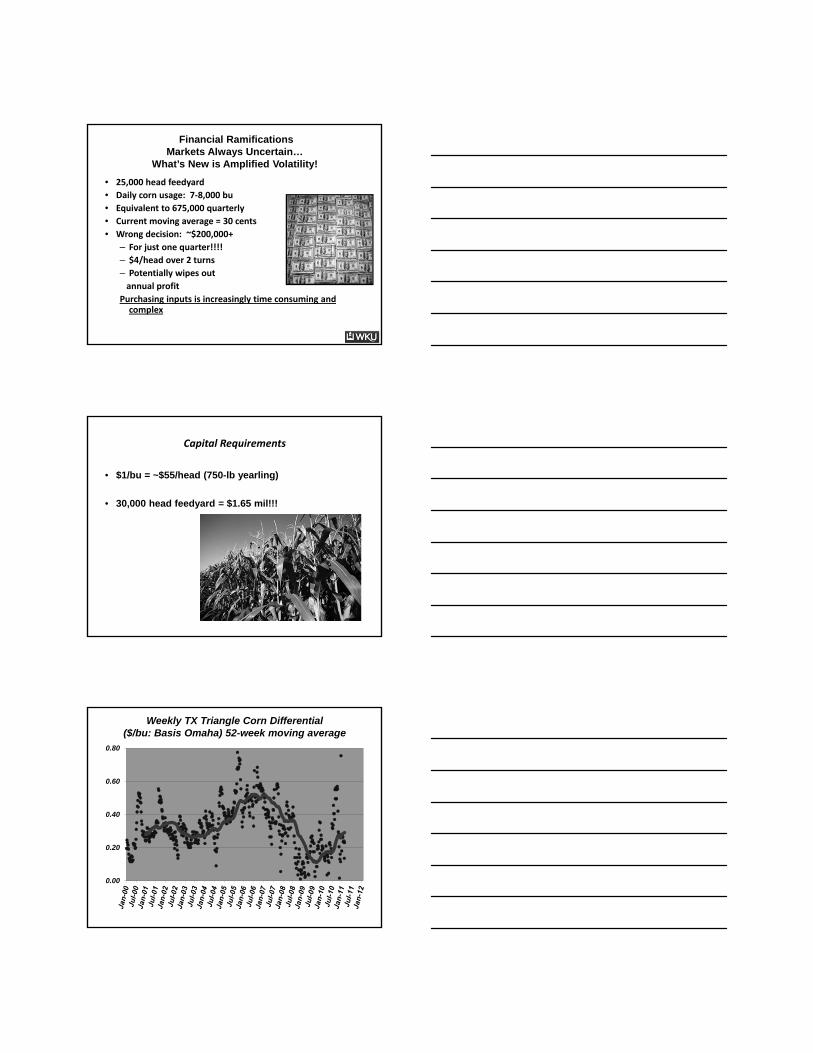
Weekly TX Triangle Corn Differential ($/bu: Basis Omaha) 52-week moving average
0.00
0.20
0.40
0.60
0.80

NE / IA / SD Aggregate COF Population% of U.S. Total (2010 through May) / Adapted from USDA:NASS
WHERE TO….?
Corn/Wheat/Soybean Acreage (mil acres)1996 = 218.5 mil acres vs. 2011 = 227 mil acres
50
60
70
80
90Corn Soybeans Wheat
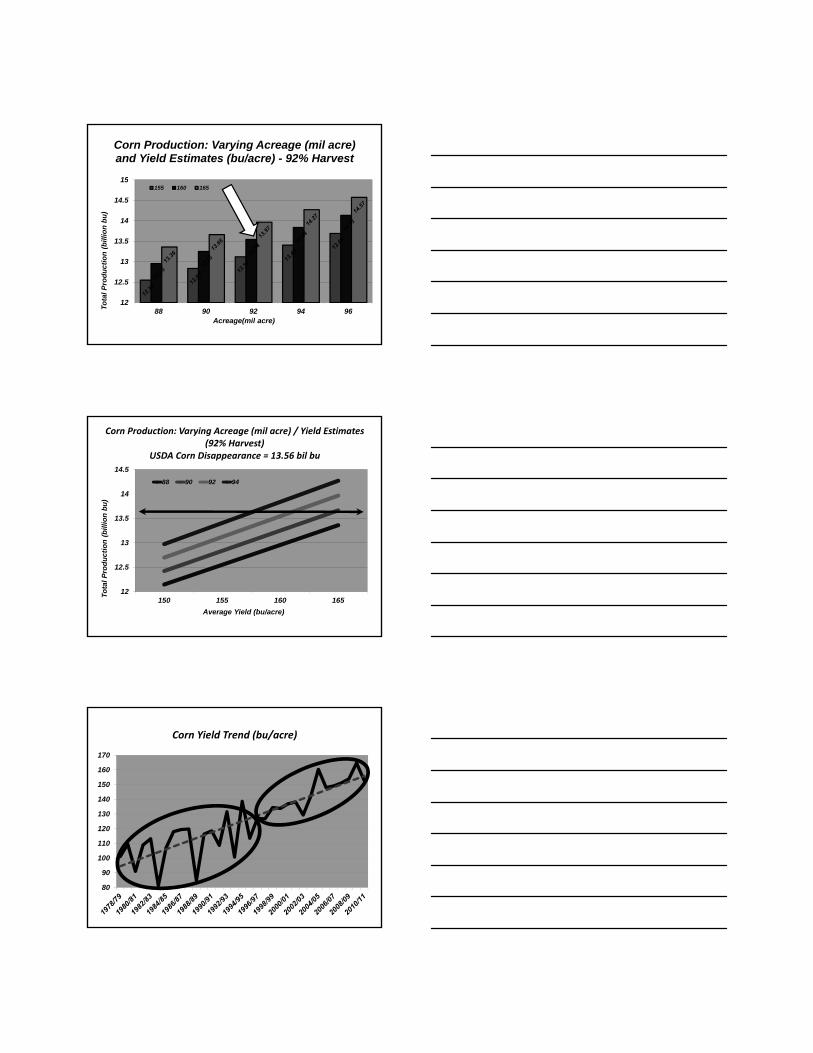
Corn Production: Varying Acreage (mil acre) and Yield Estimates (bu/acre) - 92% Harvest
12
12.5
13
13.5
14
14.5
15
88 90 92 94 96To
tal
Pro
du
ctio
n (
bill
ion
bu
)
Acreage(mil acre)
155 160 165
Corn Production: Varying Acreage (mil acre) / Yield Estimates (92% Harvest)
USDA Corn Disappearance = 13.56 bil bu
12
12.5
13
13.5
14
14.5
150 155 160 165
To
tal
Pro
du
ctio
n (
bil
lio
n b
u)
Average Yield (bu/acre)
88 90 92 94
Corn Yield Trend (bu/acre)
80
90
100
110
120
130
140
150
160
170

Grains
Meats
Speculators Fundamentals
Ag Commodities Traditional Model Internal Drivers Only
Ethanol
Energy
Markets
ForexFinancialization/ Money Flow /
Globex
Globalization
Ag Commodities
Ag Commodities New Model of Complexity
Risk = 1. Danger
2. Opportunity
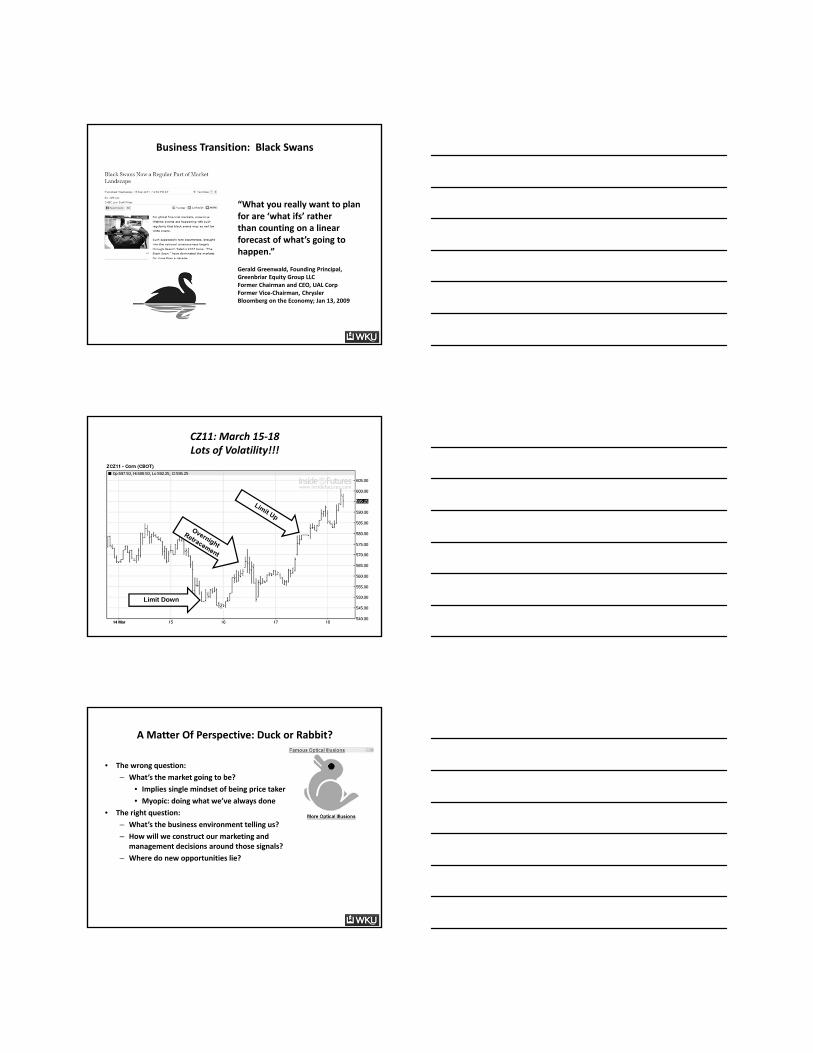
Business Transition: Black Swans
“What you really want to plan for are ‘what ifs’ rather than counting on a linear forecast of what’s going to happen.”
Gerald Greenwald, Founding Principal, Greenbriar Equity Group LLCFormer Chairman and CEO, UAL CorpFormer Vice‐Chairman, Chrysler Bloomberg on the Economy; Jan 13, 2009
CZ11: March 15‐18Lots of Volatility!!!
Limit Down
A Matter Of Perspective: Duck or Rabbit?
• The wrong question:
– What’s the market going to be?
• Implies single mindset of being price taker
• Myopic: doing what we’ve always done
• The right question:
– What’s the business environment telling us?
– How will we construct our marketing and management decisions around those signals?
– Where do new opportunities lie?

Always remember, it’s the worry you haven’t even thought to worry about
that should worry you the most! Clarice Bean, Don’t Look Now (Lauren Child)