Ple
ase
note
that
this
is a
n au
thor
-pro
duce
d P
DF
of a
n ar
ticle
acc
epte
d fo
r pub
licat
ion
follo
win
g pe
er re
view
. The
def
initi
ve p
ublis
her-
auth
entic
ated
ver
sion
is a
vaila
ble
on th
e pu
blis
her W
eb s
ite
1
Science of The Total Environment December 2011, Volumes 412–413, Pages 359–365 http://dx.doi.org/10.1016/j.scitotenv.2011.10.028 © 2011 Elsevier B.V. All rights reserved.
Archimer http://archimer.ifremer.fr
Active biomonitoring in Greek coastal waters: Application of the integrated biomarker response index in relation to contaminant levels in
caged mussels
Catherine Tsangarisa, *, Ioannis Hatzianestisa, Vassiliki-Angelique Catsikia, Konstantinos Ar. Kormasb, Evangelia Strogyloudia, Christos Neofitoub, Bruno Andralc, François Galganid
a Institute of Oceanography, Hellenic Center for Marine Research, 46.7 klm, Athinon-Souniou Ave., P.O. Box 712, 19013 Anavyssos, Greece b Department of Ichthyology and Aquatic Environment, Faculty of Agricultural Sciences, University of Thessaly, 38446, Volos, Greece c IFREMER, Laboratoire Provence Azur Corse, BP 330, 83507 La Seyne sur Mer Cedex, France d IFREMER, Laboratoire Environnement Ressources Languedoc Roussillon, BP 211, 34203 Sete Cedex, France *: Corresponding author : Catherine Tsangaris, Tel.: + 30 22910 76379 ; fax: + 30 22910 76347 ; email address : [email protected]
Abstract:
An integrated approach using biomarkers and contaminant levels in mussels Mytilus galloprovincialis L. was employed to assess chemical contamination in Greek coastal waters within the framework of the MYTIMED program. Biomarkers (metallothioneins, glutathione S-transferase, catalase, acetylcholinesterase and RNA:DNA ratio) have been previously described in mussels caged at 14 sites in coastal areas influenced by different types of anthropogenic activities. This study applied a biomarker index, the Integrated Biomarker Response (IBR) to summarize biomarker responses and relate stress levels to concentrations of organochlorine compounds (PCBs, DDTs), polycyclic aromatic hydrocarbons (PAHs), and metals (Cu, Ni, Fe, Zn) measured in the mussel tissues. The IBR index indicated environmental stress at sites near cities and industries and was overall related to organic contaminants, but also elevated metal concentrations at certain sites. Slightly increased IBR values at few sites away from known pollution sources were not accompanied with increased contaminant levels suggesting stress possibly caused by natural factors. Results confirmed the usefulness of integration of biological effects measurements and chemical analysis for the assessment of chemical contamination in coastal waters.
Highlights
► Chemical contamination in Greek coastal waters was assessed using caged mussels. ► The integrated biomarker response index indicated environmental stress at sites near cities and industries. ► Environmental stress was overall related to organic contaminants but also elevated metal concentrations at certain sites.
Keywords: Pollution ; Biomarkers ; Monitoring ; Mussel caging ; Mytilus galloprovincialis ; Mediterranean Sea
1. Introduction
Active biomonitoring i.e. the use of sentinel organisms from a single “non-contaminated” population deployed at sites under investigation in order to measure levels and biological effects of contaminants is a useful approach for pollution assessment in coastal waters (Stien et al., 1998; Andral et al., 2004; Viarengo et al., 2007; Damiens et al., 2007; Jung et al., 2008). This approach avoids bias related to the age and the reproductive status of the organisms and allows better control of
accumulation and biological effects of contaminants in a predetermined exposure
period. In addition, comparisons of sites are feasible even if natural populations are
scarce.
The combined approach of monitoring chemical contaminant levels, along side
biological effect measurements offers enormous potential to meet the challenges
outlined by the European Union Marine Strategy Framework Directive (MSFD,
2008/56/EC) for undertaking assessments of Good Environmental Status in European
marine waters (Lyons et al., 2010). Biomarkers are among the emerging tools for the
assessment of biological effects of contaminants in monitoring programmes (Allan et
al., 2006; Depledge, 2009). Biomarkers reveal environmental stress caused by
chemical contaminants and also other environmental variables thus integration of
biomarkers and chemical analysis is essential in order to establish links between stress
and pollution (Galloway et al., 2004a; Thain et al., 2008). Combinations of multiple
biomarkers reflecting effects on different endpoints and exposure to various types of
contaminants are used in order to achieve a comprehensive evaluation of pollution
impact (Galloway et al., 2004b; Viarengo et al., 2007). Since results of different sets
of biomarkers are often difficult to interpret, integration of biomarker data into
multiple-biomarker indices for the evaluation of contaminant-induced stress is
increasingly employed (Beliaeff and Burgeot, 2002; Blaise et al., 2002; Cheuvre et. al,
2003; Broeg et al., 2005; Narbonne et al., 2005; Auffret et al., 2006; Dagnino et al.,
2007; Haager et al., 2009). These biomarker-based indices of the organisms’ health
status are proposed as useful tools for the assessment of ecological risk in
environmental management. Biomarker indices are constructed using various
univariate or multivariate methods and ranking systems. The choice of biomarkers
employed depends on the basic concept of each index. A number of indices include
3
biomarkers at different levels of biological organization ranging from general stress
responses to specific effect and exposure biomarkers (Biomarker Response Index,
BRI: Haager et al., 2009; Health Status Index, HSI: Dagnino et al., 2007; Blaise et al.,
2002; Cheuvre et. al, 2003) while others employ only biomarkers reflecting specific,
early molecular responses to particular contaminants (Multimarker Pollution Index,
MPI: Narbonne et al., 2005), toxic effects ranging from early to late responses
(Bioeffect Assesement Index, BAI: Broeg et al., 2005), immunotoxic responses
(Immunotoxicological Index: Auffret et al., 2006) or lysosomal responses (Lysosomal
Response Index, LRI: Izagirre and Marigomez, 2009). The integrated biomarker
response (IBR) index is a simple graphic method developed by Beliaeff and Burgeot
(2002) that uses star plots as a means of summarizing biomarker responses into a
single value reflecting the level of environmental stress at each site. This index can
integrate variable combinations of biomarkers of general health, toxic effects and
exposure to specific contaminants (Broeg and Lehtonen, 2006). Belliaf and Bourgeot
(2002) pointed out that successful application of IBR depends on a relevant choice of
biomarkers in relation to the specific objectives of the study and the characteristics of
the field site, while interpretation of the results has to take in account variations in
abiotic and biotic factors that influence biomarker responses. A number of studies
using different biomarker combinations have shown visual accordance of this index
with contaminant levels (Beliaeff and Burgeot, 2002; Damiens et al., 2007;
Pytharopoulou et al., 2008; Lu et al., 2010) and similar results of this index to other
biomarker indices such as the BAI (Broeg and Lehtonen, 2006), the HIS and the LRI
(Raftopoulou and Dimitriadis, 2010).
Mussels are commonly used as sentinel organisms in bio-monitoring studies due to
their wide geographical distribution and ability to accumulate contaminants in
4
proportion to levels in the environment (Andral et al., 2004; Viarengo et al., 2007).
Native populations or deployed mussels originating from a non-polluted/pristine site
are commonly employed (Bocquené et al., 2004; Lehtonen et al. 2006; Gorbi et al.,
2008; Gagné et al., 2008; Hunt and Sloane, 2010). The use of deployed mussels has
proved useful for large geographical scale monitoring since mussels can be immersed
at any location and/or depth. (Andral et al., 2004; Galgani et al., 2005; Galgani et al.,
2011).
Within the framework of the MYTIMED programme, active biomonitoring using
caged mussels was applied to assess chemical contamination in the East
Mediterranean Sea. Multiple biomarkers reflecting contaminant exposure and/or
effects were assessed in mussels caged in Greek coastal waters (Tsangaris et al.,
2010). Metallothioneins (MTs), metal-binding proteins specifically induced by
exposure to certain metals such as Cu, Zn, Cd, Hg (Viarengo et al., 1999), glutathione
S-transferase (GST), a phase II biotransformation enzyme that has been shown to
respond to organic contaminants (PCBs, chlorinated pesticides, PAHs; Cheung et al.,
2001, 2002), catalase (CAT), an antioxidant enzyme used as a biomarker of oxidative
stress that can be induced by a wide range of contaminants (Livingstone, 2001),
acetylcholinesterase (AchE), a biomarker of neurotoxicity indicative of exposure to
carbamate and organophosphate pesticides (Fulton and Key, 2001) and also general
stress (Lehtonen et al., 2006), and RNA:DNA ratio, a biochemical growth biomarker
reflecting a general stress response (Wo et al., 1999) were measured. The present
study aimed to apply the IBR index in combination with contaminant levels in caged
mussels for the assessment of chemical contamination in Greek coastal waters. IBR
values reflecting environmental stress levels, were compared to concentrations of
organochlorine compounds (PCBs, DDTs), polycyclic aromatic hydrocarbons (PAHs)
5

and metals (Cu, Ni, Fe, Zn) measured in the mussel tissues. In addition, the present
study intended to further validate the suitability of the IBR index as a tool for
pollution assessment in marine ecosystems.
2. Materials and Methods
2.1. Sampling area and experimental design
Mussels Mytilus galloprovincialis were caged at several sites along the Greek
coastline. The transplantation was performed by the French oceanographic vessel ‘L’
Europe’ and the Greek oceanographic vessel ‘Philia’ according to standardized
procedures (Andral et al., 2004). Detailed information on transplantation methodology
and biomarker analyses are described in Tsangaris et al. (2010). Briefly, mussels of
approximately 60 mm shell length from an aquaculture farm were placed in PVC
cages, immersed at the selected sites at 8 m depth below the sea surface and recovered
after three months by diving. The depth of the sites was between 20 to 30 m. Samples
were conditioned immediately after collection on board. In one batch of mussels,
whole soft tissues were removed from the shells and stored at -20º for chemical
analyses (pooled sample of 120 individuals per site), condition index (pooled sample
of 30-40 individuals per site) and RNA:DNA ratio (3 pooled samples of 3-5
individuals per site) measurements. In a second batch of mussels, gills and digestive
glands were dissected and were frozen in liquid nitrogen (5 pooled samples of 6
individuals per site). AchE was measured in the gills and CAT, GST and MTs in the
digestive glands.
6

The biomarker data used for the calculation of the IBR index are presented in
Tsangaris et al. (2010). Data from 14 sites (4 sites with no data for MTs were
excluded) in coastal areas influenced by different types of anthropogenic activities
were used; S1 and S2 in Thermaikos Gulf, S3 in Saronikos Gulf, S4 in N. Evoikos
Gulf, S5 in S. Evoikos Gulf, S6 in Korinthiakos Gulf, S7 in Maliakos Gulf, S10 in
Pagasitikos Gulf, S12 in Nestos estuary, and S13, S14, S15, S16 and S18 in the
Aegean Sea (Figure 1). Types of anthropogenic impacts at the selected areas are
shown in Table 1. Sites in the Aegean Sea, near islands away from known sources of
pollution sources (S14, S15, S16 and S18) were used as reference sites.
2.2. IBR index calculation
IBR was calculated according to Beliaeff and Burgeot (2002). Data was first
standardized and then the scores of all the biomarkers at a given station were
represented in star plots. Calculations for a given station were as follows. For each
biomarker, the mean value (X) at each station, and the general mean (m) and standard
deviation (s) of X for all stations were computed. The values of X were standardized
to obtain Y, where Y = (X - m)/s. Then Z was calculated as Z = - Y or Z = Y in the
case of biomarker responding to pollution by inhibition or induction respectively. In
the case of RNA:DNA ratio that presented a biphasic response to pollution (Tsangaris
et al., 2010), Z was set as Z = - Y in all stations except S4 and S5, where very high
values were recorded and Z was set as Z = Y. Then, the minimum value (Min) of Ζ
for all stations was obtained. The score (B) for each biomarker for a given station was
computed as B = Z +│Min│where │Min │is the absolute value. Five biomarkers
(AchE, MTs, RNA:DNA, GST and CAT) were introduced in the IBR calculation. The
7

respective five scores for each station (B1-B5) were represented in star plots. The IBR
index for each station was calculated as the area of the star plot where the scores are
displayed:
where Ai is the triangular area represented by two consecutive biomarker scores (Bi ,
Bi+1) on the star plot, and n is the number of biomarkers used in the IBR calculation.
2.3. Chemical analyses
The frozen tissues were freeze-dried and homogenized. For the analysis of metals 1.5
g of dried tissue were digested with HNO3 under pressure using a microwave furnace
CEM MDS 2100 (UNEP, 1984) and the determination of Cu, Ni, Fe and Zn was
performed by flame atomic absorption spectrophotometry (Varian Spectra AA 20
Plus). The accuracy and precision of the analytical methodology was tested with the
reference material NRC-Dorm2 (Dogfish muscle).
For PAH analysis 3 g of dried tissue were spiked with known quantities of deuterated
PAH used as internal standards and saponified with methanolic KOH. The
unsaponified material was extracted with n-hexane and the extract was cleaned-up by
column chromatography. A glass column filled with 5 g of alumina deactivated with
6% water was used and the elution was performed with 20 mL of n-hexane. The
eluate was condensed to 0.2 mL and put on a glass column filled with 2 g of activated
silica. Two fractions were collected: The first one, contained the aliphatic
hydrocarbons, with 10 mL of n-hexane and the second, contained the PAH, with 10
mL of a mixture n-hexane – ethyl acetate 9:1. The determination of PAH in this
8
second fraction was performed by gas chromatography – mass spectrometry (Hewlett
– Packard 6890 GC-MSD). The quantitation was based on the internal standards
added in the beginning and the following compounds were determined: naphthalene,
methyl-, dimethyl- and trimethyl- naphthalenes, acenaphthene, acenaphthylene,
fluorine, dibenzothiophene, phenanthrene, mehyl- and dimethyl- phenanthrenes,
anthracene, fluoranthene, pyrene, benzo(a)anthracene, chrysene,
benzo(b)fluoranthene, benzo(k)fluoranthene, benzo(e)pyrene, benzo(a)pyrene,
perylene, indeno(1,2-cd)pyrene, benzo(ghi)perylene and dibenzo(ah)anthracene. The
recoveries of the intervnal standard ranged as follows: Naphthalene-d8: 51-62 %,
acenaphthene-d10: 77-84%, phenanthrene-d10: 84-89%, pyrene-d12: 87-94%,
chrysene-d12: 93-102%, perylene-d12%: 96-104%, benzo(ghi)perylene-d12: 93-
103%. The accuracy and precision of the analytical methodology was tested by using
a certified reference material provided from IAEA (IAEA- 432, mussel homogenate).
For the organochlorine analysis 5g of the dried tissue were Soxhlet extracted for 24
hrs with a mixture of dichloromethane-pentane 1:1, the extracts were cleaned-up and
fractionated on deactivated alumina columns (Satsmadjis et al., 1988) and the final
determination was performed on a gas chromatograph equipped with an ECD detector
(Agilent 7890). The accuracy and precision of the analytical methodology was tested
by using a certified reference material provided from IAEA (IAEA- 432, mussel
homogenate).
2.4. Statistical analysis
Relations between the IBR index and contaminant concentrations were examined by
correlation analysis (Pearson’s correlation coefficient). Principal Component Analysis
9
(PCA) was applied to discriminate sites by integration of contaminant levels
according to principal axes and evaluate general patterns of contaminant
bioaccumulation. PAHs, PCBs, DDTs, Cu, Ni, Zn, and Fe concentrations were the
variables used in PCA. The positions of the sites in the co-ordinates of the first two
principal components were then compared to the respective IBR values (Zitco, 1994).
Contaminant concentrations were log (x+1) transformed for statistical analysis.
Statistical analysis was performed using SPSS (correlation analysis) and Primer
(PCA).
3. Results and discussion
To demonstrate the contribution of each biomarker to the IBR index, the standardized
data of biomarkers used in the IBR calculation (biomarker scores) are shown in Table
2. Maximum values represent sites of the highest response of each biomarker (S1 for
AchE and CAT, S13 for MTs, S4 for RNA:DNA and S5 for GST), while zero values
reveal sites of the lowest response (S12 for AchE, S1 for MTs, S18 for RNA:DNA,
S15 for GST and S16 for CAT).
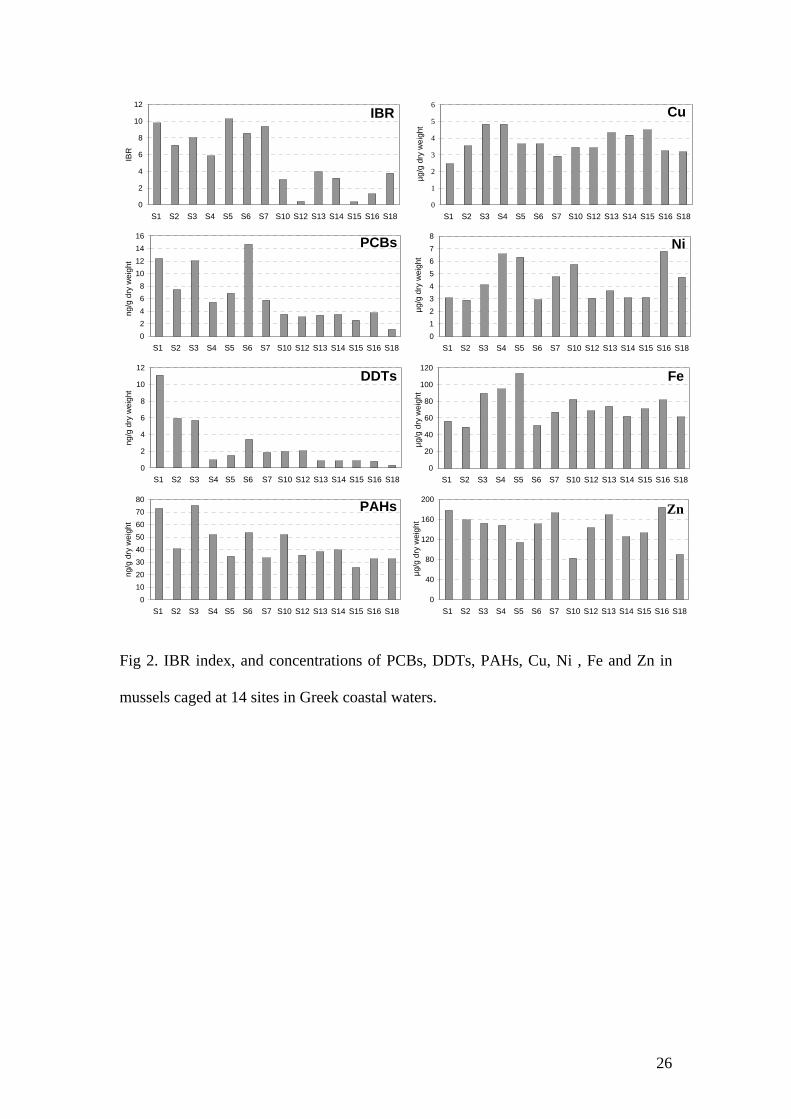
IBR index and contaminant levels in the tissues of mussels are presented in Figure 2.
The IBR index clearly discriminated stress levels among sites, showing higher values
at sites near cities and industries i.e. in Thermaikos Gulf, Saronikos Gulf, N. Evoikos
Gulf, S. Evoikos Gulf, Korinthiakos Gulf and Maliakos Gulf (sites S1, S2, S3, S4, S5,
S6 and S7) compared to sites in the Aegean Sea (sites S13, S14, S15, S16 and S18),
Pagasitikos Gulf and Nestos estuary (sites S10 and S12). The condition index of the
mussels (data presented in Tsangaris et al., 2010), which is mainly influenced by the
nutritional and reproductive status leading to weight variations, was not related to the
10
IBR index (r=0.198, P>0.05). The condition index was generally in accordance with
the trophic characteristics of the sites showing high values in areas where food is
abundant and mussel culture is intense i.e.Thermaikos Gulf, Nestos estuary, Maliakos
Gulf and N. Evoikos Gulf (SoHelME, 2005) and low values in the Aegean Sea where
waters are oligotrophic (Ignatiades, 2005). Nevertheless these differences in the
physiological status of mussels did not mask the overall stress response to pollution as
shown by the IBR index.
Concentrations of organic contaminants were generally in accordance with IBR
results, particularly PCBs and DTTs that were significantly correlated to the IBR
index (r=0.769, P<0.01 and r=0.589, P<0.05 respectively) (Table 2). With regard to
PAHs, a positive although not statistically significant correlation to the IBR index was
recorded (r=0.513, P>0.05). Highest PCBs concentrations of 12-14.7 ng/g were found
at sites S1, S3 and S6. Maximum DDTs concentrations (3.4-11.1 ng/g) were recorded
at sites S1, S2, S3 and S6. Peak PAHs concentrations were found at sites S1 and S3
(72.9 and 75.3 ng/g respectively).
Metal concentrations were not correlated to the IBR index (Table 2); nevertheless
several peaks in Cu, Ni and Fe concentrations were evident at sites showing high IBR
values. Cu concentrations were highest at sites S3 and S4 (4.8 µg/g). Fe
concentrations were highest (89.5-113.4 µg/g) at sites S3, S4 and S5. Peak Ni
concentrations (4.1-6.8 µg/g) were recorded at sites S4, S5 and S7, but also at S10 and
S16 where IBR values and levels of other contaminants were low. These elevated Ni
levels in areas of Pagasitikos Gulf (S10) and Rhodos Island (S16) where pollution
sources are lacking can be possibly due to natural enrichment (Voutsinou-Taliadouri
and Satsmadjis, 1982; Voutsinou-Taliadouri and Georgakopoulou-Grigoriadou, 1989)
and did not induce an overall stress response as shown by the IBR index. Zn
11

concentrations were homogenous with the exception of low levels at sites S10 and
S18.
Overall variations in contaminant concentrations were evaluated by PCA. PCA of
contaminant concentrations produced three principal components that accounted for
81.7% of the total variance. The plot of variable vectors for the first two principal
components PC1 and PC2 that explained 67.3% of the total variance is shown in
Figure 3a. PC1 was mainly influenced by PCBs and DDTs on the positive part while
PC2 was mainly influenced by Fe and Ni on the negative part. PC3 represented 14.4%
of the total variance and was correlated with Cu. The plot of scores for different sites
for the two dominant components PC1 and PC2 marked by the respective IBR values
at each site is shown in Figure 3b. Sites with low levels of contaminants are located in
the upper left part of the plot (negative part of PC1, positive part of PC2) and show
low IBR values. Sites with high levels of PCBs and DDTs are positioned in the
positive part of PC1 and sites with high levels of Ni and Fe are located in the negative
part of PC2; they are accompanied by high IBR values. These results suggest stress
shown by high IBR values (5.9 to 10.3) is related to elevated levels of organic
contaminants and/or metals. However at S7, where IBR value was among the highest
of this study, contaminant levels were not generally elevated. Site S7 is situated in
Maliakos Gulf, an area influenced by urban wastes and agricultural practices, where
massive fish deaths and toxic phytoplankton blooms have been recently recorded
(Pagou et al., 2010). The causes of these incidences are not clearly identified. Thus
other stressors and/or contaminants not analysed in the present study may be due for
the stress response at site S7. The inner part of Maliakos gulf is considerably affected
by the discharge of Sperchios River (Chryssovergis and Panayotidis, 1995) and its
12
ecological status based on ecological indices on phytobenthos data has been classified
from bad to moderate (Spatharis et al., 2003).
IBR index at sites showing low levels of contaminants ranged between 0.4 and 4. The
highest IBR values among these sites were found at S13 and S18 in the Aegean Sea (4
and 3.8, respectively), concomitantly with low condition index values reflecting stress
possibly caused by natural environmental factors such as temperature and food
availability as wild mussels are not present in these areas. Nevertheless regarding site
S13 at Santorini island, biomarker responses could be also due to other unidentified
pollutants emerging from the shipwreck of the ‘Sea Diamond’ cruise ship two months
prior mussel transplantation in this area.
The IBR index is regarded as a practical tool for the examination of the stress
response of different populations by combination of different biomarkers and for the
comparison of stress levels to contaminant levels (Bocquené et al., 2004, Broeg and
Lehtonen, 2006, Damiens et al, 2007, Pytharopoulou et al., 2008, Gagne et al., 2008,
Pereira et al., 2009, Oliveira et al., 2009, Raftopoulou and Dimitriadis, 2010, Wang et
al., 2010, Lu et al, 2010). Several studies using different combinations of biomarkers
in the IBR calculation have shown accordance of IBR with contaminant levels. In
eelpout (Zoarces viviparous) and mussel (Mytilus sp.) populations of the Baltic Sea
good accordance was reported between IBR and tissue levels of organochlorine
compounds (Broeg and Lehtonen, 2006). In mussels (M. galloprovincialis) caged at
several stations in the Bay of Cannes, Damiens et al. (2007) found good agreement of
IBR with tissue Cu and PCB concentrations but not with PAH concentrations. In
mussels (M. galloprovincialis) caged at an area polluted by heavy metals in the Gulf
of Patras (Greeece), IBR showed accordance with Cu concentrations in the digestive
gland (Pytharopoulou et al., 2008). In goldfish (Carassius auratus) transplanted in
13

Taihou lake (China), a visual correlation was recorded between IBR and the PCB and
OCP gradient in sediments (Lu et al., 2010).
The relevant choice of biomarkers is a key issue for the use of integrated indices in
biological effects monitoring. Selection of an appropriate battery of biomarkers can
avoid false-negative responses obtained with a single biomarker and their integration
into an index simplifies interpretation in biomonitoring programs (Beliaeff and
Burgeot, 2002). On the other hand, inclusion of several parameters that respond to the
same type of pollution or biological function will overemphasise the importance of
this particular group of contaminants or function in the overall assessment of
environmental stress (Broeg and Lehtonen, 2006). In the case of the IBR index, the
position of the biomarkers on the star plot used for the IBR calculation should also be
considered, as it affects the ‘‘relative weight’’ of each biomarker in the final index
value (Beliaeff and Burgeot, 2002; Broeg and Lehtonen, 2006). Thus, biomarker
position on the star plot has to be defined based on an objective reason such as their
ability to discriminate non- impacted from impacted sites (Beliaeff and Burgeot,
2002). A limitation of the IBR index due to its mathematical basis, is that IBR values
cannot be compared to values previously computed at the same site or other sites,
unless all data are processed in the same calculation. Thus, the IBR is not able to give
fixed values to describe environmental stress at any time or site without recalculations
and furthermore, classify sites on a fixed scale. Nevertheless, the consistency of IBR
results according to pollution gradients regardless of the variability in the biomarker
sets used (Broeg and Lehtonen, 2006; Damiens et al, 2007; Pytharopoulou et al.,
2008; Oliveira et al., 2009; Raftopoulou and Dimitriadis, 2010) supports its usefulness
as a simple tool for the assessment of pollution impacts in marine ecosystems.
14
In the present study, biochemical biomarkers representing different biological
endpoints i.e. detoxification of metals, organic contaminants and reactive oxygen
species (MTs, GST and CAT), neurotoxicity (AchE) and protein synthesis
(RNA:DNA ratio), were used in the IBR index. The choice of biomarkers intended to
include early responses to major types of contaminants i.e. metals, PAHs, PCBs,
pesticides, and general stress. The condition index may also indicate pollution stress
(Pampanin et al., 2005) but it was not included in the IBR calculation since in the
present study it was mostly related to the level of eutrophication. The position of
biomarkers on the star plot was based on their relevance in discriminating sites
receiving pollution inputs from non-impacted sites as shown by Principle Component
Analysis of biomarker data (Tsangaris et al. 2010). The application of IBR using this
selection of biomarkers proved useful in identifying stress in accordance to measured
contaminant concentrations. Obviously, additional biomarkers in the IBR would
increase the robustness of the index. For example, if ethoxyresorufin-O-deethylase
(EROD) activity was measured, a better agreement of IBR with PAHs concentrations
could have been detected. On the other hand, introduction of additional biomarkers
representing different biological endpoints such as those indicative of endocrine
disruption and genotoxicity in the IBR may have increased the robustness of the
index. Furthermore, it has to be pointed out that this study was focused on
associations between the IBR index and certain types of contaminants, but other
contaminants that were not examined may have also influenced the stress response of
mussels.
In conclusion, the IBR index proved useful tool for the assessment of contaminant-
induced stress over a large spatial scale in Greek coastal waters. Tissue contaminant
concentrations suggest stress levels were overall related to exposure to organic
15
contaminants and exposure to metals at certain sites. Results confirmed the usefulness
of integration of biological effects measurements and chemical analysis for the
assessment of chemical contamination in coastal waters.
Acknowledgements
This study was financed by the INTEREG IIIB Medocc EU Project MYTIMED. The
authors greatly appreciate the assistance of the crews of the oceanographic vessels ‘L’
Europe’ and ‘Philia’. We also thank C. Tomasino, C. Ravel, N. Ganzin, P. Vavilis, H.
Thebault, E. Emery for their valuable assistance in fieldwork and sample preparation
and S. Tsoumpana, and V. Gioni for their assistance with biomarker analyses.
References
Allan IJ, Vrana B, Greenwood R, Mills GA, Roig B, Gonzalez C. A “toolbox” for
biological and chemical monitoring requirements for the European Union’s Water
Framework Directive. Talanta 2006;69:302–322.
Andral B, Stanisiere JY, Sauzade D, Damier E, Thebault H, Galgani F, Boissery P.
Monitoring chemical contamination levels in the Mediterranean based on the use of
mussel caging. Mar Pollut Bull 2004;49:704–712.
Auffret M, Rousseau S, Boutet I, Tanguy A., Baron J, Moraga D, Duchemin M. A
multiparametric approach for monitoring immunotoxic responses in mussels from
contaminated sites in Western Mediterranea. Ecotoxicol Environ Saf 2006;73:393-
405.
16
Belliaeff B, Burgeot T. Integrated Biomarker Response: A useful tool for ecological
risk assessment. Environ Toxicol Chem 2002;21:1316–1322.
Blaise C, Gagné F, Pellerin J, Hansen P-D, Trottier S. Molluscan shellfish biomarker
study of the Quebec, Canada, Saguenay Fjord with the soft-shell clam, Mya arenaria.
Environ Toxicol 2002;3:170-186.
Bocquené G, Chantereau S, Clérendeau C, Beausir E, Ménard D, Raffin B, Minier C,
Burgeot T, Leszkowicz AP, Narbonne J-F. Biological effects of the “Erika” oil spill
on the common mussel (Mytilus edulis). Aquat Living Resour 2004;17:309–316.
Broeg K, Westernhagen Hv, Zander S, Koörting W, Koehler A. The ‘‘bioeffect
assessment index’’ (BAI) A concept for the quantification of effects of marine
pollution by an integrated biomarker approach. Mar Pollut Bull 2005;50:495–503.
Broeg K, Lehtonen KK. Indices for the assessment of environmental pollution of the
Baltic Sea coasts: Integrated assessment of a multi-biomarker approach. Mar Pollut
Bull 2006;53:508–522.
Cheung CCC, Zheng GJ, Lam PKS, Richardson BJ. Relationships between tissue
concentrations of chlorinated hydrocarbons (polychlorinated biphenyls and
chlorinated pesticides) and antioxidative responses of marine mussels, Perna viridis.
Mar Pollut Bull 2002;45:181–191.
Cheung CCC, Zheng GJ, Li AMY, Richardson BJ, Lam PKS. Relationships between
tissue concentrations of polycyclic aromatic hydrocarbons and antioxidative responses
of marine mussels, Perna viridis. Aquat Toxicol 2001;52:189–203.
Chèvre N, Gagné F, Blaise C. Development of a biomarker based index for assessing
the ecotoxic potential of aquatic sites. Biomarkers 2003;8:287–298.
17

Chryssovergis F, Panayotidis P. Communities of macrophytobenthos along an
eutrophication gradient (Maliakos gulf, Aegean Sea, Greece), Oceanologica Acta
1995;18:649–658.
Dagnino A, Allen JI, Moore MN, Broeg K, Canesi L, Viarengo A. Development of an
expert system for the integration of biomarker responses in mussels into an animal
health index. Biomarkers 2007;12(2):155-172.
Damiens G, Gnassia-Barelli M, Loquès F, Roméo M, Salbert V. Integrated biomarker
response index as a useful tool for environmental assessment evaluated using
transplanted mussels. Chemosphere 2007;66:574–583.
Depledge MH. Novel approaches and technologies in pollution assessment and
monitoring: A UK perspective. Ocean Coast Manag 2009;52:336–341.
Fulton MH, Key PB. Acetylcholinesterase inhibition in estuarine fish and
invertebrates as an indicator of organophosphorus insecticide exposure and effects.
Environ Toxicol Chem 2001;20:37-45.
Gagné F, Burgeot T, Hellou J, St-Jean S, Farcy É, Blaise C. Spatial variations in
biomarkers of Mytilus edulis mussels at four polluted regions spanning the Northern
Hemisphere. Environ Res 2008;107:201–217.
Galgani F, Martínez-Gómez C, Giovanardi F, Romanelli G, Caixach J, Cento A,
Scarpato A, BenBrahim S, Messaoudi S, Deudero S, Boulahdid M, Benedicto J,
Andral B. Assessment of polycyclic aromatic hydrocarbon concentrations in mussels
(Mytilus galloprovincialis) from the Western basin of the Mediterranean Sea. Environ
Monit Assess 2011;172:301–317.
Galgani F, Chiffoleau JF, Galla PLE, Pichota Y, Andral B, Martin C. Deep-sea caging
of the mussel Mytilus galloprovincialis: Potential application in ecotoxicological
studies. Chem Ecol 2005;21:133–141.
18

Galloway TS, Brown RJ, Browne MA, Dissanayake A, Lowe D, Jones MB, Depledge
MH.. A multibiomarker approach to environmental assessment. Environ Sci Technol
2004a;38:1723-1731.
Galloway TS, Brown RJ, Browne MA, Dissanayake A, Lowe D, Jones MB, Depledge
MH.. Ecosystem management bioindicators: the ECOMAN project – a multi-
biomarker approach to ecosystem management. Mar Environ Res 2004b;58:233–237.
Gorbi S, Lamberti CV, Notti A, Benedetti M, Fattorini D, Moltedo G, Regoli F. An
ecotoxicological protocol with caged mussels, Mytilus galloprovincialis, for
monitoring the impact of an offshore platform in the Adriatic sea. Mar Environ Res
2008;65:34–49.
Hagger JA, Galloway TS, Langston WL, Jones MB. Application of biomarkers to
assess the condition of European Marine Sites. Environ Pollut 2009;157:2003–2010.
Hunt CD, Slone E. Long-term monitoring using resident and caged mussels in Boston
Harbor yield similar spatial and temporal trends in chemical contamination. Mar
Environ Res 2010;70:343-357.
Ignatiades L. Scaling the trophic status of the Aegean Sea, Eastern Mediterranean. J
Sea Res 2005;54:51– 57.
Izagirre U, Marigomez I. Lysosomal enlargement and lysosomal membrane
destabilisation in mussel digestive cells measured by an integrative index. Environ
Pollut 2009;157:1544–1553.
Jung J-H, Kim S-J, Lee T-K, Shim WJ, Woo S, Kim D-J, Han C-H. Biomarker
responses in caged rockfish (Sebastes schlegeli) from Masan Bay and Haegeumgang,
South Korea. Mar Pollut Bull 2008;57:599–606.
Lehtonen KK, Schiedek D, Köhler A, Lang T, Vuorinen PJ, Förlin L, Barŝiené J,
Pempkowiak J, Gercken J. The BEEP project in the Baltic Sea: Overview of results
19
and outline for a regional biological effects monitoring strategy. Mar Pollut Bull
2006;53:523-537.
Livingstone DR. Contaminant-stimulated reactive oxygen species production and
oxidative damage in aquatic organisms. Mar Pollut Bull 2001;42:656-666.
Lu GH, Ji Y, Zhang HZ, Wua H, Qin J, Wang C. Active biomonitoring of complex
pollution in Taihu Lake with Carassius auratus Chemosphere 2010;79:588–594.
Lyons BP, Thain JE, Stentiford GD, Hylland K, Davies IM, Vethaak AD. Using
biological effects tools to define Good Environmental Status under the European
Union Marine Strategy Framework Directive. Mar Pollut Bull 2010;60:1647-1651.
Narbonne JF, Aarab N, Clėrandeau C, Daubėze M, Narbonne, Champeau O,
Garrigues P. Scale of classification based on biochemical markers in mussels:
application to pollution monitoring in Mediterranean coasts and temporal trends.
Biomarkers 2005;10(1):58-71.
Oliveira M, Maria VL, Ahmad I, Serafim A, Bebianno MJ, Pacheco M, Santos MA
Contamination assessment of a coastal lagoon (Ria de Aveiro, Portugal) using defence
and damage biochemical indicators in gill of Liza aurata – An integrated biomarker
approach. Environ Pollut 2009;157:959-967.
Pagou K, Varkitzi I, Pavlidou A, Hatzianestis I, Psyllidou R, Kontoyannis H, Zeri X,
Yiagnisis M, Rigos G, Prapas A. First occurrence of the fish killing Raphidophyte
chattonella sp. in Maliakos gulf, Greece (Eastern Mediterranean sea). 14th
International conference on Harmful Algae, Hersonisos, Crete, Greece, 1-5 November
2010. p. 145.
Pampanin DM, Volpato E, Marangon I, Nasci C.. Physiological measurements from
native and transplanted mussel (Mytilus galloprovincialis) in the canals of Venice.
Survival in air and condition index. Comp Biochem Physiol 2005;140A:41– 52.
20
Pereira P, de Pablo H, Rosa-Santos F, Pacheco M, Vale C. Metal accumulation and
oxidative stress in Ulva sp. substantiated by response integration into a general stress
index. Aquat Toxicol 2009;91:336–345.
Pytharopoulou S, Sazakli E, Grintzalis K, Georgiou CD, Leotsinidis M, Kalpaxis DL.
Translational responses of Mytilus galloprovincialis to environmental pollution:
Integrating the responses to oxidative stress and other biomarker responses into a
general stress index. Aquat Toxicol 2008;89:18–27.
Raftopoulou EK, Dimitriadis VK. Assessment of the health status of mussels Mytilus
galloprovincialis along Thermaikos Gulf (NorthernGreece):An integrative biomarker
approach using ecosystem health indices. Ecotoxicol Environ Saf 2010;73:1580–
1587.
Satsmadjis J, Georgakopoulos - Gregoriadis E, Voutsinou - Taliadouri F. Separation
of organochlorines on Alumina. J Chromatogr 1988;437:254-257.
SoHelME, State of the Hellenic Marine Environment. HCMR Publ; E.
Papathanassiou & A. Zenetos; 2005.
Spatharis S, Panayotidis P, Danielidis D, Monesanto B. Actes du Deuxieme
symposium Mediterraneen sur la Vegetation Marine, Athenes, 12-13 December
2003:217-222.
Stien X, Percic P, Gnassia-Barelli M, Roméo M, Lafaurie M.. Evaluation of
biomarkers in caged fishes and mussels to assess the quality of waters in a bay of the
NW Mediterranean Sea. Environ Pollut 1988;99:339-345.
Thain JE, Vethaak AD, Hylland K. Contaminants in marine ecosystems: developing
an integrated indicator framework using biological-effect techniques. ICES Journal of
Marine Science 2008;65:1508–1514.
21

Tsangaris C, Kormas K, Stroggyloudi E, Hatzianestis I, Neofitou C, Andral B,
Galgani F. Multiple biomarkers of pollution effects in caged mussels on the Greek
coastline. Comp Bioche. Physiol 2010;151C:369–378.
UNEP. Determination of total Cd, Zn, Pd and Cu in selected marine organisms by
atomic absorption spectrophotometry. Reference Methods for Marine Pollution
Studies, No 11, Rev 1;1984.
Viarengo A, Lowe D, Bolognesi C, Fabbri E, Koehler A. The use of biomarkers in
biomonitoring: A 2-tier approach assessing the level of pollutant-induced stress
syndrome in sentinel organisms. Comp Biochem Physiol 2007;146C:281–300.
Viarengo A, Burlando B, Dondero F, Marro A, Fabbri R.. Metallothionein as a tool in
biomonitoring programmes. Biomarkers 1999;4:455-466.
Voutsinou-Taliadouri F, Satsmadjis J. Trace metals in the Pasassitikos Gulf, Greece.
Estuar Coast Shelf S 1982;15:221-228
Voutsinou-Taliadouri F, Georgakopoulou-Grigoriadou E. Heavy metal concentrations
in surface stations from Pagassitikos Gulf, Greece. Toxicol Environ Chem
1989;20:53-58.
Wang C, Lu GH, Song WT, Xu S, Wang PF. Integrated biomarker response index for
the assessment of environmental stress of the Yangtze River (Nanjing section). Fish
Physiol Biochem 2010;36:1069–1078.
Wo KT, Lam PKS, Wu RSS. A comparison of growth biomarkers for assessing
sublethal effects of cadmium on a marine gastropod, Nassarius festivus. Mar Pollut
Bull 1999;39:165-173.
Zitko V. Principal Component Analysis in the Evaluation of Environmental Data. Mar
Pollut Bull 1994;28:718-722.
22
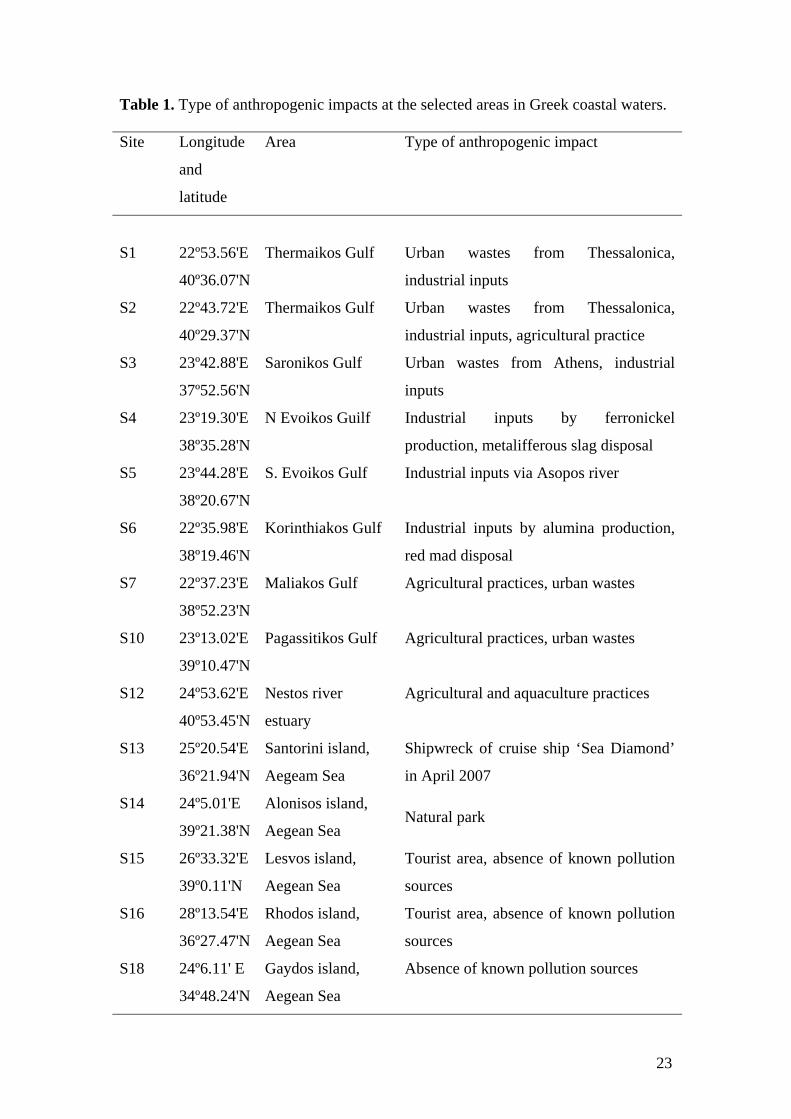
Table 1. Type of anthropogenic impacts at the selected areas in Greek coastal waters.
Site Longitude
and
latitude
Area Type of anthropogenic impact
S1 22º53.56'E
40º36.07'N
Thermaikos Gulf Urban wastes from Thessalonica,
industrial inputs
S2 22º43.72'E
40º29.37'N
Thermaikos Gulf Urban wastes from Thessalonica,
industrial inputs, agricultural practice
S3 23º42.88'E
37º52.56'N
Saronikos Gulf Urban wastes from Athens, industrial
inputs
S4 23º19.30'E
38º35.28'N
N Evoikos Guilf Industrial inputs by ferronickel
production, metalifferous slag disposal
S5 23º44.28'E
38º20.67'N
S. Evoikos Gulf Industrial inputs via Asopos river
S6 22º35.98'E
38º19.46'N
Korinthiakos Gulf Industrial inputs by alumina production,
red mad disposal
S7 22º37.23'E
38º52.23'N
Maliakos Gulf Agricultural practices, urban wastes
S10 23º13.02'E
39º10.47'N
Pagassitikos Gulf Agricultural practices, urban wastes
S12 24º53.62'E
40º53.45'N
Nestos river
estuary
Agricultural and aquaculture practices
S13 25º20.54'E
36º21.94'N
Santorini island,
Aegeam Sea
Shipwreck of cruise ship ‘Sea Diamond’
in April 2007
S14 24º5.01'E
39º21.38'N
Alonisos island,
Aegean Sea Natural park
S15 26º33.32'E
39º0.11'N
Lesvos island,
Aegean Sea
Tourist area, absence of known pollution
sources
S16 28º13.54'E
36º27.47'N
Rhodos island,
Aegean Sea
Tourist area, absence of known pollution
sources
S18 24º6.11' E
34º48.24'N
Gaydos island,
Aegean Sea
Absence of known pollution sources
23
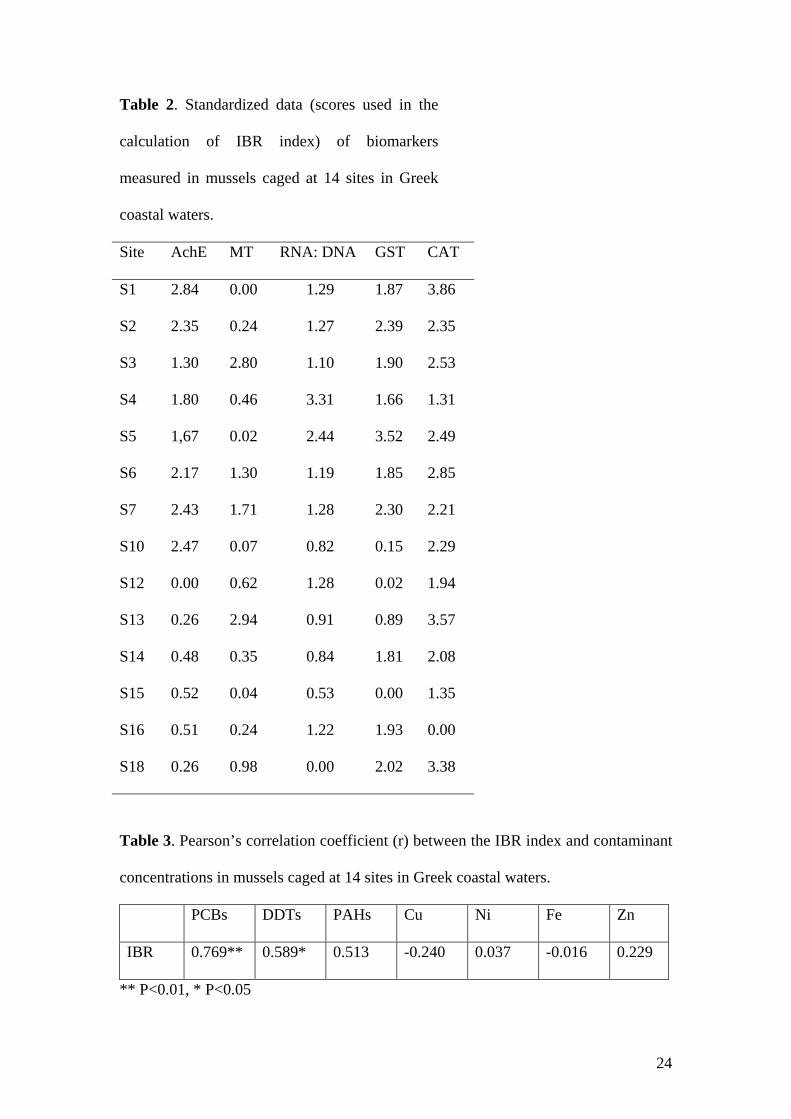
Table 2. Standardized data (scores used in the
calculation of IBR index) of biomarkers
measured in mussels caged at 14 sites in Greek
coastal waters.
Site AchE MT RNA: DNA GST CAT
S1 2.84 0.00 1.29 1.87 3.86
S2 2.35 0.24 1.27 2.39 2.35
S3 1.30 2.80 1.10 1.90 2.53
S4 1.80 0.46 3.31 1.66 1.31
S5 1,67 0.02 2.44 3.52 2.49
S6 2.17 1.30 1.19 1.85 2.85
S7 2.43 1.71 1.28 2.30 2.21
S10 2.47 0.07 0.82 0.15 2.29
S12 0.00 0.62 1.28 0.02 1.94
S13 0.26 2.94 0.91 0.89 3.57
S14 0.48 0.35 0.84 1.81 2.08
S15 0.52 0.04 0.53 0.00 1.35
S16 0.51 0.24 1.22 1.93 0.00
S18 0.26 0.98 0.00 2.02 3.38
Table 3. Pearson’s correlation coefficient (r) between the IBR index and contaminant
concentrations in mussels caged at 14 sites in Greek coastal waters.
PCBs DDTs PAHs Cu Ni Fe Zn
IBR 0.769** 0.589* 0.513 -0.240 0.037 -0.016 0.229
** P<0.01, * P<0.05
24
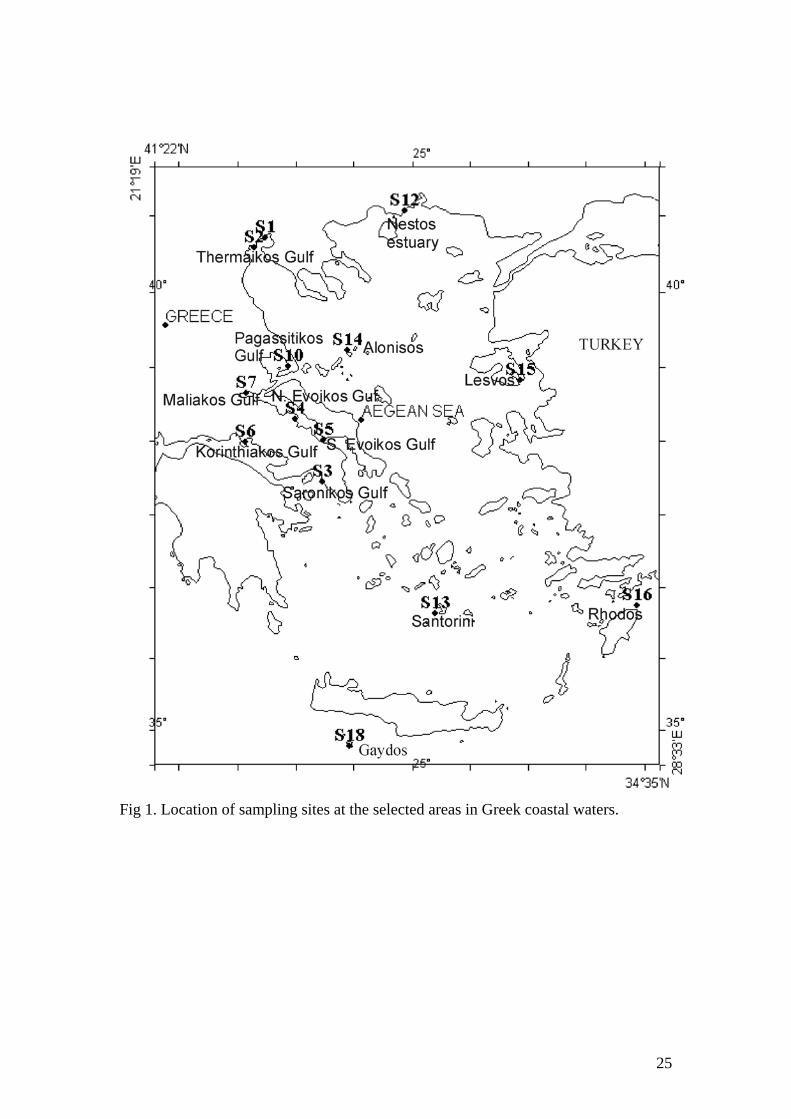
ig 1. Location of sampling sites at the selected areas in Greek coastal waters. F
25
Cu
0
1
2
3
4
5
6
S1 S2 S3 S4 S5 S6 S7 S10 S12 S13 S14 S15 S16 S18
µg/g
dry
wei
ght
IBR
0
2
4
6
8
10
12
S1 S2 S3 S4 S5 S6 S7 S10 S12 S13 S14 S15 S16 S18
IBR
PCBs
02468
10121416
S1 S2 S3 S4 S5 S6 S7 S10 S12 S13 S14 S15 S16 S18
ng/g
dry
wei
ght
Ni
012345678
S1 S2 S3 S4 S5 S6 S7 S10 S12 S13 S14 S15 S16 S18
µg/g
dry
wei
ght
DDTs
0
2
4
6
8
10
12
S1 S2 S3 S4 S5 S6 S7 S10 S12 S13 S14 S15 S16 S18
ng/g
dry
wei
ght
Fe
0
20
40
60
80
100
120
S1 S2 S3 S4 S5 S6 S7 S10 S12 S13 S14 S15 S16 S18
µg/g
dry
wei
ght
PAHs
01020304050607080
S1 S2 S3 S4 S5 S6 S7 S10 S12 S13 S14 S15 S16 S18
ng/g
dry
wei
ght
Zn
0
40
80
120
160
200
S1 S2 S3 S4 S5 S6 S7 S10 S12 S13 S14 S15 S16 S18
µg/g
dry
wei
ght
Fig 2. IBR index, and concentrations of PCBs, DDTs, PAHs, Cu, Ni , Fe and Zn in
mussels caged at 14 sites in Greek coastal waters.
26

a b
Fig 3. Results of the PCA of the two dominant components produced by contaminant
concentrations (PCBs, DDTs, PAHs, Cu, Ni, Zn, and Fe) in mussels caged at 14 sites
in Greek coastal waters. (a) Plot of variable vectors. (b) Plot of scores of different
sites marked by the respective IBR values at each site.
27