1
A Multi-Dimensional Assessment of Ecosystems and Ecosystem Services in Barshong, Bhutan
ICIMOD Working Paper 2017/6
Support to Rural Livelihoods and Climate Change Adaptation in the Himalayas (Himalica)
2
About ICIMOD
The International Centre for Integrated Mountain Development (ICIMOD), is a regional knowledge
development and learning centre serving the eight regional member countries of the Hindu Kush
Himalaya – Afghanistan, Bangladesh, Bhutan, China, India, Myanmar, Nepal, and Pakistan – and
based in Kathmandu, Nepal. Globalisation and climate change have an increasing influence on
the stability of fragile mountain ecosystems and the livelihoods of mountain people. ICIMOD aims
to assist mountain people to understand these changes, adapt to them, and make the most of new
opportunities, while addressing upstream-downstream issues. We support regional transboundary
programmes through partnership with regional partner institutions, facilitate the exchange of
experience, and serve as a regional knowledge hub. We strengthen networking among regional
and global centres of excellence. Overall, we are working to develop an economically and
environmentally sound mountain ecosystem to improve the living standards of mountain populations
and to sustain vital ecosystem services for the billions of people living downstream – now, and for
the future.
About RSPN
Royal Society for Protection of Nature (RSPN) was founded as a citizen based non-profit, non-
governmental environment organization in 1987 to support environment conservation in Bhutan.
The Society was registered under the Companies Act of Bhutan until last quarter of 2009 without
proper authority which regulated the non-profit organization, with a special clause on non-profit
entity. With the establishment of Civil Society Organization Authority (CSOA) of Bhutan, the
Society is now registered under Civil Society Organization Authority as one of the Public Benefit
Organizations (PBO). RSPN’s mission is to inspire personal responsibility and active involvement
of people of Bhutan in conservation of Kingdom’s environment though education, research and
sustainable livelihoods opportunities.
ICIMOD gratefully acknowledges the support of its core donors: the Governments of Afghanistan,
Australia, Austria, Bangladesh, Bhutan, China, India, Myanmar, Nepal, Norway, Pakistan,
Switzerland, and the United Kingdom.
Contact person: Nakul Chettri, [email protected]

i
A Multi-Dimensional Assessment of Ecosystems and Ecosystem Services in Barshong, Bhutan
International Centre for Integrated Mountain Development (ICIMOD), Kathmandu, Nepal and
Royal Society for Protection of Nature (RSPN), Thimphu, Bhutan
March 2017
ICIMOD Working Paper 2017/6

ii
Copyright © 2017International Centre for Integrated Mountain Development (ICIMOD)All rights reserved, published 2017
Published byInternational Centre for Integrated Mountain DevelopmentGPO Box 3226, Kathmandu, Nepal
ISBN 978 92 9115 477 7 (printed) 978 92 9115 478 4 (electronic)
Production TeamSusan Shellars-Shrestha (Consultant editor) Christopher Butler (Editor)Dharma R Maharjan (Layout and design)Asha Kaji Thaku (Editorial assistant)
Photos: Cover - Elisabeth Kerkhoff; pp2, 3, 7 - Nakul Chettri; p6 - Kamal Aryal; pp8, 24 - Pratikshya Kandel
Printed and bound in Nepal byHill Side Press (P) Ltd., Kathmandu, Nepal
ReproductionThis publication may be reproduced in whole or in part and in any form for educational or non-profit purposes without special permission from the copyright holder, provided acknowledgement of the source is made. ICIMOD would appreciate receiving a copy of any publication that uses this publication as a source. No use of this publication may be made for resale or for any other commercial purpose whatsoever without prior permission in writing from ICIMOD.
The views and interpretations in this publication are those of the author(s). They are not attributable to ICIMOD and do not imply the expression of any opinion concerning the legal status of any country, territory, city or area of its authorities, or concerning the delimitation of its frontiers or boundaries, or the endorsement of any product.
NoteThis publication is available in electronic form at www.icimod.org/himaldoc
Citation: ICIMOD and RSPN (2017) A multi-dimensional assessment of ecosystems and ecosystem services in Barshong, Bhutan. ICIMOD Working Paper 2017/6. Kathmandu: ICIMOD

iii
Contents
Contributors vAcknowledgements viAcronyms and Abbreviations viiExecutive Summary viii
Introduction 1 The Importance of Mountains 1 Bhutan 1
Research Framework and Methodology 4 Research Framework 4 Study Area 5 Methodology 6
Research Results 9 Socioeconomic Profile 9 State of the Ecosystems 11 Ecosystem Services Assessment 15 Regulating Services 17 Supporting Service 17 Cultural Service 18 Livelihood Vulnerability Assessment 22
Conclusion and Recommendations 25
References 26
Annex 1: Household Survey Questionnaire 28

iv
ContributorsOverall research design
Nakul Chettri, Kamal Aryal, Kabir Uddin, Pratikshya Kandel, Seema Karki, and Bikash Sharma (ICIMOD)
Compilation
Pratikshya Kandel, Dago Tshering, Kamal Aryal, Kabir Uddin, Seema Karki, Tshering Lham and Nakul Chettri
Ecosystem assessment
Dago Tshering and Tshering Lham (RSPN) Kamal Aryal, Pratikshya Kandel, Kabir Uddin, Bikash Sharma and Nakul Chettri (ICIMOD)
Livelihood assessment
Dago Tshering and Tshering Lham (RSPN) Kamal Aryal, Pratikshya Kandel and Bikash Sharma (ICIMOD)
Geospatial analysis
Dago Tshering (RSPN) Kabir Uddin and Nakul Chettri (ICIMOD)

v
AcknowledgementsWe would like to express our gratitude to Dr David Molden, Director General of ICIMOD, for his inspiration and for providing the required facilities for this research. We are thankful to Dasho Tenzin Dhendup, Secretary of the Ministry of Agriculture and Forest, Royal Government of Bhutan, for his support. We are also thankful to the Policy and Planning Division, Ministry of Agriculture and Forests, Royal Government of Bhutan for their input. We express our sincere gratitude to the Dzongkhag Administration of Tsirang and the officials of Barshong Gewog for their support and tireless commitment in carrying out this assessment, both in terms of data and human resources.
This research was made possible by the untiring efforts of the team from ICIMOD and RSPN (named in the contributors section). In addition, we acknowledge the financial support provided by the European Union through the Himalica programme to carry out this study.
Warm thanks goes to Susan Sellars-Shrestha (consultant editor), Christopher Butler (ICIMOD) and Philippus Wester (ICIMOD) for bringing the manuscript into its present form. Thanks also goes to Dharma R Maharjan for his hard work in laying out the manuscript and to Asha Kaji Thaku for his editorial assistance.

vi
Acronyms and AbbreviationsBTN Bhutanese ngultrum
GIS geographic information system
HH household
Himalica Support to Rural Livelihoods and Climate Change Adaptation in the Himalaya
HKH Hindu Kush Himalayas/Himalayan
ICIMOD International Centre for Integrated Mountain Development
masl Mean average sea level
NDVI Normalized Difference Vegetation Index
NSB National Statistics Bureau
PES payment for ecosystem services
PRA participatory rural appraisal
RGoB Royal Government of Bhutan
RS remote sensing
RSPN Royal Society for Protection of Nature
SPSS Statistical Package for Social Sciences
USD United States dollar
WTP willingness to pay
Conversion factors:
Area conversion: 1 ha = 2.471 acreCurrency conversion: 1 USD = 68.60 BTN

vii
Executive SummaryOccupying nearly 24% of the world’s land surface, mountains are home to 12% of the global population and provide a wide range of goods and services to one-fifth of humanity. The goods and services provided include water, hydroelectricity, timber, medicine, a wide variety of bio-resources, and opportunities for recreation and spiritual renewal. The Hindu Kush Himalaya (HKH) is one of the largest and most assorted mountain settings in the world, covering 4.3 million square kilometers, stretching from Afghanistan in the west to Myanmar in the east. The region is well known for its geohydrological, biological, cultural, and aesthetic value. The services provided by mountains contribute enormously to the region’s economic growth and are key to sustaining the livelihoods of the more than 200 million people living in the mountains and the approximately 1.3 billion people in the downstream river basins, as well as benefiting the global community.
Nestled within the HKH, Bhutan’s geographical diversity, combined with its equally diverse climatic conditions, make it a rich repository of biological diversity and ecosystems. Its various forests types and freshwater ecosystems are estimated to be the biggest contributor of ecosystem goods and services in Bhutan, contributing to the wellbeing of the Bhutanese people. More than 69% of the population are subsistence farmers who are dependent on forests, water bodies, and croplands for agriculture and livestock. At the macroeconomic level, Bhutan’s development agenda relies heavily on hydropower and tourism, which are, in turn, highly dependent on natural resources and ecosystem services. An ecosystem valuation carried out by Kubiszewski et al. (2013) estimated that a total of USD 4,944 million worth of benefits are derived from the ecosystem services provided by forests, rangelands, wetlands, and the inland waters of Bhutan.
However, Bhutan’s mountain ecosystem, like the rest of the Himalayan region, is fragile due to its topographic, biological, and physical features. Its dynamics and stability are influenced by its development status as an emergent economy, as well as other anthropogenic factors, including climate change. Hence, the development of policies and strategies to address the complexities of ecosystem management and enhance its services for human wellbeing is imperative.
In this context, with support from the European Union, under the aegis of the Support to Rural Livelihoods and Climate Change Adaptation in the Himalayas (Himalica) initiative, the Royal Society for Protection of Nature (RSPN), with financial and technical support from the International Centre for Integrated Mountain Development (ICIMOD), carried out this study to develop a comprehensive understanding of the state and dynamics of ecosystems and their services in Barshong Gewog in Tsirang, Bhutan and their nexus with human wellbeing.
This report draws on both primary and secondary information. A participatory rural appraisal (PRA) and household questionnaire survey were carried out to assess the state and dynamics of ecosystems in Barshong Gewog and their capacity to provide goods and services, as well as community vulnerability to various drivers of change and their coping strategies in response to perceived changes. In addition, the geospatial analysis was used to map the land use and land cover change in relation to the spatial and temporal changes in ecosystems and ecosystem services in the study area.
Findings Barshong is one of the eight gewogs (sub-districts) in Tsirang Dzongkhag (district), which is located in the south-central part of Bhutan between 250–1,600 meters above sea level (masl). It has a total area of 2,156.9 hectares. The gewog has five administrative chiwogs (villages): Barshong Toed, Barshong Moed, Chhunythang, Gangtokha, and Toisang. Most of the land is under forest cover, which is comprised mainly of broadleaf and chir pine species, combined with agricultural land.
Socioeconomic profileThe local livelihood in Barshong is based on a combination of farming, livestock rearing, and a small amount of wage labor. Nearly 80% of the respondents are farmers by occupation with around 20% engaged as wage laborers,

viii
salaried employees and small traders. Farming households grow a diverse range of cash and food crops. Farmers also earn significant income from cattle, goats, pigs, and poultry. Over 35% of households earn an annual income of less than Bhutanese Ngultrum (BTN) 20,000 (USD 292), while 8% earn more than BTN 100,000 (USD 1,458) per year. At least 28.2% of households earn between BTN 21,000 (USD 306) and 49,000 (USD 714), while the remaining 28.2% earn between BTN 50,000 (USD 729) and 99,000 (USD 1,443) annually.
State of ecosystem and dependenciesForest, freshwater, and agroecosystems contribute substantially to the local economy. Around 90% of households depend on forest ecosystems, 88% depend on agricultural ecosystems, and almost 100% are highly dependent on freshwater ecosystems for their livelihoods. Collectively, these ecosystems provide a wide range of goods and services, including 22 provisioning services, 14 regulating services, 4 supporting services, and 6 cultural services.
Over 49% of the total population reported an increase in forest cover mainly due to community forestry, followed by rural-urban migration. Interestingly, 36.8% perceived a decrease in forest cover. In terms of the agroecosystem, over 40% perceived no change, while 38.5% perceived a decline over the last decade, attributing this to less rainfall, lack of irrigation, soil erosion, lack of labor, and poor soil conditions. In terms of the freshwater ecosystem, the majority of respondents (71%) perceived it to have decreased as a result of the drying up of freshwater sources and climate change.
With regard to land use and land cover change, agricultural land, fallow land, forest, bare area, and water bodies are Barshong’s main land-cover types. Forests cover over 85% of the total area, followed by cultivated land (10.5%). Between 1989 and 2014, Barshong underwent minor changes with a 1.5% increase in forest cover and 0.9% decrease in cultivated land, with insignificant changes in other land cover categories. On the gewog boundary bordering the Punatshangchhu river basin, a considerable change in the river course and coverage has been observed.
Vulnerability In terms of vulnerability, on average, 21.2% of households in Barshong reported experiencing more than two types of crises, while 35% of the household did not report any crisis in the last 12 months. The months of May, June, and July are the most difficult for communities in terms of providing food. Related to this, and perhaps a cause of food shortages, 29.3% of households also faced issues with poor production, mainly caused by lack of rainfall or lack of access to water. Other reasons cited for poor production were human-wildlife conflict and one report of a pest/disease attack on oranges, which is considered a major source of income. Other reported crises included market fluctuations, illnesses in the family, and loss of livestock, but these were cited as minor problems.
Perceived changes in socioeconomic sectorsAll aspects of social and economic sectors seemed to have improved in the last decade, as reported by respondents. Medical facilities have improved (61.5%), water quality has improved (85.1%), there is better access to the forest (74%), food security has improved (83.3%), irrigation has improved (67.2%), and soil fertility has increased (47.7%). However, 41.2% of households reported a decline in soil fertility due to loss of topsoil and lack of access to water.
Willingness to payAround 87% of households expressed willingness to pay for the management of ecosystems. More than 50% were willing to pay at least USD 1.7 per year, over 20% were willing to pay USD 5, and less than 5% were willing to pay more than USD 50.
Conclusion and suggestive actionsBarsong is an agrarian village with majority depended on agriculture practices for subsistence livelihood. The ecosystem health is still maintained and through the dependency of people on surrounding resources are high. Food security and water resources management is highlighted to be focussed and the actions were suggested to look for alternative livihood options including, tourism, cottage industries and market for ecosystem services payment.

1
Introduction
The Importance of Mountains Mountains occupy nearly 24% of the world’s land surface and are home to 12% of the global population (Sharma et al., 2010). An estimated one-fifth of the human population derive a vast array of ecosystem goods and services directly from mountains to support their lives and livelihoods (Schild, 2008). These services include water, hydroelectricity, timber, medicine, and a wide variety of bioresources, as well as opportunities for recreation and spiritual renewal. Mountains are socioeconomically, ecologically, and aesthetically significant, not only to the people residing in them, but also to the people living in the lowlands. They are repositories of biodiversity and home to diverse ethnic communities with rich cultural practices, farming systems, and traditional knowledge. At the same time, mountains are among the most fragile ecosystems in the world and are threatened with numerous drivers of change, including climate change, invasive alien species, globalization, urbanization, and other anthropogenic pressures (ICIMOD, 2009).
The Hindu Kush Himalayan (HKH) region is one of the largest and most varied mountain settings in the world, covering 4.3 million square kilometers, extending from Afghanistan in the west to Myanmar in the east. The region is inhabited by more than 200 million people from a multitude of ethnic and socio-cultural groups. The region is well known for its geohydrological, biological, cultural, and aesthetic value. Located at the convergence of three global biodiversity hotspots (Himalayan, Indo-Burman, and mountains of Southwest China), the region has a rich variety of gene pools and species (Chettri et al., 2008). As the source of ten large Asian rivers, the HKH mountains are known as the ‘Water Towers of Asia’. These mountains provide numerous ecosystem goods and services, with freshwater being one of the most critical (Schild, 2008). These goods and services contribute enormously to the region’s economic growth and are key to sustaining the livelihoods and industries that support more than 200 million people in the mountains and approximately 1.3 billion people in the downstream river basins, as well as benefiting the global community (Eriksson et al., 2009).
However, over the past decades, the HKH region has undergone an unprecedented change in terms of the patterns of resource use and development, resulting from the burgeoning human population and unsustainable levels of consumption. These, coupled with a changing climate, pose serious threats to the sustainability of vital ecosystems, especially at higher altitudes, which are ecologically fragile and extremely sensitive. Until now, except for a few experimental studies (e.g., Maharana et al., 2000a; 2000b; Baral et al., 2007; Badola et al., 2010; Chen & Jim 2010), no serious efforts have been made to enhance our scientific understanding of the significance of ecosystem services and their value in the HKH region (Rasul et al., 2011). Substantial gaps exist in our knowledge of geographical areas and ecosystem types, the status and dynamics of many ecosystem services, and options for their assessment, valuation, and management (Pant et al., 2012). Thus, there is an increasing need to enhance our holistic landscape-level understanding of the state, dynamics, and value of ecosystems in the HKH region and develop sound methodologies for monitoring, restoring, and valuing them in order to ensure that their value is realized and that appropriate conservation interventions are implemented to effectively manage and conserve ecosystem functioning.
BhutanBhutan is a small, landlocked country covering an area of 38,394 square kilometers in the eastern part of the Himalayan range between latitudes 26° 40’ and 28° 20’ north and longitudes 88° 45’ and 92° 7’ east. It is surrounded by the Tibetan Plateau in the north, the Bengal and Assam plains in the south, Arunachal Pradesh in the east, and the Darjeeling and the Sikkim Himalayas in the west. The country is almost entirely mountainous with elevations ranging from 150 masl in the south up to 8,000 masl in the north. Bhutan’s geographical diversity, combined with its equally diverse climate conditions, make it a rich repository of biological diversity and ecosystems.

2
Bhutan has four main ecosystems: forest, alpine, aquatic, and agricultural (NBC, 2015). Forest is the dominant ecosystem, covering over 70.46% of the total area, including various categories of protected area. Protected areas cover 51% of Bhutan’s geographic area (LCMP, 2010). There are three distinct eco-floristic zones with different forest types: the subtropical zone (150–2,000 masl), with mix forest vegetation; the temperate zone (2,000–4,000 masl), which is dominated by conifer and broadleaf forests; and the alpine zone (over 4,000 masl), with meadows and scrub. Bhutan’s aquatic ecosystem consists mainly of rivers, lakes, marshlands, and hot springs. Only 2.93% of the total land area in Bhutan is cultivated agricultural land (LCMP, 2010). There are six major agroecological zones, corresponding with altitude range and climatic conditions: alpine (3,600–4,600msl), cool temperate (2,600–3,600 m), warm temperate (1,800–2,600 m), dry sub-tropical (1,200–1,800 m), humid sub-tropical (600–1,200m), and wet sub-tropical (150–600 m). Bhutan’s 677 glaciers and glacial lakes form part of the Himalayan glacial ecosystem.
The Bhutanese rely heavily on natural resources and ecosystem services for their sustenance (Kubiszewski et al., 2013; ICIMOD & RSPN 2014). Numerous ecosystem goods and services generated by various ecosystems (forests, agriculture, grassland, and freshwater) contribute to the wellbeing of the Bhutanese people, with forests as the leading contributor (Kubiszewski et al., 2013; ICIMOD & RSPN, 2014). Forests provide a myriad of services, including fuelwood, fodder, timber, food, fiber, shelter, medicines, household implements, and handicrafts, to name a few. As an agrarian community, around 69% of its rural population depend directly or indirectly on these ecosystems for agriculture and livestock (MoAF, 2011). In addition, the various ecosystems regulate soil and floods and protect the fragile topographic characteristics in rural and urban settlements. At the macroeconomic level, Bhutan’s development agenda, under the aegis of Gross National Happiness, envisions a green and self-reliant economy with a strategic focus on major sectors, such as hydropower and tourism, which are highly dependent on natural resources and ecosystem services (Norbu, 2012).
The image of 'Four Harmonious Friends' is a popular theme in traditional and contemporary arts seen throughout Bhutan.

3
An ecosystem valuation carried out by Kubiszewski et al., (2013) estimated the total value of ecosystem services (provisioning, regulating, and cultural services) provided by Bhutan’s various ecosystems, including forests, rangelands, wetlands, and inland waters, at USD 4,944 million. Similarly, a recent study estimated that an average household in the Phobjikha valley derives USD 2,610 worth of annual economic benefits from ecosystem provisioning services, with 84% of the total value coming from potato farming (ICIMOD & RSPN, 2014). It is also worth noting that 53% of the ecosystem services created within Bhutan benefit people outside its political boundaries.
However, Bhutan’s ecosystems, like the rest of the Himalayas, are fragile due to its topographic, biological, and physical features. Furthermore, its dynamics and stability are influenced by its development status as an emergent economy, as well as other anthropogenic factors, including climate change. The country is facing numerous direct pressures such as: habitat loss and fragmentation, forest fires, poaching, the illegal wildlife trade, human-wildlife conflicts, overgrazing, the unsustainable utilization of resources, unsustainable agricultural practices, invasive species, and pollution. Indirect pressures include: climate change, the rapidly growing population, and poverty (Zurick, 2006; NBSAP, 2014).
There is an urgent need to comprehend the complexities of Bhutan’s ecosystems and the bio-socioeconomics of their management so that appropriate policies and strategies can be developed to address emerging threats to Bhutan’s ecosystems and enhance their services to benefit nature and humans alike. In this context, with support from the European Union, under the aegis of the Support to Rural Livelihoods and Climate Change Adaptation in the Himalayas (Himalica) initiative, the International Centre for Integrated Mountain Development (ICIMOD) and the Royal Society for Protection of Nature (RSPN) carried out this study to develop a comprehensive understanding of the state and dynamics of the ecosystems and their services in Barshong Gewog in Tsirang, Bhutan and their nexus with human wellbeing.
Based on local-level primary data, this report presents an integrated overview of the state and dynamics of ecological, socioeconomic, and livelihood features of the Barshong Gewog. It also outlines community vulnerability to various drivers of change and identifies coping strategies adopted by communities in the gewog in response to perceived changes. The report discusses the prospects of managing the ecosystem to enhance ecosystem services, address community vulnerability, and improve socioeconomic development. Finally, it concludes with recommendations for increasing the ecological and socioeconomic resilience of Barshong and its people.
Vegetable fern is one of the provisioning ecosystem services provided by Barshong Gewog

4
Management of Socioecological System
Management of socioecological system
Human wellbeing
Biophysical structure or process• Major ecosystems• Dominant vegetation• Phytodiversity• Biodiversity• State of key species
Functions*
• Nutrient flow• Water flow• Productivity• Pollination• Habitat
Value• Social• Ecological• Economic• Tradeoff
options (e.g., REDD+, PES
Benefits• Economic
development• Health• Recreational• Environmental
ProvisioningSupporting
Regulating
Culture
Knowledge enhancement, capacity development policy briefs and mainstreaming mechanisms
Figure 1: Research framework developed for the assessment of ecosystem services linked to impact pathways
Research Framework and Methodology
Research FrameworkThe ‘Ecosystem Services Cascade’ framework of DeGroot et al., (2010) and Müller et al., (2010) was modified to design a research framework to assess the ecosystem services in the study area (Figure 1). This research framework enables the importance and significance of ecosystem services to human wellbeing to be rationalized. It compartmentalizes the elements necessary for the systematic assessment of ecosystem services, but allows for the adjustment of these elements based on the need and requirements of the study area. It allows the elements of each of the compartments (i.e., ecosystems and biodiversity, ecosystem services and human wellbeing) to be prioritized and then each element to be considered with the logical linkages needed to develop an association between the ecosystem services and human wellbeing. The framework also enables us to understand the state of the ecosystem services and the dynamics of such services in a given study area and to link them with people’s dependence to inform decision-making processes. The present study also focuses on the information and knowledge flow back as part of the impact pathway, which conventional ecosystem assessment practices do not consider as a cyclic or virtual process.
Two types of indicators were considered vital in the research design for ecosystem services: ‘state indicators’, which describe what ecosystem structures, processes, and functions are providing the services and how much (e.g., people’s dependency), and ‘performance indicators’, which describe how much of the service can potentially be
Source: Modified from DeGroot et al., 2010 and Müller et al., 2010

5
used in a sustainable way (e.g., resources availability). When this knowledge of ecosystem services is linked with human wellbeing, the importance (or ‘value’) of the ecosystem and its services can be considered under three value domains: ecological, socio-cultural, and economic. The ecological value encompasses the health of a system (and not necessarily in economic terms), measured using ecological indicators such as diversity and integrity (as well as trends and projections if applicable). The socio-cultural value includes the importance of the services provided to the people in terms of their culture and traditions; in other words, the cultural identity and practices related to the use of ecosystem services (Raymond et al., 2009). Apart from these, contemporary tools such as remote sensing (RS) and geographic information systems (GIS) were also used to understand the state and dynamics of ecosystem services in the study area.
To address the indicators for ecosystem structures, processes, and functions (and well as quantity), a number of set questions were adopted from the global framework (DeGroot et al. 2010) and developed to meet the requirements of this study (see Box 1).
Study areaBarshong Gewog is one of eight gewogs (sub-districts) in Tsirang Dzongkhag (district), which is located in the south-central part of Bhutan (Figure 2). Located between 250 masl and 1,600 masl, it has a total area of 2,156.9 hectares. The gewog has five administrative chiwogs (villages): Barshong Toed, Barshong Moed, Chhunythang, Gangtokha, and Toisang. Most of the land is under forest cover, which is comprised mainly of broadleaf and chir pine species, combined with agricultural land. The gewog has basic rural facilities including an agricultural extension centre, a livestock extension centre, a forest range office, a basic health unit with an outreach clinic, community information centres, and a primary school. It is connected to the rest of the dzongkhag by 11 kilometers of farm road. Most of the chiwogs in Barshong are covered by the national electricity grid.
Box 1: Research questions to better integrate ecosystem services into ecosystem/landscape planning, management, and decision-making
Understanding the states of ecosystems and their goods and services
• What are the main ecosystems found in the study area and what is their status?
• What are the main ecosystem services provided by these ecosystems?
• What is the state of ecosystem services in the given study area?
• How can these ecosystems and the services provided by them be spatially mapped and show changes?
• What is the effect of (changes in) the dynamic conditions (temporal and spatial) of ecosystem change on services?
Valuing ecosystem services
• What are the most important ecosystem services contributing to the economic wellbeing of the communities?
• Are there any species or ecosystems that are socio-culturally valuable?
• What are the ecologically significant species or ecosystems?
Figure 2: Location of study area showing Barshong Gewog

6
MethodologyThe research methodology involved both primary and secondary information. A sampling frame for the ecosystem services assessment covered all 174 households in Barshong. Although according to official records, there are 249 households in the gewog, only 174 have people currently residing in them.
Data collection was done using participatory rural appraisal (PRA) and a household questionnaire survey. The RSPN, in collaboration with ICIMOD, carried out the PRA in Barshong to identify major ecosystems and their uses according to communities. Numerous PRA tools (such as resource mapping, pair-wise ranking, Venn diagram, etc.) were used to gather qualitative data. This was followed by a household questionnaire survey to assess in detail the state and dynamics of ecosystems and their capacity to provide goods and services to local communities. A multi-structured questionnaire was prepared for the ecosystem services assessment by the ICIMOD team using sets and sub-sets of indicators and values. Survey data was compiled into a Statistical Package for Social Sciences (SPSS) database, cross-checked, and cleaned. The analysis was carried out using basic description statistics, cross-tabulation, the comparison of means, and correlation techniques.
The geospatial analysis was used to map the land use and land cover changes in relation to the spatial and temporal changes in ecosystems and ecosystem services. It included both GIS and RS. The details of methodologies for each action research are described below.
Ecosystems and ecosystem services assessment The study focused on three main ecosystems identified by the communities during the PRA, namely: forest, freshwater and agroecosystems. The Millennium Ecosystem Assessment (MEA, 2005) framework was used to categorize the ecosystem services derived from these ecosystems as: provisioning services (which provide direct inputs to livelihoods and the economy), regulating services (which provide flood and disease control), supporting services (which sustain and fulfil human life), and cultural services (which support recreation and spiritual or historical sites).
For the ecosystem services assessment, based on the literature review and PRA, an exhaustive list of ecosystem goods and services from Barshong Gewog was prepared and categorized into provisioning, regulating, supporting, and cultural services. Ecosystem goods and services were then ranked as high, medium, or low, based on the community’s perceptions of their importance and dependence. High-ranking goods and services were those considered widely used and essential to local subsistence. Medium-ranking goods and services were considered preferred, but could be done without if unavailable. Low-ranking goods and services were those considered optional. Socially, ecologically, and culturally-important species of plants and animals were also identified and their perceived significance ranked in a similar manner.
The ecosystem goods and services that were considered for this study included: provisioning services (such as fuelwood, fodder, forage, timber/poles, leaf litter, medicinal plants, ornamental plants, wild edible fruits and vegetables, mushrooms, fibre, thatch, bush meat, dyes, paddy, cereals, vegetables, fish, drinking water, bathing water, irrigation water, boulders, and sand), regulating services (such as carbon sequestration, climate regulation, flood control, groundwater recharge, nutrient enrichment, pest regulation, pollination, seed dispersal, soil fertility,
soil formation, soil stability, waste treatment, water purification, and retention), supporting services (such as ecosystem resilience, habitat for species, the hydrologic cycle, and soil formation), and cultural services (such as aesthetic beauty, ecotourism, education and research, recreation, nature worships, and spiritual enrichment).
Group discussion with the community people

7
Geospatial analysisFor the land use and land cover change analysis, efforts were made to map the study area using three different time series images from 1989, 2003, and 2014. The idea was to detect the change in, and status of, land use cover and the changes that have taken place, particularly in forested and agricultural land, over the period using both GIS and RS data. Subsequently, an attempt was made to project the use of the identified ecosystem services in the area over the same period.
Medium spatial resolution satellite images from Landsat were used from 1989, 2003, and 2014 and further rectified using Google eye images from 2014 to generate the land cover maps (Table 1). The land use categorization was defined using the standard land cover protocol. The land cover information derived consisted of pre-processing and classification using object-based algorithms.
In this study, Landsat 30 m spatial resolution (185 x 185 km swath) ortho-rectified and cloud free thematic mapper (TM), enhanced thematic mapper plus (ETM+), and Landsat 8 images were used for land cover mapping and change detection between 1989, 2003 and 2014. All images were downloaded from the United States Geological Survey (USGS) archived data portal. The whole study area lies within thirteen fully or partially covered Landsat images (each scene 185 x 185 km). The shuttle radar topography mission (SRTM) one arc second (30 m) digital elevation model (DEM) with add on products such as slope and aspect, was used for the topographic information as well as identification and mapping difference in land cover classes. Base layers with district, physiographic and settlement points in geographic information system (GIS) format were used both as baseline information for the maps and land cover extraction and analysis.
Land cover maps for 1989, 2003 and 2014 were prepared from analysis of the Landsat TM, ETM+, and Landsat 8 images using geographic object-based image analysis (GEOBIA). The detailed methodology used to prepare the land cover maps is described in Uddin et al. (2015). Briefly, eCognition Developer software was used to divide the image into segments. A multi-resolution segmentation algorithm was applied in which homogeneous areas resulted in larger objects and heterogeneous areas in smaller ones. Information on the spectral values of image layers, vegetation indices Normalized Difference Vegetation Index (NDVI), and a land water mask was used in the analysis. Six land cover classes were mapped for the comparison and further analysis on ecosystem service.
Following Chaudhary et al. (2016) in ArcGIS environment, the land cover was analysed and interconnected based on the sum scores for provisioning, regulating, supporting, and cultural services. Values were obtained from the SPSS data generated after the completion of the household survey, in which the respondents shared their routine resource dependency on, and usage of, the various services drawn from the different ecosystems.
Willingness to pay and livelihood vulnerability assessment The study also examined willingness to pay (WTP) for the management of key ecosystem functions and services provided by Barshong Gewog. During the survey, communities in the Gewog were given monetary and non-monetary (labour) options to express their WTP. During analysis, the non-monetary values were converted into monetary terms using the national daily wage rate.
Table 1: Data source
Satellite Sensor Row Path Year
1 Landsat Landsat 8 138 41 20142 TM 2003
3 TM 1989
Interaction with Gup (Headman of gewog council)

8
Regarding livelihood vulnerability, information was collected on inaccessibility, fragility, marginality, biological niches, and human adaptation mechanisms. The focus was on thematic areas such as food security, water security, long-term changes to basic facilities for health, education, communication, and electricity, accessibility to ecosystem goods and services, crises/shocks, and the community’s coping strategies to overcome these crises.
Local people preparing the community resource map.

9
Research Results
Socioeconomic Profile
Population characteristics In 2014, Barshong had a population of 3,240 (RSPN, 2015). However, the survey conducted for this study excluded any family members who had lived away from the gewog for more than six months, as the objective of the study was related to resource dependency in the gewog.
The population pyramid for Barshong Gewog is depicted in Figure 3. The population of Barshong is comprised of 62% men and 38% women. The mean size of a household is 3.8 members. Half (51%) of the population is under 51 years of age and the dependency ratio is 46.1 persons (aged 0–14 years and above 65) per 100 working-aged persons (15–64 years). The population density is estimated at 33 people per square kilometer (Table 2).
Around 66.7 % of the total population of Barshong are illiterate, while 33% have completed some level of primary, secondary, or non-formal education. Only one person has a higher education degree. It is also worth noting that there are more illiterate women than men (147 adult women, compared to 116 adult men).
More than 80% of the population in Barshong are Lhotsampas, Sharshops, Trongsaps, Khengpas and Ngalongs make up less than 20%. Nearly 80% of the respondents are farmers by occupation with around 20% engaged as wage laborers (5.9%), salaried employees (2.4%), or in other occupations such as small businesses (0.6%).
LandholdingThree categories of landholding were recorded according to usage: wetland/irrigated land, dryland, and orchard. Information on the area of agricultural land use owned for each landholding category is summarized in Table 3. It was observed that each household owns at least one or more type of agricultural land. The mean average size of
Under 55 - 9
*10 -1415 - 2920 - 2425 - 2930 - 3435 - 3940 - 4445 - 4950 - 5455- 5960 - 6465 - 69
70+
Percentage
Year
s
FemalesMales
40 4030 3020 2010 100
Figure 3: Population pyramid for Barshong Gewog

10
dryland owned per household is 1.2 hectares, the wetland is 0.5 hectares and orchard is 0.2 hectares.
Livelihood strategies Local livelihoods in Barshong are based on a combination of farming, livestock rearing, and small amounts of wage labor. The main sources of income for Tsirang Dzongkhag are citrus, poultry, livestock, and, more recently, organic farming (NSB, 2013). Dependency on the primary sector is high, with over 80% of households exclusively dependent on income from this sector. The contribution of secondary and tertiary sectors to annual income is minimal (Table 2).
Farming households grow a diverse range of cash and food crops. At least, nine types of crops, including three cash crops (ginger, oranges and chillies), four grains (maize, finger millet, paddy and buckwheat), and pulses are grown in Barshong Gewog. Maize is the main crop cultivated (102.4 ha), followed by finger millet (62.2 ha). Among the cash crops, oranges one of the main crops and are cultivated on 21.9 ha (Table 4).
The main types of livestock reared are cattle, poultry, goats, and pigs. Around 90% of households (156) own cattle, 74% (130) own poultry, 72% (126) own goats, and nearly 33% (59) own pigs (Figure 5). Very few households own sheep and horses. In general, livestock numbers over the last five years have declined: cattle numbers have decreased by 23%, while other livestock has decreased by less than 6%. Although there has been an increase in the number of horses, the number of horses is still insignificant (Figure 4).
Farmers earn significant income from the produce from cattle, goats, pigs, and poultry. On average, annually, farmers earn BTN 10,475 from cattle, BTN 5,526 from pigs, BTN 4,940 from goats, and BTN 1,441 from poultry (Table 5). Income from other livestock is insignificant.
The data collected on feeding practices indicate that households use stall feeding or grazing, or a combination of both, as strategies to feed their livestock. Stall feeding is the dominant strategy for goats and pigs, whereas a combination of stall feeding and grazing is prominent for cattle and poultry (Figure 5).
Table 2: Population characteristics
Characteristics Frequency
(N)
Percent
Gender Male 109 61.9Female 65 36.9
Age > 51 88 51.0≤51 86 49.0
Marital status
Single 2 1.1Married 144 82.8Divorced/widowed 28 16.1
Ethnicity Ngalong 5 2.9Sharshop 16 9.2Trongsap 4 2.3Khengpa 9 5.1Lhotsampa 140 80.5
Education Literate 58 33.0Illiterate 116 66.7
Occupation Farming 135 79.9Household activity 13 7.7Wage labourer 10 5.9Salaried employee 4 2.4Petty business 1 0.6Others 6 3.6Table 3: Land ownership by type
Land type (ha per HH)
Mean Minimum Maximum
Area of wetland owned 0.5 0 3.2Area of dryland owned 1.2 0 5.6Area of orchard owned 0.2 0 2.0ha = hectares, HH = households
Table 4: Major crops cultivated in Barshong
Major crops Area (ha)Maize 102.4Finger millet 62.2Paddy 26.2Orange 21.9Pulses 11.6Ginger 6.0Tapoika 5.5Chilli 0.3Buckwheat 0.2
Table 5: Average annual income from livestock
LivestockAverage income
(BTN) (USD)Sheep 280.7 4.8Goats 4,940 83.7Cows 10,475.7 177.6Horses 648.1 11.0Pigs 5,526.9 93.7Poultry 1,441.8 24.4Total 23,313.2 395.1

11
Income distributionA frequency distribution was prepared with respect to income categories starting with less than BTN 20,000 (USD 291.2) and with an ascending class interval up to BTN 100,000 (USD 1,456.2). Over 35% of the total households surveyed earn an annual income of less than BTN 20,000 (USD 291.2), while 8% earn more than BTN 100,000 (USD 1,456.2) per year. Most households (56.4%) earn between BTN 21,000 (USD 305.8) and 99,000 (USD 1,441.7) annually (Table 6).
Drinking water sourcesMost of the drinking water in Barshong comes from piped water (nearly 55%), followed by streams and rivers (almost 27%); only 18% of households use spring water (Figure 6). The drinking water facilities in the gewog are well covered and supported under the Five Year Plan of the Royal Government of Bhutan.
State of the Ecosystems
Community dependence on major ecosystems The three major ecosystems identified during the PRA process – forest, freshwater, and agro ecosystems – contribute greatly to the livelihoods of a large number of local households. Out of 174 households surveyed, 91, 93 and 99 percentage of households to be highly dependent on forest, agriculture and fresh ecosystems, respectively (Figure 7). Respondents reported their dependency on fresh water to be highest among the three, followed by agricultural land and forest. The high ranking for freshwater is due to the importance attached to freshwater for drinking and irrigation purposes.
1,29
4
794
664
124
26 26 4
1,38
4
1,03
4
672
149
2
0
2,00
4,00
6,00
8,00
1,000
1,200
1,400
1,600
Num
ber o
f liv
esto
ck
Types of livestock
Present Past five years
Poultry Cows Goats Pigs Sheeps Horses
Figure 4: Livestock numbers for present and past five years
0
10
20
30
40
50
60
70
80
90
100
Perc
enta
ge o
f hou
seho
lds
LivestockCows Poultry Goats Pigs Sheep Horses
Stall feeding
Grazing
Both
Figure 5: Livestock feeding practices
Figure 6: Sources of drinking water
Piped water
Stream/river
Spring
Percentage households
0 10 20 30 40 50 60
Table 6: Frequency distribution of income
Income groupFrequency
(N)
Percent
Less than BTN 20,000 (USD 291.2) 62 35.6
Between BTN 21,000–49,000 (USD 305.8- 713.5) 49 28.2
Between BTN 50,000–99,000 (USD 728.1- 1,441.7) 49 28.2
More than BTN 100,000 (USD 1,456.2) 14 8.0

12
Importance of ecosystemsThe data show no significant difference between the perceived importance of services provided by the different ecosystems (forests, freshwater and agricultural land) to the villagers. Most households (81%) reported freshwater as the most important ecosystem, followed by agricultural land (65.5%) and forest (63.2%) (Figure 8).
Some respondents explained their ranking of agricultural land as less important due to the lack of water resources in the study area. Those with access to electricity ranked dependence on forests as low, because they use electricity instead of fuelwood for energy.
Perceived change in major ecosystems/land use Over 49% of the total population perceived an increase in forest cover owing largely to community forestry, followed by rural to urban migration for employment and education. However, 36.8% perceived a decrease in forest cover (Table 7).
In relation to agriculture ecosystems, over 40% perceived no change, while 38.5% perceived a decline over the last decade (Table 7). Respondents who thought the agroecosystem had declined attributed this to less rainfall, lack of irrigation, soil erosion, lack of labor, and poor soil conditions. At least two respondents cited uncertainties surrounding climate as a reason for the decline of agriculture ecosystems.
The majority of households (72%) reported that freshwater ecosystems are decreasing as a result of the drying up of freshwater sources, climate change and increasing population (Table 7). The data does not differentiate between quantity and access; therefore, it is assumed that those who cited increasing population as the main reason for declining freshwater ecosystem may be referring to either access to, or quantity of water, at the user level. Incidentally, 19.5% of households also reported an increase in freshwater resources, which refers to the improved access to water brought about by piped water and a relative decrease in the population, and does not necessarily mean an increase in the freshwater ecosystem.
Land use, land cover change analysis Over time, additional land cover types have emerged in Barshong, primarily as a result of economic development activities in the area (Figures 9, 10, 11). However, the main land-cover types include agriculture, fallow land, forest, bare area, and water bodies. Forests cover over 85% of the total area, followed by cultivated land (10.5%).
91.4
6.9
1.1
1.1
0.6
93.1
4 1.7
99.4
0.6
0
20
40
60
80
100
120
Perc
enta
ge re
spon
dent
s
Level of dependency
Forest
Agriculture
Freshwater
Moderatelyimportance
Veryimportant
Important Lessimportant
Notimportant
Figure 7: Dependence on major ecosystems
63.2
25.9
10.3
65.5
28.7
2.9
0.6
81
18.4
0.6 2.9
0
10
20
30
40
50
60
70
80
90Pe
rcen
tage
resp
onde
nts
Level of importance
Moderatelyimportance
Veryimportant
Important Lessimportant
Notimportant
Forest
Agriculture
Freshwater
Figure 8: Importance of services from different ecosystems
Table 7: Perceived change in ecosystems as reported by respondents
Ecosystem Increasing Decreasing No change Do not know Total %Forest 49.4 36.8 6.9 6.9 100Agro 13.2 38.5 40.2 8.1 100Freshwater 19.5 71.9 5.2 3.4 100
13
Figure 7: Dependence on major ecosystems
Figure 8: Importance of services from different ecosystems
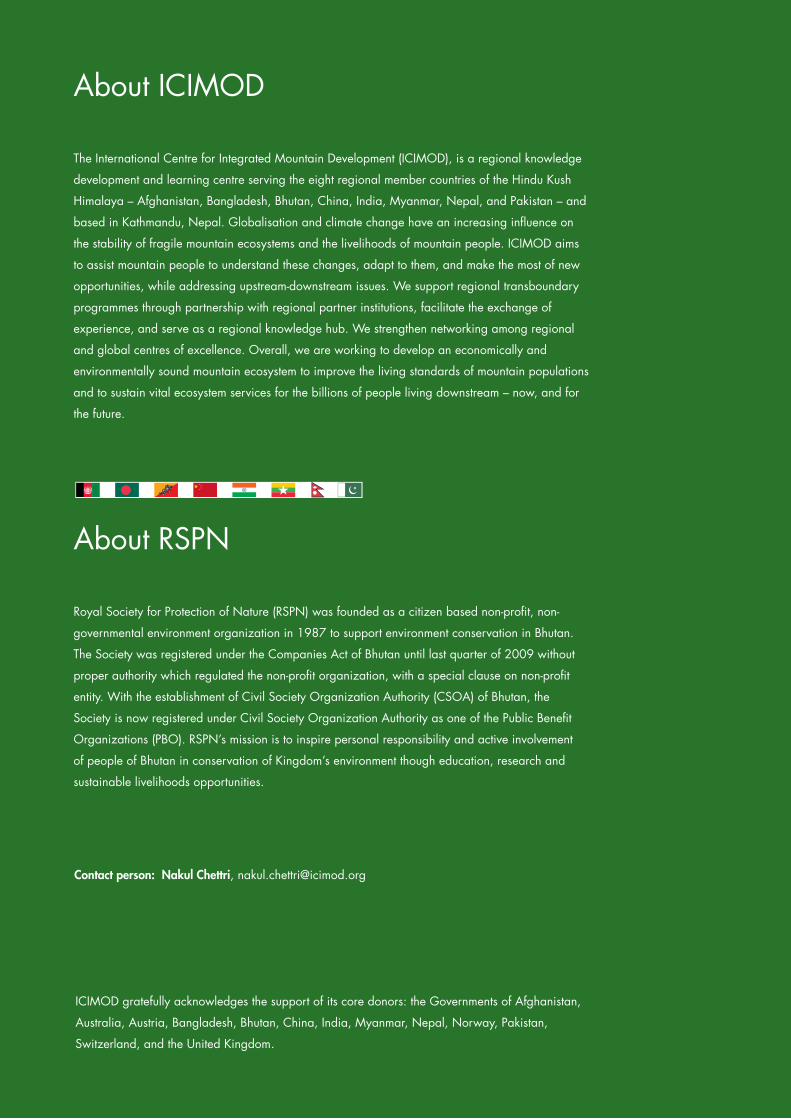
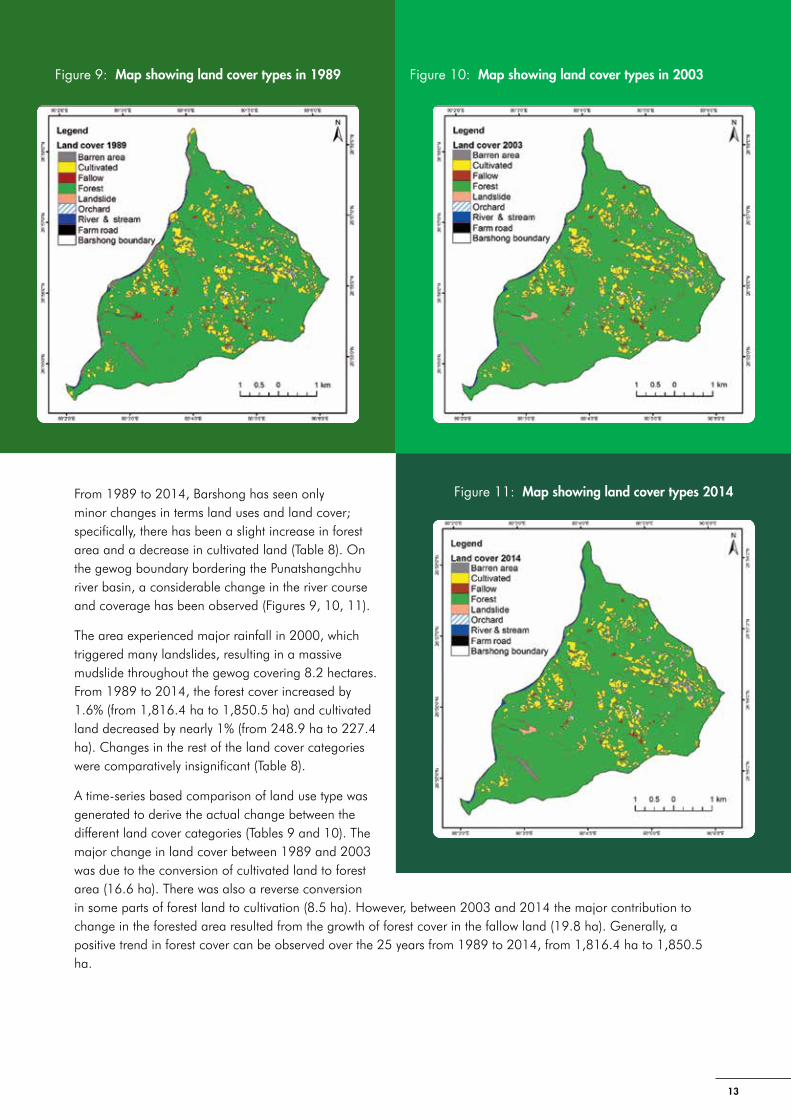
From 1989 to 2014, Barshong has seen only minor changes in terms land uses and land cover; specifically, there has been a slight increase in forest area and a decrease in cultivated land (Table 8). On the gewog boundary bordering the Punatshangchhu river basin, a considerable change in the river course and coverage has been observed (Figures 9, 10, 11).
The area experienced major rainfall in 2000, which triggered many landslides, resulting in a massive mudslide throughout the gewog covering 8.2 hectares. From 1989 to 2014, the forest cover increased by 1.6% (from 1,816.4 ha to 1,850.5 ha) and cultivated land decreased by nearly 1% (from 248.9 ha to 227.4 ha). Changes in the rest of the land cover categories were comparatively insignificant (Table 8).
A time-series based comparison of land use type was generated to derive the actual change between the different land cover categories (Tables 9 and 10). The major change in land cover between 1989 and 2003 was due to the conversion of cultivated land to forest area (16.6 ha). There was also a reverse conversion in some parts of forest land to cultivation (8.5 ha). However, between 2003 and 2014 the major contribution to change in the forested area resulted from the growth of forest cover in the fallow land (19.8 ha). Generally, a positive trend in forest cover can be observed over the 25 years from 1989 to 2014, from 1,816.4 ha to 1,850.5 ha.
Figure 9: Map showing land cover types in 1989 Figure 10: Map showing land cover types in 2003
Figure 11: Map showing land cover types 2014

14
Table 8: Land use land cover distribution (1989, 2003, and 2014)
Land cover Year 1989 Year 2003 Year 2014 Land cover changes %
(1989-2014)ha % ha % ha %
Forest 1,816.4 84.2 1,826.2 84.7 1,850.5 85.8 1.58Barren area 27.3 1.3 18.0 0.8 11.5 0.5 -0.73 Landslide 0.0 0.0 0.0 0.0 8.2 0.4 0.38Cultivated 248.9 11.5 231.0 10.7 227.4 10.5 -0.99Orchard 25.7 1.2 22.9 1.1 22.5 1.0 -0.15Fallow 16.5 0.8 40.9 1.9 10.5 0.5 -0.28Farm road 0.0 0.0 0.0 0.0 3.3 0.2 0.15Rivers and streams 22.2 1.0 18.0 0.8 23.0 1.1 0.04Total 2,156.9 100.0 2,156.9 100.0 2,156.9 100.0 0.0Note: Land cover change is calculated as a % of the total land area.
Table 9: Change matrix of land cover between 1989 and 2003 (ha)
Land cover
Fore
st
Barr
en a
rea
Land
slide
Rive
rs &
stre
ams
Culti
vate
d
Orc
hard
Fallo
w
Farm
road
Tota
l
Forest 1,806.5 3.1 0.0 0.0 16.6 0.0 0.0 0.0 1826.2
Barren area 0.0 18.0 0.0 0.0 0.0 0.0 0.0 0.0 18.0
Landslide 0.0 0.0 0.0 0.0 0.0 0.0 0.0 0.0 0.0
Rivers and streams 0.1 1.4 0.0 16.5 0.0 0.0 0.0 0.0 18.0
Cultivated 8.5 0.3 0.0 0.0 222.2 0.0 0.0 0.0 231.0
Orchard 0.4 0.0 0.0 0.0 0.3 22.2 0.0 0.0 22.9
Fallow 0.9 4.6 0.0 0.0 9.7 0.0 25.7 0.0 40.9
Farm road 0.0 0.0 0.0 0.0 0.0 0.0 0.0 0.0 0.0
Total 1,816.4 27.3 0.0 16.5 248.9 22.2 25.7 0.0 2,156.9
Table 10: Change matrix of land cover between 2003 and 2014 (ha)
Land cover
Fore
st
Barr
en a
rea
Land
slide
Rive
rs &
str
eam
s
Culti
vate
d
Orc
hard
Fallo
w
Farm
road
Tota
l
Forest 1821.9 0.8 0.0 1.4 5.6 1.1 19.8 0.0 1,850.5
Barren area 0.0 11.5 0.0 0.0 0.0 0.0 0.0 0.0 11.5
Landslide 1.1 0.0 0.0 0.0 0.0 0.0 7.2 0.0 8.2
Rivers and streams 0.1 5.7 0.0 16.6 0.0 0.0 0.6 0.0 23.0
Cultivated 1.9 0.0 0.0 0.0 225.5 0.0 0.0 0.0 227.4
Orchard 0.7 0.0 0.0 0.0 0.0 21.8 0.0 0.0 22.5
Fallow 0.2 0.0 0.0 0.0 0.0 0.0 10.3 0.0 10.5
Farm road 0.3 0.0 0.0 0.0 0.0 0.0 3.0 0.0 3.3
Total 1,826.2 18.0 0.0 18.0 231.0 22.9 40.9 0.0 2,156.9

15
Ecosystem Services Assessment
Ecosystem service utilizationCollectively, the different ecosystems in Barshong provide a wide range of goods and services, including 22 provisioning services, 14 regulating services, 4 supporting services and 6 cultural services (Table 11).
Using three major ecosystems and the list of specific ecosystem services identified during the PRA, a frequency check of respondents answering positively to each list of services was carried out (Table 12).
Provisioning servicesThe study found that the community depends largely on forests for at least eight different provisioning resources. Over 95% of households reported using timber/poles (169 households) and fuelwood (166 households), while 87 % (151 households) reported using forest ecosystems to provide forage for livestock (grazing and fodder). Less than half of the total households also reported using wild edible fruits and vegetables (49.4%) and mushrooms (26.4%). A few households collect fibers, dyes, and medicinal and ornamental plants, but the use of these was negligible in terms of number of households (Table 12).
Agriculture ecosystems are equally productive in terms of providing food (grains, cereals and vegetables). At least 90.2% (157 households) said that they obtain vegetables from agroecosystems, while 70.1% (122 households) obtain cereals and 67.2% (117 households) obtain grains (rice) from agroecosystems. As an agrarian, livestock-rearing community, agriculture ecosystems also provide a significant amount of forage and fodder for livestock. The vast majority of households (91.9%) reported using agriculture ecosystems to feed animals (Table 12).
Freshwater is significant in terms of providing water for domestic use and irrigation (Table 12). Understandably, the use of freshwater for the provision of food is limited, with only 13.7% (24 households) citing fish as a source of food. It should be noted that national policies prohibited hunting and fishing in Bhutan during the time of survey.
Table 11: Services provided by ecosystems in Barshong
Provisioning (22) Regulating (14) Supporting (4) Cultural (6)Fuelwood, fodder, grazing, timber/poles, leaf litter, medicinal plants, ornamental plants, wild edible fruit & vegetables, mushrooms, fibers, thatch, bush meat, dyes, paddy, cereals, vegetables, fish, drinking water, bathing water, irrigation water, boulders, sand
Carbon sequestration, climate regulation, flood control, groundwater recharge, nutrient enrichment, pest regulation, pollination, seed dispersal, soil fertility, soil formation, soil stability, waste treatment, water purification, water retention
Ecosystem resilience, habitat for species, hydrologic cycle, soil formation
Aesthetic beauty, ecotourism, education & research, recreation, nature worship, spiritual enrichment
Table 12: Ecosystem service utilization: Provisioning
Ecosystem
Fuel
woo
d
Fodd
er
Gra
zing
Tim
ber/
pole
s
Leaf
litte
r
Med
icin
al p
lant
s
Orn
amen
tal p
lant
s
Wild
edi
ble
fruits
/veg
etab
les
Mus
hroo
ms
Fibr
es
That
ch
Bush
mea
t
Dye
s
Cere
als
Vege
tabl
es
Padd
y
Fish
Drin
king
wat
er
Wat
er fo
r bat
hing
Wat
er fo
r irr
igat
ion
Boul
ders
Sand
Forest 166 151 118 169 83 17 2 79 35 14 9 6 6 1 42 0 3 15 13 11 6 5
Agro 152 160 128 68 62 7 46 67 26 26 19 3 6 122 157 117 4 8 3 4 106 49
Freshwater 2 2 3 0 0 0 0 0 0 0 0 0 0 0 37 40 24 165 165 135 26 18

16
A comparison of provisioning services from forest, freshwater, and agroecosystems indicates that forests are most productive in terms of the flow of services to communities. However, the community also depends heavily on agroecosystems for crops, ornamental plants, fuelwood, forage, fiber, and thatch. Similarly, freshwater ecosystems are important in terms of providing drinking water, water for bathing and irrigation, and fish for some households (Figure 12).
The provisioning services provided by ecosystems in Barshong in 1989, 2003, and 2014 are shown in Figure 13.
SandBoulders
Water for irrigationWater for bathing
Drinking waterFish
PaddyVegetables
CerealsDyes
Bush meatThatch
FibreMushroom
Wild edibles fruits/vegetables Ornamental plants
Medicinal plantsLeaf litter
Timber/polesGrazingFodder
Fuelwood
Percentage of households
Forest Agriculture Freshwater
Prov
isio
ning
eco
syst
em s
ervi
ces
0 10 20 30 40 50 60 70 80 90 100
Figure 12: Comparative importance of provisioning services:
Figure 13: Provisioning services provided by ecosystems in Barshong (1989, 2003, 2014)

17
Regulating ServicesRespondents also place a high priority on intangible services from forest ecosystems. A similar comparison of regulating services was carried out for the three main ecosystems (Figure 14). The results show that respondents place high significance on forests in terms of flood control (93.6% of households), climate regulation (87.9% of households), maintaining soil stability (83.3% of households), soil fertility and seed dispersal (77.5% of households), carbon sequestration, pollination, nutrient recycling and groundwater recharge. The regulating services for the years 1989, 2003, 2014 are shown in Figure 15.
Supporting ServicesIn terms of supporting services, the majority of respondents were positive about the role of the forest ecosystem in ecosystem resilience, providing a habitat for species, supporting the hydrological cycle and soil formation (Figure 16). A considerable number of households also seemed to understand the significance of the freshwater ecosystem in terms of the four supporting services provided. The supporting services for the years 1989, 2003, 2014 are shown in Figure 17.
Water retentionWater purification
Water treatmentSoil stability
Soil formationSoil fertility
Seed dispersalPollination
Pest regulationNutrient enrichment
Groundwater rechargeErosion/flood control
Climate regulationCarbon sequestration
Percentage of households
Forest Agriculture Freshwater
Regu
latin
g ec
osys
tem
ser
vice
s
0 10 20 30 40 50 60 70 80 90 100
Figure 14: Comparative importance of regulating services

18
Cultural ServicesForests also play the most important role in providing cultural services to local communities, including aesthetic beauty, spiritual renewal, and recreation. Over 90% of respondents seem to derive aesthetic services from forests and freshwater ecosystems (Figure 18). A marginal number of people (less than 23% also seem to understand the role of forests and freshwater in ecotourism, education, research, and recreation. Spiritual enrichment and nature worship are noteworthy services from all three ecosystems. The cultural services provided in the years 1989, 2003, 2014 are shown in Figure 19.
Figure 15: Regulating services provided by ecosystems in Barshong (1989, 2003, 2014)
6040200 80 100Percentage of households
Supp
ortin
g ec
osys
tem
ser
vice
s Spiritualenrichment
Natureworship
Recreation
Educationand research
Forest Agriculture Freshwater
Figure 16: Comparative importance of supporting services

19
Perceived social, cultural and ecological value of ecosystem services
PlantsDuring the PRA process preceding the household survey, respondents identified four plant species used by them that are of social, cultural and ecological significance: chewri (Diploknema butyracea), peepal (Ficus religiosa), bel (Limonia acidissima) and banana (Musa paradisiaca). Peepal is perceived to be the most important plant species in terms of cultural significance. Over 75% of the respondents ranked it as very important and reported its use during worship, in rituals and marriage ceremonies. Peepal is also recognized as a socially important (for 47.6% of households) tree species owing to its religious significance (Figure 20).
Percentage households
Forest Agriculture Freshwater
60 7040 5020 30100 80 90 100
Cultu
ral e
cosy
stem
ser
vice
s
Spiritual enrichment
Natureworship
Aesthetic beauty
Recreation
Ecotourism
Education& research
Figure 18: Comparative importance of cultural ecosystem services
Figure 17: Supporting services provided by ecosystems in Barshong (1989, 2003, 2014)

20
Bananas are the most significance in terms of perceived social and cultural importance. A total of 73% of households responded positively to its social significance, with 70% citing it as socially important. Bananas also received the most responses (45.3%) in terms of ecological significance.
Livestock Chickens, pigs, goats, and cows were identified during the PRA as the top four socio-culturally and ecologically important domestic animal species. Socially, all of these animals were considered very important to respondents (Figure 21), due to their economic benefits. Culturally, cows were perceived by most as important or very important, whereas other species (chickens, pigs, goats) were perceived as not important culturally. Cows, goats, and chickens are occasionally used for worshiping and rituals. Ecologically, all four species were perceived to be less important or not important.
EcosystemsAll three ecosystems – forest, freshwater, and agricultural – are considered very important in terms of their contribution to social aspects of community life (Figure 22). A general impression of the social importance of forest ecosystems can be gained from the utilitarian services derived from forests, as described in the earlier section on the state of ecosystems. Food, medicine, fodder for livestock, construction materials and fuel were some of the uses cited by respondents.
Over 50% of respondents also perceived freshwater and forest ecosystems to be important for ecological purposes, although 18% said that these ecosystems are not important. More than 30% of households found forest and freshwater ecosystems culturally significant.
Figure 19: Cultural services provided by ecosystems in Barshong (1989, 2003, 2014)

21
BananaBel
PeepalChewri
Very important Important Less important Not importantModerately important
Ecol
ogic
alim
porta
nce
Cul
tura
lim
porta
nce
Soci
alim
porta
nce
BananaBel
PeepalChewri
BananaBel
PeepalChewri
0 10 20 30 40 50 60 70 80 90 100Percent
ChickenPig
GoatCow
Very important Important Less important Not importantModerately important
Ecol
ogic
alim
porta
nce
Cul
tura
lim
porta
nce
Soci
alim
porta
nce
ChickenPig
GoatCow
ChickenPig
GoatCow
0 10 20 30 40 50 60 70 80 90 100Percent
Figure 20: Perceived importance of plant species
Figure 21: Perceived importance of livestock

22
Willingness to pay (WTP) for ecosystem servicesOver 87% of households were willing to pay for the management of the three main ecosystems and their services, compared to only 11% who were unwilling. Of the 152 households willing to pay, nearly 50% said that they would pay BTN 100 (USD 1.7), more than 20% said they would pay up to BTN 300 (USD 5), and less than 5% said they would pay more than BTN 3,000 (USD 50) per year for the management of ecosystems (Figure 23).
Livelihood Vulnerability Assessment
Vulnerability assessment The survey revealed that the food produced by farmers in the study area is not enough to sustain them. More than 75% of households reported food shortages, saying that they could live from their own food production for less than 9 months a year (Figure 24). The months of May, June and July are the most difficult for in terms of providing food for the household (Figure 25). Among those who face food shortages, only 3.4% reported it as a major issue, while 29.3 % described it as a minor problem (Figure 26).
Freshwater
Agriculture
Forest
Freshwater
Agriculture
Forest
Freshwater
Agriculture
Forest
Very important Important Less important Not importantModerately important
Ecol
ogic
alim
porta
nce
Cul
tura
lim
porta
nce
Soci
alim
porta
nce
0 10 20 30 40 50 60 70 80 90 100Percent
Figure 22: Perceived importance of ecosystems
50
0
50
40
30
20
10
80 100
165
200
300
400
500
600
700
1,00
01,
300
1,45
01,
500
2,00
03,
000
15,0
0030
,00015
0
Freq
uenc
y
Amount in cash or kind (Nu.) willing to pay per year for ecosystem services
11%
38%
29%
12%
10%
Less than3 months
More than 12 months
4-6 months
7-9 months
10-12 months
Figure 23: Willingness to pay for ecosystem services
Figure 24: Number of months household can live from own food production

23
Related to this, and perhaps a cause of food shortages, when asked about crises faced, 29.3% said that they faced issues of poor production, mainly caused by lack of rainfall or access to water (22.9%,) followed by human-wildlife conflict (2.3%,), with at least one report of pest/disease attacks on oranges, which is considered a major source of income. Other crises cited were market fluctuations, illnesses in the family, and loss of livestock, but these were considered to be minor problems (Figure 26). Remittances and damage and degradation of natural ecosystems did not feature as issues, while job loss, loss of land, and death in the family were considered minor problems.
Overall, 28.7% of households adopted a minimum of two coping strategies to face crises. However, in response to food shortages, households adopted at least seven different short-term coping strategies (Table 13). The most common strategy for coping with food shortages was reliance on social safety nets and livelihood diversification, which mainly consisted of temporary labor migration and occupation change.
Perceived changes in socioeconomic sectorsThe households in Barshong perceived an improvement in all social and economic sectors in the last decade (Figure 27). Improved medical facilities and the presence of basic health units nearby were cited as reasons for the reduced frequency of illness (cited by 61.5% of households) and improved health. Increased water quality (cited by 85.1% of households) have contributed greatly to reducing water-borne illnesses. Over 74% of households reported an improvement in access to forests as a result of the community forestry initiative and user interface. Respondents also reported improved food security (83.3%) due to improvement in renewable natural resource facilities (agriculture and livestock), improved irrigation (67.2%), and increased soil fertility (47.7%). However, 41.2% of households (30 households) also reported a decline in soil fertility due to loss of topsoil and lack of access to water.
Janu
ary
Febr
uary
0
30
6070
20304050
10
Mar
ch
May
June July
Aug
ust
Sept
embe
r
Oct
ober
Nov
embe
r
Dece
mbe
r
Apr
il
Num
ber o
f res
pond
ents
Months
Figure 25: Difficult months to provide adequate food
Figure 26: Types of crises faced by households
020
51
3120 21 17 13
6 4 8 5 2 2 0 0 0 0 0 0 06691020304050
Num
ber o
f hou
seho
lds
Types of crisis
Food
sho
rtage
Poor
pro
duct
ion
Mar
ket fl
uctu
atio
n
Loss
of l
ives
tock
Deat
h of
hou
seho
ldm
embe
r
Loss
of l
and
Job
loss
Irreg
ular
rem
ittan
ces
Dam
ages
Degr
adat
ion
ofna
tura
l...
Illne
ss/a
ccid
ent
Minor problemMajor problem
Table 13: Coping strategies (number of responses per crisis)
Copi
ng s
trate
gies
Take
loan
Loan
gra
in fr
om k
in
Adj
ust m
eals
Sell
anim
als
Tem
pora
ry la
bour
m
igra
tion
Leas
e ad
ditio
nal
farm
land
to u
se
Free
sup
port
by
fam
ily/c
omm
unity
Oth
er s
trate
gy
Types of crisis
Poor production 3 2 1 2 6 1 – 3
Food shortage 1 1 – 4 17 – 20 13
Illness/accident 2 1 – 2 2 – 8 10
Death of household member – 1 – 1 1 – 1 2
Job loss 0 0 0 0 0 0 0 0
Irregular remittances 0 0 0 0 0 0 0 0
Market fluctuation/inflation 1 1 –– – 1 – 6 15
Loss of land – – – – – – 3 4
Loss of livestock 2 – – – 1 – 2 10

24
It is interesting to note that although perceptions of opportunities to generate income locally have not changed much over the last 10 years, purchasing power has increased by 82.8% of households reporting improvement (Figure 27). With national inflation fluctuating between 5.15% (lowest) and 13.53% (highest) over the last 10 years, this increase in purchasing power may have been brought about by an increase in real income from remittances and the sale of agricultural products, as reported by respondents. At the same time, 92% of households said that access to credit has also improved. The vast majority of respondents also cited improvements in transportation (87%), access to information/communication (97%), and the quality of public services (98%). All of the respondents (N=174) reported an improvement in livelihoods from ecosystem management in the last 10 years.
Proposed livelihood improvement activitiesThe top activities proposed to improve livelihoods were construction of farm roads (cited by 75.8% of households), improved water supply for drinking and irrigation (cited by 68.9% of households), the issuing of additional land for cultivation (cited by 4.5% of households), provision of electricity (cited by 4% of households), and construction/improvement of school facilities (cited by 2.3% of households).
0
20
40
60
80
100
120
Perc
enta
geho
useh
old
Socioeconomic sectors
No change Improved WorsenedFr
eque
ncy
of il
lnes
s
Hea
lth fa
cilit
ies
Purc
hasin
g po
wer
Acc
ess
to fo
rest
Fore
st co
ver
Soil
ferti
lity
Food
sec
urity
Fam
ily s
ize
Secu
rity
Com
mun
icat
ion
Tran
spor
tatio
n
Acc
ess
to c
redi
ts
Wat
er a
vaila
bilit
y
Wat
er q
ualit
y
Vete
rinar
y fa
cilit
ies
Qua
lity
of p
ublic
ser
vice
s
Scho
ol fa
cilit
ies
Poss
ibili
ties
to g
ener
ate
inco
me
(loca
lly)
Figure 27: Long-term changes in socioeconomic sectors over last 10 years
Orchard is one of the major categories of landholdings in Barshong Livestock rearing is one of the major livelihood strategies in Barshong

25
Conclusion and Recommendations This study identified those ecosystem services that are most important to communities in Barshong Gewog. However, the study was limited to the identification of the utility of ecosystem services. It did not identify key linkages between environmental quality and human wellbeing or look at the impact of changes in the quantity and quality of the ecosystem services on the livelihoods of people in the community. Understanding how trends in forest cover, water quality/quantity, and the health of natural areas might improve or detract from the wellbeing of people in the community is key to understanding the real value of the ecosystems studied.
Like most of rural Bhutan, forests in the study area face multiple threats. Over 90% of the households surveyed depend on forests for provisioning services, such as timber, fuelwood, fodder, and supplemental food. The demand for ecosystem services from forests for social and economic purposes can result in multiple drivers of land use change, which may lead to the degradation of forest ecosystems. The role of the community forestry initiative in improving the livelihoods of user communities and conserving biological diversity is high on the Dzongkhag agenda for the next five years.
Freshwater ecosystems deliver clean water for multiple purposes and are vital to human wellbeing. It is important for communities to understand how conserving freshwater ecosystems can result in the provision of multiple services, especially given the water shortages cited during the survey. The protection of water sources also needs to be high on the conservation agenda of the gewog and the dzongkhag if it plans to meet its agro-based objectives.
Agriculture ecosystems support over 90% of the population in Barshong Gewog. Besides providing cash and food crops, there is a need to understand and consider the role of agriculture ecosystems in species and habitat conservation, erosion regulation, pollination, pest and disease control, water purification/regulation, recreation and cultural diversity, and the lifecycle maintenance of cropland ecosystems, instead of focusing exclusively on their potential for food production.
Based on the findings of this study, the following actions are suggested:
� Action 1. Diversify livelihood options to reduce poverty and stress on forest resources: Tsirang Dzongkhag has higher poverty, lower literacy, lower mean annual household income, and higher unemployment rates than the rest of Bhutan (NSB 2013). As agriculture and livestock are the main sources of livelihood, enhancing production is a priority in the 11th Five Year Programme for the Dzongkhag. Towards this, there are national plans in place to improve farm roads and the water supply, as well as for the formation of cooperatives. Given the favorable climatic conditions in the area and its strategic location between the capital and Sarbang (bordering India), there is also an opportunity to develop tourism (GNHC 2013). Opportunities to establish cottage, small, and medium-sized industries have also been identified in the 11th Five Year Plan, with the completion of an electricity transmission line between Basochhu and Tsirang and the commissioning of the Dagachhu hydroelectricity project.
� Action 2. Explore opportunities for payment for ecosystem services: Payment for ecosystem services (PES) has been found to be feasible in a number of places in Bhutan. Under this mechanism, land users are paid incentives for good environmental practices and compensated for the environmental costs they bear. Opportunities for PES exist in Barshong in relation to the provision of: watershed services for drinking water, agriculture and hydropower; soil erosion control and flood regulation for populations living downstream; carbon sequestration and storage for international carbon markets (given that 85% of the gewog is under forest cover); and aesthetic services for tourism and recreation.

26
ReferencesBadola, R., Hussain, S. A., Mishra, B. K., Konthoujam, B., Thapliyal, S., and Dhakate, P. M. (2010). ‘An assessment
of ecosystem services of Corbett Tiger Reserve, India’. The Environmentalist, 30(4), 320-329
Baral, N., Gautam, R., Timilsina, N., and Bhat, M. G. (2007). ‘Conservation implications of contingent valuation of critically endangered white-rumped vulture Gyps bengalensis in South Asia’. The International Journal of
Biodiversity Science and Management, 3(3), 145-156.
Chaudhary, S., Chettri, N., Uddin, K., Khatri, T. B., Dhakal, M., Bajracharya, B., and Ning, W. (2016). ‘Implications of land cover change on ecosystems services and people’s dependency: A case study from the Koshi Tappu Wildlife Reserve, Nepal’. Ecological Complexity, 28, 200-211.
Chen, W. Y., and Jim, C. Y. (2010). ‘Resident motivations and willingness-to-pay for urban biodiversity conservation in Guangzhou (China)’. Environmental management, 45(5), 1052-1064.
Chettri, N., Shakya, B., and Sharma, E (2008) Biodiversity conservation in the Kangchenjunga Landscape. Kathmandu: ICIMOD
De Groot, R. S., Alkemade, R., Braat, L., Hein, L., and Willemen, L. (2010). ‘Challenges in integrating the concept of ecosystem services and values in landscape planning, management and decision making’. Ecological
complexity, 7(3), 260-272.
Eriksson, M., Xu, J., Shrestha, A.B., Vaidya, R.A., Nepal, S., and Sandström, K (2009). The changing Himalayas:
Impact of climate change on water resources and livelihoods in the greater Himalayas. Kathmandu: ICIMOD
GNHC (2013). Eleventh Five Year Plan. Volume I: Main document. Thimphu: Gross National Happiness Commission, Royal Government of Bhutan.
ICIMOD (2009). Climate change impacts and vulnerability in the eastern Himalayas. Kathmandu: ICIMOD
ICIMOD, RSPN (2014). An integrated assessment of the effects of natural and human disturbances on a wetland
ecosystem: A retrospective from Phobjikha Conservation Area, Bhutan. Kathmandu: ICIMOD
Kubiszewski, I., Costanza, R., Dorji, L., Thoennes, P., and Tshering, K. (2013). ‘An initial estimate of the value of ecosystem services in Bhutan’. Ecosystem Services, 3, e11-e21. LCMP (2010) Technical Report, Bhutan Land
Cover Assessment. Thimphu: National Soil Services Centre and Policy and Planning Division (PPD), Ministry of Agriculture and Forests, Royal Government of Bhutan, Thimphu, Bhutan.
LCMP (2010). Technical report. Bhutan Land Cover Assessment 2010. Thimphu: Ministry of Agriculture and Forests, Royal Government of Bhutan.
Maharana, I., Rai, S.C., and Sharma, E. (2000a). ‘Environmental economics of the Khangchendzonga National Park in the Sikkim Himalaya, India’. Geo Journal, 50: 329–337
Maharana, I., Rai, S.C., and Sharma, E. (2000b). ‘Valuing ecotourism in a sacred lake of the Sikkim Himalaya, India’. Environmental Conservation, 27: 269–277
MEA (2005). Ecosystem and human well-being. Synthesis report. Washington, DC: Island Press
MOAF (2011). The draft 11th Five Year Plan. Thimphu: Policy and Planning Division, Ministry of Agriculture and Forests, Royal Government of Bhutan.
Muller, F., de Groot, R. S., and Willemen, L. (2010). ‘Ecosystem services at the landscape scale: the need for integrative approaches’. Landscape online: 23: 1–11. DOI:10.3097/LO.201023
NBC (2015). National Biodiversity Centre. Thimphu: Ministry of Agriculture and Forests. Available at: http://www.nbc.gov.bt/biodiversity-of-bhutan/ecosystem-diversity (assessed 2 June 2015)
NBSAP (2014). Draft National Biodiversity Strategies and Action Plan of Bhutan. Final draft. National Biodiversity Centre, Ministry of Agriculture and Forests, Thimphu, Bhutan.
Norbu, U.P. (2012). Benefit-sharing for ecosystem services with emphasis on poverty reduction. Thimphu: Watershed Management Division, Ministry of Agriculture and Forest
NSB (2013). Annual dzongkhag statistic. National Statistics Bureau, Royal Government of Bhutan, Thimphu: Bhutan.

27
Pant, K.P., Rasul, G., Chettri, N., Rai, K.R., and Sharma, E. (2012). Value of forest ecosystem services: A quantitative
estimation from the Kangchenjunga landscape in eastern Nepal. Working Paper 2012/5. Kathmandu: ICIMOD
Rasul, G., Chettri, N., and Sharma, E. (2011) Framework for valuing ecosystem services in the Himalayas. Kathmandu, ICIMOD
Raymond, C. M., Bryan, B. A., MacDonald, D. H., Cast, A., Strathearn, S., Grandgirard, A., and Kalivas, T. (2009). ‘Mapping community values for natural capital and ecosystem services’. Ecological economics, 68(5), 1301-1315. RGoB (2013). Eleventh five year plan. Volume I: Main document. Gross National Happiness Commission, Royal Government of Bhutan, Thimphu, Bhutan.
RSPN (2015). Ecosystem services for sustainable livelihoods. Barshong Tsirang case study, 2015. Policy Brief. Royal Society for Protection of Nature, Thimphu, Bhutan.
Schild, A. (2008). ‘The case of the Hindu Kush-Himalayas: ICIMOD’s position on climate change and mountain systems’. Mountain Research and Development, 28(3/4), 328–331
Sharma, E., Chettri, N., and Oli, K.P. (2010). ‘Mountain biodiversity conservation and management: a paradigm shift in policies and practices in the Hindu Kush-Himalayas’. Ecological Research, 25, 905–923
Uddin, K., Shrestha, H. L., Murthy, M. S. R., Bajracharya, B., Shrestha, B., Gilani, H., Pradhan, S., and Dangol, B. (2015). ‘Development of 2010 national land cover database for the Nepal’ . Journal of environmental
management, 148, 82-90.
Zurick, D. (2006). ‘Gross National Happiness and environmental status in Bhutan’. Geographical Review, 96(4), 657–681

28
Annex 1: Household Survey Questionnaire
Community Assessment of Ecosystem Services: Household Survey QuestionnaireKuzuzangpola,
We are conducting an ecosystem services assessment survey in your community. The purpose is to assess the status of ecosystems and their services and we request you to take part in the household survey. If you agree to take part in the survey, we would like to ask you some questions, which will take around an hour. The questions that you answer are completely your views and perceptions; there are no any right or wrong answers as such. The information, opinion, and knowledge you provide will be helpful for us to come up with a detailed assessment of ecosystem services in this community. Your responses will remain completely anonymous and only the aggregated results will be published in the report and in papers.
Would you like to take part in this interview? Yes No
If the respondent decides not to take part in the interview, please thank the respondent in a polite way then proceed to the next household.
Thank you
Basic information
a Date (dd/mm/yy): h Household code:
b Name of interviewer: i Name of respondent:
c Name of country: j Sex: 1 Male 2 Female
d District/gewog k Age:
e Village: l Caste / tribe:
f Chiwog: m Contact number:
g GPS data: Latitude: Longitude: Altitude:
Demographic information Please use the following codes: * 0= Male; 1= Female ** Marital status: 0= Single; 1= Married; 2= Divorced/widowed *** 0= No; 1= Yes **** 1 = Farming; 2 = Household activity; 3 = Wage labour; 4 = Petty business (specify); 5= Salaried employee; 6 = Studying; 7 = Remittances; 8= Infant; 0 = Other (specify)
No. Name of HHs members
Age (years)
Sex* Marital status**
Can read and write***
If yes, level of education (years of schooling)
Occupation / main activity****
Remarks
1st 2nd
1
2
3
4
5
Note: Start with household head first, then spouse and other member (members who stayed outside the village for more than 6 months can be excluded)
Does your household have access to any agricultural land? 0 No 1 Yes

29
If yes, provide the following information:
Land type Total area (local area) Remarks
Total owned
Self-cultivated
Uncultivated Rented in
Rented out
Irrigated terraces (wetland)
Rainfed terraces (dry land)
Other types (private forest)
Orchard
What are the major crops grown and their area coverage?
Major crops Area under crop (in local unit)
Does your household have any livestock? 0 No 1 Yes
If yes (Please use given codes: *1= Stall feeding, 2= Grazing, 3= Both
Type Present number
Number in the past 5 years
Way of feeding*
Average income from animal and animal products/annum (in BTN)
Remarks (if both, rate number of months against each category)
Sheep
Goats
Cows/bulls
Buffalo
Donkeys/mules
Pigs
Poultry
Other (specify):
How much money (cash income in local currency) in gross does your household earn per year? Please tick one of the following
Less than 20,000 Between 21,000–49,000 Between 50,000–99,000 More than 100,000
What are the major sources of drinking water? And volume collected/used per day?
Sources of water Local unit/litres
Piped water
Stream /river
Spring
Bore hole/well
Pond/dam
Wetland
Lake
Other (please specify)

30
State of ecosystems and servicesWhat are the major ecosystems/land use in terms of coverage in the study area and how important are they in providing ecosystem goods and services? (Please use given codes: * 4= very important, 3= important, 2= moderately important, 1= less important, 0 = not important
**4= highly dependent, 3= dependent, 2= moderately dependent, 1= less dependent, 0 = not dependent)
Major ecosystems Rank in terms of their importance to provide services *
Rank in terms of the dependency on the services **
Remarks/reasons
Forest
Agriculture land
Grassland/rangeland
Shrubland
Freshwater (river/stream)
Wetland
Settlements
Degraded or bareland
Others (specify)
Has there been any change in these ecosystems/ land use in terms of their area over the last 10 years? (*Please use given codes: 0= No change; 1= Increasing; 2= Decreasing, 3= No idea)
Major ecosystems Change* Reasons for change (change in hectare/acre/or local units; specify)
Forest
Agriculture land
Grassland/rangeland
Shrubland
Freshwater (river/stream)
Wetland
Settlements
Degraded or bareland
Other (specify)(Only forest, agriculture land and freshwater ecosystems were selected for this assessment)
Information on ecosystem services, sources and their statusWhat are the major ecosystem services provided by these ecosystems? (Please use the following code: 0= No; 1= Yes)
Ecosystem services
(Provisioning)
Major ecosystems Remarks
Fore
st
Agric
ultu
re
Gra
ssla
nd
Shru
blan
d
Fres
hwat
er
Settl
emen
t
Deg
rade
d la
nd
Oth
er
Fuelwood
Fodder
Grazing
Timber/poles
Leaf litter

31
Medicinal plants
Ornamental plants
Wild edible fruits and vegetables
Mushrooms
Fibre
Thatch
Bush meat
Dyes
Paddy
Cereals
Vegetables
Fish
Drinking water
Water for bathing
Water for irrigation
Boulders
Sand
Other (specify)
Other (specify)
What are the major ecosystem services provided by these ecosystems? (Please use the following code: 0= No; 1= Yes)
Ecosystem services
(regulating)
Major ecosystems
Remarks
Fore
st
Agric
ultu
re
Gra
ssla
nd
Shru
blan
d
Fres
hwat
er
Settl
emen
t
Deg
rade
d la
nd
Oth
er
Carbon sequestration
Climate regulation
Erosion/flood control
Groundwater recharge
Nutrient enrichment
Pest regulation
Pollination
Seed dispersal
Soil fertility
Soil formation
Soil stability
Waste treatment
Water purification
Water retention
Other (specify)
What are the major ecosystem services provided by these ecosystems? (Please use the following code: 0= No; 1= Yes)

32
Ecosystem services
(supporting)
Major ecosystems
Remarks
Fore
st
Agric
ultu
re
Gra
ssla
nd
Shru
blan
d
Fres
hwat
er
Settl
emen
t
Deg
rade
d la
nd
Oth
er
Ecosystem resilience
Habitat for species
Hydrologic cycle
Soil formation
Other (specify)
What are the major ecosystem services provided by these ecosystems? (Please use the following code: 0= No; 1= Yes)
Ecosystem services
(cultural)
Major ecosystems
Remarks
Fore
st
Agric
ultu
re
Gra
ssla
nd
Shru
blan
d
Fres
hwat
er
Settl
emen
t
Deg
rade
d la
nd
Oth
er
Aesthetic beauty
Ecotourism
Education & research
Recreation
Nature worships
Spiritual enrichment
Other (specify)
Information on ecosystem services use and market valuesWhat are the five most important provisional services contributing to economic wellbeing of your household?
(Please use the following code: *Collected by: 0= Male; 1=Female; 2= Both **Frequency: 1= daily; 2= weekly, 3= Monthly; 4= Once in 6 months; 5= Once a year
Services Mainly collected by*
Frequency** Quantity in local unit
Season Time required (hours) per collection
Remarks
Estimating value according to local people’s willingness to pay for key ecosystem function and services
Let us assume your ecosystems are fully managed by a committee of people from your community to ensure that there will be assured/improved provision of ecosystem services such as fuelwood, fodder, water etc. to your community and you would like to use the services from the system. In that case are you willing to pay either in cash or kind (i.e., labour days contribution per year) for the services you use? This will help the committee to operate /maintain healthy ecosystem. We would like you to answer these questions at your ease; there are no any wrong or right answers.
(*, **: Please use the following code: 0= No; 1= Yes; 2= Don’t know)

33
If you do not want to pay, what is/are the reason/(s)?
I do not think it is important to preserve the ecosystems
These are the free resources from the nature why should I pay
I cannot afford to give money to preserve the ecosystems
Preserving ecosystems has value to me, but it is not for me to finance preservation
Other (Please specify) ……………………………………………………………………………………………………………………..
If you are asked to pay/contribute, why did you decide to make a maximum BTN _______ per year (in kind or cash)?
(Here we can pose question like: If you are ask to contribute, how much you will contribute both in terms of cash or kind? (in kind we can mention labour days contribution/year)
This is the value that I attribute to the particular ecosystem service
This is the maximum amount that I can afford to give
This is the amount I normally pay for good causes
I chose this amount at random
Other (Specify) ……………………………………………………………………………………………………….
Who do you think should manage the fund generated for managing healthy ecosystem?
Local community
Government
User committee
Gewog administration
Others (please specify)
Information on ecosystem services and their socio-cultural and ecological values
Note: Socially important (important for subsistence livelihood); culturally important (important in tradition and culture such as sacred plant, animal, river, sacred groves); ecologically important (species or ecosystems that people think important for ecological balance and resilience)
Are there any species that are socio-culturally and ecologically valuable? (List five most important species only)
(Please use the codes: 4= Very important, 3= Important, 2= Moderately important, 1= Less important, 0 = Not important)
Socially important
Culturally important
Ecologically important
Indicate the reason
Plant species
Animal species

34
Ecosystems
Sacred sites
Others
Vulnerability contextCrisis, shocks, security
Number of months per year in which the household can live from own food production:
< 3 months
4–6 moths
7–9 months
10–12 months
> 12 months
Most difficult months to provide adequate food for the household:
1 JAN 2 FEB 3 MAR 4 APR 5 MAY 6 JUN 7 JUL 8 AUG 9 SEP 10 OCT 11 NOV 12 DEC
How did you cope during the difficult months?
Coping strategy: 1 = Taking loan 2 = Grain loan from kin 3 = Adjustment to meals 4 = Cash or cereal loan from merchants 5 = Farmland mortgage out 6 = Farmland leased out 7 = Sold household assets 8 = Sold animals 9 = Sold jewellery 10 = Sold farmland 11 = Occupation change 12 = Temporary labour migration 13 = Permanent labour migration 14 = Begging 15 = Free support by any organization 16 = Free support by family/kin/neighbours/community 17 = Other (specify))
What kind of crises have you experienced during the past 12 months and how did you cope with it?
(Please use the codes: 0 = No problem, 1=Minor problem, 2= Major problem;
Coping strategy: 1 = Taking loan 2 = Grain loan from kin 3 = Adjustment to meals 4 = Cash or cereal loan from merchants 5 = Farmland mortgage out 6 = Farmland leased out 7 = Sold household assets 8 = Sold animals 9 = Sold jewellery 10 = Sold farmland 11 = Occupation change 12 = Temporary labour migration 13 = Permanent labour migration 14 = Begging 15 = Free support by any organization 16 = Free support by family/kin/neighbours/community 17 = Other (specify)

35
Crisis Problem* Coping strategy
Remarks
a. Poor production (specify): ……..........………………………
b. Shortage of food
c. Illness/accident of a household member
d. Death of a household member
e. Arrest of household member
f. Loss of job
g. Irregular remittance
h. Market fluctuation/inflation
i. Loss of land
j. Loss of livestock
k. Damage, specify: ……………………………………………
l. Degradation of natural ecosystem
m. Political crisis/insecurity, specify: ……………………………
n. Other, specify: ....……………………………………………
Long-term changesConsidering the last ten years – what has changed in regard to: (Please use the codes: 0= No change; 1= Improved/ Increased/ Better/ Higher; 2=Worsened/ Declined/ Smaller/ Lower)
Area Quality of change Remarks
a Frequency of illness
b Health facilities
c Purchasing power
d Possibilities to generate income (locally)
e Possibilities to generate income (remittances)
f School facilities
g Quality of public services
h Access to forest
i Forest cover
j Soil fertility
k Food security
l Veterinary facilities
m Family size
n Security
o Communication, access to relevant information
p Transportation
q Access to credits
r Water availability
s Water quality
t Irrigation facilities
u Participation in decision-making
v Other (specify)

36
GeneralAre there any ecosystem management related activities carried out to support the livelihood enhancement in your areas?
Has the livelihood of your household improved through ecosystem management compared to the situation 10 years ago?
0 No 1 Yes
0 No 1 Yes
What activities would be most helpful to improve the livelihood of your household?
Possibility to come back in order to clarify some points: 0 No 1 Yes
THANK YOU

37

38
© ICIMOD 2017International Centre for Integrated Mountain Development
GPO Box 3226, Kathmandu, NepalTel +977 1 5003222 Fax +977 1 5003299Email [email protected] Web www.icimod.org
ISBN 978 92 9115 477 7Himalica is funded by the European Union