CHAPTER 54 ECOSYSTEMS Copyright © 2002 Pearson Education, Inc., publishing as Benjamin Cummings Section A: The Ecosystem Approach to Ecology 1. Trophic relationships determine the routes of energy flows and chemical cycling in an ecosystem 2. Decomposition connects all trophic levels 3. The laws of physics and chemistry apply to ecosystems

Welcome message from author
This document is posted to help you gain knowledge. Please leave a comment to let me know what you think about it! Share it to your friends and learn new things together.
Transcript
CHAPTER 54
ECOSYSTEMS
Copyright © 2002 Pearson Education, Inc., publishing as Benjamin Cummings
Section A: The Ecosystem Approach to Ecology
1. Trophic relationships determine the routes of energy flows and chemical
cycling in an ecosystem
2. Decomposition connects all trophic levels
3. The laws of physics and chemistry apply to ecosystems

• An ecosystem consists of all the organisms living in a
community as well as all the abiotic factors with which
they interact.
• The dynamics of an ecosystem involve two processes:
energy flow and chemical cycling.
• Ecosystem ecologists view ecosystems as energy
machines and matter processors.
• We can follow the transformation of energy by
grouping the species in a community into trophic
levels of feeding relationships.
Introduction
Copyright © 2002 Pearson Education, Inc., publishing as Benjamin Cummings

• The autotrophs are the primary producers, and are
usually photosynthetic (plants or algae).
• They use light energy to synthesize sugars and other
organic compounds.
1. Trophic relationships determine the
routes of energy flow and chemical cycling
in an ecosystem
Copyright © 2002 Pearson Education, Inc., publishing as Benjamin Cummings
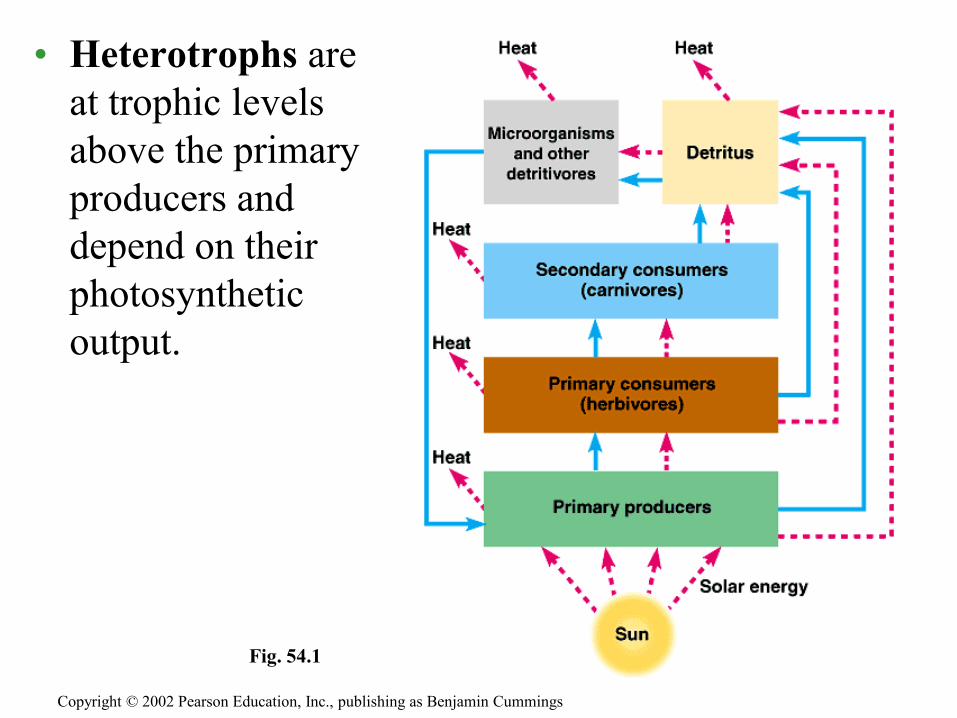
• Heterotrophs are
at trophic levels
above the primary
producers and
depend on their
photosynthetic
output.
Copyright © 2002 Pearson Education, Inc., publishing as Benjamin Cummings
Fig. 54.1
• Herbivores that eat primary producers are called primary
consumers.
• Carnivores that eat herbivores are called secondary
consumers.
• Carnivores that eat secondary producers are called
tertiary consumers.
• Another important group of heterotrophs is the
detritivores, or decomposers.
• They get energy from detritus, nonliving organic
material, and play an important role in material cycling.
Copyright © 2002 Pearson Education, Inc., publishing as Benjamin Cummings
• The organisms that feed as detritivores often form a
major link between the primary producers and the
consumers in an ecosystem.
• The organic material that makes up the living
organisms in an ecosystem gets recycled.
2. Decomposition connects all trophic levels
Copyright © 2002 Pearson Education, Inc., publishing as Benjamin Cummings
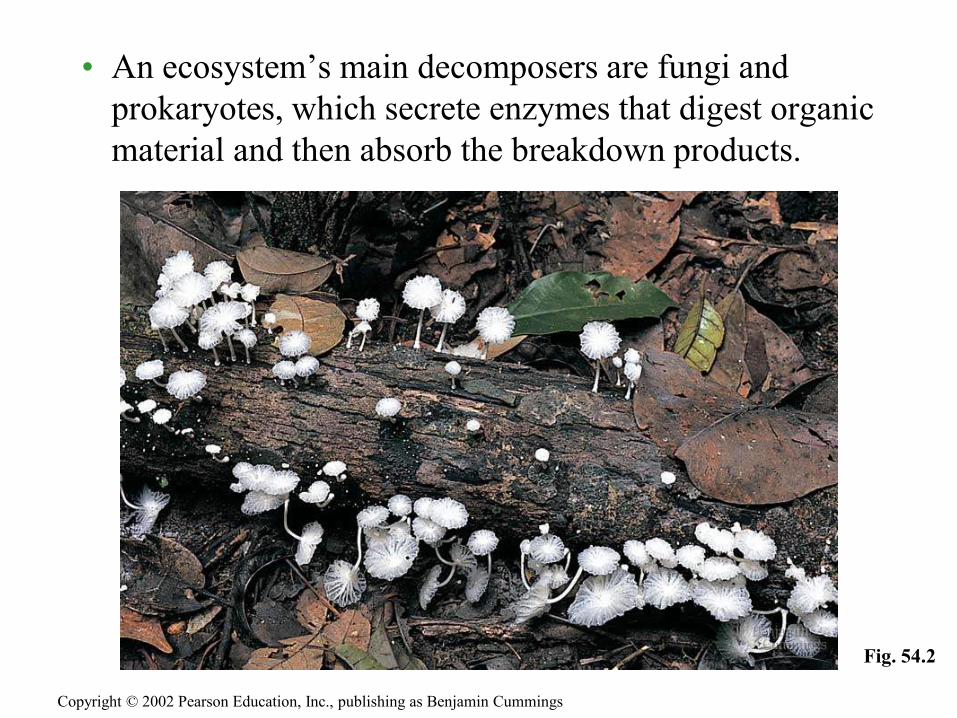
• An ecosystem’s main decomposers are fungi and
prokaryotes, which secrete enzymes that digest organic
material and then absorb the breakdown products.
Copyright © 2002 Pearson Education, Inc., publishing as Benjamin Cummings
Fig. 54.2
• The law of conservation of energy applies to
ecosystems.
• We can potentially trace all the energy from its solar input
to its release as heat by organisms.
• The second law of thermodynamics allows us to
measure the efficiency of the energy conversions.
3. The laws of physics and chemistry apply
to ecosystems
Copyright © 2002 Pearson Education, Inc., publishing as Benjamin Cummings
CHAPTER 54
ECOSYSTEMS
Copyright © 2002 Pearson Education, Inc., publishing as Benjamin Cummings
Section B: Primary Production in Ecosystems
1. An ecosystem’s energy budget depends on primary production
2. In aquatic ecosystems, light and nutrients limit primary production
3. In terrestrial ecosystems, temperature, moisture, and nutrients limit
primary production

• The amount of light energy converted to chemical
energy by an ecosystem’s autotrophs in a given time
period is called primary production.
Introduction
Copyright © 2002 Pearson Education, Inc., publishing as Benjamin Cummings
• Most primary producers use light energy to
synthesize organic molecules, which can be broken
down to produce ATP; there is an energy budget in
an ecosystem.
1. An ecosystem’s energy budget depends
on primary production
Copyright © 2002 Pearson Education, Inc., publishing as Benjamin Cummings

• The Global Energy Budget
• Every day, Earth is bombarded by large amounts of solar radiation.
• Much of this radiation lands on water and land that either reflect or absorb it.
• Of the visible light that reaches photosynthetic organisms, only about 1% is converted to chemical energy.
• Although this is a small amount, primary producers are capable of producing about 170 billion tons of organic material per year.
Copyright © 2002 Pearson Education, Inc., publishing as Benjamin Cummings

• Gross and Net Primary Production.
• Total primary production is known as gross primary
production (GPP).
• This is the amount of light energy that is converted into
chemical energy.
• The net primary production (NPP) is equal to gross
primary production minus the energy used by the primary
producers for respiration (R):
• NPP = GPP –R
Copyright © 2002 Pearson Education, Inc., publishing as Benjamin Cummings

• Primary production can be expressed in terms of energy
per unit area per unit time, or as biomass of vegetation
added to the ecosystem per unit area per unit time.
• This should not be confused with the total biomass of
photosynthetic autotrophs present in a given time,
called the standing crop.
Copyright © 2002 Pearson Education, Inc., publishing as Benjamin Cummings

• Different ecosystems differ greatly in their production as
well as in their contribution to the total production of the
Earth.
Copyright © 2002 Pearson Education, Inc., publishing as Benjamin Cummings
Fig. 54.3
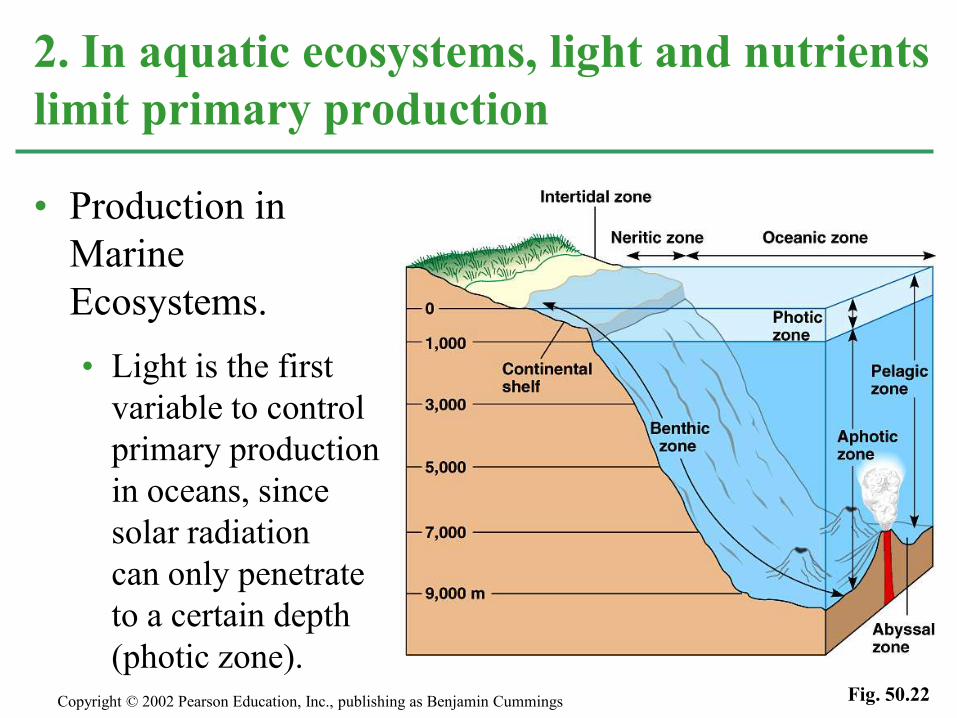
• Production in
Marine
Ecosystems.
• Light is the first
variable to control
primary production
in oceans, since
solar radiation
can only penetrate
to a certain depth
(photic zone).
2. In aquatic ecosystems, light and nutrients
limit primary production
Copyright © 2002 Pearson Education, Inc., publishing as Benjamin Cummings Fig. 50.22
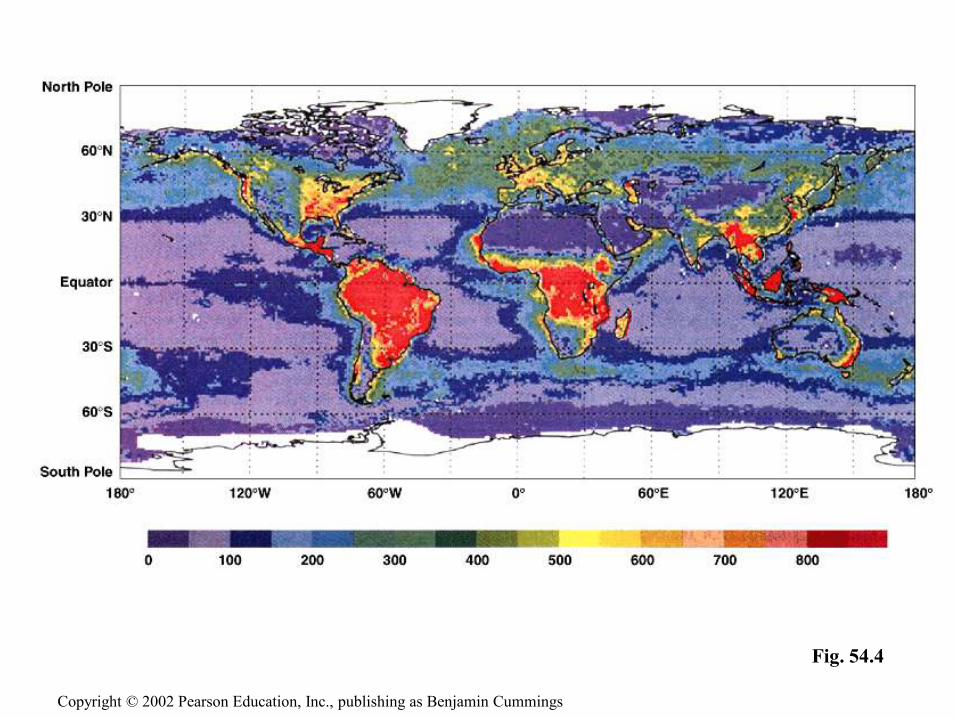
• We would expect production to increase along a gradient
from the poles to the equator, but that is not the case.
• There are parts of the ocean in the tropics and
subtropics that exhibit low primary production.
Copyright © 2002 Pearson Education, Inc., publishing as Benjamin Cummings
Copyright © 2002 Pearson Education, Inc., publishing as Benjamin Cummings
Fig. 54.4

• Why are tropical and subtropical oceans less productive
than we would expect?
• It depends on nutrient availability.
• Ecologists use the term limiting nutrient to define
the nutrient that must be added for production to
increase.
Copyright © 2002 Pearson Education, Inc., publishing as Benjamin Cummings
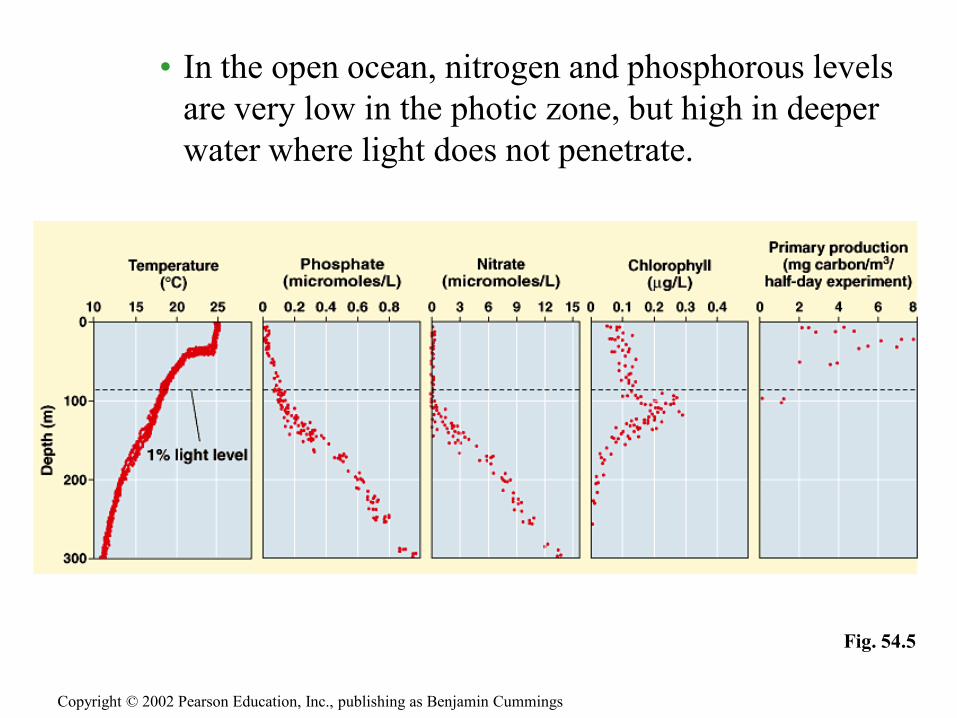
• In the open ocean, nitrogen and phosphorous levels
are very low in the photic zone, but high in deeper
water where light does not penetrate.
Copyright © 2002 Pearson Education, Inc., publishing as Benjamin Cummings
Fig. 54.5

• Nitrogen is the one nutrient that limits phytoplankton
growth in many parts of the ocean.
Copyright © 2002 Pearson Education, Inc., publishing as Benjamin CummingsFig. 54.6

• Production in Freshwater Ecosystems.
• Solar radiation and temperature are closely linked to
primary production in freshwater lakes.
• During the 1970s, sewage and fertilizer pollution added
nutrients to lakes, which shifted many lakes from having
phytoplankton communities to those dominated by
diatoms and green algae.
Copyright © 2002 Pearson Education, Inc., publishing as Benjamin Cummings
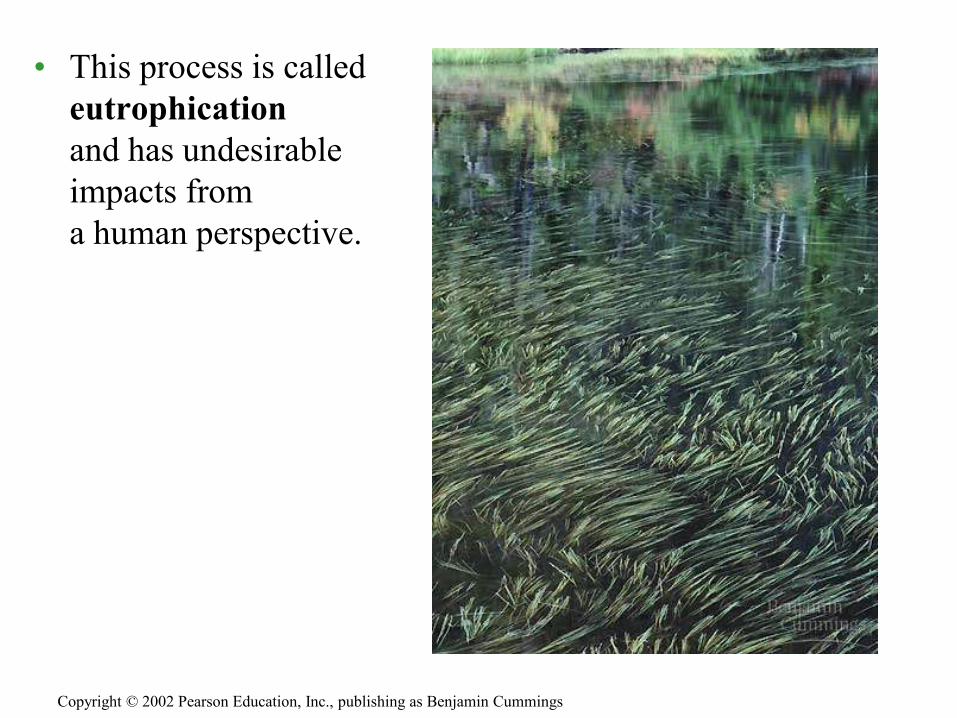
• This process is called
eutrophication
and has undesirable
impacts from
a human perspective.
Copyright © 2002 Pearson Education, Inc., publishing as Benjamin Cummings
• Obviously, water availability varies among terrestrial
ecosystems more than aquatic ones.
• On a large geographic scale, temperature and moisture are
the key factors controlling primary production in
ecosystems.
3. In terrestrial ecosystems, temperature,
moisture, and nutrients limit primary
production
Copyright © 2002 Pearson Education, Inc., publishing as Benjamin Cummings
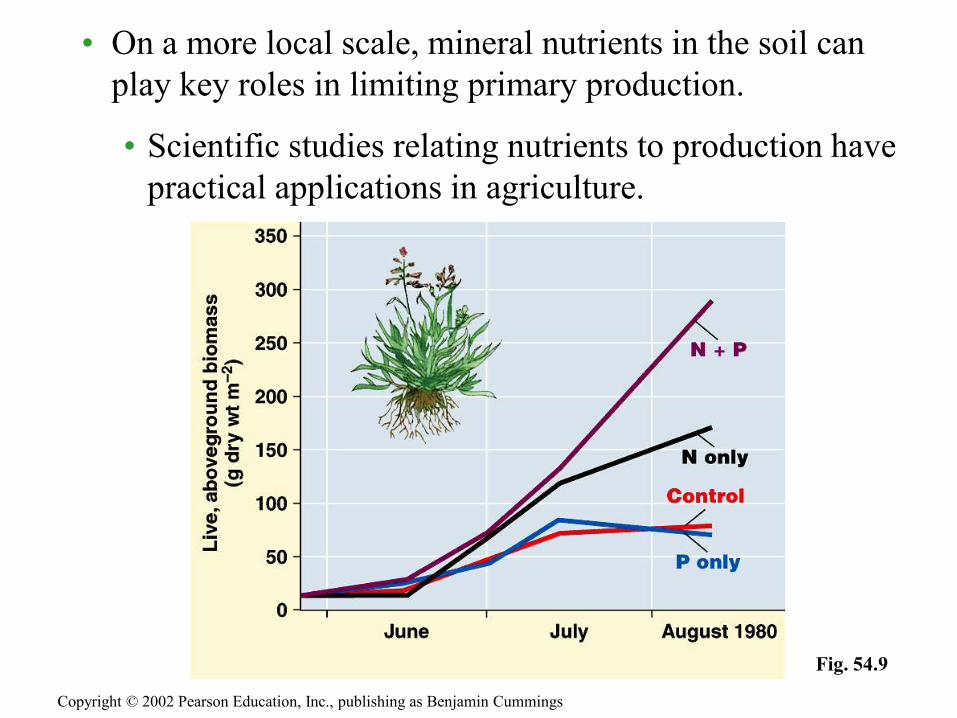
• On a more local scale, mineral nutrients in the soil can
play key roles in limiting primary production.
• Scientific studies relating nutrients to production have
practical applications in agriculture.
Copyright © 2002 Pearson Education, Inc., publishing as Benjamin Cummings
Fig. 54.9
CHAPTER 54
ECOSYSTEMS
Copyright © 2002 Pearson Education, Inc., publishing as Benjamin Cummings
Section C: Secondary Production in Ecosystems
1. The efficiency of energy transfer between trophic levels is usually less
than 20%
2. Herbivores consume a small percentage of vegetation: the green world
hypothesis

• The amount of chemical energy in consumers’ food
that is converted to their own new biomass during a
given time period is called secondary production.
Introduction
Copyright © 2002 Pearson Education, Inc., publishing as Benjamin Cummings

• Production Efficiency.
• One way to under-
stand secondary
production is to
examine the
process in
individual
organisms.
1. The efficiency of energy transfer between
trophic levels is usually less than 20%
Copyright © 2002 Pearson Education, Inc., publishing as Benjamin Cummings
Fig. 54.10
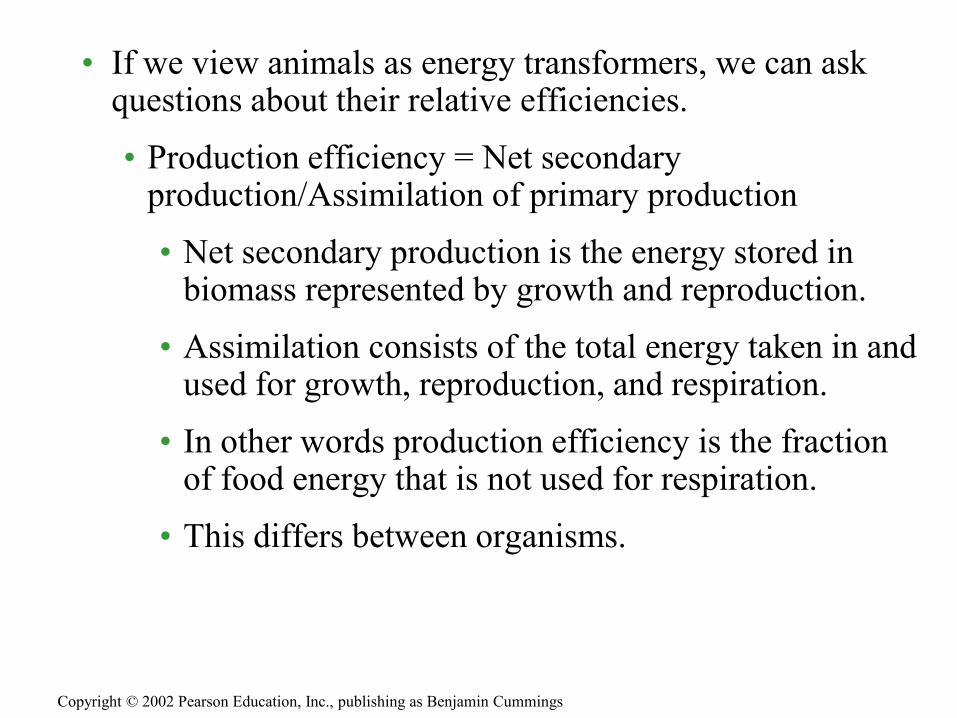
• If we view animals as energy transformers, we can ask questions about their relative efficiencies.
• Production efficiency = Net secondary production/Assimilation of primary production
• Net secondary production is the energy stored in biomass represented by growth and reproduction.
• Assimilation consists of the total energy taken in and used for growth, reproduction, and respiration.
• In other words production efficiency is the fraction of food energy that is not used for respiration.
• This differs between organisms.
Copyright © 2002 Pearson Education, Inc., publishing as Benjamin Cummings
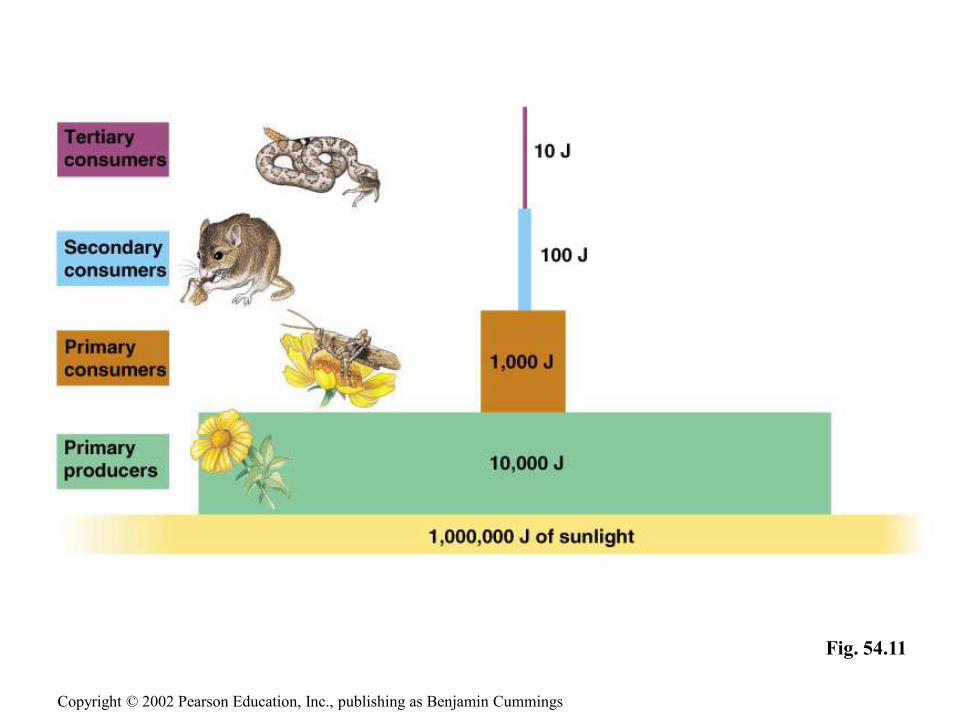
• Trophic Efficiency and Ecological Pyramids.
• Trophic efficiency is the percentage of production
transferred from one trophic level to the next.
• Pyramids of production represent the multiplicative
loss of energy from a food chain.
Copyright © 2002 Pearson Education, Inc., publishing as Benjamin Cummings
Copyright © 2002 Pearson Education, Inc., publishing as Benjamin Cummings
Fig. 54.11
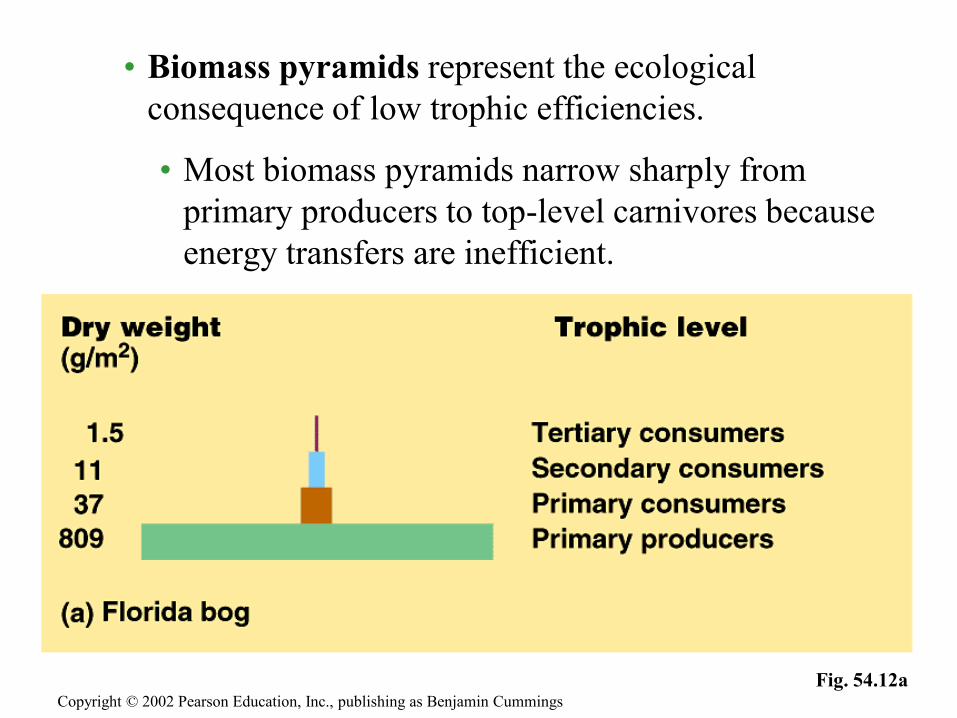
• Biomass pyramids represent the ecological
consequence of low trophic efficiencies.
• Most biomass pyramids narrow sharply from
primary producers to top-level carnivores because
energy transfers are inefficient.
Copyright © 2002 Pearson Education, Inc., publishing as Benjamin Cummings
Fig. 54.12a

• In some aquatic ecosystems, the pyramid is inverted.
• In this example, phytoplankta grow, reproduce, and are consumed rapidly.
• They have a short turnover time, which is a comparison of standing crop mass compared to production.
Copyright © 2002 Pearson Education, Inc., publishing as Benjamin Cummings
Fig. 54.12b

• Pyramids of numbers show how the levels in the
pyramids of biomass are proportional to the number of
individuals present in each trophic level.
Copyright © 2002 Pearson Education, Inc., publishing as Benjamin Cummings
Fig. 54.13

• According to the green world hypothesis,
herbivores consume relatively little plant biomass
because they are held in check by a variety of
factors.
• Plants have defenses against herbivores
• Nutrients, not energy supply, usually limit herbivores
• Abiotic factors limit herbivores
• Intraspecific competition can limit herbivore numbers
• Interspecific interactions check herbivore densities
2. Herbivores consume a small percentage
of vegetation: the green world hypothesis
Copyright © 2002 Pearson Education, Inc., publishing as Benjamin Cummings

CHAPTER 54
ECOSYSTEMS
Copyright © 2002 Pearson Education, Inc., publishing as Benjamin Cummings
Section D: The Cycling of Chemical Elements
in Ecosystems
1. Biological and geologic processes move nutrients between organic and
inorganic compartments
2. Decomposition rates largely determine the rates of nutrient cycling
3. Nutrient cycling is strongly regulated by vegetation
• Nutrient circuits involve both biotic and abiotic
components of ecosystems and are called
biogeochemical cycles.
Introduction
Copyright © 2002 Pearson Education, Inc., publishing as Benjamin Cummings

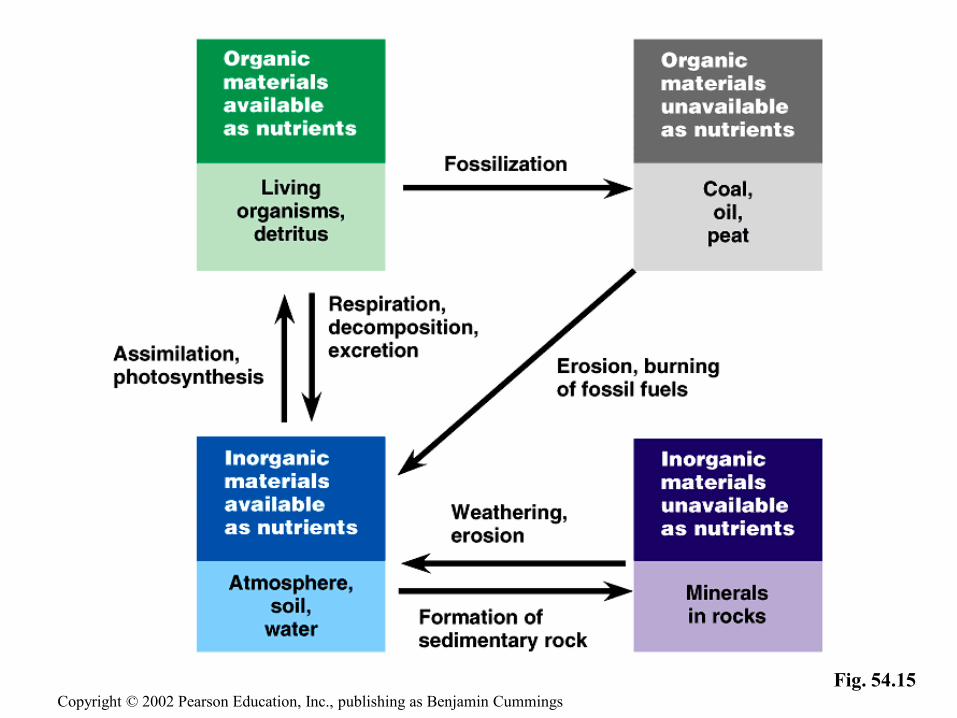
• A general model of chemical cycling.
• There are four main reservoirs of elements and processes
that transfer elements between reservoirs.
• A reservoirs is defined by two characteristics: whether
it contains organic or inorganic materials, and whether
or not the materials are directly usable by organisms.
1. Biological and geologic processes move
nutrients between organic and inorganic
compartments
Copyright © 2002 Pearson Education, Inc., publishing as Benjamin Cummings
Copyright © 2002 Pearson Education, Inc., publishing as Benjamin Cummings
Fig. 54.15

• The water cycle is more of a physical process than a
chemical one.
Copyright © 2002 Pearson Education, Inc., publishing as Benjamin CummingsFig. 54.16
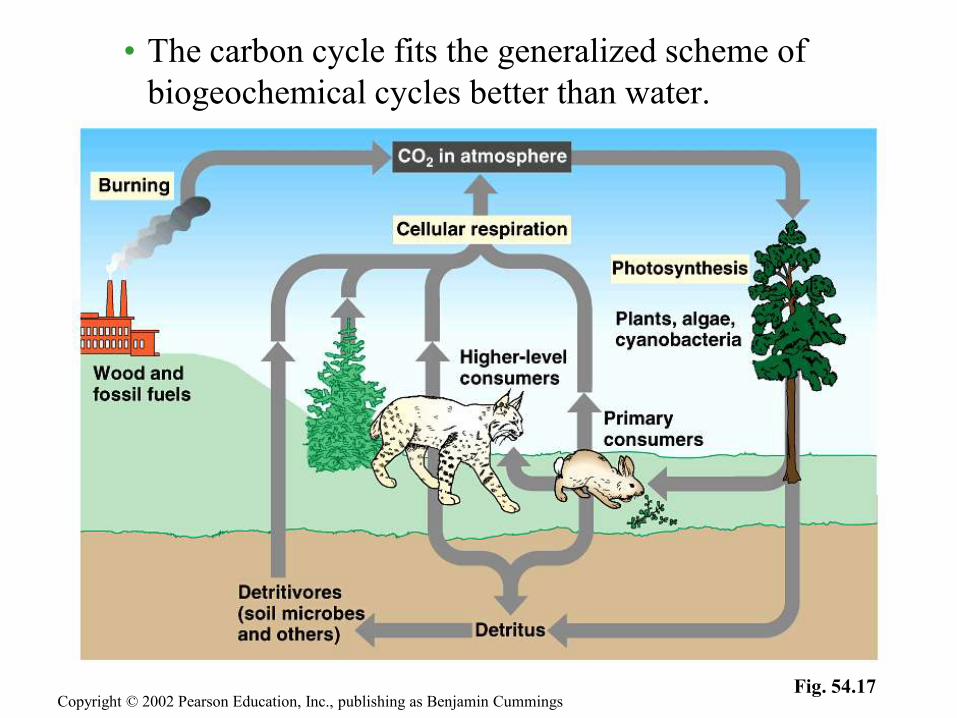
• The carbon cycle fits the generalized scheme of
biogeochemical cycles better than water.
Copyright © 2002 Pearson Education, Inc., publishing as Benjamin CummingsFig. 54.17

• The nitrogen cycle.
• Nitrogen enters ecosystems through two natural pathways.
• Atmospheric deposition, where usable nitrogen is added
to the soil by rain or dust.
• Nitrogen fixation, where certain prokaryotes convert
N2 to minerals that can be used to synthesize
nitrogenous organic compounds like amino acids.
Copyright © 2002 Pearson Education, Inc., publishing as Benjamin Cummings

Copyright © 2002 Pearson Education, Inc., publishing as Benjamin Cummings
Fig. 54.18
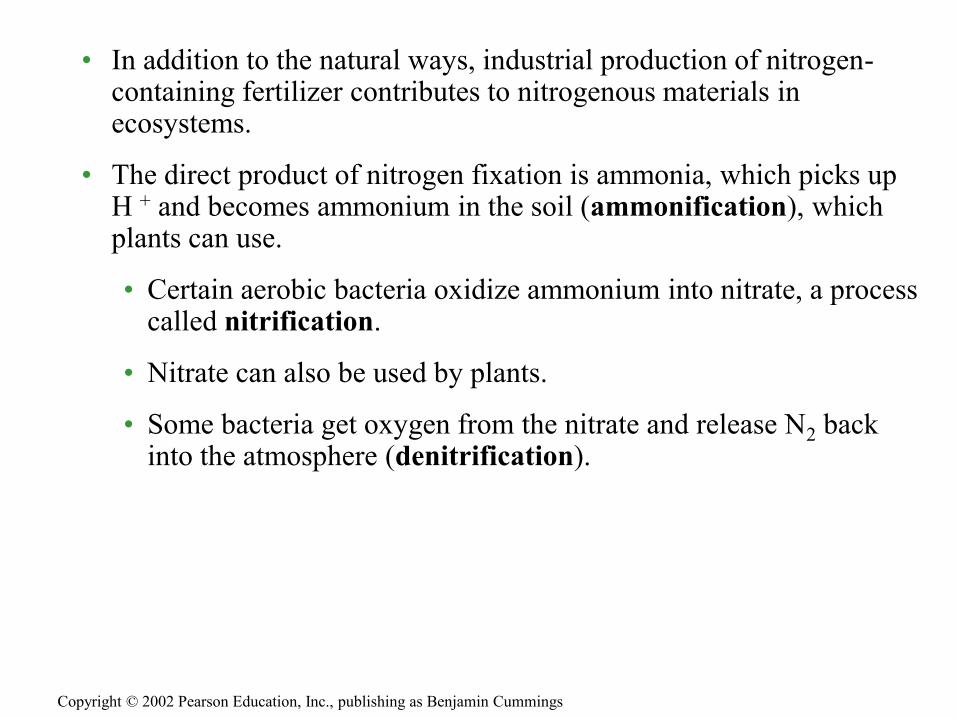
• In addition to the natural ways, industrial production of nitrogen-containing fertilizer contributes to nitrogenous materials in ecosystems.
• The direct product of nitrogen fixation is ammonia, which picks up H + and becomes ammonium in the soil (ammonification), which plants can use.
• Certain aerobic bacteria oxidize ammonium into nitrate, a process called nitrification.
• Nitrate can also be used by plants.
• Some bacteria get oxygen from the nitrate and release N2 back into the atmosphere (denitrification).
Copyright © 2002 Pearson Education, Inc., publishing as Benjamin Cummings
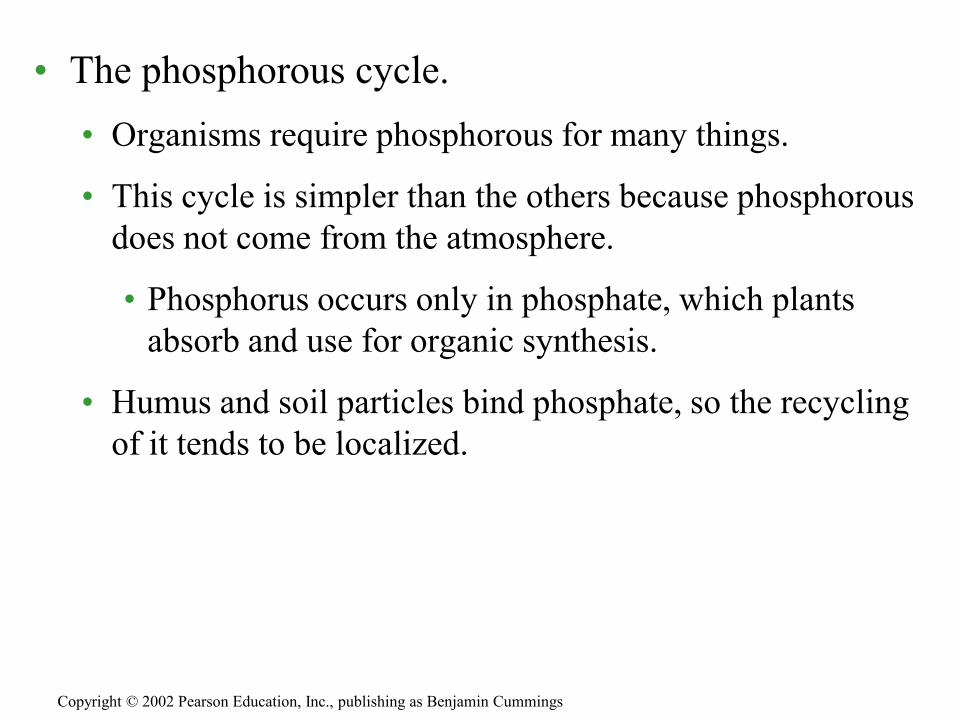
• The phosphorous cycle.
• Organisms require phosphorous for many things.
• This cycle is simpler than the others because phosphorous
does not come from the atmosphere.
• Phosphorus occurs only in phosphate, which plants
absorb and use for organic synthesis.
• Humus and soil particles bind phosphate, so the recycling
of it tends to be localized.
Copyright © 2002 Pearson Education, Inc., publishing as Benjamin Cummings

Copyright © 2002 Pearson Education, Inc., publishing as Benjamin Cummings
Fig. 54.19

• Figure 54.20 reviews
chemical cycling
in ecosystems.
Copyright © 2002 Pearson Education, Inc., publishing as Benjamin Cummings
Fig. 54.20
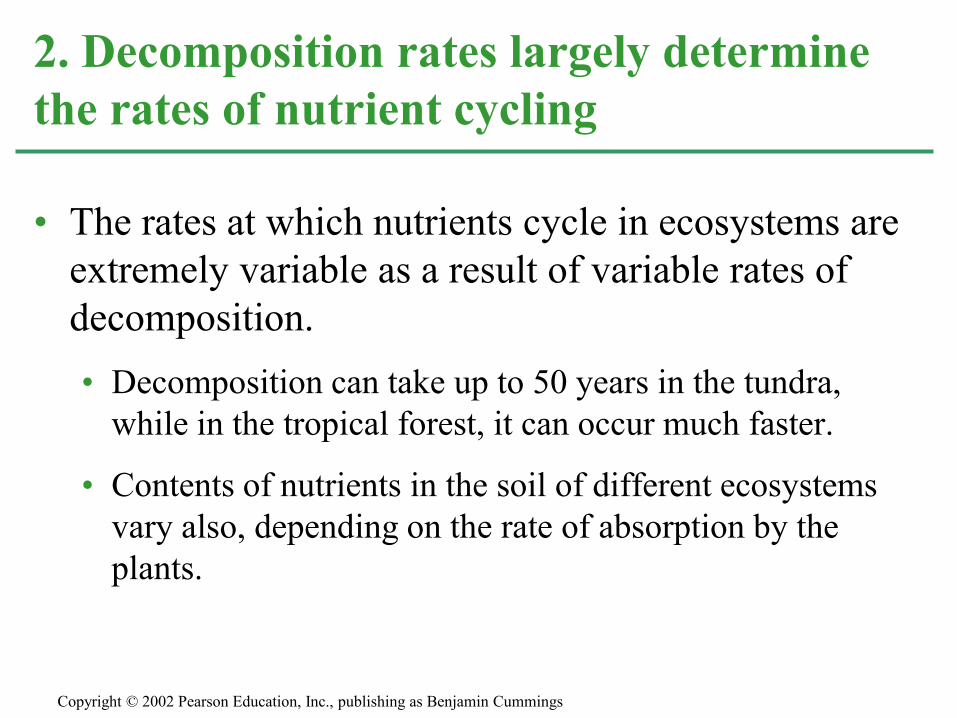
• The rates at which nutrients cycle in ecosystems are
extremely variable as a result of variable rates of
decomposition.
• Decomposition can take up to 50 years in the tundra,
while in the tropical forest, it can occur much faster.
• Contents of nutrients in the soil of different ecosystems
vary also, depending on the rate of absorption by the
plants.
2. Decomposition rates largely determine
the rates of nutrient cycling
Copyright © 2002 Pearson Education, Inc., publishing as Benjamin Cummings
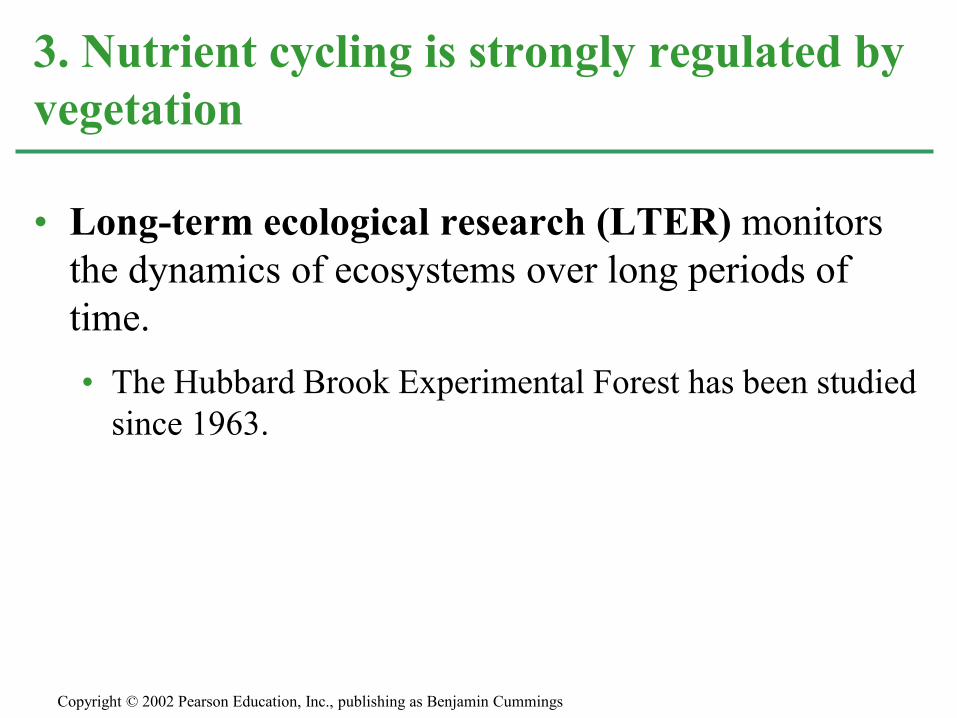
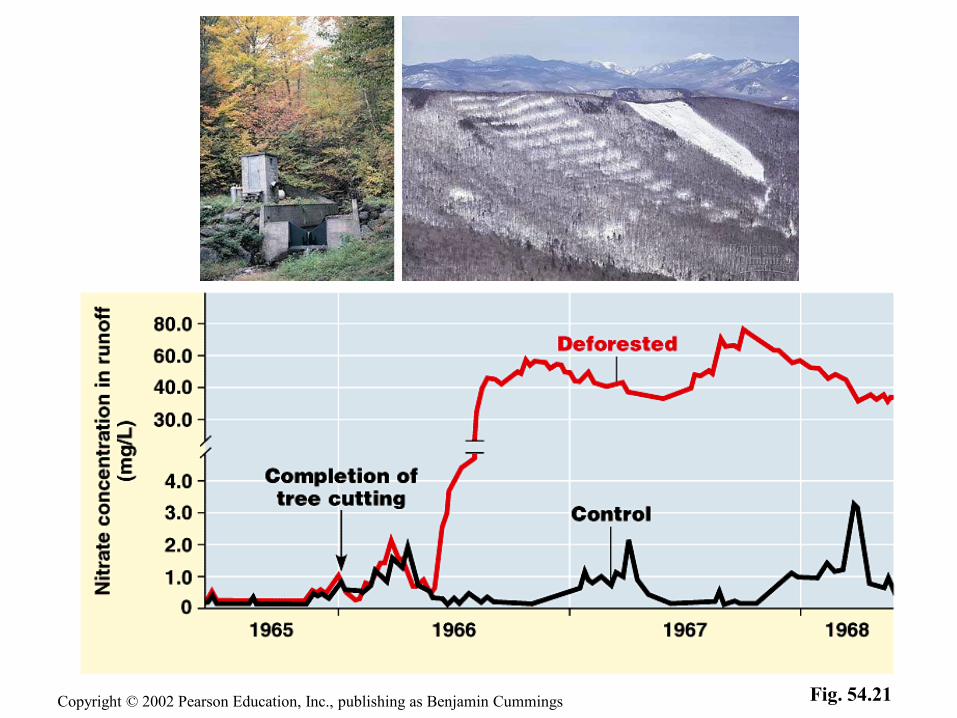
• Long-term ecological research (LTER) monitors
the dynamics of ecosystems over long periods of
time.
• The Hubbard Brook Experimental Forest has been studied
since 1963.
3. Nutrient cycling is strongly regulated by
vegetation
Copyright © 2002 Pearson Education, Inc., publishing as Benjamin Cummings
Copyright © 2002 Pearson Education, Inc., publishing as Benjamin Cummings Fig. 54.21

• Preliminary studies confirmed that internal cycling within
a terrestrial ecosystem conserves most of the mineral
nutrients.
• Some areas have been completely logged and then
sprayed with herbicides to study how removal of
vegetation affects the nutrient content of the soil.
• In addition to the natural ways, industrial production of
nitrogen-containing fertilizer contributes to nitrogenous
materials in ecosystems.
Copyright © 2002 Pearson Education, Inc., publishing as Benjamin Cummings
CHAPTER 54
ECOSYSTEMS
Copyright © 2002 Pearson Education, Inc., publishing as Benjamin Cummings
Section E: Human Impact on Ecosystems and
the Biosphere
1. The human population is disrupting chemical cycles throughout the
biosphere
2. Combustion of fossil fuels is the main cause of acid precipitation
3. Toxins can become concentrated in successive trophic levels of food webs
4. Human activities may be causing climate change by increasing carbon
dioxide concentration in the atmosphere
5. Human activities are depleting atmospheric ozone
• Human activity intrudes in nutrient cycles by
removing nutrients from one part of the biosphere
and then adding them to another.
• Agricultural effects of nutrient cycling.
1. The human population is disrupting
chemical cycles throughout the biosphere
Copyright © 2002 Pearson Education, Inc., publishing as Benjamin Cummings

• In agricultural ecosystems, a large amount of nutrients are
removed from the area in the crop biomass.
• After a while, the natural store of nutrients can become
exhausted.
Copyright © 2002 Pearson Education, Inc., publishing as Benjamin Cummings
Fig. 54.22
• Recent studies indicate that human activities have
approximately doubled the worldwide supply of fixed
nitrogen, due to the use of fertilizers, cultivation of
legumes, and burning.
• This may increase the amount of nitrogen oxides in the
atmosphere and contribute to atmospheric warming,
depletion of ozone, and possibly acid rain.
Copyright © 2002 Pearson Education, Inc., publishing as Benjamin Cummings
• Critical load and nutrient cycles.
• In some situations, the addition of nitrogen to ecosystems
by human activity can be beneficial, but in others it can
cause problems.
• The key issue is the critical load, the amount of added
nitrogen that can be absorbed by plants without damaging
the ecosystem.
Copyright © 2002 Pearson Education, Inc., publishing as Benjamin Cummings

• Accelerated eutrophication of lakes.
• Human intrusion has disrupted freshwater ecosystems by
what is called cultural eutrophication.
• Sewage and factory wastes and runoff of animal wastes
from pastures and stockyards have overloaded many
freshwater streams and lakes with nitrogen.
• This can eliminate fish species because it is difficult for
them to live in these new conditions.
Copyright © 2002 Pearson Education, Inc., publishing as Benjamin Cummings
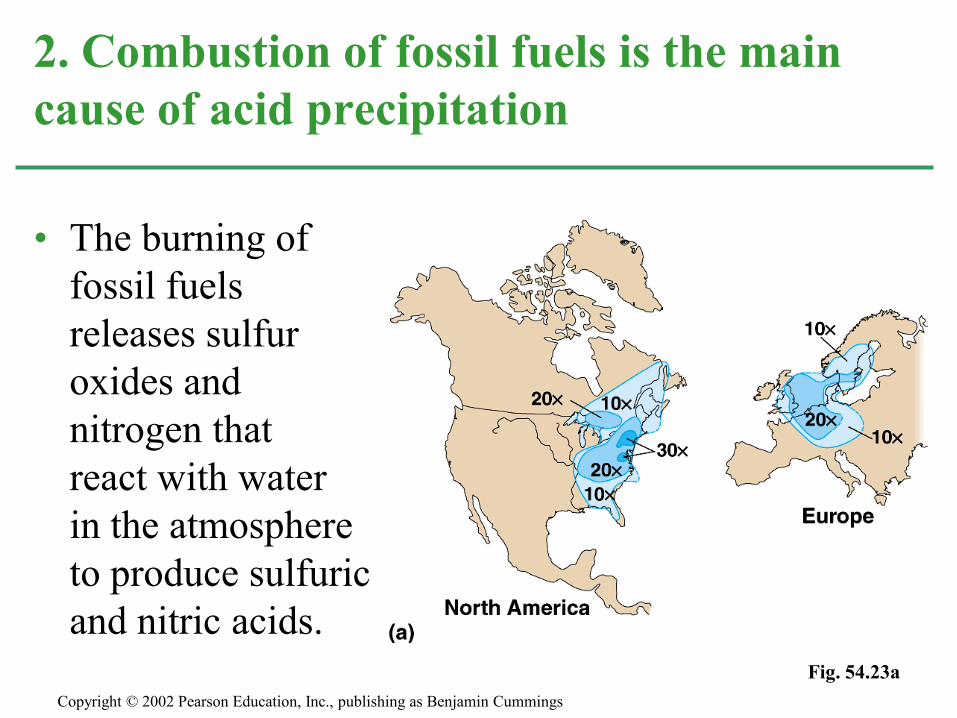
• The burning of
fossil fuels
releases sulfur
oxides and
nitrogen that
react with water
in the atmosphere
to produce sulfuric
and nitric acids.
2. Combustion of fossil fuels is the main
cause of acid precipitation
Copyright © 2002 Pearson Education, Inc., publishing as Benjamin Cummings
Fig. 54.23a

• These acids fall back to earth as acid precipitation, and
can damage ecosystems greatly.
• By changing the pH of the soil and water, the acids can
kill plants and aquatic organisms.
Copyright © 2002 Pearson Education, Inc., publishing as Benjamin Cummings Fig. 54.23b
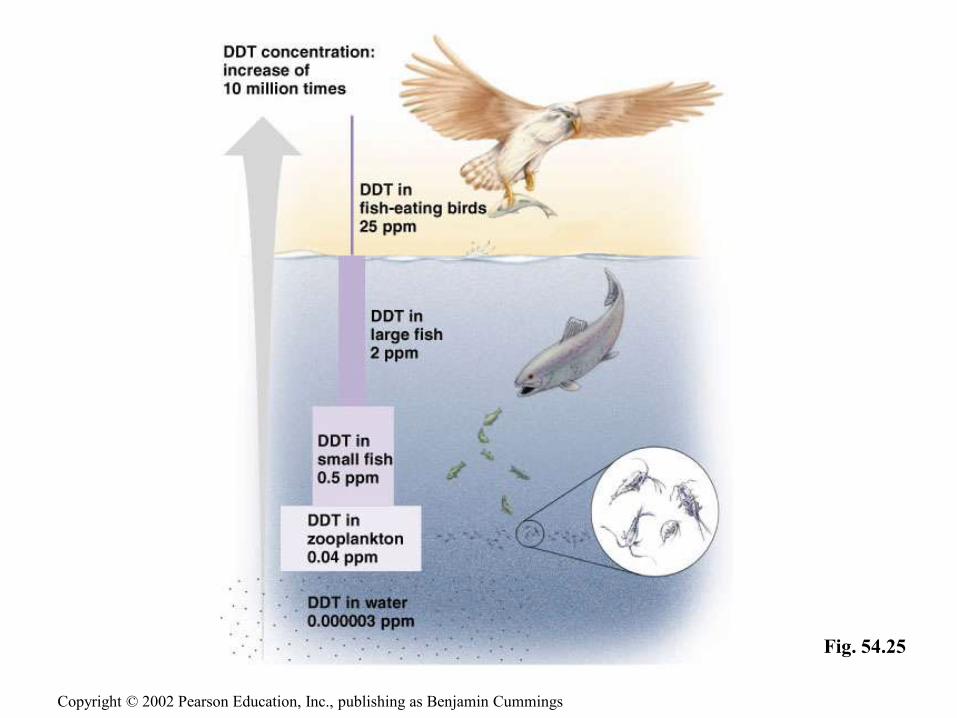
• Humans produce many toxic chemicals that are
dumped into ecosystems.
• These substances are ingested and metabolized by the
organisms in the ecosystems and can accumulate in the
fatty tissues of animals.
• These toxins become more concentrated in successive
trophic levels of a food web, a process called biological
magnification.
3. Toxins can become concentrated in
successive trophic levels of food webs
Copyright © 2002 Pearson Education, Inc., publishing as Benjamin Cummings

• The pesticide DDT, before it was banned, provided
an example of this effect.
Copyright © 2002 Pearson Education, Inc., publishing as Benjamin Cummings
Fig. 54.24
Copyright © 2002 Pearson Education, Inc., publishing as Benjamin Cummings
Fig. 54.25
• Rising atmospheric CO2.
• Since the Industrial Revolution, the concentration of CO2
in the atmosphere has increased greatly as a result of
burning fossil fuels.
4. Human activities may be causing climate
change by increasing carbon dioxide
concentration in the atmosphere
Copyright © 2002 Pearson Education, Inc., publishing as Benjamin Cummings

• Measurements
in 1958 read
316 ppm and
have increased
to 370 ppm
today.
Copyright © 2002 Pearson Education, Inc., publishing as Benjamin Cummings
Fig. 54.26

• The greenhouse effect.
• Rising levels of atmospheric CO2 may have an impact on
Earth’s heat budget.
• When light energy hits the Earth, much of it is reflected
off the surface.
• CO2 causes the Earth to retain some of the energy that
would ordinarily escape the atmosphere.
• This phenomenon is called the greenhouse effect.
• The Earth needs this heat, but too much could be
disastrous.
Copyright © 2002 Pearson Education, Inc., publishing as Benjamin Cummings
• Global warming.
• Scientists continue to construct models to predict how
increasing levels of CO2 in the atmosphere will affect
Earth.
• Several studies predict a doubling of CO2 in the
atmosphere will cause a 2º C increase in the average
temperature of Earth.
• Rising temperatures could cause polar ice cap melting,
which could flood coastal areas.
• It is important that humans attempt to stabilize their use of
fossil fuels.
Copyright © 2002 Pearson Education, Inc., publishing as Benjamin Cummings

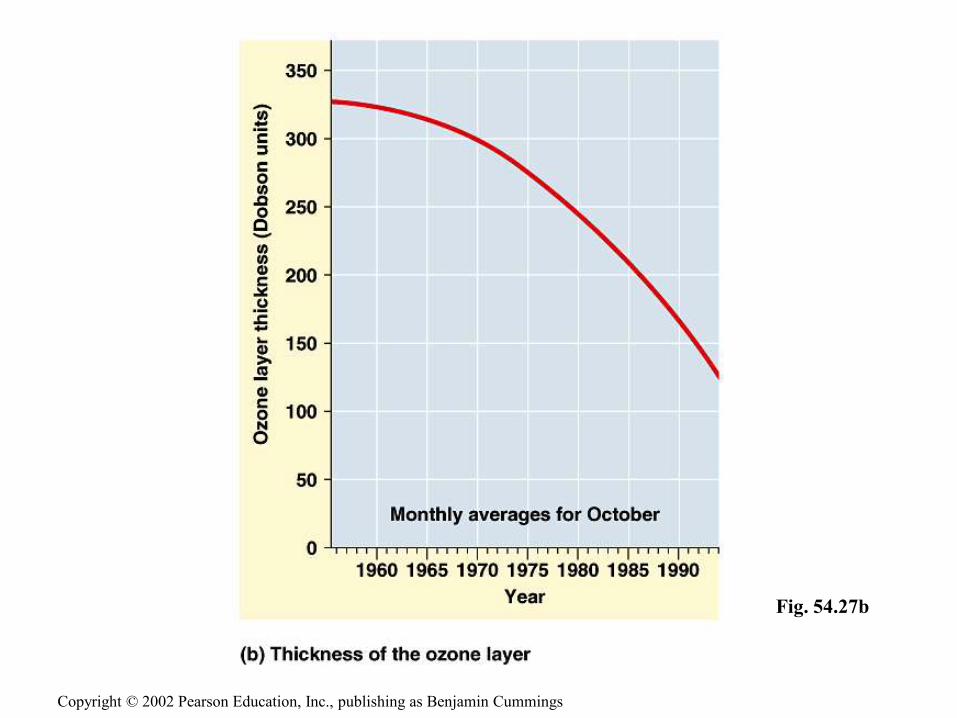
• Life on earth is protected from the damaging affects
of ultraviolet radiation
(UV) by a layer of O3,
or ozone.
• Studies suggest that
the ozone layer has
been gradually
“thinning” since 1975.
5. Human activities are depleting the
atmospheric ozone
Copyright © 2002 Pearson Education, Inc., publishing as Benjamin Cummings
Fig. 54.27a
Copyright © 2002 Pearson Education, Inc., publishing as Benjamin Cummings
Fig. 54.27b
• The destruction of ozone probably results from the
accumulation of chlorofluorocarbons, chemicals
used in refrigeration and aerosol cans, and in certain
manufacturing processes.
• The result of a reduction in the ozone layer may be
increased levels of UV radiation that reach the surface of
the Earth.
• This radiation has been linked to skin cancer and
cataracts.
• The impact of human activity on the ozone layer is
one more example of how much we are able to
disrupt ecosystems and the entire biosphere.
Copyright © 2002 Pearson Education, Inc., publishing as Benjamin Cummings
Related Documents