A Framework for Total Productivity Measurement of
Construction Projects Construction Owners Association of Alberta
NSERC IRC SCMD: Total Productivity Measurement/COAA/2018-TD01
February 20, 2018
PREPARED BY Selam Ayele, M.Eng.
Aminah Robinson Fayek, Ph.D., P.Eng.
i
Executive summary
Productivity measurement is a major concern for both construction practitioners and
researchers. In construction research, productivity can be measured at three levels:
activity, project, and industry levels. At the project level, previous studies focused on
measuring the productivity of specific activities. In addition, existing project-level
productivity metrics do not consider the impacts of all resources used in a project, a step
which is necessary to effectively assess overall project performance.
This study proposes a framework for measuring construction project productivity, which
takes into consideration all resources used in a project. This paper presents a reliable
metric to assess the total productivity of construction projects. In addition, the process for
identifying and measuring the components of the metric are discussed. The study began
with a review of the current productivity measurement metrics used in construction
research; findings from this literature review were them used to propose a metric to
assess the utilization of resources in construction projects. Next, a detailed list of
components required to quantify total productivity was outlined, and a focus group
discussion was conducted with industry experts to evaluate the appropriateness and
completeness of the metric and its components. In addition, the framework was verified
using a questionnaire. The developed framework can be used by researchers and
practitioners for data collection and analysis of total construction productivity.
ii
Table of contents
Executive summary .......................................................................................................... i
Table of contents ..............................................................................................................ii
List of tables ....................................................................................................................iv
List of figures ................................................................................................................... v
1. Introduction .............................................................................................................. 1
1.1 Background ........................................................................................................ 1
1.2 Research objectives ........................................................................................... 2
2. Literature review: Overview of productivity measures .............................................. 3
2.1 Productivity measurement methods ................................................................... 3
2.1.1 Single-factor productivity ............................................................................. 6
2.1.2 Total factor productivity (TFP) ................................................................... 10
2.2 Level of production system .............................................................................. 10
2.2.1 Measuring productivity at the Industry level ............................................... 11
2.2.2 Measuring productivity at the activity level................................................. 13
2.2.3 Measuring productivity at the project level ................................................. 14
2.3 Measurement of input ...................................................................................... 22
2.3.1 Labour input ............................................................................................... 22
2.3.2 Capital input ............................................................................................... 23
2.3.3 Intermediate inputs .................................................................................... 24
2.4 Measurement of output .................................................................................... 24
2.5 Summary .......................................................................................................... 27
3. Methodology .......................................................................................................... 29
4. Total productivity measurement framework ........................................................... 30
4.1 Phase I: Total productivity measurement metric .............................................. 30
4.2 Phase II: Development of list of input components .......................................... 30
4.2.1 Proposed total productivity metric .............................................................. 35
4.2.2 Method of quantification of input and output .............................................. 36
4.2.3 Project phase classification ....................................................................... 36
4.2.4 Categorization of tangible inputs ............................................................... 36
iii
4.3 Phase III: Verification of the measurement framework ..................................... 43
5. Conclusions and recommendations ....................................................................... 48
6. References ............................................................................................................. 50
7. Appendices ............................................................................................................ 56
APPENDIX A. Description of project phase activities, major participants, and typical cost elements ............................................................................................................ 56
APPENDIX B: Focus group data collection forms ..................................................... 61
iv
List of tables
Table 1. OECD measures of productivity (2001) ........................................................... 13 Table 2. Quantity-based approach and cost-based approaches for project productivity 18 Table 3. Sample semi-structured form for indirect labour input category ...................... 34 Table 4. Labour input components ................................................................................ 39 Table 5. Material input category .................................................................................... 40 Table 6. Construction project indirect inputs ................................................................. 42 Table 7. Owner input cost components ......................................................................... 43 Table 8. List of input components for measuring the total productivity of construction projects .......................................................................................................................... 45
v
List of figures
Figure 1. Productivity cycle; adapted from Sumanth and Dedeoglu (1988) 4 Figure 2. Procedure for calculating equivalent work unit (EWU); adapted from Ellis and Lee (2006) 17 Figure 3. The EPMS metric hierarchy; adapted from Liao et al. (2012) 21 Figure 4. Research methodology 29 Figure 5. Total productivity measurement framework components 32 Figure 6. Modified total productivity measurement framework 38
1
1. Introduction
1.1 Background
Productivity improvement has been a major concern in the construction industry for many
years; a productivity increase in this industry will not only benefit this sector but also the
country as a whole. In today’s competitive environment, companies should be making the
management of productivity a high priority in order to effectively and efficiently convert
resources into marketable goods and services (Kao et al. 2013).
Chau and Walker (1988) describe two key considerations for productivity analysis and
management: the meaning of productivity, and the methods by which it is measured. The
definition of productivity varies depending on the application area, level of measurement,
availability of data, and the objective of measurement (Crawford and Vogl 2006, Pekuri
et al. 2011, Bröchner and Olofsson 2012). This variation in definitions can create
confusion and may limit the transferability of productivity research to different contexts.
Difficulty in productivity measurement can be attributed to the ways that it is defined,
which vary depending on the stakeholder’s point of view and the level of production being
assessed. Given these issues, a considerable number of question may arise for
researchers and practitioners, such as what are the best ways to measure productivity,
and what are the challenges in measurement? Moreover, what are the challenges in
quantifying the required parameters for a measurement metric? What are the challenges
in generalizing metrics for different levels of aggregation in productivity measurement?
(CII 2013, Crawford and Vogl 2006).
2
In general, productivity is defined as a ratio of outputs to inputs, and it shows the
effectiveness and efficiency in utilization of resources (Equation 1) (Mani et al. 2017).
𝑃𝑃𝑃𝑃𝑃𝑃𝑃𝑃𝑃𝑃𝑃𝑃𝑃𝑃𝑃𝑃𝑃𝑃𝑃𝑃𝑃𝑃𝑃𝑃 = 𝑂𝑂𝑃𝑃𝑃𝑃𝑂𝑂𝑃𝑃𝑃𝑃𝐼𝐼𝐼𝐼𝑂𝑂𝑃𝑃𝑃𝑃 (1)
The following study was conducted by the Natural Sciences and Engineering Research
Council of Canada (NSERC) Industrial Research Chair in Strategic Construction
Modeling and Delivery. This study illustrates the development of a framework to measure
the total productivity of construction projects and the detailed input and output
components of the productivity metric. The developed productivity metric will aid
practitioners in analyzing and improving the productivity of construction projects.
1.2 Research objectives
The general purpose of this research is to develop a framework that can be used in
evaluating total project productivity, while the specific objectives are as follows:
I. To perform a comprehensive review of existing productivity measurement studies;
II. To propose a metric that can be used to measure the total productivity of
construction projects by considering the joint impact of all input resources;
III. To prepare a detailed list of components required for measuring productivity at the
project level; and
IV. To investigate the applicability of the developed framework in construction.
3
2. Literature review: Overview of productivity measures
2.1 Productivity measurement methods
Measurement and management of productivity play an important role in the success of
any project. Management of productivity can be considered as a four-phase process,
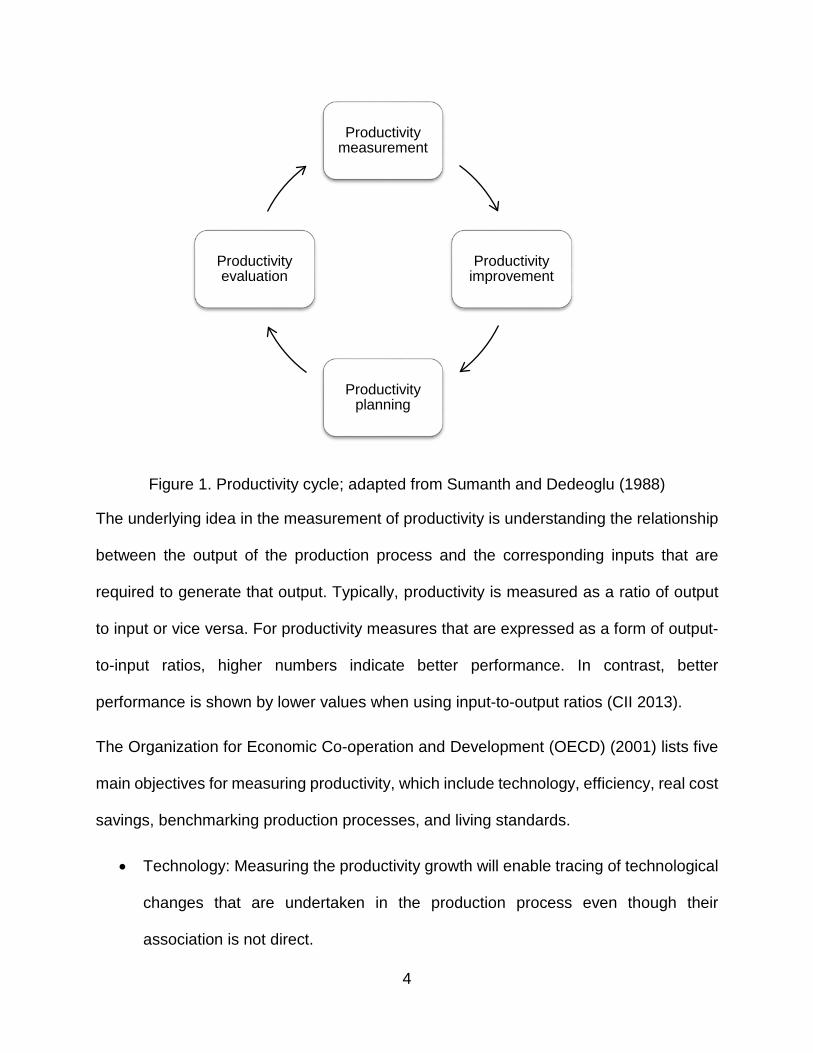
commonly termed as the “productivity cycle”. The four phases are as follows: productivity
measurement, productivity evaluation, productivity planning, and productivity
improvement (see Figure 1) (Sumanth and Dedeoglu 1988, Najafi et al. 2014). These
phases of productivity management involve quantification, comparison, establishment of
targets, and application of techniques that increase productivity at any level of the
production system. Productivity measurement, which is the initial step in the management
process, is considered to be the important component that lays the foundation for
productivity analysis. As stated by Drucker, who has contributed greatly to the
development of the modern business corporation, “Without productivity objectives, a
business does not have direction. Without productivity measurement, a business does
not have control.” Due to the importance of productivity in achieving business objectives,
it has been a major research focus area for many years (Spring 2011).
4
Figure 1. Productivity cycle; adapted from Sumanth and Dedeoglu (1988)
The underlying idea in the measurement of productivity is understanding the relationship
between the output of the production process and the corresponding inputs that are
required to generate that output. Typically, productivity is measured as a ratio of output
to input or vice versa. For productivity measures that are expressed as a form of output-
to-input ratios, higher numbers indicate better performance. In contrast, better
performance is shown by lower values when using input-to-output ratios (CII 2013).
The Organization for Economic Co-operation and Development (OECD) (2001) lists five
main objectives for measuring productivity, which include technology, efficiency, real cost
savings, benchmarking production processes, and living standards.
• Technology: Measuring the productivity growth will enable tracing of technological
changes that are undertaken in the production process even though their
association is not direct.
Productivity measurement
Productivity improvement
Productivity planning
Productivity evaluation
5
• Efficiency: Efficiency expresses real performance against theoretical standards;
with productivity analysis, the observed difference in efficiency can easily be traced
and quantified.
• Real cost savings: Real cost saving can be considered as the major resource input
contributing to the growth of productivity; productivity measurement can thus be
regarded as an attempt to quantify real cost savings in the production process.
• Benchmarking production processes: Inefficiency in a production process can be
determined by comparing the productivity measures with the best performance
value achieved.
• Living standards: Productivity can be considered as one of the most important
factors in determining a nation’s living standards. For example, income per person,
which is typically used for measuring living standards, is directly associated with
labour productivity. By measuring and analyzing labour productivity, researchers
and practitioners can develop a better understanding of the state of living
standards.
Various studies were conducted to provide measures that can be used to quantify
productivity. In general, these productivity measures can be categorized into two classes:
single-factor productivity (SFP), which compares the output with one specific input factor
such as labour or capital, and multifactor productivity (MFP), which evaluates output
against all resources used (CII 2013, Yi and Chan 2014).
6
2.1.1 Single-factor productivity
Single-factor productivity (SFP) is the most commonly used productivity measurement
method. SFP evaluates productivity as a ratio of one input factor to output (CII 2013, Park
2006). Various factors can be considered in SFP measurement methods. These factors
can be categorized into two broad groups, labour-related factors and capital-related
factors, both of which are discussed in detail in the coming sections.
Labour productivity
A great amount of research and development efforts have been carried out in the area of
labour productivity, as compared to other productivity measures. The main reason that
labour productivity has been a central research focus is its ability to provide information
regarding operational efficiency, economic growth, and living standards. In addition, since
the construction industry is labour intensive, labour productivity is seen as a major index
to provide information on the productivity of construction projects (Chang and Woo 2017).
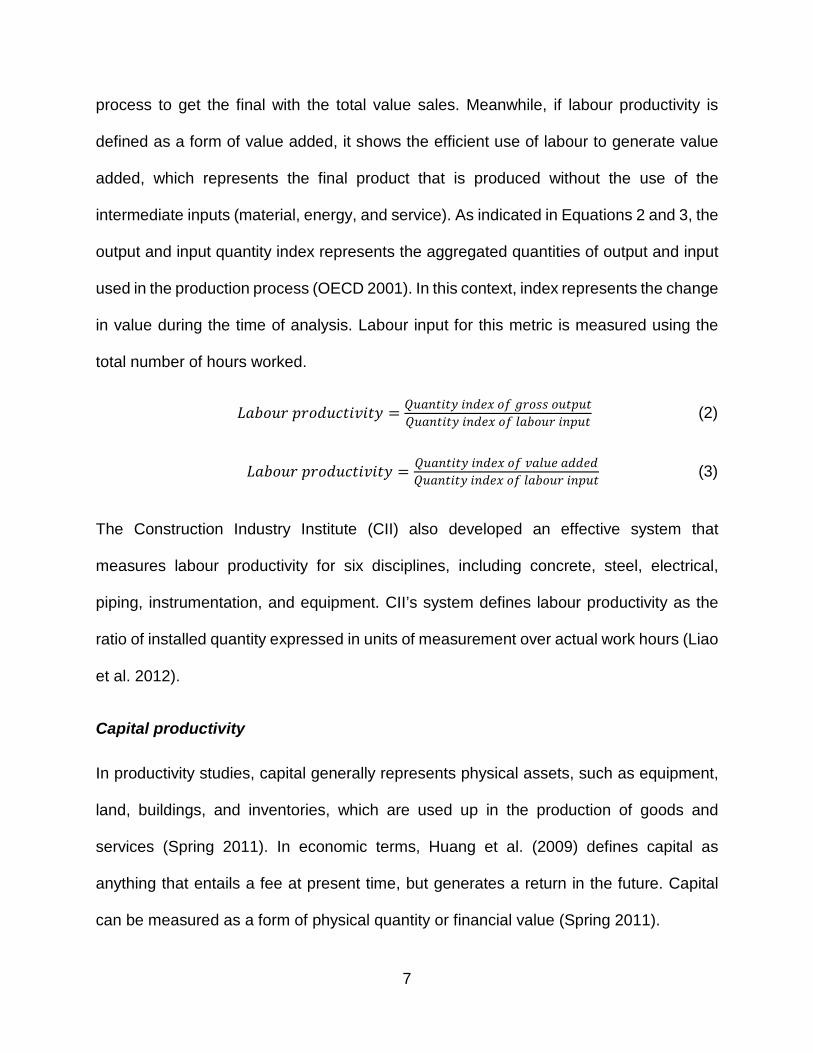
The main advantage of labour productivity measures is their ease of measurement and
flexibility, as compared to MFP or capital productivity measures. Based on a 2001 report
by OECD, labour productivity can be measured in terms of gross output and value added,
as shown in Equation 2 and Equation 3. Gross output measures for individual firms or
industry include measures for intermediate inputs (e.g., material, energy, and service)
used in the production of goods and services. In contrast, value-added measures exclude
consumption of intermediate inputs. When labour productivity is measured in terms of
gross output, it reflects the effective use of labour to generate the output, which represents
the supply of all goods and services that are being produced through the production
7
process to get the final with the total value sales. Meanwhile, if labour productivity is
defined as a form of value added, it shows the efficient use of labour to generate value
added, which represents the final product that is produced without the use of the
intermediate inputs (material, energy, and service). As indicated in Equations 2 and 3, the
output and input quantity index represents the aggregated quantities of output and input
used in the production process (OECD 2001). In this context, index represents the change
in value during the time of analysis. Labour input for this metric is measured using the
total number of hours worked.
𝐿𝐿𝐿𝐿𝐿𝐿𝑃𝑃𝑃𝑃𝑃𝑃 𝑂𝑂𝑃𝑃𝑃𝑃𝑃𝑃𝑃𝑃𝑃𝑃𝑃𝑃𝑃𝑃𝑃𝑃𝑃𝑃𝑃𝑃𝑃𝑃 = 𝑄𝑄𝑃𝑃𝐿𝐿𝐼𝐼𝑃𝑃𝑃𝑃𝑃𝑃𝑃𝑃 𝑃𝑃𝐼𝐼𝑃𝑃𝑖𝑖𝑖𝑖 𝑃𝑃𝑜𝑜 𝑔𝑔𝑃𝑃𝑃𝑃𝑔𝑔𝑔𝑔 𝑃𝑃𝑃𝑃𝑃𝑃𝑂𝑂𝑃𝑃𝑃𝑃𝑄𝑄𝑃𝑃𝐿𝐿𝐼𝐼𝑃𝑃𝑃𝑃𝑃𝑃𝑃𝑃 𝑃𝑃𝐼𝐼𝑃𝑃𝑖𝑖𝑖𝑖 𝑃𝑃𝑜𝑜 𝑙𝑙𝐿𝐿𝐿𝐿𝑃𝑃𝑃𝑃𝑃𝑃 𝑃𝑃𝐼𝐼𝑂𝑂𝑃𝑃𝑃𝑃 (2)
𝐿𝐿𝐿𝐿𝐿𝐿𝑃𝑃𝑃𝑃𝑃𝑃 𝑂𝑂𝑃𝑃𝑃𝑃𝑃𝑃𝑃𝑃𝑃𝑃𝑃𝑃𝑃𝑃𝑃𝑃𝑃𝑃𝑃𝑃𝑃𝑃 = 𝑄𝑄𝑃𝑃𝐿𝐿𝐼𝐼𝑃𝑃𝑃𝑃𝑃𝑃𝑃𝑃 𝑃𝑃𝐼𝐼𝑃𝑃𝑖𝑖𝑖𝑖 𝑃𝑃𝑜𝑜 𝑃𝑃𝐿𝐿𝑙𝑙𝑃𝑃𝑖𝑖 𝐿𝐿𝑃𝑃𝑃𝑃𝑖𝑖𝑃𝑃𝑄𝑄𝑃𝑃𝐿𝐿𝐼𝐼𝑃𝑃𝑃𝑃𝑃𝑃𝑃𝑃 𝑃𝑃𝐼𝐼𝑃𝑃𝑖𝑖𝑖𝑖 𝑃𝑃𝑜𝑜 𝑙𝑙𝐿𝐿𝐿𝐿𝑃𝑃𝑃𝑃𝑃𝑃 𝑃𝑃𝐼𝐼𝑂𝑂𝑃𝑃𝑃𝑃 (3)
The Construction Industry Institute (CII) also developed an effective system that
measures labour productivity for six disciplines, including concrete, steel, electrical,
piping, instrumentation, and equipment. CII’s system defines labour productivity as the
ratio of installed quantity expressed in units of measurement over actual work hours (Liao
et al. 2012).
Capital productivity
In productivity studies, capital generally represents physical assets, such as equipment,
land, buildings, and inventories, which are used up in the production of goods and
services (Spring 2011). In economic terms, Huang et al. (2009) defines capital as
anything that entails a fee at present time, but generates a return in the future. Capital
can be measured as a form of physical quantity or financial value (Spring 2011).
8
Capital productivity is commonly defined as a ratio of output over capital used; it is also
considered to be a monetary value-based quantification of productivity, as it assesses the
value of money on a large scale. Capital input used to produce goods has correlative
characteristics with those of labour input measures. For labour productivity, labour input
factors are normally quantified with labour service as total hours worked, while in the case
of capital productivity, physical capital is calculated with total machine hours, which are
considered to be fixed in proportion to the capital stock. Another commonality between
labour input and capital input is the pricing of values. For labour inputs, prices are
expressed by compensation per hour, while capital input is quantified as the cost of capital
assets (Huang et al. 2009).
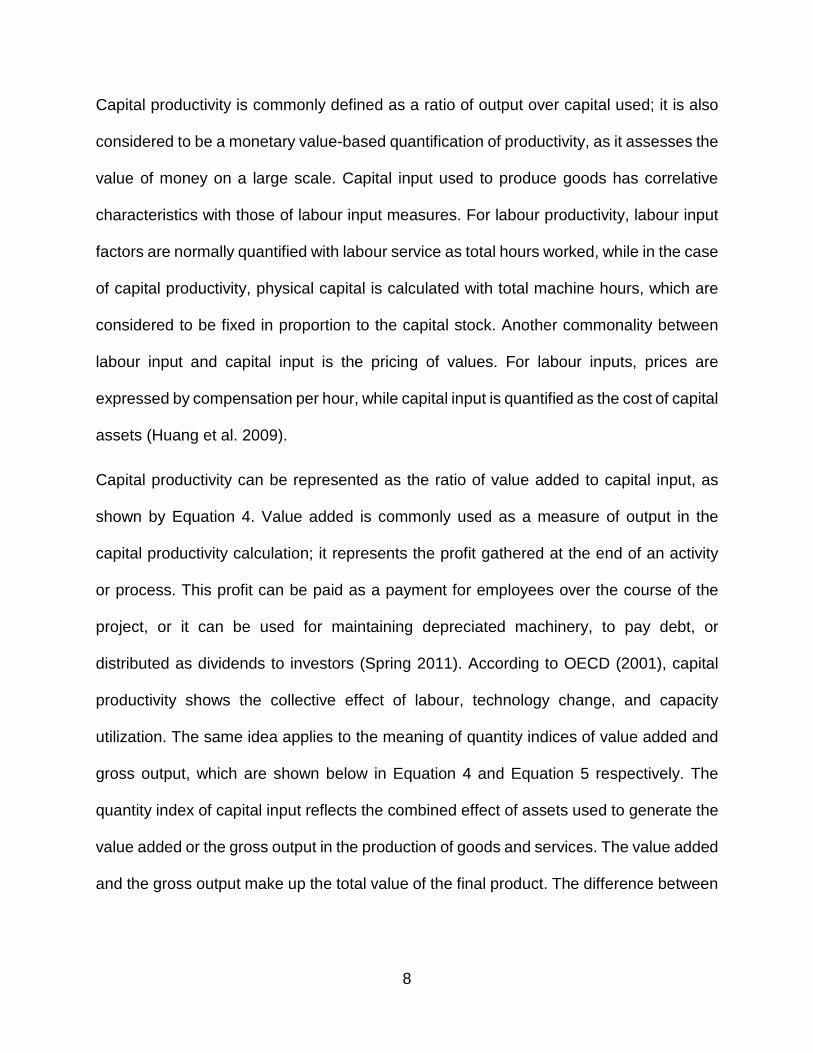
Capital productivity can be represented as the ratio of value added to capital input, as
shown by Equation 4. Value added is commonly used as a measure of output in the
capital productivity calculation; it represents the profit gathered at the end of an activity
or process. This profit can be paid as a payment for employees over the course of the
project, or it can be used for maintaining depreciated machinery, to pay debt, or
distributed as dividends to investors (Spring 2011). According to OECD (2001), capital
productivity shows the collective effect of labour, technology change, and capacity
utilization. The same idea applies to the meaning of quantity indices of value added and
gross output, which are shown below in Equation 4 and Equation 5 respectively. The
quantity index of capital input reflects the combined effect of assets used to generate the
value added or the gross output in the production of goods and services. The value added
and the gross output make up the total value of the final product. The difference between
9
these outputs is that gross output is evaluated before subtracting the value of intermediate
goods used up in production.
𝐶𝐶𝐿𝐿𝑂𝑂𝑃𝑃𝑃𝑃𝐿𝐿𝑙𝑙 𝑂𝑂𝑃𝑃𝑃𝑃𝑃𝑃𝑃𝑃𝑃𝑃𝑃𝑃𝑃𝑃𝑃𝑃𝑃𝑃𝑃𝑃𝑃𝑃 = 𝑄𝑄𝑃𝑃𝐿𝐿𝐼𝐼𝑃𝑃𝑃𝑃𝑃𝑃𝑃𝑃 𝑃𝑃𝐼𝐼𝑃𝑃𝑖𝑖𝑖𝑖 𝑃𝑃𝑜𝑜 𝑃𝑃𝐿𝐿𝑙𝑙𝑃𝑃𝑖𝑖 𝐿𝐿𝑃𝑃𝑃𝑃𝑖𝑖𝑃𝑃𝑄𝑄𝑃𝑃𝐿𝐿𝐼𝐼𝑃𝑃𝑃𝑃𝑃𝑃𝑃𝑃 𝑃𝑃𝐼𝐼𝑃𝑃𝑖𝑖𝑖𝑖 𝑃𝑃𝑜𝑜 𝑃𝑃𝐿𝐿𝑂𝑂𝑃𝑃𝑃𝑃𝐿𝐿𝑙𝑙 𝑃𝑃𝐼𝐼𝑂𝑂𝑃𝑃𝑃𝑃 (4)
Capital productivity can also be measured based on gross output, as illustrated in
Equation 5:
𝐶𝐶𝐿𝐿𝑂𝑂𝑃𝑃𝑃𝑃𝐿𝐿𝑙𝑙 𝑂𝑂𝑃𝑃𝑃𝑃𝑃𝑃𝑃𝑃𝑃𝑃𝑃𝑃𝑃𝑃𝑃𝑃𝑃𝑃𝑃𝑃𝑃𝑃 = 𝑄𝑄𝑃𝑃𝐿𝐿𝐼𝐼𝑃𝑃𝑃𝑃𝑃𝑃𝑃𝑃 𝑃𝑃𝐼𝐼𝑃𝑃𝑖𝑖𝑖𝑖 𝑃𝑃𝑜𝑜 𝑔𝑔𝑃𝑃𝑃𝑃𝑔𝑔𝑔𝑔 𝑃𝑃𝑃𝑃𝑃𝑃𝑂𝑂𝑃𝑃𝑃𝑃𝑄𝑄𝑃𝑃𝐿𝐿𝐼𝐼𝑃𝑃𝑃𝑃𝑃𝑃𝑃𝑃 𝑃𝑃𝐼𝐼𝑃𝑃𝑖𝑖𝑖𝑖 𝑃𝑃𝑜𝑜 𝑃𝑃𝐿𝐿𝑂𝑂𝑃𝑃𝑃𝑃𝐿𝐿𝑙𝑙 𝑃𝑃𝐼𝐼𝑂𝑂𝑃𝑃𝑃𝑃 (5)
The procedure for estimating capital productivity requires quantification of the value of
gross capital stock in order to provide an appropriate measure for capital input. Gross
capital stock represents a capital measure that shows the overall flow of venture
undertaken in the production process (Huang et al. 2009). Capital stocks can be
quantified in three ways: using historic prices, using constant prices, or using current
prices. In contrast, valuation of the capital stock for productivity management is performed
using only constant prices and current prices. Current prices indicate the value of the
asset for the current year; it should be noted that this value does not account for inflation.
Constant prices show the valuation of the capital stock in a given year. The capital stock
shows the cumulative flow of investments or expenses combined to obtain the required
output. Crawford and Vogl (2006) suggest that capital stocks should be measured using
the perpetual inventory method (PIM), which involves aggregating the inputs, and
adjusting for deterioration resulting from the long-term use of the asset. Berlmann and
Wesselohoft (2014) note that most of the methods used to represent capital stock entail
the use of PIM. A key component of PIM is that it considers the capital stock as an
inventory, which increases with the service that is provided. Over time, when the asset
10
provides service to the production process, the amount of capital stock decreases with
the amount of depreciation.
2.1.2 Total factor productivity (TFP)
Total factor productivity (TFP) (also known as multifactor productivity) is a productivity
measure that uses multiple input factors (energy, labour, equipment, materials and
capital) to produce and output (Nasir et al. 2013; Park 2006). Since this measure
evaluates output against several types of intangible inputs, such as advancement in
technology, it is interpreted as the collective effect of the variation in output that cannot
be accounted for by change in combined inputs (OECD 2001). TFP is commonly used to
monitor the state of economy and to inform the development of economic policy.
2.2 Level of production system
In the construction industry, the production system is said to be a process whereby input
resources are transformed into output. The production system is considered to have
various boundaries or levels, depending on the purpose of investigation and availability
of data. According to Yi and Chan (2014), research on construction labour productivity
(CLP) typically focuses on three levels: industry, project, and activity levels. Activity-level
productivity measures are most commonly used in the construction industry; they
measure the performance of individual construction activities, such as concrete placing
and steel erection. In contrast, project-level productivity measures reflect performance
related to the activities required for construction of a certain facility. Industry-level
productivity measures provide an assessment of the overall state of productivity in the
industry sector.
11
2.2.1 Measuring productivity at the Industry level
At the industry level, productivity can be used as a measure of industrial efficiency; it is
calculated as the amount of output produced per unit of input. The productivity measured
can be expressed as a form of labour productivity or multifactor productivity (CII 2013).
Macro-economic productivity measures, such as industry-level productivity, provide
information regarding living standards, the status of an economy’s productive capacity, a
comparison of international productivity, and influence of economic policies (Huang et al.
2009).
According to CII (2013), industry-level productivity is assessed using two key metrics:
total factor productivity (TFP) and labour productivity. TFP can be determined by
comparing the goods and services produced with the input used in production operations.
Equation 6 shows the calculations for TFP, expressed in terms of labour, material,
equipment, energy, and capital (CII 2013). In this case, energy input is determined by the
quantity and price of resources used for generating power, such as fuel, coal, oil products,
and electricity. Capital input, which is commonly measured in dollars, represents anything
used in the production process that has cost at present time, but that earns a return in the
future, such as land, inventories, and human capital (CII 2013).
𝑇𝑇𝑃𝑃𝑃𝑃𝐿𝐿𝑙𝑙 𝑜𝑜𝐿𝐿𝑃𝑃𝑃𝑃𝑃𝑃𝑃𝑃 𝑂𝑂𝑃𝑃𝑃𝑃𝑃𝑃𝑃𝑃𝑃𝑃𝑃𝑃𝑃𝑃𝑃𝑃𝑃𝑃𝑃𝑃𝑃𝑃 = 𝑇𝑇𝑃𝑃𝑃𝑃𝐿𝐿𝑙𝑙 𝑃𝑃𝑃𝑃𝑃𝑃𝑂𝑂𝑃𝑃𝑃𝑃𝐿𝐿𝐿𝐿𝐿𝐿𝑃𝑃𝑃𝑃𝑃𝑃 + 𝑀𝑀𝐿𝐿𝑃𝑃𝑖𝑖𝑃𝑃𝑃𝑃𝐿𝐿𝑙𝑙+𝐸𝐸𝐸𝐸𝑃𝑃𝑃𝑃𝑂𝑂𝐸𝐸𝑖𝑖𝐼𝐼𝑃𝑃+𝐸𝐸𝐼𝐼𝑖𝑖𝑃𝑃𝑔𝑔𝑃𝑃+𝐶𝐶𝐿𝐿𝑂𝑂𝑃𝑃𝑃𝑃𝐿𝐿𝑙𝑙 (6)
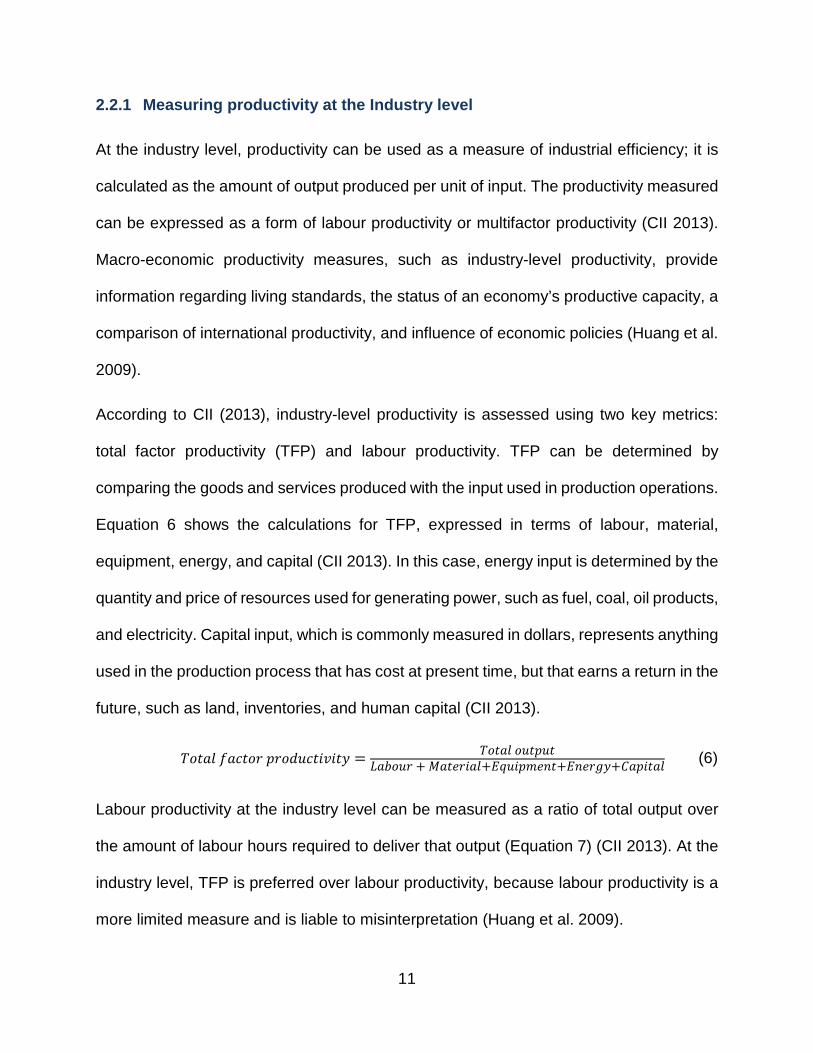
Labour productivity at the industry level can be measured as a ratio of total output over
the amount of labour hours required to deliver that output (Equation 7) (CII 2013). At the
industry level, TFP is preferred over labour productivity, because labour productivity is a
more limited measure and is liable to misinterpretation (Huang et al. 2009).
12
𝐿𝐿𝐿𝐿𝐿𝐿𝑃𝑃𝑃𝑃𝑃𝑃 𝑂𝑂𝑃𝑃𝑃𝑃𝑃𝑃𝑃𝑃𝑃𝑃𝑃𝑃𝑃𝑃𝑃𝑃𝑃𝑃𝑃𝑃𝑃𝑃 = 𝑇𝑇𝑃𝑃𝑃𝑃𝐿𝐿𝑙𝑙 𝑃𝑃𝑃𝑃𝑃𝑃𝑂𝑂𝑃𝑃𝑃𝑃𝐿𝐿𝐿𝐿𝐿𝐿𝑃𝑃𝑃𝑃𝑃𝑃 (𝐷𝐷𝑃𝑃𝑃𝑃𝑖𝑖𝑃𝑃𝑃𝑃 𝑤𝑤𝑃𝑃𝑃𝑃𝑤𝑤ℎ𝑃𝑃𝑃𝑃𝑃𝑃𝑔𝑔) (7)
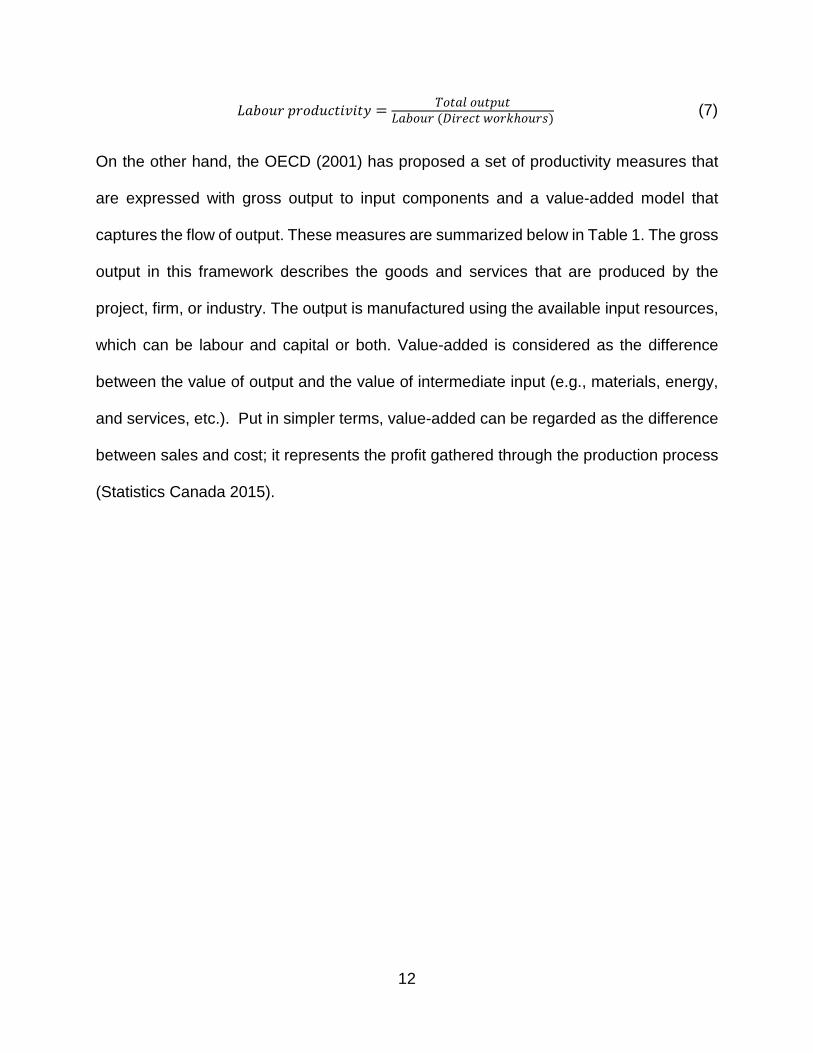
On the other hand, the OECD (2001) has proposed a set of productivity measures that
are expressed with gross output to input components and a value-added model that
captures the flow of output. These measures are summarized below in Table 1. The gross
output in this framework describes the goods and services that are produced by the
project, firm, or industry. The output is manufactured using the available input resources,
which can be labour and capital or both. Value-added is considered as the difference
between the value of output and the value of intermediate input (e.g., materials, energy,
and services, etc.). Put in simpler terms, value-added can be regarded as the difference
between sales and cost; it represents the profit gathered through the production process
(Statistics Canada 2015).
13
Table 1. OECD measures of productivity (2001)
Type of input measure
Type of output measure
Labour Capital Capital and labour
Capital, labour and
intermediate inputs (energy,
materials, services)
Gross output
Labour productivity (based on gross output)
Capital productivity (based on gross output)
Capital-labour productivity MFP (based on gross output)
KLEMS productivity
Value added
Labour productivity (based on value added)
Capital productivity (based on value added)
Capital-labour productivity MFP (based on value added)
-
Single factor productivity (SFP) measures
Multifactor productivity (MFP) measures
2.2.2 Measuring productivity at the activity level
Activity-level productivity metrics are the most commonly used productivity measures in
the construction industry. Single-factor productivity metrics are widely applied to
measures activity-level productivity, particularly labour productivity. In measuring
productivity at the activity level, the units of measurement for quantifying tasks should be
precise and easy to understand. CII (2013) describes five criteria that should be
considered before selecting methods of quantity measurement for productivity analysis.
These criteria are as follows: easy to understand and determine, degree of control
needed, nature of the activity, construction method, and activity scope.
14
2.2.3 Measuring productivity at the project level
In general, a project is a collection of activities that are required for the construction of a
facility. Since projects entail completion of various activities, measurement of productivity
at the project level is more complicated than measurement of activity-level productivity
(Huang et al. 2009).
CII (2013) lists common measures of productivity, which are expressed either as a ratio
of output to input or as a ratio of input to output. Factor productivity, which is shown below
in Equation 8, is similar to TFP, and it is mainly used in conceptual estimation to quantify
construction productivity.
𝐹𝐹𝐿𝐿𝑃𝑃𝑃𝑃𝑃𝑃𝑃𝑃 𝑂𝑂𝑃𝑃𝑃𝑃𝑃𝑃𝑃𝑃𝑃𝑃𝑃𝑃𝑃𝑃𝑃𝑃𝑃𝑃𝑃𝑃𝑃𝑃 = 𝑃𝑃ℎ𝑃𝑃𝑔𝑔𝑃𝑃𝑃𝑃𝐿𝐿𝑙𝑙 𝑃𝑃𝑃𝑃𝑃𝑃𝑂𝑂𝑃𝑃𝑃𝑃 (𝑃𝑃𝐼𝐼𝑃𝑃𝑃𝑃𝑔𝑔)𝐿𝐿𝐿𝐿𝐿𝐿𝑃𝑃𝑃𝑃𝑃𝑃�$�+𝑀𝑀𝐿𝐿𝑃𝑃𝑖𝑖𝑃𝑃𝑃𝑃𝐿𝐿𝑙𝑙�$�+𝐸𝐸𝐸𝐸𝑃𝑃𝑃𝑃𝑂𝑂𝐸𝐸𝑖𝑖𝐼𝐼𝑃𝑃 �$� (8)
Partial-factor productivity can be estimated by removing one of the input resources (e.g.,
labour, material, or equipment) from factor productivity, as shown in Equation 9.
According to CII (2013), partial-factor productivity is mainly used for specific types of
conceptual estimation for measuring productivity on construction projects.
𝑃𝑃𝐿𝐿𝑃𝑃𝑃𝑃𝑃𝑃𝐿𝐿𝑙𝑙 𝑜𝑜𝐿𝐿𝑃𝑃𝑃𝑃𝑃𝑃𝑃𝑃 𝑂𝑂𝑃𝑃𝑃𝑃𝑃𝑃𝑃𝑃𝑃𝑃𝑃𝑃𝑃𝑃𝑃𝑃𝑃𝑃𝑃𝑃𝑃𝑃 = 𝑃𝑃ℎ𝑃𝑃𝑔𝑔𝑃𝑃𝑃𝑃𝐿𝐿𝑙𝑙 𝑃𝑃𝑃𝑃𝑃𝑃𝑂𝑂𝑃𝑃𝑃𝑃 (𝑈𝑈𝐼𝐼𝑃𝑃𝑃𝑃𝑔𝑔)𝐿𝐿𝐿𝐿𝐿𝐿𝑃𝑃𝑃𝑃𝑃𝑃�$�+𝐸𝐸𝐸𝐸𝑃𝑃𝑃𝑃𝑂𝑂𝐸𝐸𝑖𝑖𝐼𝐼𝑃𝑃 ($) (9)
The other productivity measure that can be computed at the project level is labour
productivity. Labour productivity can be estimated based on the cost of labour required
or on direct work hours (see Equations 10 and 11).
𝐿𝐿𝐿𝐿𝐿𝐿𝑃𝑃𝑃𝑃𝑃𝑃 𝑂𝑂𝑃𝑃𝑃𝑃𝑃𝑃𝑃𝑃𝑃𝑃𝑃𝑃𝑃𝑃𝑃𝑃𝑃𝑃𝑃𝑃𝑃𝑃 = 𝑃𝑃ℎ𝑃𝑃𝑔𝑔𝑃𝑃𝑃𝑃𝐿𝐿𝑙𝑙 𝑃𝑃𝑃𝑃𝑃𝑃𝑂𝑂𝑃𝑃𝑃𝑃 (𝑈𝑈𝐼𝐼𝑃𝑃𝑃𝑃𝑔𝑔)𝐿𝐿𝐿𝐿𝐿𝐿𝑃𝑃𝑃𝑃𝑃𝑃�$� (10)
𝐿𝐿𝐿𝐿𝐿𝐿𝑃𝑃𝑃𝑃𝑃𝑃 𝑂𝑂𝑃𝑃𝑃𝑃𝑃𝑃𝑃𝑃𝑃𝑃𝑃𝑃𝑃𝑃𝑃𝑃𝑃𝑃𝑃𝑃𝑃𝑃 = 𝑃𝑃ℎ𝑃𝑃𝑔𝑔𝑃𝑃𝑃𝑃𝐿𝐿𝑙𝑙 𝑃𝑃𝑃𝑃𝑃𝑃𝑂𝑂𝑃𝑃𝑃𝑃 (𝑈𝑈𝐼𝐼𝑃𝑃𝑃𝑃𝑔𝑔)𝐷𝐷𝑃𝑃𝑃𝑃𝑖𝑖𝑃𝑃𝑃𝑃 𝑤𝑤𝑃𝑃𝑃𝑃𝑤𝑤 ℎ𝑃𝑃𝑃𝑃𝑃𝑃𝑔𝑔 (11)
15
Goodrum and Haas (2002) modified Equation 8 by assigning equipment cost to fixed
capital and material cost to circulating capital, as is shown in Equation 12. Goodrum and
Haas (2002) studied the effect of equipment technological change on partial-factor
productivity, excluding circulating capital as an input over a 22-year time period. Labour
cost and fixed capital cost data for the construction activities were collected from
published data that was prepared for cost estimation.
𝐹𝐹𝐿𝐿𝑃𝑃𝑃𝑃𝑃𝑃𝑃𝑃 𝑂𝑂𝑃𝑃𝑃𝑃𝑃𝑃𝑃𝑃𝑃𝑃𝑃𝑃𝑃𝑃𝑃𝑃𝑃𝑃𝑃𝑃𝑃𝑃 = 𝑃𝑃𝑃𝑃𝑔𝑔𝑃𝑃𝑃𝑃𝐿𝐿𝑙𝑙 𝑃𝑃𝑃𝑃𝑃𝑃𝑂𝑂𝑃𝑃𝑃𝑃 (𝑃𝑃𝐼𝐼𝑃𝑃𝑃𝑃𝑔𝑔)𝐿𝐿𝐿𝐿𝐿𝐿𝑃𝑃𝑃𝑃𝑃𝑃�$�+𝐶𝐶𝑃𝑃𝑃𝑃𝑃𝑃𝑃𝑃𝑙𝑙𝐿𝐿𝑃𝑃𝑃𝑃𝐼𝐼𝑔𝑔 𝑃𝑃𝐿𝐿𝑂𝑂𝑃𝑃𝑃𝑃𝐿𝐿𝑙𝑙�$�+𝐹𝐹𝑃𝑃𝑖𝑖𝑖𝑖𝑃𝑃 𝑃𝑃𝐿𝐿𝑂𝑂𝑃𝑃𝑃𝑃𝐿𝐿𝑙𝑙 ($) (12)
In measuring productivity at this level, the type of information required for inputs and
outputs depends on how the metric is defined. A review of the construction engineering
literature shows a number of studies dedicated to the development of meaningful project-
level productivity metrics, which provide qualitative estimates on the productivity of a
project using activity data (Ellis and Lee 2006; Thomas et al. 1990; Liao 2012).
In an effort to include the effect of all activities involved in construction projects, Ellis and
Lee (2006) developed a project-level productivity measurement method (shown in
Equation 13), which uses activity data from transportation projects to measure project-
level productivity. Ellis and Lee (2006) argue that the success of a project is influenced
by the productivity of all task elements in the project; therefore, evaluating only a few work
elements or activities will not be adequate for the purpose of assessing overall
productivity.
Ellis and Lee’s (2006) project-level productivity (PLP) metric was developed on the
assumption that “the total input or work effort on all activities and the total output or work
produced on all activities” are incorporated during productivity measurement. The
16
researchers outlined two major objectives to be fulfilled by the measurement approach,
the first of which was to develop a single PLP value for all activities involved in a highway
project. The second objective was to evaluate the PLP results over the full duration of the
project. In order to achieve the outlined objectives, the procedure started with the
establishment of a method specifying the mode of measurement for both inputs and
outputs. Ellis and Lee (2006) expressed input in terms of the total worker hours of all crew
members involved in the production of output. The output is defined in terms of total
equivalent work units (EWU).
𝑃𝑃𝐿𝐿𝑃𝑃 = 𝑇𝑇𝑇𝑇𝑇𝑇𝑇𝑇𝑇𝑇 𝑤𝑤𝑇𝑇𝑤𝑤𝑤𝑤𝑤𝑤𝑤𝑤 ℎ𝑇𝑇𝑜𝑜𝑤𝑤𝑜𝑜𝑇𝑇𝑇𝑇𝑇𝑇𝑇𝑇𝑇𝑇 𝐸𝐸𝐸𝐸𝐸𝐸
(13)
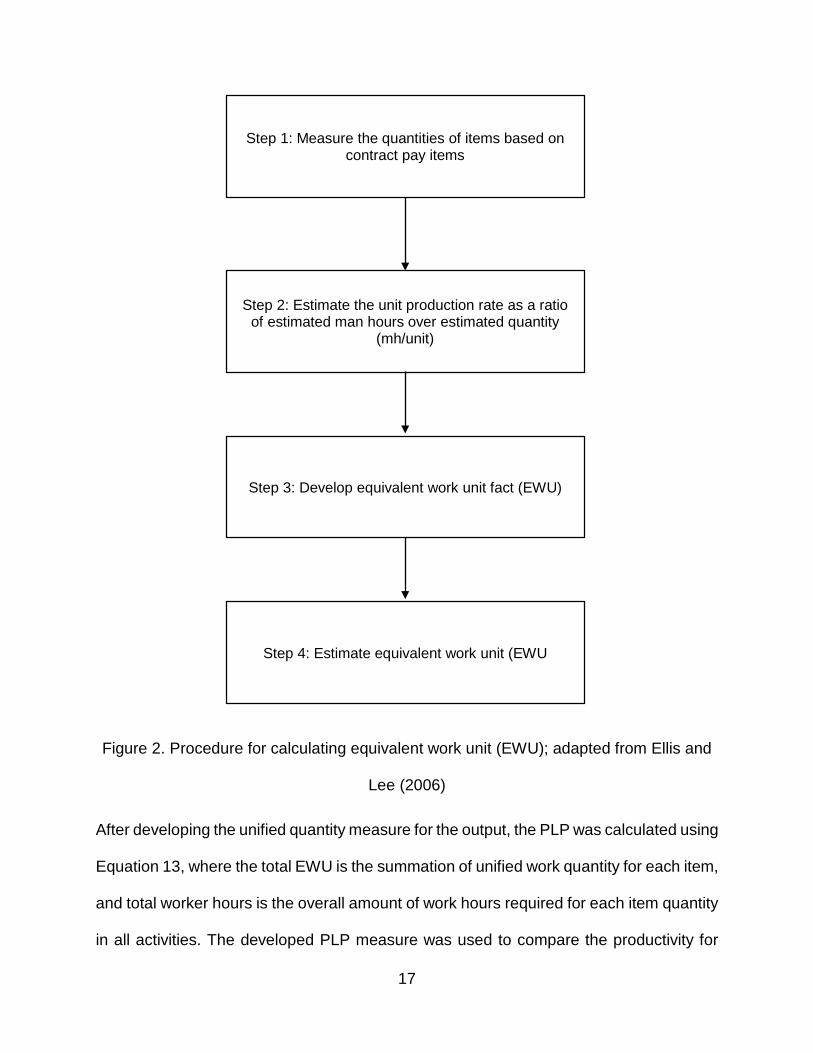
EWU is a converted value of the daily installed work quantities, which may be measured
in different units. To develop the unified PLP quantity value, the researchers used four
steps, which are shown in Figure 2. The first step involves preparation of a database for
all activities containing relevant information regarding pay items, such as estimated
quantity, units of measurement, estimated man-hours, and crew composition. In the
second step, average production rate, which indicates the number of hours spent in
producing a single unit of some item, was calculated based on crew information data
drawn from a published estimating database: “RS Means Heavy Construction Cost”. The
third step involved the calculation of the equivalent unit factor, which is eight work hours
divided by the unit production rate determined in the second step. Finally, the EWU was
calculated for each work item as a ratio of estimated quantity and the equivalent work unit
factor.
17
Figure 2. Procedure for calculating equivalent work unit (EWU); adapted from Ellis and
Lee (2006)
After developing the unified quantity measure for the output, the PLP was calculated using
Equation 13, where the total EWU is the summation of unified work quantity for each item,
and total worker hours is the overall amount of work hours required for each item quantity
in all activities. The developed PLP measure was used to compare the productivity for
Step 1: Measure the quantities of items based on contract pay items
Step 2: Estimate the unit production rate as a ratio of estimated man hours over estimated quantity
(mh/unit)
Step 3: Develop equivalent work unit fact (EWU)
Step 4: Estimate equivalent work unit (EWU
18
three highway projects by looking at trends and project control strategies implemented in
the projects. It should be noted that this approach sums up all the construction crafts
without considering the variation of installed quantities, which is a common characteristic
of activities in construction projects.
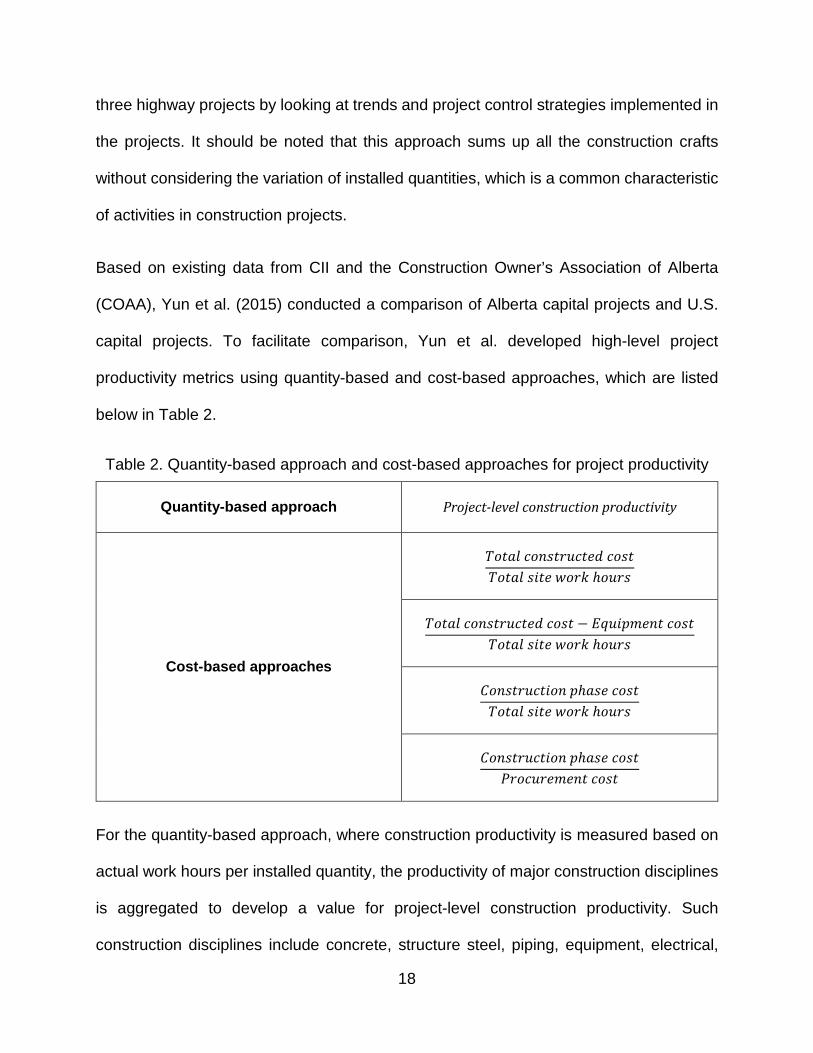
Based on existing data from CII and the Construction Owner’s Association of Alberta
(COAA), Yun et al. (2015) conducted a comparison of Alberta capital projects and U.S.
capital projects. To facilitate comparison, Yun et al. developed high-level project
productivity metrics using quantity-based and cost-based approaches, which are listed
below in Table 2.
Table 2. Quantity-based approach and cost-based approaches for project productivity
Quantity-based approach Project-level construction productivity
Cost-based approaches
𝑇𝑇𝑃𝑃𝑃𝑃𝐿𝐿𝑙𝑙 𝑃𝑃𝑃𝑃𝐼𝐼𝑔𝑔𝑃𝑃𝑃𝑃𝑃𝑃𝑃𝑃𝑃𝑃𝑖𝑖𝑃𝑃 𝑃𝑃𝑃𝑃𝑔𝑔𝑃𝑃𝑇𝑇𝑃𝑃𝑃𝑃𝐿𝐿𝑙𝑙 𝑔𝑔𝑃𝑃𝑃𝑃𝑖𝑖 𝑤𝑤𝑃𝑃𝑃𝑃𝑤𝑤 ℎ𝑃𝑃𝑃𝑃𝑃𝑃𝑔𝑔
𝑇𝑇𝑃𝑃𝑃𝑃𝐿𝐿𝑙𝑙 𝑃𝑃𝑃𝑃𝐼𝐼𝑔𝑔𝑃𝑃𝑃𝑃𝑃𝑃𝑃𝑃𝑃𝑃𝑖𝑖𝑃𝑃 𝑃𝑃𝑃𝑃𝑔𝑔𝑃𝑃 − 𝐸𝐸𝐸𝐸𝑃𝑃𝑃𝑃𝑂𝑂𝐸𝐸𝑖𝑖𝐼𝐼𝑃𝑃 𝑃𝑃𝑃𝑃𝑔𝑔𝑃𝑃𝑇𝑇𝑃𝑃𝑃𝑃𝐿𝐿𝑙𝑙 𝑔𝑔𝑃𝑃𝑃𝑃𝑖𝑖 𝑤𝑤𝑃𝑃𝑃𝑃𝑤𝑤 ℎ𝑃𝑃𝑃𝑃𝑃𝑃𝑔𝑔
𝐶𝐶𝑃𝑃𝐼𝐼𝑔𝑔𝑃𝑃𝑃𝑃𝑃𝑃𝑃𝑃𝑃𝑃𝑃𝑃𝑃𝑃𝐼𝐼 𝑂𝑂ℎ𝐿𝐿𝑔𝑔𝑖𝑖 𝑃𝑃𝑃𝑃𝑔𝑔𝑃𝑃𝑇𝑇𝑃𝑃𝑃𝑃𝐿𝐿𝑙𝑙 𝑔𝑔𝑃𝑃𝑃𝑃𝑖𝑖 𝑤𝑤𝑃𝑃𝑃𝑃𝑤𝑤 ℎ𝑃𝑃𝑃𝑃𝑃𝑃𝑔𝑔
𝐶𝐶𝑃𝑃𝐼𝐼𝑔𝑔𝑃𝑃𝑃𝑃𝑃𝑃𝑃𝑃𝑃𝑃𝑃𝑃𝑃𝑃𝐼𝐼 𝑂𝑂ℎ𝐿𝐿𝑔𝑔𝑖𝑖 𝑃𝑃𝑃𝑃𝑔𝑔𝑃𝑃𝑃𝑃𝑃𝑃𝑃𝑃𝑃𝑃𝑃𝑃𝑃𝑃𝑖𝑖𝐸𝐸𝑖𝑖𝐼𝐼𝑃𝑃 𝑃𝑃𝑃𝑃𝑔𝑔𝑃𝑃
For the quantity-based approach, where construction productivity is measured based on
actual work hours per installed quantity, the productivity of major construction disciplines
is aggregated to develop a value for project-level construction productivity. Such
construction disciplines include concrete, structure steel, piping, equipment, electrical,
19
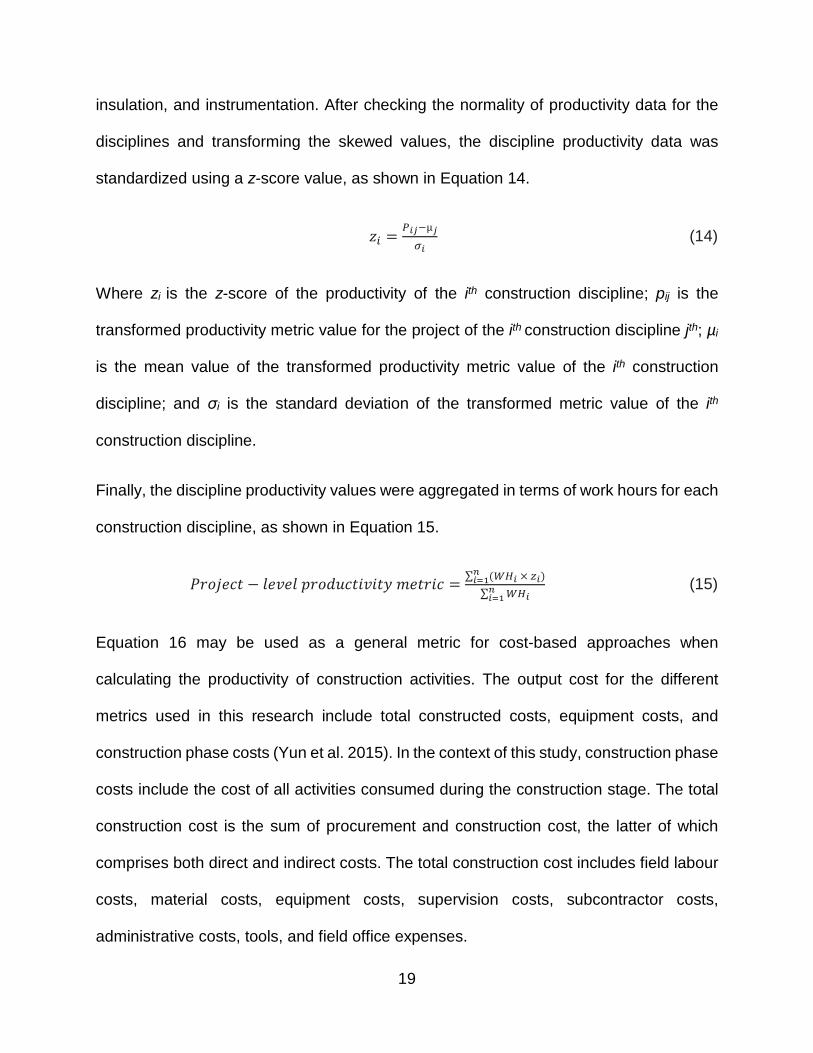
insulation, and instrumentation. After checking the normality of productivity data for the
disciplines and transforming the skewed values, the discipline productivity data was
standardized using a z-score value, as shown in Equation 14.
𝑧𝑧𝑖𝑖 = 𝑃𝑃𝑖𝑖𝑖𝑖−µ𝑖𝑖𝜎𝜎𝑖𝑖
(14)
Where zi is the z-score of the productivity of the ith construction discipline; pij is the
transformed productivity metric value for the project of the ith construction discipline jth; µi
is the mean value of the transformed productivity metric value of the ith construction
discipline; and σi is the standard deviation of the transformed metric value of the ith
construction discipline.
Finally, the discipline productivity values were aggregated in terms of work hours for each
construction discipline, as shown in Equation 15.
𝑃𝑃𝑃𝑃𝑃𝑃𝑃𝑃𝑖𝑖𝑃𝑃𝑃𝑃 − 𝑙𝑙𝑖𝑖𝑃𝑃𝑖𝑖𝑙𝑙 𝑂𝑂𝑃𝑃𝑃𝑃𝑃𝑃𝑃𝑃𝑃𝑃𝑃𝑃𝑃𝑃𝑃𝑃𝑃𝑃𝑃𝑃𝑃𝑃 𝐸𝐸𝑖𝑖𝑃𝑃𝑃𝑃𝑃𝑃𝑃𝑃 = ∑ (𝐸𝐸𝑊𝑊𝑖𝑖 × 𝑧𝑧𝑖𝑖)𝑛𝑛𝑖𝑖=1∑ 𝐸𝐸𝑊𝑊𝑖𝑖𝑛𝑛𝑖𝑖=1
(15)
Equation 16 may be used as a general metric for cost-based approaches when
calculating the productivity of construction activities. The output cost for the different
metrics used in this research include total constructed costs, equipment costs, and
construction phase costs (Yun et al. 2015). In the context of this study, construction phase
costs include the cost of all activities consumed during the construction stage. The total
construction cost is the sum of procurement and construction cost, the latter of which
comprises both direct and indirect costs. The total construction cost includes field labour
costs, material costs, equipment costs, supervision costs, subcontractor costs,
administrative costs, tools, and field office expenses.
20
𝑃𝑃𝑃𝑃𝑃𝑃𝑃𝑃𝑖𝑖𝑃𝑃𝑃𝑃 𝑂𝑂𝑃𝑃𝑃𝑃𝑃𝑃𝑃𝑃𝑃𝑃𝑃𝑃𝑃𝑃𝑃𝑃𝑃𝑃𝑃𝑃𝑃𝑃 𝐸𝐸𝑖𝑖𝑃𝑃𝑃𝑃𝑃𝑃𝑃𝑃 = 𝐶𝐶𝑃𝑃𝑔𝑔𝑃𝑃 𝑜𝑜𝑃𝑃𝑃𝑃 𝑃𝑃𝑃𝑃𝐼𝐼𝑔𝑔𝑃𝑃𝑃𝑃𝑃𝑃𝑃𝑃𝑃𝑃𝑃𝑃𝑃𝑃𝐼𝐼 𝐿𝐿𝑃𝑃𝑃𝑃𝑃𝑃𝑃𝑃𝑃𝑃𝑃𝑃𝑃𝑃𝑖𝑖𝑔𝑔𝑊𝑊𝑃𝑃𝑃𝑃𝑤𝑤 ℎ𝑃𝑃𝑃𝑃𝑃𝑃𝑔𝑔
(16)
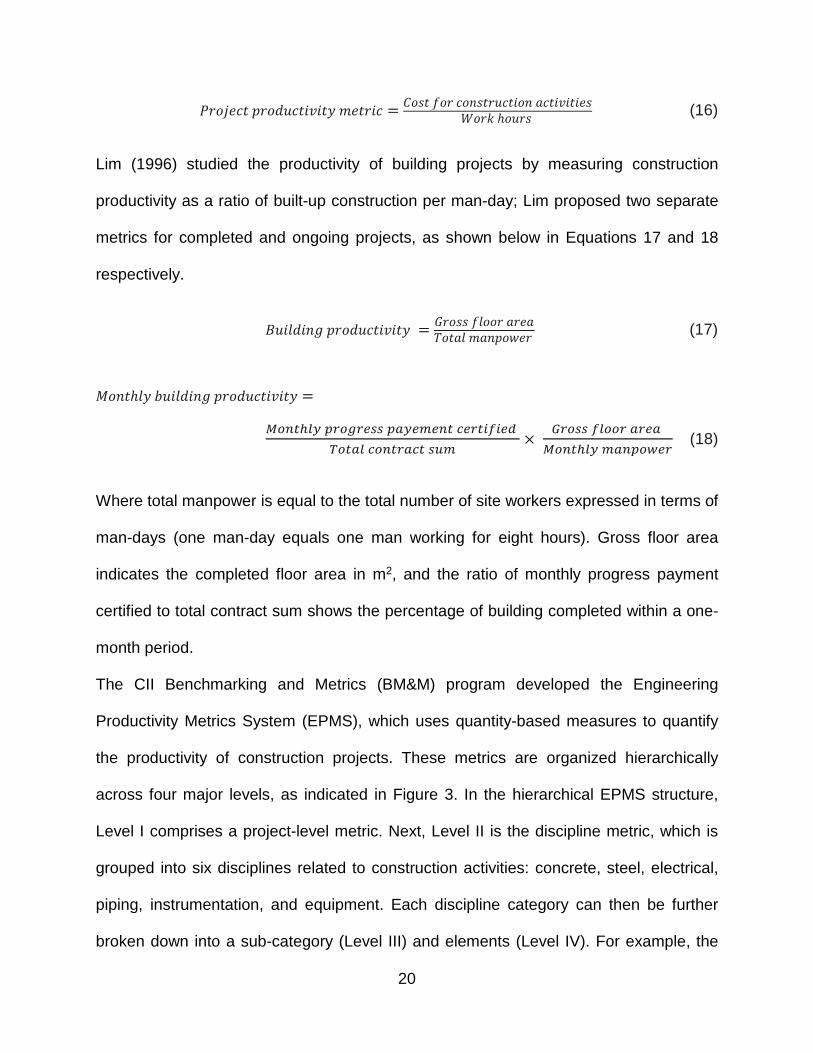
Lim (1996) studied the productivity of building projects by measuring construction
productivity as a ratio of built-up construction per man-day; Lim proposed two separate
metrics for completed and ongoing projects, as shown below in Equations 17 and 18
respectively.
𝐵𝐵𝑃𝑃𝑃𝑃𝑙𝑙𝑃𝑃𝑃𝑃𝐼𝐼𝑔𝑔 𝑂𝑂𝑃𝑃𝑃𝑃𝑃𝑃𝑃𝑃𝑃𝑃𝑃𝑃𝑃𝑃𝑃𝑃𝑃𝑃𝑃𝑃𝑃𝑃 = 𝐺𝐺𝑃𝑃𝑃𝑃𝑔𝑔𝑔𝑔 𝑜𝑜𝑙𝑙𝑃𝑃𝑃𝑃𝑃𝑃 𝐿𝐿𝑃𝑃𝑖𝑖𝐿𝐿𝑇𝑇𝑃𝑃𝑃𝑃𝐿𝐿𝑙𝑙 𝐸𝐸𝐿𝐿𝐼𝐼𝑂𝑂𝑃𝑃𝑤𝑤𝑖𝑖𝑃𝑃 (17)
𝑀𝑀𝑃𝑃𝐼𝐼𝑃𝑃ℎ𝑙𝑙𝑃𝑃 𝐿𝐿𝑃𝑃𝑃𝑃𝑙𝑙𝑃𝑃𝑃𝑃𝐼𝐼𝑔𝑔 𝑂𝑂𝑃𝑃𝑃𝑃𝑃𝑃𝑃𝑃𝑃𝑃𝑃𝑃𝑃𝑃𝑃𝑃𝑃𝑃𝑃𝑃𝑃𝑃 =
𝑀𝑀𝑇𝑇𝑀𝑀𝑇𝑇ℎ𝑇𝑇𝑙𝑙 𝑝𝑝𝑤𝑤𝑇𝑇𝑟𝑟𝑤𝑤𝑤𝑤𝑜𝑜𝑜𝑜 𝑝𝑝𝑇𝑇𝑙𝑙𝑤𝑤𝑝𝑝𝑤𝑤𝑀𝑀𝑇𝑇 𝑐𝑐𝑤𝑤𝑤𝑤𝑇𝑇𝑖𝑖𝑐𝑐𝑖𝑖𝑤𝑤𝑐𝑐 𝑇𝑇𝑇𝑇𝑇𝑇𝑇𝑇𝑇𝑇 𝑐𝑐𝑇𝑇𝑀𝑀𝑇𝑇𝑤𝑤𝑇𝑇𝑐𝑐𝑇𝑇 𝑜𝑜𝑜𝑜𝑝𝑝
× 𝐺𝐺𝑤𝑤𝑇𝑇𝑜𝑜𝑜𝑜 𝑐𝑐𝑇𝑇𝑇𝑇𝑇𝑇𝑤𝑤 𝑇𝑇𝑤𝑤𝑤𝑤𝑇𝑇
𝑀𝑀𝑇𝑇𝑀𝑀𝑇𝑇ℎ𝑇𝑇𝑙𝑙 𝑝𝑝𝑇𝑇𝑀𝑀𝑝𝑝𝑇𝑇𝑤𝑤𝑤𝑤𝑤𝑤 (18)
Where total manpower is equal to the total number of site workers expressed in terms of
man-days (one man-day equals one man working for eight hours). Gross floor area
indicates the completed floor area in m2, and the ratio of monthly progress payment
certified to total contract sum shows the percentage of building completed within a one-
month period.
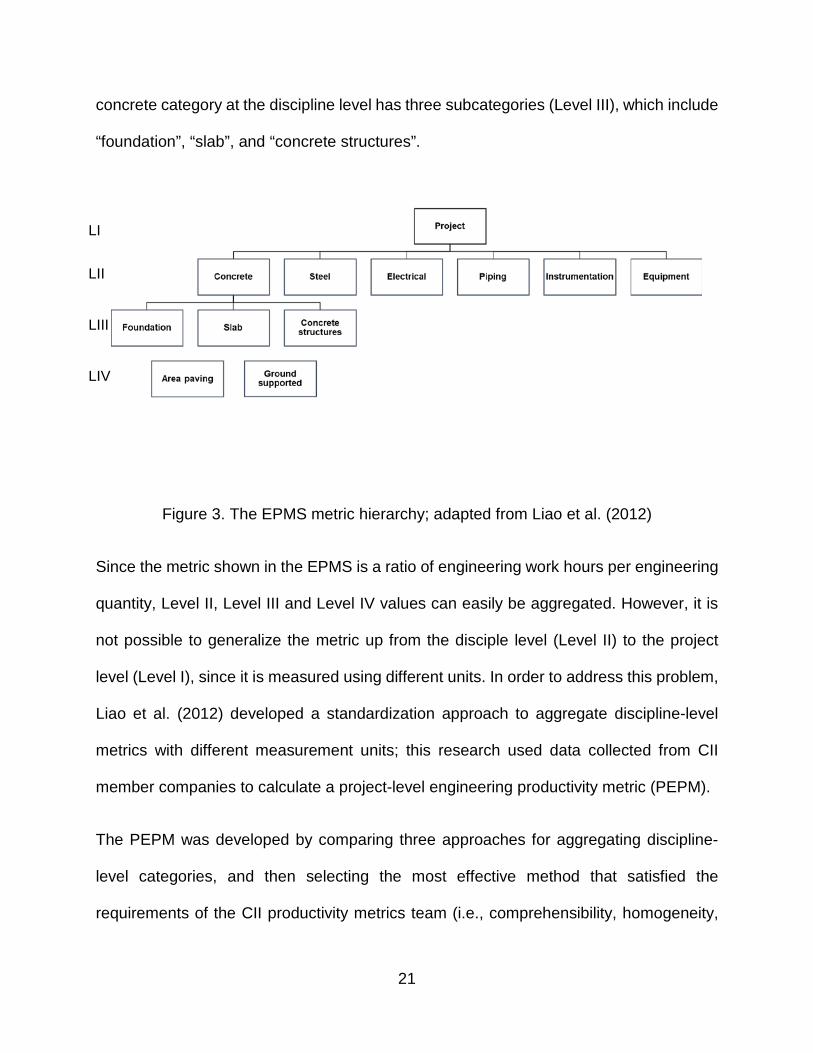
The CII Benchmarking and Metrics (BM&M) program developed the Engineering
Productivity Metrics System (EPMS), which uses quantity-based measures to quantify
the productivity of construction projects. These metrics are organized hierarchically
across four major levels, as indicated in Figure 3. In the hierarchical EPMS structure,
Level I comprises a project-level metric. Next, Level II is the discipline metric, which is
grouped into six disciplines related to construction activities: concrete, steel, electrical,
piping, instrumentation, and equipment. Each discipline category can then be further
broken down into a sub-category (Level III) and elements (Level IV). For example, the
21
concrete category at the discipline level has three subcategories (Level III), which include
“foundation”, “slab”, and “concrete structures”.
Figure 3. The EPMS metric hierarchy; adapted from Liao et al. (2012)
Since the metric shown in the EPMS is a ratio of engineering work hours per engineering
quantity, Level II, Level III and Level IV values can easily be aggregated. However, it is
not possible to generalize the metric up from the disciple level (Level II) to the project
level (Level I), since it is measured using different units. In order to address this problem,
Liao et al. (2012) developed a standardization approach to aggregate discipline-level
metrics with different measurement units; this research used data collected from CII
member companies to calculate a project-level engineering productivity metric (PEPM).
The PEPM was developed by comparing three approaches for aggregating discipline-
level categories, and then selecting the most effective method that satisfied the
requirements of the CII productivity metrics team (i.e., comprehensibility, homogeneity,
LI
LII
LIII
LIV
22
and trending ability). The three approaches that were analyzed for developing a project-
level productivity metric were the earned-value method, the max-min method, and the z-
score method (Liao et al. 2012). The earned-value method uses the ratio of total worked
hours over the predicted amount of work hours for the six disciplines in order to quantify
the productivity at Level I. The maximum-minimum method applies a two-step process to
calculate project-level productivity. The initial step involves standardization, which is done
by subtracting the minimum productivity value at discipline level; next, this value is divided
by the range of the metrics, which is the maximum minus the minimum productivity value.
Finally, the z-score method involves using a statistical method to transform the
engineering productivity metric for every discipline into a dimensionless measure for
aggregation. After comparing the results of the proposed methods, the z-score method
was selected, since it satisfies the requirements of the PM team.
2.3 Measurement of input
When developing productivity metrics, the data that is used for measuring the price of
capital, labour, material, and service can be collected from companies or projects, but for
macroeconomic studies, productivity is calculated based on data that is collected at the
national level (Crawford and Vogl 2006). These inputs are required to undertake and
complete a construction process or activity.
2.3.1 Labour input
Labour input shows effort provided by the workforce in the production system. Due to the
nature of work involved in construction projects, labour input constitutes 33−50% of the
total project contract amount (Hanna et al. 2008). Labour is commonly measured as the
23
total number of hours worked or as labour cost (Thomas et al. 1990). According to OECD
(2001a), the price of labour input is calculated as compensation per hour, which is
expressed with labour income and labour shares that incorporate wages and salaries.
For multifactor productivity calculations, inputs are combined using the corresponding
costs as weights. The OECD (2008) defines labour cost for any industry-level productivity
measurement in terms of three components: compensation of employees, labour income
of self-employed persons, and the sum of tax-free subsidies on labour. The calculations
for labour cost are shown below in Equation 19. For industry-level measurement, the price
value can be collected from national statistical agencies.
𝑊𝑊∗𝑇𝑇 = 𝑊𝑊𝐸𝐸𝑇𝑇 + 𝑊𝑊𝑆𝑆
𝑇𝑇 + 𝑇𝑇𝐿𝐿𝑇𝑇 = 𝑊𝑊𝑇𝑇 + 𝑇𝑇𝐿𝐿𝑇𝑇 (19)
Where 𝑊𝑊∗𝑇𝑇 represents the total labour cost; 𝑊𝑊𝐸𝐸𝑇𝑇 represents compensation of employees,
(i.e., the total gross wages paid to employees in a given accounting period); 𝑊𝑊𝑆𝑆𝑇𝑇 denotes
labour income of self-employed persons, a value which is commonly approximated to be
equivalent to employee income; 𝑇𝑇𝐿𝐿𝑇𝑇 is the sum of tax-free subsidies on labour, which
reflects the difference between the amount the producer is paid and the value of the
transaction to the producer; and 𝑊𝑊𝑇𝑇 represents the total labour cost excluding tax-free
subsidies.
2.3.2 Capital input
Production involves the use of capital to generate output. In productivity measurement
studies, capital is restricted to equipment, structure, and land (Huang et al. 2009). Huang
et al. (2009) point out that in relation to provision of service flow, both capital and labour
24
are similar, but price index data for capital input is not readily available in the same way
it is for labour input.
2.3.3 Intermediate inputs
Intermediate inputs in productivity measurement include energy, material, and business
service. Together with primary inputs, such as capital and labour, these inputs are used
in the construction industry to estimate total factor productivity. The construction process
is an energy-intensive endeavour. According to Sharrard et al. (2007), energy in a
construction project may be consumed in a form of electricity, natural gas, gasoline, and
diesel.
2.4 Measurement of output
At any level of productivity measurement, output can be expressed either as a physical
quantity or as a financial value. Key considerations in assessing the output of production
are the amount of work done or the amount of product produced in the process; these
values indicate the overall result of an activity (OECD 2001). The type of measurement
method selected depends on the objective of the measurement and on the availability of
data. Sezer and Bröchner (2013) point out that the challenges in quantifying output are
mainly due to the difficulty in determining what it includes, given the diverse nature of
construction projects and the absence of data.
At the industry level, the OECD (2001) measures productivity as a ratio of the quantity
index of output to input, where the output is mainly expressed as value added or as gross
output. Gross output represents the service or product available for use; it includes the
value of sales, depreciation, consumption of fixed capital, and net additions to inventories,
25
among other things. In the context of value added, intermediate inputs that are used up
by the production process are deducted from the gross output value (OECD 2001). A
different approach can be adopted for calculating the quantity index of output using the
index number. These approaches address the issue of heterogeneity in output by
concentrating on the disaggregated prices and quantities of output. Commonly used index
formulae include the Laspeyrse, Passche, Fisher, and Törnqvist indices (OECD 2001).
According to the Office of National Statistics UK, output in the construction industry is
calculated in current prices and chained volume measures from data collected through
monthly surveys of the value of construction work.
In project-level productivity measurement, outputs can be expressed in terms of functional
units. Thomas et al. (1990) examined a case from the United States Federal Highway
Administration in which the productivity of a highway project was measured by taking
using the amount of resources used in design, inspection, construction, and right of way
as inputs, and then measuring the output in physical units, or in this case, lane miles.
Thomas et al. (1990) also proposed a method for measuring project-level productivity by
accounting for labour, equipment, and material inputs as a dollar value, and then
measuring the output as physical units (i.e., square feet). In addition, Bröchner and
Olofsson (2012) studied productivity measures for innovation projects by comparing the
same type of beam bridge projects, all of which were constructed during a 30-year period.
The output measure used for the purpose of this study was the usable area of the
constructed facility; this value was subject to a correction factor related to the flexibility of
structural technology. Other research that utilized area measures within a productivity
metric system include work by Lim (1996), which considered built-up construction per
26
man-day to measure the productivity of building projects. In contrast, Ellis and Lee (2006)
used equivalent work units (EWU) to calculate the total output of a transportation project.
In this context, EWU represents the amount of work that can be completed within an eight-
hour work period. Ellis and Lee (2006) emphasize the need for using the collective value
of all work items to express the global project productivity value. EWU-based approaches
for determining overall output require that each activity in a project be weighted in order
to develop a composite unit; however, such data can be difficult to analyze for complex
projects involving many different activities. Moreover, when applying EWU to normalize
and aggregate output, this method does not consider the variance of the installed
quantities for each work item or activity, which results in an imprecise project-level
productivity value.
For activity-level productivity measurement in construction projects, the commonly
adopted output measure is based on quantity (Thomas et al. 1990, CII 2013, Park 2006).
According to CII (2013), when measuring the productivity of a construction activity, the
output quantity unit must be measured with precision, and the unit itself should also be
convenient for measurement and computation. CII (2013) notes five major quantity
measurement methods along with their advantages and disadvantages. Keane and
Caletka (2008) and Humphreys (2004) describe these quantity measures as methods for
measuring work progress. The methods include unit measures, incremental milestones,
start /finish, level of effort or cost ratio, and observational assessment. Unit measures can
be used for tracking tasks that are done repeatedly. This method of measurement
provides a detailed and accurate value for project control; however, the major drawback
of this approach is that it requires extensive data collection (CII 2013). Incremental
27
milestones are another quantity measurement method, which require documentation of
each step as a mini-milestone that represents a percentage of the total installation
process. This method is used for cost accounting involving tasks that need to be
completed in a linear fashion. For activities without intermediate milestones, start/finish
measurement can be implemented by focusing on the starting and finishing points of a
task. When using the start/finish technique, the percentage of progress is assigned when
the task starts, based on agreement between contractor and owner of the project. One
hundred percent of progress is achieved when the task is considered complete. For non-
critical tasks, simple and quick observational assessment can be done on the progress
of the task at hand. Observational assessment of percent complete is a subjective method
that relies on the experience and opinion of a project manager to determine project status.
Finally, the cost-ratio method of measurement is applicable to tasks that are continuous
throughout the lifecycle of a project.
The equivalent unit measurement of output is another method that can be implemented
to express the final product of sub-tasks within an activity, which have different units of
measurement (Keane and Caletka 2008). This method is used for complicated activities
with overlapping subtasks. In this approach, each sub-task is given a weighted value in
equivalent units, which are then used for calculating a composite unit of measurement.
The allocated weights in this technique are determined by estimating the level of effort
required to complete a task (Keane and Caletka 2008).
2.5 Summary
In summary, the progress of construction projects involves many concurrent and
interrelated activities. The metrics employed for assessing project productivity often focus
28
on selected activities, despite the fact that the success of a project depends on the
performance of all activities. In general, past methods have focused on evaluating
productivity using labour input, and limited attention has been given to the development
of a metric that accounts for all resources used in a project. Moreover, there is also a lack
of standards for determining which components should be included as inputs in
productivity measurement.
29
3. Methodology
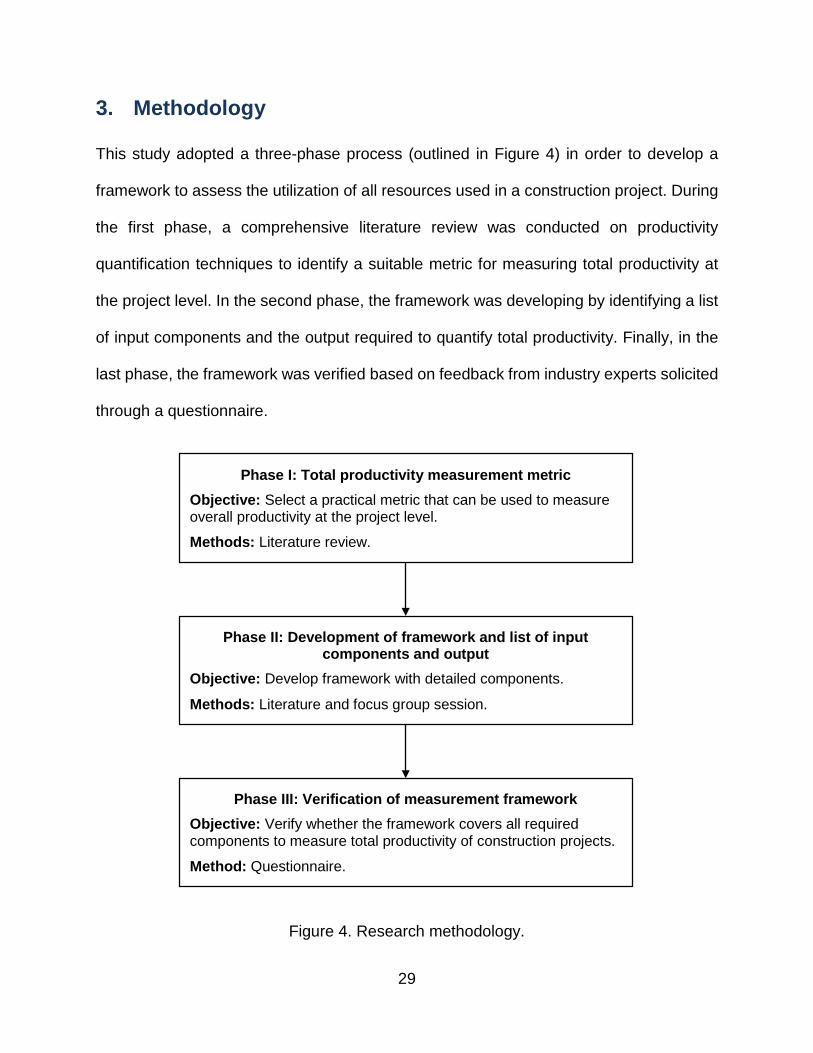
This study adopted a three-phase process (outlined in Figure 4) in order to develop a
framework to assess the utilization of all resources used in a construction project. During
the first phase, a comprehensive literature review was conducted on productivity
quantification techniques to identify a suitable metric for measuring total productivity at
the project level. In the second phase, the framework was developing by identifying a list
of input components and the output required to quantify total productivity. Finally, in the
last phase, the framework was verified based on feedback from industry experts solicited
through a questionnaire.
Figure 4. Research methodology.
Phase I: Total productivity measurement metric Objective: Select a practical metric that can be used to measure overall productivity at the project level. Methods: Literature review.
Phase II: Development of framework and list of input components and output
Objective: Develop framework with detailed components. Methods: Literature and focus group session.
Phase III: Verification of measurement framework Objective: Verify whether the framework covers all required components to measure total productivity of construction projects. Method: Questionnaire.
30
4. Total productivity measurement framework
Measuring the total productivity of a construction project can be a challenging process.
These challenges stem from the complexity in determining the components of an
appropriate metric. This report proposes a framework to measure the total productivity of
construction projects. The framework consists of a metric, its components, the basis for
quantifying each component, and the data required for measurement.
4.1 Phase I: Total productivity measurement metric
To propose a metric that can assess the impact of all resource inputs used in a
construction project, a review of productivity studies was conducted at different levels of
the production system (i.e., industry, project, and activity levels). One of the main
differences between these different methods for measuring total productivity lies in the
methodology adopted to quantify the elements of the metrics. This study proposes the
equation shown below (Equation 20) as a metric to measure the total productivity in
construction projects. In this case, tangible output represents physical units of project
output (e.g., km for a highway project or m for a pipeline project). Tangible inputs include
labour, material, capital, energy, and other expenses quantified as a dollar value.
𝑇𝑇𝑃𝑃𝑃𝑃𝐿𝐿𝑙𝑙 𝑂𝑂𝑃𝑃𝑃𝑃𝑃𝑃𝑃𝑃𝑃𝑃𝑃𝑃𝑃𝑃𝑃𝑃𝑃𝑃𝑃𝑃 = 𝑇𝑇𝑇𝑇𝑀𝑀𝑟𝑟𝑖𝑖𝑇𝑇𝑇𝑇𝑤𝑤 𝑇𝑇𝑜𝑜𝑇𝑇𝑝𝑝𝑜𝑜𝑇𝑇 (𝑃𝑃ℎ𝑙𝑙𝑜𝑜𝑖𝑖𝑐𝑐𝑇𝑇𝑇𝑇 𝑜𝑜𝑀𝑀𝑖𝑖𝑇𝑇)𝑇𝑇𝑇𝑇𝑀𝑀𝑟𝑟𝑖𝑖𝑇𝑇𝑇𝑇𝑤𝑤 𝑖𝑖𝑀𝑀𝑝𝑝𝑜𝑜𝑇𝑇𝑜𝑜 ($)
(20)
4.2 Phase II: Development of list of input components
After proposing a total productivity metric, a list of components was established to be
included as part of each input resource category. Each input resource is quantified in
terms of amount of labour, equipment, energy, material, and other expenses. Cost
31
elements associated with each of these input categories are grouped in terms of phase
in the construction process. Chang et al. (2001) propose five project phases: pre-project
planning, detailed design, procurement (material management), construction, and start-
up and commissioning. For the purpose of the research discussed in this report, the
project lifecycle is grouped into five phases, which are based on CII performance
assessment project classifications: initiation, planning and design, procurement,
construction, and commissioning and start-up (Choi et al. 2016). The phases consist of
overlapping activities linked with each other by the produced outputs or deliverables.
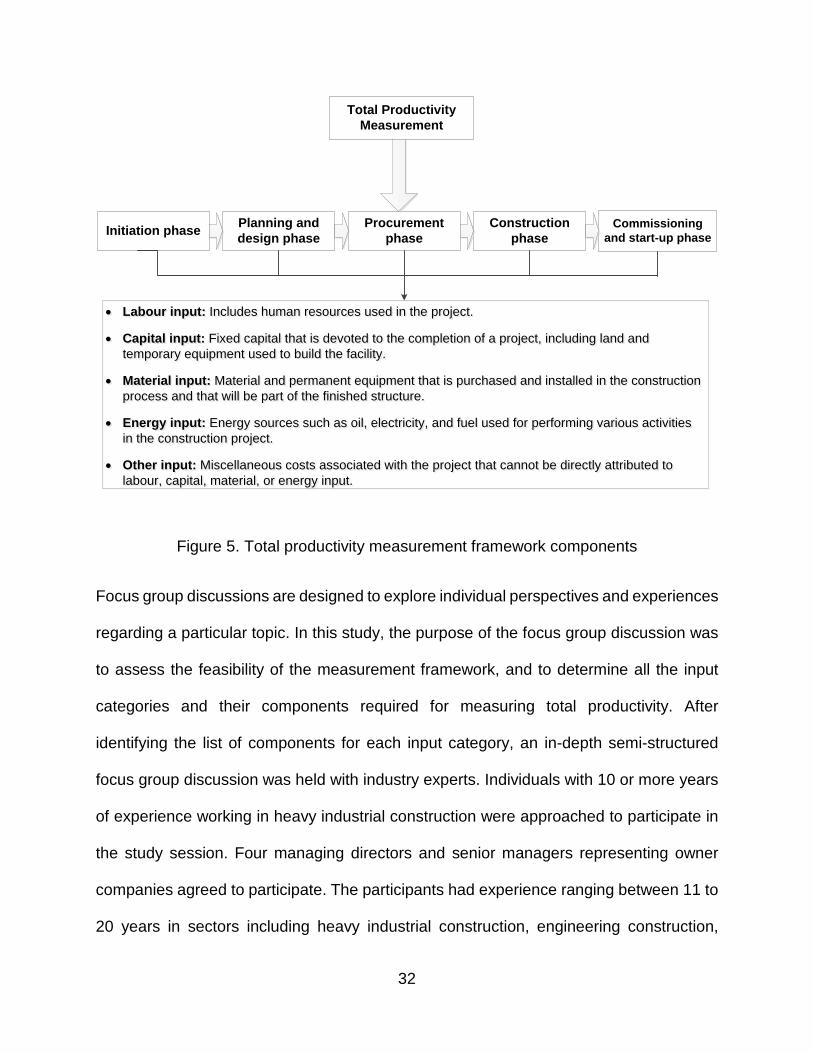
Using the typical cost components and major participants list developed during the first
phase (see Appendix A), along with the definitions shown in Figure 5, the components of
each input category were outlined. After proposing a metric and developing a list of
components required for measuring productivity, a focus group discussion was held with
industry experts to assess the completeness and viability of the measurement framework.
32
Total Productivity Measurement
Initiation phase Planning and design phase
Procurement phase
Commissioning and start-up phase
Construction phase
• Labour input: Includes human resources used in the project.
• Capital input: Fixed capital that is devoted to the completion of a project, including land and temporary equipment used to build the facility.
• Material input: Material and permanent equipment that is purchased and installed in the construction process and that will be part of the finished structure.
• Energy input: Energy sources such as oil, electricity, and fuel used for performing various activities in the construction project.
• Other input: Miscellaneous costs associated with the project that cannot be directly attributed to labour, capital, material, or energy input.
Figure 5. Total productivity measurement framework components
Focus group discussions are designed to explore individual perspectives and experiences
regarding a particular topic. In this study, the purpose of the focus group discussion was
to assess the feasibility of the measurement framework, and to determine all the input
categories and their components required for measuring total productivity. After
identifying the list of components for each input category, an in-depth semi-structured
focus group discussion was held with industry experts. Individuals with 10 or more years
of experience working in heavy industrial construction were approached to participate in
the study session. Four managing directors and senior managers representing owner
companies agreed to participate. The participants had experience ranging between 11 to
20 years in sectors including heavy industrial construction, engineering construction,
33
institutional commercial construction, and home building and renovation. The participants
held the following positions within their respective companies: vice-president, general
manager, manger, and director.
The discussion was initiated by providing an overview of the research and the aim of the
focus group discussion. Each participant was asked a series of questions related to their
perspective on the utilized approach, input categories, and challenges pertaining to the
approach. In addition, a questionnaire was provided during the discussion session, which
is available in Appendix B. The form comprises three sections, the first of which covers
general demographic information, such as total years of experience and current
occupation. In the second section, open-ended questions are provided to assess experts’
opinions regarding the feasibility of the metric, the method of quantifying output and
inputs, categorization of inputs, and any potential challenges they could foresee
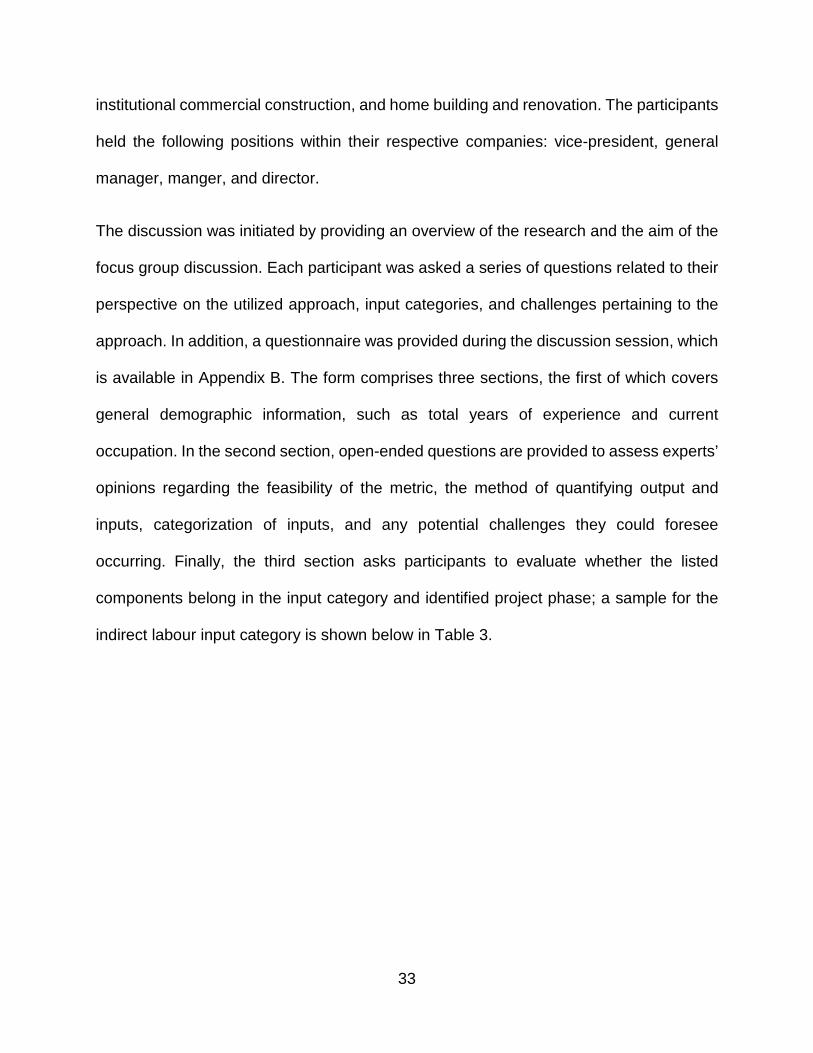
occurring. Finally, the third section asks participants to evaluate whether the listed
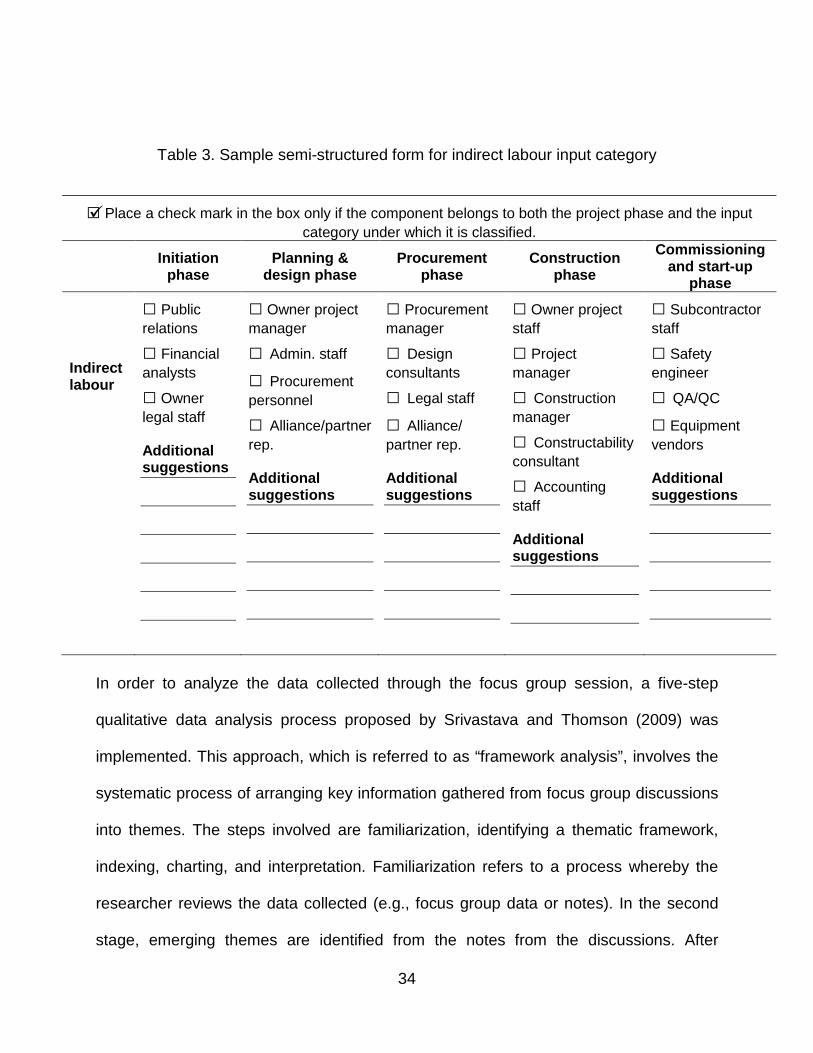
components belong in the input category and identified project phase; a sample for the
indirect labour input category is shown below in Table 3.
34
Table 3. Sample semi-structured form for indirect labour input category
In order to analyze the data collected through the focus group session, a five-step
qualitative data analysis process proposed by Srivastava and Thomson (2009) was
implemented. This approach, which is referred to as “framework analysis”, involves the
systematic process of arranging key information gathered from focus group discussions
into themes. The steps involved are familiarization, identifying a thematic framework,
indexing, charting, and interpretation. Familiarization refers to a process whereby the
researcher reviews the data collected (e.g., focus group data or notes). In the second
stage, emerging themes are identified from the notes from the discussions. After
□ Place a check mark in the box only if the component belongs to both the project phase and the input category under which it is classified.
Initiation phase
Planning & design phase
Procurement phase
Construction phase
Commissioning and start-up
phase Indirect labour
□ Public relations
□ Financial analysts
□ Owner legal staff Additional suggestions
□ Owner project manager
□ Admin. staff
□ Procurement personnel
□ Alliance/partner rep. Additional suggestions
□ Procurement manager
□ Design consultants
□ Legal staff
□ Alliance/ partner rep. Additional suggestions
□ Owner project staff
□ Project manager
□ Construction manager
□ Constructability consultant
□ Accounting staff Additional suggestions
□ Subcontractor staff
□ Safety engineer
□ QA/QC
□ Equipment vendors Additional suggestions
35
identifying the themes, the data are labelled to correspond to a particular theme. In the
charting step, the labelled data are arranged in the themes. The final stage involves
analysis of key points identified in each theme. The framework analysis method was
chosen, because it has been well-established in social science research projects for the
analysis of semi-structured interviews and textual data, including documents such as
meeting minutes, diaries, and field notes from observations (Albanesi 2014; Leavy and
Phillips 2014). The method provides clear steps to follow and offers structured output for
qualitative data. Following the analysis, five main themes were identified from participant
responses: proposed total productivity metric, method of quantification of input and
output, project phase classification, categorization of tangible inputs, and limitation of the
proposed technique and difficulty associated with the approach.
4.2.1 Proposed total productivity metric
The total productivity metric is expressed as a ratio of total tangible output to total tangible
input. The participants involved in the research study agreed on the developed metric and
felt that it properly captures the total productivity of construction projects by measuring
effectiveness in resource utilization. Studies link efficiency to “doing things right”, which
may be interpreted as consumption of available resources to a satisfactory level (Yi and
Chan 2014, Sundqvist et al. 2014). Effectiveness, on the other hand, is expressed as
“doing the right things”, where the focus is on producing an output in accordance to
specified characteristics (Pekuri et al. 2011, Sundqvist et al. 2014). Productivity can thus
be considered as a combined measure of effectiveness and efficiency (Pekuri et al. 2011,
Roghanian et al. 2012). One participant pointed out that the commonly adopted procedure
36
for capturing capital effectiveness and efficiency in their company is to break the project
elements into different activities, and assessing the cost required to complete an activity.
4.2.2 Method of quantification of input and output
All participants agreed with the quantification method proposed for both input and output.
The participants indicated that measuring input in terms of dollar value and output as a
physical unit is a good approach for future benchmarking purposes and for comparing the
productivity of a wide variety of projects.
4.2.3 Project phase classification
Understanding the phases involved in the project lifecycle is essential for successfully
guiding a project from initiation to completion. The participants expressed that in the
construction industry, there are different ways to describe construction processes. The
participants agreed with the appropriateness of the project phase classification adopted
in this study, which involves the following five steps: initiation, planning and design,
procurement, construction, and commissioning and start-up. The participants mentioned
that for sectors involved in heavy industrial construction, measurement of project
performance should be done after the investment decision, and it should not include any
of the cost elements associated with the initiation phase of the project.
4.2.4 Categorization of tangible inputs
The participants agreed that the categorization of tangible inputs into labour, capital,
material, and energy in the metric is consistent with respect to common practices in the
construction industry. Participants suggested a modification related to the other expense
input cost category. According to the participants, the commonly adopted cost categories
37
in the heavy industrial construction sector include owner cost, engineering cost,
procurement cost, and construction cost. While input categories suggested in this
research, such as labour, material, capital, and energy, can be derived from commonly
adopted cost classifications, other expense input components were not consistently
interpreted by users of the framework. In order to address this problem, participants
suggested the creation of a separate input category, which considers an indirect cost
input component and owner cost. As a result, the other expense input category
components were re-distributed to construction project indirect input and owner cost
input.
Furthermore, it was indicated that having a common approach for collecting input data
would aid in the development of a standardized data collection approach that is suitable
for use by companies. Companies can also customize the framework to fit the project,
depending on their sector of involvement in the construction industry. One participant
mentioned that a similar approach had previously been adopted within their company to
compare projects. Under this approach, all associated costs are listed, and the cost
elements not common to all the projects can be removed in order to facilitate cost
comparison. Therefore, based on feedback from the participants, the initial framework
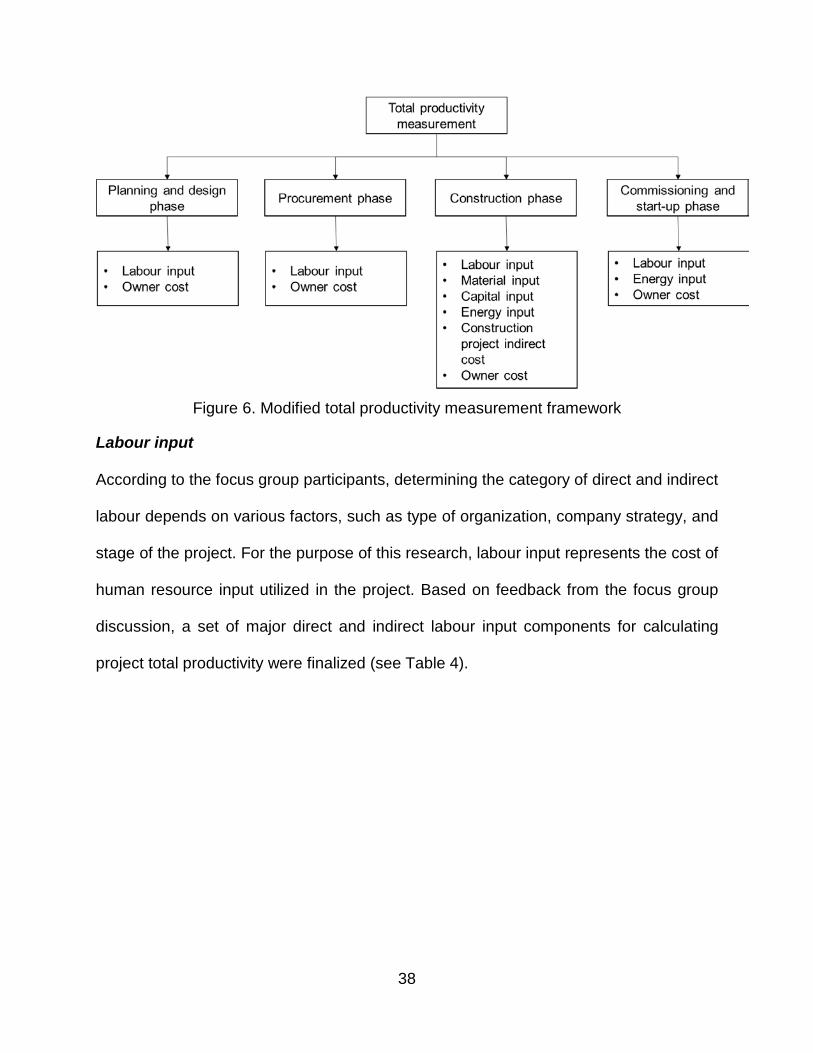
shown in Figure 5 was later modified, as is shown in Figure 6. In the modified framework,
input quantification for total productivity measurement is initiated during the planning and
design stage. In addition, the other expense input is further grouped into construction
project indirect and owner costs. The description and list of components for each input
category is discussed below.
38
Figure 6. Modified total productivity measurement framework
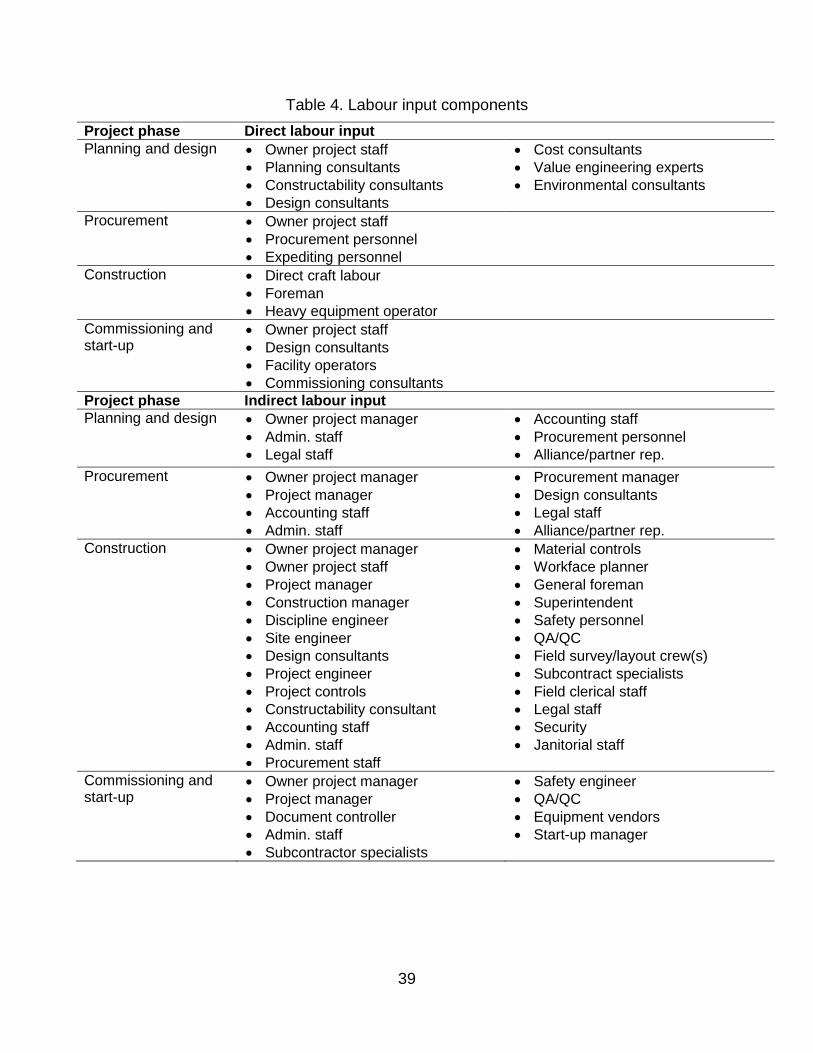
Labour input
According to the focus group participants, determining the category of direct and indirect
labour depends on various factors, such as type of organization, company strategy, and
stage of the project. For the purpose of this research, labour input represents the cost of
human resource input utilized in the project. Based on feedback from the focus group
discussion, a set of major direct and indirect labour input components for calculating
project total productivity were finalized (see Table 4).
39
Table 4. Labour input components Project phase Direct labour input Planning and design • Owner project staff
• Planning consultants • Constructability consultants • Design consultants
• Cost consultants • Value engineering experts • Environmental consultants
Procurement • Owner project staff • Procurement personnel • Expediting personnel
Construction • Direct craft labour • Foreman • Heavy equipment operator
Commissioning and start-up
• Owner project staff • Design consultants • Facility operators • Commissioning consultants
Project phase Indirect labour input Planning and design • Owner project manager
• Admin. staff • Legal staff
• Accounting staff • Procurement personnel • Alliance/partner rep.
Procurement • Owner project manager • Project manager • Accounting staff • Admin. staff
• Procurement manager • Design consultants • Legal staff • Alliance/partner rep.
Construction • Owner project manager • Owner project staff • Project manager • Construction manager • Discipline engineer • Site engineer • Design consultants • Project engineer • Project controls • Constructability consultant • Accounting staff • Admin. staff • Procurement staff
• Material controls • Workface planner • General foreman • Superintendent • Safety personnel • QA/QC • Field survey/layout crew(s) • Subcontract specialists • Field clerical staff • Legal staff • Security • Janitorial staff
Commissioning and start-up
• Owner project manager • Project manager • Document controller • Admin. staff • Subcontractor specialists
• Safety engineer • QA/QC • Equipment vendors • Start-up manager
40
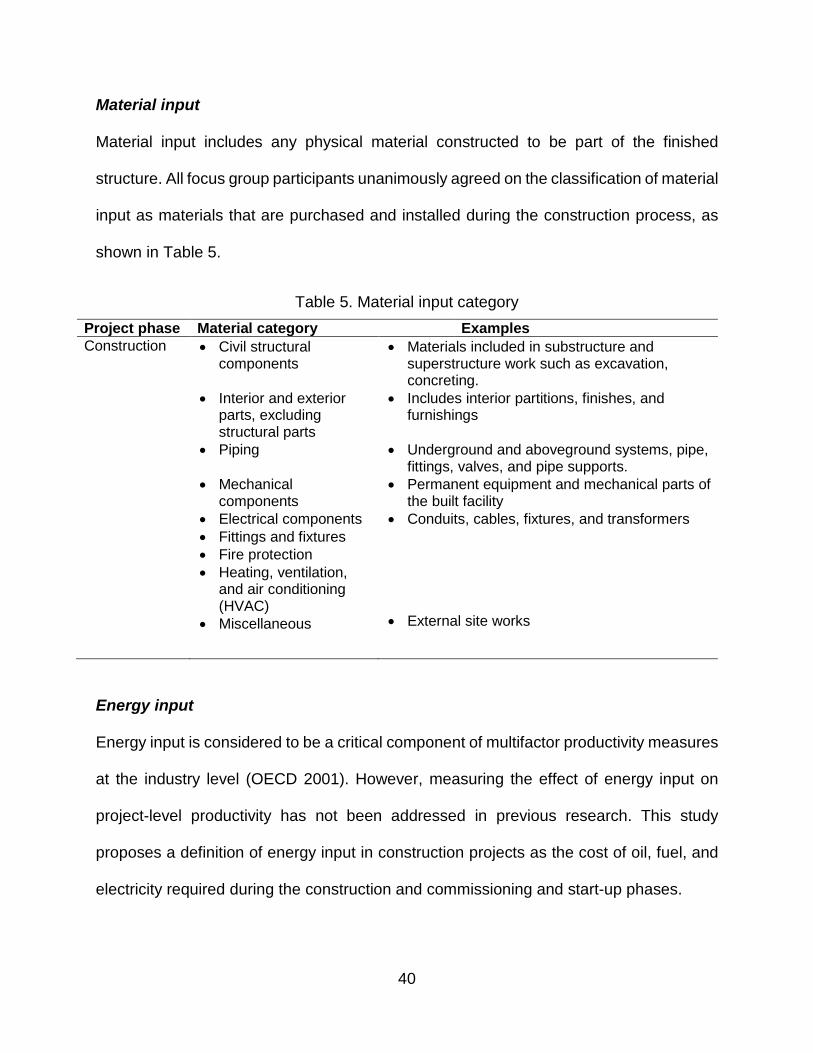
Material input
Material input includes any physical material constructed to be part of the finished
structure. All focus group participants unanimously agreed on the classification of material
input as materials that are purchased and installed during the construction process, as
shown in Table 5.
Table 5. Material input category Project phase Material category Examples Construction • Civil structural
components
• Interior and exterior parts, excluding structural parts
• Piping
• Mechanical components
• Electrical components • Fittings and fixtures • Fire protection • Heating, ventilation,
and air conditioning (HVAC)
• Miscellaneous
• Materials included in substructure and superstructure work such as excavation, concreting.
• Includes interior partitions, finishes, and furnishings
• Underground and aboveground systems, pipe, fittings, valves, and pipe supports.
• Permanent equipment and mechanical parts of the built facility
• Conduits, cables, fixtures, and transformers • External site works
Energy input
Energy input is considered to be a critical component of multifactor productivity measures
at the industry level (OECD 2001). However, measuring the effect of energy input on
project-level productivity has not been addressed in previous research. This study
proposes a definition of energy input in construction projects as the cost of oil, fuel, and
electricity required during the construction and commissioning and start-up phases.
41
Participants agreed with the proposed energy input category. However, many participants
noted that energy is not tracked as a separate input component in their companies;
instead, energy is considered as an overhead cost. It was indicated that extraction of
energy consumption data might be useful for companies, depending on the nature of the
project; this data can be used to track carbon efficiency in a project. Participants also
suggested that energy consumption analysis for total productivity measurement should
be performed only at the construction and commissioning and start-up phases of the
project, since energy consumption for other phases will be insignificant.
Capital input
The meaning of capital varies across disciplines. In the context of economics, capital input
includes any tool that is used to produce goods and services (Goodrum and Haas 2002).
In productivity measurement studies, capital is restricted to equipment and land that has
been used in the production system. Intangible assets such as organizational effort,
software development, and advertisement costs are excluded during capital input
calculation (Huang et al. 2009). Goodrum and Haas (2002) separate capital input into
fixed and circulating capital. Fixed capital includes buildings and equipment used in the
production process. Circulating capital refers to the available funds required for
purchasing raw materials. In this study, capital input denotes fixed capital that is devoted
to the completion of a project, and it represents temporary equipment used to build the
facility. Temporary equipment costs include direct (e.g., rental or ownership, tires, and
filters) and indirect costs (e.g., maintenance, depreciation, and insurance).
42
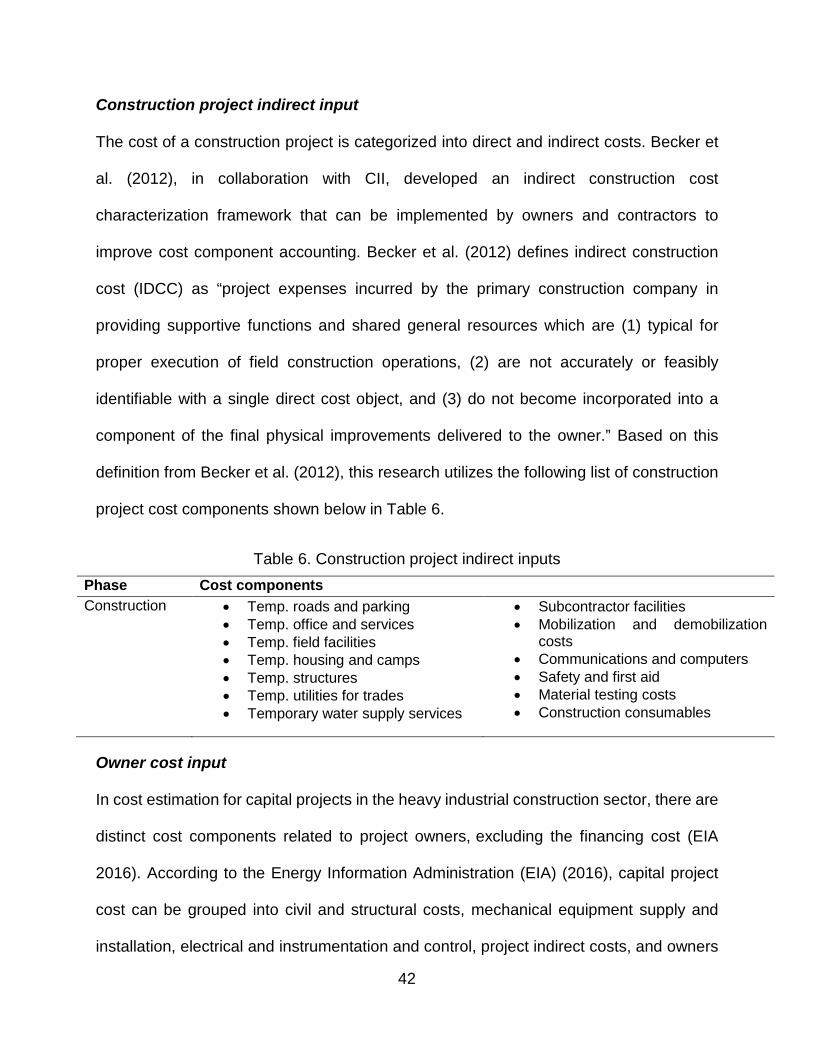
Construction project indirect input
The cost of a construction project is categorized into direct and indirect costs. Becker et
al. (2012), in collaboration with CII, developed an indirect construction cost
characterization framework that can be implemented by owners and contractors to
improve cost component accounting. Becker et al. (2012) defines indirect construction
cost (IDCC) as “project expenses incurred by the primary construction company in
providing supportive functions and shared general resources which are (1) typical for
proper execution of field construction operations, (2) are not accurately or feasibly
identifiable with a single direct cost object, and (3) do not become incorporated into a
component of the final physical improvements delivered to the owner.” Based on this
definition from Becker et al. (2012), this research utilizes the following list of construction
project cost components shown below in Table 6.
Table 6. Construction project indirect inputs Phase Cost components Construction • Temp. roads and parking
• Temp. office and services • Temp. field facilities • Temp. housing and camps • Temp. structures • Temp. utilities for trades • Temporary water supply services
• Subcontractor facilities • Mobilization and demobilization
costs • Communications and computers • Safety and first aid • Material testing costs • Construction consumables
Owner cost input
In cost estimation for capital projects in the heavy industrial construction sector, there are
distinct cost components related to project owners, excluding the financing cost (EIA
2016). According to the Energy Information Administration (EIA) (2016), capital project
cost can be grouped into civil and structural costs, mechanical equipment supply and
installation, electrical and instrumentation and control, project indirect costs, and owners
43
costs. The owner cost input category includes expenses incurred by the owner to bring
the project to commercially operable status. Table 7 shows the components associated
with owner cost that cannot be directly attributed to labour input, material input, capital
input, energy input, and construction project indirect input.
Table 7. Owner input cost components Project phase Owner cost input components Planning and design
• Office equipment and consumables • Environmental costs • Site analysis and surveying • Legal expenses • Permitting costs
• Advertising costs • Bidding costs • Training of personnel • Travel expenses
Procurement
• Office equipment and consumables • Advertising costs • Travel expenses
Construction
• Office equipment and consumables • Insurance • Taxes and duties • Site development outside of project
boundaries • Safety program • Contingency • Legal services
• Escalation • Personnel training costs • Environmental and mitigation costs • Permits (construction-related) • Travel expenses • Transportation expenses
Commissioning and start-up
• Office equipment and consumables • Handover costs • Operating costs
• Staff training and preparation of necessary documents for operation
• Clean-up costs • Travel expenses
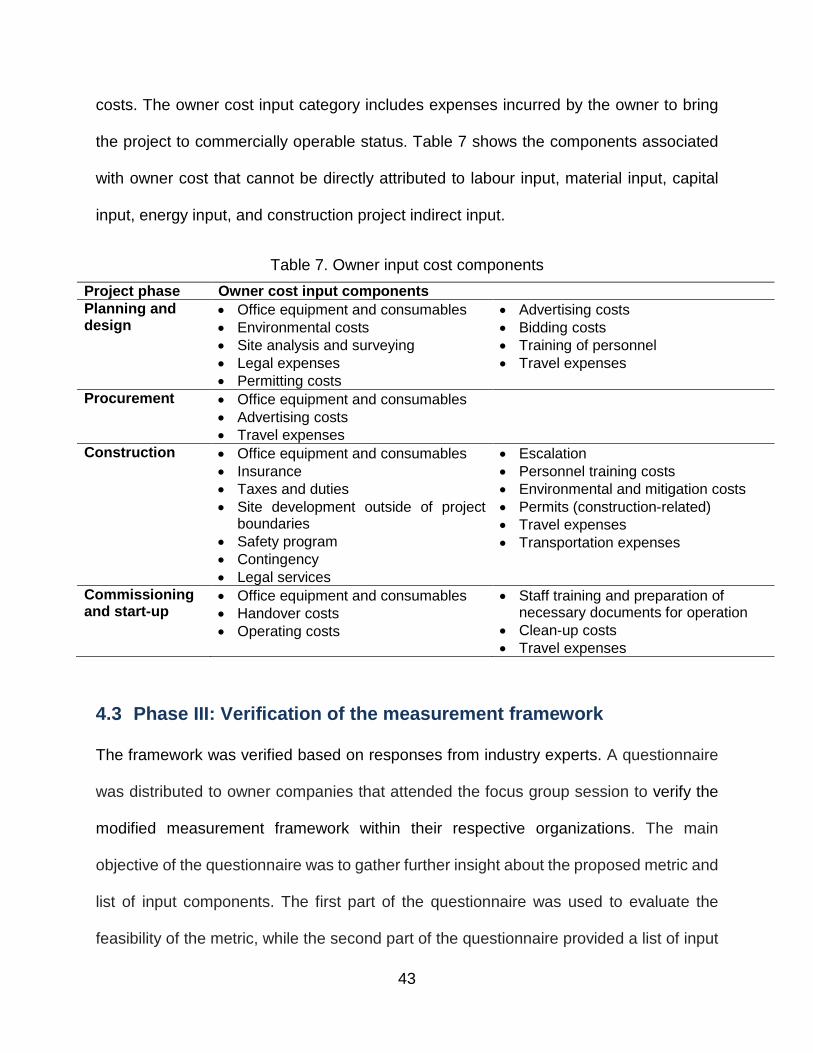
4.3 Phase III: Verification of the measurement framework
The framework was verified based on responses from industry experts. A questionnaire
was distributed to owner companies that attended the focus group session to verify the
modified measurement framework within their respective organizations. The main
objective of the questionnaire was to gather further insight about the proposed metric and
list of input components. The first part of the questionnaire was used to evaluate the
feasibility of the metric, while the second part of the questionnaire provided a list of input
44
components in each category and was used to evaluate whether respondents agreed that
each listed input component belongs in the specified phase and input category.
Four completed questionnaires were received back from the participating companies. The
respondents had between 11 and 20 years of experience in sections including heavy
industrial construction, home building and renovation, engineering construction,
institutional and commercial construction. Respondents held the following positions within
their respective organizations: senior engineer, technical lead, engineer technologist, and
field engineer technologist.
The survey results were similar to the focus group discussion, and all respondents agreed
with the proposed metric. Furthermore, it was noted that even though the list of input
components might be used as a basis for data collection, the metric may face challenges
related to accuracy in cost tracking and allocation of the measurement components.
Based on a literature review, as well as responses from focus group discussion and
survey questionnaires, a final list of the categories and components of the productivity
metric was established (Table 8). The presented list of input components can be used to
calculate the total productivity of construction projects.
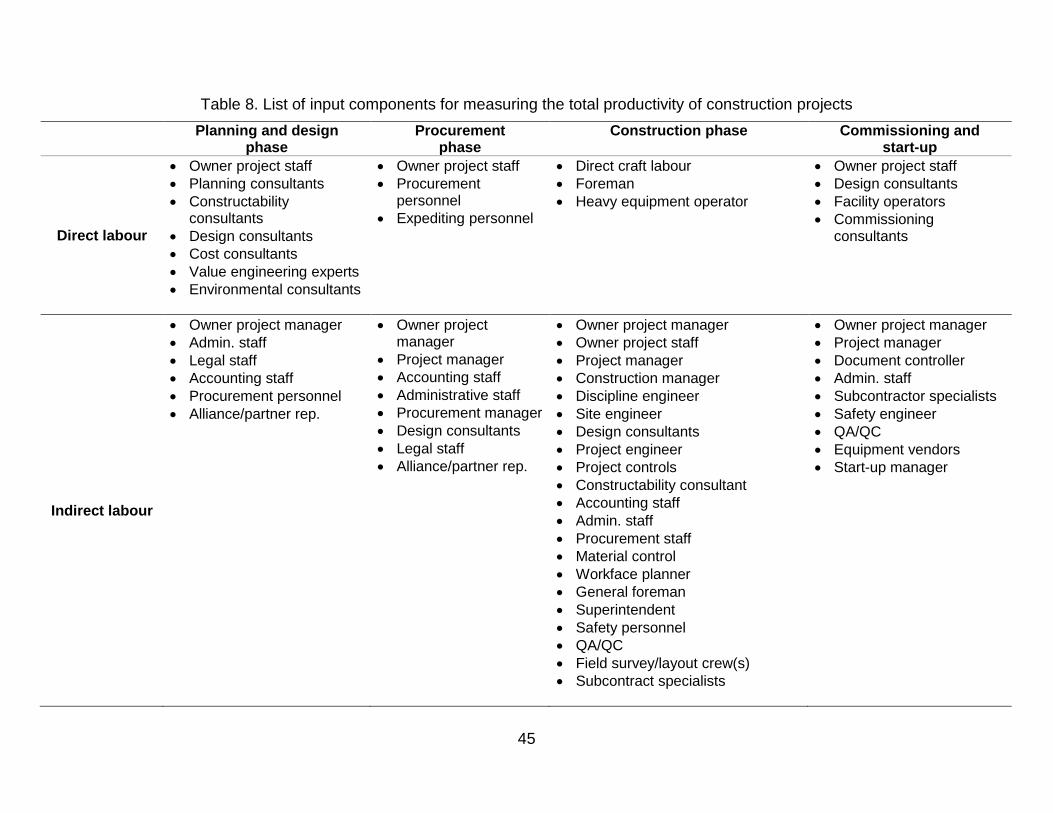
45
Table 8. List of input components for measuring the total productivity of construction projects Planning and design
phase Procurement
phase Construction phase Commissioning and
start-up
Direct labour
• Owner project staff • Planning consultants • Constructability
consultants • Design consultants • Cost consultants • Value engineering experts • Environmental consultants
• Owner project staff • Procurement
personnel • Expediting personnel
• Direct craft labour • Foreman • Heavy equipment operator
• Owner project staff • Design consultants • Facility operators • Commissioning
consultants
Indirect labour
• Owner project manager • Admin. staff • Legal staff • Accounting staff • Procurement personnel • Alliance/partner rep.
• Owner project manager
• Project manager • Accounting staff • Administrative staff • Procurement manager • Design consultants • Legal staff • Alliance/partner rep.
• Owner project manager • Owner project staff • Project manager • Construction manager • Discipline engineer • Site engineer • Design consultants • Project engineer • Project controls • Constructability consultant • Accounting staff • Admin. staff • Procurement staff • Material control • Workface planner • General foreman • Superintendent • Safety personnel • QA/QC • Field survey/layout crew(s) • Subcontract specialists
• Owner project manager • Project manager • Document controller • Admin. staff • Subcontractor specialists • Safety engineer • QA/QC • Equipment vendors • Start-up manager
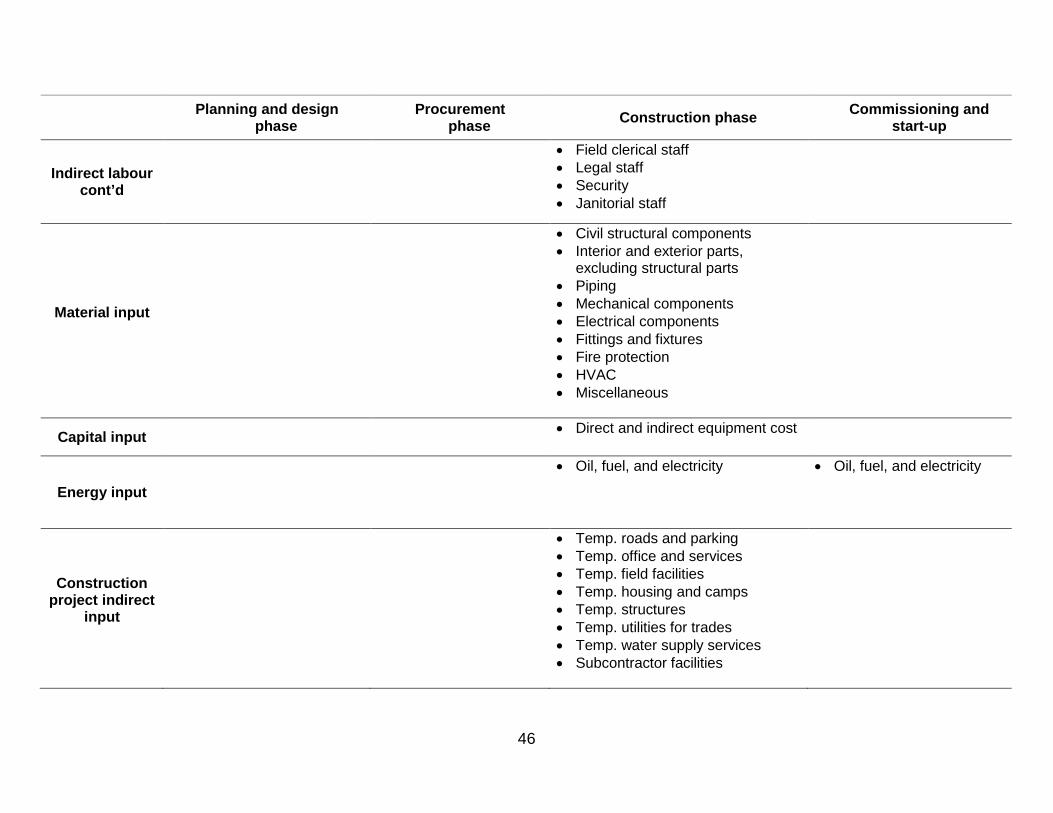
46
Planning and design phase
Procurement phase Construction phase Commissioning and
start-up
Indirect labour cont’d
• Field clerical staff • Legal staff • Security • Janitorial staff
Material input
• Civil structural components • Interior and exterior parts,
excluding structural parts • Piping • Mechanical components • Electrical components • Fittings and fixtures • Fire protection • HVAC • Miscellaneous
Capital input • Direct and indirect equipment cost
Energy input
• Oil, fuel, and electricity • Oil, fuel, and electricity
Construction project indirect
input
• Temp. roads and parking • Temp. office and services • Temp. field facilities • Temp. housing and camps • Temp. structures • Temp. utilities for trades • Temp. water supply services • Subcontractor facilities
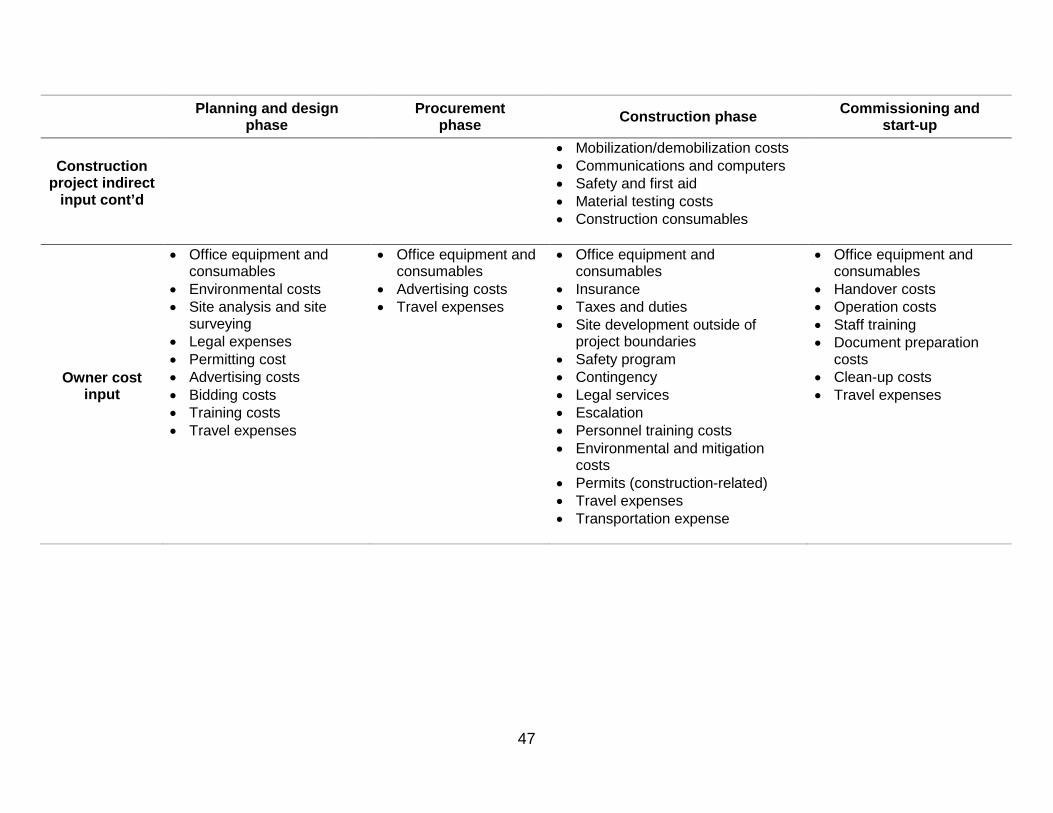
47
Planning and design phase
Procurement phase Construction phase Commissioning and
start-up
Construction project indirect
input cont’d
• Mobilization/demobilization costs • Communications and computers • Safety and first aid • Material testing costs • Construction consumables
Owner cost input
• Office equipment and consumables
• Environmental costs • Site analysis and site
surveying • Legal expenses • Permitting cost • Advertising costs • Bidding costs • Training costs • Travel expenses
• Office equipment and consumables
• Advertising costs • Travel expenses
• Office equipment and consumables
• Insurance • Taxes and duties • Site development outside of
project boundaries • Safety program • Contingency • Legal services • Escalation • Personnel training costs • Environmental and mitigation
costs • Permits (construction-related) • Travel expenses • Transportation expense
• Office equipment and consumables
• Handover costs • Operation costs • Staff training • Document preparation
costs • Clean-up costs • Travel expenses
48
5. Conclusions and recommendations
Productivity measurement is a major concern for both construction practitioners and
researchers. Previous studies undertaken in assessing construction productivity have
developed metrics for measuring the productivity of specific activities, and many have
focused exclusively on labour productivity. Few studies exist that propose a method to
account for the overall impact of all tangible input resources used in construction projects
on total productivity. In addition, there is lack of standard measurement methods for
assessing the total productivity of construction projects. This paper explores productivity
measurement at different levels and develops a framework for measuring total
productivity of construction projects. The framework consists of a total productivity metric,
categorization and itemization of input components, and an approach for measuring each
element in the total productivity metric, thus contributing to the standardization of total
productivity measurement. Furthermore, this framework will assist in determining the
basic components of productivity measurement for future data collection and analysis.
Future research will explore further refinement of the developed framework and
verification in different construction sectors. The framework will be validated by collecting
and analyzing data from additional projects to derive a total productivity value. With the
application of the framework on various project types and industry sectors, a standard
data collection tool for measuring total productivity will be developed and used for future
benchmarking purposes. Additionally, in order to effectively benchmark projects over
time, the framework will be expanded to consider inflation and changes in the quality of
the output. Common inflation indices for construction output will be considered, such as
the construction price indices used by Statistics Canada (e.g., new housing, non-

49
residential buildings, and construction union wage rate index). These indices will be used
to develop an approach to convert a current year output measure into a real output, which
will allow year-to-year changes in output, adjusting for the change in the quality of the
built facility.
50
6. References
Albanesi, C. 2014. Focus Groups. In Michalos A.C. (Ed.). Encyclopedia of Quality of Life
and Well-Being Research. Springer, Dordrecht, Netherlands.
Becker, T. C., Edward J. J., Mohamed El., and Jing, D. 2012. Industry practices for
estimating, controlling, and managing key indirect construction costs at the project
level. Proc., Construction Research Congress 2012, West Lafayette, IN, USA.
Bröchner, J., and Olofsson, T. 2012. Construction productivity measures for innovation
projects. J. Constr. Eng. M., 138(5): 670–677.
Chang, C. K., and Woo, S. 2017. Critical review of previous studies on labour productivity
loss due to overtime. KSCE J. Civ. Eng., 21(7): 2551–2557.
Chang, L.M., Georgy, M. E., and Zhang, L. 2001. Engineering productivity measurement:
A report to the Construction Industry Institute. Construction Industry Institute,
University of Texas at Austin, Austin, TX, USA.
Chau, K. W., and Walker, A. 1988. The measurement of total factor productivity of the
Hong Kong construction industry. Construction Management and Economics, 6(3):
209–224.
Choi, J., Yun, S., and Oliveira, D. P. D. 2016. Developing a cost normalization framework
for phase-based performance assessment of construction projects. Can. J. Civil Eng.,
43(12): 1075–1086.
Construction Industry Institute (CII). 2013. The construction productivity handbook.
Implementation Resource 252-2d. Jacqueline Thomas (Ed.). University of Texas at
Austin, Austin, TX, USA.
51
Crawford, P., and Vogl, B. 2006. Measuring productivity in the construction industry. Build
Res. Inf., 34(3): 208–219.
Energy Information Administration (EIA). 2016. Capital cost estimates for utility scale
electricity generating plants. Statistical and analytical agency. U.S. Department of
Energy. Washington, DC, USA.
Ellis, R. D., and Lee, S.H. 2006. Measuring Project Level Productivity on Transportation
Projects. J. Constr. Eng. Manage., 132(3): 314–320.
Goodrum, P. M., and Haas, C. T. 2002. Partial Factor Productivity and Equipment
Technology Change at Activity Level in U.S. Construction Industry. J. Constr. Eng.
Manage., 128(6): 463–472.
Hanna, A. S., Chang, C.K., Sullivan, K. T., and Lackney, J. A. 2008. Impact of Shift Work
on Labour Productivity for Labour Intensive Contractor. J. Constr. Eng. Manage.,
134(3): 197–204.
Huang L. A., Chapman E. R., and Butry T. D. 2009. Metrics and Tools for Measuring
Construction Productivity: Technical and Empirical Considerations. NIST Special
Publication 1101. U.S Department of Commerce National Institute of Standards and
Technology (NIST), Office of Applied Economics Building and Fire Research
Laboratory, Gaithersburg, MD, USA.
Humphreys, K. K. 2004. Project and Cost Engineers' Handbook, 4th Ed. Marcel Dekker
(ed.), New York INC, New York, NY, USA.
Kao, C., Huang, K. L., Huang, Y. M., Liu, W. J., Huang, S. K., and Wu, C. A. 2013.
Productivity of Taiwan’s 1000 Largest Companies. Journal of Industrial and Production
Engineering, 30(1): 44-53.
52
Keane, P. J., and Caletka, A. F. 2008. Delay analysis in construction contracts. Wiley-
Blackwell, Oxford, UK.
Leavy, P., and Phillips, B. D. 2014. Qualitative Disaster Research. The Oxford Handbook
of Qualitative Research. Oxford University Press, Oxford, UK.
Liao, P.C., Thomas, S. R., O'brien, W. J., Dai, J., Mulva, S. P., and Kim, I. 2012.
Benchmarking project level engineering productivity. J. Civ. Eng. Manag., 18(2): 235–
244.
Lim, E. C. 1996. The analysis of productivity in building construction. Ph.D. thesis,
Loughborough University of Technology, Leicestershire, UK.
Lowe, J. G. 1987. The Measurement of Productivity in the Construction Industry.
Construction Management And Economics, 5(2): 101-113.
Mani, N., Kisi, K. P., and Rojas, E. M. Foster, E. T., 2017. Estimating Labour Productivity
Frontier: A Pilot Study. J. Constr. Eng. Manage., 143(10).
Najaf M., Fallah M., Hamed S. 2014. Presenting a Hybrid Approach based on Two-stage
Data Envelopment Analysis to Evaluating Organization Productivity. Int. J. Data
Envelopment Analysis 2(10).
Nasir, H., Ahmed, H., Haas, C., and Goodrum, P. M. 2013. An analysis of construction
productivity differences between Canada and the United States. Construction
Management and Economics, 32(6): 595–607.
Organisation for Economic Co-operation and Development (OECD). 2001. Overview of
productivity measures. Measuring productivity. Organisation for Economic Co-
operation and Development Manual, 2001st ed. Vol. 2., OECD Publication, Paris,
France.
53
Organisation for Economic Co-operation and Development (OECD). 2008. Productivity
Measurement and Analysis. Organisation for Economic Co-operation and
Development Manual, OECD Publications, Paris, France.
Park, H. S. 2006. Conceptual framework of construction productivity estimation. KSCE J
Civ Eng, 10(5), 311–317.
Pekuri, A., Haapasalo, H., Herrala, M. 2011. Productivity and performance management:
Managerial practices in the construction industry. International Journal of Performance
Measurement, 1: 39-58.
Phusavat, K. 2013. Productivity management in an organization: measurement and
analysis. ToKnowPress, Bangkok, Thailand.
Project Management Institute. 2000. A guide to the project management body of
knowledge (PMBOK guide). Project Management Institute, Newtown Square, PA,
USA.
Roghanian, P., Rasli, A., and Gheysari, H. 2012. Productivity through effectiveness and
efficiency in the banking industry. Procd. Soc. Behv., 40, 550–556.
Sezer, A. A., and Bröchner, J. 2013. The construction productivity debate and the
measurement of service qualities. Construction Management and Economics, 32(6),
565–574.
Sharrard, A. L., Matthews, H. S., and Roth, M. 2007. Environmental Implications of
Construction Site Energy Use and Electricity Generation. J. Constr. Eng. Manage.,
133(11): 846–854.
54
Spring Singapore. 2011. A Guide to Productivity Measurement.
<http://www.spring.gov.sg/resources/documents/guidebook_productivity_measureme
nt.pdf>
Srivastava, A., Thomson, SB. 2009. Framework analysis: A qualitative methodology for
applied policy research. Journal of Administration and Governance, 4(2): 72–79.
Statistics Canada. 2017. Gross domestic product at basic prices, by industry.
http://www.statcan.gc.ca/tables-tableaux/sum-som/l01/cst01/econ41-eng.htm
[accessed on 11 October 2017].
Sundqvist, E., Backlund, F., and Chronéer, D. 2014. What is project efficiency and
effectiveness?. Procd. Soc. Behv., 119: 278–287.
Sumanth, D. J., and Dedeoglu, M. 1988. Application of Expert Systems to productivity
measurement in companies/organizations. Computers & Industrial Engineering, 14(3),
241–249.
Thomas, H. R., Maloney, W. F., Horner, R. M. W., Smith, G. R., Handa, V. K., and
Sanders, S. R. 1990. Modeling construction labour productivity. J. Constr. Eng.
Manage., 116(4): 705–726.
Vereen, S. C., Rasdorf, W., and Hummer, J. E. 2016. Development and Comparative
Analysis of Construction Industry Labour Productivity Metrics. J. Constr. Eng.
Manage., 142(7): 04016020.
Vrat, P., Sardana, G. D., and Sahay, B. S. 1998. Productivity management: a systems
approach. Narosa, London, UK.
55
Vogl, B., and Abdel-Wahab, M. 2015. Measuring the construction industry’s productivity
performance: critique of international productivity comparisons at industry level. J.
Constr. Eng. Manage., 141(4): 04014085.
Yi, W., and Chan, A. P. C. 2014. Critical review of labour productivity research in
construction journals. J. Manage. Eng., 30(2): 214–225.
Yun, S., Mulva P. S., Kim Y. D. 2015. Measuring high-level project productivity for Alberta
projects. Proc., 11th Construction Specialty Conference, Vancouver, British Columbia.
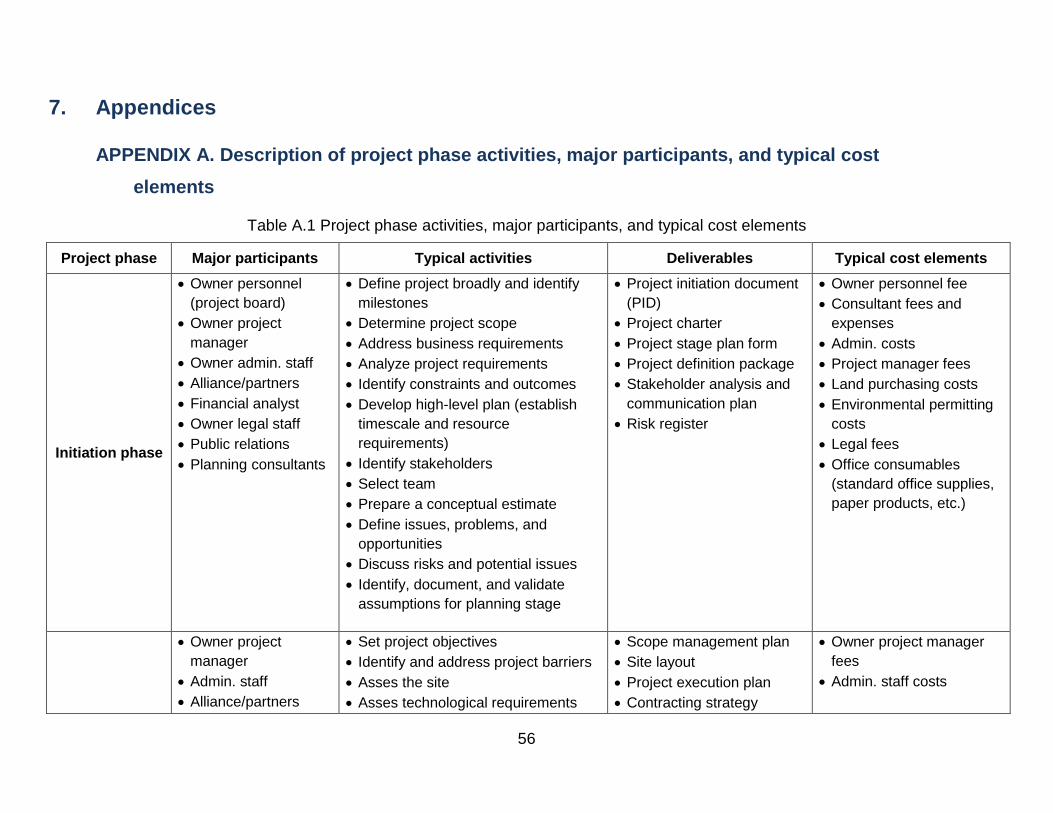
56
7. Appendices
APPENDIX A. Description of project phase activities, major participants, and typical cost elements
Table A.1 Project phase activities, major participants, and typical cost elements
Project phase Major participants Typical activities Deliverables Typical cost elements
Initiation phase
• Owner personnel (project board)
• Owner project manager
• Owner admin. staff • Alliance/partners • Financial analyst • Owner legal staff • Public relations • Planning consultants
• Define project broadly and identify milestones
• Determine project scope • Address business requirements • Analyze project requirements • Identify constraints and outcomes • Develop high-level plan (establish
timescale and resource requirements)
• Identify stakeholders • Select team • Prepare a conceptual estimate • Define issues, problems, and
opportunities • Discuss risks and potential issues • Identify, document, and validate
assumptions for planning stage
• Project initiation document (PID)
• Project charter • Project stage plan form • Project definition package • Stakeholder analysis and
communication plan • Risk register
• Owner personnel fee • Consultant fees and
expenses • Admin. costs • Project manager fees • Land purchasing costs • Environmental permitting
costs • Legal fees • Office consumables
(standard office supplies, paper products, etc.)
• Owner project manager
• Admin. staff • Alliance/partners
• Set project objectives • Identify and address project barriers • Asses the site • Asses technological requirements
• Scope management plan • Site layout • Project execution plan • Contracting strategy
• Owner project manager fees
• Admin. staff costs
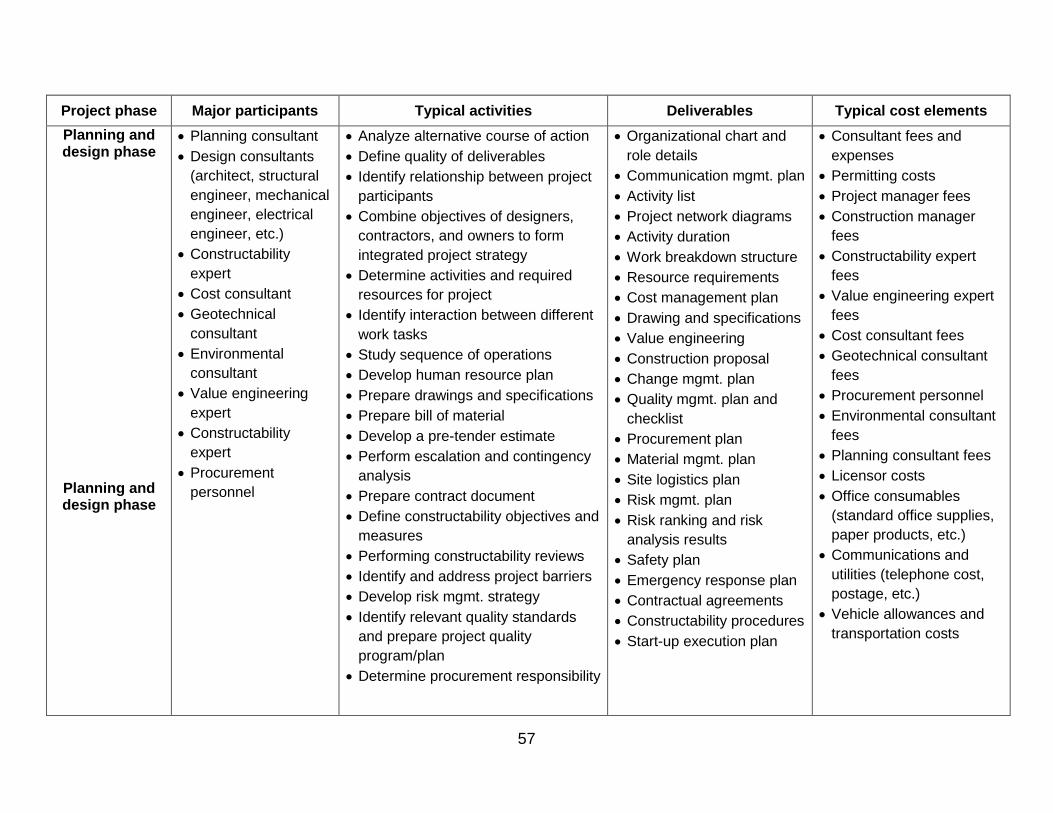
57
Project phase Major participants Typical activities Deliverables Typical cost elements Planning and design phase
Planning and design phase
• Planning consultant • Design consultants
(architect, structural engineer, mechanical engineer, electrical engineer, etc.)
• Constructability expert
• Cost consultant • Geotechnical
consultant • Environmental
consultant • Value engineering
expert • Constructability
expert • Procurement
personnel
• Analyze alternative course of action • Define quality of deliverables • Identify relationship between project
participants • Combine objectives of designers,
contractors, and owners to form integrated project strategy
• Determine activities and required resources for project
• Identify interaction between different work tasks
• Study sequence of operations • Develop human resource plan • Prepare drawings and specifications • Prepare bill of material • Develop a pre-tender estimate • Perform escalation and contingency
analysis • Prepare contract document • Define constructability objectives and
measures • Performing constructability reviews • Identify and address project barriers • Develop risk mgmt. strategy • Identify relevant quality standards
and prepare project quality program/plan
• Determine procurement responsibility
• Organizational chart and role details
• Communication mgmt. plan • Activity list • Project network diagrams • Activity duration • Work breakdown structure • Resource requirements • Cost management plan • Drawing and specifications • Value engineering • Construction proposal • Change mgmt. plan • Quality mgmt. plan and
checklist • Procurement plan • Material mgmt. plan • Site logistics plan • Risk mgmt. plan • Risk ranking and risk
analysis results • Safety plan • Emergency response plan • Contractual agreements • Constructability procedures • Start-up execution plan
• Consultant fees and expenses
• Permitting costs • Project manager fees • Construction manager
fees • Constructability expert
fees • Value engineering expert
fees • Cost consultant fees • Geotechnical consultant
fees • Procurement personnel • Environmental consultant
fees • Planning consultant fees • Licensor costs • Office consumables
(standard office supplies, paper products, etc.)
• Communications and utilities (telephone cost, postage, etc.)
• Vehicle allowances and transportation costs
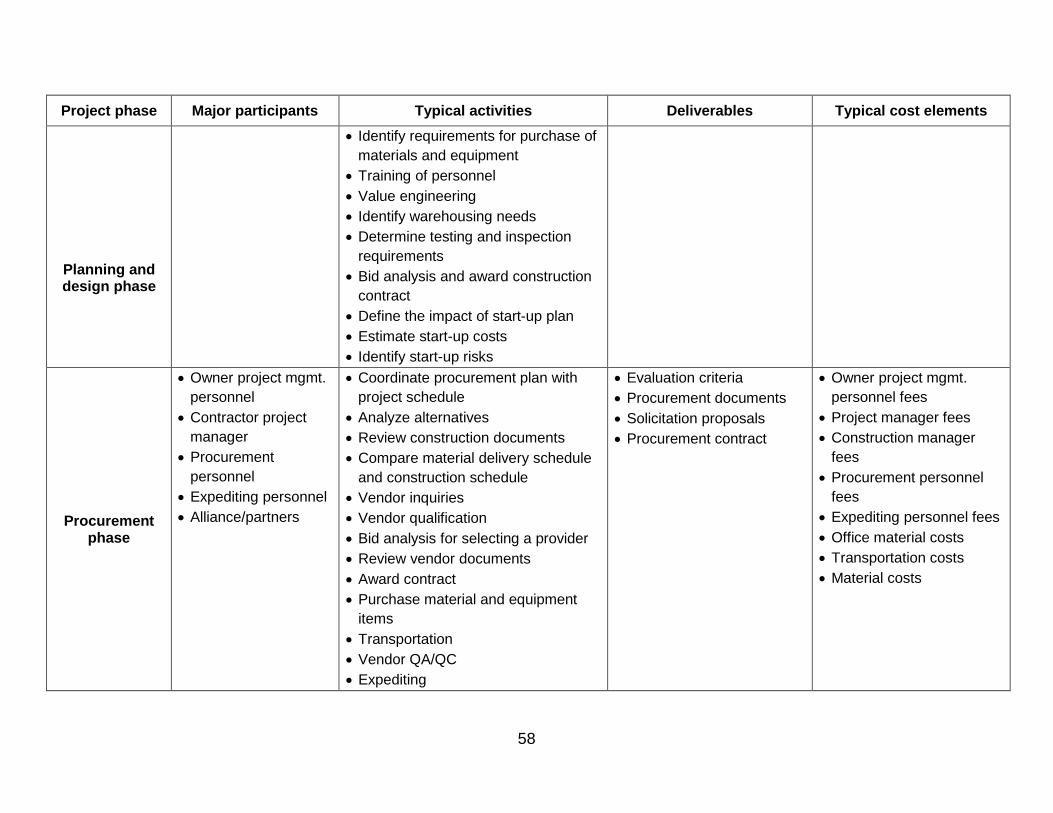
58
Project phase Major participants Typical activities Deliverables Typical cost elements
Planning and design phase
• Identify requirements for purchase of materials and equipment
• Training of personnel • Value engineering • Identify warehousing needs • Determine testing and inspection
requirements • Bid analysis and award construction
contract • Define the impact of start-up plan • Estimate start-up costs • Identify start-up risks
Procurement phase
• Owner project mgmt. personnel
• Contractor project manager
• Procurement personnel
• Expediting personnel • Alliance/partners
• Coordinate procurement plan with project schedule
• Analyze alternatives • Review construction documents • Compare material delivery schedule
and construction schedule • Vendor inquiries • Vendor qualification • Bid analysis for selecting a provider • Review vendor documents • Award contract • Purchase material and equipment
items • Transportation • Vendor QA/QC • Expediting
• Evaluation criteria • Procurement documents • Solicitation proposals • Procurement contract
• Owner project mgmt. personnel fees
• Project manager fees • Construction manager
fees • Procurement personnel
fees • Expediting personnel fees • Office material costs • Transportation costs • Material costs
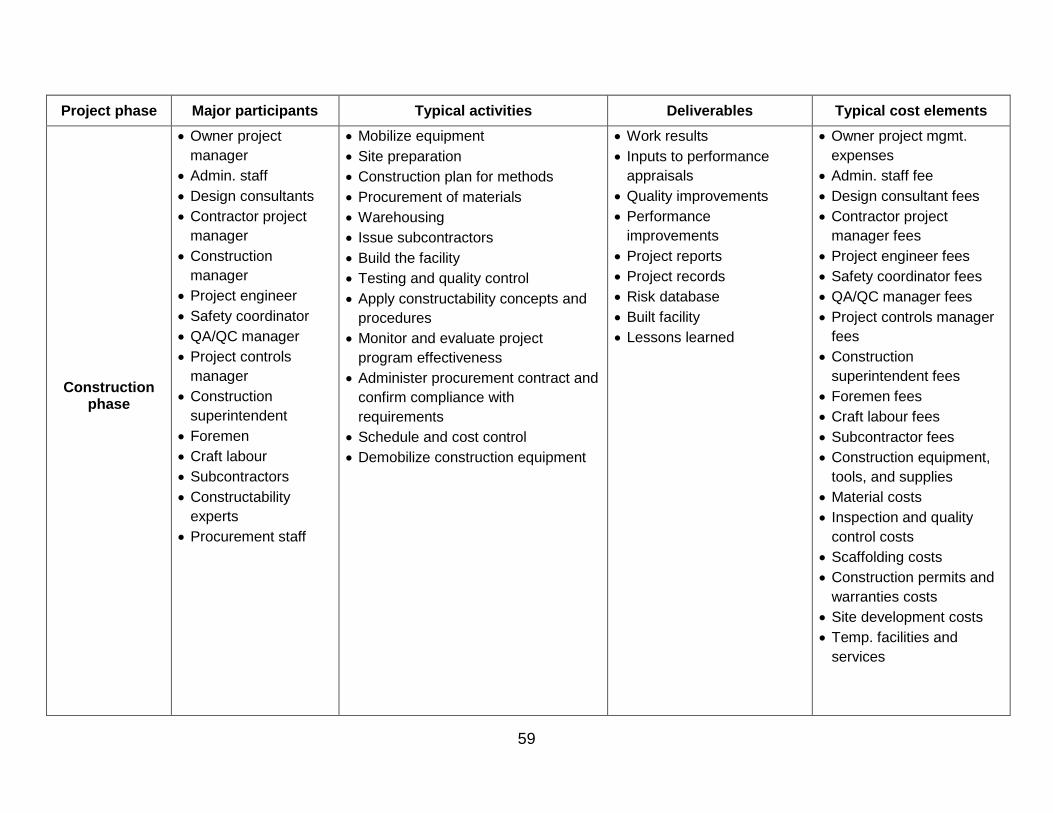
59
Project phase Major participants Typical activities Deliverables Typical cost elements
Construction phase
• Owner project manager
• Admin. staff • Design consultants • Contractor project
manager • Construction
manager • Project engineer • Safety coordinator • QA/QC manager • Project controls
manager • Construction
superintendent • Foremen • Craft labour • Subcontractors • Constructability
experts • Procurement staff
• Mobilize equipment • Site preparation • Construction plan for methods • Procurement of materials • Warehousing • Issue subcontractors • Build the facility • Testing and quality control • Apply constructability concepts and
procedures • Monitor and evaluate project
program effectiveness • Administer procurement contract and
confirm compliance with requirements
• Schedule and cost control • Demobilize construction equipment
• Work results • Inputs to performance
appraisals • Quality improvements • Performance
improvements • Project reports • Project records • Risk database • Built facility • Lessons learned
• Owner project mgmt. expenses
• Admin. staff fee • Design consultant fees • Contractor project
manager fees • Project engineer fees • Safety coordinator fees • QA/QC manager fees • Project controls manager
fees • Construction
superintendent fees • Foremen fees • Craft labour fees • Subcontractor fees • Construction equipment,
tools, and supplies • Material costs • Inspection and quality
control costs • Scaffolding costs • Construction permits and
warranties costs • Site development costs • Temp. facilities and
services
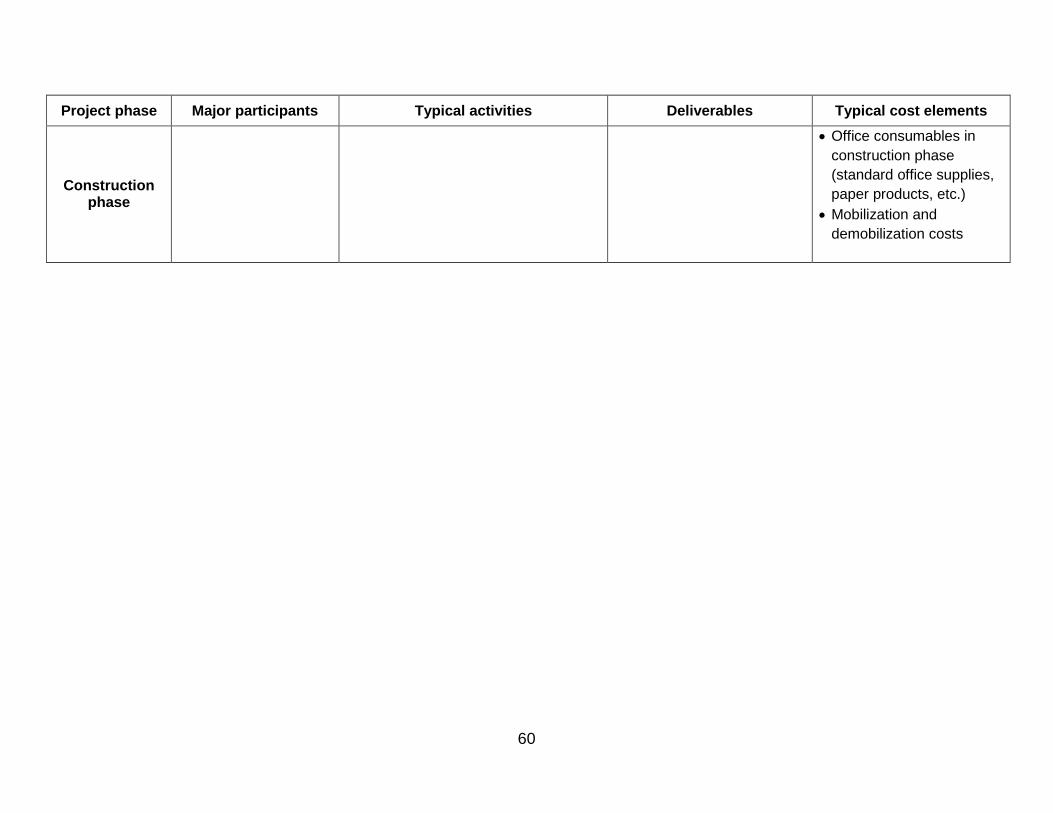
60
Project phase Major participants Typical activities Deliverables Typical cost elements
Construction phase
• Office consumables in construction phase (standard office supplies, paper products, etc.)
• Mobilization and demobilization costs
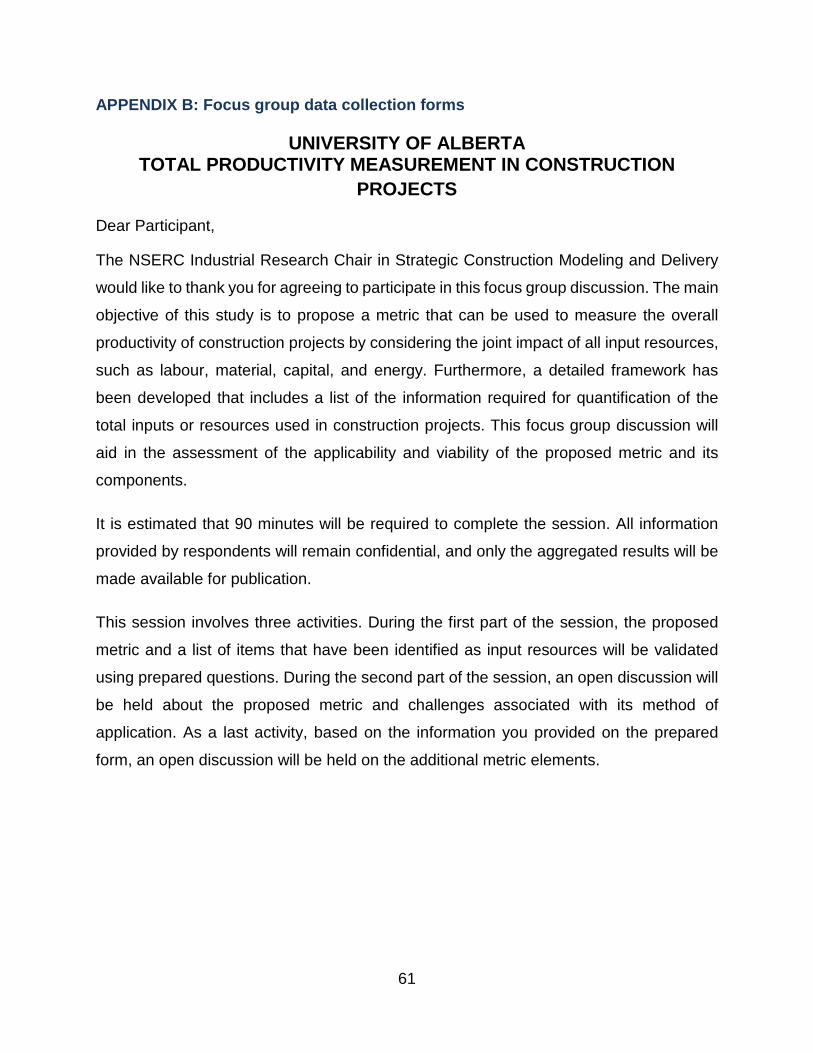
61
APPENDIX B: Focus group data collection forms
UNIVERSITY OF ALBERTA TOTAL PRODUCTIVITY MEASUREMENT IN CONSTRUCTION
PROJECTS
Dear Participant,
The NSERC Industrial Research Chair in Strategic Construction Modeling and Delivery
would like to thank you for agreeing to participate in this focus group discussion. The main
objective of this study is to propose a metric that can be used to measure the overall
productivity of construction projects by considering the joint impact of all input resources,
such as labour, material, capital, and energy. Furthermore, a detailed framework has
been developed that includes a list of the information required for quantification of the
total inputs or resources used in construction projects. This focus group discussion will
aid in the assessment of the applicability and viability of the proposed metric and its
components.
It is estimated that 90 minutes will be required to complete the session. All information
provided by respondents will remain confidential, and only the aggregated results will be
made available for publication.
This session involves three activities. During the first part of the session, the proposed
metric and a list of items that have been identified as input resources will be validated
using prepared questions. During the second part of the session, an open discussion will
be held about the proposed metric and challenges associated with its method of
application. As a last activity, based on the information you provided on the prepared
form, an open discussion will be held on the additional metric elements.
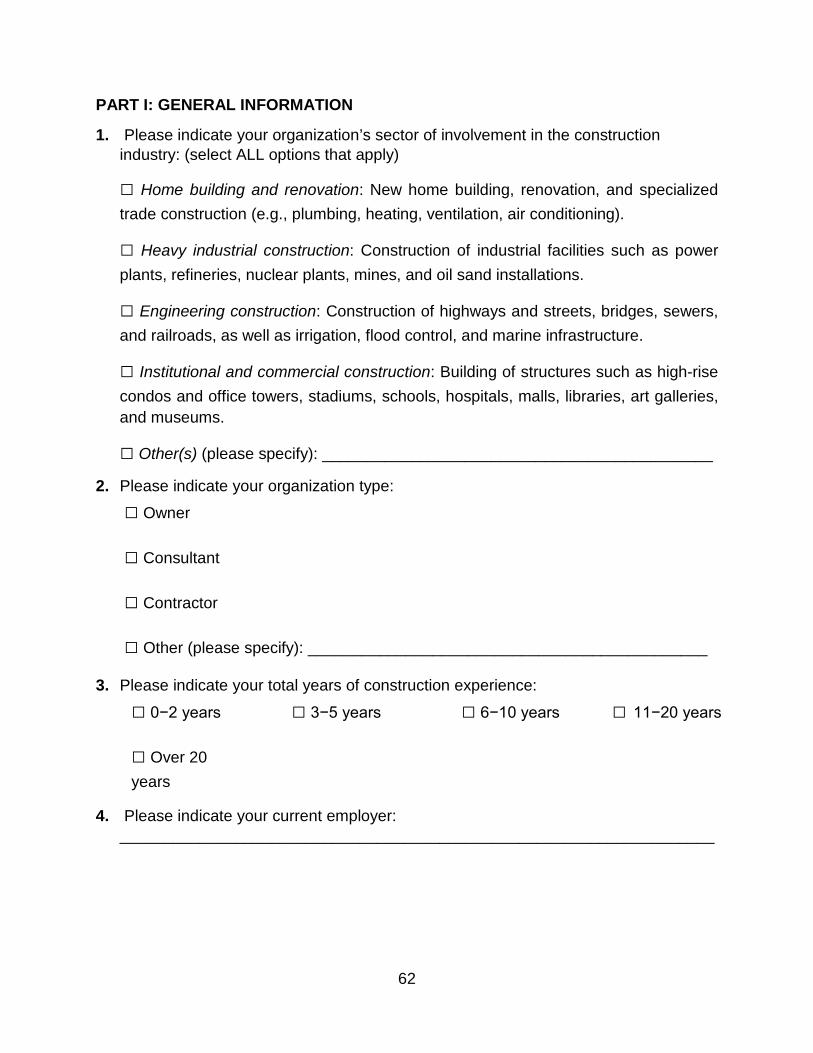
62
PART I: GENERAL INFORMATION
1. Please indicate your organization’s sector of involvement in the construction industry: (select ALL options that apply)
□ Home building and renovation: New home building, renovation, and specialized trade construction (e.g., plumbing, heating, ventilation, air conditioning).
□ Heavy industrial construction: Construction of industrial facilities such as power plants, refineries, nuclear plants, mines, and oil sand installations.
□ Engineering construction: Construction of highways and streets, bridges, sewers, and railroads, as well as irrigation, flood control, and marine infrastructure.
□ Institutional and commercial construction: Building of structures such as high-rise condos and office towers, stadiums, schools, hospitals, malls, libraries, art galleries, and museums.
□ Other(s) (please specify): ____________________________________________
2. Please indicate your organization type: □ Owner
□ Consultant
□ Contractor
□ Other (please specify): _____________________________________________
3. Please indicate your total years of construction experience: □ 0−2 years □ 3−5 years □ 6−10 years □ 11−20 years
□ Over 20 years
4. Please indicate your current employer: ___________________________________________________________________
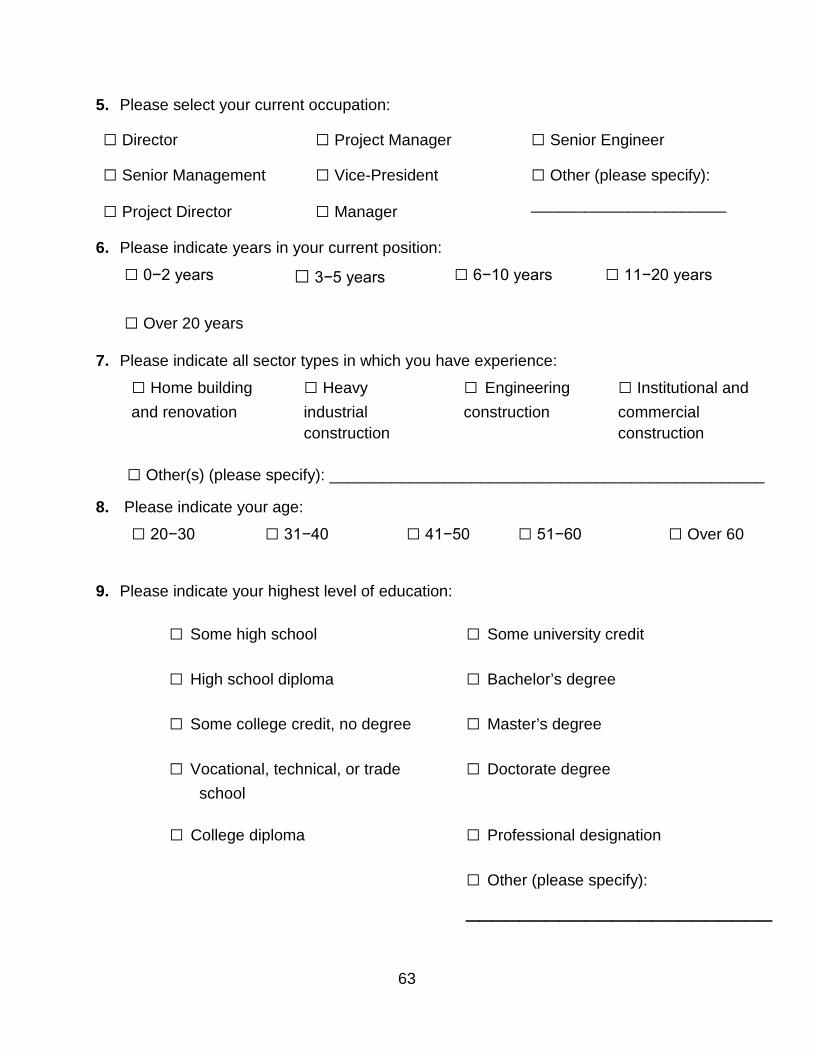
63
5. Please select your current occupation:
□ Director □ Project Manager □ Senior Engineer
□ Senior Management □ Vice-President □ Other (please specify):
□ Project Director □ Manager ______________________
6. Please indicate years in your current position: □ 0−2 years □ 3−5 years □ 6−10 years □ 11−20 years
□ Over 20 years
7. Please indicate all sector types in which you have experience: □ Home building and renovation
□ Heavy industrial construction
□ Engineering construction
□ Institutional and commercial construction
□ Other(s) (please specify): _________________________________________________
8. Please indicate your age: □ 20−30 □ 31−40 □ 41−50 □ 51−60 □ Over 60
9. Please indicate your highest level of education:
□ Some high school □ Some university credit
□ High school diploma □ Bachelor’s degree
□ Some college credit, no degree □ Master’s degree
□ Vocational, technical, or trade school
□ Doctorate degree
□ College diploma □ Professional designation
□ Other (please specify): _______________________
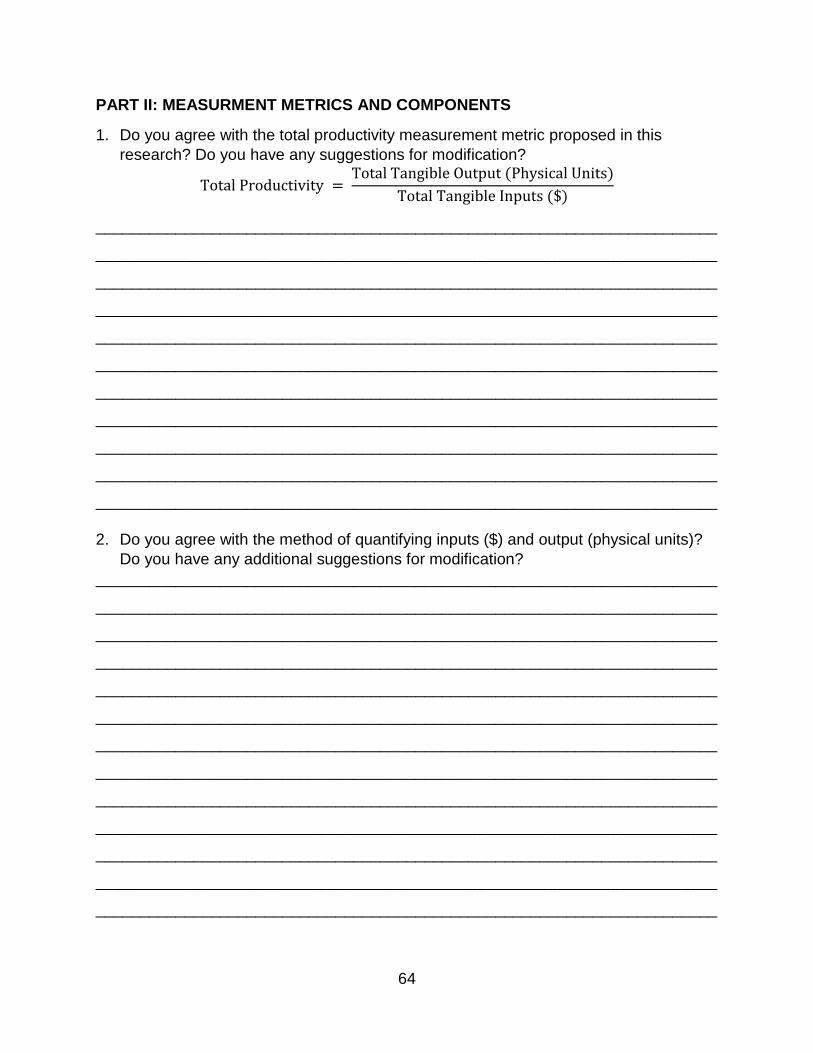
64
PART II: MEASURMENT METRICS AND COMPONENTS
1. Do you agree with the total productivity measurement metric proposed in this research? Do you have any suggestions for modification?
Total Productivity = Total Tangible Output (Physical Units)
Total Tangible Inputs ($)
______________________________________________________________________
______________________________________________________________________
______________________________________________________________________
______________________________________________________________________
______________________________________________________________________
______________________________________________________________________
______________________________________________________________________
______________________________________________________________________
______________________________________________________________________
______________________________________________________________________
______________________________________________________________________
2. Do you agree with the method of quantifying inputs ($) and output (physical units)? Do you have any additional suggestions for modification?
______________________________________________________________________
______________________________________________________________________
______________________________________________________________________
______________________________________________________________________
______________________________________________________________________
______________________________________________________________________
______________________________________________________________________
______________________________________________________________________
______________________________________________________________________
______________________________________________________________________
______________________________________________________________________
______________________________________________________________________
______________________________________________________________________

65
3. Do you agree with the classification and definition of total tangible input resources (labour, capital, material, energy, and other)? Do you have any additional suggestions for categories to add?
______________________________________________________________________
______________________________________________________________________
______________________________________________________________________
______________________________________________________________________
______________________________________________________________________
______________________________________________________________________
______________________________________________________________________
______________________________________________________________________
______________________________________________________________________
______________________________________________________________________
______________________________________________________________________
______________________________________________________________________
______________________________________________________________________
4. Based on your experience, what are the limitations or difficulties that may be encountered while using the proposed metric?
______________________________________________________________________
______________________________________________________________________
______________________________________________________________________
______________________________________________________________________
______________________________________________________________________
______________________________________________________________________
______________________________________________________________________
______________________________________________________________________
______________________________________________________________________
______________________________________________________________________
______________________________________________________________________
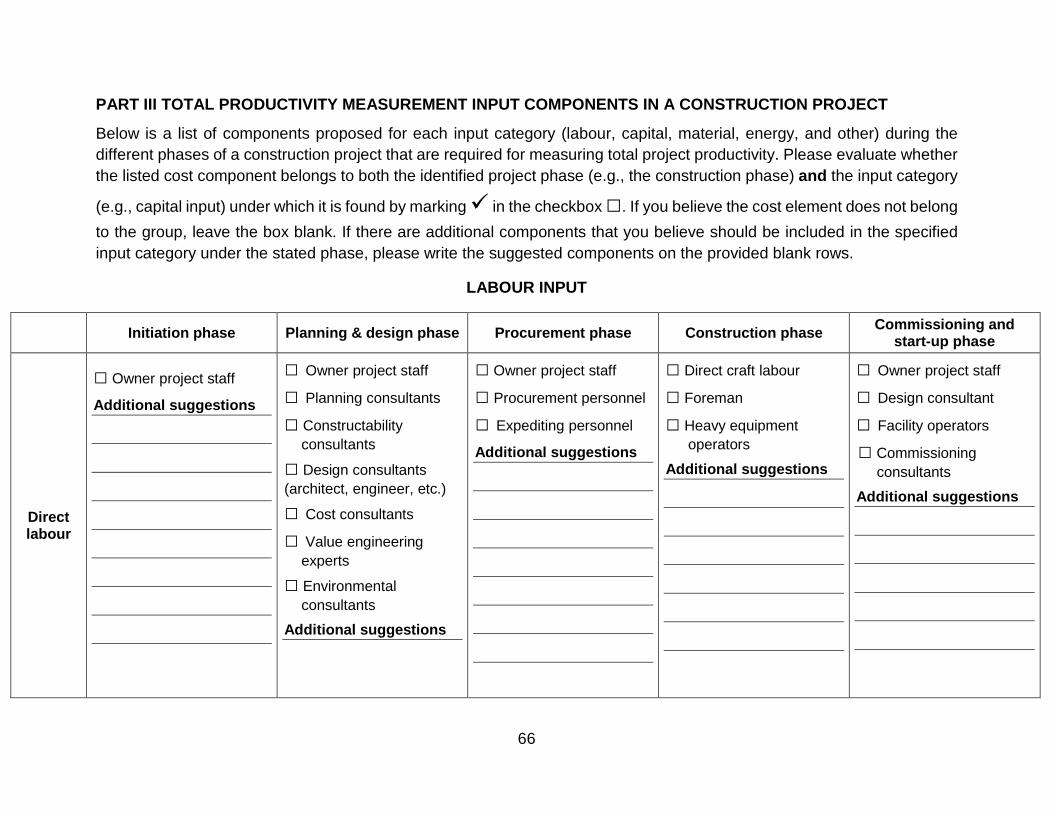
66
PART III TOTAL PRODUCTIVITY MEASUREMENT INPUT COMPONENTS IN A CONSTRUCTION PROJECT
Below is a list of components proposed for each input category (labour, capital, material, energy, and other) during the different phases of a construction project that are required for measuring total project productivity. Please evaluate whether the listed cost component belongs to both the identified project phase (e.g., the construction phase) and the input category
(e.g., capital input) under which it is found by marking in the checkbox □. If you believe the cost element does not belong to the group, leave the box blank. If there are additional components that you believe should be included in the specified input category under the stated phase, please write the suggested components on the provided blank rows.
LABOUR INPUT
Initiation phase Planning & design phase Procurement phase Construction phase Commissioning and start-up phase
Direct labour
□ Owner project staff
Additional suggestions
□ Owner project staff
□ Planning consultants
□ Constructability consultants
□ Design consultants (architect, engineer, etc.)
□ Cost consultants
□ Value engineering experts
□ Environmental consultants
Additional suggestions
□ Owner project staff
□ Procurement personnel
□ Expediting personnel
Additional suggestions
□ Direct craft labour
□ Foreman
□ Heavy equipment operators
Additional suggestions
□ Owner project staff
□ Design consultant
□ Facility operators
□ Commissioning consultants
Additional suggestions
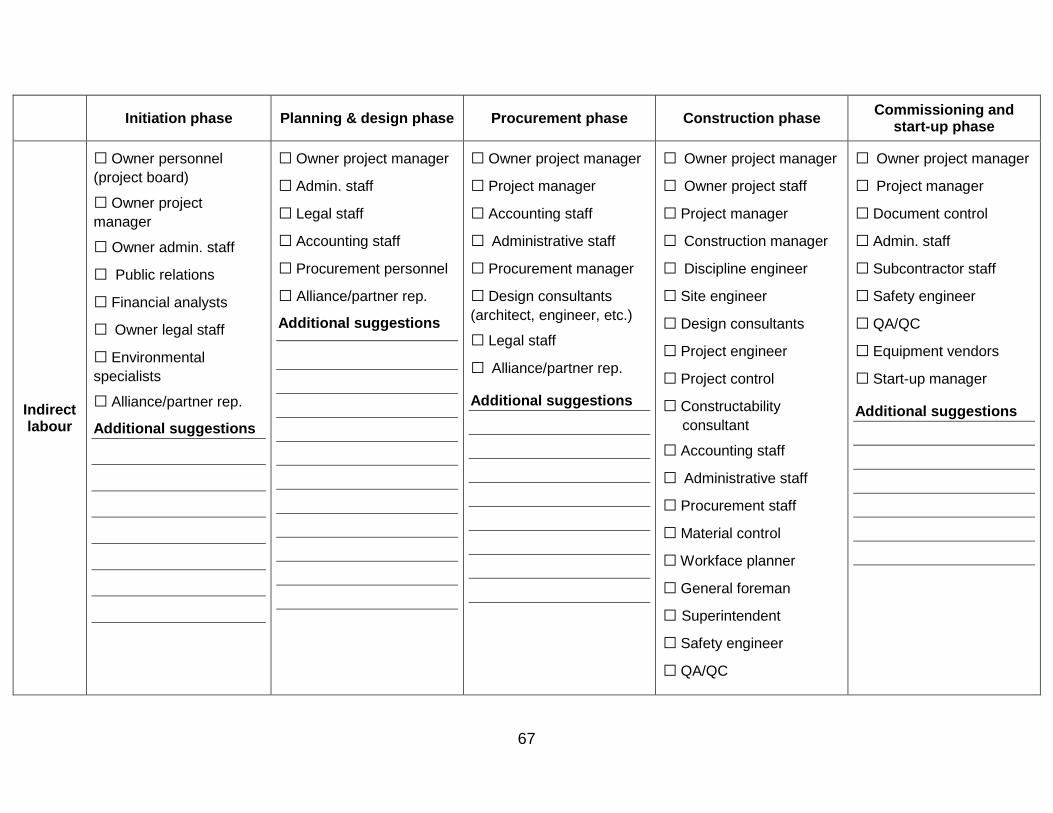
67
Initiation phase Planning & design phase Procurement phase Construction phase Commissioning and start-up phase
Indirect labour
□ Owner personnel (project board)
□ Owner project manager
□ Owner admin. staff
□ Public relations
□ Financial analysts
□ Owner legal staff
□ Environmental specialists
□ Alliance/partner rep.
Additional suggestions
□ Owner project manager
□ Admin. staff
□ Legal staff
□ Accounting staff
□ Procurement personnel
□ Alliance/partner rep.
Additional suggestions
□ Owner project manager
□ Project manager
□ Accounting staff
□ Administrative staff
□ Procurement manager
□ Design consultants (architect, engineer, etc.)
□ Legal staff
□ Alliance/partner rep. Additional suggestions
□ Owner project manager
□ Owner project staff
□ Project manager
□ Construction manager
□ Discipline engineer
□ Site engineer
□ Design consultants
□ Project engineer
□ Project control
□ Constructability consultant
□ Accounting staff
□ Administrative staff
□ Procurement staff
□ Material control
□ Workface planner
□ General foreman
□ Superintendent
□ Safety engineer
□ QA/QC
□ Owner project manager
□ Project manager
□ Document control
□ Admin. staff
□ Subcontractor staff
□ Safety engineer
□ QA/QC
□ Equipment vendors
□ Start-up manager Additional suggestions
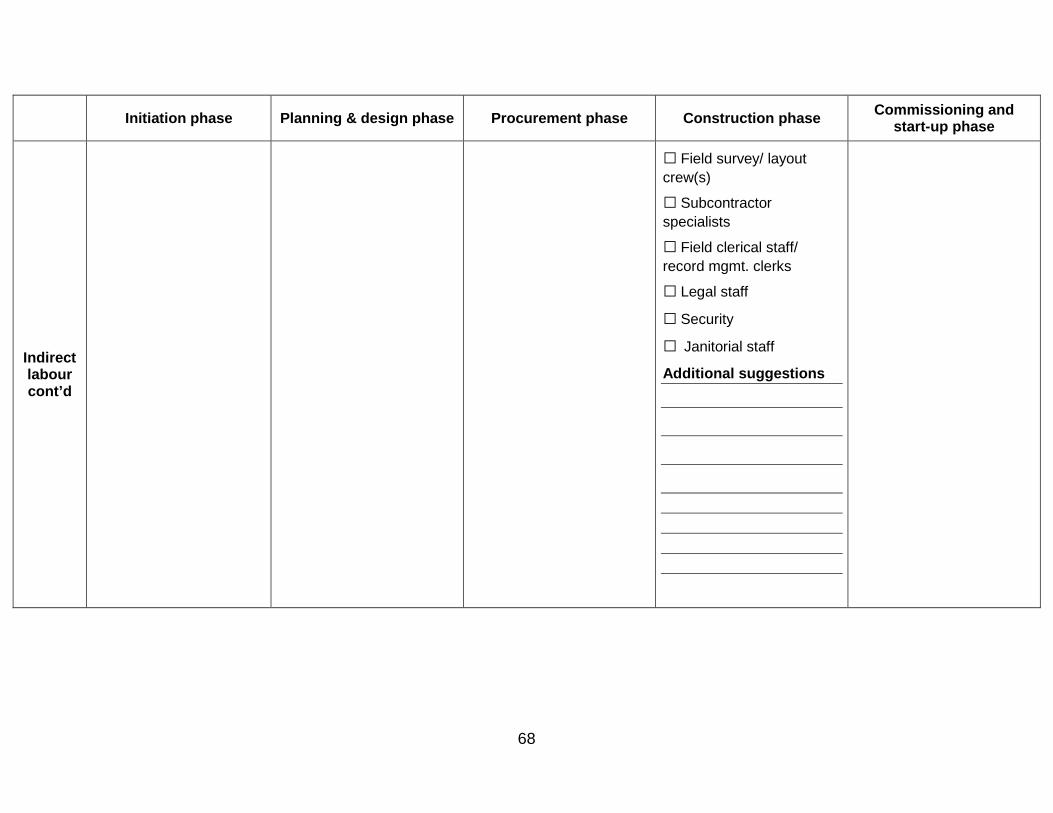
68
Initiation phase Planning & design phase Procurement phase Construction phase Commissioning and start-up phase
Indirect labour cont’d
□ Field survey/ layout crew(s)
□ Subcontractor specialists
□ Field clerical staff/ record mgmt. clerks
□ Legal staff
□ Security
□ Janitorial staff
Additional suggestions
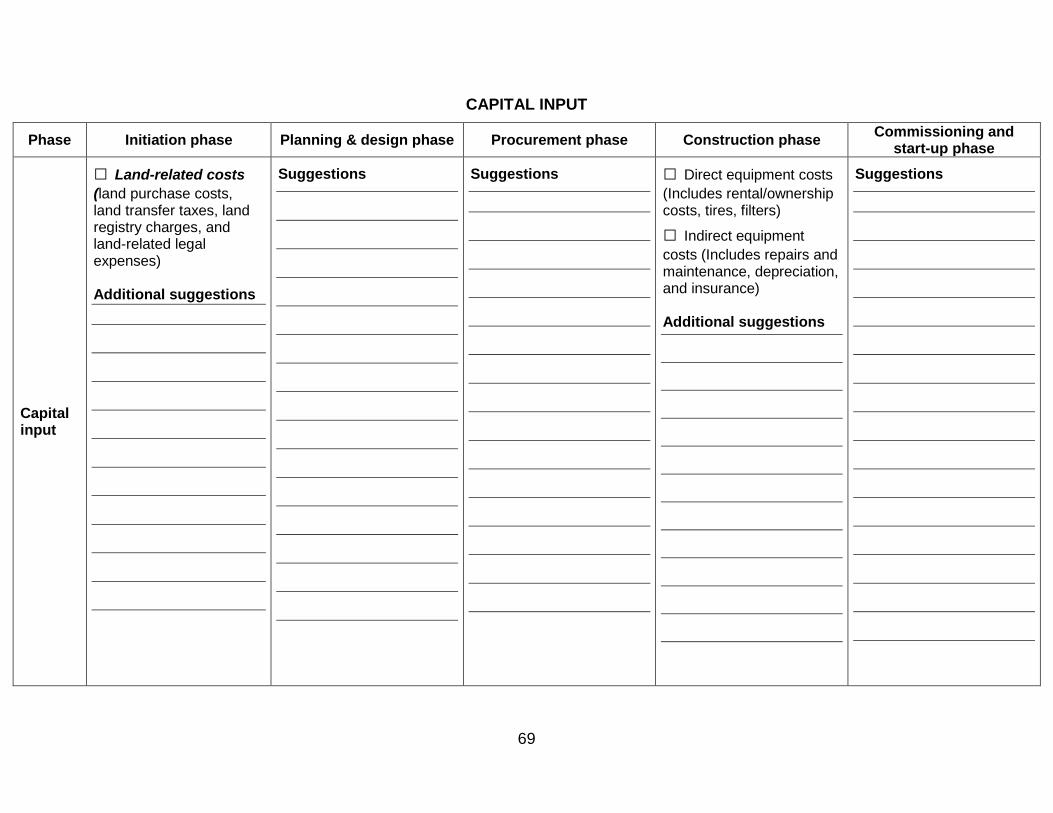
69
CAPITAL INPUT
Phase Initiation phase Planning & design phase Procurement phase Construction phase Commissioning and start-up phase
Capital input
□ Land-related costs (land purchase costs, land transfer taxes, land registry charges, and land-related legal expenses) Additional suggestions
Suggestions
Suggestions
□ Direct equipment costs (Includes rental/ownership costs, tires, filters)
□ Indirect equipment costs (Includes repairs and maintenance, depreciation, and insurance) Additional suggestions
Suggestions
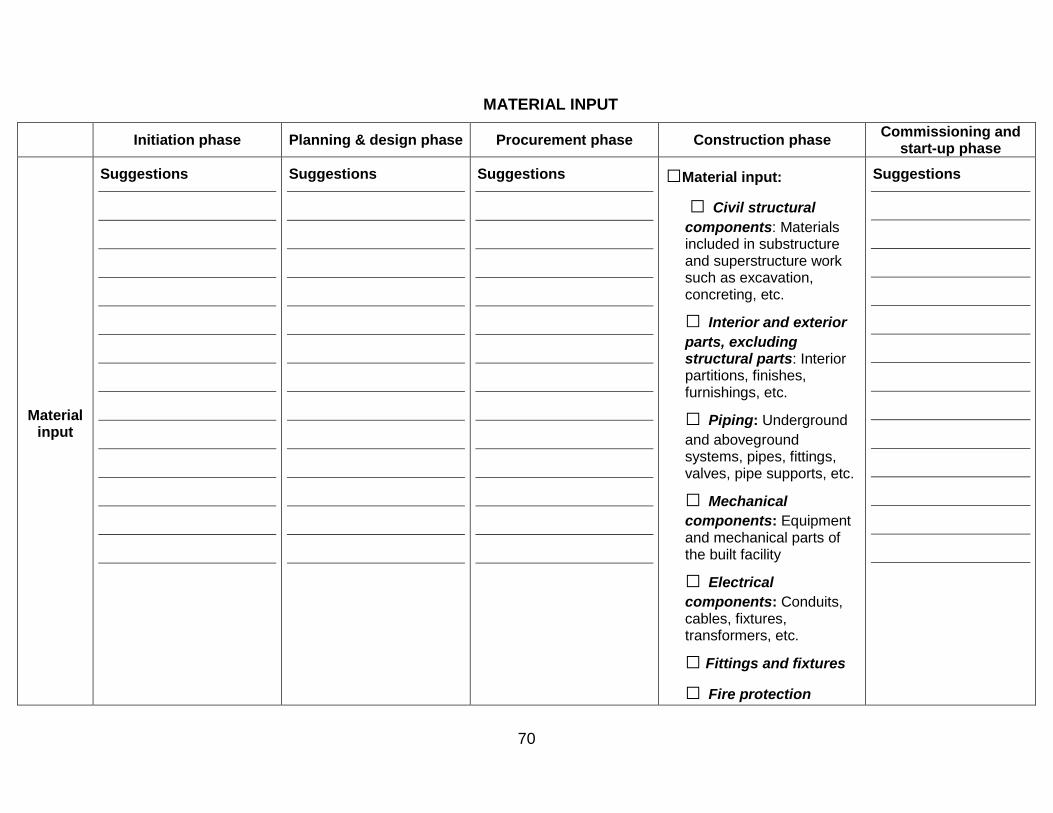
70
MATERIAL INPUT
Initiation phase Planning & design phase Procurement phase Construction phase Commissioning and start-up phase
Material input
Suggestions
Suggestions
Suggestions
□Material input:
□ Civil structural components: Materials included in substructure and superstructure work such as excavation, concreting, etc.
□ Interior and exterior parts, excluding structural parts: Interior partitions, finishes, furnishings, etc.
□ Piping: Underground and aboveground systems, pipes, fittings, valves, pipe supports, etc.
□ Mechanical components: Equipment and mechanical parts of the built facility
□ Electrical components: Conduits, cables, fixtures, transformers, etc.
□ Fittings and fixtures
□ Fire protection
Suggestions
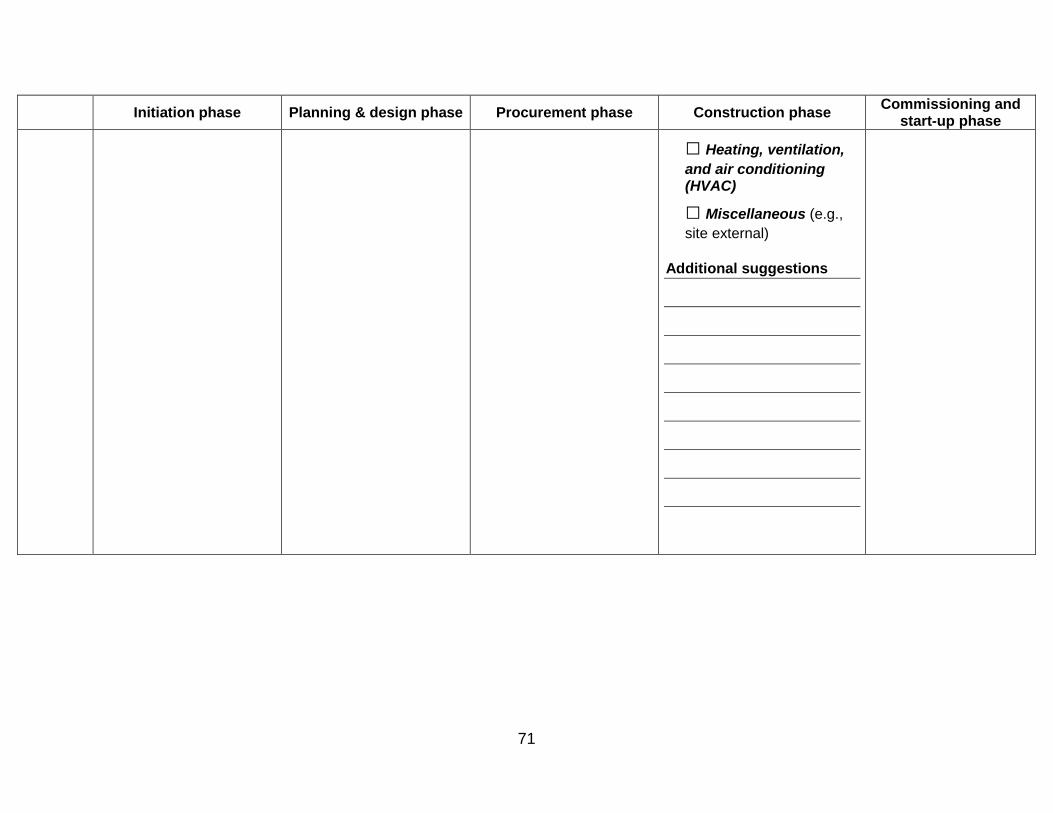
71
Initiation phase Planning & design phase Procurement phase Construction phase Commissioning and start-up phase
□ Heating, ventilation, and air conditioning (HVAC)
□ Miscellaneous (e.g., site external)
Additional suggestions
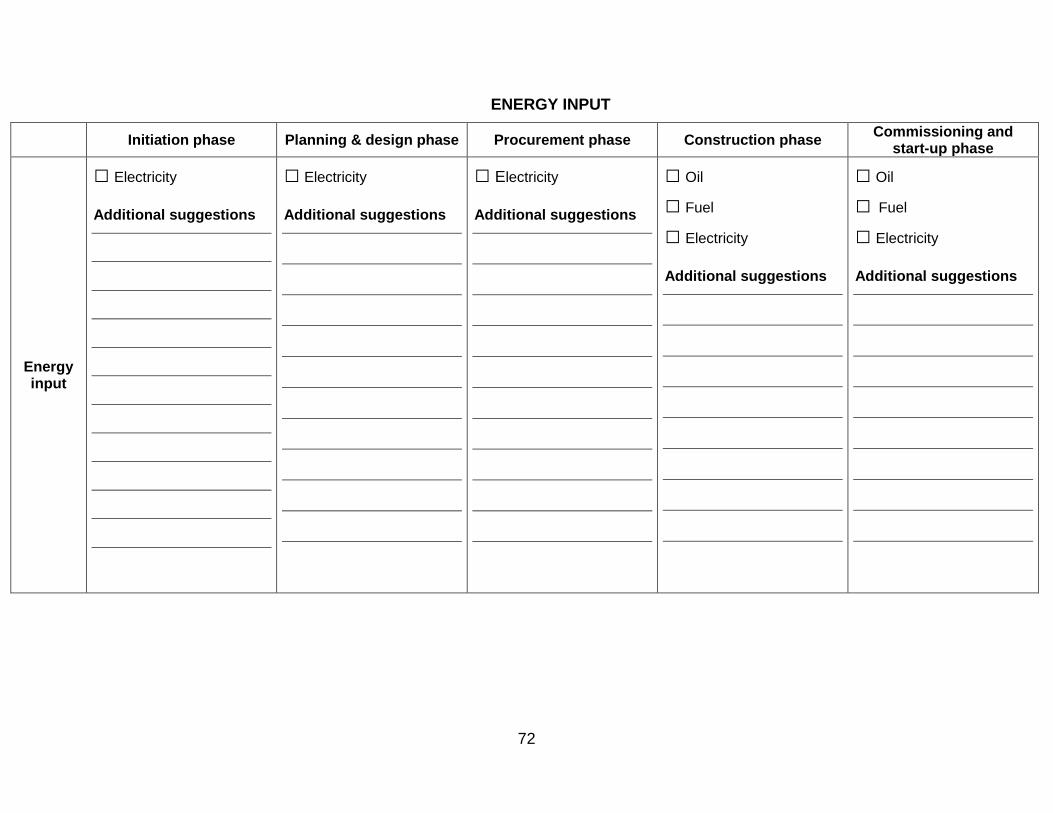
72
ENERGY INPUT
Initiation phase Planning & design phase Procurement phase Construction phase Commissioning and start-up phase
Energy input
□ Electricity Additional suggestions
□ Electricity Additional suggestions
□ Electricity Additional suggestions
□ Oil
□ Fuel
□ Electricity Additional suggestions
□ Oil
□ Fuel
□ Electricity Additional suggestions
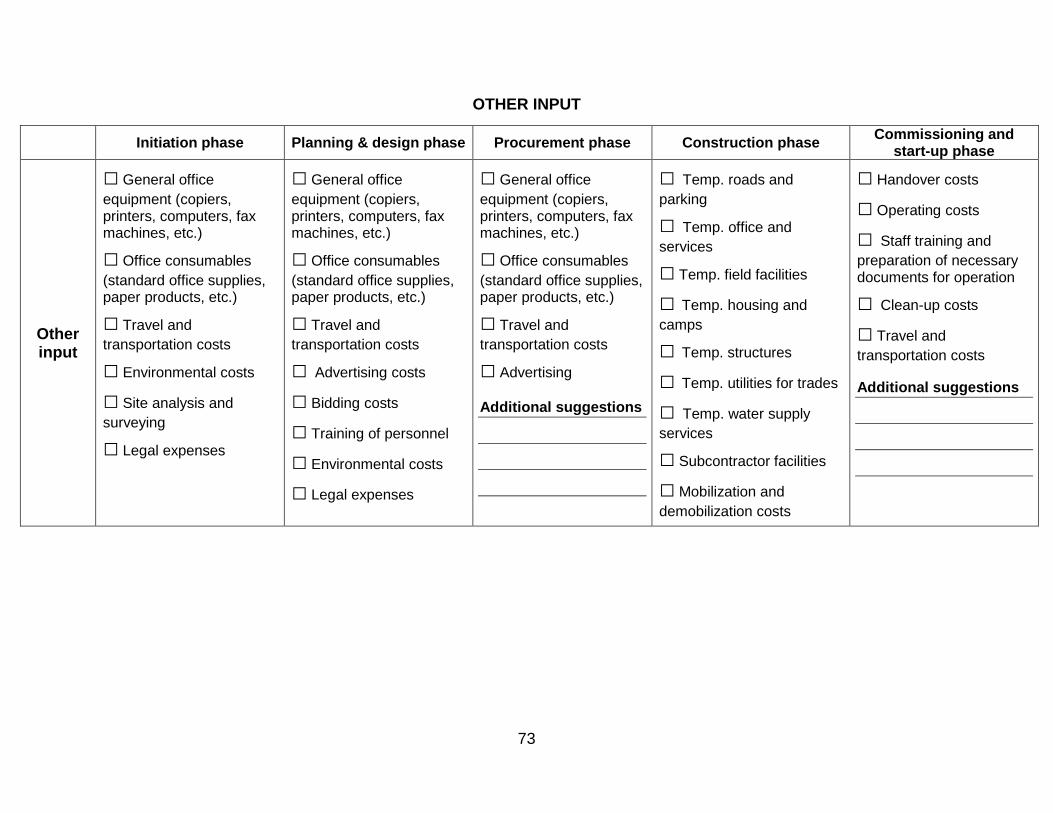
73
OTHER INPUT
Initiation phase Planning & design phase Procurement phase Construction phase Commissioning and start-up phase
Other input
□ General office equipment (copiers, printers, computers, fax machines, etc.)
□ Office consumables (standard office supplies, paper products, etc.)
□ Travel and transportation costs
□ Environmental costs
□ Site analysis and surveying
□ Legal expenses
□ General office equipment (copiers, printers, computers, fax machines, etc.)
□ Office consumables (standard office supplies, paper products, etc.)
□ Travel and transportation costs
□ Advertising costs
□ Bidding costs
□ Training of personnel
□ Environmental costs
□ Legal expenses
□ General office equipment (copiers, printers, computers, fax machines, etc.)
□ Office consumables (standard office supplies, paper products, etc.)
□ Travel and transportation costs
□ Advertising Additional suggestions
□ Temp. roads and parking
□ Temp. office and services
□ Temp. field facilities
□ Temp. housing and camps
□ Temp. structures
□ Temp. utilities for trades
□ Temp. water supply services
□ Subcontractor facilities
□ Mobilization and demobilization costs
□ Handover costs
□ Operating costs
□ Staff training and preparation of necessary documents for operation
□ Clean-up costs
□ Travel and transportation costs Additional suggestions
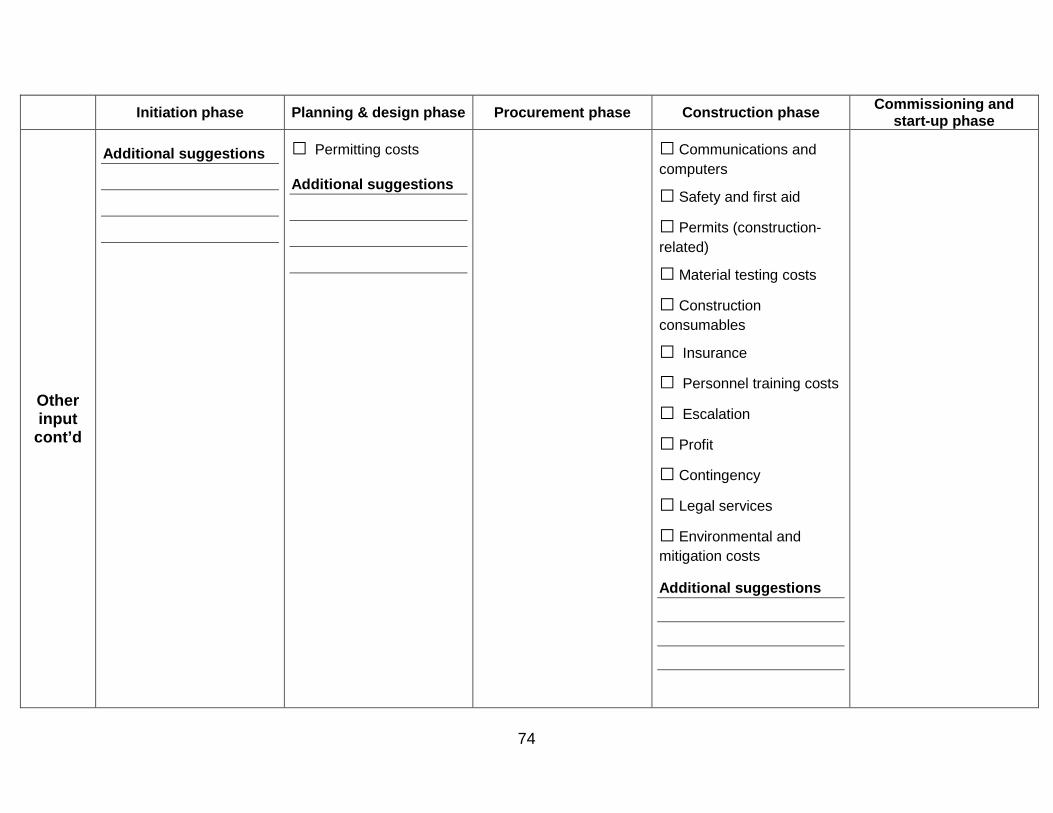
74
Initiation phase Planning & design phase Procurement phase Construction phase Commissioning and start-up phase
Other input
cont’d
Additional suggestions
□ Permitting costs Additional suggestions
□ Communications and computers
□ Safety and first aid
□ Permits (construction-related)
□ Material testing costs
□ Construction consumables
□ Insurance
□ Personnel training costs
□ Escalation
□ Profit
□ Contingency
□ Legal services
□ Environmental and mitigation costs Additional suggestions
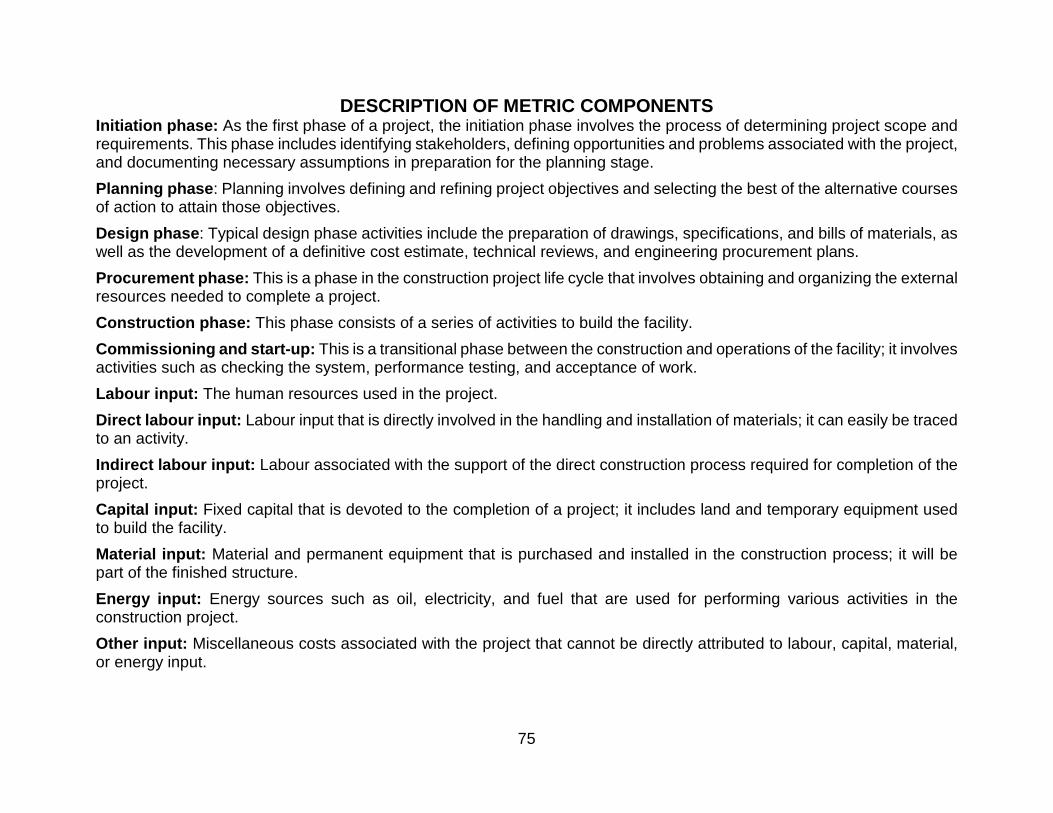
75
DESCRIPTION OF METRIC COMPONENTS Initiation phase: As the first phase of a project, the initiation phase involves the process of determining project scope and requirements. This phase includes identifying stakeholders, defining opportunities and problems associated with the project, and documenting necessary assumptions in preparation for the planning stage. Planning phase: Planning involves defining and refining project objectives and selecting the best of the alternative courses of action to attain those objectives. Design phase: Typical design phase activities include the preparation of drawings, specifications, and bills of materials, as well as the development of a definitive cost estimate, technical reviews, and engineering procurement plans. Procurement phase: This is a phase in the construction project life cycle that involves obtaining and organizing the external resources needed to complete a project. Construction phase: This phase consists of a series of activities to build the facility. Commissioning and start-up: This is a transitional phase between the construction and operations of the facility; it involves activities such as checking the system, performance testing, and acceptance of work. Labour input: The human resources used in the project. Direct labour input: Labour input that is directly involved in the handling and installation of materials; it can easily be traced to an activity. Indirect labour input: Labour associated with the support of the direct construction process required for completion of the project. Capital input: Fixed capital that is devoted to the completion of a project; it includes land and temporary equipment used to build the facility. Material input: Material and permanent equipment that is purchased and installed in the construction process; it will be part of the finished structure. Energy input: Energy sources such as oil, electricity, and fuel that are used for performing various activities in the construction project. Other input: Miscellaneous costs associated with the project that cannot be directly attributed to labour, capital, material, or energy input.
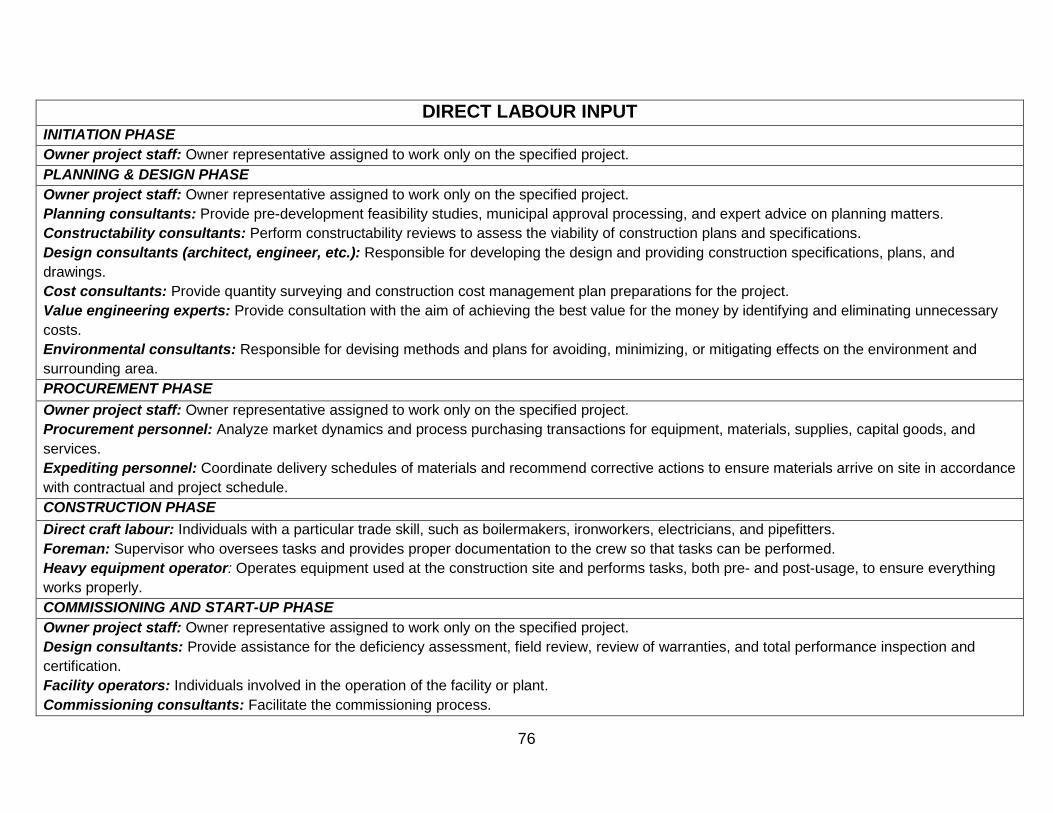
76
DIRECT LABOUR INPUT INITIATION PHASE Owner project staff: Owner representative assigned to work only on the specified project. PLANNING & DESIGN PHASE Owner project staff: Owner representative assigned to work only on the specified project. Planning consultants: Provide pre-development feasibility studies, municipal approval processing, and expert advice on planning matters. Constructability consultants: Perform constructability reviews to assess the viability of construction plans and specifications. Design consultants (architect, engineer, etc.): Responsible for developing the design and providing construction specifications, plans, and drawings. Cost consultants: Provide quantity surveying and construction cost management plan preparations for the project. Value engineering experts: Provide consultation with the aim of achieving the best value for the money by identifying and eliminating unnecessary costs. Environmental consultants: Responsible for devising methods and plans for avoiding, minimizing, or mitigating effects on the environment and surrounding area. PROCUREMENT PHASE Owner project staff: Owner representative assigned to work only on the specified project. Procurement personnel: Analyze market dynamics and process purchasing transactions for equipment, materials, supplies, capital goods, and services. Expediting personnel: Coordinate delivery schedules of materials and recommend corrective actions to ensure materials arrive on site in accordance with contractual and project schedule. CONSTRUCTION PHASE Direct craft labour: Individuals with a particular trade skill, such as boilermakers, ironworkers, electricians, and pipefitters. Foreman: Supervisor who oversees tasks and provides proper documentation to the crew so that tasks can be performed. Heavy equipment operator: Operates equipment used at the construction site and performs tasks, both pre- and post-usage, to ensure everything works properly. COMMISSIONING AND START-UP PHASE Owner project staff: Owner representative assigned to work only on the specified project. Design consultants: Provide assistance for the deficiency assessment, field review, review of warranties, and total performance inspection and certification. Facility operators: Individuals involved in the operation of the facility or plant. Commissioning consultants: Facilitate the commissioning process.
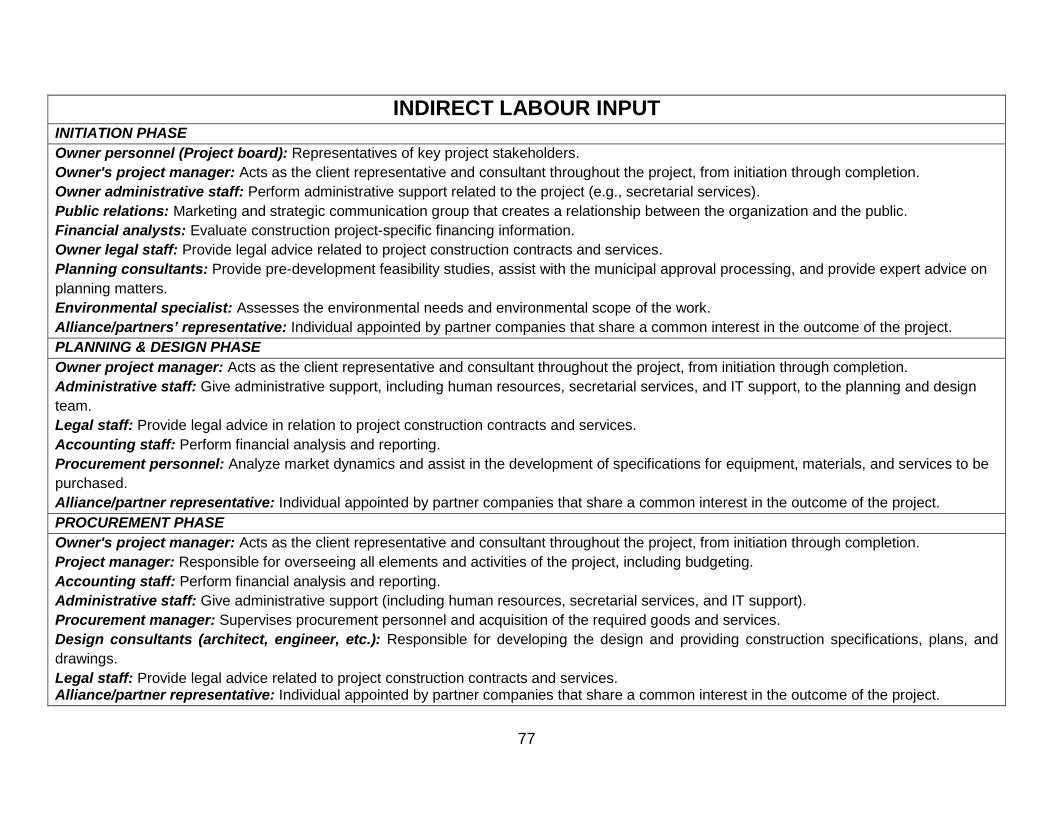
77
INDIRECT LABOUR INPUT INITIATION PHASE Owner personnel (Project board): Representatives of key project stakeholders. Owner's project manager: Acts as the client representative and consultant throughout the project, from initiation through completion. Owner administrative staff: Perform administrative support related to the project (e.g., secretarial services). Public relations: Marketing and strategic communication group that creates a relationship between the organization and the public. Financial analysts: Evaluate construction project-specific financing information. Owner legal staff: Provide legal advice related to project construction contracts and services. Planning consultants: Provide pre-development feasibility studies, assist with the municipal approval processing, and provide expert advice on planning matters. Environmental specialist: Assesses the environmental needs and environmental scope of the work. Alliance/partners’ representative: Individual appointed by partner companies that share a common interest in the outcome of the project. PLANNING & DESIGN PHASE Owner project manager: Acts as the client representative and consultant throughout the project, from initiation through completion. Administrative staff: Give administrative support, including human resources, secretarial services, and IT support, to the planning and design team. Legal staff: Provide legal advice in relation to project construction contracts and services. Accounting staff: Perform financial analysis and reporting. Procurement personnel: Analyze market dynamics and assist in the development of specifications for equipment, materials, and services to be purchased. Alliance/partner representative: Individual appointed by partner companies that share a common interest in the outcome of the project. PROCUREMENT PHASE Owner's project manager: Acts as the client representative and consultant throughout the project, from initiation through completion. Project manager: Responsible for overseeing all elements and activities of the project, including budgeting. Accounting staff: Perform financial analysis and reporting. Administrative staff: Give administrative support (including human resources, secretarial services, and IT support). Procurement manager: Supervises procurement personnel and acquisition of the required goods and services. Design consultants (architect, engineer, etc.): Responsible for developing the design and providing construction specifications, plans, and drawings. Legal staff: Provide legal advice related to project construction contracts and services. Alliance/partner representative: Individual appointed by partner companies that share a common interest in the outcome of the project.
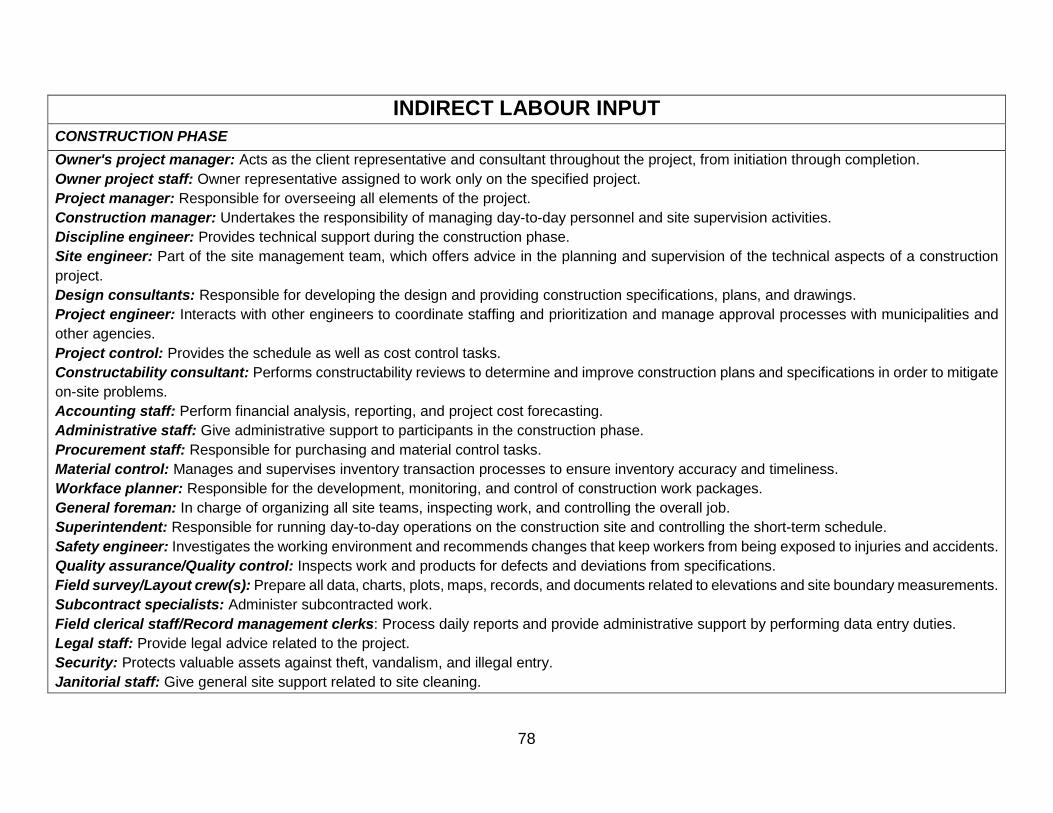
78
INDIRECT LABOUR INPUT CONSTRUCTION PHASE Owner's project manager: Acts as the client representative and consultant throughout the project, from initiation through completion. Owner project staff: Owner representative assigned to work only on the specified project. Project manager: Responsible for overseeing all elements of the project. Construction manager: Undertakes the responsibility of managing day-to-day personnel and site supervision activities. Discipline engineer: Provides technical support during the construction phase. Site engineer: Part of the site management team, which offers advice in the planning and supervision of the technical aspects of a construction project. Design consultants: Responsible for developing the design and providing construction specifications, plans, and drawings. Project engineer: Interacts with other engineers to coordinate staffing and prioritization and manage approval processes with municipalities and other agencies. Project control: Provides the schedule as well as cost control tasks. Constructability consultant: Performs constructability reviews to determine and improve construction plans and specifications in order to mitigate on-site problems. Accounting staff: Perform financial analysis, reporting, and project cost forecasting. Administrative staff: Give administrative support to participants in the construction phase. Procurement staff: Responsible for purchasing and material control tasks. Material control: Manages and supervises inventory transaction processes to ensure inventory accuracy and timeliness. Workface planner: Responsible for the development, monitoring, and control of construction work packages. General foreman: In charge of organizing all site teams, inspecting work, and controlling the overall job. Superintendent: Responsible for running day-to-day operations on the construction site and controlling the short-term schedule. Safety engineer: Investigates the working environment and recommends changes that keep workers from being exposed to injuries and accidents. Quality assurance/Quality control: Inspects work and products for defects and deviations from specifications. Field survey/Layout crew(s): Prepare all data, charts, plots, maps, records, and documents related to elevations and site boundary measurements. Subcontract specialists: Administer subcontracted work. Field clerical staff/Record management clerks: Process daily reports and provide administrative support by performing data entry duties. Legal staff: Provide legal advice related to the project. Security: Protects valuable assets against theft, vandalism, and illegal entry. Janitorial staff: Give general site support related to site cleaning.
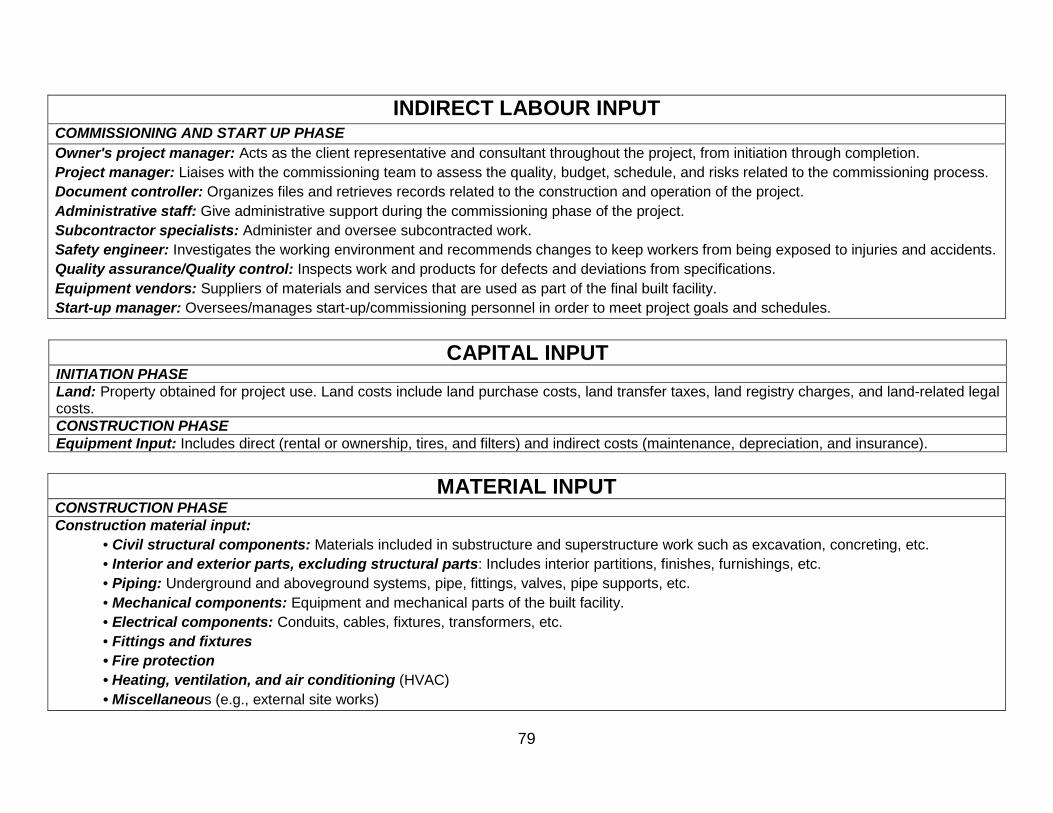
79
INDIRECT LABOUR INPUT COMMISSIONING AND START UP PHASE Owner's project manager: Acts as the client representative and consultant throughout the project, from initiation through completion. Project manager: Liaises with the commissioning team to assess the quality, budget, schedule, and risks related to the commissioning process. Document controller: Organizes files and retrieves records related to the construction and operation of the project. Administrative staff: Give administrative support during the commissioning phase of the project. Subcontractor specialists: Administer and oversee subcontracted work. Safety engineer: Investigates the working environment and recommends changes to keep workers from being exposed to injuries and accidents. Quality assurance/Quality control: Inspects work and products for defects and deviations from specifications. Equipment vendors: Suppliers of materials and services that are used as part of the final built facility. Start-up manager: Oversees/manages start-up/commissioning personnel in order to meet project goals and schedules.
CAPITAL INPUT INITIATION PHASE Land: Property obtained for project use. Land costs include land purchase costs, land transfer taxes, land registry charges, and land-related legal costs. CONSTRUCTION PHASE Equipment Input: Includes direct (rental or ownership, tires, and filters) and indirect costs (maintenance, depreciation, and insurance).
MATERIAL INPUT
CONSTRUCTION PHASE Construction material input:
• Civil structural components: Materials included in substructure and superstructure work such as excavation, concreting, etc. • Interior and exterior parts, excluding structural parts: Includes interior partitions, finishes, furnishings, etc. • Piping: Underground and aboveground systems, pipe, fittings, valves, pipe supports, etc. • Mechanical components: Equipment and mechanical parts of the built facility. • Electrical components: Conduits, cables, fixtures, transformers, etc. • Fittings and fixtures • Fire protection • Heating, ventilation, and air conditioning (HVAC) • Miscellaneous (e.g., external site works)
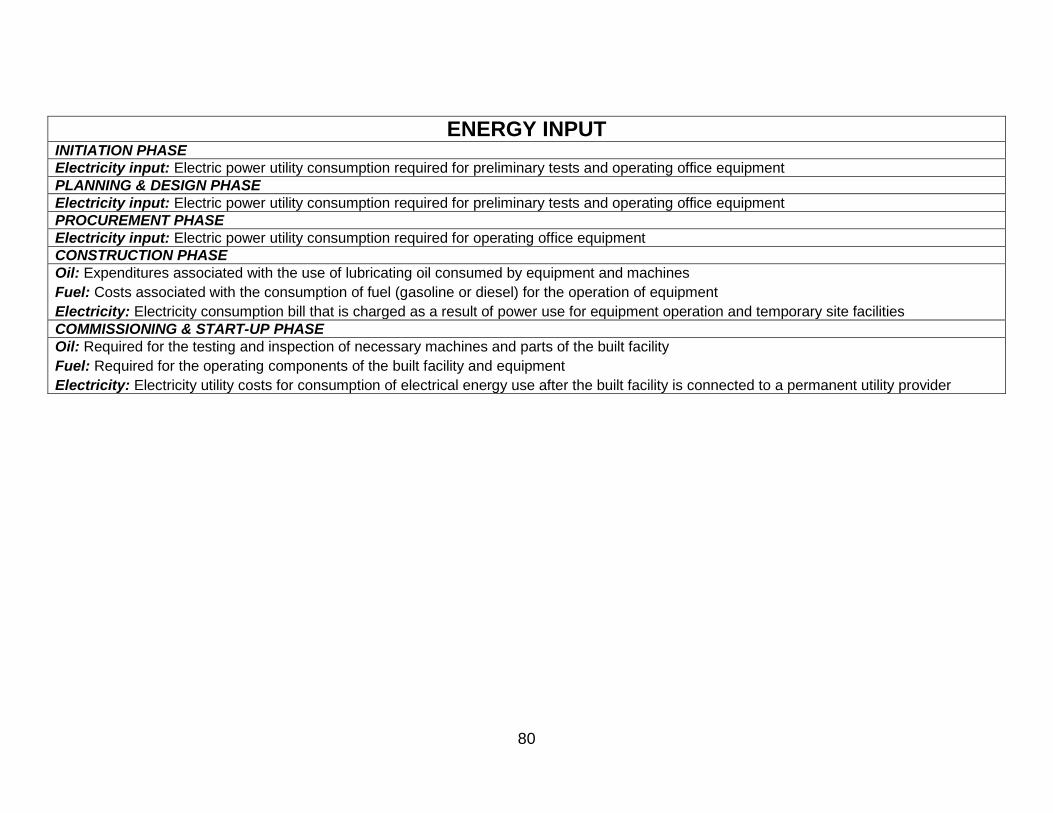
80
ENERGY INPUT
INITIATION PHASE Electricity input: Electric power utility consumption required for preliminary tests and operating office equipment PLANNING & DESIGN PHASE Electricity input: Electric power utility consumption required for preliminary tests and operating office equipment PROCUREMENT PHASE Electricity input: Electric power utility consumption required for operating office equipment CONSTRUCTION PHASE Oil: Expenditures associated with the use of lubricating oil consumed by equipment and machines Fuel: Costs associated with the consumption of fuel (gasoline or diesel) for the operation of equipment Electricity: Electricity consumption bill that is charged as a result of power use for equipment operation and temporary site facilities COMMISSIONING & START-UP PHASE Oil: Required for the testing and inspection of necessary machines and parts of the built facility Fuel: Required for the operating components of the built facility and equipment Electricity: Electricity utility costs for consumption of electrical energy use after the built facility is connected to a permanent utility provider
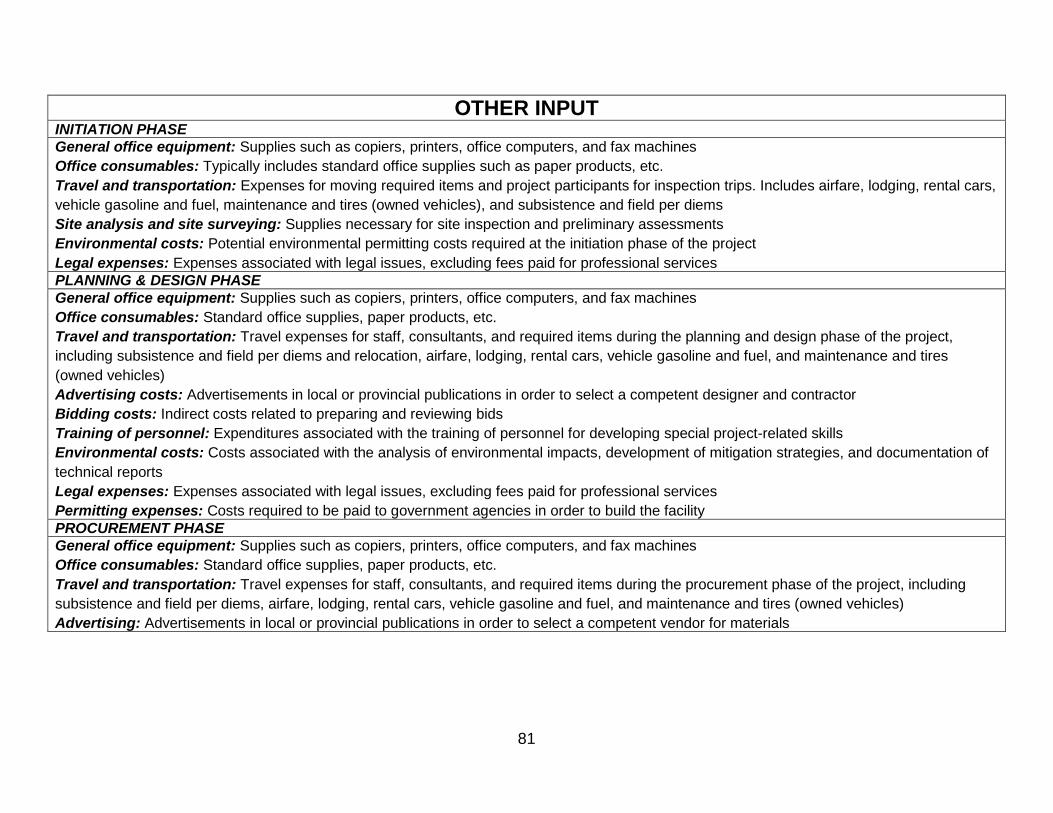
81
OTHER INPUT INITIATION PHASE General office equipment: Supplies such as copiers, printers, office computers, and fax machines Office consumables: Typically includes standard office supplies such as paper products, etc. Travel and transportation: Expenses for moving required items and project participants for inspection trips. Includes airfare, lodging, rental cars, vehicle gasoline and fuel, maintenance and tires (owned vehicles), and subsistence and field per diems Site analysis and site surveying: Supplies necessary for site inspection and preliminary assessments Environmental costs: Potential environmental permitting costs required at the initiation phase of the project Legal expenses: Expenses associated with legal issues, excluding fees paid for professional services PLANNING & DESIGN PHASE General office equipment: Supplies such as copiers, printers, office computers, and fax machines Office consumables: Standard office supplies, paper products, etc. Travel and transportation: Travel expenses for staff, consultants, and required items during the planning and design phase of the project, including subsistence and field per diems and relocation, airfare, lodging, rental cars, vehicle gasoline and fuel, and maintenance and tires (owned vehicles) Advertising costs: Advertisements in local or provincial publications in order to select a competent designer and contractor Bidding costs: Indirect costs related to preparing and reviewing bids Training of personnel: Expenditures associated with the training of personnel for developing special project-related skills Environmental costs: Costs associated with the analysis of environmental impacts, development of mitigation strategies, and documentation of technical reports Legal expenses: Expenses associated with legal issues, excluding fees paid for professional services Permitting expenses: Costs required to be paid to government agencies in order to build the facility PROCUREMENT PHASE General office equipment: Supplies such as copiers, printers, office computers, and fax machines Office consumables: Standard office supplies, paper products, etc. Travel and transportation: Travel expenses for staff, consultants, and required items during the procurement phase of the project, including subsistence and field per diems, airfare, lodging, rental cars, vehicle gasoline and fuel, and maintenance and tires (owned vehicles) Advertising: Advertisements in local or provincial publications in order to select a competent vendor for materials
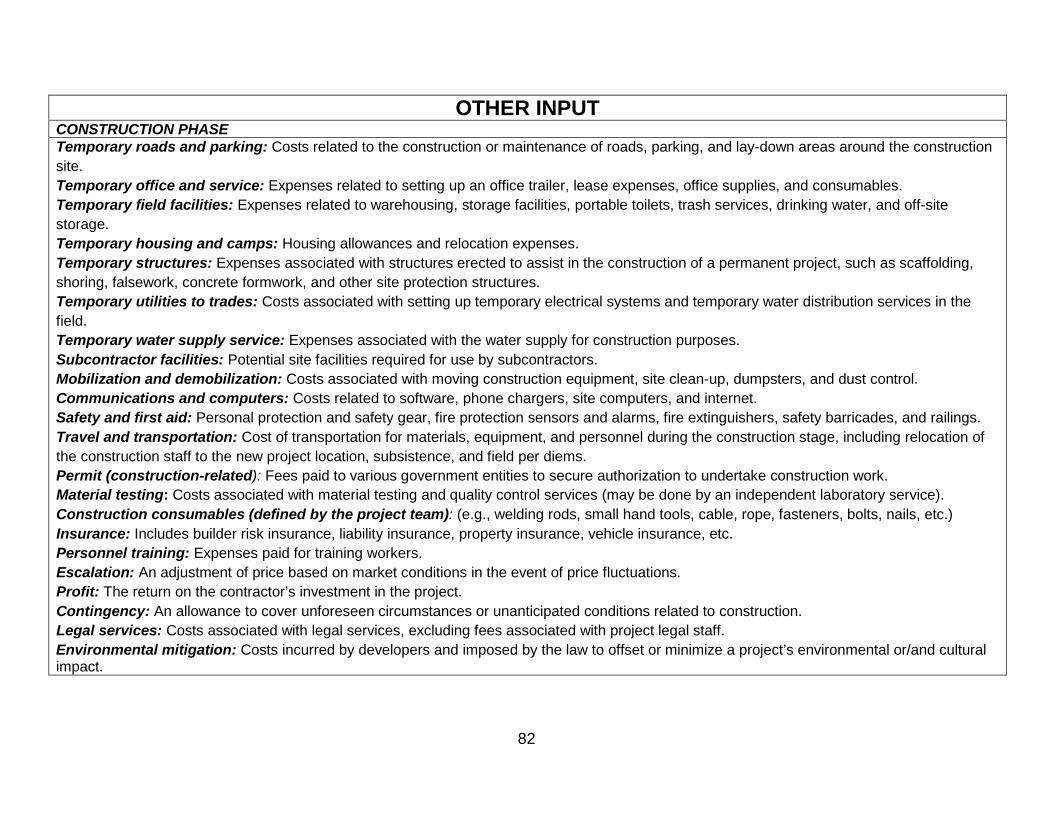
82
OTHER INPUT CONSTRUCTION PHASE Temporary roads and parking: Costs related to the construction or maintenance of roads, parking, and lay-down areas around the construction site. Temporary office and service: Expenses related to setting up an office trailer, lease expenses, office supplies, and consumables. Temporary field facilities: Expenses related to warehousing, storage facilities, portable toilets, trash services, drinking water, and off-site storage. Temporary housing and camps: Housing allowances and relocation expenses. Temporary structures: Expenses associated with structures erected to assist in the construction of a permanent project, such as scaffolding, shoring, falsework, concrete formwork, and other site protection structures. Temporary utilities to trades: Costs associated with setting up temporary electrical systems and temporary water distribution services in the field. Temporary water supply service: Expenses associated with the water supply for construction purposes. Subcontractor facilities: Potential site facilities required for use by subcontractors. Mobilization and demobilization: Costs associated with moving construction equipment, site clean-up, dumpsters, and dust control. Communications and computers: Costs related to software, phone chargers, site computers, and internet. Safety and first aid: Personal protection and safety gear, fire protection sensors and alarms, fire extinguishers, safety barricades, and railings. Travel and transportation: Cost of transportation for materials, equipment, and personnel during the construction stage, including relocation of the construction staff to the new project location, subsistence, and field per diems. Permit (construction-related): Fees paid to various government entities to secure authorization to undertake construction work. Material testing: Costs associated with material testing and quality control services (may be done by an independent laboratory service). Construction consumables (defined by the project team): (e.g., welding rods, small hand tools, cable, rope, fasteners, bolts, nails, etc.) Insurance: Includes builder risk insurance, liability insurance, property insurance, vehicle insurance, etc. Personnel training: Expenses paid for training workers. Escalation: An adjustment of price based on market conditions in the event of price fluctuations. Profit: The return on the contractor’s investment in the project. Contingency: An allowance to cover unforeseen circumstances or unanticipated conditions related to construction. Legal services: Costs associated with legal services, excluding fees associated with project legal staff. Environmental mitigation: Costs incurred by developers and imposed by the law to offset or minimize a project’s environmental or/and cultural impact.
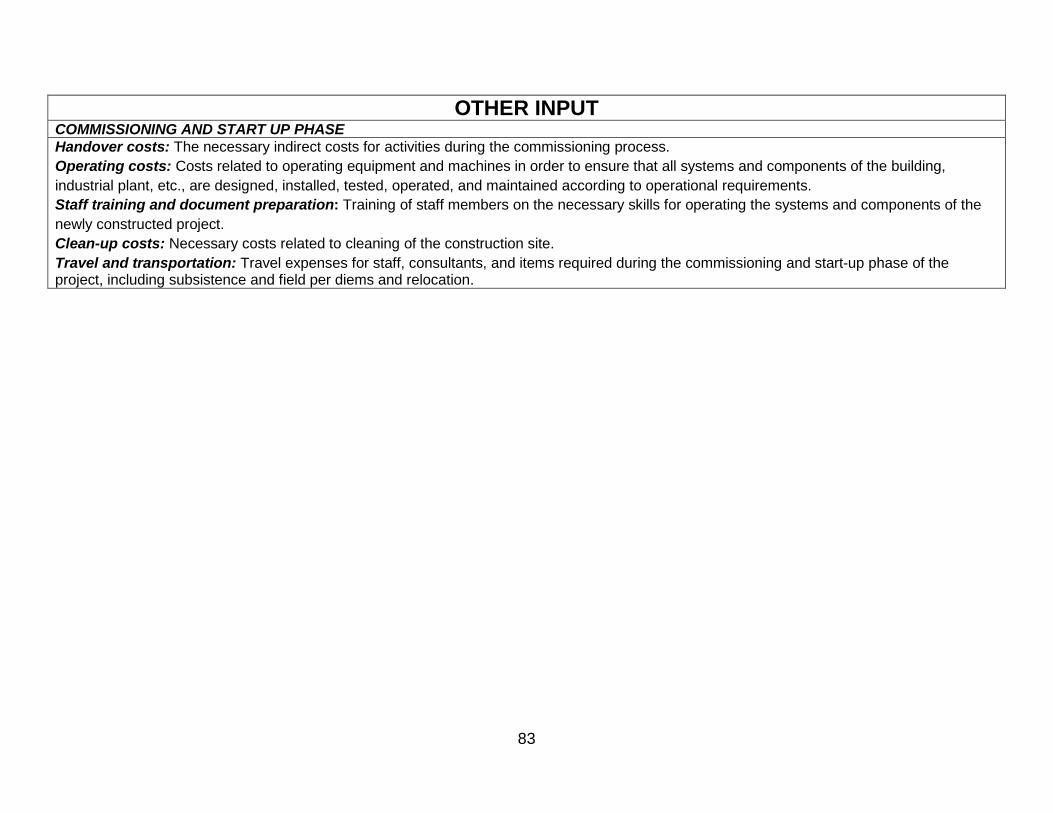
83
OTHER INPUT COMMISSIONING AND START UP PHASE Handover costs: The necessary indirect costs for activities during the commissioning process. Operating costs: Costs related to operating equipment and machines in order to ensure that all systems and components of the building, industrial plant, etc., are designed, installed, tested, operated, and maintained according to operational requirements. Staff training and document preparation: Training of staff members on the necessary skills for operating the systems and components of the newly constructed project. Clean-up costs: Necessary costs related to cleaning of the construction site. Travel and transportation: Travel expenses for staff, consultants, and items required during the commissioning and start-up phase of the project, including subsistence and field per diems and relocation.