Case Copenhagen Cycle Track Workshop, CIP
Conference 2013
Andreas Røhl, Head of Bicycle Programme,
City of Copenhagen (10 months with Urban
Systems in 2012)

Why cycle tracks
Cycle track design: Current focus in Cph
Public engagement process – Examples
Content

Why cycle tracks
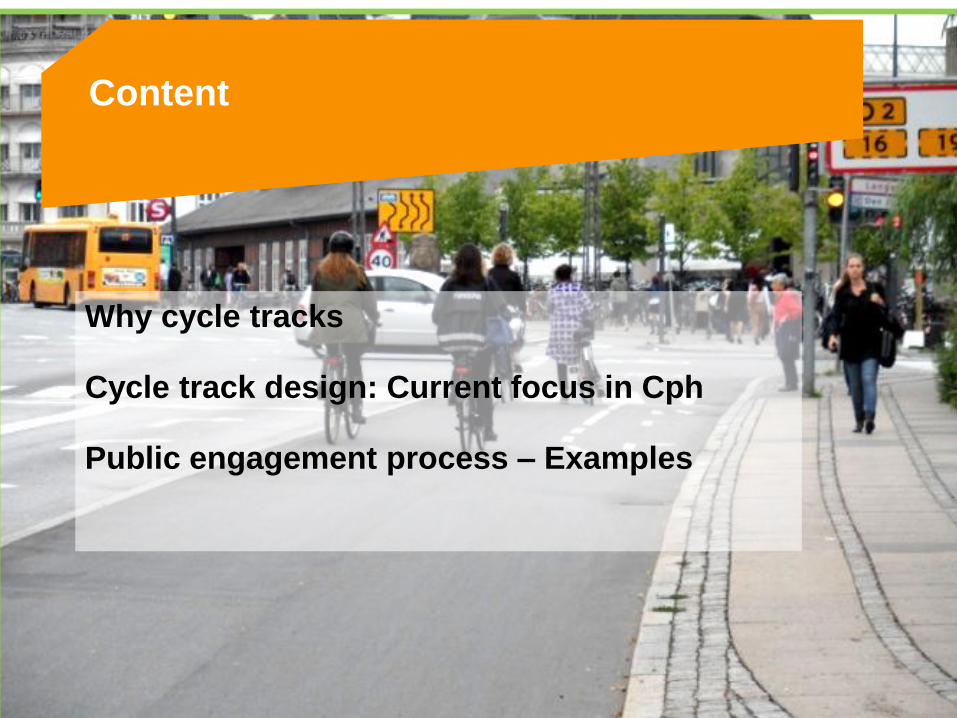
Quality matters
+18%
+55%
Modal split; effect of cycle tracks:
4% to 55% increase in cycling
volume
1% to 30% of increase due to modal
change or new trips
6
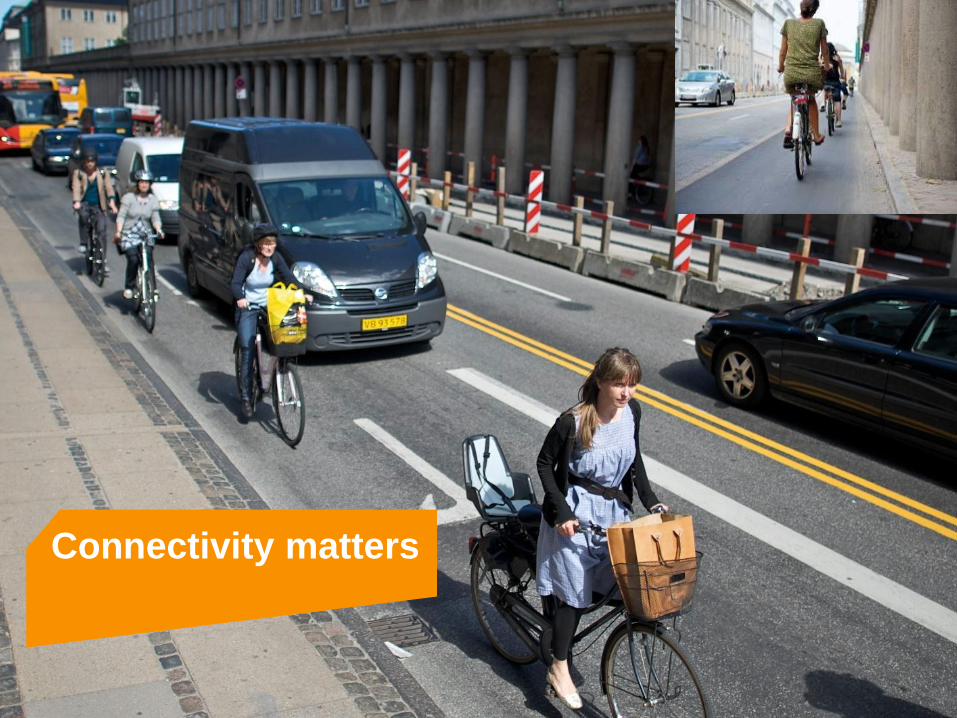
Connectivity matters
Tryghed før og efter anlæg af cykelstier
0
5
10
15
20
25
30
35
1 2 3 4 5 6 7 8 9 10
1 Meget utryg - 10 Meget tryg
Pro
cen
t
Stormgade før Stormgade efter
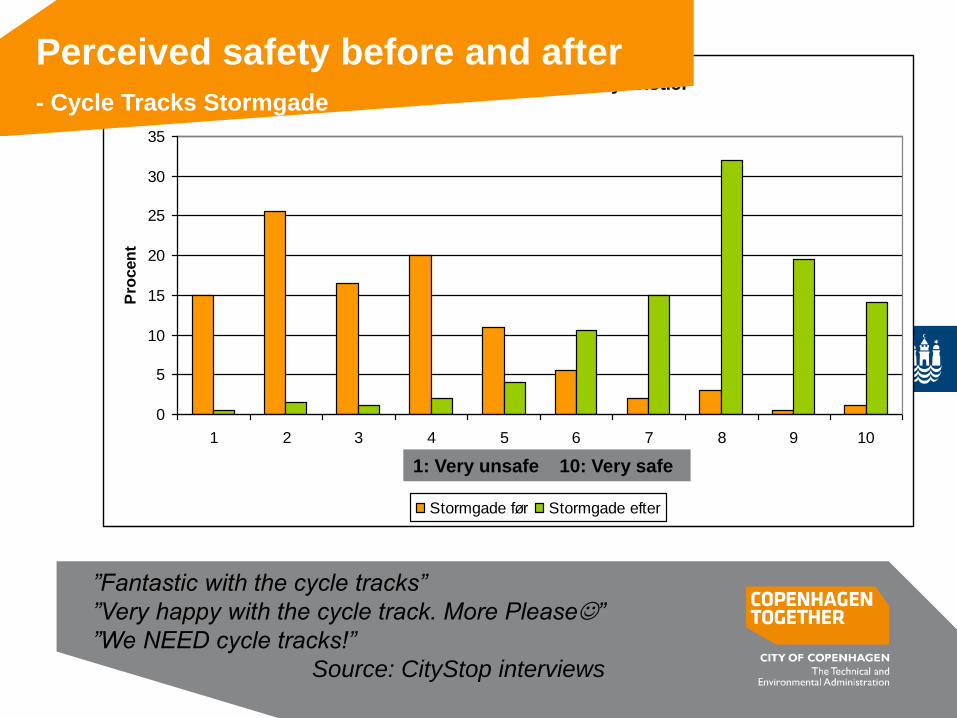
”Fantastic with the cycle tracks”
”Very happy with the cycle track. More Please”
”We NEED cycle tracks!”
Source: CityStop interviews
Percieved safety
- before and after
1: Very unsafe 10: Very safe
Perceived safety before and after
- Cycle Tracks Stormgade

Monday morning

9
Tuesday morning
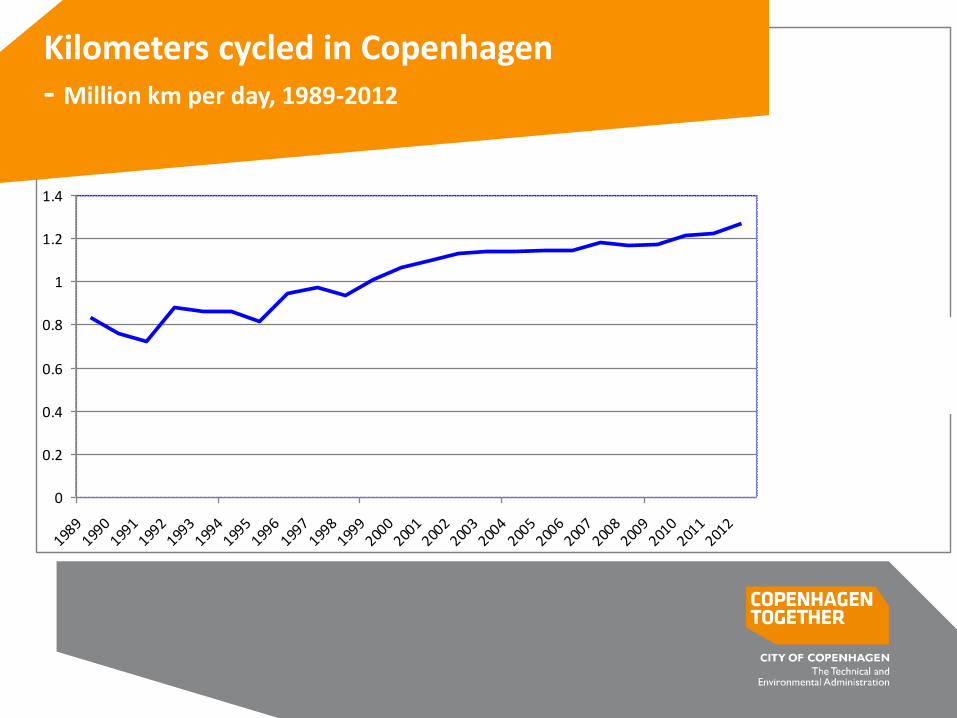
Cykeltrafikarbejde
1989-2012
mio. km pr. dag
0
0.2
0.4
0.6
0.8
1
1.2
1.4
1989
1990
1991
1992
1993
1994
1995
1996
1997
1998
1999
2000
2001
2002
2003
2004
2005
2006
2007
2008
2009
2010
2011
2012
Cykeltrafikarbejde
Kilometers cycled in Copenhagen - Million km per day, 1989-2012

33,900
31,000
25,800 24,000
20,200
-
5,000
10,000
15,000
20,000
25,000
30,000
35,000
40,000
Nørrebrogade Knippelsbro Langebro Gyldenløvsgade Torvegade
Eksempler, højt trafikerede strækninger cykler, årsdøgnstrafik 2011
Streets with high cycling volumes (examples) - Yearly average, bicycles per day

12
More diverse traffic - Reality and ambition

Cycle track design: Current focus
•Optimizing capacity
•What is a cycle track

1
4
Copenhagen
Cycle Track

Copenhagen
Cycle Lane

On-street facillities:
350 kms of cycle tracks
25 kms of cycle lanes
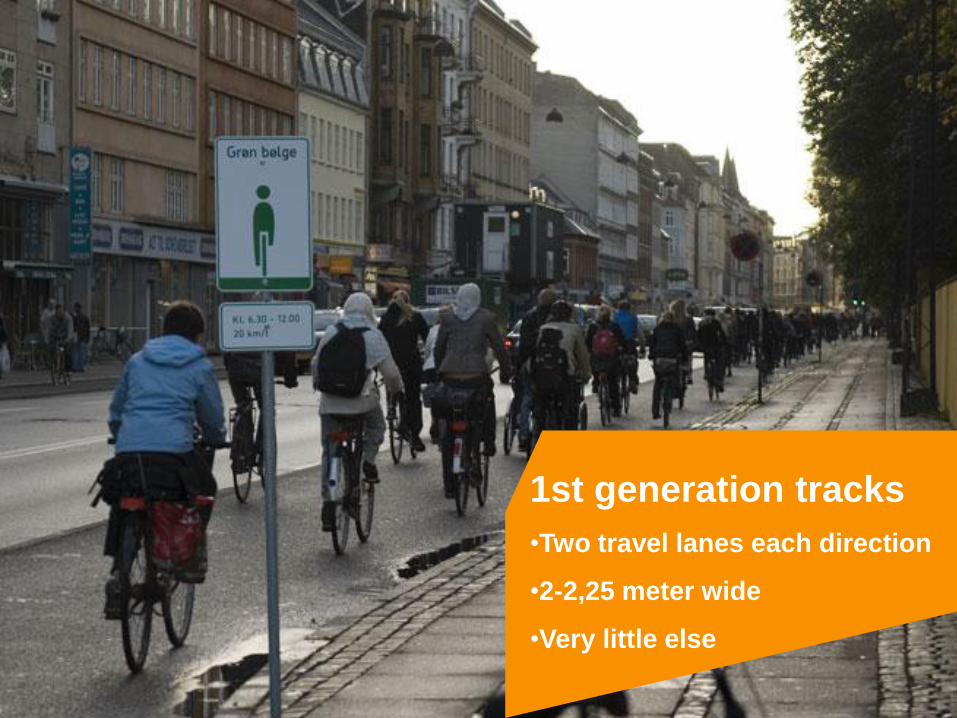
1st generation tracks
•Two travel lanes each direction
•2-2,25 meter wide
•Very little else

Towards 2nd generation
Tracks. Focus on...
Billede af Square dance
Help needed...

Where shall I stop when doing a
left turn (I)?

Before After
Where shall I stop when doing a
left turn (II)?
vlcsnap-2012-05-15-16h21m14s134.png
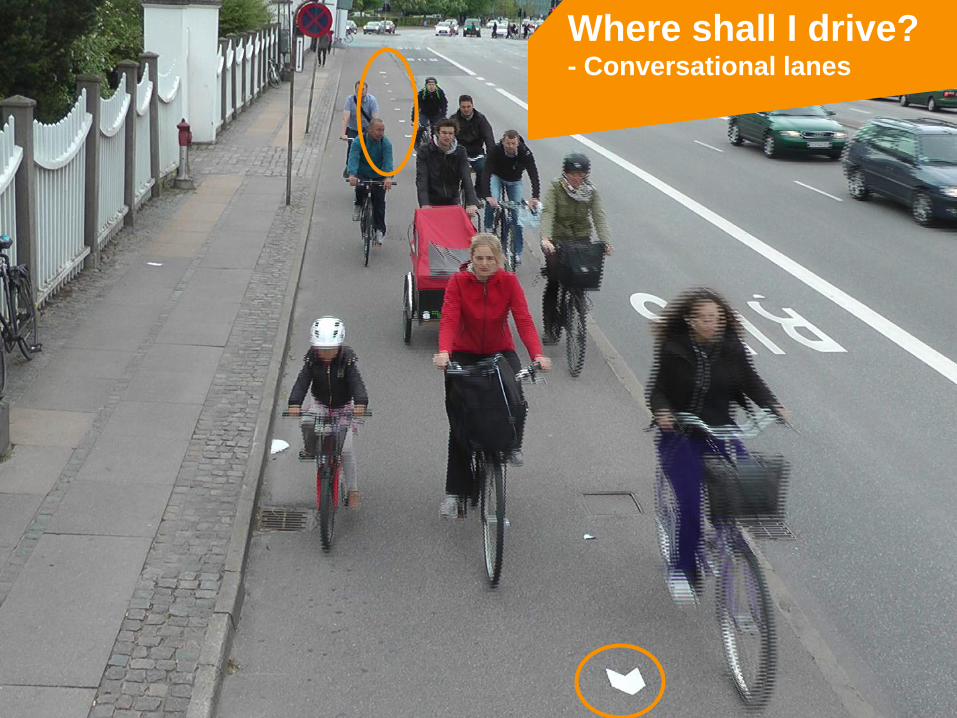
Where shall I drive? - Conversational lanes
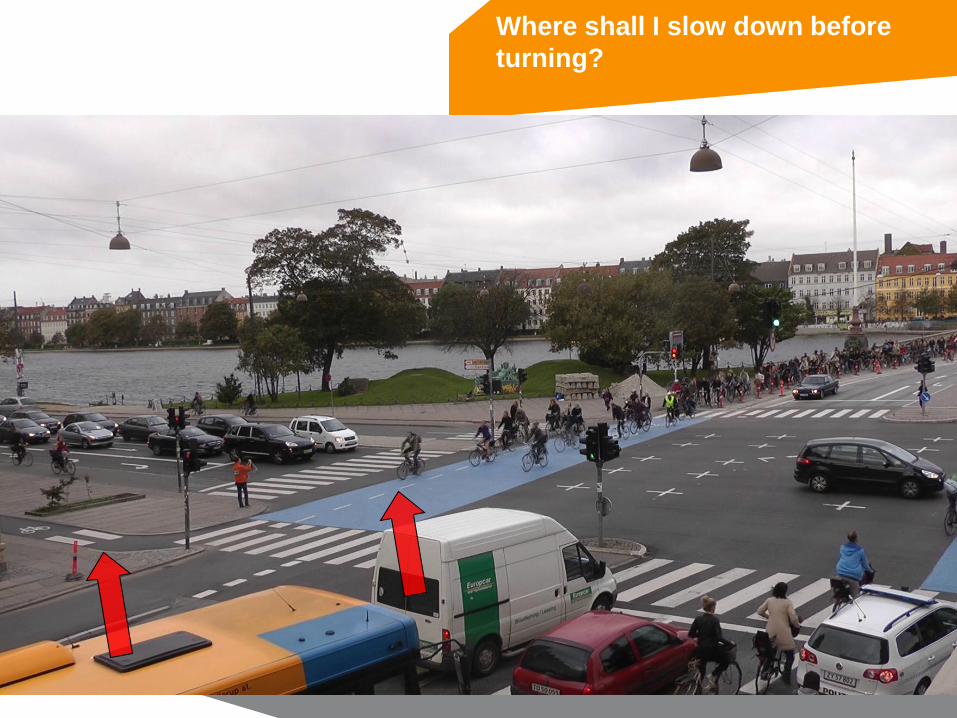
Where shall I slow down before
turning?

Getting rid of bottlenecks

ITS solutions: •”Before green”
•Dynamic green wawes
•Personalized green wawes
•Flexible use of space during the day
.

Information combined with infrastructure
”Good Cycling
etiquette”
33 % has noticed
89% positive
Difficult to measure
exact effect on
capacity

Bredere cykelstier gør en forskel
• Større kapacitet - lavere rejsetid
• Mere plads til cyklister og fodgængere
Dr. Louises Bro (before and after)
Østerbrogade 2011
Extra space if needed
(and possible): * Three travel lanes each direction
* 3 meter wide
2007
2011
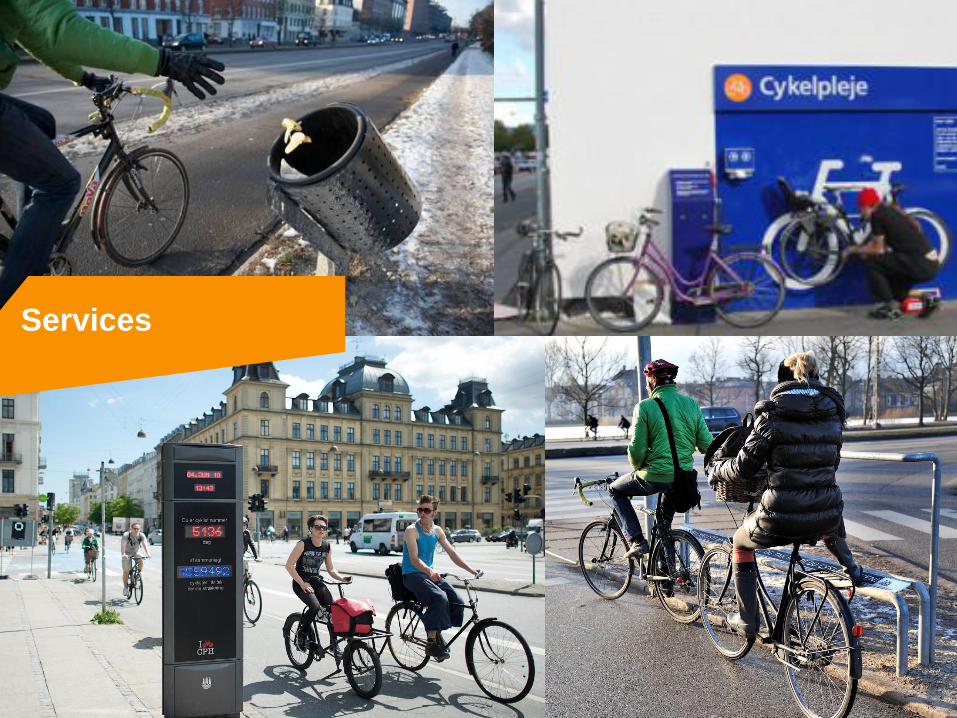
Services

29
Tools
- Better design and normalizing

Capacity monitoring •Theoretical capacity
•Subjective capacity

Realistisk simulering af cykeltrafik
Micro Simulation

North American
influence (I)

Figure 3: BQI Assessment Results
North American
influence (II)

Public engagement

Kort med alle cykelprojekter der er på vej
Very different
depending on project
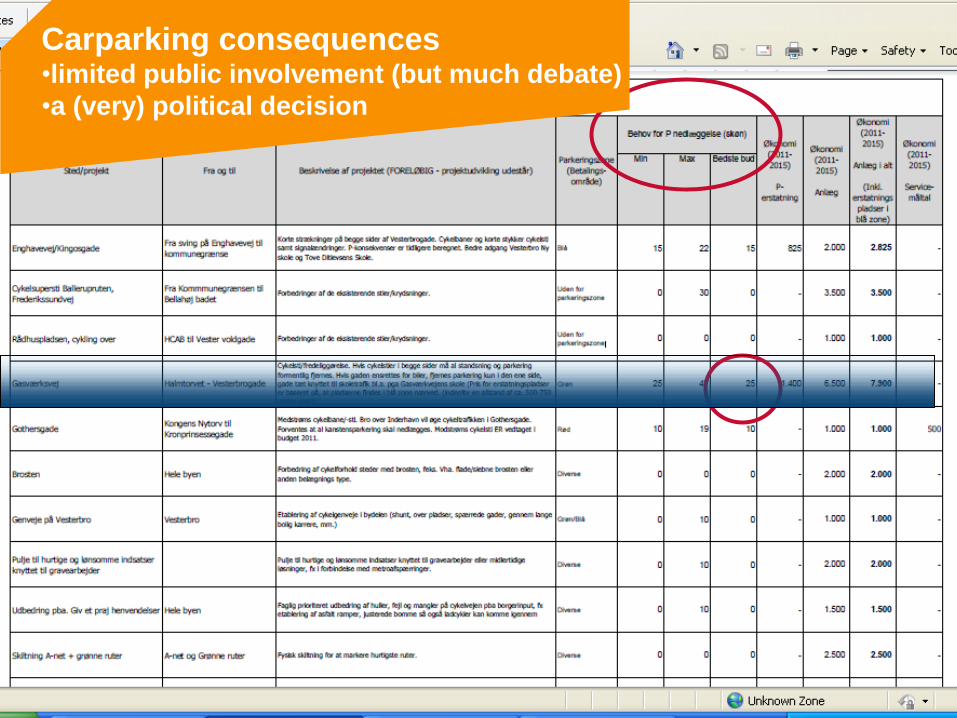
Carparking consequences •limited public involvement (but much debate)
•a (very) political decision
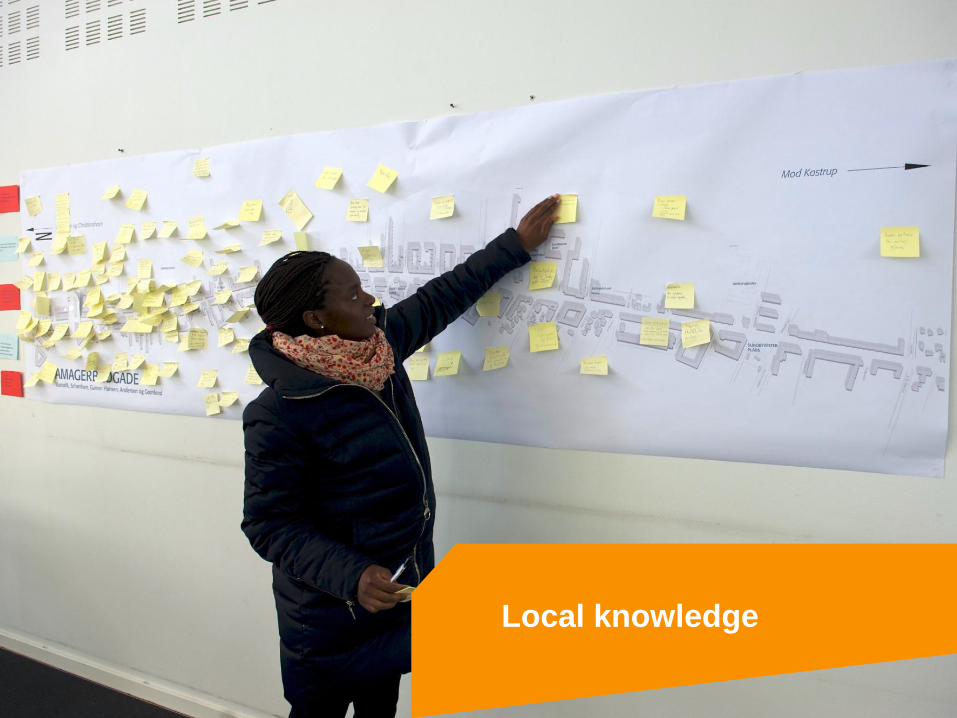
Local knowledge
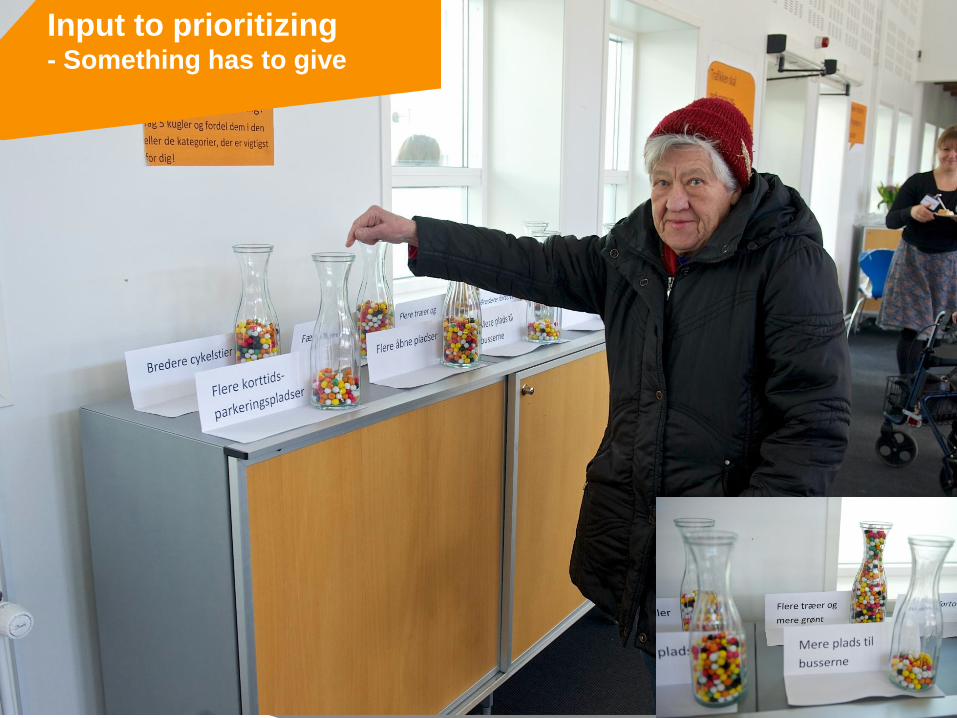
Input to prioritizing - Something has to give
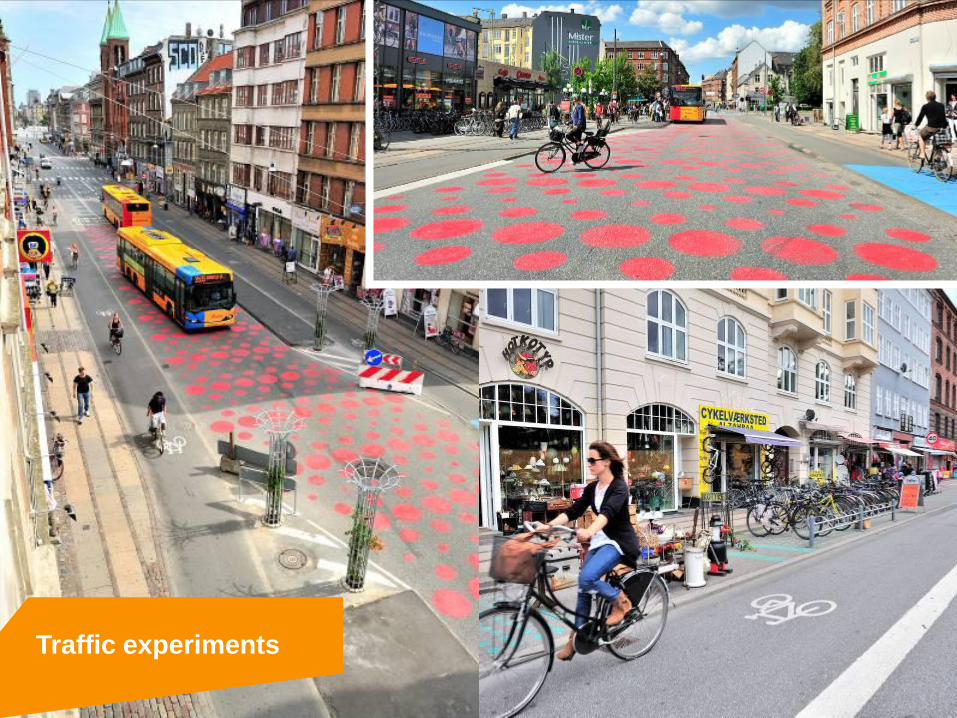
Traffic experiments
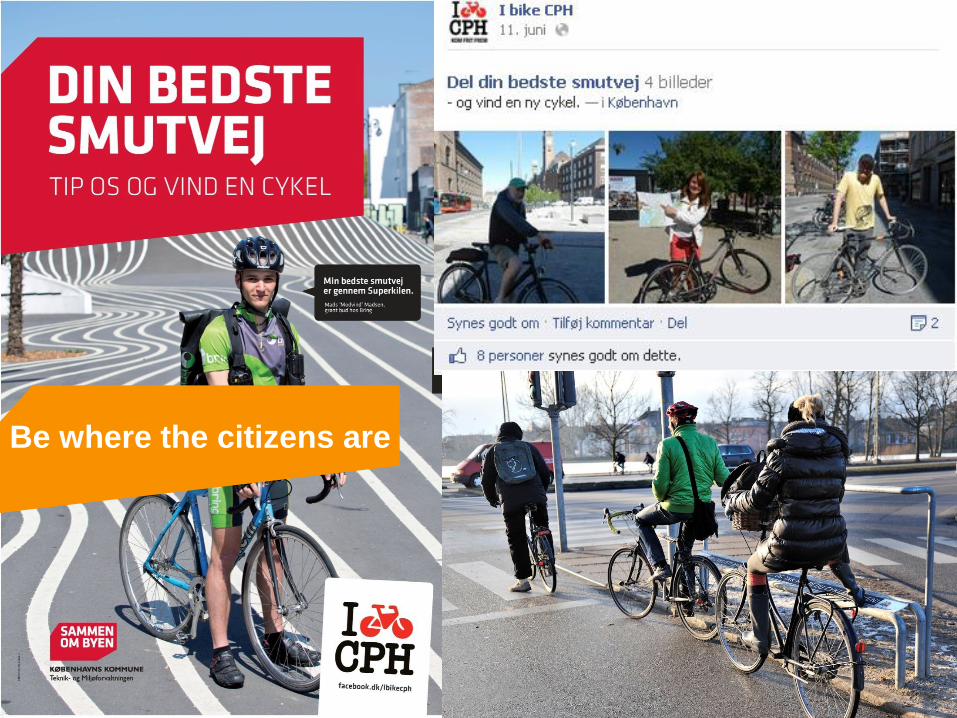
Be where the citizens are
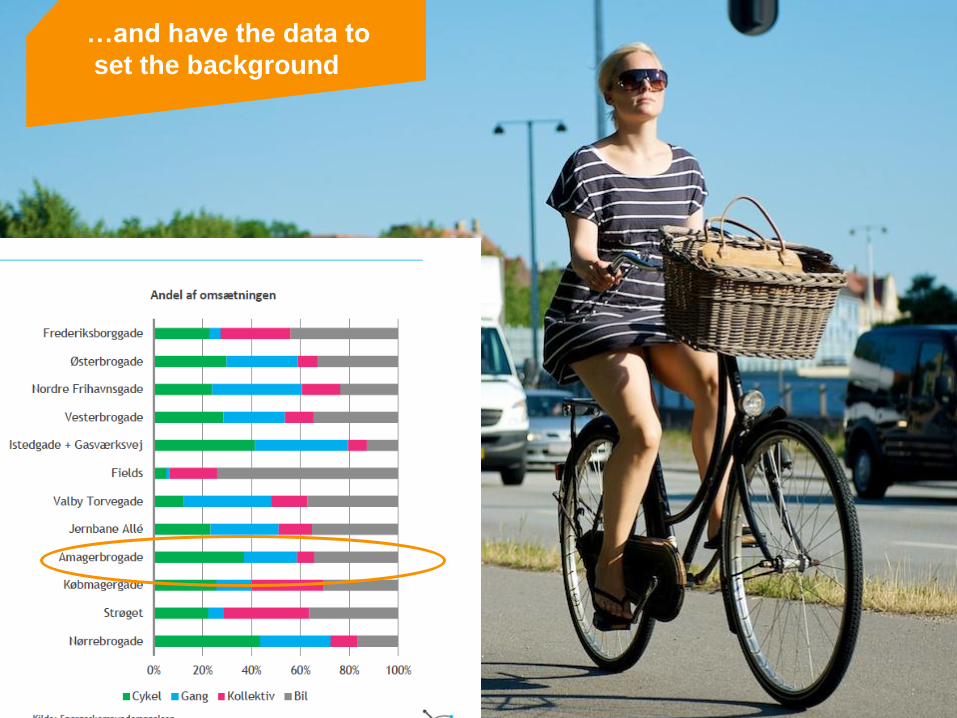
…and have the data to
set the background

Thanks!
More info: www.kk.dk/cityofcyclists