Int. J. Mol. Sci. 2022, 23, 4784. https://doi.org/10.3390/ijms23094784 www.mdpi.com/journal/ijms Article Targeting Cell Death Mechanism Specifically in Triple Negative Breast Cancer Cell Lines Lavinia‐Lorena Pruteanu 1,2,3 , Cornelia Braicu 4, *, Dezső Módos 1 , Maria‐Ancuţa Jurj 4 , Lajos‐Zsolt Raduly 4 , Oana Zănoagă 4 , Lorand Magdo 4 , Roxana Cojocneanu 4 , Sergiu Paşca 4 , Cristian Moldovan 2,5 , Alin Iulian Moldovan 2,5 , Adrian Bogdan Ţigu 2 , Eugen Gurzău 6 , Lorentz Jäntschi 7,8 , Andreas Bender 1 and Ioana Berindan‐Neagoe 4 1 Department of Chemistry, Centre for Molecular Science Informatics, University of Cambridge, Cambridge CB2 1EW, UK; [email protected] (L.‐L.P.); [email protected] (D.M.); [email protected] (A.B.) 2 MedFuture Research Center for Advanced Medicine, “Iuliu Hațieganu” University of Medicine and Pharmacy, 400377 Cluj‐Napoca, Romania; [email protected] (C.M.); [email protected] (A.I.M.); [email protected] (A.B.Ț.) 3 Department of Chemistry and Biology, North University Center at Baia Mare, Technical University of Cluj‐Napoca, 4800 Baia Mare, Romania 4 Research Center for Functional Genomics, Biomedicine and Translational Medicine, “Iuliu Hațieganu” University of Medicine and Pharmacy, 400337 Cluj‐Napoca, Romania; [email protected] (M.‐A.J.); [email protected] (L.‐Z.R.); [email protected] (O.Z.); [email protected] (L.M.); [email protected] (R.C.); [email protected] (S.P.); [email protected] (I.B.‐N.) 5 Department of Pharmaceutical Physics‐Biophysics, “Iuliu Hațieganu” University of Medicine and Phar‐ macy, 400349 Cluj‐Napoca, Romania 6 Environmental Health Center, 400240 Cluj‐Napoca, Romania; [email protected] 7 Institute for Doctoral Studies, Babeş‐Bolyai University, 400084 Cluj‐Napoca, Romania; [email protected] 8 Department of Physics and Chemistry, Technical University of Cluj‐Napoca, 400641 Cluj‐Napoca, Romania * Correspondence: [email protected] Abstract: Triple negative breast cancer (TNBC) is currently associated with a lack of treatment op‐ tions. Arsenic derivatives have shown antitumoral activity both in vitro and in vivo; however, their mode of action is not completely understood. In this work we evaluate the response to arsenate of the double positive MCF‐7 breast cancer cell line as well as of two different TNBC cell lines, Hs578T and MDA‐MB‐231. Multimodal experiments were conducted to this end, using functional assays and microarrays. Arsenate was found to induce cytoskeletal alteration, autophagy and apoptosis in TNBC cells, and moderate effects in MCF‐7 cells. Gene expression analysis showed that the TNBC cell linesʹ response to arsenate was more prominent in the G2M checkpoint, autophagy and apop‐ tosis compared to the Human Mammary Epithelial Cells (HMEC) and MCF‐7 cell lines. We con‐ firmed the downregulation of anti‐apoptotic genes (MCL1, BCL2, TGFβ1 and CCND1) by qRT‐PCR, and on the protein level, for TGFβ2, by ELISA. Insight into the mode of action of arsenate in TNBC cell lines it is provided, and we concluded that TNBC and non‐TNBC cell lines reacted differently to arsenate treatment in this particular experimental setup. We suggest the future research of arse‐ nate as a treatment strategy against TNBC. Keywords: triple negative breast cancer; breast cancer; gene expression; arsenate; microarray; mode of action 1. Introduction Breast cancer is a common female malignancy, representing 11.6% of all cancer cases worldwide, [1] particularly in developing countries [2–4]. Among all breast cancer sub‐ types, triple negative breast cancer (TNBC) is differentiated from other types of breast Citation: Pruteanu, L.‐L.; Braicu, C.; Módos, D.; Jurj, M.‐A.; Raduly, L.‐Z.; Zănoagă, O.; Magdo, L.; Cojocneanu, R.; Sergiu, P.; Moldovan, C.; et al. Targeting Cell Death Mechanism Specifically in Triple Negative Breast Cancer Cell Lines. Int. J. Mol. Sci. 2022, 23, 4784. https://doi.org/10.3390/ijms23094784 Academic Editor: Nam Deuk Kim Received: 18 March 2022 Accepted: 15 April 2022 Published: 26 April 2022 Publisher’s Note: MDPI stays neu‐ tral with regard to jurisdictional claims in published maps and institu‐ tional affiliations. Copyright: © 2022 by the authors. Li‐ censee MDPI, Basel, Switzerland. This article is an open access article distributed under the terms and con‐ ditions of the Creative Commons At‐ tribution (CC BY) license (https://cre‐ ativecommons.org/licenses/by/4.0/).

Welcome message from author
This document is posted to help you gain knowledge. Please leave a comment to let me know what you think about it! Share it to your friends and learn new things together.
Transcript
Int. J. Mol. Sci. 2022, 23, 4784. https://doi.org/10.3390/ijms23094784 www.mdpi.com/journal/ijms
Article
Targeting Cell Death Mechanism Specifically in Triple
Negative Breast Cancer Cell Lines
Lavinia‐Lorena Pruteanu 1,2,3, Cornelia Braicu 4,*, Dezső Módos 1, Maria‐Ancuţa Jurj 4, Lajos‐Zsolt Raduly 4,
Oana Zănoagă 4, Lorand Magdo 4, Roxana Cojocneanu 4, Sergiu Paşca 4, Cristian Moldovan 2,5,
Alin Iulian Moldovan 2,5, Adrian Bogdan Ţigu 2, Eugen Gurzău 6, Lorentz Jäntschi 7,8, Andreas Bender 1 and
Ioana Berindan‐Neagoe 4
1 Department of Chemistry, Centre for Molecular Science Informatics, University of Cambridge,
Cambridge CB2 1EW, UK; [email protected] (L.‐L.P.); [email protected] (D.M.);
[email protected] (A.B.) 2 MedFuture Research Center for Advanced Medicine, “Iuliu Hațieganu” University of Medicine and
Pharmacy, 400377 Cluj‐Napoca, Romania; [email protected] (C.M.);
[email protected] (A.I.M.); [email protected] (A.B.Ț.) 3 Department of Chemistry and Biology, North University Center at Baia Mare, Technical University of
Cluj‐Napoca, 4800 Baia Mare, Romania 4 Research Center for Functional Genomics, Biomedicine and Translational Medicine, “Iuliu Hațieganu”
University of Medicine and Pharmacy, 400337 Cluj‐Napoca, Romania; [email protected] (M.‐A.J.);
[email protected] (L.‐Z.R.); [email protected] (O.Z.); [email protected] (L.M.);
[email protected] (R.C.); [email protected] (S.P.); [email protected] (I.B.‐N.) 5 Department of Pharmaceutical Physics‐Biophysics, “Iuliu Hațieganu” University of Medicine and Phar‐
macy, 400349 Cluj‐Napoca, Romania 6 Environmental Health Center, 400240 Cluj‐Napoca, Romania; [email protected] 7 Institute for Doctoral Studies, Babeş‐Bolyai University, 400084 Cluj‐Napoca, Romania;
[email protected] 8 Department of Physics and Chemistry, Technical University of Cluj‐Napoca, 400641 Cluj‐Napoca, Romania
* Correspondence: [email protected]
Abstract: Triple negative breast cancer (TNBC) is currently associated with a lack of treatment op‐
tions. Arsenic derivatives have shown antitumoral activity both in vitro and in vivo; however, their
mode of action is not completely understood. In this work we evaluate the response to arsenate of
the double positive MCF‐7 breast cancer cell line as well as of two different TNBC cell lines, Hs578T
and MDA‐MB‐231. Multimodal experiments were conducted to this end, using functional assays
and microarrays. Arsenate was found to induce cytoskeletal alteration, autophagy and apoptosis in
TNBC cells, and moderate effects in MCF‐7 cells. Gene expression analysis showed that the TNBC
cell linesʹ response to arsenate was more prominent in the G2M checkpoint, autophagy and apop‐
tosis compared to the Human Mammary Epithelial Cells (HMEC) and MCF‐7 cell lines. We con‐
firmed the downregulation of anti‐apoptotic genes (MCL1, BCL2, TGFβ1 and CCND1) by qRT‐PCR,
and on the protein level, for TGFβ2, by ELISA. Insight into the mode of action of arsenate in TNBC
cell lines it is provided, and we concluded that TNBC and non‐TNBC cell lines reacted differently
to arsenate treatment in this particular experimental setup. We suggest the future research of arse‐
nate as a treatment strategy against TNBC.
Keywords: triple negative breast cancer; breast cancer; gene expression; arsenate; microarray; mode
of action
1. Introduction
Breast cancer is a common female malignancy, representing 11.6% of all cancer cases
worldwide, [1] particularly in developing countries [2–4]. Among all breast cancer sub‐
types, triple negative breast cancer (TNBC) is differentiated from other types of breast
Citation: Pruteanu, L.‐L.; Braicu, C.;
Módos, D.; Jurj, M.‐A.; Raduly, L.‐Z.;
Zănoagă, O.; Magdo, L.;
Cojocneanu, R.; Sergiu, P.;
Moldovan, C.; et al. Targeting Cell
Death Mechanism Specifically in
Triple Negative Breast Cancer Cell
Lines. Int. J. Mol. Sci. 2022, 23, 4784.
https://doi.org/10.3390/ijms23094784
Academic Editor: Nam Deuk Kim
Received: 18 March 2022
Accepted: 15 April 2022
Published: 26 April 2022
Publisher’s Note: MDPI stays neu‐
tral with regard to jurisdictional
claims in published maps and institu‐
tional affiliations.
Copyright: © 2022 by the authors. Li‐
censee MDPI, Basel, Switzerland.
This article is an open access article
distributed under the terms and con‐
ditions of the Creative Commons At‐
tribution (CC BY) license (https://cre‐
ativecommons.org/licenses/by/4.0/).
Int. J. Mol. Sci. 2022, 23, 4784 2 of 24
cancer by not expressing three receptors, namely the Estrogen receptor, Progesterone re‐
ceptor and the receptor tyrosine kinase Her2/neu [3–5]. TNBC occurs more often in
younger women and it is more difficult to identify on a mammogram [2–4]. Furthermore,
TNBC tends to grow faster than other types of cancer and it frequently recurs [3,6].
Standard therapy across breast cancer subtypes includes surgery, chemotherapy, and
radiation. Non‐selective chemotherapies are especially important for TNBC patients, be‐
cause no targeted therapy is available. Also, for those patients who have developed me‐
tastases, surgery alone is not sufficient, and additional general chemotherapy is necessary
[4,6–11]. Hence, treatment options for TNBC differ from other types of breast cancer, and
they are generally more limited [3,5]. All of these factors necessitate potential novel
chemotherapeutic agents, ideally with at least limited selectivity.
Among non‐specific cancer treatments, arsenic‐derived compounds are commonly
used [12–14]. In the human body, inorganic arsenic compounds are converted to arsenite
(arsenic in the +3 oxidation state) and arsenate (arsenic in the +5 oxidation state). Arsenite
is significantly more toxic than arsenate, which is related to both reactivity and transport
[12–14]. Upon entering the cell, arsenate can be reduced to arsenite, leading to both chem‐
ical species being present depending on the redox state of the cell [15–17].
Arsenate is known to cause direct and indirect DNA damage through reactive oxy‐
gen species, [18] and can affect the DNA repair mechanism at low concentrations [19].
Increased inorganic phosphate transport observed in the MDA‐MB‐231 cell line may be
associated with the higher energy demands linked to its metastatic phenotype and can
increase the arsenate intake as well [20]. Arsenic has been studied more extensively on the
transcriptomic level due to its clinical relevance, [21] however the same is not yet true for
arsenate, which is the contribution of the current work [20]. On the mechanistic level, the
activity of arsenate is largely unknown in breast cancer. Here we attempted to unravel the
effects of arsenate on TNBC cells in comparison with one double positive breast cancer
(DPBC) and one normal breast cell line. In particular, we used the normal breast cell line
HMEC (Human Mammary Epithelial Cells), the DPBC cell line MCF‐7, as well as the
TNBC cell lines Hs578T and MDA‐MB‐231. HMEC and MCF‐7 possess intact DNA repair
mechanisms according to the COSMIC cell line encyclopedia, while the two TNBC cell
lines are p53 mutants [22].
The purpose of this study was to investigate whether arsenate can be a selective
chemotherapeutic agent against TNBC cell lines. For this, we examined the response to
arsenate treatment in autophagy, apoptosis and cell proliferation via phenotypic and tran‐
scriptomics readouts. Firstly, we evaluated the effect of arsenate treatment on the cellular
level. We performed functional tests, including colony assay formation, autophagy and
apoptosis investigation using fluorescence microscopy, and measured cytoskeletal re‐
sponse by immunofluorescence staining followed by confocal microscopy evaluation and
dark field microscopy for morphologic alteration. Then, after seeing that arsenate causes
apoptosis specifically in the Hs578T and MDA‐MB‐231 cell lines, we investigated whether
there is any mechanistic change in the transcriptome of the cell lines responding to the
low arsenate concentration using cDNA microarrays and regularized discriminant analy‐
sis (RDA). Finally, findings from the gene expression analysis were validated by qRT‐
PCR, and at the protein level by ELISA and immunofluorescence confocal microscopy.
2. Results
2.1. Arsenate Exposure Decreases Colony Formation in Cancer Cell Lines
We first assessed the effect of arsenate exposure on colony formation capacity, which
is a widely used test to assess the sensitivity of tumor cell lines to therapeutic agents [23].
The test evaluates the clonogenic capacity, responding to much lower doses than the
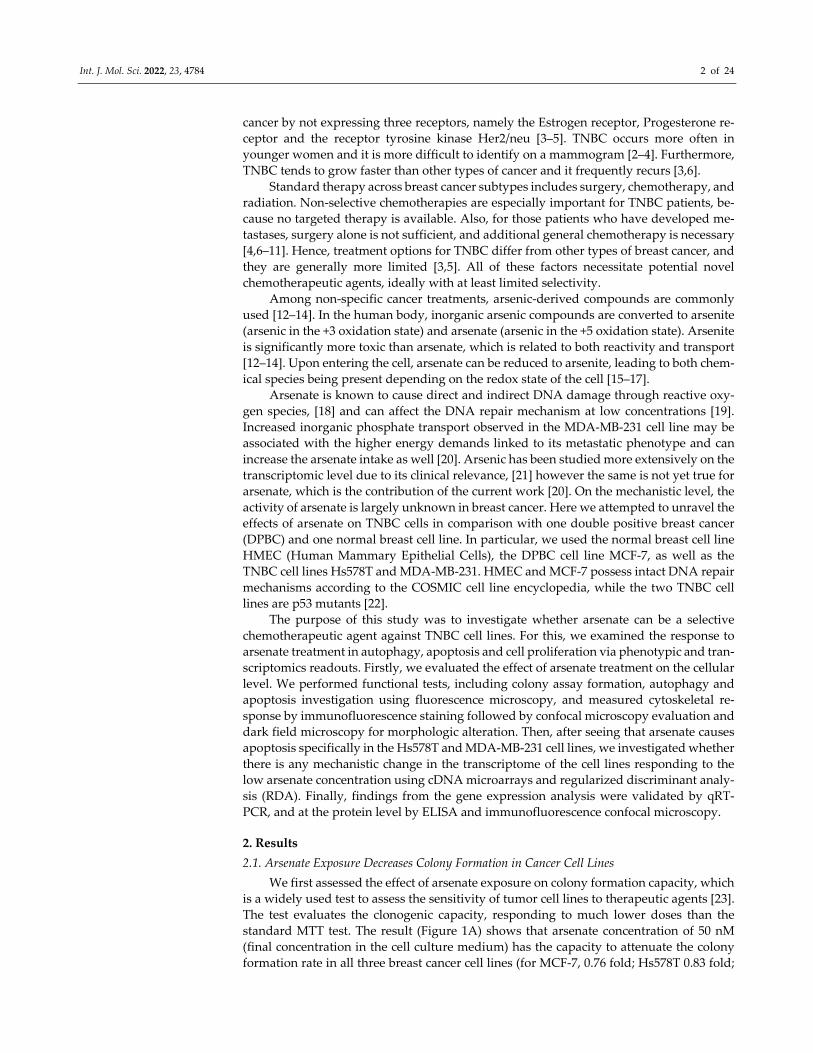
standard MTT test. The result (Figure 1A) shows that arsenate concentration of 50 nM
(final concentration in the cell culture medium) has the capacity to attenuate the colony
formation rate in all three breast cancer cell lines (for MCF‐7, 0.76 fold; Hs578T 0.83 fold;
Int. J. Mol. Sci. 2022, 23, 4784 3 of 24
MDA‐MB‐231 to 0.87 fold of control). The effect of arsenate treatment on the ability of
forming colonies has been shown in previous studies, [24] and the current results are in
agreement with that. (The HMEC cell line was unable to form colonies, since it is a non‐
tumorous cell line).
Figure 1. Evaluation of cellular effect of arsenate. (A) Arsenate treatment (50 nM) affects the ability
of breast cancer cell lines to form colonies at 24 h after arsenate treatment. On the left side of the
figure are representative images of the colony formation assays for each cell line, while on the right
side boxplots for the number of colonies are shown. (*p < 0.05 two sided t‐test treated vs. untreated
cells n = 3). Arsenate significantly decreased the colony forming capacity of all cancer cell lines used
in this study (while the normal HMEC cell line used as a control is not able to form colonies in any
case). (B) Autophagy evaluation by fluorescence microscopy following exposure to 50 nM arsenate
on different cell lines (20× magnification). This experiment emphasizes an increase of MDC‐labeled
vesicles as an effect of arsenate exposure in tumor cells, which is less profound in normal cells 24 h
after treatment. Compared to control, the number of autophagic cells was significantly increased 24
h after arsenate treatment. (*** p < 0.001, **** p < 0.0001 two sided t‐test, treated vs. untreated cells n
Int. J. Mol. Sci. 2022, 23, 4784 4 of 24
= 3) (C) Apoptosis evaluation in the same experimental conditions at 24 h after arsenate treatment.
Green fluorescence is Annexin V‐FITC and red fluorescence is propidium iodide (PI). Annexin V‐
FITC around the membrane displays apoptotic cells, only red fluorescence in the nucleus displays
the necrotic cells and double staining is specific for late apoptotic cells. Large numbers of fluorescent
Annexin V‐FITC and Annexin V‐FITC/PI was observed in tumoral cells treated with arsenate; in
contrast, few fluorescent cells were observed in the HMEC control cells. The number of cells were
counted with the apoptotic markers and normalized with the untreated controls. (* p < 0.05, *** p <
0.001 two sided t‐test, treated vs. untreated cells n = 3)
2.2. Effect of Arsenate on the Modulation of Apoptosis and Autophagy in MCF‐7, Hs578T, and
MDA‐MB‐231 Cells
Given the decrease of colony formation ability described above, we next investigated
its mechanistic background, focusing on apoptosis and autophagy. We stained the cells
with monodansylcadaverine (MDC), a fluorescent marker for the acidic endosomes, lyso‐
somes, and late‐stage autophagosomes [25]. An increase of the MDC signal was observed
in the case of treated cancer cell lines compared to untreated cells (Figure 1B), which gen‐
erally labels later stages of the degradation processes, as opposed to being a specific
marker for autophagy [25]. Arsenate treatment increased the number of autophagy vacu‐
oles containing MCF‐7 cells by a factor of 1.91 compared to control (p = 0.0004). However,
the increase is not observed for arsenate treated vs. untreated HMEC cells (Figure 1B; p >
0.05 in a t‐test). The number of autophagic cells in the Hs578T and MDA‐MB‐231 cell lines
increased significantly (by a factor of 5.31 and 6.43, p = < 0.0001 and 0.0001 in a t‐test,
respectively).
The cells were then simultaneously stained with Annexin‐V and FITC/PI to visualize
apoptosis. Only Annexin‐V FITC staining visualizes early apoptosis, meanwhile both An‐
nexin‐V and FITC PI are markers for late apoptosis. An increased apoptotic rate was ob‐
served in the triple negative breast cancer cell lines as follows. In the Hs578T cell line, both
the early and late apoptotic state was visible, while in case of the MDA‐MB‐231 cells, the
majority of cells appeared in the late apoptotic phase (70–90%; Figure 1C). The number of
apoptotic cells also increased in the DPBC MCF‐7 cell line (by a factor of 2.82; p = 0.026 in
a t‐test), but not in the HMEC cell line (p > 0.05).
These data suggest the involvement of apoptosis and likely autophagy as a response
to arsenate exposure, which, based on the data shown here, is more pronounced in the
TNBC cancer cell lines. Consistent with that, arsenic in oxidation state +3 has previously
been found to interfere with intrinsic and extrinsic apoptosis and autophagy mechanisms
in the breast cancer cell lines MCF‐7 and MDA‐MB‐231 [26]. Arsenic trioxide was found
to suppress cell growth, to stimulate apoptosis, and to be involved in retarded cell inva‐
sion by interfering with coding and non‐coding gene regulation [27–30].
Autophagy has been presented in previous literature as a protective mechanism
against arsenite induced oxidative stress, which causes genome damage [31]. Meanwhile,
there is no literature information related to the modulation of autophagy by arsenate.
Based on the current study, we can conclude that arsenate exposure likely activates au‐
tophagy (with some ambiguity from the MDC marker used as in our previous studies
[32,33]) and (more certainly) apoptosis, and hence similar cellular mechanisms as arsenite.
In our study the activation of autophagy observed by fluorescence microscopy is sup‐
ported by microarray data. The idea of this study was to demonstrate how complex the
mechanistic effects of arsenate are. On this occasion we did not focus on a single mecha‐
nism like the autophagy. Microarray data shows that arsenateʹs effects are complex, em‐
phasizing the crosstalk among the different signalling pathways. This observation was is
confirmed as well in publications such as [34].
2.3. Dark‐Field Microscopic and Cytoskeletal Evaluation
We next used dark field microscopy to assess cellular morphology, which allows for
the assessment of cytoskeleton alterations and hence the actin and tubulin status of a cell.
Int. J. Mol. Sci. 2022, 23, 4784 5 of 24
It can also resolve more discrete features such as membrane disorganization, blebbing and
apoptotic bodies. In the case of HMEC cells, only a slight modification of morphology was
observed (Figure 2). The cells appear slightly elongated in the arsenate treated group com‐
pared to the control. Nuclei have a normal round/elliptical shape with no signs of frag‐
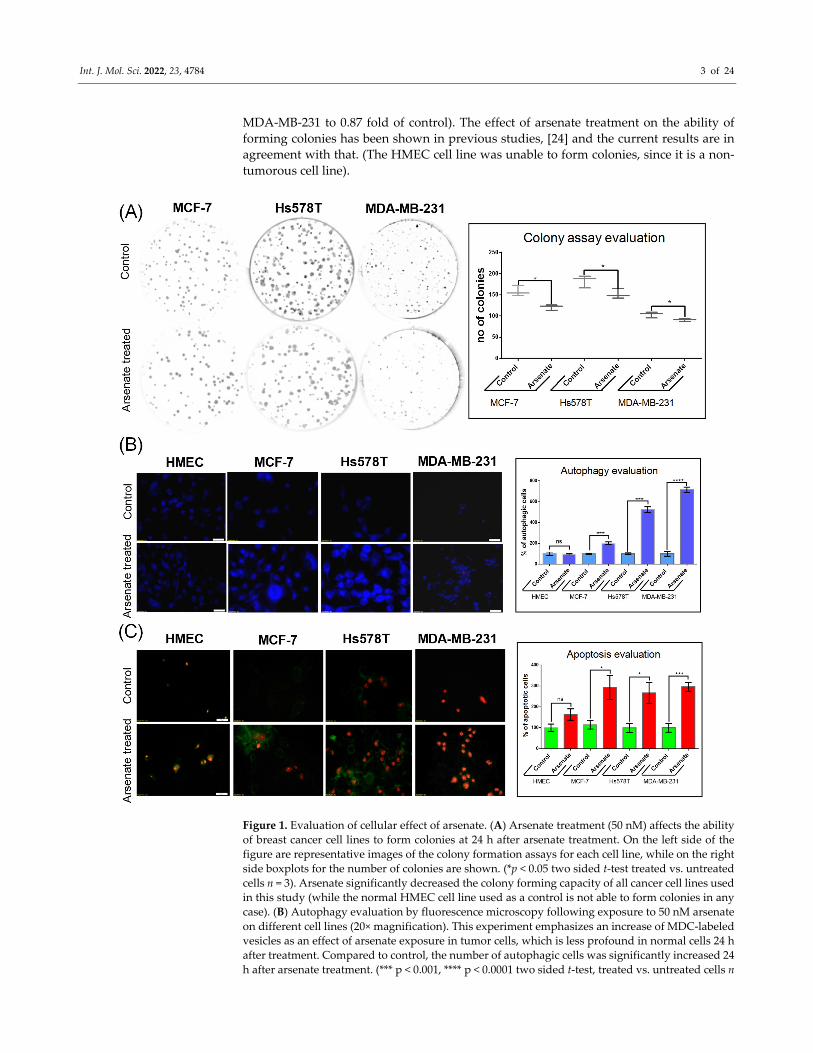
mentation. After arsenate exposure the cell membrane of TNBC cells became thick and
fragmented (Figure 2F, H, green arrows).
Figure 2. Effect of arsenate treatment on four different cell lines visualized using dark field micros‐
copy. Magnification of 15 μm. (A) HMEC untreated cells, (B) HMEC arsenate treated cells, (C) MCF‐
7 untreated cells, (D) MCF‐7 arsenate treated cells, (E) Hs578T untreated cells, (F) Hs578T arsenate
treated cells, (G) MDA‐MD‐231 untreated cells, (H) MDA‐MD‐231 arsenate treated cells. Red arrows
(D) indicate apoptotic bodies; green arrows (F,H) indicate thickened and fragmented cell mem‐
branes. EC (orange—(F)) elongated cell, orange arrows (F) indicate apoptopodia‐like projections,
magenta arrows (F) indicate tunneling nanotubes, cyan arrows (H) show apoptotic bodies labeled
AB. No important alterations can be seen for normal cell lines; meanwhile, in the case of tumor cells,
the activation of apoptotic mechanisms can be observed (indicated by red arrows), which is more
pronounced for TNBC cells.
Cellular stress becomes visible through abnormal elongated cells for MCF‐7 and
Hs578T cells and irregular nuclei surrounded by sparse apoptotic bodies (Figures 2D and
2F). Numerous apoptotic bodies can be seen in the case of arsenate treated cells (Figure
2H), and the apical membrane (Figure 2F) shows signs of breakage and a higher degree of
disorganization. Apoptopodia‐like projections are prominent in the case of Hs578T cells
(Figure 2F), which are less pronounced for MDA‐MB‐231 and MCF‐7 and not present in
the case of HMEC cells. In the case of Hs578T, the presence of cells with abnormally high
nuclear displacement and the formation of tunneling nanotubes (Figure 2F) can be ob‐
served. All of this shows that HMEC cells are not going through the same strong apoptotic
response that is observed for the tumor cells.
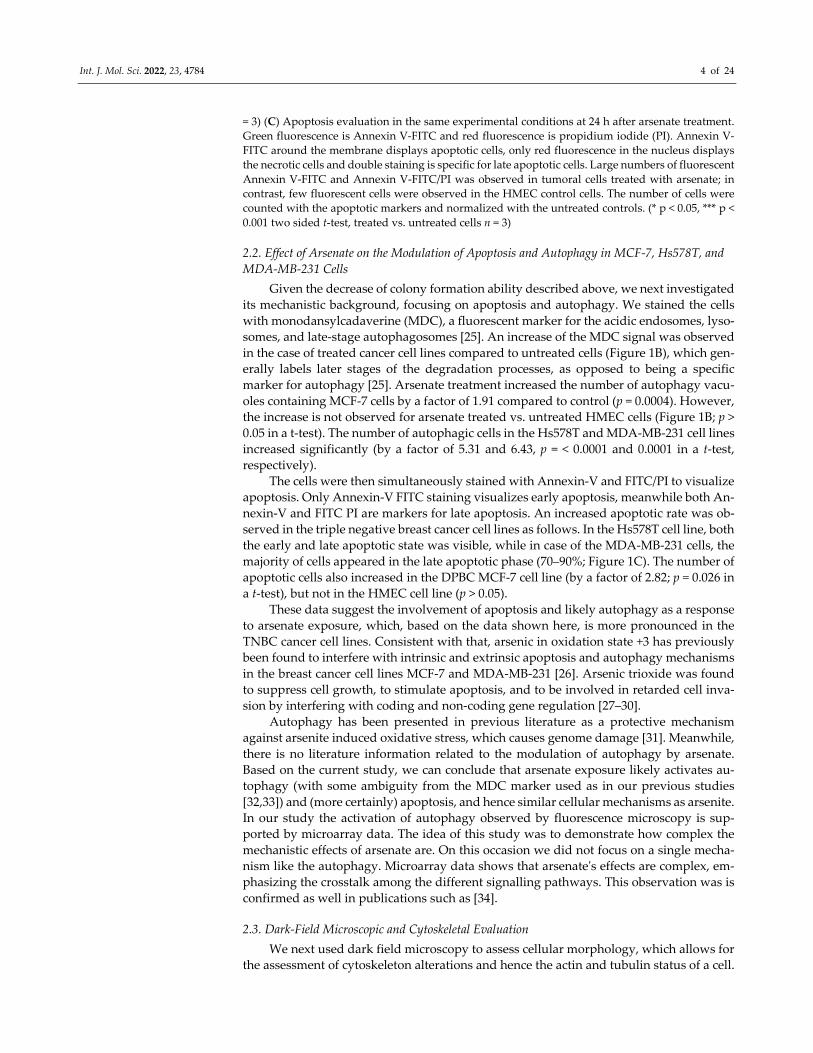
To assess whether the morphological response of the cellular cytoskeleton to arsenate
treatment is in accordance with the dark field microscopy images, we next stained the
actin cytoskeleton with Phalloidin‐FITC dye and the cell nuclei with DAPI staining, visu‐
alized in Figure 3. The response of HMEC cells (Figure 3A.I, II) to arsenate exposure was
reduced compared to the cancer cell lines, and it can be observed that the cells are now
more compact and have a slightly elongated shape. Also, the nucleus and cytoplasm area
of HMEC cells is reduced as a result of arsenate exposure. Some larger nuclei are still
visible in the case of HMEC cells, which indicates a stress response; however, the nuclei
are not fragmented. In contrast, in the case of breast cancer cells, the nuclear fragmentation
is more pronounced in TNBC cells (Figure 3B.II).
Int. J. Mol. Sci. 2022, 23, 4784 6 of 24
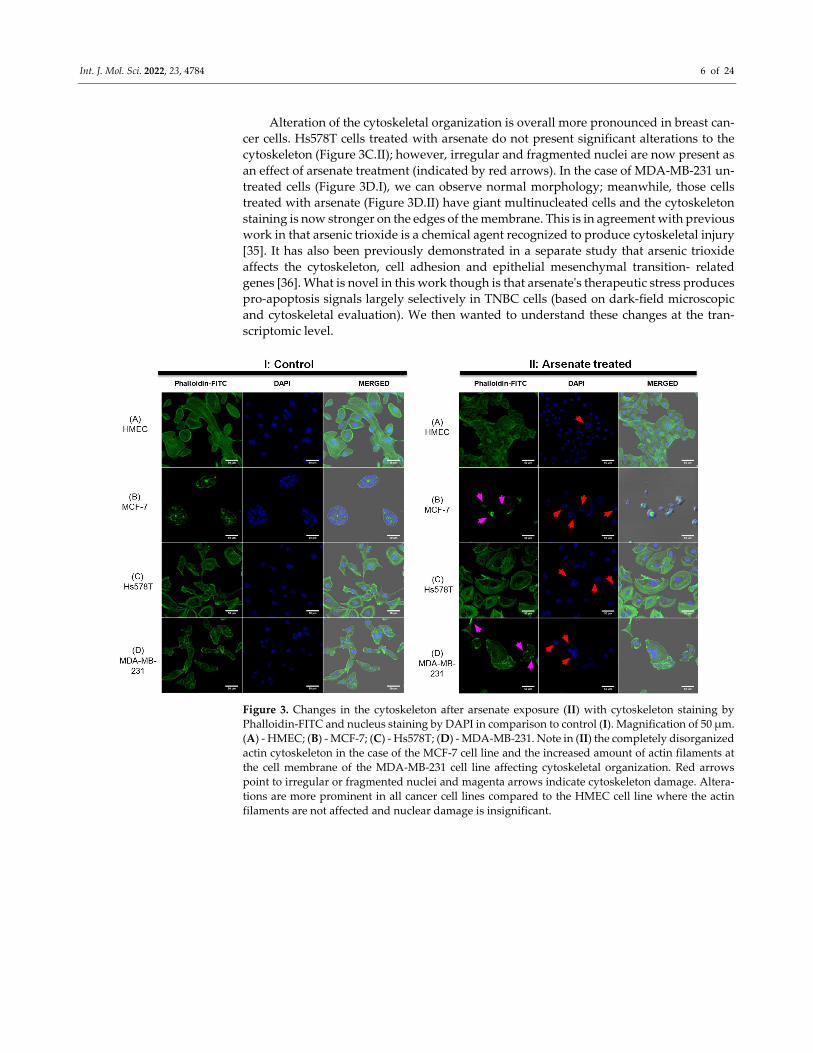
Alteration of the cytoskeletal organization is overall more pronounced in breast can‐
cer cells. Hs578T cells treated with arsenate do not present significant alterations to the
cytoskeleton (Figure 3C.II); however, irregular and fragmented nuclei are now present as
an effect of arsenate treatment (indicated by red arrows). In the case of MDA‐MB‐231 un‐
treated cells (Figure 3D.I), we can observe normal morphology; meanwhile, those cells
treated with arsenate (Figure 3D.II) have giant multinucleated cells and the cytoskeleton
staining is now stronger on the edges of the membrane. This is in agreement with previous
work in that arsenic trioxide is a chemical agent recognized to produce cytoskeletal injury
[35]. It has also been previously demonstrated in a separate study that arsenic trioxide
affects the cytoskeleton, cell adhesion and epithelial mesenchymal transition‐ related
genes [36]. What is novel in this work though is that arsenateʹs therapeutic stress produces
pro‐apoptosis signals largely selectively in TNBC cells (based on dark‐field microscopic
and cytoskeletal evaluation). We then wanted to understand these changes at the tran‐
scriptomic level.
Figure 3. Changes in the cytoskeleton after arsenate exposure (II) with cytoskeleton staining by
Phalloidin‐FITC and nucleus staining by DAPI in comparison to control (I). Magnification of 50 μm.
(A) ‐ HMEC; (B) ‐ MCF‐7; (C) ‐ Hs578T; (D) ‐ MDA‐MB‐231. Note in (II) the completely disorganized
actin cytoskeleton in the case of the MCF‐7 cell line and the increased amount of actin filaments at
the cell membrane of the MDA‐MB‐231 cell line affecting cytoskeletal organization. Red arrows
point to irregular or fragmented nuclei and magenta arrows indicate cytoskeleton damage. Altera‐
tions are more prominent in all cancer cell lines compared to the HMEC cell line where the actin
filaments are not affected and nuclear damage is insignificant.
Int. J. Mol. Sci. 2022, 23, 4784 7 of 24
2.4. Mode‐of‐Action Analysis of Arsenate Treatment Based on Gene Expression Data
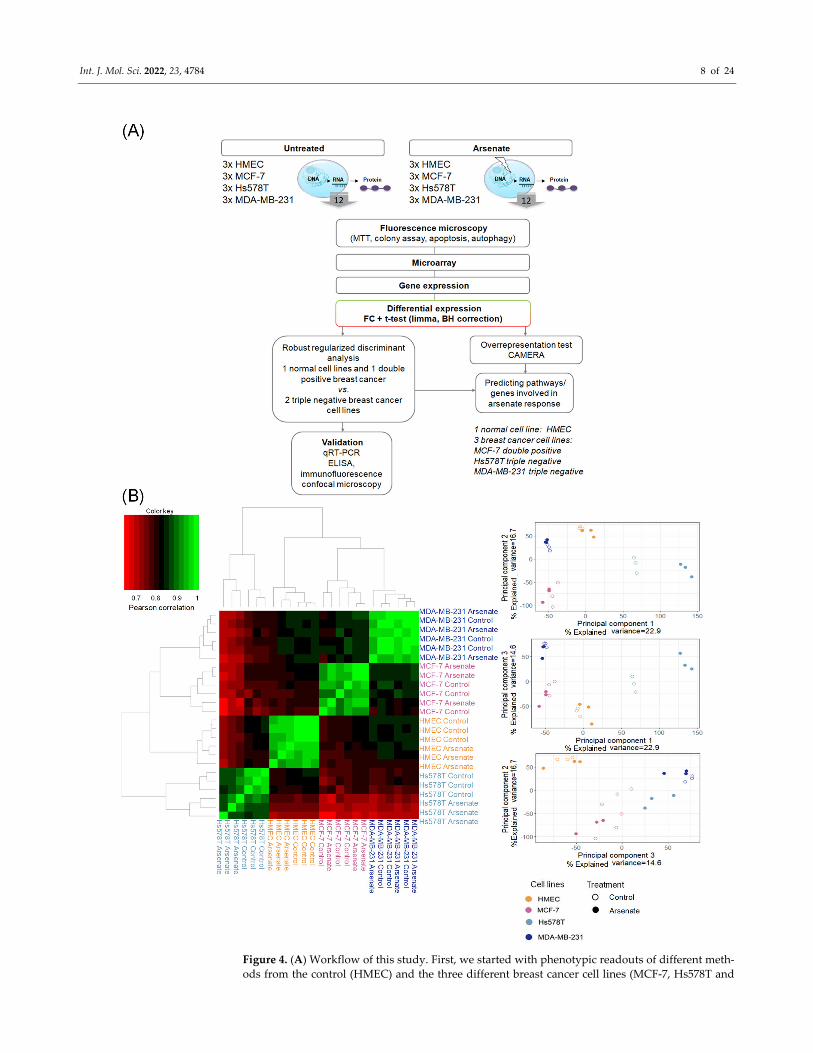
We next investigated the mode‐of‐action of arsenate treatment in the four different
cell lines based on gene expression data (see Figure 4A for the experimental workflow and
methods section for experimental details). A Pearson correlation matrix analysis visual‐
ized as a heatmap (shown in Figure 4B) showed that the first differentiating factor be‐
tween samples is the cell line, and only the second one is the arsenate treatment. This is in
agreement with previous experiments in breast cancer cell lines and their response to
chemotherapeutics [37]. We next used principal component analysis (PCA) to visualize
differences between the different cell lines and treatment conditions further, the results of
which are shown in Figure 4B. It can be seen, in agreement with the correlation analysis,
that the four cell lines are located in rather distinct locations of PCA space. Arsenate
treated cells, as a whole, are not distinct from untreated cells in a specific direction in the
first three principal components; however, they generally differ from the non‐treated cell
lines (Figure 4B).
Int. J. Mol. Sci. 2022, 23, 4784 8 of 24
Figure 4. (A) Workflow of this study. First, we started with phenotypic readouts of different meth‐
ods from the control (HMEC) and the three different breast cancer cell lines (MCF‐7, Hs578T and
Int. J. Mol. Sci. 2022, 23, 4784 9 of 24
MDA‐MB‐231) with and without arsenate treatment. Next, microarray data were collected from
three replicates each of the four cell lines in each condition. Subsequently, we determined differen‐
tially expressed genes using fold change (FC) and the False Discovery Rate (FDR)‐corrected t‐test,
CAMERA. The response to arsenate between the two TNBC and the DPBC and normal cell lines
was compared by using Robust Regularized Discriminant Analysis. From the resulting centroid of
data, GSEA (gene set enrichment analysis) was performed in order to identify the involved Gene
Ontology Biological Processes (GO‐BP) and pathways. Representative genes were selected to vali‐
date the differentially expressed genes by qRT‐PCR, ELISA, and fluorescence microscopy. (B) Sim‐
ilarity of cell lines and treatment conditions based on Pearson correlation and principal component
analysis (PCA). It can be seen that the cell type causes bigger differences in gene expression space
than treatment conditions (panel A). In panel B the arsenateʹs response has no specific direction
compared to untreated samples; however, treated and untreated samples are generally distinguish‐
able.
We next evaluated gene expression on an individual gene and pathway level. First,
we found the number of differentially expressed genes in the four arsenate‐treated cell
lines, which were 81 for HMEC, zero for MCF‐7, 1231 for Hs578T and 275 for the MDA‐
MB‐231 cell line (with a q‐value < 0.1 in a Benjamini‐Hochberg False Discovery Rate‐cor‐
rected t‐test and |log2 FC| > 1; see Table S3 for details in the Supplementary Materials).
This seems to an extent surprising given the toxicity of arsenic [38], and one reason might
be that the concentration of arsenate (50 nM) is relatively low. Furthermore, the two TNBC
cell lines had a stronger response than the two other cell lines investigated here. However,
these differentially expressed genes were not enriched in any gene ontology biological
process, (FDR > 0.1) nor were they enriched by using the CAMERA method for gene‐set
enrichment analysis (FDR > 0.1). To distinguish the weak transcriptomics signal, we com‐
pared the response of the TNBC and DPBC and normal cell lines.
2.5. Arsenate Response in Triple Negative Cell Lines vs. Double Positive and Normal Cell Line
We used regularized discriminant analysis (RDA) to differentiate the response to ar‐
senate between the cell lines as follows. For this kind of comparison, we used the fold
change values as input. We treated the two TNBC cell lines as one and the normal and
DPBC cell line together as a second set of cell lines. This way we intended to investigate
whether the RDA analysis will show transcriptomic changes according to the morpholog‐
ical results obtained. Indeed, we found enrichment in the apoptosis, the mTORC and the
cell cycle hallmarks using the RDA value as input data (Figure 5). This suggests that even
though the hallmarks are not changed at the individual cell line level after arsenate treat‐
ment, their response on the transcriptomic level is different when we compare the DPBC
and TNBC cells.
The mTORC signalling was differentiated between the TNBC and the DPBC/normal
cell lines. The mTORC signalling was generally downregulated in the TNBC cell lines.
This downregulation included various metabolic enzymes such as glucose‐6‐phosphate
dehydrogenase (G6PD) or sorbitol dehydrogenase (SORD), amino acid transporters such
as cystine/glutamate transporter (SLC7A11) and large neutral amino acid transporter
small subunit 1 (SLC7A5). The mTORC is the master regulator of autophagy, inhibiting it
in the case of adequate metabolic flux [39]. These results show the downregulation of the
metabolic input after arsenate treatment, which can trigger autophagy through the
mTORC complex in TNBC cell lines.
However, all these responses on the transcriptome are weak, possibly due to the low
concentration of the arsenate treatment used. Next we selected the key regulators of the
various processes (autophagy, apoptosis, cell cycle) for further validation experiments to
validate our results. The activation of apoptosis, autophagy and cell cycle arrest are the
key outcomes of arsenate treatment as observable from the genes shown in Figure 5 in
combination with autophagy and apoptosis assays (Figure 1) and microscopic images
(Figures 2 and 3).
Int. J. Mol. Sci. 2022, 23, 4784 10 of 24
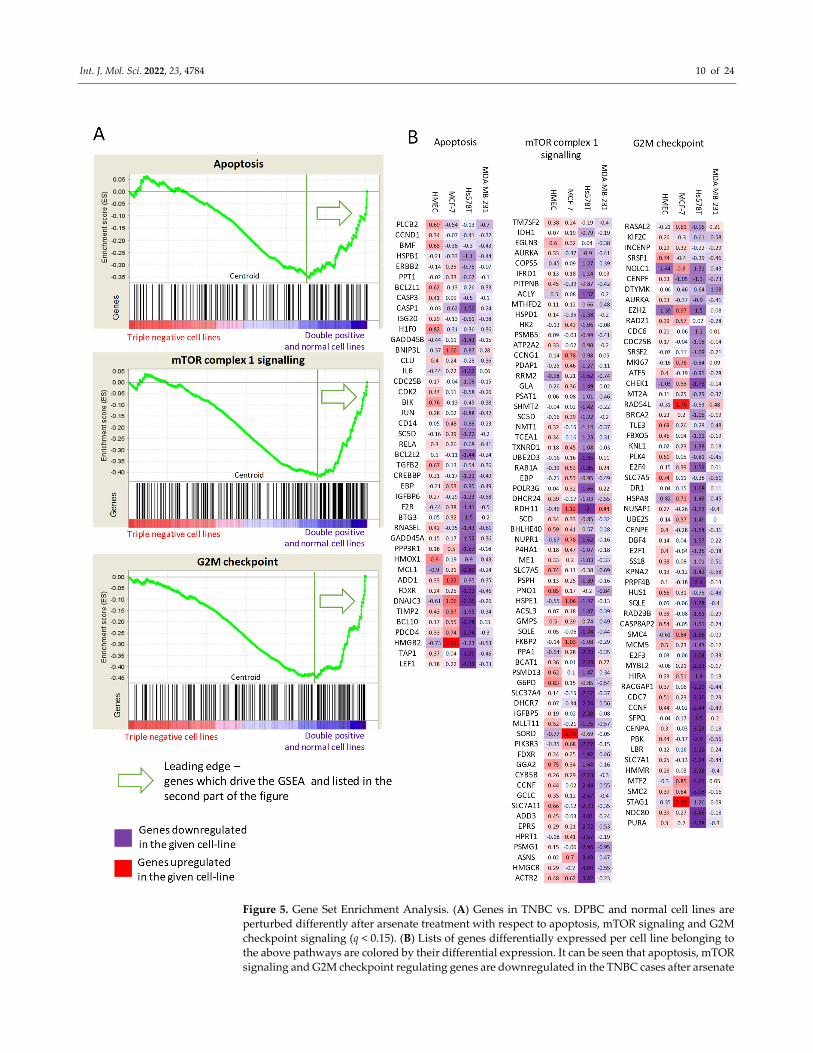
Figure 5. Gene Set Enrichment Analysis. (A) Genes in TNBC vs. DPBC and normal cell lines are
perturbed differently after arsenate treatment with respect to apoptosis, mTOR signaling and G2M
checkpoint signaling (q < 0.15). (B) Lists of genes differentially expressed per cell line belonging to
the above pathways are colored by their differential expression. It can be seen that apoptosis, mTOR
signaling and G2M checkpoint regulating genes are downregulated in the TNBC cases after arsenate
Int. J. Mol. Sci. 2022, 23, 4784 11 of 24
treatment, while they are upregulated or not changed in the DPBC and in HMEC cell lines. The full
results can be seen in Table S4.
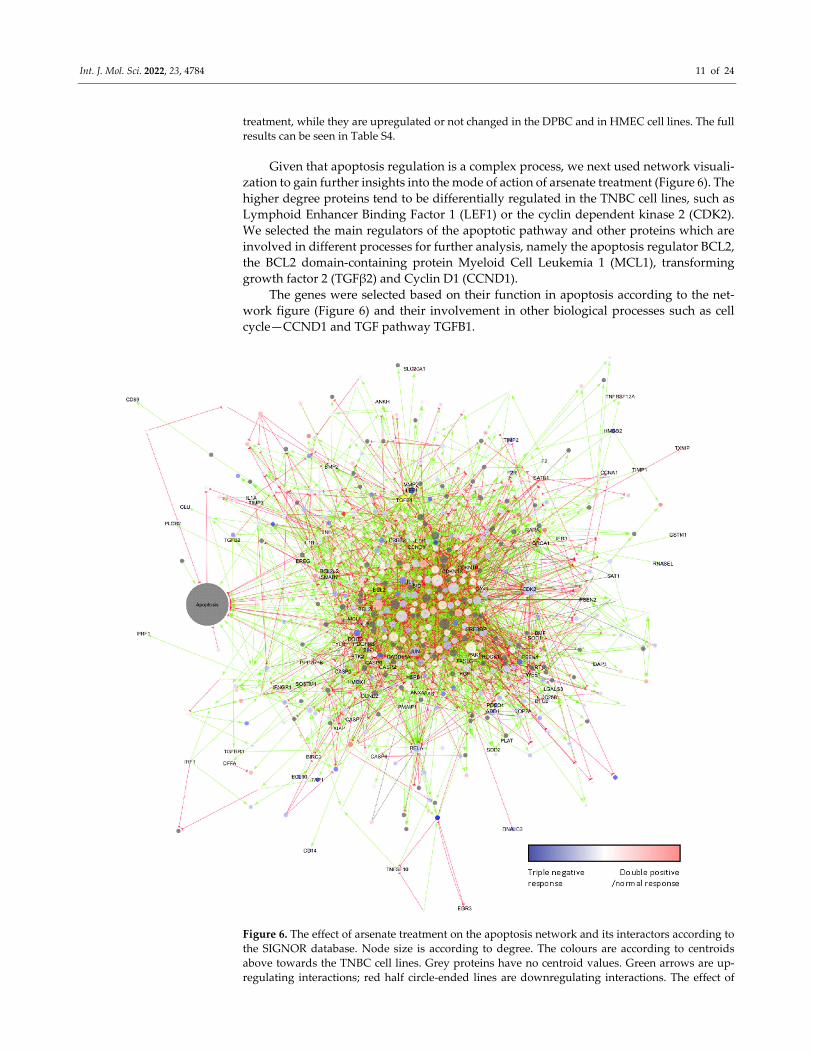
Given that apoptosis regulation is a complex process, we next used network visuali‐
zation to gain further insights into the mode of action of arsenate treatment (Figure 6). The
higher degree proteins tend to be differentially regulated in the TNBC cell lines, such as
Lymphoid Enhancer Binding Factor 1 (LEF1) or the cyclin dependent kinase 2 (CDK2).
We selected the main regulators of the apoptotic pathway and other proteins which are
involved in different processes for further analysis, namely the apoptosis regulator BCL2,
the BCL2 domain‐containing protein Myeloid Cell Leukemia 1 (MCL1), transforming
growth factor 2 (TGFβ2) and Cyclin D1 (CCND1).
The genes were selected based on their function in apoptosis according to the net‐
work figure (Figure 6) and their involvement in other biological processes such as cell
cycle—CCND1 and TGF pathway TGFB1.
Figure 6. The effect of arsenate treatment on the apoptosis network and its interactors according to
the SIGNOR database. Node size is according to degree. The colours are according to centroids
above towards the TNBC cell lines. Grey proteins have no centroid values. Green arrows are up‐
regulating interactions; red half circle‐ended lines are downregulating interactions. The effect of
Int. J. Mol. Sci. 2022, 23, 4784 12 of 24
grey lines is unknown. High degree yellow bordered proteins are chosen to validate. They are cen‐
tral members of the network in apoptosis. Many high degree proteins such as LEF1 and CDK2 also
respond to treatment in TNBC cell lines.
2.6. qRT‐PCR Validation of Transcriptomic Profiles
Following microarray‐based gene expression analysis, we selected four genes for
qRT‐PCR in order to validate our results, which have a central role in apoptosis (Figure 7)
and which were negatively regulated from the microarray data as an effect of arsenate
treatment.
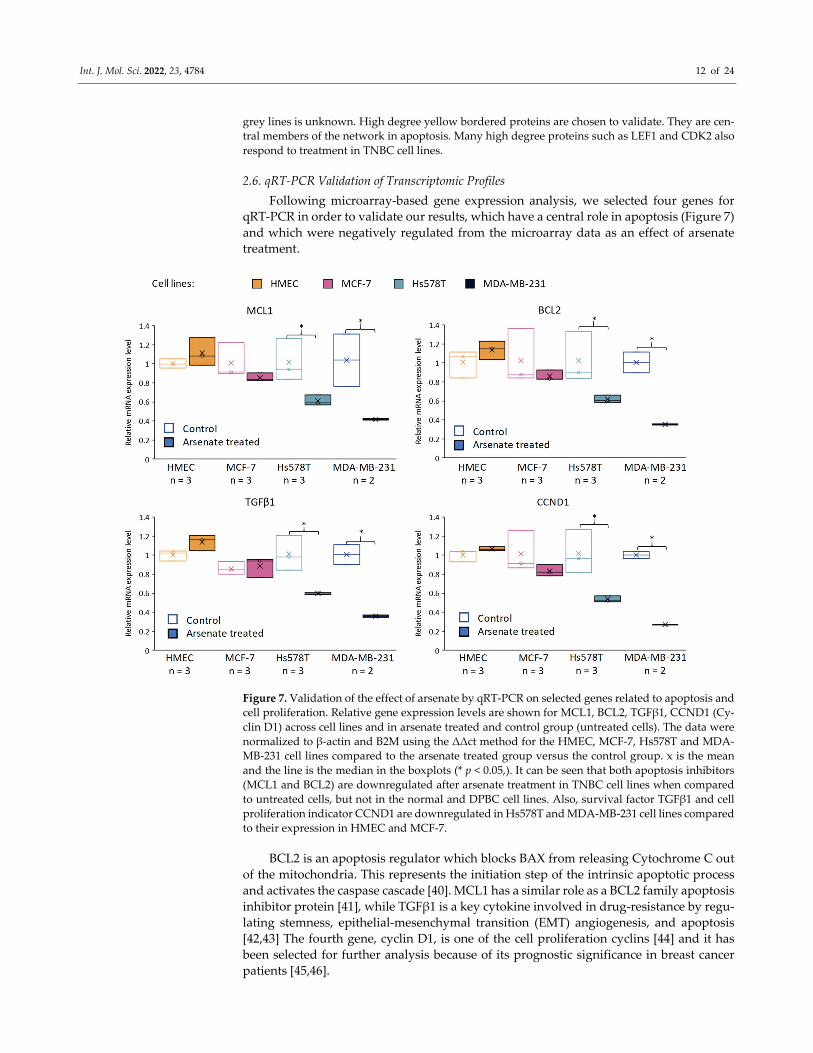
Figure 7. Validation of the effect of arsenate by qRT‐PCR on selected genes related to apoptosis and
cell proliferation. Relative gene expression levels are shown for MCL1, BCL2, TGFβ1, CCND1 (Cy‐
clin D1) across cell lines and in arsenate treated and control group (untreated cells). The data were
normalized to β‐actin and B2M using the ΔΔct method for the HMEC, MCF‐7, Hs578T and MDA‐
MB‐231 cell lines compared to the arsenate treated group versus the control group. x is the mean
and the line is the median in the boxplots (* p < 0.05,). It can be seen that both apoptosis inhibitors
(MCL1 and BCL2) are downregulated after arsenate treatment in TNBC cell lines when compared
to untreated cells, but not in the normal and DPBC cell lines. Also, survival factor TGFβ1 and cell
proliferation indicator CCND1 are downregulated in Hs578T and MDA‐MB‐231 cell lines compared
to their expression in HMEC and MCF‐7.
BCL2 is an apoptosis regulator which blocks BAX from releasing Cytochrome C out
of the mitochondria. This represents the initiation step of the intrinsic apoptotic process
and activates the caspase cascade [40]. MCL1 has a similar role as a BCL2 family apoptosis
inhibitor protein [41], while TGFβ1 is a key cytokine involved in drug‐resistance by regu‐
lating stemness, epithelial‐mesenchymal transition (EMT) angiogenesis, and apoptosis
[42,43] The fourth gene, cyclin D1, is one of the cell proliferation cyclins [44] and it has
been selected for further analysis because of its prognostic significance in breast cancer
patients [45,46].
Int. J. Mol. Sci. 2022, 23, 4784 13 of 24
It can be seen (Figure 7) that in the case of the Hs578T and MDA‐MB‐231 cell lines,
we observed a downregulation of BCL2, MCL‐1, TGFβ1 and CCND1 at 24 h post‐treat‐
ment with arsenate when compared to the control group. No alteration of relative gene
expression can be seen in the case of normal cell line HMEC and MCF‐7 (Figure 7).
The expression of antiapoptotic regulators (BCL2 and MCL‐1) hence significantly de‐
creased after arsenate exposure, which provides a mechanistic rationale for in apoptosis
facilitation via the intrinsic apoptosis pathway [47]. CCND1 is an influential cell‐cycle reg‐
ulatory protein, and its overexpression is connected with cell proliferation, poor prognosis
and recurrence in breast cancer, which has here shown to be downregulated as an effect
of the arsenate exposure. Hence, decreased CCND1 expression can be related to decreased
cell proliferation [48]. CCND1 provided to be a link between degradative autophagy and
cell cycle regulation in hepatocarcinoma tumorigenesis [49]. Overall, we can see that ar‐
senate regulates key genes involved in cell cycle regulation, signal transduction, autoph‐
agy [50] and apoptosis [8,51]. The alteration produced might in involve epigenetic com‐
ponents in addition to the transcriptomic level, [8] which, however, was outside the scope
of the current study.
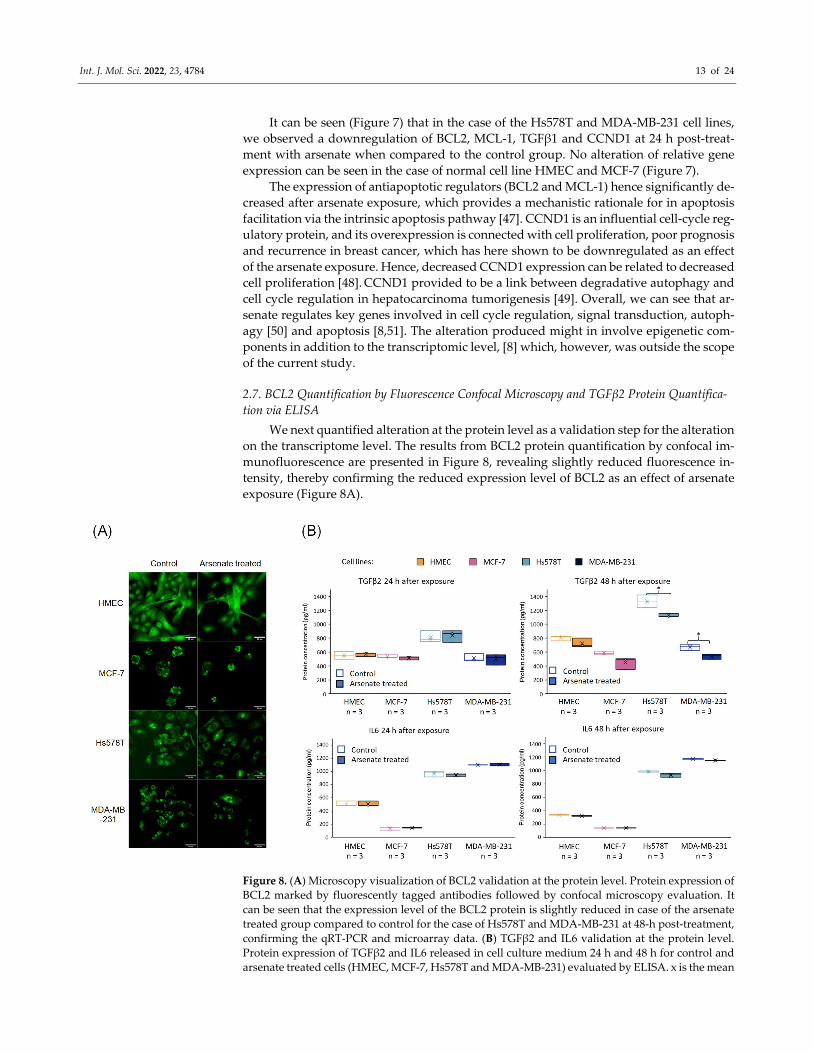
2.7. BCL2 Quantification by Fluorescence Confocal Microscopy and TGFβ2 Protein Quantifica‐
tion via ELISA
We next quantified alteration at the protein level as a validation step for the alteration
on the transcriptome level. The results from BCL2 protein quantification by confocal im‐
munofluorescence are presented in Figure 8, revealing slightly reduced fluorescence in‐
tensity, thereby confirming the reduced expression level of BCL2 as an effect of arsenate
exposure (Figure 8A).
Figure 8. (A) Microscopy visualization of BCL2 validation at the protein level. Protein expression of
BCL2 marked by fluorescently tagged antibodies followed by confocal microscopy evaluation. It
can be seen that the expression level of the BCL2 protein is slightly reduced in case of the arsenate
treated group compared to control for the case of Hs578T and MDA‐MB‐231 at 48‐h post‐treatment,
confirming the qRT‐PCR and microarray data. (B) TGFβ2 and IL6 validation at the protein level.
Protein expression of TGFβ2 and IL6 released in cell culture medium 24 h and 48 h for control and
arsenate treated cells (HMEC, MCF‐7, Hs578T and MDA‐MB‐231) evaluated by ELISA. x is the mean
Int. J. Mol. Sci. 2022, 23, 4784 14 of 24
and median is the middle line in the boxplots. * p < 0.05two‐sided t‐test. TGFβ2 is downregulated in
protein level after 48 h of arsenate treated cells, but there is no change in the IL6 levels.
Finally, we quantified TGFβ2 and IL6 by an ELISA assay (at the protein level) after
24 h and 48 h from cultures of HMEC, MCF‐7, Hs578T and MDA‐MB‐231 cells for treat‐
ment vs. control, the results of which are shown in Figure 8B. We observe a slightly de‐
creased level of TGFβ2 after 48 h in TNBC cell lines. TGFβ2 is involved in the EMT in‐
volved in cell migration and angiogenesis, [42] and overexpression of TGFβ2 promotes
tumor growth and invasion, therefore its inhibition by arsenate exposure might contribute
favorably to treatment efficacy [52]. TGFβ also influences TNBC cancer stem cells through
regulating stemness EMT and apoptosis [43]. Downregulating TGFβ2 with arsenate could
in turn help to reduce such effects and make the TNBC cells more susceptible to conven‐
tional chemotherapy. In contrast to TGFβ2, IL6 had a very little downregulation after 48
h of arsenate treatment in the TNBC cell lines (p < 0.05 t‐test, Figure 8B). IL6 is an activator
of mTOR signalling, which is involved in metastasis formation of TNBC [53,54] as well as
in drug resistance which is counteracted by the administration of arsenate [33].
3. Discussion
Arsenic derivatives showed antitumoral activity in the case of many types of cancer
such as arsenic trioxide on head and neck tumors [55] or on epithelial ovarian cancer, [56]
human neuroblastoma, [57] human liver cancer cells, [58] leukaemia, [59] renal cancer [60]
and prostate cancer [61]. Arsenate and arsenite showed inhibition of proliferation of mel‐
anoma cells [62] and of human promyelocytic leukemia cells [63]; arsenite and arsenic acid
induced apoptosis in the leukemia cells [64]; tetraarsenic hexoxide induced G2/M arrest,
apoptosis, and autophagy in SW620 human colon cancer cells [65]. In the context of TNBC,
arsenic derivatives have shown activity in in vitro experiments against several breast can‐
cer cell lines like arsenate on MCF‐7 cells [66]; arsenite on DPBC cells (MCF‐7) and TNBC
cells (MDA‐MB‐231, T‐47D, BT‐20 [7–11], and arsenic disulfide on MCF‐7 and MDA‐MB‐
231 breast cancer cells [26,67].
Arsenate derivatives have been researched extensively regarding their medical ap‐
plicability as well as biological effects. Arsenate affects cancer progression through coding
and non‐coding genes related to a wide range of biological processes [68]. A particular
application of arsenate derivatives is focused on miRNAs as promoters of apoptosis in‐
duced by arsenic trioxide, which is commonly used in the treatment of acute promyelo‐
cytic leukemia [68–70] The cross‐talk among all of the literature and the current applica‐
bility of arsenate gives a niche for further investigations to fit the puzzle pieces together.
Most of the studies that presented the biological effect of arsenic are related to the
oxidation state +3 (arsenite); meanwhile for the oxidation state +5 (arsenate) there is much
less information about its known mode of action. Despite the fact that arsenate efficacy in
the treatment of breast cancer was demonstrated, [66] its antitumor mechanism has not
been fully elucidated yet.
In a wide range of cellular models [27,71–73], it has been shown before that arsenic
treatment has the capacity to significantly reduce cell proliferation, invasion, and metas‐
tasis and to induce apoptosis. Our analysis now showed that arsenateʹs effect is largely
cell line specific to TNBC cell lines, absent in HMEC normal control cells, and present only
to a much lesser effect in MCF‐7 cells. Arsenic treatment has been demonstrated to specif‐
ically activate apoptosis in MCF‐7 2D‐ and 3D‐culture models [67]; however, arsenate has
only a moderate effect on the MCF‐7 cell line in the current study. The cause could be that
cells were grown in clusters in our study, and darkfield microscopy showed apoptosis
only at the edge of the clusters. The effect of arsenate treatment was more pronounced in
the case of TNBC cells, as this could be observed by microscopy data and confirmed on
the gene expression level.
Arsenite showed the ability to induce S‐phase arrest, autophagy and apoptosis on
various tumors by modulating genes such as Forkhead box O3 (FOXO3a) and Cyclin D1
Int. J. Mol. Sci. 2022, 23, 4784 15 of 24
(CCND1) [74], or sustaining inhibition of mTORC1 [7], the latter of which was shown to
be related to autophagy regulation. The mTOR pathway is activated through IL6 signal‐
ing, which is closely related to cell growth and metastasis in TNBC [53,54]. Other studies
have shown that the blockade of IL6‐associated inflammation positively correlates with
the inhibition of tumor growth and EMT process, [53] which should be further explored
in TNBC. The mTOR pathway is a frequently activated pathway in human cancers, rep‐
resenting an attractive target for anti‐cancer drug development [75]. Furthermore, mTOR
also negatively regulates autophagy [76]. The inhibition of mTOR signaling can decrease
cellular proliferation and promotion of cell death including apoptosis and autophagy [76].
The current study proposes autophagy and apoptosis as a final cellular response of arse‐
nate‐inducing oxidative stress, where mTOR signaling has an essential role, as we ob‐
served in our study.
It was demonstrated previously that the apoptotic and autophagic responses have
very specific cross‐talk [77]. Evidence in the literature suggests that in the case of the
TNBC cells, arsenate could induce apoptosis through autophagy. In our experiments, we
have seen both elevated autophagy and apoptosis in TNBC cell lines, but not in HMEC
cells. MCL1 and BCL2 are the main effector proteins in regulating the antiapoptotic and
anti‐autophagy response, which were downregulated in TNBC cells validated by qRT‐
PCR. The apoptosis mechanism was activated in the case of breast cancer cells in this
study as well. Similarly, in HT‐29 colorectal cancer cells, activation of the intrinsic apop‐
tosis pathway was demonstrated via upregulation of BAX and downregulation of BCL2
[78]. Although this effect was also observed in the present study, it was considerably
smaller. Additionally, we have seen the capacities of BCL2 family proteins to regulate
autophagy via the interaction with Beclin‐1; caspases have been indicated to suppress au‐
tophagy via a mechanism mediated by the cleavage of autophagy‐related proteins [79].
The analysis described in our paper shows that arsenate reduced cell proliferation as
well as activation of autophagy and apoptosis in breast cancer cells. In this study the cy‐
totoxic effect of arsenate was found to be largely cell type specific, as observed previously
also in hepatocellular carcinoma cells [80]. Our study next investigated the cellular effects
of arsenate further, based on functional tests in combination with transcriptomics experi‐
ments to elucidate its mode of action.
Each cell line in this study responded to arsenate treatment differently (possibly de‐
pending on the mutations present, TNBC cell lines being known to be TP53 mutant [81]).
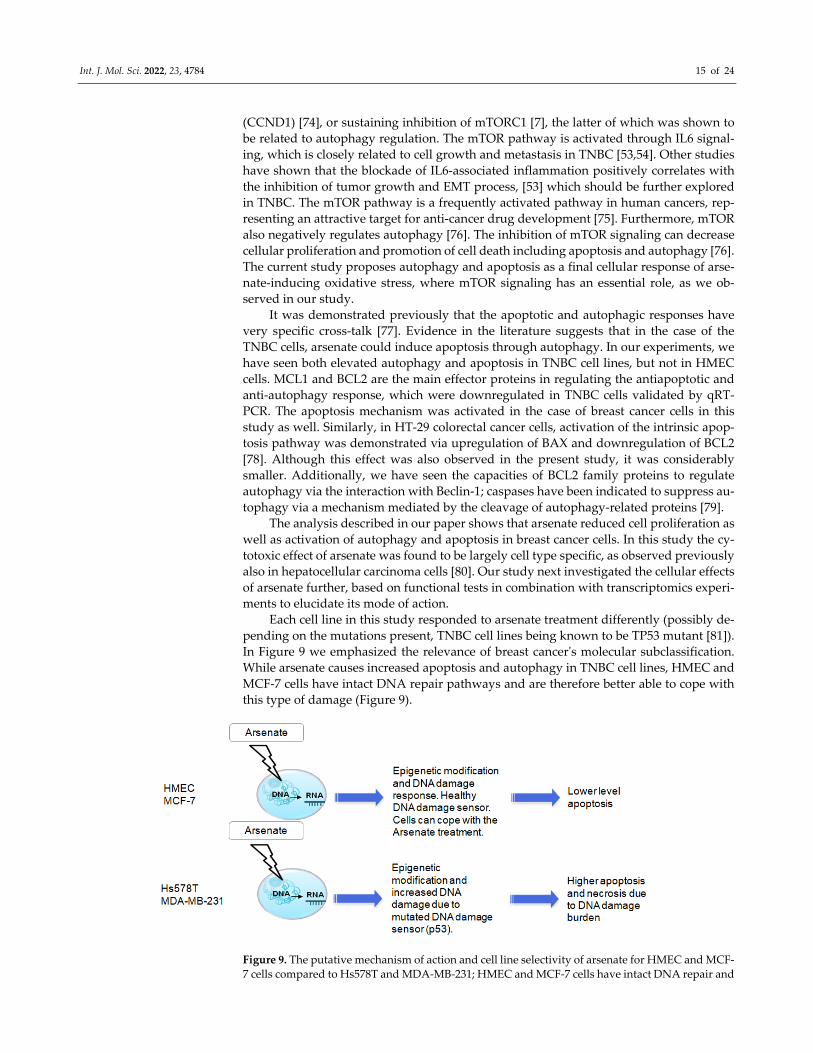
In Figure 9 we emphasized the relevance of breast cancerʹs molecular subclassification.
While arsenate causes increased apoptosis and autophagy in TNBC cell lines, HMEC and
MCF‐7 cells have intact DNA repair pathways and are therefore better able to cope with
this type of damage (Figure 9).
Figure 9. The putative mechanism of action and cell line selectivity of arsenate for HMEC and MCF‐
7 cells compared to Hs578T and MDA‐MB‐231; HMEC and MCF‐7 cells have intact DNA repair and
Int. J. Mol. Sci. 2022, 23, 4784 16 of 24
are hence better able to cope with this type of damage, while TNBC cell lines are known to be TP53
mutant and therefore arsenate causes increased apoptosis and autophagy.
In the case of Hs578T cells, we observed an alteration of chromatin pathways, DNA
replication and telomere signaling pathways, and chromatin modification (a form of late
apoptosis signals) correlating with microscopy data from previous studies [82,83]. Chro‐
matin modifications are a frequent event observed during the repair of environmental
exposure‐induced DNA damage, including for arsenic exposure [84]. It has previously
been demonstrated that arsenic affects chromatin silencing pathways in HeLa cells [85].
These alterations might be transient or can be accompanied by heritable epigenetic alter‐
ations at some specific sites of chronic arsenic exposure. These epigenetic changes and
DNA damage might, in turn, be exploited as a therapeutic strategy for breast cancer by
inducing apoptosis in TNBC cells. In the case of MDA‐MB‐231 cells the reduction of cell
proliferation was related to the activation of cell death via the endoplasmic reticulum and
mitochondrial axis, as confirmed by fluorescence microscopy and gene expression data,
whereas in the case of microarray data we identified genes that regulate these processes,
which is shown in Figure 6 (network showing the specific genes related to the intrinsic,
mitochondrial axis of apoptosis via MCL1 and BCL2) [86]. Arsenic compounds activate an
apoptosis‐related mechanism via intrinsic and extrinsic caspase pathway activation [87].
Arsenate target genes involved epigenetic reprogramming [88], which lately affect
cell fate through a direct or indirect way [8]. DNA damage caused by arsenic derivatives
exposure was identified in multiple cancer models and was demonstrated to affect the
response to chemotherapy [89]. In the current study, arsenate has shown a chromatin‐
modifying effect in all cell lines, which can be the marker of DNA damage, but the normal
and DPBC cell lines can more readily cope with this effect, which resulted in a relatively
decreased apoptotic rate compared to the TNBC cell lines with relatively higher apoptotic
levels, leading to a degree of selective toxicity [82,83]. The mutated status of p53 in the
two TNBC cell lines is possibly causally related behind the decreased DNA damage re‐
sponse [22]. In spite of the fact that we treated the cells with a very low concentration of
arsenate at 50 nM, it had the capacity to interfere with cell proliferation checkpoints and
apoptosis and thus suppress tumorigenesis. This has important relevance because DNA
repair systems interact with other cellular components responsible for homeostasis and
DNA metabolism [90]. Arsenic is presented in the literature not only as an apoptosis reg‐
ulator but also as an autophagy regulator, which in agreement with our data, and also for
the +5 oxidation state.
Our data suggest the involvement of apoptosis and autophagy in the effects of arse‐
nate exposure, which furthermore appears to be specific to cancer cell lines, based on the
data generated here. In our in vitro experiments we have not distinguished whether arse‐
nate or arsenite had the biological effect in the intracellular milieu. Nevertheless, the out‐
come of the apoptosis and autophagy assay suggest a cell line specific cytotoxic effect.
Arsenic in oxidation state +3 has previously been found to interfere with intrinsic and
extrinsic apoptosis and autophagy mechanisms in the breast cancer cell lines MCF‐7 and
MDA‐MB‐231 [26]. Arsenic trioxide was found to suppress cell growth, to stimulate apop‐
tosis, and to be involved in retarded cell invasion by interfering [91] with coding and non‐
coding gene regulation [27–30]. We can conclude that in our case, the arsenate exposure
activates two important mechanisms, autophagy and apoptosis regulating the cell death,
and hence we consider arsenate as a promising candidate in cancer management.
4. Materials and Methods
4.1. Cell Lines and Treatment
HMEC (human mammary epithelial cells, A10565 Life Technology, Carlsbad, CA,
USA) were maintained in HMEC basal serum free medium (Life Technology, cat no.
12753018, Carlsbad, CA, USA) and HMEC supplement kit (Life Technology cat. No.
12755013, Carlsbad, CA, USA). The DPBC cell line MCF‐7 (ATCC collection, USA) was
Int. J. Mol. Sci. 2022, 23, 4784 17 of 24
cultured in MEM medium supplemented with 10% fetal bovine serum, 2 mM L‐glutamine
and 1% nonessential amino acids. The Hs578T cell line (ATCC collection) was maintained
in MEM (Dulbecco’s Modified Eagle Medium, Gibco Life Technologies; USA) high glu‐
cose (4500 mg/mL glucose) supplemented with 10% fetal bovine serum, 2 mM L‐gluta‐
mine, 1% nonessential amino acids (Gibco Life Technologies; USA) and 0.01 mg/mL insu‐
lin. The MDA‐MB‐231 cell line (ATCC collection) was cultured in RPMI‐1640 medium
supplemented with 10% fetal bovine serum and 2 mM L‐glutamine. All cells were main‐
tained in a humidified incubator at 37°C with 5% CO2.
We used the As5+ in solution directly because arsenate is internalized easily by phos‐
phate carriers. [92] Hence, the normal and tumor breast cancer cells were treated with
arsenic in the oxidation state +5 (As5+) presenting less direct cell toxicity than (As3+). [14]
Arsenate was obtained in 1000 mg/l standard solution (As + 5HNO3⟶H3AsO4 + 5NO2 +
H2O) (produced by Merck KGaA, Darmstadt, Germany, Product Number 1197730100, Lot
number HC55536773) and diluted to the required concentration.
4.2. Colony Assay
Treated and untreated cells were seeded in six‐well plates at a density of 250
cells/well/2 mL in triplicate. After 14 days, the cells were washed with PBS 1×, fixed with
1 mL of methanol 80% for 15 min, stained with 300 μL of Trypan Blue 0.2% and then
washed with PBS 1×. The colonies were counted by a visual observer without the use of
visual augmentation devices. Images of the plates have been taken with a c300 machine
(Azure Biosystems, USA) using the white light and then they were counted directly from
the plate (n = 3). A graphical representation and t‐test results were shown.
4.3. Autophagy and Apoptosis Detection
Both autophagy and apoptosis assessments were done using fluorescence micros‐
copy on 10,000 pre‐plated cells for 24 h in 96‐well plates for each triplicate of control and
arsenate treated samples. Fluorescence microscopy was performed on an Olympus I×71
microscope (Olympus, Japan) using a 20× objective for magnification.
For autophagy detection, the cells were treated with an Autophagy/Cytotoxicity
Dual Staining Kit (Abcam cat no. ab133075, Cambridge, MA, USA) that contains mono‐
dansylcadaverine (MDC) for autophagic vacuole detection in cultured cells and propid‐
ium iodide (PI) for necrotic cell detection. Staining was applied after 24 h of arsenate treat‐
ment. Apoptosis was detected by the Annexin V‐FITC/PI Apoptosis Detection Kit (Abcam
cat no. ab14155, Cambridge, MA, USA). The kit contains Annexin V‐FITC that stains in
green the apoptotic cells that translocated membrane phospholipid phosphatidylserine to
the outer leaflet of the cellular membrane, while the PI part of the composition stains the
nuclei. Late apoptotic cells are hence double stained with both PI and Annexin‐V‐FITC.
The staining was performed according to the manufacturer’s protocol followed by fluo‐
rescence microscopy evaluation (20× magnification). On four different images the apop‐
totic and autophagic cells were counted in both, treated and untreated conditions. The
average cell count of the untreated condition was set to 100% and changes in cell number
were reported as multiples of this number.
4.4. Dark‐Field Microscopy
Dark‐field microscopy was performed using an Olympus B × 43 microscope (Olym‐
pus, Tokyo, Japan) equipped with a CytoViva Enhanced Dark‐Field Condenser (Cytoviva,
USA), an UPlanFLN60×, NA = 1.2 oil immersion objective (Olympus, Tokyo, Japan) and a 6.4 μm/pixel CCD camera (QImaging, Canada). Images were calibrated for scale and an‐
notated in ImageJ2.0 [93] and converted to 8‐bit grayscale. Contrast enhancement was
performed in the same software (0.3% saturated pixels; Normalized and Histogram equal‐
ized) followed by the application of an Unsharp Mask (Sigma value = 2–12 pixels; Mask
Weight = 0.6). The magnification used for all images was 60×.
Int. J. Mol. Sci. 2022, 23, 4784 18 of 24
4.5. Cytoskeletal Evaluation
The fluorescent staining protocol used DAPI (Abcam, Cambridge, UK) for the label‐
ling of the nucleus and Phalloidin‐FITC (Cytoskeleton Inc, Denver, CO, USA) for the cy‐
toskeleton. After treatment, the cells were fixed in 4% paraformaldehyde followed by 0.5%
Triton × permeabilization for 1 h. The cells were incubated at 37°C and 5% CO2. Thereafter,
100 μL of 200 nM Phalloidin‐FITC was added and the samples were incubated at room
temperature under no illumination for 30 min. 200 μL of 100 nM DAPI was added over
the coverslip for 30 s and washed with a phosphate saline buffer. The coverslips were
mounted with 90% glycerol. Images were captured using a UPLSAPO40 × 2, NA:0.95 ob‐
jective (Olympus, Tokyo, Japan) and excitation wavelengths/emission windows were au‐
tomatically selected according to the fluorescence dye spectral information database in‐
side the acquisition software (FW10‐ASW, Olympus, Tokyo, Japan)
4.6. Microarrays
For microarray experiments, cells from three serial passages were seeded in a six‐
well plate, using 0.3 million cells/well for each triplicate of control and arsenate treated
cells. RNA extraction was performed using TriReagent, which was then purified using the
RNeasy Mini kit (Qiagen, Hilden, Germany).
The microarray samples were prepared according to the Agilent Low Input Quick
Amp Labeling (5190–2305) protocol to synthesize equal quantities of 100 ng of total RNA,
followed by purification of the hybridization products using the RNeasy Mini kit (Qi‐
agen). A NanoDrop2000 spectrophotometer (Thermo Scientific, Waltham, USA) was used
to perform probe quality control, with results showing that all the probes had a specific
activity higher than 6 pmol/μL Cy3/μg cRNA (specific activity > 8 pmol Cy3/μg cRNA).
Fragmentation and hybridization were performed based on the Agilent One‐Color proto‐
col (Agilent Technologies, Santa Clara, CA, USA). [94,95] The samples were hybridized
for 17 h at 65 °C in a hybridization oven. This was followed by microarray slide scanning
with a SureScan Microarray Scanner (1 × 60 k array slides with 61 × 21 mm size, resolution
3 μM) from Agilent, and image processing was undertaken with the Feature Extraction
11.0.1.1 software (Agilent 2016, Santa Clara, USA).
Gene expression values were determined using the Agilent G4851C microarray slides
for the three arsenate treated samples and three controls across four cell lines (HMEC,
MCF‐7, Hs578T, and MDA‐MB‐231).
Resulting data were analyzed using the limma [96] package in R [97], where the back‐
ground was corrected with the “normexp” method and then quantile normalization [96]
was performed, as we used in our previous work. [98] Probes transcribed and expressed
in at least three samples in any conditions at a level higher than the 95th percentile were
selected. This process resulted in a list of 29,874 probes. Next, probes were mapped to
genes using the mean expression with the “avereps” function in R. The probe sets were
translated using the annotation file of the microarray chip [97]. This resulted in a list of
18,849 genes which were used for subsequent analysis, following the standard procedure
[96]. From the gene expression values, we conducted a Principal Component Analysis
(PCA) using the “prcomp” function in R [97] for visualization purposes.
Based on the experimentally determined gene expression profiles, we calculated the
average log2 fold change value per gene for each cell line responding to arsenate in R,
using the functions lmFit and eBayes [99]. Significantly differentially expressed genes
(with Benjamini‐Hochberg corrected p‐value < 0.1 and |log2 FC| > 1) were tested in the
Gorilla [100] tool for Gene Ontology Biological Process overrepresentation [101,102]. For
gene set enrichment analysis we used the CAMERA method [103].
The calculation of log2 fold changes between each treatment and each non‐treated
sample resulted in nine fold‐change values per cell line (three treated and three untreated
replicates in each distinct cell lines). Next, Robust Regularized Discriminant Analysis
(RDA) was performed on these fold changes using the R package RDA [104]. After a

Int. J. Mol. Sci. 2022, 23, 4784 19 of 24
parameter search we chose to use as parameters α = 0.22 and δ = 0.33, because these values
correctly classified all of our samples (see Table S1 for the confusion matrix).
After optimizing parameters, we calculated a centroid value per gene, which indi‐
cates the extent to which the given gene is able to differentiate the two TNBC cell lines
from the double positive and normal cell line. This centroid was the subject of the subse‐
quent Gene Set Enrichment Analysis (GSEA) [105] using the Cellular Hallmarks from
MolSigDB and the network analysis (see below) [106]. A high centroid‐based differential
expression value represents a larger response of the given gene in the TNBC cell lines. The
cut‐off for significantly differentially regulated hallmarks was set to an FDR of below 0.15.
The GSEA was run using a gene set size cut‐off larger than 10 genes, but smaller than 500.
All other parameters were kept as default.
4.7. Apoptosis Network in Pathological Condition as Effect of Arsenate Treatment
We next generated an apoptosis reference network by using the genes from the
MolSigDB apoptosis pathway [106] and mapped them to UniProt gene identifiers through
the UniProt mapping service [107]. We used the mapped UniProt identifiers as a searching
seed in the SIGNOR database [108]. We kept the seeds and also their direct interaction
partners if they interacted with at least two seed proteins. We then mapped the centroid
values of each gene from the RDA analysis to the network, and we indicated that with a
gradient. We calculated the degree—number of neighbours—of all nodes of the whole
SIGNOR network. Degree was indicated by node size in the visualization. This method
visualizes the most central regulators in the apoptosis specific regulatory network as a key
anticancer mechanism.
4.8. qRT‐PCR Evaluation
Total RNA extraction was performed using TriReagent (Invitrogen, Carlsbad, USA)
according to the manufacturer’s protocol. A NanoDrop‐1100 (Thermo Fisher Scientific,
Carlsbad, USA) was used to evaluate RNA concentration and quality by measuring the
absorbance of UV light. For gene expression evaluation, total RNA (1000 ng) was reversely
transcribed into cDNA using the High Capacity cDNA Reverse Transcription Kit (Ap‐
plied Biosystems, Carlsbad,USA). We used the Assay Design Center from Roche for the
primer design (Roche INC 2018). The primers for each gene are listed in Table S2. SYBR
Select Master Mix (Life Technologies, Carlsbad, USA) was used for gene expression eval‐
uation, and all amplifications and detections were carried out in the Applied Biosystems
ViiA7 System (Thermo Fisher Scientific, Waltham, USA) based on the manufacturers rec‐
ommended protocol.
4.9. TGFβ2 and IL6 Quantification in Cell Culture Medium
The expression level of TGFβ2 released in the cell culture medium was detected by
ELISA using the Human TGF‐beta 2 DuoSet ELISA (R&D System, cat no. DY302, Minne‐
apolis, MN, USA), DuoSet Ancillary Reagent Kit 2 (5 plates, R&D Systems, cat no. DY008,
Minneapolis, MN, USA) and Sample Activation Kit 1 (R&D Systems, cat no. DY010, Min‐
neapolis, MN, USA). For IL6 quantification from cell culture, ELISA was performed using
the IL6 DuoSet ELISA Kit (R&D System, cat no. DY206‐05, Minneapolis, MN, USA) along
with the DuoSet Ancillary Reagent Kit 2 (5 plates, R&D Systems, cat no. DY008, Minne‐
apolis, MN, USA).
4.10. BCL2 Protein Evaluation by Confocal Microscopy
For immunofluorescence staining, a Human/Mouse BCL2 Antibody (R&D Systems,
cat no. AF810‐SP, Minneapolis, MN, USA) was used. Incubation was done with 5 μg/mL
overnight followed by washing steps and incubation for 2 h with secondary antibody Goat
Anti‐Rabbit Alexa Fluor® 488 (ab150077, 1:100 dilution). Laser scanning confocal
Int. J. Mol. Sci. 2022, 23, 4784 20 of 24
microscopy was performed on an Olympus FV1200MPE microscope equipped with UP‐
LSAPO40×2, NA:0.95 objective.
4.11. Statistical Evaluation
For pairwise comparisons we used two‐sided t‐tests, our considered significance
level was p < 0.05, and the statistical analyses were performed using GraphPad Prism soft‐
ware version 6 for Windows (GraphPad Software, San Diego, CA, USA). For microarray
differential gene analysis, we used moderate t‐statistics with a Benjamini‐Hochberg cor‐
rection and p < 0.05. For Gene‐set enrichment analysis we used the Kolmogorov Smirnov
test for p < 0.05 and FDR < 0.1.
5. Conclusions
In this study we were able to demonstrate that arsenate induces a cell line specific
morphological and transcriptomic alteration at low concentration. Arsenate induces the
cytoskeletal alteration and cell death in TNBC cell lines through activating autophagy and
apoptosis and reduces the clonogenic capacity.
The novelty of this study stands in the fact that arsenate therapeutic stress produces
pro‐apoptosis signals largely selectively in TNBC cells (based on dark‐field microscopic
and cytoskeletal evaluation). In addition, arsenate showed no effects in HMEC cells and
only moderate effects in MCF‐7 cells.
Regularized discriminant analysis showed that the low concentration of arsenate af‐
fected the G2M checkpoint, autophagy and apoptosis cell line specifically. The downreg‐
ulation of anti‐apoptotic genes (MCL1, BCL2, TGFβ1 and CCND1) was confirmed by qRT‐
PCR, and on the protein level, for TGFβ2, by ELISA, concluding that TNBC and non‐
TNBC cell lines in this particular experimental setup reacted differently to treatment.
The alteration of gene expression levels demonstrates a crosstalk among autophagy,
cell cycle and apoptosis as a potential mechanism of action of arsenate which must be
investigated in future pharmacological interventions.
This study is a step toward understanding arsenate TNBC‐type specific effects which
potentially correlates with active DNA repair pathways. However, further studies are ne‐
cessitated to demonstrate arsenate metabolism and mechanism of action, considering the
importance of intracellular reduction of the metalloids for biological effects. Nevertheless,
this study makes the use of arsenate to be a potential selective chemotherapeutic drug
treating triple negative breast cancer one step closer to reality.
Supplementary Materials: The following supporting information can be downloaded at:
https://www.mdpi.com/article/10.3390/ijms23094784/s1.
Author Contributions: Conceptualization, L.‐L.P. and C.B.; methodology, L.‐L.P., C.B. and D.M.;
software, A.B. and I.B.‐N.; validation, M.‐A.J. and L.‐Z.R.; formal analysis, R.C.; investigation, C.M.,
A.I.M. and A.B.Ț.; resources, E.G.; data curation, L.M. and S.P.; writing—original draft preparation,
L.‐L.P., C.B. and D.M.; writing—review and editing, L.J. and A.B.; visualization, O.Z.; supervision,
A.B. and I.B.‐N.; project administration, L.‐L.P.; funding acquisition, C.B. All authors have read and
agreed to the published version of the manuscript.
Funding: This work was partially funded by UEFISCDI, projects entitled “Genomic mapping of the
population from polluted area with radioactivity and heavy metals to increase national security and
Advanced Innovative approaches for predictable regenerative medicine“, PNII project entitled
“Modulation of pro/anticarcinogenic effect of toxic chemical agents in breast cancer multitargeted
therapy“ (CANCERTER‐p53).
Institutional Review Board Statement: Not applicable.
Informed Consent Statement: Not applicable.
Data Availability Statement: The data generated or analyzed during this study are included in this
published article (and its Supplementary Materials files).
Conflicts of Interest: The authors declare that they have no conflicts of interest.
Int. J. Mol. Sci. 2022, 23, 4784 21 of 24
References
1. Bray, F.; Ferlay, J.; Soerjomataram, I.; Siegel, R.L.; Torre, L.A.; Jemal, A. Global cancer statistics 2018: GLOBOCAN estimates of
incidence and mortality worldwide for 36 cancers in 185 countries. CA Cancer J. Clin. 2018, 68, 394–424.
2. Schmid, P.; Adams, S.; Rugo, H.S.; Schneeweiss, A.; Barrios, C.H.; Iwata, H.; Diéras, V.; Hegg, R.; Im, S.‐A.; Shaw Wright, G.; et
al. IMpassion130 Trial Investigators Atezolizumab and Nab‐Paclitaxel in Advanced Triple‐Negative Breast Cancer. N. Engl. J.
Med. 2018, 379, 2108–2121.
3. Chiorean, R.; Braicu, C.; Berindan‐Neagoe, I. Another review on triple negative breast cancer. Are we on the right way towards
the exit from the labyrinth? Breast 2013, 22, 1026–1033.
4. Braicu, C.; Berindan‐Neagoe, I.; Pileczki, V.; Cojocneanu‐Petric, R.; Pop, L.‐A.; Puscas, E.; Irimie, A.; Buiga, R. Breast tumor
bank: An important resource for developing translational cancer research in Romania. Cancer Biomark. 2014, 14, 119–127.
5. Braicu, C.; Chiorean, R.; Irimie, A.; Chira, S.; Tomuleasa, C.; Neagoe, E.; Paradiso, A.; Achimas‐Cadariu, P.; Lazar, V.; Berindan‐
Neagoe, I. Novel insight into triple‐negative breast cancers, the emerging role of angiogenesis, and antiangiogenic therapy.
Expert Rev. Mol. Med. 2016, 18, e18.
6. Foulkes, W.D.; Smith, I.E.; Reis‐Filho, J.S. Triple‐negative breast cancer. N. Engl. J. Med. 2010, 363, 1938–1948.
7. Yun, S.‐M.; Woo, S.H.; Oh, S.T.; Hong, S.‐E.; Choe, T.‐B.; Ye, S.‐K.; Kim, E.‐K.; Seong, M.K.; Kim, H.‐A.; Noh, W.C.; et al. Mela‐
tonin enhances arsenic trioxide‐induced cell death via sustained upregulation of Redd1 expression in breast cancer cells. Mol.
Cell. Endocrinol. 2016, 422, 64–73.
8. Moghaddaskho, F.; Eyvani, H.; Ghadami, M.; Tavakkoly‐Bazzaz, J.; Alimoghaddam, K.; Ghavamzadeh, A.; Ghaffari, S.H. De‐
methylation and alterations in the expression level of the cell cycle‐related genes as possible mechanisms in arsenic trioxide‐
induced cell cycle arrest in human breast cancer cells. Tumor Biol. 2017, 39, 1010428317692255.
9. Kasukabe, T.; Okabe‐Kado, J.; Kato, N.; Honma, Y.; Kumakura, S. Cotylenin A and arsenic trioxide cooperatively suppress cell
proliferation and cell invasion activity in human breast cancer cells. Int. J. Oncol. 2015, 46, 841–848.
10. Baj, G.; Arnulfo, A.; Deaglio, S.; Mallone, R.; Vigone, A.; De Cesaris, M.G.; Surico, N.; Malavasi, F.; Ferrero, E. Arsenic trioxide
and breast cancer: Analysis of the apoptotic, differentiative and immunomodulatory effects. Breast Cancer Res. Treat. 2002, 73,
61–73.
11. Smith, A.H.; Marshall, G.; Yuan, Y.; Steinmaus, C.; Liaw, J.; Smith, M.T.; Wood, L.; Heirich, M.; Fritzemeier, R.M.; Pegram, M.D.;
et al. Rapid reduction in breast cancer mortality with inorganic arsenic in drinking water. EBioMedicine 2014, 1, 58–63.
12. Lacerda‐Abreu, M.A.; Russo‐Abrahão, T.; Monteiro, R. de Q.; Rumjanek, F.D.; Meyer‐Fernandes, J.R. Inorganic phosphate trans‐
porters in cancer: Functions, molecular mechanisms and possible clinical applications. Biochim. Biophys. Acta Rev. Cancer 2018,
1870, 291–298.
13. Bolan, N.; Mahimairaja, S.; Kunhikrishnan, A.; Seshadri, B.; Thangarajan, R. Bioavailability and ecotoxicity of arsenic species in
solution culture and soil system: Implications to remediation. Environ. Sci. Pollut. Res. Int. 2015, 22, 8866–8875.
14. Ratnaike, R.N. Acute and chronic arsenic toxicity. Postgrad. Med. J. 2003, 79, 391–396.
15. IARC Working Group on the Evaluation of Carcinogenic Risks to Humans Arsenic, metals, fibres, and dusts. IARC Monogr.
Eval. Carcinog. Risks Hum. 2012, 100, 11–465.
16. Patterson, T.J.; Ngo, M.; Aronov, P.A.; Reznikova, T.V.; Green, P.G.; Rice, R.H. Biological activity of inorganic arsenic and anti‐
mony reflects oxidation state in cultured human keratinocytes. Chem. Res. Toxicol. 2003, 16, 1624–1631.
17. Carter, D.E.; Aposhian, H.V.; Gandolfi, A.J. The metabolism of inorganic arsenic oxides, gallium arsenide, and arsine: A toxico‐
chemical review. Toxicol. Appl. Pharmacol. 2003, 193, 309–334.
18. Jomova, K.; Jenisova, Z.; Feszterova, M.; Baros, S.; Liska, J.; Hudecova, D.; Rhodes, C.J.; Valko, M. Arsenic: Toxicity, oxidative
stress and human disease. J. Appl. Toxicol. 2011, 31, 95–107.
19. Hartwig, A.; Blessing, H.; Schwerdtle, T.; Walter, I. Modulation of DNA repair processes by arsenic and selenium compounds.
Toxicology 2003, 193, 161–169.
20. Russo‐Abrahão, T.; Lacerda‐Abreu, M.A.; Gomes, T.; Cosentino‐Gomes, D.; Carvalho‐de‐Araújo, A.D.; Rodrigues, M.F.;
Oliveira, A.C.L. de; Rumjanek, F.D.; Monteiro, R. de Q.; Meyer‐Fernandes, J.R. Characterization of inorganic phosphate
transport in the triple‐negative breast cancer cell line, MDA‐MB‐PLoS ONE 2018, 13, e0191270.
21. Li, Y.; Liu, K.‐Q.; Gong, B.‐F.; Wang, Y.; Wei, H.; Lin, D.; Liu, B.‐C.; Zhou, C.‐L.; Wei, S.‐N.; Zhang, G.‐J.; et al. Efficacy of Arsenic
Trioxide Combined with ATRA and Chemotherapy for Relapsed Acute Promyelocytic Leukemia Patients. Zhongguo Shi Yan
Xue Ye Xue Za Zhi 2020, 28, 1–6.
22. Forbes, S.A.; Beare, D.; Gunasekaran, P.; Leung, K.; Bindal, N.; Boutselakis, H.; Ding, M.; Bamford, S.; Cole, C.; Ward, S.; et al.
COSMIC: Exploring the world’s knowledge of somatic mutations in human cancer. Nucleic Acids Res. 2015, 43, D805–11.
23. Guzmán, C.; Bagga, M.; Kaur, A.; Westermarck, J.; Abankwa, D. ColonyArea: An ImageJ plugin to automatically quantify col‐
ony formation in clonogenic assays. PLoS ONE 2014, 9, e92444.
24. Ulbricht, U.; Sommer, A.; Beckmann, G.; Lutzenberger, M.; Seidel, H.; Kreft, B.; Toschi, L. Isogenic human mammary epithelial
cell lines: Novel tools for target identification and validation. Comprehensive characterization of an isogenic human mammary
epithelial cell model provides evidence for epithelial‐mesenchymal transition. Breast Cancer Res. Treat. 2013, 138, 437–456.
25. Klionsky, D.J.; Abdelmohsen, K.; Abe, A.; Abedin, M.J.; Abeliovich, H.; Acevedo Arozena, A.; Adachi, H.; Adams, C.M.; Adams,
P.D.; Adeli, K.; et al. Guidelines for the use and interpretation of assays for monitoring autophagy (3rd edition). Autophagy 2016,
12, 1–222.
Int. J. Mol. Sci. 2022, 23, 4784 22 of 24
26. Zhao, Y.; Onda, K.; Sugiyama, K.; Yuan, B.; Tanaka, S.; Takagi, N.; Hirano, T. Antitumor effects of arsenic disulfide on the
viability, migratory ability, apoptosis and autophagy of breast cancer cells. Oncol. Rep. 2019, 41, 27–42.
27. Shi, Y.; Cao, T.; Huang, H.; Lian, C.; Yang, Y.; Wang, Z.; Ma, J.; Xia, J. Arsenic trioxide inhibits cell growth and motility via up‐
regulation of let‐7a in breast cancer cells. Cell Cycle 2017, 16, 2396–2403.
28. Zhang, S.; Ma, C.; Pang, H.; Zeng, F.; Cheng, L.; Fang, B.; Ma, J.; Shi, Y.; Hong, H.; Chen, J.; et al. Arsenic trioxide suppresses
cell growth and migration via inhibition of miR‐27a in breast cancer cells. Biochem. Biophys. Res. Commun. 2016, 469, 55–61.
29. Wang, Y.; Wang, L.; Yin, C.; An, B.; Hao, Y.; Wei, T.; Li, L.; Song, G. Arsenic trioxide inhibits breast cancer cell growth via
microRNA‐328/hERG pathway in MCF‐7 cells. Mol. Med. Rep. 2015, 12, 1233–1238.
30. Liu, W.; Gong, Y.; Li, H.; Jiang, G.; Zhan, S.; Liu, H.; Wu, Y. Arsenic trioxide‐induced growth arrest of breast cancer MCF‐7 cells
involving FOXO3a and IκB kinase β expression and localization. Cancer Biother. Radiopharm. 2012, 27, 504–512.
31. Qi, Y.; Li, H.; Zhang, M.; Zhang, T.; Frank, J.; Chen, G. Autophagy in arsenic carcinogenesis. Exp. Toxicol. Pathol. 2014, 66, 163–
168.
32. Ciocan‐Cȃrtiţă, C.A.; Jurj, A.; Raduly, L.; Cojocneanu, R.; Moldovan, A.; Pileczki, V.; Pop, L.‐A.; Budişan, L.; Braicu, C.; Korban,
S.S.; et al.New perspectives in triple‐negative breast cancer therapy based on treatments with TGFβ1 siRNA and doxorubicin.
Mol. Cell. Biochem. 2020, 475, 285–299.
33. Ciocan‐Cartita, C.A.; Jurj, A.; Zanoaga, O.; Cojocneanu, R.; Pop, L.‐A.; Moldovan, A.; Moldovan, C.; Zimta, A.A.; Raduly, L.;
Pop‐Bica, C.; et al. New insights in gene expression alteration as effect of doxorubicin drug resistance in triple negative breast
cancer cells. J. Exp. Clin. Cancer Res. 2020, 39, 241.
34. Delgado, M.E.; Dyck, L.; Laussmann, M.A.; Rehm, M. Modulation of apoptosis sensitivity through the interplay with au‐
tophagic and proteasomal degradation pathways. Cell Death Dis. 2014, 5, e1011.
35. Zhao, Y.; Toselli, P.; Li, W. Microtubules as a critical target for arsenic toxicity in lung cells in vitro and in vivo. Int. J. Environ.
Res. Public Health 2012, 9, 474–495.
36. Lencinas, A.; Broka, D.M.; Konieczka, J.H.; Klewer, S.E.; Antin, P.B.; Camenisch, T.D.; Runyan, R.B. Arsenic exposure perturbs
epithelial‐mesenchymal cell transition and gene expression in a collagen gel assay. Toxicol. Sci. 2010, 116, 273–285.
37. Troester, M.A.; Hoadley, K.A.; Sørlie, T.; Herbert, B.‐S.; Børresen‐Dale, A.‐L.; Lønning, P.E.; Shay, J.W.; Kaufmann, W.K.; Perou,
C.M. Cell‐type‐specific responses to chemotherapeutics in breast cancer. Cancer Res. 2004, 64, 4218–4226.
38. Bustaffa, E.; Stoccoro, A.; Bianchi, F.; Migliore, L. Genotoxic and epigenetic mechanisms in arsenic carcinogenicity. Arch. Toxicol.
2014, 88, 1043–1067.
39. Nazio, F.; Strappazzon, F.; Antonioli, M.; Bielli, P.; Cianfanelli, V.; Bordi, M.; Gretzmeier, C.; Dengjel, J.; Piacentini, M.; Fimia,
G.M.; et al. mTOR inhibits autophagy by controlling ULK1 ubiquitylation, self‐association and function through AMBRA1 and
TRAF. Nat. Cell Biol. 2013, 15, 406–416.
40. Youle, R.J.; Strasser, A. The BCL‐2 protein family: Opposing activities that mediate cell death. Nat. Rev. Mol. Cell Biol. 2008, 9,
47–59.
41. Edlich, F. BCL‐2 proteins and apoptosis: Recent insights and unknowns. Biochem. Biophys. Res. Commun. 2018, 500, 26–34.
42. Drabsch, Y.; ten Dijke, P. TGF‐β signaling in breast cancer cell invasion and bone metastasis. J. Mammary Gland Biol. Neoplasia
2011, 16, 97–108.
43. Xu, X.; Zhang, L.; He, X.; Zhang, P.; Sun, C.; Xu, X.; Lu, Y.; Li, F. TGF‐β plays a vital role in triple‐negative breast cancer (TNBC)
drug‐resistance through regulating stemness, EMT and apoptosis. Biochem. Biophys. Res. Commun. 2018, 502, 160–165.
44. Kozar, K.; Sicinski, P. Cell cycle progression without cyclin D‐CDK4 and cyclin D‐CDK6 complexes. Cell Cycle 2005, 4, 388–391.
45. Zagouri, F.; Kotoula, V.; Kouvatseas, G.; Sotiropoulou, M.; Koletsa, T.; Gavressea, T.; Valavanis, C.; Trihia, H.; Bobos, M.; Laza‐
ridis, G.; et al. Protein expression patterns of cell cycle regulators in operable breast cancer. PLoS ONE 2017, 12, e0180489.
46. Lengare, P.V.; Sinai Khandeparkar, S.G.; Joshi, A.R.; Gogate, B.P.; Solanke, S.G.; Gore, S.H. Immunohistochemical expression
of cyclin D1 in invasive breast carcinoma and its correlation with clinicopathological parameters. Indian J. Pathol Microbiol 2020,
63, 376–381.
47. Tiainen, M.; Tammilehto, L.; Rautonen, J.; Tuomi, T.; Mattson, K.; Knuutila, S. Chromosomal abnormalities and their correla‐
tions with asbestos exposure and survival in patients with mesothelioma. Br. J. Cancer 1989, 60, 618–626.
48. Ahlin, C.; Lundgren, C.; Embretsén‐Varro, E.; Jirström, K.; Blomqvist, C.; Fjällskog, M.L. High expression of cyclin D1 is asso‐
ciated to high proliferation rate and increased risk of mortality in women with ER‐positive but not in ER‐negative breast cancers.
Breast Cancer Res. Treat. 2017, 164, 667–678.
49. Wu, S.‐Y.; Lan, S.‐H.; Liu, H.‐S. Degradative autophagy selectively regulates CCND1 (cyclin D1) and MIR224, two oncogenic
factors involved in hepatocellular carcinoma tumorigenesis. Autophagy 2019, 15, 729–730.
50. Brown, N.E.; Jeselsohn, R.; Bihani, T.; Hu, M.G.; Foltopoulou, P.; Kuperwasser, C.; Hinds, P.W. Cyclin D1 activity regulates
autophagy and senescence in the mammary epithelium. Cancer Res. 2012, 72, 6477–6489.
51. Wang, X.; Gao, P.; Long, M.; Lin, F.; Wei, J.‐X.; Ren, J.‐H.; Yan, L.; He, T.; Han, Y.; Zhang, H.‐Z. Essential role of cell cycle
regulatory genes p21 and p27 expression in inhibition of breast cancer cells by arsenic trioxide. Med. Oncol. 2011, 28, 1225–1254.
52. Ouhtit, A.; Madani, S.; Gupta, I.; Shanmuganathan, S.; Abdraboh, M.E.; Al‐Riyami, H.; Al‐Farsi, Y.M.; Raj, M.H. TGF‐β2: A
Novel Target of CD44‐Promoted Breast Cancer Invasion. J. Cancer 2013, 4, 566–572.
53. Lee, H.H.; Jung, J.; Moon, A.; Kang, H.; Cho, H. Antitumor and Anti‐Invasive Effect of Apigenin on Human Breast Carcinoma
through Suppression of IL‐6 Expression. Int. J. Mol. Sci. 2019, 20.
Int. J. Mol. Sci. 2022, 23, 4784 23 of 24
54. Bianchini, G.; Balko, J.M.; Mayer, I.A.; Sanders, M.E.; Gianni, L. Triple‐negative breast cancer: Challenges and opportunities of
a heterogeneous disease. Nat. Rev. Clin. Oncol. 2016, 13, 674–690.
55. Du, S.; Liu, K.; Gao, P.; Li, Z.; Zheng, J. Differential anticancer activities of arsenic trioxide on head and neck cancer cells with
different human papillomavirus status. Life Sci. 2018, 212, 182–193.
56. Luo, D.; Zhang, X.; Du, R.; Gao, W.; Luo, N.; Zhao, S.; Li, Y.; Chen, R.; Wang, H.; Bao, Y.; et al. Low dosage of arsenic trioxide
(As2O3) inhibits angiogenesis in epithelial ovarian cancer without cell apoptosis. J. Biol. Inorg. Chem. 2018, 23, 939–947.
57. Xiong, X.; Li, Y.; Liu, L.; Qi, K.; Zhang, C.; Chen, Y.; Fang, J. Arsenic trioxide induces cell cycle arrest and affects Trk receptor
expression in human neuroblastoma SK‐N‐SH cells. Biol. Res. 2018, 51, 18.
58. Sadaf, N.; Kumar, N.; Ali, M.; Ali, V.; Bimal, S.; Haque, R. Arsenic trioxide induces apoptosis and inhibits the growth of human
liver cancer cells. Life Sci. 2018, 205, 9–17.
59. Mohammadi Kian, M.; Mohammadi, S.; Tavallaei, M.; Chahardouli, B.; Rostami, S.; Zahedpanah, M.; Ghavamzadeh, A.;
Nikbakht, M. Inhibitory effects of arsenic trioxide and thalidomide on angiogenesis and vascular endothelial growth factor
expression in leukemia cells. Asian Pac. J. Cancer Prev. 2018, 19, 1127–1134.
60. Li, Y.‐L.; Jin, Y.‐F.; Liu, X.‐X.; Li, H.‐J. A comprehensive analysis of Wnt/β‐catenin signaling pathway‐related genes and crosstalk
pathways in the treatment of As2O3 in renal cancer. Ren. Fail. 2018, 40, 331–339.
61. Ji, H.; Li, Y.; Jiang, F.; Wang, X.; Zhang, J.; Shen, J.; Yang, X. Inhibition of transforming growth factor beta/SMAD signal by MiR‐
155 is involved in arsenic trioxide‐induced anti‐angiogenesis in prostate cancer. Cancer Sci. 2014, 105, 1541–1549.
62. Hiwatashi, Y.; Tadokoro, H.; Henmi, K.; Arai, M.; Kaise, T.; Tanaka, S.; Hirano, T. Antiproliferative and anti‐invasive effects of
inorganic and organic arsenic compounds on human and murine melanoma cells in vitro. J. Pharm. Pharmacol. 2011, 63, 1202–
1210.
63. Sakai, C.; Arai, M.; Tanaka, S.; Onda, K.; Sugiyama, K.; Hirano, T. Effects of arsenic compounds on growth, cell‐cycle distribu‐
tion and apoptosis of tretinoin‐resistant human promyelocytic leukemia cells. Anticancer Res. 2014, 34, 6489–6494.
64. Hikita, E.; Arai, M.; Tanaka, S.; Onda, K.; Utsumi, H.; Yuan, B.; Toyoda, H.; Hirano, T. Effects of inorganic and organic arsenic
compounds on growth and apoptosis of human T‐lymphoblastoid leukemia cells. Anticancer Res. 2011, 31, 4169–4178.
65. Nagappan, A.; Lee, W.S.; Yun, J.W.; Lu, J.N.; Chang, S.‐H.; Jeong, J.‐H.; Kim, G.S.; Jung, J.‐M.; Hong, S.C. Tetraarsenic hexoxide
induces G2/M arrest, apoptosis, and autophagy via PI3K/Akt suppression and p38 MAPK activation in SW620 human colon
cancer cells. PLoS ONE 2017, 12, e0174591.
66. Ruiz‐Ramos, R.; Lopez‐Carrillo, L.; Rios‐Perez, A.D.; De Vizcaya‐Ruíz, A.; Cebrian, M.E. Sodium arsenite induces ROS genera‐
tion, DNA oxidative damage, HO‐1 and c‐Myc proteins, NF‐kappaB activation and cell proliferation in human breast cancer
MCF‐7 cells. Mutat. Res. 2009, 674, 109–115.
67. Zhao, Y.; Onda, K.; Yuan, B.; Tanaka, S.; Kiyomi, A.; Sugiyama, K.; Sugiura, M.; Takagi, N.; Hirano, T. Arsenic disulfide‐induced
apoptosis and its potential mechanism in two‐ and three‐dimensionally cultured human breast cancer MCF‐7 cells. Int. J. Oncol.
2018, 52, 1959–1971.
68. Wallace, D.R.; Taalab, Y.M.; Heinze, S.; Tariba Lovaković, B.; Pizent, A.; Renieri, E.; Tsatsakis, A.; Farooqi, A.A.; Javorac, D.;
Andjelkovic, M.; et al. Toxic‐Metal‐Induced Alteration in miRNA Expression Profile as a Proposed Mechanism for Disease
Development. Cells 2020, 9.
69. Ghaffari, S.H.; Bashash, D.; Dizaji, M.Z.; Ghavamzadeh, A.; Alimoghaddam, K. Alteration in miRNA gene expression pattern
in acute promyelocytic leukemia cell induced by arsenic trioxide: A possible mechanism to explain arsenic multi‐target action.
Tumor Biol. 2012, 33, 157–172.
70. Gao, J.; Wang, G.; Wu, J.; Zuo, Y.; Zhang, J.; Jin, X. Skp2 Expression Is Inhibited by Arsenic Trioxide through the Upregulation
of miRNA‐330‐5p in Pancreatic Cancer Cells. Mol. Ther. Oncolytics 2019, 12, 214–223.
71. Wu, B.; Tan, M.; Cai, W.; Wang, B.; He, P.; Zhang, X. Arsenic trioxide induces autophagic cell death in osteosarcoma cells via
the ROS‐TFEB signaling pathway. Biochem. Biophys. Res. Commun. 2018, 496, 167–175.
72. Leung, L.L.; Lam, S.‐K.; Li, Y.‐Y.; Ho, J.C.‐M. Tumour growth‐suppressive effect of arsenic trioxide in squamous cell lung car‐
cinoma. Oncol. Lett. 2017, 14, 3748–3754.
73. Pileczki, V.; Braicu, C.; Gherman, C.D.; Berindan‐Neagoe, I. TNF‐α gene knockout in triple negative breast cancer cell line in‐
duces apoptosis. Int. J. Mol. Sci. 2012, 14, 411–420.
74. Zhou, C.‐Y.; Gong, L.‐Y.; Liao, R.; Weng, N.‐N.; Feng, Y.‐Y.; Dong, Y.‐P.; Zhu, H.; Zhao, Y.‐Q.; Zhang, Y.‐Y.; Zhu, Q.; et al.
Evaluation of the target genes of arsenic trioxide in pancreatic cancer by bioinformatics analysis. Oncol. Lett. 2019, 18, 5163–
5172.
75. Zhang, H.‐W.; Hu, J.‐J.; Fu, R.‐Q.; Liu, X.; Zhang, Y.‐H.; Li, J.; Liu, L.; Li, Y.‐N.; Deng, Q.; Luo, Q.‐S.; et al. Flavonoids inhibit cell
proliferation and induce apoptosis and autophagy through downregulation of PI3Kγ mediated PI3K/AKT/mTOR/p70S6K/ULK
signaling pathway in human breast cancer cells. Sci. Rep. 2018, 8, 11255.
76. Tian, T.; Li, X.; Zhang, J. mTOR Signaling in Cancer and mTOR Inhibitors in Solid Tumor Targeting Therapy. Int. J. Mol. Sci.
2019, 20.
77. Maiuri, M.C.; Zalckvar, E.; Kimchi, A.; Kroemer, G. Self‐eating and self‐killing: Crosstalk between autophagy and apoptosis.
Nat. Rev. Mol. Cell Biol. 2007, 8, 741–752.
78. Stevens, J.J.; Graham, B.; Dugo, E.; Berhaneselassie‐Sumner, B.; Ndebele, K.; Tchounwou, P.B. Arsenic Trioxide Induces Apop‐
tosis via Specific Signaling Pathways in HT‐29 Colon Cancer Cells. J. Cancer Sci. Ther. 2017, 9, 298–306.
Int. J. Mol. Sci. 2022, 23, 4784 24 of 24
79. El‐Khattouti, A.; Selimovic, D.; Haikel, Y.; Hassan, M. Crosstalk between apoptosis and autophagy: Molecular mechanisms and
therapeutic strategies in cancer. J. Cell Death 2013, 6, 37–55.
80. Kharroubi, W.; Nury, T.; Ahmed, S.H.; Andreoletti, P.; Sakly, R.; Hammami, M.; Lizard, G. Induction by arsenate of cell‐type‐
specific cytotoxic effects in nerve and hepatoma cells. Hum. Exp. Toxicol. 2017, 36, 1256–1269.
81. Chavez, K.J.; Garimella, S.V.; Lipkowitz, S. Triple negative breast cancer cell lines: One tool in the search for better treatment of
triple negative breast cancer. Breast Dis. 2010, 32, 35–48.
82. Bailey, K.A.; Fry, R.C. Arsenic‐Associated Changes to the Epigenome: What Are the Functional Consequences? Curr. Environ.
Health Rep. 2014, 1, 22–34.
83. Howe, C.G.; Gamble, M.V. Influence of arsenic on global levels of histone posttranslational modifications: A review of the
literature and challenges in the field. Curr. Environ. Health Rep. 2016, 3, 225–237.
84. O’Hagan, H.M. Chromatin modifications during repair of environmental exposure‐induced DNA damage: A potential mecha‐
nism for stable epigenetic alterations. Env. Mol. Mutagen. 2014, 55, 278–291.
85. Chaidez, B.R.; Dixon, K. Arsenic Exposure Alters a Chromatin Silencing Pathway. Epidemiology 2008, 19, S226.
86. Hata, A.N.; Engelman, J.A.; Faber, A.C. The BCL2 family: Key mediators of the apoptotic response to targeted anticancer ther‐
apeutics. Cancer Discov. 2015, 5, 475–487.
87. Mu, Y.‐F.; Chen, Y.‐H.; Chang, M.‐M.; Chen, Y.‐C.; Huang, B.‐M. Arsenic compounds induce apoptosis through caspase path‐
way activation in MA‐10 Leydig tumor cells. Oncol. Lett. 2019, 18, 944–954.
88. Treas, J.N.; Tyagi, T.; Singh, K.P. Effects of chronic exposure to arsenic and estrogen on epigenetic regulatory genes expression
and epigenetic code in human prostate epithelial cells. PLoS ONE 2012, 7, e43880.
89. Muenyi, C.S.; Ljungman, M.; States, J.C. Arsenic Disruption of DNA Damage Responses‐Potential Role in Carcinogenesis and
Chemotherapy. Biomolecules 2015, 5, 2184–2193.
90. Nishikawa, S.; Ishii, H.; Haraguchi, N.; Kano, Y.; Fukusumi, T.; Ohta, K.; Ozaki, M.; Sakai, D.; Satoh, T.; Nagano, H.; et al.
Genotoxic therapy stimulates error‐prone DNA repair in dormant hepatocellular cancer stem cells. Exp. Med. 2012, 3, 959–962.
91. Charoensuk, V.; Gati, W.P.; Weinfeld, M.; Le, X.C. Differential cytotoxic effects of arsenic compounds in human acute promye‐
locytic leukemia cells. Toxicol. Appl. Pharmacol. 2009, 239, 64–70.
92. Ventura‐Lima, J.; Bogo, M.R.; Monserrat, J.M. Arsenic toxicity in mammals and aquatic animals: A comparative biochemical
approach. Ecotoxicol. Environ. Saf. 2011, 74, 211–218.
93. Rueden, C.T.; Schindelin, J.; Hiner, M.C.; DeZonia, B.E.; Walter, A.E.; Arena, E.T.; Eliceiri, K.W. ImageJ2: ImageJ for the next
generation of scientific image data. BMC Bioinformatics 2017, 18, 529
94. Braicu, C.; Cojocneanu‐Petric, R.; Jurj, A.; Gulei, D.; Taranu, I.; Gras, A.M.; Marin, D.E.; Berindan‐Neagoe, I. Microarray based
gene expression analysis of Sus Scrofa duodenum exposed to zearalenone: Significance to human health. BMC Genom. 2016, 17,
646.
95. Petric, R.C.; Braicu, C.; Bassi, C.; Pop, L.; Taranu, I.; Dragos, N.; Dumitrascu, D.; Negrini, M.; Berindan‐Neagoe, I. Interspecies
Gene Name Extrapolation‐‐A New Approach. PLoS ONE 2015, 10, e0138751.
96. Ritchie, M.E.; Phipson, B.; Wu, D.; Hu, Y.; Law, C.W.; Shi, W.; Smyth, G.K. limma powers differential expression analyses for
RNA‐sequencing and microarray studies. Nucleic Acids Res. 2015, 43, e47.
97. Core Team, R. R: A Language and Environment for Statistical Computing; R Core Team: Vienna, Austria, 2015.
98. Pruteanu, L.‐L.; Kopanitsa, L.; Módos, D.; Kletnieks, E.; Samarova, E.; Bender, A.; Gomez, L.D.; Bailey, D.S. Transcriptomics
predicts compound synergy in drug and natural product treated glioblastoma cells. PLoS ONE 2020, 15, e0239551.
99. Phipson, B.; Lee, S.; Majewski, I.J.; Alexander, W.S.; Smyth, G.K. Robust hyperparameter estimation protects against hypervar‐
iable genes and improves power to detect differential expression. Ann. Appl. Stat. 2016, 10, 946–963.
100. Eden, E.; Navon, R.; Steinfeld, I.; Lipson, D.; Yakhini, Z. GOrilla: A tool for discovery and visualization of enriched GO terms
in ranked gene lists. BMC Bioinform. 2009, 10, 48.
101. The Gene Ontology Consortium Expansion of the Gene Ontology knowledgebase and resources. Nucleic Acids Res. 2017, 45,
D331–D338.
102. Ashburner, M.; Ball, C.A.; Blake, J.A.; Botstein, D.; Butler, H.; Cherry, J.M.; Davis, A.P.; Dolinski, K.; Dwight, S.S.; Eppig, J.; et
al. Gene Ontology: Tool for the unification of biology. Nat. Genet. 2000, 25, 25–29.
103. Wu, D.; Smyth, G.K. Camera: A competitive gene set test accounting for inter‐gene correlation. Nucleic Acids Res. 2012, 40, e133.
104. Guo, Y.; Hastie, T.; Tibshirani, R. Regularized linear discriminant analysis and its application in microarrays. Biostatistics 2007,
8, 86–100.
105. Subramanian, A.; Tamayo, P.; Mootha, V.K.; Mukherjee, S.; Ebert, B.L.; Gillette, M.A.; Paulovich, A.; Pomeroy, S.L.; Golub, T.R.;
Lander, E.S.; et al. Gene set enrichment analysis: A knowledge‐based approach for interpreting genome‐wide expression pro‐
files. Proc. Natl. Acad. Sci. USA 2005, 102, 15545–15550.
106. Liberzon, A.; Birger, C.; Thorvaldsdóttir, H.; Ghandi, M.; Mesirov, J.P.; Tamayo, P. The Molecular Signatures Database
(MSigDB) hallmark gene set collection. Cell Syst. 2015, 1, 417–425.
107. UniProt Consortium UniProt: A hub for protein information. Nucleic Acids Res. 2015, 43, D204–D212.
108. Perfetto, L.; Briganti, L.; Calderone, A.; Cerquone Perpetuini, A.; Iannuccelli, M.; Langone, F.; Licata, L.; Marinkovic, M.; Mat‐
tioni, A.; Pavlidou, T.; et al. SIGNOR: A database of causal relationships between biological entities. Nucleic Acids Res. 2016, 44,
D548–D554.
Related Documents