Supported by AFRICA 2 MILLION HA STATISTICS & EMERGING TRENDS 2021 NORTH AMERICA 3.6 MILLION HA OCEANIA 35.9 MILLION HA LATIN AMERICA 8.3 MILLION HA ASIA 5.9 MILLION HA EUROPE 16.5 MILLION HA FiBL & IFOAM – ORGANICS INTERNATIONAL

Welcome message from author
This document is posted to help you gain knowledge. Please leave a comment to let me know what you think about it! Share it to your friends and learn new things together.
Transcript

In cooperation withISBN Printed version 978-3-03736-393-5ISBN PDF version 978-3-03736-394-2
Supported by
!"# $%&'( %)%&*+,-. +*&-./'!/&#
AFRICA 2 MILLION HA
STATISTICS & EMERGING TRENDS 2021
NORTH AMERICA 3.6 MILLION HA
OCEANIA 35.9 MILLION HA
LATIN AMERICA 8.3 MILLION HA
ASIA 5.9 MILLION HA
EUROPE 16.5 MILLION HA
FiBL & IFOAM – ORGANICS INTERNATIONAL
FiB
L &
IFO
AM
– O
RG
AN
ICS
INTE
RN
ATI
ON
AL
THE
WO
RLD
OF
ORG
AN
IC A
GR
ICU
LTU
RE
2021
ST
ATI
STIC
S
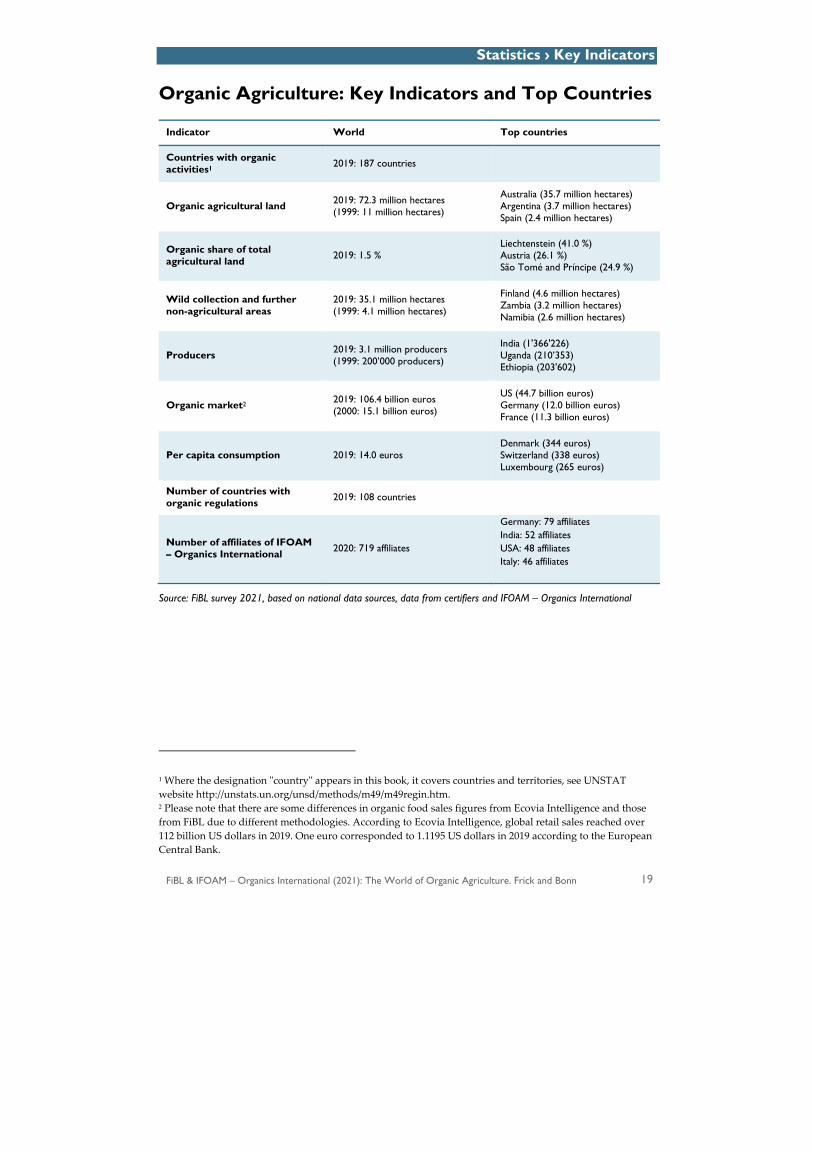
Organic agriculture is practised in 187 countries, and 72.3 million hectares of agricultural land are managed organically by at least 3.1 million farmers. The global sales of organic food and drink reached more than 106 billion euros in 2019. The 22nd edition of The World of Organic Agriculture, published by the Research Institute of Organic Agriculture FiBL and IFOAM – Organics International, provides a comprehensive review of recent developments in global organic agriculture. It presents detailed organic farming statistics covering the area under organic management, land use and crops in organic systems, the number of farms and other operator types and selected market data. The book includes contributions from representatives of the organic sector around the world about the global market for organic food, organic imports, standards and regulations, Participatory Guarantee Systems (PGS), public food procurement in the organic sector and insights into current and emerging trends in organic agriculture in Africa, Asia, Europe, Latin America, North America, and Oceania. This year’s edition also includes information describing the impacts of the COVID-19 pandemic on the organic sector.
The latest data are presented annually at BIOFACH in Nuremberg, Germany In 2022, BIOFACH will be held from 15 – 18 February
From its Roots,organic inspires life.
SAVE THE DATES
FRANCE
SEPTEMBER 6th TO 10th 2021 IN RENNESCOUVENT DES JACOBINS � CONFERENCE CENTRE
90 minutes from Paris
#OWC2021 CONGRÈS MONDIAL BIO 2021 IFOAM ORGANIC WORLD CONGRESS 2021
[email protected] | www.owc.ifoam.bio
6-7 SEPTEMBER
7 SEPTEMBER
8-10 SEPTEMBER
PRE-CONFERENCES
OPENING CEREMONY (IN THE EVENING)
CONFERENCES2021
Research Institute of Organic Agriculture FiBL IFOAM – Organics International
The World of Organic Agriculture Statistics and Emerging Trends 2021
Edited by
Helga Willer, Jan Trávníček, Claudia Meier and Bernhard Schlatter
For the PDF version, corrigenda, supplementary material see http://www.organic-world.net/yearbook/yearbook-2021.html
All of the statements and results contained in this book have been compiled by the authors and are to the best of their knowledge correct and have been checked by the Research Institute of Organic Agriculture FiBL and IFOAM – Organics International. However, the possibility of mistakes cannot be ruled out entirely. Therefore, the editors, authors, and publishers are not subject to any obligation and make no guarantees whatsoever regarding any of the statements or results in this work; neither do they accept responsibility or liability for any possible mistakes, nor for any consequences of actions taken by readers based on statements or advice contained therein. Authors are responsible for the content of their articles. Their opinions do not necessarily express the views of FiBL or IFOAM – Organics International. This document has been produced with the support of the Swiss State Secretariat for Economic Affairs (SECO), the International Trade Centre (ITC), the Sustainability Fund of Coop Switzerland (Coop Fonds für Nachhaltigkeit) and NürnbergMesse. The views expressed herein can in no way be taken to reflect the official opinions of SECO, ITC, Coop Switzerland, or NürnbergMesse. Should corrections and updates become necessary, they will be published at www.organic-world.net. This book is available for download at http://www.organic-world.net/yearbook/yearbook-2021.html. Any inquiries regarding this book and its contents should be sent to Helga Willer, FiBL, Ackerstrasse 113, 5070 Frick, Switzerland, e-mail [email protected]. Please quote articles from this book individually with name(s) of author(s) and title of article. The same applies to the tables: Please quote source, title of table and then the overall report. The whole report should be cited as: Willer, Helga, Jan Trávníček, Claudia Meier and Bernhard Schlatter (Eds.) (2021): The World of Organic Agriculture. Statistics and Emerging Trends 2021. Research Institute of Organic Agriculture FiBL, Frick, and IFOAM – Organics International, Bonn Die Deutsche Bibliothek – CIP Cataloguing-in-Publication-Data A catalogue record for this publication is available from Die Deutsche Bibliothek © February 2021. Research Institute of Organic Agriculture FiBL and IFOAM – Organics International. Research Institute of Organic Agriculture FiBL, Ackerstrasse113, 5070 Frick, Switzerland, Tel. +41 62 865 72 72, Fax +41 62 865 72 73, e-mail [email protected], Internet www.fibl.org IFOAM – Organics International, Charles-de-Gaulle-Str. 5, 53113 Bonn, Germany, Tel. +49 228 926 50-10, Fax +49 228 926 50-99, e-mail [email protected], Internet www.ifoam.bio, Trial Court Bonn, Association Register no. 8726 Language editing: Lauren Dietemann and Laura Kemper, FiBL, Frick, Switzerland Cover: Simone Bissig, FiBL, Frick, Switzerland Layout: Jan Trávníček, Bernhard Schlatter, Helga Willer, FiBL, Frick, Switzerland Maps: Jan Trávníček, FiBL, Frick, Switzerland Graphs (if not otherwise stated): Jan Trávníček, Bernhard Schlatter, Olivia Keller, FiBL, Frick, Switzerland Infographics: Jan Trávníček, Kurt Riedi, FiBL, Frick, Switzerland Cover picture: Flight above organic farm, Velké Hostěrádky (VH), located in the South Moravia region, Czech Republic, May 2020. Background: VH Agroton s.r.o. is a 367 ha organic arable farm located in the heart of Southern Moravia. Despite the scenic surroundings, the farm is prone to excessive erosion due to its hilly landscape. These challenges are being overcome and the knowledge gained is shared with others via demonstrations of suitable practices for profitable and sustainable organic production in arid and erosion threatened areas for the benefit of people and nature. It is a pleasure to inspire others on this challenging but rewarding journey. Picture: Martin Matěj, Czech Republic. Printed by Plump Druck & Medien GmbH, Rolandsecker Weg 33, 53619 Rheinbreitbach, Germany Price: 30 Euros, IFOAM – Organics International affiliates: 20 Euros Printed copies of this volume may be ordered directly from IFOAM – Organics International and FiBL (see addresses above) or via the FiBL shop at shop.fibl.org ISBN Print Version 978-3-03736-393-5 ISBN PDF Version 978-3-03736-394-2
Table of Contents
FiBL & IFOAM – Organics International (2021): The World of Organic Agriculture. Frick and Bonn 3
Table of Contents
Glossary 10 Foreword from SECO and ITC 11 Foreword from FiBL and IFOAM – Organics International 12 Foreword from the Editors 13 Acknowledgements 14 Organic Agriculture: Key Indicators and Top Countries 19 THE WORLD OF ORGANIC AGRICULTURE 2021: SUMMARY 20
Helga Willer, Claudia Meier, Bernhard Schlatter, Lauren Dietemann, Laura Kemper and Jan Trávníček ORGANIC AGRICULTURE WORLDWIDE: CURRENT STATISTICS 31 Current Statistics on Organic Agriculture Worldwide: Area, Operators and Market 32 Bernhard Schlatter, Jan Trávníček, Claudia Meier, Olivia Keller and Helga Willer General notes on the data 35 Organic land 37 Organic producers and other operator types 56 Retail sales and international trade data 64 Organic farming in developing countries and emerging markets 69 Land use and key commodities in organic agriculture 71 Organic Cotton 130 Lisa Barsley, Evonne Tan, Suet Yin, Amish Gosai and Liesl Truscott GLOBAL MARKET ORGANIC IMPORTS 135 The Global Market for Organic Food & Drink 136 By Amarjit Sahota Imports of Organic Agri-food Products into the European Union ‒ Summary of the EU Agricultural Market Brief on EU Organic Imports 2019 140 STANDARDS AND LEGISLATION, POLICY SUPPORT 151
Organic Agriculture Regulations Worldwide: Current Situation 152 Cornelia Kirchner, Joelle Katto-Andrighetto and Joelle Katto-Andrighetto and Flávia Moura e Castro Participatory Guarantee Systems in 2020 158 Flávia Moura e Castro, Sara Anselmi, Cornelia Kirchner and Federica Varini Demeter International – Current Statistics 165 Christoph Simpfendörfer and Sarah Fischer The Power of Public Food Procurement: Fostering Organic Production and Consumption 170 Federica Varini and Xhona Hysa AFRICA 179
Latest Developments in Organic Agriculture in Africa 180 David M. Amudavi, Venancia Wambua, Alex Mutung1, Moses Aisu and Olugbenga O. Adeoluwa
Table of Contents
4 FiBL & IFOAM – Organics International (2021): The World of Organic Agriculture. Frick and Bonn
Africa: Current Statistics 189 ASIA 197
Developments in the Organic Sector in Asia in 2020 198 Shaikh Tanveer Hossain, Jennifer Chang and Vic Anthony Joseph Fabre Tagupa Asia: Current statistics 208 EUROPE 217 Organic in Europe: Recent Developments 219 Helga Willer, Bram Moeskops, Emanuele Busacca , Léna Brisset, Maria Gernert and Silvia Schmidt Europe and the European Union: Key indicators 2019 228 Organic Farming and Market Development in Europe and the European Union 229 Jan Trávníček, Helga Willer and Diana Schaack LATIN AMERICA AND THE CARIBBEAN 267 Latin America: An Insight into the Latest Developments in Organic Agriculture 268 Patricia Flores The Inter-American Commission for Organic Agriculture (CIAO) 272 Graciela Lacaze & Juan Manuel Gámez Latin America and the Caribbean: Current statistics 274 NORTH AMERICA 283
US Organic Sales Break Through 55 billion Dollar Mark 284 Barbara Fitch Haumann Canada 289 Tia Loftsgard North America: Current statistics 291 OCEANIA 297
Australia 298 Nicole Ford and Owen Gwilliam The Pacific Islands 302 Karen Mapusua Oceania: Current statistics 305 OUTLOOK 309
Building Resilience 310 Louise Luttikholt KEY INDICATORS BY COUNTRY AND REGION 313 DATA PROVIDERS AND DATA SOURCES 317

Table of Contents
FiBL & IFOAM – Organics International (2021): The World of Organic Agriculture. Frick and Bonn 5
Tables
Table 1: Countries and territories covered by the global survey on organic agriculture 2019 .......................... 33 Table 2: World: Organic agricultural land (including in-conversion areas) and regions’ shares
of the global organic agricultural land 2019 .......................................................................................................... 37 Table 3: World: Organic agricultural land (including in-conversion areas) by country 2019 (sorted) ............. 39 Table 4: World: Organic agricultural land (including in-conversion areas) and organic share of total
agricultural land by region 2019 .............................................................................................................................. 41 Table 5: World: Organic shares of total agricultural land by country 2019 (sorted) ........................................... 43 Table 6: World: Organic agricultural land (including in-conversion areas) by region: growth 2018-2019
and 10 years growth .................................................................................................................................................. 45 Table 7: World: Development of organic agricultural land by country 2018-2019 .............................................. 47 Table 8: World: Organic areas: Agricultural land (including conversion areas) and further
organic areas by region in 2019 ............................................................................................................................... 52 Table 9: World: Organic areas: Agricultural land (including conversion areas) and
further organic areas by country 2019 .................................................................................................................... 52 Table 10: World: Development of the numbers of producers by region 2018 to 2019 ........................................ 56 Table 11: World: Organic producers and other operator types by country 2019 ................................................. 58 Table 12: Global market data: Retail sales and per capita consumption by region 2019 .................................... 65 Table 13: Global market data: Retail sales, organic share of all retail sales, per capita consumption, and
exports by country 2019 ............................................................................................................................................ 67 Table 14: Countries on the DAC list: Development of organic agricultural land 2014-2019 ............................. 70 Table 15: World: Land use in organic agriculture by region (including in-conversion areas) 2019 ................. 74 Table 16: World: Land use and crop categories in organic agriculture worldwide 2019 ................................... 74 Table 17: Use of organic arable land (including in-conversion areas), 2018 and 2019 compared ..................... 75 Table 18: Use of organic permanent cropland (including in-conversion areas), 2018 and 2019 compared ..... 77 Table 19: Wild collection and beekeeping areas by region 2018 and 2019 compared ......................................... 79 Table 20: Wild collection and beekeeping areas by crop group 2019 .................................................................... 79 Table 21: Wild collection and beekeeping areas by country 2019 .......................................................................... 81 Table 22: Number of organic beehives by country 2019 .......................................................................................... 86 Table 23: Organic aquaculture: Production volume by species 2019 ..................................................................... 87 Table 24: Organic aquaculture: Production volume by country 2019 ................................................................... 89 Table 25: World: Selected key crop groups and crops area in organic agriculture 2019
(overview including conversion areas) .................................................................................................................. 90 Table 26: Cereals: Organic area by country 2019 ....................................................................................................... 93 Table 27: Citrus fruit: Organic area by country 2019 ................................................................................................ 97 Table 28: Cocoa beans: Organic area by country 2019 ............................................................................................ 100 Table 29: Coffee: Organic area by country 2019 ...................................................................................................... 103 Table 30: Dry pulses: Organic area by country 2019............................................................................................... 106 Table 31: Temperate fruit: Organic area by country 2019 ...................................................................................... 110 Table 32: Tropical and subtropical fruit: Organic area by country 2019 ............................................................. 114 Table 33: Grapes: Organic area by country 2019 ..................................................................................................... 118 Table 34: Oilseeds: Organic area by country 2019 ................................................................................................... 121 Table 35: Olives: Organic area by country 2019 ...................................................................................................... 125 Table 36: Vegetables: Organic area by country 2019 .............................................................................................. 128 Table 37: Organic cotton farmers, area and production 2018/2019, ..................................................................... 132 Table 38: Organic cereals, oilseeds and sugar import volumes for key product categories,
2018 and 2019 (thousand MT) ................................................................................................................................ 142 Table 39: Organic fruit and vegetables import volumes by product category, 2018 and 2019 ....................... 144 Table 40: Organic permanent crops (excl. fruit and nuts) import volumes by product category,
2018 and 2019 ............................................................................................................................................................ 144 Table 41: Organic animal product import volumes by product category, 2018 and 2019 ................................ 145 Table 42: European Union: Imports by Member State 2019 .................................................................................. 145 Table 43: Organic import volumes by exporting country, 2018 and 2019 ........................................................... 146 Table 44: Organic import volumes by product category, 2018 and 2019 ............................................................ 149 Table 45: Status of organic agriculture regulation: Number of countries by region 2020 ................................ 152
Table of Contents
6 FiBL & IFOAM – Organics International (2021): The World of Organic Agriculture. Frick and Bonn
Table 46: Status of organic agriculture regulations ................................................................................................. 155 Table 47: PGS statistics 2020 ....................................................................................................................................... 163 Table 48: Certified Demeter operations in member countries with a certifying organisation (July 2020) ..... 167 Table 49: ICO-certified Demeter operations in other countries ............................................................................ 167 Table 50: Demeter certified vintners and grape area worldwide* ........................................................................ 169 Table 51: Africa: Organic agricultural land, organic share of total agricultural land and number of organic
producers 2019 ......................................................................................................................................................... 194 Table 52: Africa: All organic areas 2019 .................................................................................................................... 195 Table 53: Africa: Land use in organic agriculture 2019 .......................................................................................... 196 Table 54: Africa: Use of wild collection areas 2019 ................................................................................................. 196 Table 55: Asia: Organic agricultural land, organic share of farmland, producers 2019 .................................... 213 Table 56: Asia: All organic areas 2019 ....................................................................................................................... 214 Table 57: Asia: Land use in organic agriculture 2019 ............................................................................................. 215 Table 58: Asia: Use of wild collection areas 2019 .................................................................................................... 215 Table 59: Europe: Organic agricultural land in Europe and the European Union 2019 ................................... 231 Table 60: Europe and the European Union: Land use 2019 ................................................................................... 237 Table 61: Europe and the European Union: Key crops/crop group 2019 ............................................................ 240 Table 62: Europe and the European Union: Organic livestock 2019 .................................................................... 243 Table 63: Europe: Organic operators by country group 2019 ............................................................................... 245 Table 64: Europe and the European Union: Organic retail sales 2019: Key data ............................................... 248 Table 65: Organic shares for retail sales values (euros) for selected products 2019 .......................................... 254 Table 66: Europe: Organic agricultural land by country 2019 .............................................................................. 260 Table 67: Europe: Conversion status of organic agricultural land 2019 .............................................................. 261 Table 68: Europe: Land use in organic agriculture by country 2019 .................................................................... 262 Table 69: Europe: Organic agricultural land and wild collection areas by country 2019 ................................. 263 Table 70: Europe: Organic livestock by country 2019 ............................................................................................. 264 Table 71: Europe: Organic producers, processors, and importers by country 2019 .......................................... 265 Table 72: Europe: The organic food market 2019 .................................................................................................... 266 Table 73: Brazil: Organic producers in Brazil according to the certification system ......................................... 269 Table 74: Latin America: Organic agricultural land, organic share of total agricultural land,
and number of producers 2019 .............................................................................................................................. 279 Table 75: Latin America: All organic areas 2019 ...................................................................................................... 280 Table 76: Latin America: Land use in organic agriculture 2019 ............................................................................ 281 Table 77: Latin America: Use of wild collection areas 2019 ................................................................................... 281 Table 78: North America: Organic agricultural land, organic share of total agricultural land,
and number of producers 2019 ............................................................................................................................. 295 Table 79: North America: All organic areas 2019 .................................................................................................... 295 Table 80: North America: Land use in organic agriculture 2019 .......................................................................... 295 Table 81: Australia: Fire extent area during 2019–20 summer bushfire season in southern and eastern
Australia .................................................................................................................................................................... 299 Table 82: Pacific Islands: Main certified organic products .................................................................................... 302 Table 83: Oceania: Organic agricultural land, organic share of total agricultural land,
and number of producers 2019 .............................................................................................................................. 307 Table 84: Oceania: All organic areas 2019 ................................................................................................................. 308 Table 85: Oceania: Land use in organic agriculture 2019 ....................................................................................... 308 Table 86: Key indicators by region 2019 ................................................................................................................... 313 Table 87: Key indicators by country 2019 ................................................................................................................. 313 Table 88: Development of the number of producers and the organic area according to the Ministry of
Agriculture, Livestock and Food in Brazil ........................................................................................................... 336
Figures
Figure 1: World: Distribution of organic agricultural land by region 2019 ........................................................... 38 Figure 2: World: The ten countries with the largest areas of organic agricultural land 2019............................. 38 Figure 3: World: Countries with an organic share of the total agricultural land of at least 10 percent 2019 .. 42 Figure 4: World: Distribution of the organic shares of the agricultural land 2019 .............................................. 42
Table of Contents
FiBL & IFOAM – Organics International (2021): The World of Organic Agriculture. Frick and Bonn 7
Figure 5: World: Growth of the organic agricultural land and organic share 1999-2019 ................................... 46 Figure 6: World: Growth of the organic agricultural land by continent 2010 to 2019 ......................................... 46 Figure 7: World: The ten countries with the highest increase of organic agricultural land 2019 ...................... 47 Figure 8: World: Distribution of all organic areas 2019. Total: 107.4 million hectares ........................................ 51 Figure 9: World: Distribution of organic producers by region 2019 (Total: 3.1 million producers) ................. 57 Figure 10: World: The ten countries with the largest numbers of organic producers 2019 ............................... 57 Figure 11: Global market for organic food: Distribution of retail sales by country 2019 .................................... 65 Figure 12: Global market for organic food: Distribution of retail sales by region 2019 ...................................... 65 Figure 13: Global market: The countries with the largest markets for organic food 2019 .................................. 66 Figure 14: Global market: The ten countries with the highest per capita consumption 2019 ............................ 66 Figure 15 (left): Countries on the DAC list: The ten countries with the largest areas of
organic agricultural land in 2019 ............................................................................................................................. 70 Figure 16 (right): Countries on the DAC list: The ten countries with the highest organic shares of the total
agricultural land in 2019 ........................................................................................................................................... 70 Figure 17: World: Distribution of main land use types by region 2019 ................................................................. 72 Figure 18: World: Distribution of main land use types and key crop categories 2019 ........................................ 73 Figure 19: World: Development of organic arable land, permanent cropland and permanent
grassland/grazing areas 2004-2019 .......................................................................................................................... 73 Figure 20: World: Distribution of organic arable cropland by region 2019 .......................................................... 76 Figure 21: World: Use of arable cropland by crop group 2019 ............................................................................... 76 Figure 22: World: Distribution of permanent cropland by region 2019 ................................................................ 78 Figure 23: World: Use of permanent cropland by crop group 2019 ....................................................................... 78 Figure 24: World: Distribution of organic wild collection and beekeeping areas by region in 2019 ................ 80 Figure 25: World: The ten countries with the largest organic wild collection and
beekeeping areas in 2019 .......................................................................................................................................... 80 Figure 26: World: Distribution of organic beehives by region in 2019 .................................................................. 85 Figure 27: World: Development of the organic beehives 2008-2019 ...................................................................... 85 Figure 28: World: Organic aquaculture production volume:
Distribution by continent and top 10 countries 2019 ........................................................................................... 88 Figure 29: World: Organic aquaculture production volume: Distribution
by species and key species 2019 .............................................................................................................................. 88 Figure 30: Cereals: Organic area 2019 ......................................................................................................................... 91 Figure 31: Cereals: Organic area 2019 ......................................................................................................................... 92 Figure 32: Citrus fruit: Organic area 2019 ................................................................................................................... 95 Figure 33: Citrus fruit: Organic area 2019 ................................................................................................................... 96 Figure 34: Cocoa: Organic area 2019 ........................................................................................................................... 98 Figure 35: Cocoa: Organic area 2019 ........................................................................................................................... 99 Figure 36: Coffee: Organic area 2019 ......................................................................................................................... 101 Figure 37: Coffee: Organic area 2019 ......................................................................................................................... 102 Figure 38: Dry Pulses: Organic area 2019 ................................................................................................................. 104 Figure 39: Dry Pulses: Organic area 2019 ................................................................................................................. 105 Figure 40: Temperate Fruit: Organic area 2019 ........................................................................................................ 108 Figure 41: Temperate Fruit: Organic area 2019 ........................................................................................................ 109 Figure 42: Tropical and subtropical fruit: Organic area 2019 ................................................................................ 112 Figure 43: Tropical and subtropical fruit: Organic area 2019 ................................................................................ 113 Figure 44: Grapes: Organic area 2019 ........................................................................................................................ 116 Figure 45: Grapes: Organic area 2019 ........................................................................................................................ 117 Figure 46: Oilseeds: Organic area 2019 ..................................................................................................................... 119 Figure 47: Oilseeds: Organic area 2019 ..................................................................................................................... 120 Figure 48: Olives: Organic area 2019 ......................................................................................................................... 123 Figure 49: Olives: Organic area 2019 ......................................................................................................................... 124 Figure 50: Vegetables: Organic area 2019 ................................................................................................................. 126 Figure 51: Vegetables: Organic area 2019 ................................................................................................................. 127 Figure 52: Development of organic cotton fibre production in metric tons ....................................................... 131 Figure 53: Growth in Global Organic Food Sales by Leading Regions, 2000-2019 ............................................ 137 Figure 54: Organic agri-food import volumes by import country ....................................................................... 140

Table of Contents
8 FiBL & IFOAM – Organics International (2021): The World of Organic Agriculture. Frick and Bonn
Figure 55: Share (%) of total organic agri-food import volumes by product groups (left) and export country (right) 2019 ..................................................................................................................................... 141
Figure 56: Development of PGS certified producers worldwide ......................................................................... 159 Figure 57: Development of the number of Demeter-certified farms .................................................................... 166 Figure 58: Development of the Demeter-certified area .......................................................................................... 166 Figure 59: Africa: The ten countries with the largest organic agricultural area 2019 ........................................ 191 Figure 60: Africa: The countries with the highest organic share of total agricultural land 2019 ..................... 192 Figure 61: Africa: Development of organic agricultural land 1999-2019 ............................................................. 192 Figure 62: Africa: Use of organic agricultural land 2019 ........................................................................................ 193 Figure 63: Africa: The ten countries with the largest number of organic producers 2019................................ 193 Figure 64: Asia: The ten countries with the largest organic agricultural area 2019 ........................................... 211 Figure 65: Asia: The countries with the highest organic share of total agricultural land 2019 ........................ 211 Figure 66: Asia: Development of organic agricultural land 1999 to 2019 ............................................................ 212 Figure 67: Asia: Use of organic agricultural land 2019 ........................................................................................... 212 Figure 68: European Union: European Union: Growth of organic farmland and retail sales 2000-2019
compared ................................................................................................................................................................... 220 Figure 69: Europe: Distribution of organic farmland by country 2019 ................................................................ 231 Figure 70: Europe: Organic agricultural land by country 2019 ............................................................................. 232 Figure 71: Europe: Organic shares of total agricultural land 2019 ....................................................................... 234 Figure 72: Europe and the European Union: Development of organic agricultural land 1985-2019 .............. 235 Figure 73: Europe: Growth rates for organic agricultural land in Europe and the European Union 1985-2019
..................................................................................................................................................................................... 235 Figure 74: Europe: The ten countries with the highest growth in organic agricultural land in hectares and
percentage in 2019 ................................................................................................................................................... 236 Figure 75: Europe and the European Union: Conversion status of organic land in Europe and the European
Union 2019 ................................................................................................................................................................ 236 Figure 76: Europe and European Union: Distribution of land use in organic agriculture 2019 ...................... 237 Figure 77: Europe: Land use in organic agriculture by top 10 countries 2019 ................................................... 238 Figure 78: Europe: Growth in organic agricultural land by land use type 2004-2019 ....................................... 239 Figure 79: European Union: Growth in organic agricultural land by land use type 2004-2019 ...................... 239 Figure 80: Europe and the European Union: Development of organic cow’s milk production
2008-2019 ................................................................................................................................................................... 244 Figure 81: Europe and the European Union: Development of the number of
organic producers in 2000-2019 ............................................................................................................................. 246 Figure 82: Europe: Distribution of organic producers and processors by country 2019 .................................. 246 Figure 83: Europe: Number of organic producers by country 2019 ..................................................................... 247 Figure 84: Europe: Distribution of retail sales by country and by single market worldwide 2019 ................. 248 Figure 85: Europe: Retail sales by country 2019 ...................................................................................................... 249 Figure 86: Europe: Growth of organic retail sales in Europe and the European Union, 2000-2019 ................ 250 Figure 87: Europe: The countries with the highest organic market growth 2019 .............................................. 251 Figure 88: Europe: The countries with the highest per capita consumption 2019 ............................................. 252 Figure 89: Europe: Growth of the per capita consumption 2010-2019 ................................................................. 252 Figure 90: Europe: The countries with the highest shares of the total retail sales 2019 .................................... 253 Figure 91: Europe: Marketing channels for organic products in selected countries 2019 ................................ 256 Figure 92: Europe: Growth of marketing channels for organic products 2017-2019 in selected countries .... 256 Figure 93: Latin America and Caribbean: The ten countries with the largest areas
of organic agricultural land 2019 ........................................................................................................................... 277 Figure 94: Latin America and Caribbean: The ten countries with the highest organic share of
total agricultural land 2019 .................................................................................................................................... 277 Figure 95: Latin America and Caribbean: Development of organic agricultural land 1999-2019 ................... 278 Figure 96: Latin America and Caribbean: Use of agricultural organic land 2019 .............................................. 278 Figure 97: North America: Organic agricultural land in Canada and the United States 2019 ......................... 293 Figure 98: North America: Organic share of total agricultural land in Canada
and the United States 2019 ..................................................................................................................................... 293 Figure 99: North America: Development of organic agricultural land 1999-2019 ............................................. 294 Figure 100: North America: Land use in organic agriculture 2019 ...................................................................... 294

Table of Contents
FiBL & IFOAM – Organics International (2021): The World of Organic Agriculture. Frick and Bonn 9
Figure 101: Oceania: Organic agricultural land by country 2019 ......................................................................... 306 Figure 102: Oceania: Organic share of total agricultural land by country 2019 ................................................. 306 Figure 103: Oceania: Development of organic agricultural land 1999-2019 ....................................................... 307
Maps
Map 1: Organic agricultural land and non-agricultural areas in 2019 ................................................................... 31 Map 2: Organic agricultural land in the countries of Africa 2019 (in hectares) ................................................. 179 Map 3: Organic agricultural land in the countries of Asia 2019 ........................................................................... 197 Map 4: Organic agricultural land in the countries of Europe 2019 (in hectares) ............................................... 217 Map 5: Organic agricultural land in the countries of Latin America
and the Caribbean 2019 (in hectares) .................................................................................................................... 267 Map 6: Organic agricultural land in Canada and the United States 2019 ........................................................... 283 Map 7: Organic agricultural land in the countries of Oceania 2019 ..................................................................... 297
Infographics
Infographic 1: Key indicators 2019 .............................................................................................................................. 30 Infographic 2: Organic farmland 2019 ........................................................................................................................ 36 Infographic 3: Organic producers 2019 ....................................................................................................................... 55 Infographic 4: Organic retail sales 2019 ...................................................................................................................... 63 Infographic 5: Organic agriculture in Europe: Key indicators 2019 ..................................................................... 218
Glossary
10 FiBL & IFOAM – Organics International (2021): The World of Organic Agriculture. Frick and Bonn
Glossary
€/person: Per capita consumption in euros AfrONet: African Organic Network AMI: Agrarmarkt-Informationsgesellschaft - Agricultural Market Information Company, Germany AOC: African Organic Conference AU: African Union AUC: African Union Commission CAP: Common Agricultural Policy of the European Union CAADP: Comprehensive Africa Agriculture Development Programme CIHEAM: Centre international de hautes études agronomiques méditerranéennes CNCA: China National Certification and Accreditation Administration COTA: Canada Organic Trade Association, Canada CPC: Candidates and Potential Candidates for the European Union CSC: Continental Steering Committee of the Ecological Organic Agriculture Initiative for Africa (EOA-I) EFTA: European Free Trade Association EOA(-I): Ecological Organic Agriculture (Initiative for Africa) EU: European Union EU-28: Member countries of the European Union (from 2020 onward: EU-27) EU-NACOA: EU/North-African Conference on Organic Agriculture Eurostat: Statistical office of the European Union, Luxembourg FAO: Food and Agriculture Organisation of the United Nations FAOSTAT: Statistics Division of FAO, the Food and Agriculture Organisation of the United Nations FiBL: Forschungsinstitut für biologischen Landbau – Research Institute of Organic Agriculture, Switzerland GOTS: Global Organic Textile Standard ha: Hectares Horizon 2020: Research and Innovation Programme of the European Union, running from 2014 to 2020 HS codes: Harmonized System Codes ISOFAR: International Society of Organic Agriculture Research, Germany ITC: International Trade Centre, Switzerland MOAN: Mediterranean Organic Agriculture Network hosted by CIHEAM Bari, Italy MT: Metric tons NASAA: National Association for Sustainable Agriculture, Australia NOARA: Network of Organic Agriculture Researchers in Africa OTA: Organic Trade Association, United States of America PGS: Participatory Guarantee Systems POETcom: Pacific Organic and Ethical Trade Community SDC: Swiss Agency for Development and Cooperation SECO: State Secretariat for Economic Affairs, Switzerland SÖL: Stiftung Ökologie & Landbau – Foundation Ecology & Agriculture, Germany TP Organics: European Technology Platform for Organic Food and Farming U.S.: United States USDA: United States Department of Agriculture
Foreword from SECO & ITC
FiBL & IFOAM – Organics International (2021): The World of Organic Agriculture. Frick and Bonn 11
Foreword from SECO and ITC
In the dynamic field of organic agriculture, access to good quality data on organic farming helps to measure success toward achieving the Sustainable Development Goals (SDGs) and serves as a resource for further analysis and informed decision-making by researchers, policymakers, industry actors and other stakeholders along the whole value chain. Data can also support the development of a favourable policy environment, reliable regulations and standards, as well as transparency in the organic sector, which has proven to be particularly important over the past year.
COVID-19 is having a deep impact on all of us, highlighting the need to understand what is happening in the sector in order to mitigate the negative impacts of the crisis and reduce the vulnerability of supply chains. For the organic sector, it was a special year, as consumer demand for organic foods increased substantially during the pandemic. Evidence shows that retail sales have risen by up to 30 percent in some countries.
This report, which looks at the consolidated data from 2019, shows that once again, increasing demand for organic products stimulated growth in the organic sector with organic food sales heading towards the 110 billion euro mark. Double-digit growth rates were recorded in many advanced markets for organic products. The production side is also keeping pace: The latest data shows that organic farmland grew in many countries, and the total organic area increased to more than 72 million hectares, representing 1.5 percent of agricultural land worldwide, managed by more than three million producers.
By providing dynamic and easy access to organic market and production data, the Swiss State Secretariat for Economic Affairs (SECO) and the International Trade Centre (ITC) aim to support decision-makers in governmental administrations, development agencies, NGOs, and other actors of the international organic industry.
Considering the latest figures and the continuous and sustainable growth over many years, the organic movement can look confidently to the future.
Dr. Monica Rubiolo Head of the Division for Trade Promotion Swiss State Secretariat for Economic Affairs (SECO) Bern, Switzerland
Joseph Wozniak Head, Trade for Sustainable Development Programme (T4SD) International Trade Centre (ITC) Geneva, Switzerland
Foreword from FiBL & IFOAM – Organics International
12 FiBL & IFOAM – Organics International (2021): The World of Organic Agriculture. Frick and Bonn
Foreword from FiBL and IFOAM – Organics International
With the 22nd edition, FiBL and IFOAM – Organics International proudly present a new edition of “The World of Organic Agriculture.” Data collection as such is a major and constant concern of the Research Institute of Organic Agriculture FiBL and IFOAM – Organics International. The comprehensive data provided over more than two decades in this publication serve as an important tool for stakeholders, policymakers, authorities, and the industry, as well as for researchers and extension professionals. It has also proven useful for development programs and supporting strategies for organic agriculture and markets, and crucial for monitoring the impact of these activities. The publication also shows our ongoing engagement with transparency in the organic sector; the method of collecting the data has been refined over time to reflect the global status of organic as much as possible. “The World of Organic Agriculture” has become one of the most frequently quoted pieces of literature in scientific, technical, and descriptive articles and reports on organic agriculture. This publication also demonstrates the contribution of organic agriculture to overarching sustainability strategies like the Sustainable Development Goals, the EU Farm to Fork Strategy and the upcoming UN Food Systems Summit. Given that organic agriculture contributes substantially to all of the goals and strategies, this book not only shows the land area, number of producers, and market figures; it also highlights the contribution of organic agriculture to tackling climate change, ensuring food and nutrition security, halting biodiversity loss, and promoting sustainable consumption, to name a few. Overall, “The World of Organic Agriculture” shows the potential organic farming has to contribute to a sustainable future! We are grateful to the Swiss State Secretariat for Economic Affairs (SECO), the International Trade Centre (ITC), the Coop Sustainability Fund and Nürnberg Messe for supporting this publication. We would like to express our thanks to all authors and data providers for contributing in-depth information and figures on their region, their country, or their field of expertise. Lastly, we would like to thank the editorial team for their dedication and engagement, and we would also like to express our thanks to the other members of the FiBL team, who support the activities surrounding the data collection.
Frick and Bonn, February 2021
Prof. Dr. Knut Schmidtke Director Research Institute of Organic Agriculture FiBL Frick, Switzerland
Louise Luttikholt Executive Director IFOAM – Organics International Bonn, Germany
Foreword from the Editors
FiBL & IFOAM – Organics International (2021): The World of Organic Agriculture. Frick and Bonn 13
Foreword from the Editors
In the 22nd edition of “The World of Organic Agriculture”, we present the latest available data on organic agriculture.
Again, many experts have provided valuable data, and we are very grateful to our data and information suppliers from all over the world!
Knowledgeable authors once again contributed articles about their regions, their countries, or their fields of expertise, including the global market report, public standards and legislation, Participatory Guarantee Systems, policy support with a focus on organic food service, organic cotton, the European Union’s organic import data as well as the statistics of Demeter International.
Like for the 2020 edition, we did not provide texts in the crop chapters, but instead, we are presenting graphs: A map on the global distribution by country for a given crop/crop group, its development, the top countries in terms of organic area and organic share of the total area, the distribution by continent and, in the case of crop groups, the breakdown by crop. All of these graphics are based on interactive Power BI graphs, which you can explore at https://statistics.fibl.org/visualisation.html.
Finally, we wish to announce that the Chinese edition of “The World of Organic Agriculture” will be published for the 10th time by the Organic and Beyond company.
We want to express our warm gratitude to everyone who makes this report possible!
Helga Willer, Jan Trávníček, Claudia Meier and Bernhard
Research Institute of Organic Agriculture FiBL, Frick, Switzerland
Acknowledgements
14 FiBL & IFOAM – Organics International (2021): The World of Organic Agriculture. Frick and Bonn
Acknowledgements
The Research Institute of Organic Agriculture FiBL and IFOAM – Organics International are very grateful to their supporters for granting financial support for the global data collection and for the 2021 edition of “The World of Organic Agriculture”: the Swiss State Secretariat for Economic Affairs (SECO), Economic Development and Cooperation (within the framework of its support activities for organic production in developing countries), Bern, Switzerland, the International Trade Centre (ITC), Geneva, Switzerland, the Sustainability Fund of Coop Switzerland (Coop Fonds für Nachhaltigkeit), Basel, Switzerland, and NürnbergMesse, the organizers of BIOFACH, Nürnberg, Germany.
Numerous individuals have contributed to the making of this work. The editors are very grateful to all those listed below, without whom it would not have been possible to produce this yearbook.
Olugbenga O. AdeOluwa, Network of Organic Agriculture Research in Africa (NOARA), University of Ibadan, Nigeria, www.unaab.edu.ng; Marcelle Agius, Ministry for the Environment, Sustainable Development and Climate Change, Malta, Moises Aisu, Network of Organic Agriculture Research in Africa (NOARA), University of Ibadan, Nigeria, Ibadan, Nigeria, www.unaab.edu.ng; Khurshid Alam, Bangladesh Agricultural Research Institute (BARI), Bangladesh, Saif Moh Al-Shara, Ministry of Environment and Water, Agricultural Affairs and Animal Sector, Dubai, United Arab Emirates, www.moew.gov.ae; David Amudavi, Biovision Africa Trust, Nairobi, Kenya; Sara Anselmi, IFOAM - Organics International, Bonn, Germany, www.ifoam.bio; Stoilko Apostolov, Bioselena: Foundation for organic agriculture, Karlovo, Bulgaria, www.bioselena.com; Lidya Ariesusanty, Indonesia Organic Alliance IOA, Bogor, Indonesia, www.organicindonesia.org; Angela Atallah, CCPB Middle East, Beirut, Lebanon, www.ccpb.it; Vugar Babayev, Ganja Agribusiness Association (GABA), Ganja City, Azerbaijan, www.gaba.az; Nouhoun Barro, Ecocert SA West Africa Office, Ougadougou, Burkina Faso, www.ecocert.com; Lisa Barsley, Textile Exchange, London, United Kingdom; Elif Bayraktar Öktem, Ministry of Agriculture and Forestry of the Republic of Turkey, Ankara, Turkey, Milena Belli, Istituto per la Certificazione Etica ed Ambientale (ICEA), Bologna, Italy, www.icea.info; Albrecht Benzing, CERES - CERtification of Environmental Standards - GmbH, Happurg, Germany, Olena Berezovska, Organic Ukraine NGO of organic producers, Kyiv, Ukraine; Florian Bernardi, Klaus Büchel Anstalt, Mauren, Liechtenstein, www.kba.li; Eva Berre, Ecocert International, L'Isle Jourdain, France, www.ecocert.com; Rommel Aníbal Betancourt Herrera, Agencia de Regulación y Control Fito y Zoosanitario - AGROCALIDAD, Ministerio de Agricultura y Ganadería MAG, Quito, Ecuador, www.agrocalidad.gob.ec; Sandeep Bhargava, OneCert International Pvt. Ltd, Jaipur, Rajasthan, India, www.onecertasia.in; Olivera Bicikliski, Ministry of Agriculture, Forestry and Water Management, Skopje, North Macedonia; Simone Bissig, Research Institute of Organic Agriculture FiBL, Frick, Switzerland; Barbara Böck, NürnbergMesse, Nuremberg, Germany; Thavisith Bounyasouk, Department of Agriculture (DOA), Vientiane, Lao PDR; Lorcan Bourke, Bord Bia - Irish Food Board, Dublin 2, Ireland, www.agriculture.gov.ie; Léna Brisset, IFOAM Organics Europe, Brussels, Belgium, www.ifoam-eu.org; Danila Brunner, Nürnberg Messe; Marie Reine Bteich, CIHEAM Bari, Bari, Italy; Klaus Büchel, Klaus Büchel Anstalt, Mauren, Liechtenstein, www.kba.li; Emanuele Busacca, IFOAM Organics Europe, Brussels, Belgium, www.ifoam-eu.org; Myroslava Bzhestovska, Ministry for Development of Economy, Trade and Agriculture of Ukraine, Kyiv, Ukraine; Liliana Calmațui, Asociația Educație pentru Dezvoltare (AED), Chișinău, Republica Moldova; Celia Carave, Ecocert Group, Sevilla, Spain; Geisel Carvalho de Menezes, Ministry of Finance, Commerce and
Acknowledgements
FiBL & IFOAM – Organics International (2021): The World of Organic Agriculture. Frick and Bonn 15
Blue Economy, Sao Tomé and Príncipe; Jennifer Chang, IFOAM Asia, Seoul, Republic of Korea, www.kfsao.org; Dong-Geun Choi, Korean Federation of Sustainable Agriculture Organizations, Namyangju City, Gyeonggi Province, South Korea; Thomas Cierpka, IFOAM - Organics International, Bonn, Germany, www.ifoam.bio; Genaro Coronel, Servicio Nacional de Calidad y Sanidad Vegetal y de Semillas (SENAVE), Asunción, Paraguay, www.senave.gov.py; Finn Cottle, Soil Association, Bristol, United Kingdom; Eduardo Cuoco, Technology Platform Organics, Brussels, www.tporganics.eu; Joy Daniel, Institut for Integrated Rural Development (IIRD), Aurangabad, Maharashtra, India; Nune Darbinyan, ECOGLOBE - Organic control and certification body, Yerevan, Republic of Armenia, www.ecoglobe.am; Wahyudi David, Universitas Bakrie,; Monique Decker, Administration des services techniques de l'agriculture (ASTA), Luxembourg, www.asta.etat.lu; Giorgia DeSantis, Food and Agriculture Organization of the United Nations (FAO), Rome, Italy; Lauren Dietemann, Research Institute of Organic Agriculture FiBL, Frick, Switzerland; Priyanga S. Dissanayake, Sustainable Agriculture Research and Development Centre, Department of Agriculture; Dóra Drexler, Hungarian Research Institute of Organic Agriculture (ÖMKi), Budapest, Hungary, www.biokutatas.hu; Gita Đurković, Ministry of Agriculture Croatia, Croatia, www.dzs.hr; Pilar M. Eguillor Recabarren, Oficina de Estudios y Politicas Agrarias ODEPA, Santiago Centro, Chile, www.odepa.gob.cl; Pauline Eid Saad, Ministry of Agriculture, Lebanon; Lucy Ellis, Department of Agriculture, Stanley, Falkland Islands (Malvinas), www.agriculture.gov.fk; Carlos Andres Escobar Fernandez, ECONEXOS, Conexion Ecologica, Cali, Colombia, www.econexos.com; Vic Anthony Joseph Fabre, IFOAM Asia, Philippines; Nawal Farkacha, Ministry of Agriculture, Fisheries, Rural development and Forests, Rabat, Morocco; Ditta Fekete, Control Union Certifications B.V., Zwolle, The Netherlands, www.controlunion.com; Li Feng, IFOAM Asia China Office; Sara Fischer, Demeter-International e.V., Office Echterdingen, Echterdingen, Germany; Tobias Fischer, BCS Öko-Garantie GmbH, Nürnberg, Germany, www.bcs-oeko.de; Barbara Fitch Haumann, Organic Trade Association (OTA), Brattleboro, United States of America, www.ota.com; Dorian Fléchet, Agence Bio, Montreuil-sous-Bois, France, www.agencebio.fr; Patricia Flores Escudero, Latin American Office of IFOAM - Organics International, Lima, Peru; Alexandra Forbord, Norwegian Agriculture Agency Landbruksdirektoratet, Oslo, Norway, www.slf.dep.no; Nicole Ford, Australian Organic Ltd, Nundah, Australia; Emmeline Foubert, Certisys, Walhain, Belgium, www.certisys.eu; Sergiy Galashevskyy, Organic Standard, Kyiv, Ukraine; Juan Manuel Gámez, Comisión Interamericana de Agricultura Orgánica (CIAO), Buenos Aires, Argentina, www.ciaorganico.net; Osvaldo Garcia, IMOcert Latinoamerica LTDA, Cochabamba, Bolivia, www.imocert.bio; Maria Gernert, IFOAM Organics Europe, Brussels, Belgium, www.ifoam-eu.org; Maheswar Ghimire, Kathmandu, Nepal; Juan Gilardoni, LETIS S.A., Santa Fe, Argentina; Laurent C. Glin, Benin; Amish Gosai, Textile Exchange, Bangalore, India; R.P.N. Gunaratne, Department of Agriculture, Sustainable Agriculture Research and Development Centre, Makandura, Sri Lanka; Gunnar Gunnarsson, Vottunarstofan Tún ehf., Reykjavik, Iceland, www.tun.is; Owen Gwilliams, Australian Organic Ltd, Nundah, Australia; Zuhair Hasnain, PMAS Arid Agriculture University, Rawalpindi, Pakistan; Abid Ali Hasan, Zakho Small Villages Projects ZSVP; Dohuk City, Dohuk, Iraq: Jan Heusser, Coop Fonds für Nachhaltigkeit, Basel, Switzerland; Serhii Hlushchenko, Ministry for Development of Economy, Trade and Agriculture of Ukraine, Kyiv, Ukraine; Otto Hofer, Bundesministerium für Nachhaltigkeit und Tourismus, Wien, Austria, www.bmlfuw.gv.at; Lee Holdstock, Soil Association, Bristol UK; Tanveer Hossain Shaikh, Asian Productivity Organization (APO), Tokyo, Japan, tanveerbrri.webs.com; Andrea Hrabalová, CTPOA, Brno, Czech Republic; Beate Huber, Research Institute of Organic Agriculture FiBL, Frick, Switzerland, www.fibl.org; Dang Huong, Vietnam Organic Agriculture Association VOAA, Vietnam; Xhona Hysa, IFOAM - Organics International, Bonn, www.ifoam.org; Barbara Jäggin, Swiss State Secretariat for
Acknowledgements
16 FiBL & IFOAM – Organics International (2021): The World of Organic Agriculture. Frick and Bonn
Economic Affairs SECO, Bern, Switzerland; Hakkyun Jeong, Korea Institute of Rural Social Affairs, Chungnam Province, Republic of Korea, www.kfsao.org; ManChul Jung, Korea Institute of Rural Social Affairs, Chungnam Province, Republic of Korea, www.kfsao.org; Joelle Katto-Andrighetto, IFOAM - Organics International, Bonn, Germany, www.ifoam.bio; Olivia Keller, Research Institute of Organic Agriculture FiBL, Frick, Switzerland; Laura Kemper, Research Institute of Organic Agriculture FiBL, Frick, Switzerland; Liudmyla Khomichak, Ministry for Development of Economy, Trade and Agriculture of Ukraine, Kyiv, Ukraine; Cornelia Kirchner, IFOAM - Organics International, Bonn, Germany, www.ifoam.bio; Natalie Kleine-Herzbruch, FiBL Deutschland, Frankfurt; Lyubomyr Klepbach, Center for Environmental Solutions (CES), Minsk, Belarus; Barbara Köcher-Schulz, AMA-Marketing GesmbH AMA, Wien, Austria, www.ama-marketing.at; Milana Kosanovic, Ecocert Balkan, Belgrad, Serbia, www.ecocert.com; Marja-Riitta Kottila, Pro Luomu, Kauniainen, Finland, www.luomu.fi; Daniël Kotzé, Ecocert South Africa, Stellenbosch, South Africa, www.ecocertsouthafrica.com; Eva Lacarce, Agence Bio, Montreuil-sous-Bois, France, www.agencebio.fr; Graciela Lacaze, Comisión Interamericana de Agricultura Orgánica (CIAO), Buenos Aires, Argentina, www.ciaorganico.net; Nicolas Lampkin, Organic Policy, Business and Research Consultancy; Julia Lernoud, IFOAM Board of Directors Argentina; Francesca Lilliu, IFOAM Organics Europe, Brussels, Belgium, www.ifoam-eu.org; Aurora Josefina Lobato García, Subdirectora de Autorización y Aprobación de Organismos de Coadyuvancia, Servicio Nacional de Sanidad, Inocuidad y Calidad Agroalimentaria (SENASICA), Secretaría de Agricultura y Desarrollo Rural (SADER), Ciudad de México, México; Tia Loftsgard, Canada Organic Trade Association, Ottawa, Canada, www.ota.com; Pedro Lopez, PROVOTEC, Madrid, Spain, www.provotec.es; Marly Cristina López Rengifo, Dirección General Agrícola (DGA - MINAGRI), Lima, Peru; Anna Lubovedskaya, Union Organic Farming, Moscow, Russian Federation, www.soz.bio; Virginija Luksiene, Ekoagros, Kaunas, Lithuania, www.ekoagros.lt; Martin Lundø, Statistics Denmark, Copenhagen, Denmark, www.dst.dk; Louise Luttikholt, IFOAM - Organics International, Bonn, Germany; Samia Maamer Belkhiria, Ministère de l'Agriculture, des Ressources Hydrauliques et de la Pêche, Tunis, Tunisia, www.tunisie.com; Hossein Mahmoudi, Environmental Sciences Research Institute, Evin Shahid Beheshti University SBU, Velenjak, Evin, Tehran, Iran; Fernando Maldonado Cestona, Dirección General de Sanidad Vegetal y Animal, El Salvador; John Manhire, The AgriBusiness Group, Lincoln, New Zealand, www.agribusinessgroup.com; Karen Mapusua, Pacific Community, SPC, Suva, Fiji, www.spc.int; Félix Oswaldo Maquera Cuayla, Servicio Nacional de Sanidad Agraria (SENASA), Ministerio de Agricultura y Riego (MINAGRI), Lima, Peru; Roberto Maresca, Controllo e Certificazione Prodotti Biologic CCPB, Bologna; Ayumi Matsuura, Cambodian Organic Agriculture Association (COrAA), Phnom Penh, Cambodia, www.coraa.org; Virgínia Mendes Cipriano Lira, Ministério da Agricultura, Pecuária e Abastecimento (DTECSDAMAPA), Brasilia, Brazil; Manoj Kumar Menon; International Competence Centre for Organic Agriculture ICCOA, Rajarajeshwarinagar, Bangalore, India; Dorota Metera, BIOEKSPERT, Warszawa, Poland, www.bioekspert.waw.pl; Merit Mikk, Centre of Ecological Engineering - Ökoloogiliste Tehnoloogiate Keskus, Tartu, Estonia, www.ceet.ee; Jelena Milic, Ministry of Agriculture, Forestry and Water Economy, Belgrade, Republic of Serbia; Eugene Milovanov, Organic Federation of Ukraine, Kyiv, Ukraine, organic.com.ua; Rodrigo Misiac, Argencert, Buenos Aires, Argentina; Satoko Miyoshi, Global Organic Textile Standard (GOTS) Japan, Tokyo, Japan, www.oci2010.org; Nadejda Mocanu, Cultivating New Frontiers in Agriculture, Chisinau, Moldova, www.cnfa.org; Bram Moeskops, IFOAM Organics Europe, Brussels, Belgium, www.ifoam-eu.org; Carolin Möller, NASAA Certified Organic, Stirling, Australia; Flávia Moura e Castro, IFOAM - Organics International, Bonn, Germany, www.ifoam.org; Arijana Mušić, Organska Kontrola (OK), Sarajevo, Bosnia & Herzegovina; Mohammed Mutarad Aloun, Ministry of Climate Change and Environment of the United Arab Emirates, United Arab Emirates,
Acknowledgements
FiBL & IFOAM – Organics International (2021): The World of Organic Agriculture. Frick and Bonn 17
www.moccae.gov.ae; Alex Mutung, AfrONet, Dar es Salaam, Tanzania; Từ Thị Tuyết Nhung, Vietnam Organic Agriculture Association, Hanoi, Vietnam, www.vietnamorganic.vn; Urs Niggli, Agroecology.Science, Frick, Switzerland, www.agroecology.science; Ramón Ernesto Noguera García, Instituto de Protección y Sanidad Agropecuaria IPSA, Departamento de Inspección Certificación Fitosanitaria, Managua, Nicaragua; Fatima Obaid Saeed, Ministry of Environment and Water of the United Arab Emirates, United Arab Emirates; Sharon Ong, Ecocert South-East Asia, Singapore; Susanne Padel, Thünen Institute, Germany; Amresh Pandey, Ecocert; Aurangabad, Maharashtra, India; Elena Panichi, European Commission, Agriculture & Rural Development, Brussels, Belgium; Vitoon Panyakul, Green Net, Bangkok, Thailand, www.greennet.or.th; Ejvind Pedersen, Landbrug & Fødevarer, Copenhagen, Denmark, www.lf.dkOekologi.aspx; Eliza Petrosyan-Sudzilovskaya, ECOGLOBE - Organic control and certification body, Yerevan, Republic of Armenia, www.ecoglobe.am; Diego Pinasco, Servicio Nacional de Sanidad y Calidad Agroalimentaria SENASA, Buenos Aires, Argentina; Roberto Pinton, Pinton Organic Consulting, Padova, Italy; Ritu Priya, OneCert International Pvt. Ltd, Jaipur, Rajasthan, India, www.onecert.com; Natalie Prokopchuk, SECO-FiBL-SAFOSO Swiss-Ukrainian Program “Higher Value Added Trade from the Organic and Dairy Sector in Ukraine”, Kyiv, Ukraine, www.qftp.org; Andrijana Rakočević, Ministry of Agriculture and Rural Development, Podgorica, Crna Gora, Montenegro; Brayène Ramanantsoa, Ecocert, Antananarivo, Madagascar; Juan Carlos Ramirez, Servicio Nacional de Sanidad y Calidad Agroalimentaria SENASA, Buenos Aires, Argentina, www.senasa.gov.ar; Hans Ramseier, Bio Suisse, Basel, Switzerland, www.bio-suisse.ch; Pia Reindl, AMA-Marketing GesmbH AMA, Wien, Austria, www.ama-marketing.at; Michel Reynaud, Ecocert International, Office, L'Isle Jourdain, France, www.ecocert.com; Kurt Riedi, Research Institute of Organic Agriculture FiBL, Frick, Switzerland; Nathalie Rison Alabert, Agence Bio, Montreuil-sous-Bois, France, www.agencebio.fr; Christian Robin, Swiss State Secretariat for Economic Affairs, Bern, Switzerland; Fermín Vicente Romero Houlstan, Dirección Nacional de Sanidad Vegetal; Ministerio de Desarrollo Agropecuario (MIDA), Panamá, República de Panamá, www.mida.gob.pa; Monica Rubiolo, Swiss State Secretariat for Economic Affairs, Bern, Switzerland; Cecilia Ryegård, Ekoweb, Sweden; Olle Ryegård, Ekoweb, Sweden; Ayman Saad Al-Ghamdi, Organic Agriculture Department, Saudi Arabia; Amarjit Sahota, Ecovia Intelligence, London, United Kingdom, www.ecoviaint.com; Gregory Sampson, International Trade Centre (ITC), Geneva, Switzerland; Sisigué Arsène Sanou, Ecocert Burkina Faso, Ougadougou, Burkina Faso; Diana Schaack, Agrarmarkt Informations-Gesellschaft mbH, Bonn, Germany, www.ami-informiert.de; Aender Schanck, OIKOPOLIS Groupe, Munsbach, Luxembourg, www.oikopolis.lu; Silvia Schmidt, IFOAM Organics Europe, Brussels, Belgium, www.ifoam-eu.org; Knut Schmidtke, Forschungsinstitut für biologischen Landbau FiBL, Frick, www.fibl.org; Claudine Schmit, Administration des services techniques de l'agriculture (ASTA), Luxembourg, www.asta.etat.lu; Bernhard Schulz, CERES - CERtification of Environmental Standards - GmbH, Happurg, Germany, www.ceres-cert.com; Hana Šejnohová, Institute of agricultural economics and information, Brno, Czech Republic, www.uzei.cz; Andreas Selearis, Department of Agriculture (MOA), Nicosia, Cyprus, www.moa.gov.cy; Dheeraj Sharma, OneCert International Pvt. Ltd, Jaipur, Rajasthan, India, www.onecertasia.in; Elene Shatberashvili, Elkana - Biological Farming Association, Akhaltsikhe, Georgia, www.elkana.org.ge; Christoph Simpfendörfer, Demeter-International e.V., Office Echterdingen, Echterdingen, Germany; Harpreet Singh Sondh, Control Union Certifications B.V., Zwolle, www.controlunion.com www.controlunion.com; Anamarija Slabe, Institut za trajnostni razvoj, Lubljana, Slovenia, www.itr.si; Nicolette van der Smissen, Consultant for Organic Production, Feres, Greece; Manjo Smith, Namibian Organic Association NOA, Okahandja, Namibia, www.noa.org.na; Francesco Solfanelli, Università Politecnica Marche, Ancona, Italy, www.univpm.it; Michael Stadler,

Acknowledgements
18 FiBL & IFOAM – Organics International (2021): The World of Organic Agriculture. Frick and Bonn
CERES - CERtification of Environmental Standards - GmbH, Happurg, Germany, www.ceres-cert.com; Marcela Stahil, Ministry of Agriculture, Regional Development and Environment of Moldova, Department for Organic Production and Products of Origin, Chişinău, Moldova; Franziska Staubli, Bioinspecta, Frick, Switzerland, www.bio-inspecta.ch; Evonne Tan, Textile Exchange, Kuala Lumpur, Malaysia; Ilse Timmermans, Departement Landbouw en Visserij, Brussels, Belgium; Thanh Trinh, Vietnam Organic Agriculture Association VOOA, Hanoi, Vietnam; Bence Truly, Hungarian Research Institute of Organic Agriculture (ÖMKi), Budapest, Hungary, www.biokutatas.hu; Liesl Truscott, Textile Exchange, Bath, United Kingdom; Emma Tsessue, Ecocert SAS, L'Isle Jourdain, France, www.ecocert.com; Kesang Tshomo, Ministry of Agriculture MOA, Thimphu, Bhutan, www.moa.gov.bt; Daava Tungalag, Ministry of Food Agriculture and Light industry of Mongolia, Ulaanbaatar, Mongolia; Tal Weil Tzameret, Ministry of Agriculture & Rural Development, Plant Protection & Inspection Services (PPIS), Israel; Francesco Tubiello, Food and Agriculture Organization of the United Nations (FAO), Rome, Italy; Ray Tzeng, Organic Center, National Ilan University (NIU), Yilan City, Taiwan; Edgardo Uychiat, Negros Island Sustainable Agriculture Research & Development, The Philippines; Miriam van Bree, Bionext, JC Ede, The Netherlands, bionext.nl; Marijke van Schagen, European Commission, Directorate-General for Agriculture and Rural Development, Bruxelles, Belgium; Frederica Varini, IFOAM - Organics International, Bonn, www.ifoam.org; Jelena Vasiljevic, Ministry of Agriculture Serbia, Belgrade, Serbia, www.minpolj.gov.rs; Airi Vetemaa, Estonian Organic Farming Foundation EOFF, Tartu, Estonia, www.lzuu.lt; Rita Villarreal, Dirección Nacional de Sanidad Vegetal; Ministerio de Desarrollo Agropecuario (MIDA), Panamá, República de Panamá, www.mida.gob.pa; Venancia Wambua, AfrONet, Dar es Salaam, Tanzania; Joseph Wozniak, International Trade Centre (ITC), Geneva, Switzerland; P.I. Yapa, Sabaragamuwa University of Sri Lanka; David Yavruyan, Eco Consulting Group; Suet Yin Siew, Textile Exchange, India; Qiao Yuhui, China Agricultural University, Beijing, China, www.cau.edu.cnzihuan; Valentyna Zaiets, Ministry for Development of Economy, Trade and Agriculture of Ukraine, Kyiv, Ukraine; Raffaele Zanoli, Università Politecnica delle Marche UNIVPM, Ancona, www.univpm.it; José Zapata, Oficina de Control Agricultura Organica, Direccion de Certificacion de Productos Agropecuarios (DICERT-RD), Santo Domingo, Republica Dominicana, www.agricultura.gob.do; Diana Zeidan, Canada Organic Trade Association, Ottawa, Canada, www.ota.com; Lisha Zheng, Ecocert China, Beijing, China; Zhejiang Zhou, IFOAM Asia, China, www.ifoam.org; Darko Znaor, Independent Consultant, Zagreb, Croatia; Silvia Zucconi, Nomisma - Economic Research Institute, Bologna, Italy
Statistics › Key Indicators
FiBL & IFOAM – Organics International (2021): The World of Organic Agriculture. Frick and Bonn 19
Organic Agriculture: Key Indicators and Top Countries
Indicator World Top countries
Countries with organic activities1 2019: 187 countries
Organic agricultural land 2019: 72.3 million hectares (1999: 11 million hectares)
Australia (35.7 million hectares) Argentina (3.7 million hectares) Spain (2.4 million hectares)
Organic share of total agricultural land 2019: 1.5 %
Liechtenstein (41.0 %) Austria (26.1 %) São Tomé and Príncipe (24.9 %)
Wild collection and further non-agricultural areas
2019: 35.1 million hectares (1999: 4.1 million hectares)
Finland (4.6 million hectares) Zambia (3.2 million hectares) Namibia (2.6 million hectares)
Producers 2019: 3.1 million producers (1999: 200’000 producers)
India (1'366'226) Uganda (210’353) Ethiopia (203'602)
Organic market2 2019: 106.4 billion euros (2000: 15.1 billion euros)
US (44.7 billion euros) Germany (12.0 billion euros) France (11.3 billion euros)
Per capita consumption 2019: 14.0 euros Denmark (344 euros) Switzerland (338 euros) Luxembourg (265 euros)
Number of countries with organic regulations 2019: 108 countries
Number of affiliates of IFOAM – Organics International 2020: 719 affiliates
Germany: 79 affiliates India: 52 affiliates USA: 48 affiliates Italy: 46 affiliates
Source: FiBL survey 2021, based on national data sources, data from certifiers and IFOAM – Organics International
1 Where the designation "country" appears in this book, it covers countries and territories, see UNSTAT website http://unstats.un.org/unsd/methods/m49/m49regin.htm. 2 Please note that there are some differences in organic food sales figures from Ecovia Intelligence and those from FiBL due to different methodologies. According to Ecovia Intelligence, global retail sales reached over 112 billion US dollars in 2019. One euro corresponded to 1.1195 US dollars in 2019 according to the European Central Bank.
The World of Organic Agriculture › Summary
20 FiBL & IFOAM – Organics International (2021): The World of Organic Agriculture. Frick and Bonn
The World of Organic Agriculture 2021: Summary
HELGA WILLER,1 CLAUDIA MEIER,2 BERNHARD SCHLATTER,3 LAUREN DIETEMANN,4 LAURA KEMPER5 AND JAN TRÁVNÍČEK6
The latest available data on organic agriculture worldwide show that the year 2019 was another good year for global organic agriculture. According to the latest FiBL survey on organic agriculture worldwide, the organic farmland and organic retail sales continued to grow and reached another all-time high, as shown by the data from 187 countries (data as of the end 2019). Consolidated data for 2020, which were not available at the time of writing this report, are expected to show the first impacts of the COVID-19 pandemic on organic markets. This data will be released by the countries during 2021 and made available in the 2022 edition of this report.
More than 72.3 million hectares of organic farmland
In 2019, 72.3 million hectares of organic agricultural land, including in-conversion areas, were recorded. The regions with the largest organic agricultural land areas are Oceania (35.9 million hectares, which is half the world’s organic agricultural land) and Europe (16.5 million hectares, 23 percent). Latin America has 8.3 million hectares (11 percent) followed by Asia (5.9 million hectares, 8 percent), North America (3.6 million hectares, 5 percent) and Africa (2 million hectares, 3 percent).
Australia has the largest area
The countries with the most organic agricultural land are Australia (35.7 million hectares), Argentina (3.7 million hectares) and Spain (2.4 million hectares).
Globally, 1.5 percent of the farmland is organic
Currently, 1.5 percent of the world’s agricultural land is organic. The highest organic shares of the total agricultural land, by region, are in Oceania (9.6 percent) and Europe (3.3 percent; European Union 8.1 percent).
Liechtenstein has the highest organic share with 41.0 percent
Some countries reach far higher shares than the global share: Liechtenstein (41.0 percent) and Austria (26.1 percent) have the highest organic shares. In sixteen countries, 10 percent or more of the agricultural land is organic.
1 Dr. Helga Willer, Research Institute of Organic Agriculture FiBL, Frick, Switzerland, www.fibl.org 2 Claudia Meier, Research Institute of Organic Agriculture FiBL, Frick, Switzerland, www.fibl.org 3 Bernhard Schlatter, Research Institute of Organic Agriculture FiBL, Frick, Switzerland, www.fibl.org 4 Lauren Dietemann, Research Institute of Organic Agriculture FiBL, Frick, Switzerland, www.fibl.org 5 Laura Kemper, Research Institute of Organic Agriculture FiBL, Frick, Switzerland, www.fibl.org 6 Jan Trávníček, Research Institute of Organic Agriculture FiBL, Frick, Switzerland, www.fibl.org
The World of Organic Agriculture › Summary
FiBL & IFOAM – Organics International (2021): The World of Organic Agriculture. Frick and Bonn 21
Growth in organic farmland - Increase of 1.1 million hectares or 1.6 percent
Organic farmland increased by 1.1 million hectares or 1.6 percent in 2019. Many countries reported a significant increase, for instance, India (18.6 percent increase; over 0.36 million hectares more) and Kazakhstan (18.6 percent increase; almost 0.1 million hectares more). Increase of organic farmland in almost all regions
In 2019, organic agricultural land increased in Africa, Europe, Latin America, and Northern America (Table 6). The agricultural area decreased in Asia (-7.1 percent, -0.45 million hectares), mainly due to a drop in organic areas reported from China, and Oceania (-0.3 percent, -0.12 million hectares). The highest absolute growth was in Europe (+5.9 percent, +0.9 million hectares), followed by Northern America (+9.1 percent, +0.30 million hectares) and Latin America (+3.5 percent, +0.28 million hectares).
Apart from land dedicated to organic agriculture, there are further areas of organic land dedicated to other activities. The largest part of these is wild collection areas and areas for beekeeping. Further non-agricultural areas include aquaculture, forests, and grazing areas on non-agricultural land. These areas totalled 35.0 million hectares, and all the organic areas together summed up to 107.4 million hectares.
Growth in most major crop groups
Land use and crop details were available for over 92 percent of the organic agricultural land. Unfortunately, some countries with very large organic areas, such as Brazil and India, had little or no information on their land use (see page 75).
Over two-thirds of the organic agricultural land was grassland/grazing areas (almost 49 million hectares), which increased in 2019 by 1.2 percent.
With over 13.1 million hectares, arable land constitutes 18 percent of the organic agricultural land. A decrease of 1.7 percent since 2018 was reported, mainly due to a decrease of organic arable land reported from China. Most of this category of land was used for cereals including rice (5.1 million hectares), followed by green fodder from arable land (almost 3.2 million hectares), oilseeds (1.7 million hectares), dry pulses and vegetables.
The significant growth in organic cotton production seen in 2017/18, when global fibre volumes rose 56 percent, continued into 2018/19 with a further 31 percent growth, according to the Textile Exchange. Global production reached 239´787 metric tons. Estimates show that the current growth trend will continue next year, though to a slightly lesser degree, with a ten percent growth expected. Globally, an estimated 222´134 farmers were growing certified organic cotton in 2018/19, spread across 19 countries and 418´935 hectares of certified land. For more information, see Barsley et al. on page 130.
Permanent crops account for seven percent of the organic agricultural land, amounting to over 4.7 million hectares. Compared to the previous survey, an increase of more than 17´000 hectares, or 0.4 percent, was reported. The most important crops are olives, with nearly 0.9 million hectares or 19 percent, coffee (over 0.7 million
The World of Organic Agriculture › Summary
22 FiBL & IFOAM – Organics International (2021): The World of Organic Agriculture. Frick and Bonn
hectares or 15 percent of the organic permanent cropland), nuts (0.6 million hectares or 13 percent), grapes (0.5 million hectares or 10 percent) and cocoa (almost 0.4 million hectares or 8 percent) (see page 71). Organic producers on the rise – 3.1 million producers in 2019
There were at least 3.1 million organic producers in 2019.1 Fifty-one percent of the world’s organic producers are in Asia, followed by Africa (27 percent), Europe (14 percent) and Latin America (7 percent). The countries with the most producers are India (1’366’226), Uganda (210’353) and Ethiopia (203’602) (page 58). There has been an increase in the number of producers of more than 347’000, or 12.5 percent, compared to 2018.
Global market and EU organic imports Global market reached more than 100 billion euros
Organic food and drink sales reached more than 106 billion euros, according to FiBL (page 64)2,3 in 2019. In 2019, the countries with the largest organic markets were the United States (44.7 billion euros), Germany (12.0 billion euros), and France (11.3 billion euros). The largest single market was the United States (42 percent of the global market), followed by the European Union (41.4 billion euros, 39 percent) and China (8.5 billion euros, 8.0 percent). The highest per-capita consumption in 2019, with 344 euros, was found in Denmark. The highest organic market shares were reached in Denmark (12.1 percent), Switzerland (10.4 percent) and Austria (9.3 percent) (See the chapter on the FiBL survey on the global market, page 64).
Effect of the pandemic on the global organic market
Although North America and Europe generate most sales, their share of the total market is shrinking (Sahota (page 136). The coronavirus crisis is predicted to accelerate this trend as more regional markets for organic foods develop. In particular, the share of developing countries, such as China, India, Brazil and Indonesia, is likely to grow at a fast rate in the coming years. The pandemic, which began in spring 2020, has had a profound impact on our daily lives, as well as on the organic food industry. Consumers are turning to organic foods as they look more closely at personal health, wellness and nutrition. Organic is likely to benefit as the food industry transitions to a post-COVID world, writes Sahota (page 136). According to him, the coronavirus pandemic is likely to change the global organic food industry with several trends affecting the further
1 Please note that some countries report only the numbers of companies, projects, or grower groups, which may each comprise a number of individual producers. The number of producers should, therefore, be treated with caution, and it may be assumed that the total number of organic producers is higher than that reported here. 2 Please note that there are some differences in organic food sales figures from Ecovia Intelligence and those from FiBL due to different methodologies. According to Ecovia Intelligence, global retail sales reached over 112 billion U.S. dollars in 2019. 3 One euro corresponded to 1.1195 U.S. dollars in 2019 according to the European Central Bank.

The World of Organic Agriculture › Summary
FiBL & IFOAM – Organics International (2021): The World of Organic Agriculture. Frick and Bonn 23
development of organic agriculture in various ways. Examples of such changes include the de-globalisation of food supply chains, increasing importance of food security, more government support; move towards traceability and transparency in food supply chains, changing consumer behaviour and increased importance of online retailing.
Organic imports in the European Union
The European Union, which is the second-biggest organic market, provided data on its organic imports, showing the key import products and key importing countries (based on volume in metric tons). In 2019, the EU imported a total of 3.2 million tonnes of organic agri-food products. Imports of tropical fruit (fresh or dried), nuts and spices represented the single biggest category, totalling 885’930 tonnes or 27.3 percent of total imports, followed by oilcakes, cereals other than wheat, as well as rice, and wheat. China is the biggest supplier of organic agri-food products to the EU, with 433´705 tonnes; 13.4 percent of the total organic import volume. Ukraine, the Dominican Republic, and Ecuador each have a 10 percent share of the total organic import volume. For more information, see the contribution about the EU organic imports on page 140.
Standards, regulations, policy support
According to the latest IFOAM survey on organic regulations, 72 countries had fully implemented organic regulations as of 2020. Twenty-two countries had regulations, which were not fully implemented, while 14 unregulated countries were drafting legislation. Among the countries that newly passed organic regulations in 2020 are Madagascar and Egypt. Some countries are majorly revising their existing regulations, among these are the European Union and the United States. Countries that have concluded significant amendments of their existing regulations in 2020 include the Philippines and Peru. For more information, see the chapter by Kirchner et al., page 152.
Participatory Guarantee Systems (PGS) are locally focused quality assurance systems. PGS have proven to be an affordable alternative to third-party certification, an effective tool to develop local markets for organic produce and are particularly appropriate for small-scale farmers. Despite the difficulties related to the impact of the COVID-19 pandemic in 2020, the number of PGS initiatives and producers involved and certified by them has been growing worldwide. They represent today a well-established guarantee system for organic agriculture in many countries. The overall trend towards an increase in the number of PGS initiatives and producers certified is maintained. To date, IFOAM – Organics International has recorded in its PGS database 235 PGS initiatives in 77 countries, with at least 1’153’220 producers involved and 1’110’964 producers certified. It is estimated that these producers manage over 755’000 ha of land (area under organic management that is PGS certified is not available for all PGS initiatives and countries ). For more information, see the chapter by Moura e Castro et al. on page 158.
Statistics provided by Demeter International show that there are more than 4’400 Demeter farmers worldwide with over 220’000 hectares in 62 countries (July 2020).
The World of Organic Agriculture › Summary
24 FiBL & IFOAM – Organics International (2021): The World of Organic Agriculture. Frick and Bonn
Demeter International was founded in 1997 and currently has 19 members and four guest members from Europe, America, Africa, New Zealand and India. For details, see the article by Simpfendörfer and Fischer, page 165.
When it comes to fostering organic production and consumption, of particular interest to the organic sector is adopting sustainability-oriented public food procurement policies and standards applied to food and catering services in public institutions. Such measures can shift buying power to support environmental, health and socio-economic objectives in line with the principles of organic agriculture. As shown with several examples from all contents, public food procurement can help create new and stable markets for organic products, stimulate changes in food habits and foster conversion to organic agriculture. For more information, see the article by Varini and Hysa, page 170.
Organic in the Continents
Africa
There were more than 2 million hectares of certified organic agricultural land in Africa in 2019. Compared to 2018, Africa reported 177’054 hectares more, a 9.5 percent increase. There were at least 850’000 producers. Tunisia was the country with the largest organic area (with almost 287’000 hectares in 2018), and Uganda had the largest number of organic producers (more than 210’000). The country with the highest organic share of the total agricultural land in the region was the island state São Tomé and Príncipe, with 24.9 percent of its agricultural area being organic. The majority of certified organic products in Africa are destined for export markets. Key crops are coffee, olives, cocoa, nuts, oilseeds, and cotton (see page 189). Five countries in Africa have legislation on organic agriculture, and five countries are drafting legislation. Six countries have a national standard but no organic legislation.
In Africa, the Ecological Organic Agriculture Initiative realised several achievements during 2020. Geographical coverage expanded to include Rwanda as the ninth country. The value chains and market development approach was adopted with all participating partners in nine countries in East and West Africa. An important current project is the Knowledge Center for Organic Agriculture in Africa, which aims at ensuring knowledge hubs in West, Eastern, North and Southern Africa and later also in Central Africa. These hubs are successfully introduced as an innovative strategy for promoting organic agriculture with actors in Africa. The African Organic Network AfrONet as custodian of the African organic movements and organic sector development aims to strengthen and support national, regional and continental networks, overseeing the development and growth of the Ecological Organic Agriculture Initiative for Africa. AfrONet has been bringing together all the networks, partners and other stakeholders under the African Organic Conference platform. Morocco will be hosting the 5th Conference in Marrakesh in November 2021. Furthermore, planning for the 6th West African Organic Conference (WAOC) to be held in Burkina Faso from October 13 to 16, 2021. For more information, see the chapter by Amudavi, page 180.
The World of Organic Agriculture › Summary
FiBL & IFOAM – Organics International (2021): The World of Organic Agriculture. Frick and Bonn 25
Asia
The total area dedicated to organic agriculture in Asia was more than 5.9 million hectares in 2019. There were 1.4 million producers, most of which were in India. The leading countries by area were India (2.3 million hectares) and China (over 2.2 million hectares). Timor-Leste had the highest proportion of organic agricultural land (8.5 percent) (page 189). Twenty-one countries in the region have legislation on organic agriculture, and seven countries are drafting legislation.
Together with the rest of the world, Asia has suffered much due to the effects of COVID-19, write Hossain et al. (page 198). As traditional markets were closed and schools, offices and other establishments were shut down, every stakeholder across the supply chain was affected in one way or another. However, the resiliency of many countries in Asia was highlighted, as they searched for ways to mitigate the effects of the pandemic. In South Korea, the closure of schools meant the cessation of school meals, which was a significant source of income for many organic farmers. In response, a Countermeasures Committee for COVID-19 was established, providing thousands of food packages of environmentally-friendly farm products to more than 6’000 self-quarantined people. In Japan, there was a major development in the Basic Plan for Agriculture and Management, aiming to triple the number of organic farmers and organic lands by 2030. In Indonesia, the National Medium-Term Development Plan IV (2020-2024) will increase the policies related to organic agriculture. Finally, the Philippines had one of the most significant milestones in organic agriculture with the amendment of the Organic Act of 2010, including Participatory Guarantee Systems (PGS) under the country’s national organic standards.
In 2020, IFOAM Asia expanded the networking activities of the Asian Local Governments for Organic Agriculture (ALGOA), which celebrated its 5th anniversary. The 6th ALGOA Summit was a historic occasion as ALGOA took the initiative in linking up with the International Network of eco-regions and other European partners, to launch the Global Alliance of Organic Districts (GAOD). Another significant activity was that the Asian Organic Youth Forum took the initiative to expand its organic youth network globally and launched the Young Organics Global Network in September 2020. More information can be found in the chapter by Hossain et al., page 198.
Europe
As of the end of 2019, 16.5 million hectares of agricultural land in Europe (European Union: 14.6 million hectares) were managed organically by over 430’000 producers (European Union: almost 344’000). In Europe, 3.3 percent of the agricultural area was organic (European Union: 8.1 percent). Organic farmland has increased by over 0.97 million hectares compared to 2018. The countries with the largest organic agricultural areas were Spain (2.4 million hectares), France (2.2 million hectares) and Italy (2.0 million hectares). In twelve countries, at least 10 percent of the farmland was organic: Liechtenstein has the lead (41.0 percent), followed by Austria (26.1 percent) and Estonia (22.3 percent). Retail sales of organic products totalled 45.0 billion euros in 2019 (European Union: 41.4 billion euros), an increase of 8.0 percent since 2018. The largest
The World of Organic Agriculture › Summary
26 FiBL & IFOAM – Organics International (2021): The World of Organic Agriculture. Frick and Bonn
market for organic products in 2019 was Germany, with retail sales of 12.0 billion euros, followed by France (11.3 billion euros) and Italy (3.6 billion euros) (see the article by Trávníček et al., page 229).
In December 2019, the European Commission unveiled the European Green Deal, a new growth strategy aiming for Europe to be the first climate-neutral continent by becoming a modern, resource-efficient economy. The Farm to Fork (F2F) strategy, which was published in April 2020, is part of the European Green Deal and includes a target of increasing the total of the EU’s agricultural land under organic farming to least 25% by 2030 and a significant increase in organic aquaculture. As part of the F2F strategy, the Commission pledged to review the EU promotion programme for agricultural and food products to enhance its contribution to sustainable production and consumption. For more information about the Farm to Fork strategy, the Common Agricultural Policy and research updates, see the article by FiBL and IFOAM Organics Europe on page Fehler! Textmarke nicht definiert..
Latin America and the Caribbean
In Latin America, over 224’000 producers managed almost 8.3 million hectares of agricultural land organically in 2019. This constituted 11 percent of the world’s organic land and 1.2 percent of the region’s agricultural land. The leading countries were Argentina (3.7 million hectares), Uruguay (2.1 million hectares) and Brazil (1.3 million hectares). The highest organic shares of total agricultural land were in Uruguay (15.3 percent), French Guiana (11.3 percent) and the Dominican Republic (5.5 percent). Many Latin American countries remain important exporters of organic products such as coffee, cocoa, and bananas. In Argentina and Uruguay, temperate fruit and meat are key export commodities. Nineteen countries in the region have legislation on organic agriculture, and two countries are drafting legislation. Brazil has the largest market for organic products in Latin America. Like Asia, demand is coming from a growing middle class seeking healthy, nutritious foods.
In the last 20 years, the organic agriculture sector has developed, especially organised export-oriented family farmers focused on international trade to supply markets in the European Union, the United States, Canada and Japan. Organic production of coffee, cocoa, tropical fruits (banana, mango), ginger, turmeric and Andean grains stand out. This is especially noteworthy in the industry of fine aroma cacao and chocolate – here the cacao value chain has been developed based on native genetic resources and the organisation of cacao growers giving special attention to the quality of the final product. Notable developments which took place in 2020 included the implementation of the Memorandum of Understanding on Organic Products between Chile and Brazil, and in Mexico, the competent Mexican authority SENASICA is also developing equivalence agreements with its main trade partners, the United States, Canada and the EU. The equivalence will allow the free flow of Mexican organic products that hold the National Organic Seal to the world's most competitive markets. For more information, see the chapter by Flores on page 268.

The World of Organic Agriculture › Summary
FiBL & IFOAM – Organics International (2021): The World of Organic Agriculture. Frick and Bonn 27
The Inter-American Commission for Organic Agriculture (CIAO), which comprises Competent Authorities for Control of Organic Agriculture in the region, is a technical entity created in July 2008 with the aim of contributing to the development of organic agriculture and organic trade in countries in the Americas. In May 2020, CIAO and IFOAM - Organics International signed a Memorandum of Understanding to strengthen the collaboration among the parties. Since 2019, CIAO and the Research Institute of Organic Agriculture FiBL have been working together to collect statistical data on organic production. For more information, see the article by Lacaze & Gámez, page 272.
North America
In North America, over 3.6 million hectares of farmland were managed organically in 2019. Of these, 2.3 million were in the United States and 1.3 million in Canada, representing 0.8 percent of the total agricultural area in the region (see page 291).
New records were achieved in both the US organic food market and organic non-food market. Organic food sales reached 50.1 billion US dollars (approx. 44.7 billion euros), an increase of 4.5 percent compared to 2018. Sales of organic non-food products jumped by 8.7 percent to 6 billion US dollars. Almost six percent of the food sold in the United States is now organic.
In the United States (although 2020 numbers are not yet available), the COVID-19 pandemic has had dramatic consequences for the organic sector. As shoppers searched for healthy, clean food to feed their families, organic proved to be the food of choice for home consumption. Demand for organic fresh produce grew substantially from March onward as consumers continued at-home eating in the face of restaurant closures. In fact, the Organic Produce Network predicted double-digit growth of fresh produce sales in its analysis during the year. Fresh fruit and vegetable sales averaged 18 percent year-over-year growth in each of the first three quarters. Another notable development were the Organic Trade Association’s ‘Organic Fraud Prevention Solutions’ programme and a fraud-fighting training package from USDA. Furthermore, the USDA’s National Organic Program (NOP) published its Strengthening Organic Enforcement and Oversight proposed rule to support the continued growth of the organic market and improve oversight at critical links in the supply chain. For more information, see the article by Haumann on page 284.
Canada’s total organic market (including food and non-food items) reached 6.93 billion Canadian dollars (approx. 4.7 billion euros), up from 3.5 billion in 2012, with a compound annual growth rate of 8.7 percent. Statistics indicate the market share of organic food and beverages sold through mainstream retailers has grown from 2.6 to 3.2 percent (2019).
In Canada, the most recent State of Organic Performance Report outlines the current forms of support for the organic sector from Federal, Provincial and Territorial jurisdictions and provides a broad set of summarised recommendations for each level of government. One finding includes that while there is great consumer confidence in the Canada Organic Regime, and recognition is growing for the Canadian Organic

The World of Organic Agriculture › Summary
28 FiBL & IFOAM – Organics International (2021): The World of Organic Agriculture. Frick and Bonn
Logo, the lack of comprehensive programming assistance at the provincial/territorial level leaves a patchwork of provincially applied standards for intra-provincial trade. There is also a need for the federal government to provide more robust and comprehensive data on production, imports, exports and consumption, which are paramount for good decision making on government objectives related to climate change. For more information, see the chapter by Loftsgard on page 289.
Oceania
This region includes Australia, New Zealand, and the Pacific Island states. Altogether, there were over 18’000 producers, managing almost 36.0 million hectares. This constituted 9.7 percent of the region's agricultural land and half of the world’s organic land. More than 99 percent of the organic land in the region is in Australia (35.7 million hectares, most of which is extensive grazing land), followed by New Zealand (almost 89’000 hectares) and Samoa (over 41’000 hectares). The highest organic shares of all national agricultural land were in Samoa (14.5 percent), followed by Australia (9.9 percent), Fiji (5.5 percent), Vanuatu (4.5 percent), Solomon Islands (3.5 percent) and French Polynesia (3.4 percent). Four countries in Oceania have legislation on organic agriculture, and twelve countries have a national standard but no organic legislation.
In Australia, fueled by years of drought, hot summer temperatures and an abundance of fuel loads, such as dry leaf litter, over ten million hectares of bushland were incinerated. For some of the hardest-hit regions, re-establishing their organic status will take much time, and some have lost entire orchards and native tea tree plantations. Many of these operators will be without production for years. Due to the drought and shortages of available feed for many livestock producers, the year 2020 has seen the largest demand for organic hay and grain for at least a decade with livestock fodder. Following on from the improvements to the regulatory system for exports, in December 2020, the Australian Minister for Agriculture, Water and the Environment has requested his Department appoint an Organics Industry Advisory Group to investigate the creation of a nationwide regulatory framework for the production and sale of organic products domestically. The group will review whether the current domestic regulatory framework is fit for purpose and better understand the potential of improving current regulations to facilitate the organic industry's development and growth. For more information about Australia, see the report by Ford on page 298.
While generally, certification continues to expand across the Pacific, some countries are reflecting a drop in certified land in recent years. This can be attributed to natural disasters affecting perennial crops, such as coconuts, causing the licensees to suspend or leave certification programs until their crops produce again. Governments are becoming more and more interested in creating a supportive policy environment. A significant development is regional and national agencies and development partners increasingly recognising the value of organic agriculture as a development tool for the Pacific islands context. The local market for organic products is expected to continue to

The World of Organic Agriculture › Summary
FiBL & IFOAM – Organics International (2021): The World of Organic Agriculture. Frick and Bonn 29
expand as the tourism and hospitality industries in the Pacific Islands develop their brand for organic and sustainability (see the chapter by Mapusua, page 302).
Outlook
The year 2020 will be remembered for the global COVID-19 pandemic, the impact of which is likely to be felt for a much longer time, writes Louise Luttikholt, executive Director of IFOAM – Organics International. According to her, the crisis revealed the vulnerability of global food systems and that the transition to sustainable and resilient food systems is needed; in COVID times, it almost looked as if food was regarded as medicine. It remains to be seen if the 2021 United Nation’s Food Systems Summit, aiming to ‘launch bold and new actions to transform the way the world produces and consumes food’, will take these signals seriously. For more information, see the chapter by Luttikholt on page 310.
IFOAM Organic World Congress and Statistics pre-conference
The 20th Organic World Congress (OWC), originally scheduled to take place in 2020, will be held from September 6 to 10, 2021 in Rennes, France. In the days leading up to the congress, delegates have the opportunity to participate in one of eight, topic-specific pre-conferences, one of them focusing on statistics. More information is available at OWC 2021 website https://owc.ifoam.bio/2021/.
Next FiBL survey on organic agriculture worldwide
The next global organic survey will start in mid-2021; data will be published in February 2022 and presented at the Biofach Organic Trade Fair in Nuremberg, Germany. We will contact all relevant experts and would be very grateful if data could be sent to us. Should you notice any errors regarding the statistical data in this volume, please let us know; we will then correct the information in our database and provide the corrected data in the 2022 edition of “The World of Organic Agriculture.” Corrections will also be posted on www.organic-world.net.
Contact: [email protected].
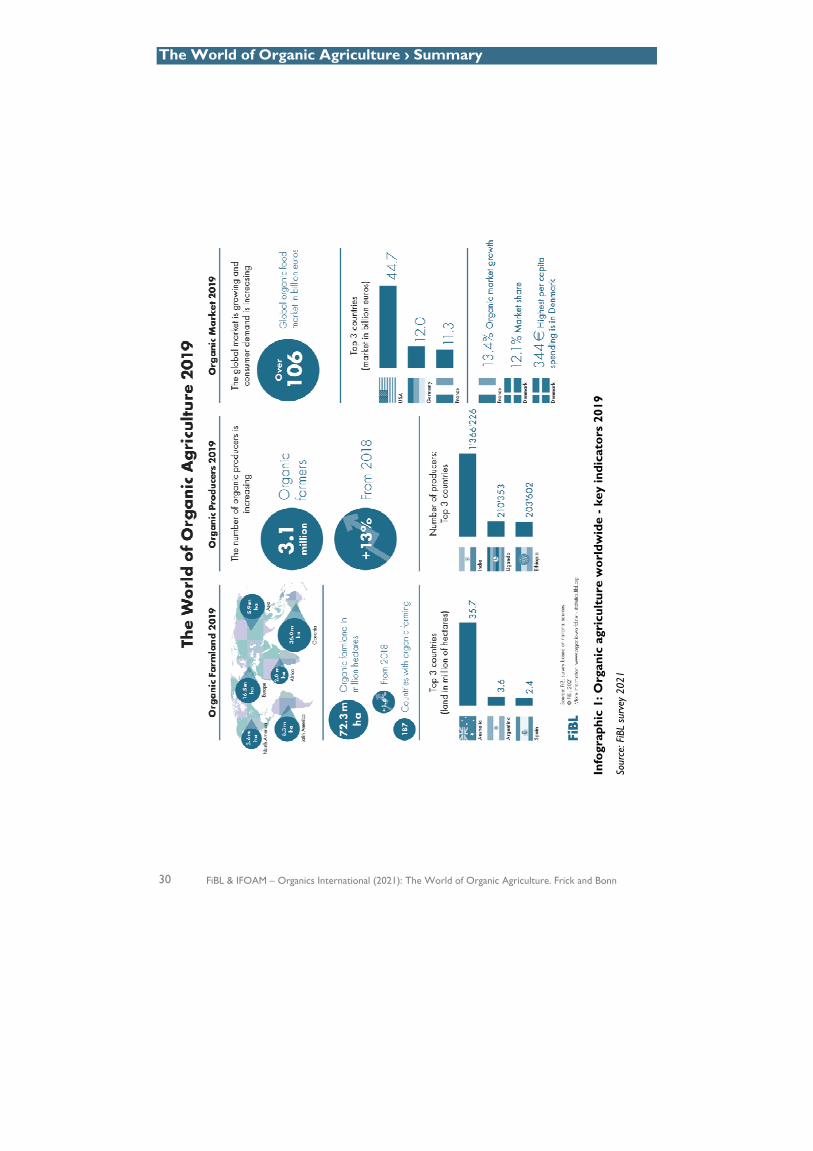
The World of Organic Agriculture › Summary
30 FiBL & IFOAM – Organics International (2021): The World of Organic Agriculture. Frick and Bonn
Info
grap
hic
1: O
rgan
ic a
gric
ultu
re w
orld
wid
e - k
ey in
dica
tors
201
9
Sour
ce: F
iBL
surv
ey 2
021
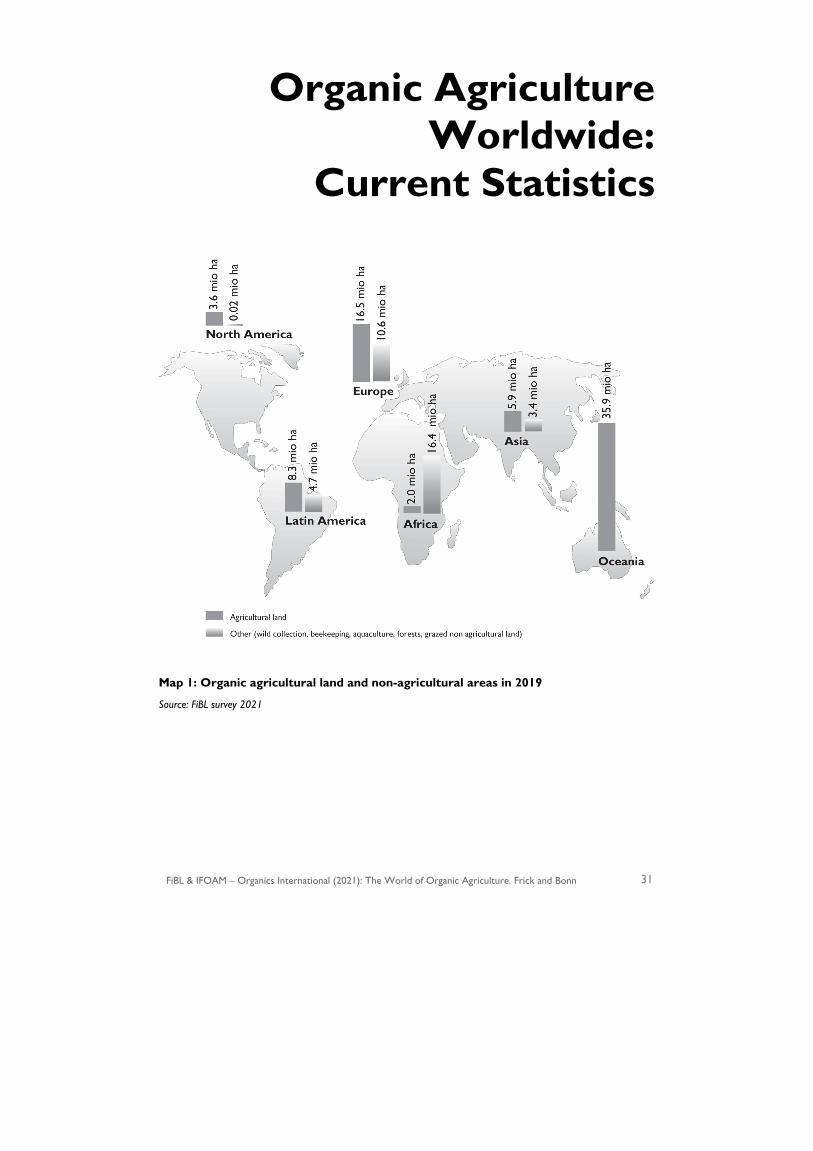
FiBL & IFOAM – Organics International (2021): The World of Organic Agriculture. Frick and Bonn 31
Organic Agriculture Worldwide:
Current Statistics
Map 1: Organic agricultural land and non-agricultural areas in 2019
Source: FiBL survey 2021

Statistics › Introduction
32 FiBL & IFOAM – Organics International (2021): The World of Organic Agriculture. Frick and Bonn
Current Statistics on Organic Agriculture Worldwide: Area, Operators and Market
BERNHARD SCHLATTER,1 JAN TRÁVNÍČEK,2 CLAUDIA MEIER,3 OLIVIA KELLER4 AND HELGA WILLER5
Introduction
The 22nd survey of certified organic agriculture worldwide was carried out by the Research Institute of Organic Agriculture FiBL in collaboration with many partners from around the world. The results are published jointly with IFOAM – Organics International. The survey was supported by the Swiss State Secretariat for Economic Affairs (SECO), the International Trade Centre (ITC),6 the Sustainability Fund of Coop Switzerland,7 and NürnbergMesse.8
Data providers
In total, data were provided by more than 200 experts. Governments, private sector organizations, certifiers, and market research companies have contributed to the data collection effort.
Several international certifiers deserve special mention as they provided data on several countries: ACO Certification, BioInspecta, CCPB, CERES, Certisys, Control Union, Ecocert, Ecoglobe, Ekoagros, ICEA, Imocert, Kiwa BCS Oko-Garantie GmbH, LACON, LETIS, NASAA Certified Organic (NCO), Organic Agriculture Certification Thailand (ACT), Organización Internacional Agropecuaria (OIA), OneCert and Quality Certification Services (QCS).
Our collaboration with the Inter-American Commission for Organic Agriculture (CIAO) eased data collection in Latin American and the Caribbean substantially. Data from the Mediterranean countries were supplied by the Mediterranean Organic Agriculture Network (MOAN, c/o Mediterranean Agronomic Institute of Bari). Data from the Pacific Islands was provided by the Pacific Organic and Ethical Trade
1 Bernhard Schlatter, Research Institute of Organic Agriculture FiBL, Frick, Switzerland, www.fibl.org 2 Jan Trávníček, Research Institute of Organic Agriculture FiBL, Frick, Switzerland, www.fibl.org 3 Claudia Meier, Research Institute of Organic Agriculture FiBL, Frick, Switzerland, www.fibl.org 4 Olivia Keller, Research Institute of Organic Agriculture FiBL, Frick, Switzerland, www.fibl.org 5 Dr. Helga Willer, Research Institute of Organic Agriculture FiBL, Frick, Switzerland, www.fibl.org 6 Since 2014, data collection on organic agriculture worldwide and on further voluntary standards has been funded by the International Trade Centre (ITC) and the Swiss State Secretariat for Economic Affairs (SECO) under the project “T4SD Global Platform for Market Data on Organic Agriculture and Sustainability Standards”. For more information on this project, see www.vss.fibl.org 7 Since 2019, the data collection on organic agriculture has been supported by the Sustainability Fund of Coop Switzerland. 8 The organisers of BIOFACH, the World Organic Trade Fair in Nuremberg, Germany (today: NürnbergMesse), have supported data collection on organic agriculture worldwide and the production of the yearbook “The World of Organic Agriculture” since 2000.

Statistics › Introduction
FiBL & IFOAM – Organics International (2021): The World of Organic Agriculture. Frick and Bonn 33
Community (POET.com). Another important source covering many countries is Eurostat. A list of all data sources and contacts is provided in the annex.
Countries covered
In total, data from 187 countries/territories were available. Updated data on the organic area was available for 142 countries; however, for some countries, updates were only available for the total organic area and not necessarily for the number of farms, land use, or other indicators. For the countries for which FiBL compiles the data among certifiers, not all certifiers provided updated data. When no new data was available, data from the previous survey were used.
Table 1: Countries and territories covered by the global survey on organic agriculture 2019
Region Countries* with data on organic agriculture
Countries per region1
Share of countries that provided data (%)
Africa 47 60 77% Asia 42 50 82% Europe 48 52 94% Latin America and the Caribbean 35 52 73%
North America 3 5 75% Oceania 12 29 50% World 187 249 78%
Source: FiBL survey 2021 *Where the designation "country" appears in this book, it covers countries or territories, see UNSTAT website.2
Indicators covered
Data on the following indicators were collected:
! organic area and production including breakdown by crop; ! livestock numbers; production data (volumes and values); ! producers and further operator types; ! domestic market data (total retail sales and food service sales values and volumes,
per capita consumption, share of the total market, and breakdown by product); international trade data (total import and export values and volumes, and breakdown by product).
Not all data that was collected is published in this book (e.g., production, livestock numbers, breakdown by product for the domestic market and international trade data) because it was not possible to draw a complete global picture for these indicators. More
1 Number of countries and areas are mostly based on countries as listed in the FAO database at http://www.fao.org/faostat/en/#data/RL as well as some additional countries such as Kosovo. 2 For more information on countries, territories and regions see the UNSTAT website at http://unstats.un.org/unsd/methods/m49/m49.htm.
Statistics › Introduction
34 FiBL & IFOAM – Organics International (2021): The World of Organic Agriculture. Frick and Bonn
information about the data collection and analysis process is available in our metadata, which can be found on Organic Eprints https://orgprints.org/36848/).
Challenges with the 2021 survey
With the 2021 survey, we experienced a number of challenges: ! We had data in our database, for which we had not received updates or
confirmation for several years. We decided not to continue using this data after a certain point of time (e.g. from 2015 onwards), which resulted in a substantial drop in area and producers for some countries.
! We revised some of the crop data for some countries, as the data seemed implausible.
! We received some major data revisions for some countries, sometimes resulting in a drop of area and producers or change of crop data compared to what we had communicated previously.
More information on statistics.fibl.org
Interactive tables and graphs with more details on crops, markets, and international trade, as well as explanations for certain data can be found on FiBL’s statistics website statistics.fibl.org.
Contact: Enquiries related to the data should be sent to Helga Willer, Research Institute of Organic Agriculture FiBL, Frick, Switzerland, e-mail [email protected].
Statistics › General Notes
FiBL & IFOAM – Organics International (2021): The World of Organic Agriculture. Frick and Bonn 35
General notes on the data
Area: Data represents certified organic land that is already fully converted as well as land under conversion because many data sources do not separate or include the latter (for instance, Austria, Germany, and Switzerland) and because land under conversion is under organic management. For a definition of organic agriculture, see the IFOAM – Organics International website.1
Area share of total agricultural land: In some cases, the calculation of the organic share of the total agricultural land or that of individual crops, based on FAOSTAT and in some cases the Eurostat data, might differ from the organic shares obtained from ministries or local experts.
Producer data: Some countries report the number of smallholders, while others report only the number of companies, projects, or grower groups, which may each comprise several producers. This applies in particular to many African countries. The number of producers is, therefore, probably higher than the number communicated in this report.
Market data: It should be noted that for market and trade data, comparing country statistics remains very problematic due to differing methods of data collection. Furthermore, for market and trade values fluctuating exchange rates must be kept in mind.
PGS: For some countries, areas certified by Participatory Guarantee Systems (PGS) have been included. (For more information about PGS, see the article by Moura e Castro et al. on page 158).
Country definitions: For countries and territories, the FAO country list is used. Where the designation "country" appears in this report, it covers countries or territories. In most cases, countries are groups by region according to the Standard Country and Area Classifications as defined by the United Nations Statistics Division.
Sources: Data was gathered from private sector organizations, governments, and certification bodies. For detailed information on the data sources, please check the annex at the end of this volume (page 317).
Direct year-to-year comparison: A direct year-to-year comparison is not possible for all data, as the data sources may change, data may not be provided on an annual basis, data may have been revised or corrected, data access may improve, or exchange rates might change from year to year.
Completeness of data: For some countries, either no current data were available, or the data provided may not be complete. For others, no data were available. It may, therefore, be assumed that the extent of organic agriculture is larger than documented in this publication.
Data revisions: Data revisions and corrections are communicated at statistics.fibl.org.
Metadata: Metadata for the FiBL survey on organic agriculture worldwide are available on Organic Eprints at https://orgprints.org/36848.
1 The definition of organic agriculture is available at the website of IFOAM – Organics International www.ifoam.bio/en/organic-landmarks/definition-organic-agriculture

36 FiBL & IFOAM – Organics International (2021): The World of Organic Agriculture. Frick and Bonn
Info
grap
hic
2: O
rgan
ic fa
rmla
nd 2
019
Sour
ce: F
iBL
surv
ey 2
021
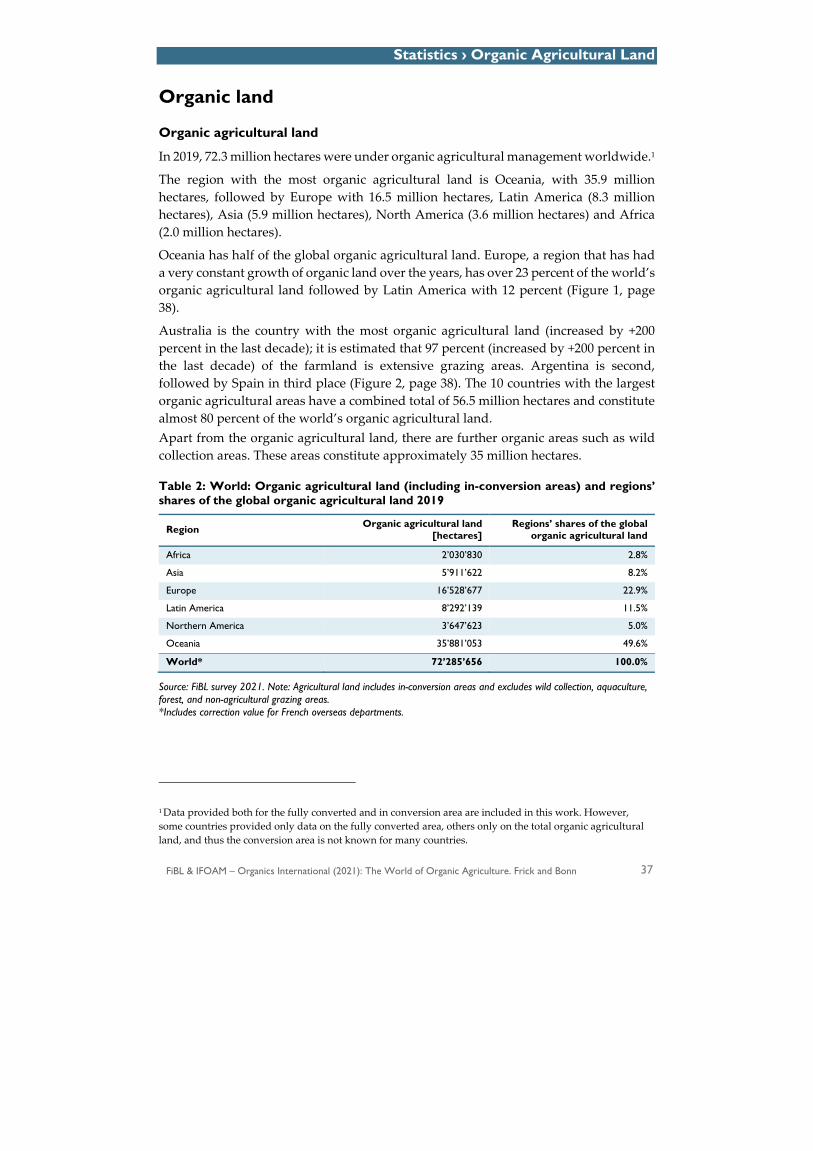
Statistics › Organic Agricultural Land
FiBL & IFOAM – Organics International (2021): The World of Organic Agriculture. Frick and Bonn 37
Organic land
Organic agricultural land
In 2019, 72.3 million hectares were under organic agricultural management worldwide.1
The region with the most organic agricultural land is Oceania, with 35.9 million hectares, followed by Europe with 16.5 million hectares, Latin America (8.3 million hectares), Asia (5.9 million hectares), North America (3.6 million hectares) and Africa (2.0 million hectares).
Oceania has half of the global organic agricultural land. Europe, a region that has had a very constant growth of organic land over the years, has over 23 percent of the world’s organic agricultural land followed by Latin America with 12 percent (Figure 1, page 38).
Australia is the country with the most organic agricultural land (increased by +200 percent in the last decade); it is estimated that 97 percent (increased by +200 percent in the last decade) of the farmland is extensive grazing areas. Argentina is second, followed by Spain in third place (Figure 2, page 38). The 10 countries with the largest organic agricultural areas have a combined total of 56.5 million hectares and constitute almost 80 percent of the world’s organic agricultural land. Apart from the organic agricultural land, there are further organic areas such as wild collection areas. These areas constitute approximately 35 million hectares.
Table 2: World: Organic agricultural land (including in-conversion areas) and regions’ shares of the global organic agricultural land 2019
Region Organic agricultural land [hectares]
Regions’ shares of the global organic agricultural land
Africa 2’030’830 2.8%
Asia 5’911’622 8.2%
Europe 16’528’677 22.9%
Latin America 8’292’139 11.5%
Northern America 3’647’623 5.0%
Oceania 35’881’053 49.6%
World* 72’285’656 100.0%
Source: FiBL survey 2021. Note: Agricultural land includes in-conversion areas and excludes wild collection, aquaculture, forest, and non-agricultural grazing areas. *Includes correction value for French overseas departments.
1 Data provided both for the fully converted and in conversion area are included in this work. However, some countries provided only data on the fully converted area, others only on the total organic agricultural land, and thus the conversion area is not known for many countries.
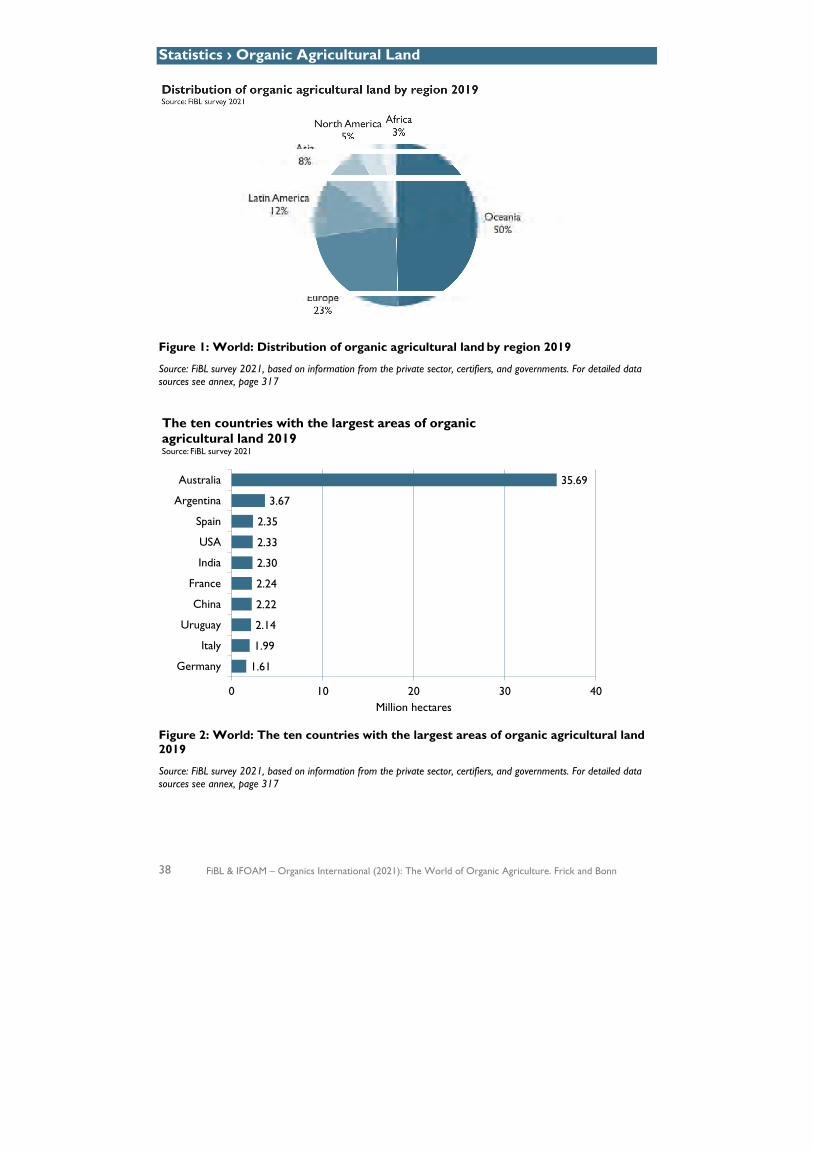
Statistics › Organic Agricultural Land
38 FiBL & IFOAM – Organics International (2021): The World of Organic Agriculture. Frick and Bonn
Figure 1: World: Distribution of organic agricultural land by region 2019
Source: FiBL survey 2021, based on information from the private sector, certifiers, and governments. For detailed data sources see annex, page 317
Figure 2: World: The ten countries with the largest areas of organic agricultural land
2019
Source: FiBL survey 2021, based on information from the private sector, certifiers, and governments. For detailed data sources see annex, page 317
1.61
1.99
2.14
2.22
2.24
2.30
2.33
2.35
3.67
35.69
0 10 20 30 40
Germany
Italy
Uruguay
China
France
India
USA
Spain
Argentina
Australia
Million hectares
The ten countries with the largest areas of organic agricultural land 2019Source: FiBL survey 2021
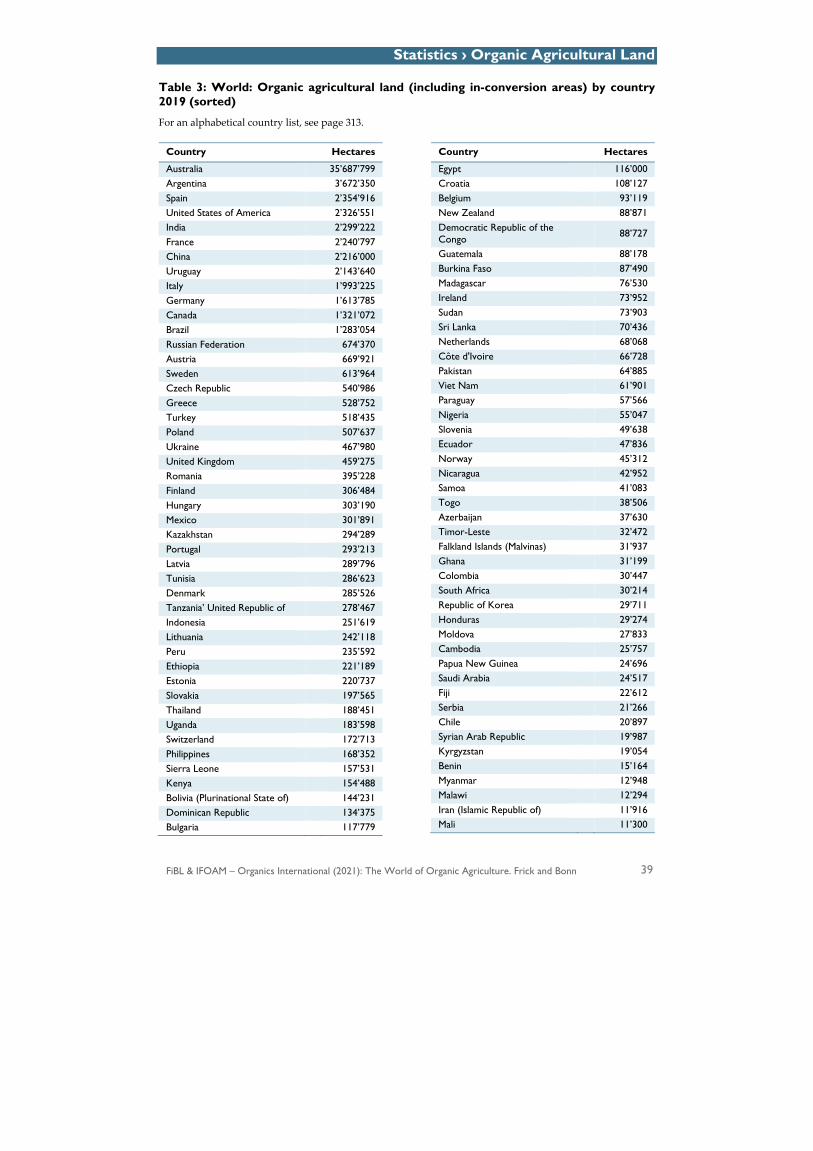
Statistics › Organic Agricultural Land
FiBL & IFOAM – Organics International (2021): The World of Organic Agriculture. Frick and Bonn 39
Table 3: World: Organic agricultural land (including in-conversion areas) by country 2019 (sorted)
For an alphabetical country list, see page 313.
Country Hectares
Australia 35’687’799 Argentina 3’672’350 Spain 2’354’916 United States of America 2’326’551 India 2’299’222 France 2’240’797 China 2’216’000 Uruguay 2’143’640 Italy 1’993’225 Germany 1’613’785 Canada 1’321’072 Brazil 1’283’054 Russian Federation 674’370 Austria 669’921 Sweden 613’964 Czech Republic 540’986 Greece 528’752 Turkey 518’435 Poland 507’637 Ukraine 467’980 United Kingdom 459’275 Romania 395’228 Finland 306’484 Hungary 303’190 Mexico 301’891 Kazakhstan 294’289 Portugal 293’213 Latvia 289’796 Tunisia 286’623 Denmark 285’526 Tanzania’ United Republic of 278’467 Indonesia 251’619 Lithuania 242’118 Peru 235’592 Ethiopia 221’189 Estonia 220’737 Slovakia 197’565 Thailand 188’451 Uganda 183’598 Switzerland 172’713 Philippines 168’352 Sierra Leone 157’531 Kenya 154’488 Bolivia (Plurinational State of) 144’231 Dominican Republic 134’375 Bulgaria 117’779
Country Hectares
Egypt 116’000 Croatia 108’127 Belgium 93’119 New Zealand 88’871 Democratic Republic of the Congo
88’727
Guatemala 88’178 Burkina Faso 87’490 Madagascar 76’530 Ireland 73’952 Sudan 73’903 Sri Lanka 70’436 Netherlands 68’068 Côte d'Ivoire 66’728 Pakistan 64’885 Viet Nam 61’901 Paraguay 57’566 Nigeria 55’047 Slovenia 49’638 Ecuador 47’836 Norway 45’312 Nicaragua 42’952 Samoa 41’083 Togo 38’506 Azerbaijan 37’630 Timor-Leste 32’472 Falkland Islands (Malvinas) 31’937 Ghana 31’199 Colombia 30’447 South Africa 30’214 Republic of Korea 29’711 Honduras 29’274 Moldova 27’833 Cambodia 25’757 Papua New Guinea 24’696 Saudi Arabia 24’517 Fiji 22’612 Serbia 21’266 Chile 20’897 Syrian Arab Republic 19’987 Kyrgyzstan 19’054 Benin 15’164 Myanmar 12’948 Malawi 12’294 Iran (Islamic Republic of) 11’916 Mali 11’300
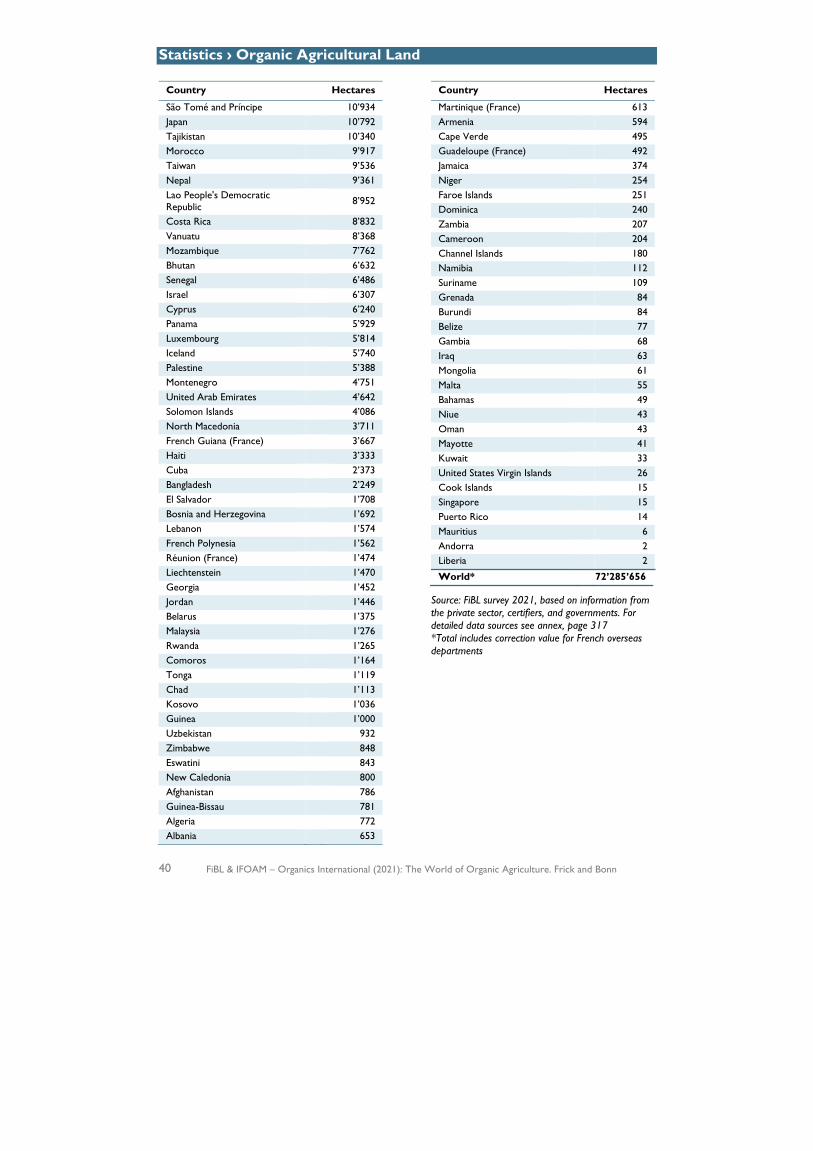
Statistics › Organic Agricultural Land
40 FiBL & IFOAM – Organics International (2021): The World of Organic Agriculture. Frick and Bonn
Country Hectares
São Tomé and Príncipe 10’934 Japan 10’792 Tajikistan 10’340 Morocco 9’917 Taiwan 9’536 Nepal 9’361 Lao People's Democratic Republic
8’952
Costa Rica 8’832 Vanuatu 8’368 Mozambique 7’762 Bhutan 6’632 Senegal 6’486 Israel 6’307 Cyprus 6’240 Panama 5’929 Luxembourg 5’814 Iceland 5’740 Palestine 5’388 Montenegro 4’751 United Arab Emirates 4’642 Solomon Islands 4’086 North Macedonia 3’711 French Guiana (France) 3’667 Haiti 3’333 Cuba 2’373 Bangladesh 2’249 El Salvador 1’708 Bosnia and Herzegovina 1’692 Lebanon 1’574 French Polynesia 1’562 Réunion (France) 1’474 Liechtenstein 1’470 Georgia 1’452 Jordan 1’446 Belarus 1’375 Malaysia 1’276 Rwanda 1’265 Comoros 1’164 Tonga 1’119 Chad 1’113 Kosovo 1’036 Guinea 1’000 Uzbekistan 932 Zimbabwe 848 Eswatini 843 New Caledonia 800 Afghanistan 786 Guinea-Bissau 781 Algeria 772 Albania 653
Country Hectares
Martinique (France) 613 Armenia 594 Cape Verde 495 Guadeloupe (France) 492 Jamaica 374 Niger 254 Faroe Islands 251 Dominica 240 Zambia 207 Cameroon 204 Channel Islands 180 Namibia 112 Suriname 109 Grenada 84 Burundi 84 Belize 77 Gambia 68 Iraq 63 Mongolia 61 Malta 55 Bahamas 49 Niue 43 Oman 43 Mayotte 41 Kuwait 33 United States Virgin Islands 26 Cook Islands 15 Singapore 15 Puerto Rico 14 Mauritius 6 Andorra 2 Liberia 2
World* 72’285’656
Source: FiBL survey 2021, based on information from the private sector, certifiers, and governments. For detailed data sources see annex, page 317 *Total includes correction value for French overseas departments
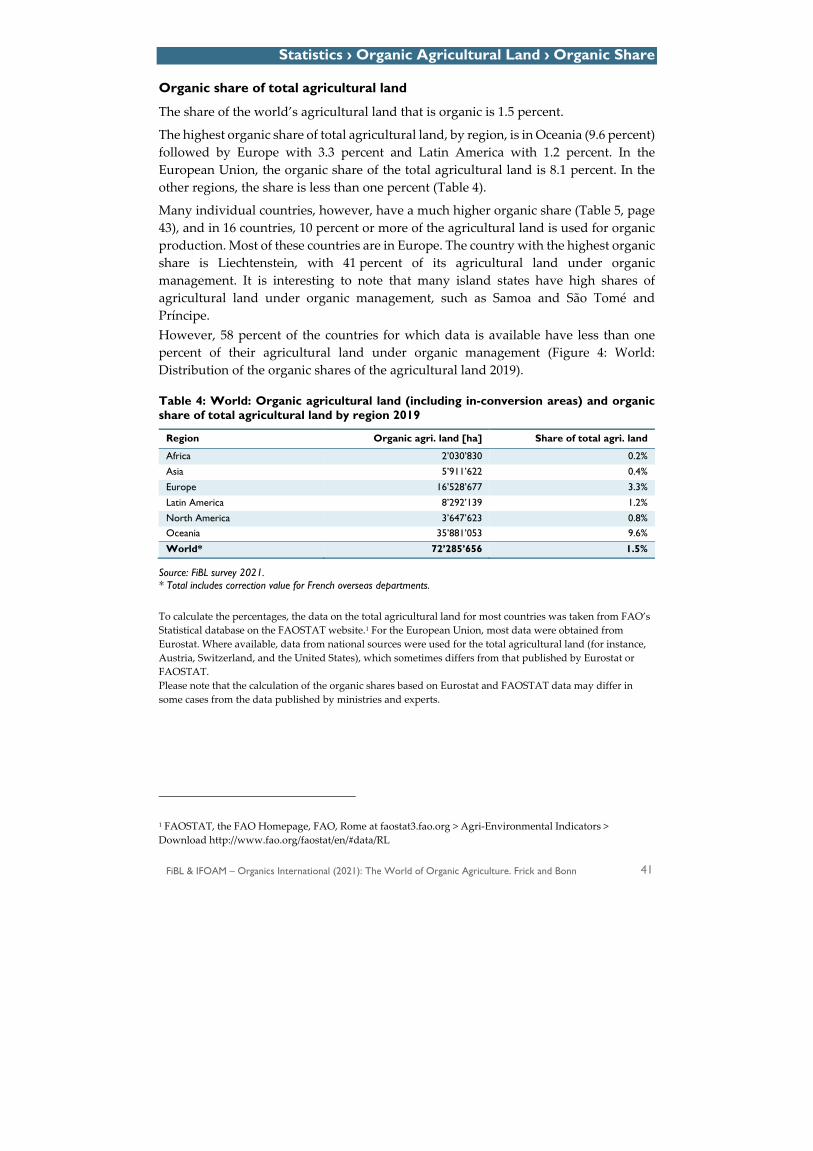
Statistics › Organic Agricultural Land › Organic Share
FiBL & IFOAM – Organics International (2021): The World of Organic Agriculture. Frick and Bonn 41
Organic share of total agricultural land
The share of the world’s agricultural land that is organic is 1.5 percent.
The highest organic share of total agricultural land, by region, is in Oceania (9.6 percent) followed by Europe with 3.3 percent and Latin America with 1.2 percent. In the European Union, the organic share of the total agricultural land is 8.1 percent. In the other regions, the share is less than one percent (Table 4).
Many individual countries, however, have a much higher organic share (Table 5, page 43), and in 16 countries, 10 percent or more of the agricultural land is used for organic production. Most of these countries are in Europe. The country with the highest organic share is Liechtenstein, with 41 percent of its agricultural land under organic management. It is interesting to note that many island states have high shares of agricultural land under organic management, such as Samoa and São Tomé and Príncipe. However, 58 percent of the countries for which data is available have less than one percent of their agricultural land under organic management (Figure 4: World: Distribution of the organic shares of the agricultural land 2019).
Table 4: World: Organic agricultural land (including in-conversion areas) and organic share of total agricultural land by region 2019
Region Organic agri. land [ha] Share of total agri. land
Africa 2’030’830 0.2%
Asia 5’911’622 0.4%
Europe 16’528’677 3.3%
Latin America 8’292’139 1.2%
North America 3’647’623 0.8% Oceania 35’881’053 9.6%
World* 72’285’656 1.5%
Source: FiBL survey 2021. * Total includes correction value for French overseas departments.
To calculate the percentages, the data on the total agricultural land for most countries was taken from FAO’s Statistical database on the FAOSTAT website.1 For the European Union, most data were obtained from Eurostat. Where available, data from national sources were used for the total agricultural land (for instance, Austria, Switzerland, and the United States), which sometimes differs from that published by Eurostat or FAOSTAT. Please note that the calculation of the organic shares based on Eurostat and FAOSTAT data may differ in some cases from the data published by ministries and experts.
1 FAOSTAT, the FAO Homepage, FAO, Rome at faostat3.fao.org > Agri-Environmental Indicators > Download http://www.fao.org/faostat/en/#data/RL
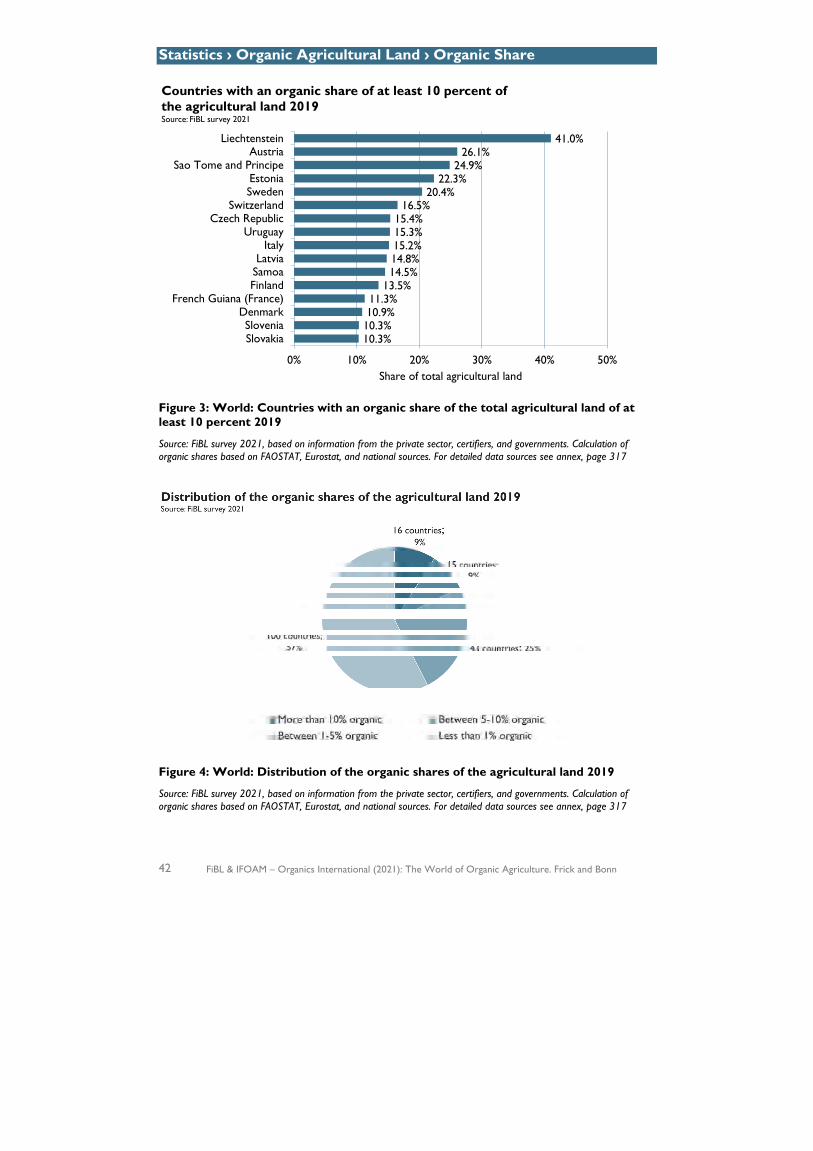
Statistics › Organic Agricultural Land › Organic Share
42 FiBL & IFOAM – Organics International (2021): The World of Organic Agriculture. Frick and Bonn
Figure 3: World: Countries with an organic share of the total agricultural land of at least 10 percent 2019
Source: FiBL survey 2021, based on information from the private sector, certifiers, and governments. Calculation of organic shares based on FAOSTAT, Eurostat, and national sources. For detailed data sources see annex, page 317
Figure 4: World: Distribution of the organic shares of the agricultural land 2019
Source: FiBL survey 2021, based on information from the private sector, certifiers, and governments. Calculation of organic shares based on FAOSTAT, Eurostat, and national sources. For detailed data sources see annex, page 317
10.3%10.3%10.9%11.3%
13.5%14.5%14.8%15.2%15.3%15.4%
16.5%20.4%
22.3%24.9%
26.1%41.0%
0% 10% 20% 30% 40% 50%
SlovakiaSlovenia
DenmarkFrench Guiana (France)
FinlandSamoaLatvia
ItalyUruguay
Czech RepublicSwitzerland
SwedenEstonia
Sao Tome and PrincipeAustria
Liechtenstein
Share of total agricultural land
Countries with an organic share of at least 10 percent of the agricultural land 2019Source: FiBL survey 2021
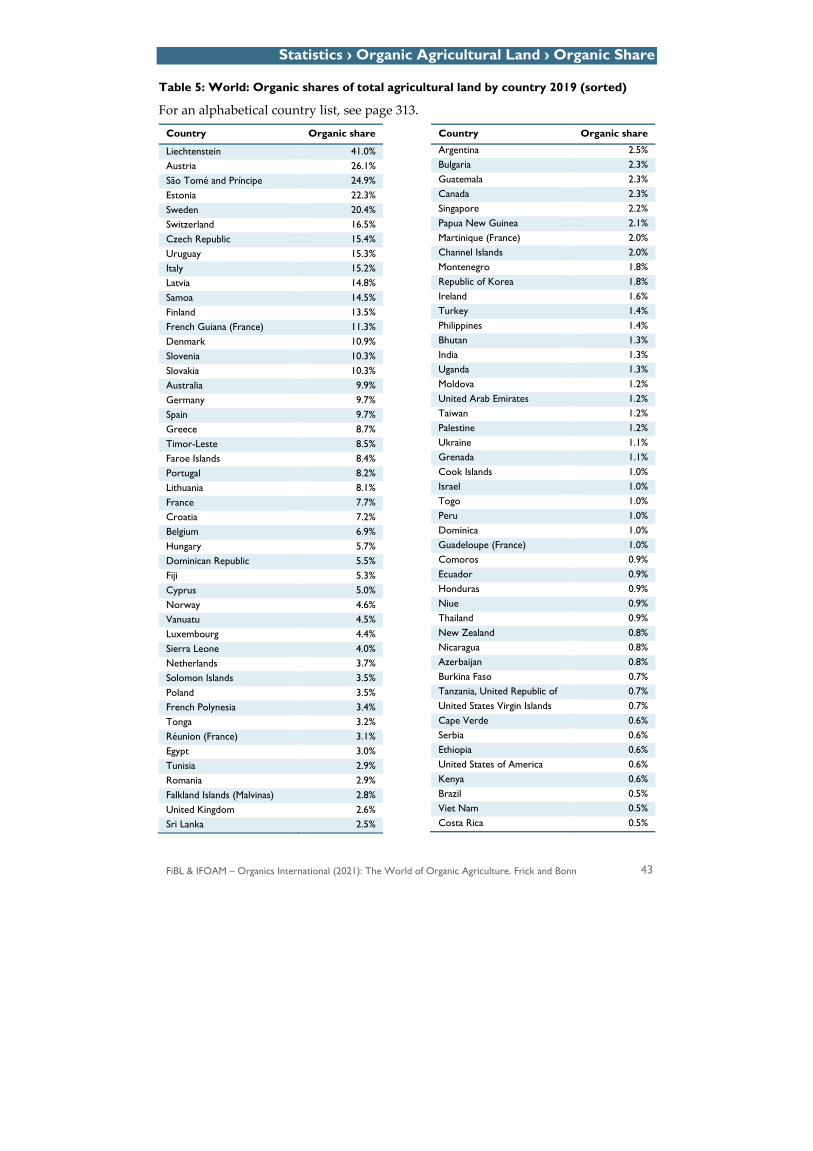
Statistics › Organic Agricultural Land › Organic Share
FiBL & IFOAM – Organics International (2021): The World of Organic Agriculture. Frick and Bonn 43
Table 5: World: Organic shares of total agricultural land by country 2019 (sorted)
For an alphabetical country list, see page 313.
Country Organic share
Liechtenstein 41.0% Austria 26.1% São Tomé and Príncipe 24.9% Estonia 22.3% Sweden 20.4% Switzerland 16.5% Czech Republic 15.4% Uruguay 15.3% Italy 15.2% Latvia 14.8% Samoa 14.5% Finland 13.5% French Guiana (France) 11.3% Denmark 10.9% Slovenia 10.3% Slovakia 10.3% Australia 9.9% Germany 9.7% Spain 9.7% Greece 8.7% Timor-Leste 8.5% Faroe Islands 8.4% Portugal 8.2% Lithuania 8.1% France 7.7% Croatia 7.2% Belgium 6.9% Hungary 5.7% Dominican Republic 5.5% Fiji 5.3% Cyprus 5.0% Norway 4.6% Vanuatu 4.5% Luxembourg 4.4% Sierra Leone 4.0% Netherlands 3.7% Solomon Islands 3.5% Poland 3.5% French Polynesia 3.4% Tonga 3.2% Réunion (France) 3.1% Egypt 3.0% Tunisia 2.9% Romania 2.9% Falkland Islands (Malvinas) 2.8% United Kingdom 2.6% Sri Lanka 2.5%
Country Organic share
Argentina 2.5% Bulgaria 2.3% Guatemala 2.3% Canada 2.3% Singapore 2.2% Papua New Guinea 2.1% Martinique (France) 2.0% Channel Islands 2.0% Montenegro 1.8% Republic of Korea 1.8% Ireland 1.6% Turkey 1.4% Philippines 1.4% Bhutan 1.3% India 1.3% Uganda 1.3% Moldova 1.2% United Arab Emirates 1.2% Taiwan 1.2% Palestine 1.2% Ukraine 1.1% Grenada 1.1% Cook Islands 1.0% Israel 1.0% Togo 1.0% Peru 1.0% Dominica 1.0% Guadeloupe (France) 1.0% Comoros 0.9% Ecuador 0.9% Honduras 0.9% Niue 0.9% Thailand 0.9% New Zealand 0.8% Nicaragua 0.8% Azerbaijan 0.8% Burkina Faso 0.7% Tanzania, United Republic of 0.7% United States Virgin Islands 0.7% Cape Verde 0.6% Serbia 0.6% Ethiopia 0.6% United States of America 0.6% Kenya 0.6% Brazil 0.5% Viet Nam 0.5% Costa Rica 0.5%
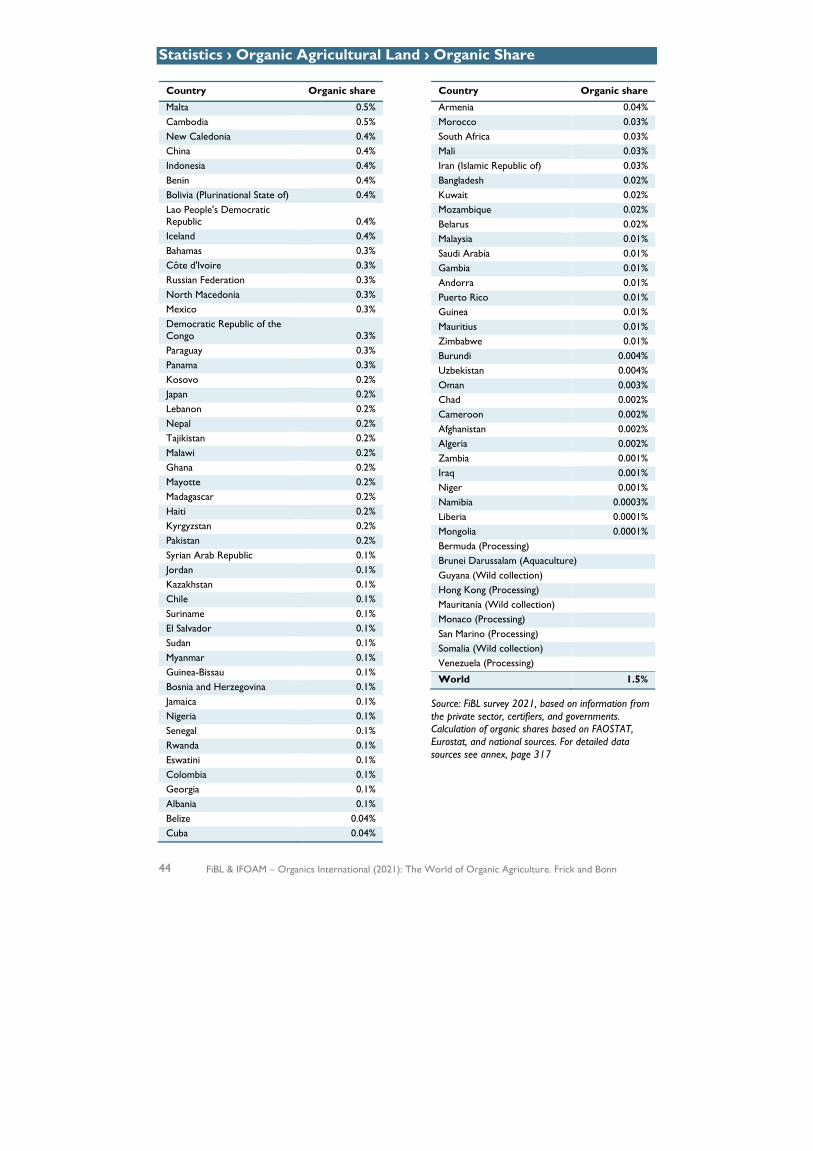
Statistics › Organic Agricultural Land › Organic Share
44 FiBL & IFOAM – Organics International (2021): The World of Organic Agriculture. Frick and Bonn
Country Organic share
Malta 0.5% Cambodia 0.5% New Caledonia 0.4% China 0.4% Indonesia 0.4% Benin 0.4% Bolivia (Plurinational State of) 0.4% Lao People's Democratic Republic 0.4% Iceland 0.4% Bahamas 0.3% Côte d'Ivoire 0.3% Russian Federation 0.3% North Macedonia 0.3% Mexico 0.3% Democratic Republic of the Congo 0.3% Paraguay 0.3% Panama 0.3% Kosovo 0.2% Japan 0.2% Lebanon 0.2% Nepal 0.2% Tajikistan 0.2% Malawi 0.2% Ghana 0.2% Mayotte 0.2% Madagascar 0.2% Haiti 0.2% Kyrgyzstan 0.2% Pakistan 0.2% Syrian Arab Republic 0.1% Jordan 0.1% Kazakhstan 0.1% Chile 0.1% Suriname 0.1% El Salvador 0.1% Sudan 0.1% Myanmar 0.1% Guinea-Bissau 0.1% Bosnia and Herzegovina 0.1% Jamaica 0.1% Nigeria 0.1% Senegal 0.1% Rwanda 0.1% Eswatini 0.1% Colombia 0.1% Georgia 0.1% Albania 0.1% Belize 0.04% Cuba 0.04%
Country Organic share
Armenia 0.04% Morocco 0.03% South Africa 0.03% Mali 0.03% Iran (Islamic Republic of) 0.03% Bangladesh 0.02% Kuwait 0.02% Mozambique 0.02% Belarus 0.02% Malaysia 0.01% Saudi Arabia 0.01% Gambia 0.01% Andorra 0.01% Puerto Rico 0.01% Guinea 0.01% Mauritius 0.01% Zimbabwe 0.01% Burundi 0.004% Uzbekistan 0.004% Oman 0.003% Chad 0.002% Cameroon 0.002% Afghanistan 0.002% Algeria 0.002% Zambia 0.001% Iraq 0.001% Niger 0.001% Namibia 0.0003% Liberia 0.0001% Mongolia 0.0001% Bermuda (Processing) Brunei Darussalam (Aquaculture) Guyana (Wild collection) Hong Kong (Processing) Mauritania (Wild collection) Monaco (Processing) San Marino (Processing) Somalia (Wild collection) Venezuela (Processing)
World 1.5%
Source: FiBL survey 2021, based on information from the private sector, certifiers, and governments. Calculation of organic shares based on FAOSTAT, Eurostat, and national sources. For detailed data sources see annex, page 317
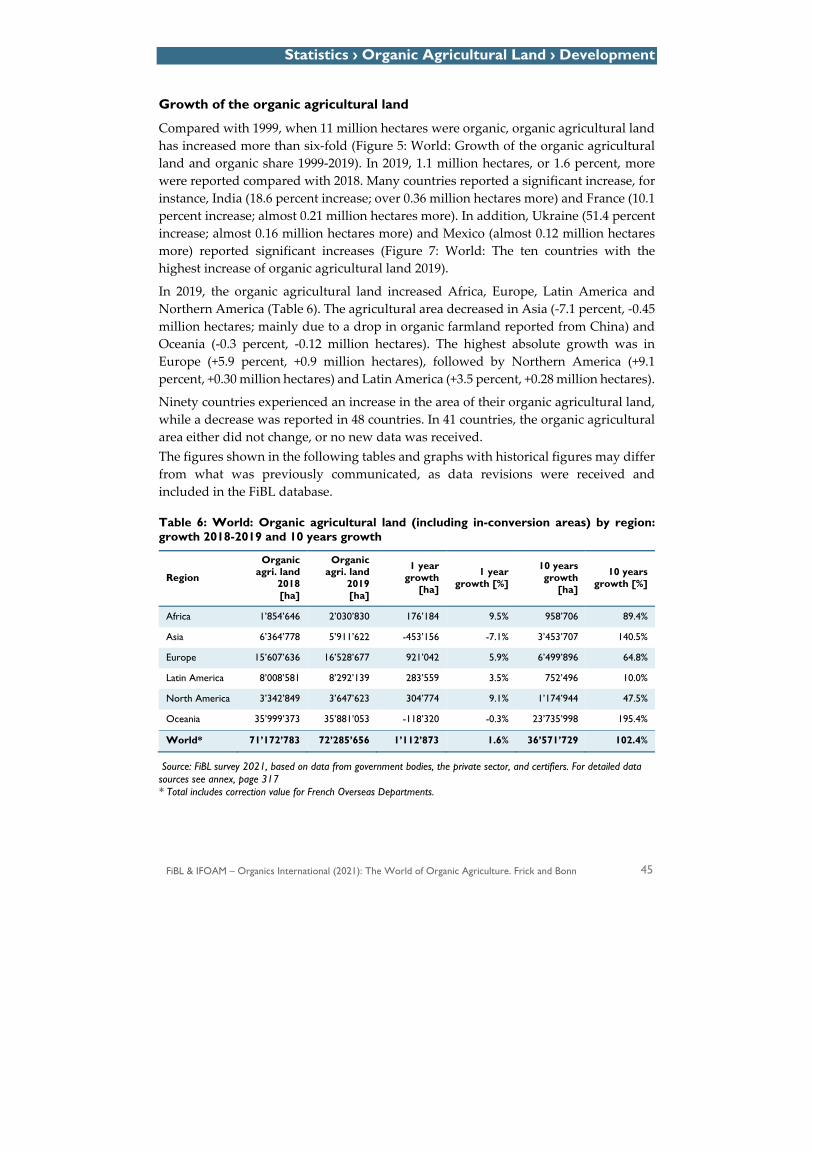
Statistics › Organic Agricultural Land › Development
FiBL & IFOAM – Organics International (2021): The World of Organic Agriculture. Frick and Bonn 45
Growth of the organic agricultural land
Compared with 1999, when 11 million hectares were organic, organic agricultural land has increased more than six-fold (Figure 5: World: Growth of the organic agricultural land and organic share 1999-2019). In 2019, 1.1 million hectares, or 1.6 percent, more were reported compared with 2018. Many countries reported a significant increase, for instance, India (18.6 percent increase; over 0.36 million hectares more) and France (10.1 percent increase; almost 0.21 million hectares more). In addition, Ukraine (51.4 percent increase; almost 0.16 million hectares more) and Mexico (almost 0.12 million hectares more) reported significant increases (Figure 7: World: The ten countries with the highest increase of organic agricultural land 2019).
In 2019, the organic agricultural land increased Africa, Europe, Latin America and Northern America (Table 6). The agricultural area decreased in Asia (-7.1 percent, -0.45 million hectares; mainly due to a drop in organic farmland reported from China) and Oceania (-0.3 percent, -0.12 million hectares). The highest absolute growth was in Europe (+5.9 percent, +0.9 million hectares), followed by Northern America (+9.1 percent, +0.30 million hectares) and Latin America (+3.5 percent, +0.28 million hectares).
Ninety countries experienced an increase in the area of their organic agricultural land, while a decrease was reported in 48 countries. In 41 countries, the organic agricultural area either did not change, or no new data was received. The figures shown in the following tables and graphs with historical figures may differ from what was previously communicated, as data revisions were received and included in the FiBL database.
Table 6: World: Organic agricultural land (including in-conversion areas) by region: growth 2018-2019 and 10 years growth
Region
Organic agri. land
2018 [ha]
Organic agri. land
2019 [ha]
1 year growth
[ha]
1 year growth [%]
10 years growth
[ha]
10 years growth [%]
Africa 1’854’646 2’030’830 176’184 9.5% 958’706 89.4%
Asia 6’364’778 5’911’622 -453’156 -7.1% 3’453’707 140.5%
Europe 15’607’636 16’528’677 921’042 5.9% 6’499’896 64.8%
Latin America 8’008’581 8’292’139 283’559 3.5% 752’496 10.0%
North America 3’342’849 3’647’623 304’774 9.1% 1’174’944 47.5%
Oceania 35’999’373 35’881’053 -118’320 -0.3% 23’735’998 195.4%
World* 71’172’783 72’285’656 1’112’873 1.6% 36’571’729 102.4%
Source: FiBL survey 2021, based on data from government bodies, the private sector, and certifiers. For detailed data sources see annex, page 317 * Total includes correction value for French Overseas Departments.
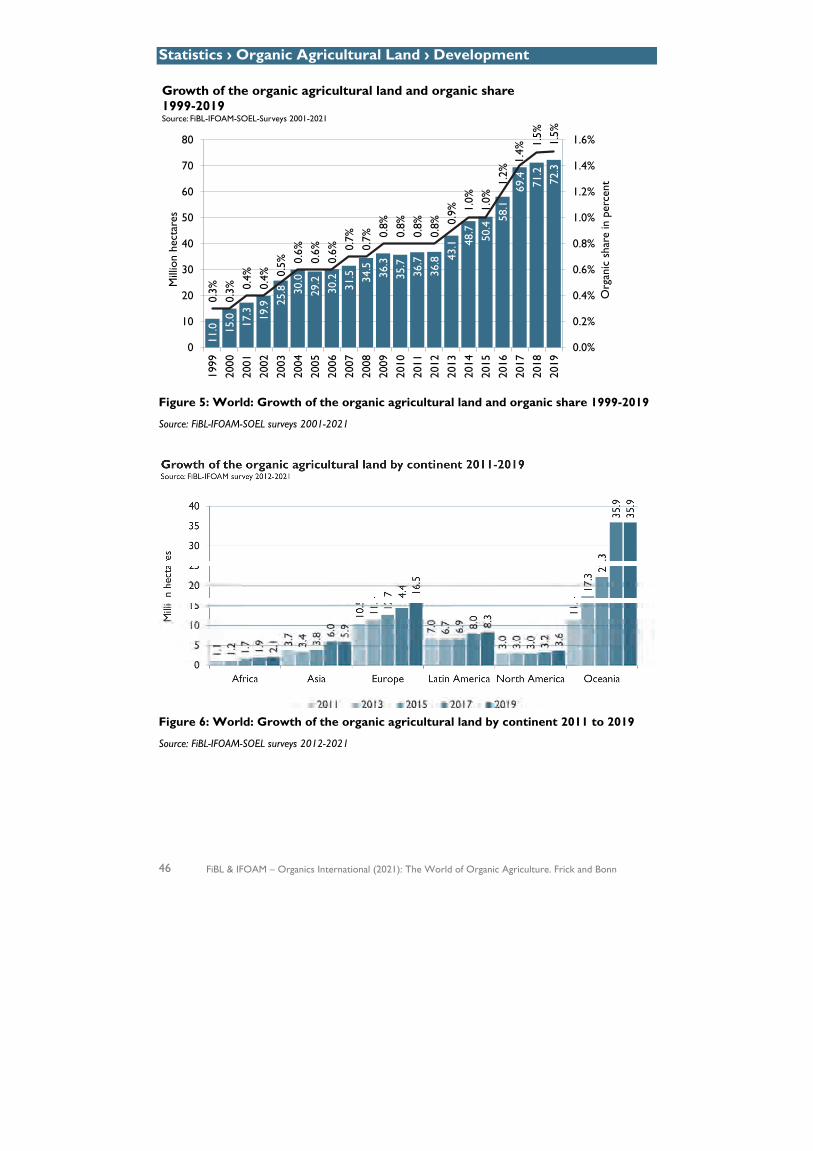
Statistics › Organic Agricultural Land › Development
46 FiBL & IFOAM – Organics International (2021): The World of Organic Agriculture. Frick and Bonn
Figure 5: World: Growth of the organic agricultural land and organic share 1999-2019
Source: FiBL-IFOAM-SOEL surveys 2001-2021
Figure 6: World: Growth of the organic agricultural land by continent 2011 to 2019
Source: FiBL-IFOAM-SOEL surveys 2012-2021
11.0 15
.0 17.3 19
.9 25.8 30
.029
.230
.231
.5 34.5
36.3
35.7
36.7
36.8 43
.1 48.7
50.4
58.1
69.4
71.2
72.3
0.3%
0.3% 0.
4%0.
4% 0.5% 0.
6%0.
6%0.
6% 0.7%
0.7% 0.
8%0.
8%0.
8%0.
8% 0.9% 1.
0%1.
0%1.
2%1.
4%
1.5%
1.5%
0.0%
0.2%
0.4%
0.6%
0.8%
1.0%
1.2%
1.4%
1.6%
0
10
20
30
40
50
60
70
80
1999
2000
2001
2002
2003
2004
2005
2006
2007
2008
2009
2010
2011
2012
2013
2014
2015
2016
2017
2018
2019
Org
anic
sha
re in
per
cent
Mill
ion
hect
ares
Growth of the organic agricultural land and organic share 1999-2019Source: FiBL-IFOAM-SOEL-Surveys 2001-2021
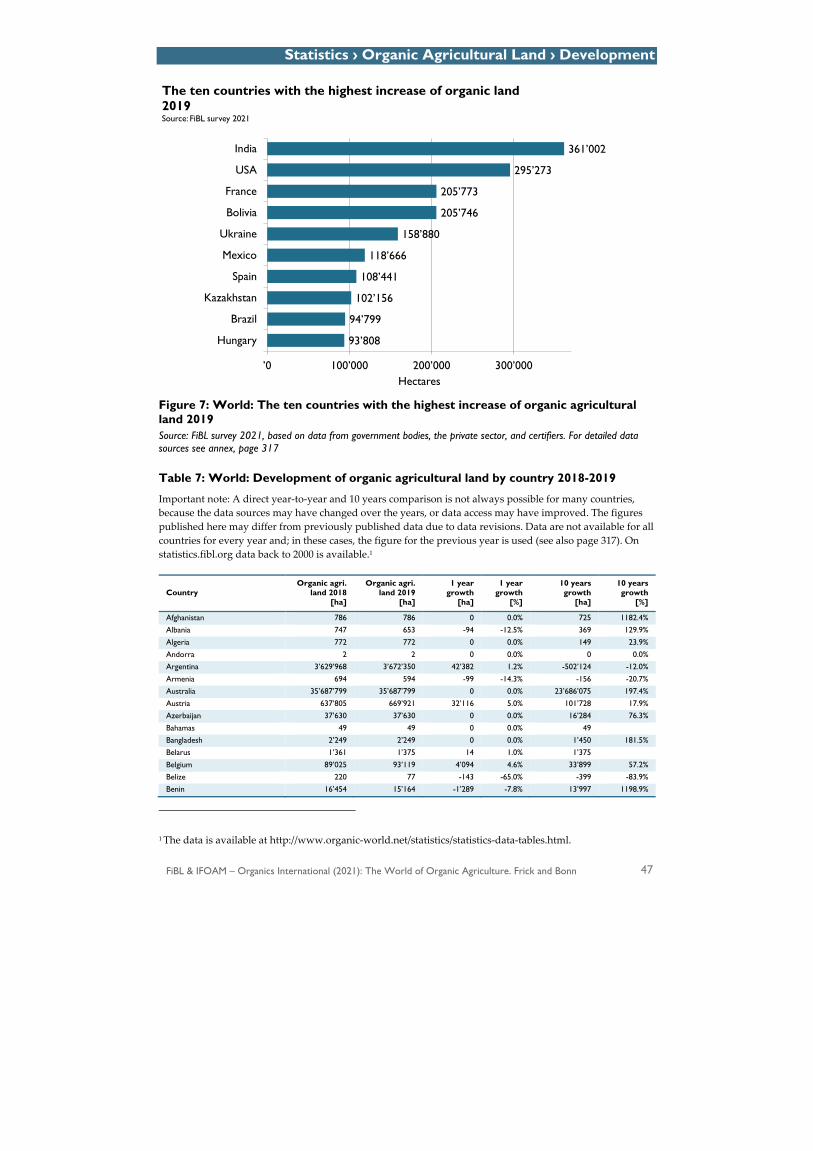
Statistics › Organic Agricultural Land › Development
FiBL & IFOAM – Organics International (2021): The World of Organic Agriculture. Frick and Bonn 47
93’808
94’799
102’156
108’441
118’666
158’880
205’746
205’773
295’273
361’002
’0 100’000 200’000 300’000
Hungary
Brazil
Kazakhstan
Spain
Mexico
Ukraine
Bolivia
France
USA
India
Hectares
The ten countries with the highest increase of organic land 2019Source: FiBL survey 2021
Figure 7: World: The ten countries with the highest increase of organic agricultural land 2019 Source: FiBL survey 2021, based on data from government bodies, the private sector, and certifiers. For detailed data sources see annex, page 317
Table 7: World: Development of organic agricultural land by country 2018-2019
Important note: A direct year-to-year and 10 years comparison is not always possible for many countries, because the data sources may have changed over the years, or data access may have improved. The figures published here may differ from previously published data due to data revisions. Data are not available for all countries for every year and; in these cases, the figure for the previous year is used (see also page 317). On statistics.fibl.org data back to 2000 is available.1
Country Organic agri.
land 2018 [ha]
Organic agri. land 2019
[ha]
1 year growth
[ha]
1 year growth
[%]
10 years growth
[ha]
10 years growth
[%]
Afghanistan 786 786 0 0.0% 725 1182.4% Albania 747 653 -94 -12.5% 369 129.9% Algeria 772 772 0 0.0% 149 23.9% Andorra 2 2 0 0.0% 0 0.0% Argentina 3’629’968 3’672’350 42’382 1.2% -502’124 -12.0% Armenia 694 594 -99 -14.3% -156 -20.7% Australia 35’687’799 35’687’799 0 0.0% 23’686’075 197.4% Austria 637’805 669’921 32’116 5.0% 101’728 17.9% Azerbaijan 37’630 37’630 0 0.0% 16’284 76.3% Bahamas 49 49 0 0.0% 49 Bangladesh 2’249 2’249 0 0.0% 1’450 181.5% Belarus 1’361 1’375 14 1.0% 1’375 Belgium 89’025 93’119 4’094 4.6% 33’899 57.2% Belize 220 77 -143 -65.0% -399 -83.9% Benin 16’454 15’164 -1’289 -7.8% 13’997 1198.9%
1 The data is available at http://www.organic-world.net/statistics/statistics-data-tables.html.
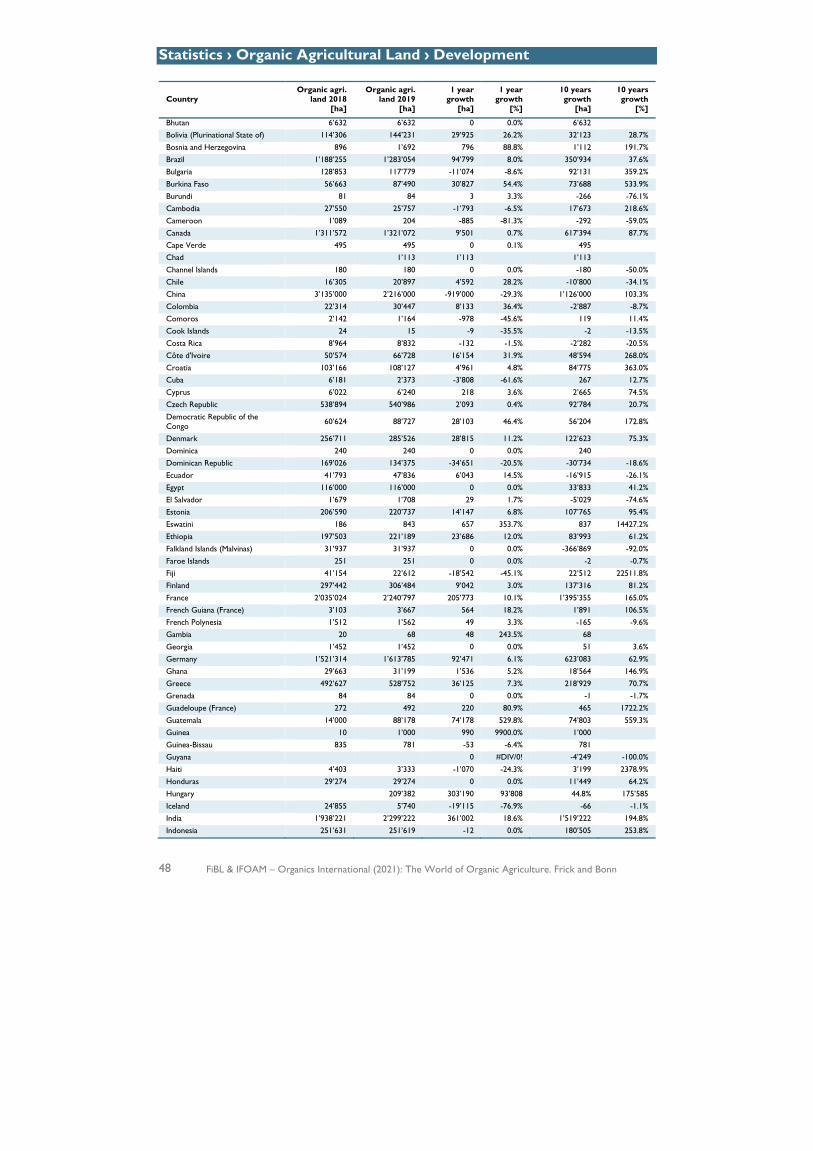
Statistics › Organic Agricultural Land › Development
48 FiBL & IFOAM – Organics International (2021): The World of Organic Agriculture. Frick and Bonn
Country Organic agri.
land 2018 [ha]
Organic agri. land 2019
[ha]
1 year growth
[ha]
1 year growth
[%]
10 years growth
[ha]
10 years growth
[%]
Bhutan 6’632 6’632 0 0.0% 6’632 Bolivia (Plurinational State of) 114’306 144’231 29’925 26.2% 32’123 28.7% Bosnia and Herzegovina 896 1’692 796 88.8% 1’112 191.7% Brazil 1’188’255 1’283’054 94’799 8.0% 350’934 37.6% Bulgaria 128’853 117’779 -11’074 -8.6% 92’131 359.2% Burkina Faso 56’663 87’490 30’827 54.4% 73’688 533.9% Burundi 81 84 3 3.3% -266 -76.1% Cambodia 27’550 25’757 -1’793 -6.5% 17’673 218.6% Cameroon 1’089 204 -885 -81.3% -292 -59.0% Canada 1’311’572 1’321’072 9’501 0.7% 617’394 87.7% Cape Verde 495 495 0 0.1% 495 Chad 1’113 1’113 1’113 Channel Islands 180 180 0 0.0% -180 -50.0% Chile 16’305 20’897 4’592 28.2% -10’800 -34.1% China 3’135’000 2’216’000 -919’000 -29.3% 1’126’000 103.3% Colombia 22’314 30’447 8’133 36.4% -2’887 -8.7% Comoros 2’142 1’164 -978 -45.6% 119 11.4% Cook Islands 24 15 -9 -35.5% -2 -13.5% Costa Rica 8’964 8’832 -132 -1.5% -2’282 -20.5% Côte d'Ivoire 50’574 66’728 16’154 31.9% 48’594 268.0% Croatia 103’166 108’127 4’961 4.8% 84’775 363.0% Cuba 6’181 2’373 -3’808 -61.6% 267 12.7% Cyprus 6’022 6’240 218 3.6% 2’665 74.5% Czech Republic 538’894 540’986 2’093 0.4% 92’784 20.7% Democratic Republic of the Congo 60’624 88’727 28’103 46.4% 56’204 172.8%
Denmark 256’711 285’526 28’815 11.2% 122’623 75.3% Dominica 240 240 0 0.0% 240 Dominican Republic 169’026 134’375 -34’651 -20.5% -30’734 -18.6% Ecuador 41’793 47’836 6’043 14.5% -16’915 -26.1% Egypt 116’000 116’000 0 0.0% 33’833 41.2% El Salvador 1’679 1’708 29 1.7% -5’029 -74.6% Estonia 206’590 220’737 14’147 6.8% 107’765 95.4% Eswatini 186 843 657 353.7% 837 14427.2% Ethiopia 197’503 221’189 23’686 12.0% 83’993 61.2% Falkland Islands (Malvinas) 31’937 31’937 0 0.0% -366’869 -92.0% Faroe Islands 251 251 0 0.0% -2 -0.7% Fiji 41’154 22’612 -18’542 -45.1% 22’512 22511.8% Finland 297’442 306’484 9’042 3.0% 137’316 81.2% France 2’035’024 2’240’797 205’773 10.1% 1’395’355 165.0% French Guiana (France) 3’103 3’667 564 18.2% 1’891 106.5% French Polynesia 1’512 1’562 49 3.3% -165 -9.6% Gambia 20 68 48 243.5% 68 Georgia 1’452 1’452 0 0.0% 51 3.6% Germany 1’521’314 1’613’785 92’471 6.1% 623’083 62.9% Ghana 29’663 31’199 1’536 5.2% 18’564 146.9% Greece 492’627 528’752 36’125 7.3% 218’929 70.7% Grenada 84 84 0 0.0% -1 -1.7% Guadeloupe (France) 272 492 220 80.9% 465 1722.2% Guatemala 14’000 88’178 74’178 529.8% 74’803 559.3% Guinea 10 1’000 990 9900.0% 1’000 Guinea-Bissau 835 781 -53 -6.4% 781 Guyana 0 #DIV/0! -4’249 -100.0% Haiti 4’403 3’333 -1’070 -24.3% 3’199 2378.9% Honduras 29’274 29’274 0 0.0% 11’449 64.2% Hungary 209’382 303’190 93’808 44.8% 175’585 Iceland 24’855 5’740 -19’115 -76.9% -66 -1.1% India 1’938’221 2’299’222 361’002 18.6% 1’519’222 194.8% Indonesia 251’631 251’619 -12 0.0% 180’505 253.8%
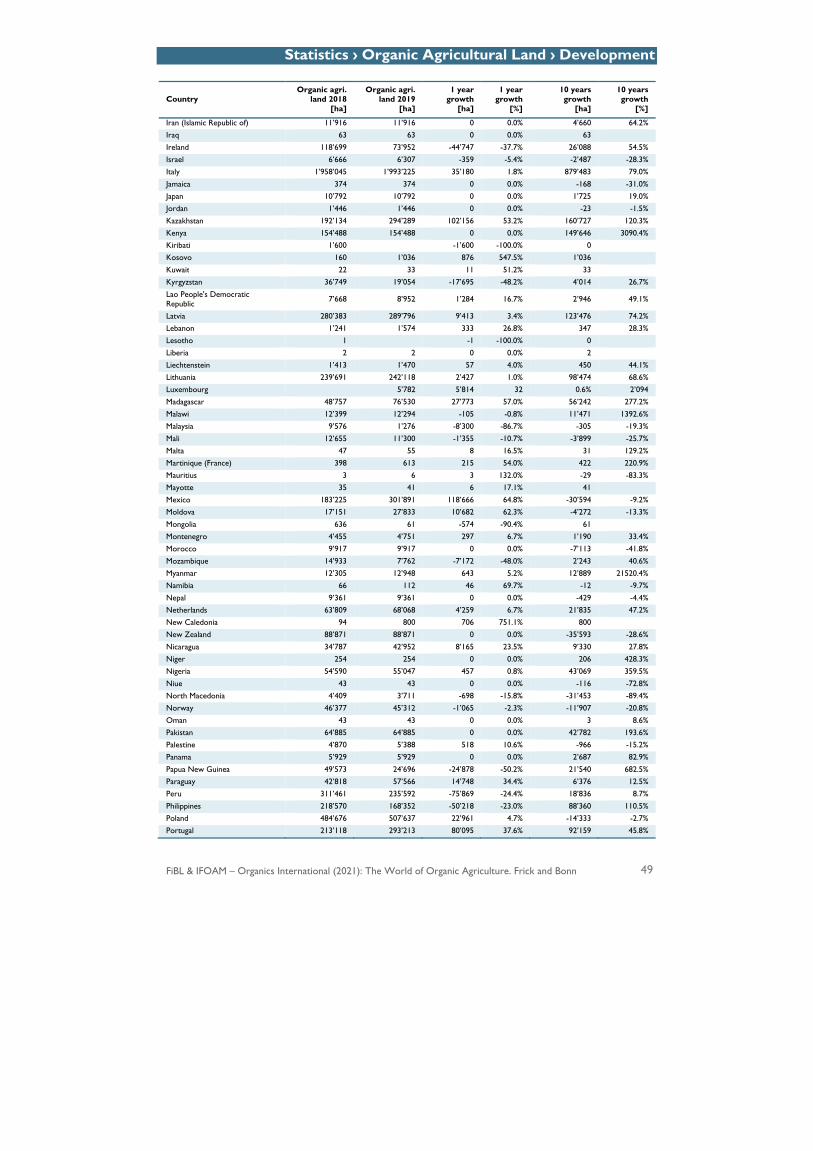
Statistics › Organic Agricultural Land › Development
FiBL & IFOAM – Organics International (2021): The World of Organic Agriculture. Frick and Bonn 49
Country Organic agri.
land 2018 [ha]
Organic agri. land 2019
[ha]
1 year growth
[ha]
1 year growth
[%]
10 years growth
[ha]
10 years growth
[%]
Iran (Islamic Republic of) 11’916 11’916 0 0.0% 4’660 64.2% Iraq 63 63 0 0.0% 63 Ireland 118’699 73’952 -44’747 -37.7% 26’088 54.5% Israel 6’666 6’307 -359 -5.4% -2’487 -28.3% Italy 1’958’045 1’993’225 35’180 1.8% 879’483 79.0% Jamaica 374 374 0 0.0% -168 -31.0% Japan 10’792 10’792 0 0.0% 1’725 19.0% Jordan 1’446 1’446 0 0.0% -23 -1.5% Kazakhstan 192’134 294’289 102’156 53.2% 160’727 120.3% Kenya 154’488 154’488 0 0.0% 149’646 3090.4% Kiribati 1’600 -1’600 -100.0% 0 Kosovo 160 1’036 876 547.5% 1’036 Kuwait 22 33 11 51.2% 33 Kyrgyzstan 36’749 19’054 -17’695 -48.2% 4’014 26.7% Lao People's Democratic Republic 7’668 8’952 1’284 16.7% 2’946 49.1%
Latvia 280’383 289’796 9’413 3.4% 123’476 74.2% Lebanon 1’241 1’574 333 26.8% 347 28.3% Lesotho 1 -1 -100.0% 0 Liberia 2 2 0 0.0% 2 Liechtenstein 1’413 1’470 57 4.0% 450 44.1% Lithuania 239’691 242’118 2’427 1.0% 98’474 68.6% Luxembourg 5’782 5’814 32 0.6% 2’094 Madagascar 48’757 76’530 27’773 57.0% 56’242 277.2% Malawi 12’399 12’294 -105 -0.8% 11’471 1392.6% Malaysia 9’576 1’276 -8’300 -86.7% -305 -19.3% Mali 12’655 11’300 -1’355 -10.7% -3’899 -25.7% Malta 47 55 8 16.5% 31 129.2% Martinique (France) 398 613 215 54.0% 422 220.9% Mauritius 3 6 3 132.0% -29 -83.3% Mayotte 35 41 6 17.1% 41 Mexico 183’225 301’891 118’666 64.8% -30’594 -9.2% Moldova 17’151 27’833 10’682 62.3% -4’272 -13.3% Mongolia 636 61 -574 -90.4% 61 Montenegro 4’455 4’751 297 6.7% 1’190 33.4% Morocco 9’917 9’917 0 0.0% -7’113 -41.8% Mozambique 14’933 7’762 -7’172 -48.0% 2’243 40.6% Myanmar 12’305 12’948 643 5.2% 12’889 21520.4% Namibia 66 112 46 69.7% -12 -9.7% Nepal 9’361 9’361 0 0.0% -429 -4.4% Netherlands 63’809 68’068 4’259 6.7% 21’835 47.2% New Caledonia 94 800 706 751.1% 800 New Zealand 88’871 88’871 0 0.0% -35’593 -28.6% Nicaragua 34’787 42’952 8’165 23.5% 9’330 27.8% Niger 254 254 0 0.0% 206 428.3% Nigeria 54’590 55’047 457 0.8% 43’069 359.5% Niue 43 43 0 0.0% -116 -72.8% North Macedonia 4’409 3’711 -698 -15.8% -31’453 -89.4% Norway 46’377 45’312 -1’065 -2.3% -11’907 -20.8% Oman 43 43 0 0.0% 3 8.6% Pakistan 64’885 64’885 0 0.0% 42’782 193.6% Palestine 4’870 5’388 518 10.6% -966 -15.2% Panama 5’929 5’929 0 0.0% 2’687 82.9% Papua New Guinea 49’573 24’696 -24’878 -50.2% 21’540 682.5% Paraguay 42’818 57’566 14’748 34.4% 6’376 12.5% Peru 311’461 235’592 -75’869 -24.4% 18’836 8.7% Philippines 218’570 168’352 -50’218 -23.0% 88’360 110.5% Poland 484’676 507’637 22’961 4.7% -14’333 -2.7% Portugal 213’118 293’213 80’095 37.6% 92’159 45.8%
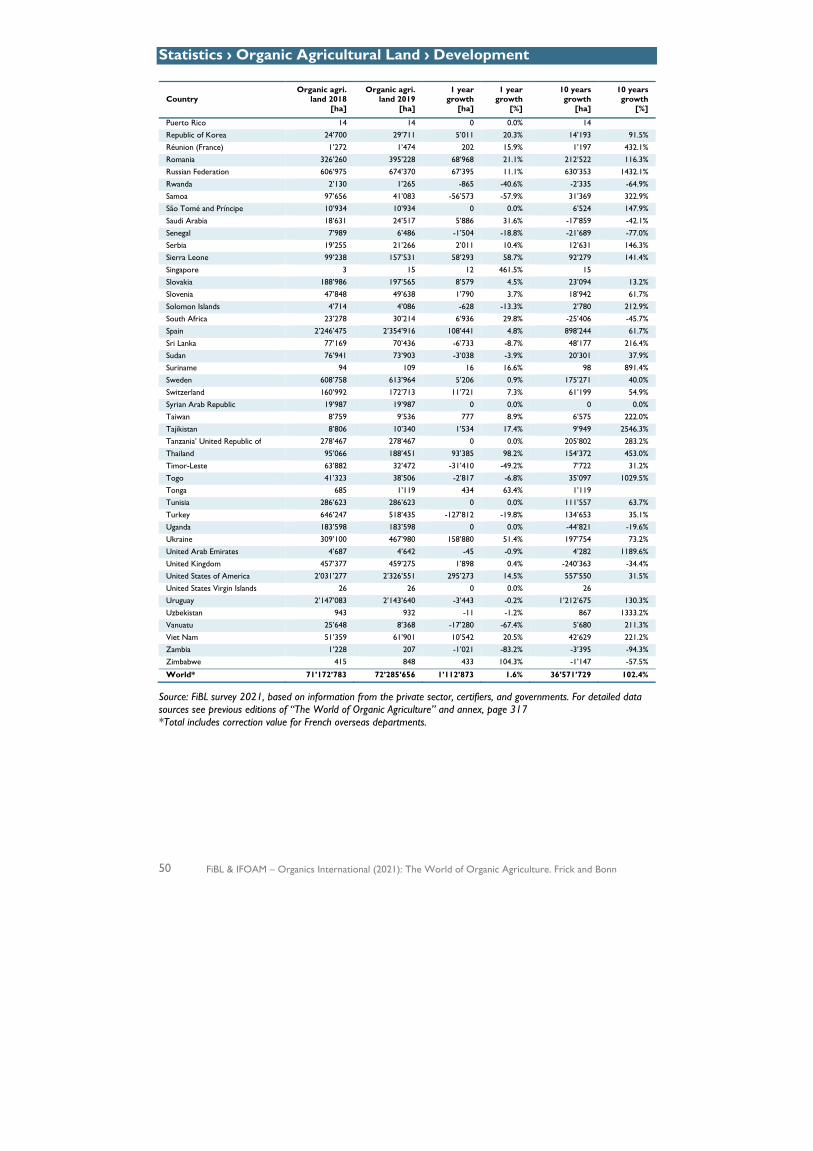
Statistics › Organic Agricultural Land › Development
50 FiBL & IFOAM – Organics International (2021): The World of Organic Agriculture. Frick and Bonn
Country Organic agri.
land 2018 [ha]
Organic agri. land 2019
[ha]
1 year growth
[ha]
1 year growth
[%]
10 years growth
[ha]
10 years growth
[%]
Puerto Rico 14 14 0 0.0% 14 Republic of Korea 24’700 29’711 5’011 20.3% 14’193 91.5% Réunion (France) 1’272 1’474 202 15.9% 1’197 432.1% Romania 326’260 395’228 68’968 21.1% 212’522 116.3% Russian Federation 606’975 674’370 67’395 11.1% 630’353 1432.1% Rwanda 2’130 1’265 -865 -40.6% -2’335 -64.9% Samoa 97’656 41’083 -56’573 -57.9% 31’369 322.9% São Tomé and Príncipe 10’934 10’934 0 0.0% 6’524 147.9% Saudi Arabia 18’631 24’517 5’886 31.6% -17’859 -42.1% Senegal 7’989 6’486 -1’504 -18.8% -21’689 -77.0% Serbia 19’255 21’266 2’011 10.4% 12’631 146.3% Sierra Leone 99’238 157’531 58’293 58.7% 92’279 141.4% Singapore 3 15 12 461.5% 15 Slovakia 188’986 197’565 8’579 4.5% 23’094 13.2% Slovenia 47’848 49’638 1’790 3.7% 18’942 61.7% Solomon Islands 4’714 4’086 -628 -13.3% 2’780 212.9% South Africa 23’278 30’214 6’936 29.8% -25’406 -45.7% Spain 2’246’475 2’354’916 108’441 4.8% 898’244 61.7% Sri Lanka 77’169 70’436 -6’733 -8.7% 48’177 216.4% Sudan 76’941 73’903 -3’038 -3.9% 20’301 37.9% Suriname 94 109 16 16.6% 98 891.4% Sweden 608’758 613’964 5’206 0.9% 175’271 40.0% Switzerland 160’992 172’713 11’721 7.3% 61’199 54.9% Syrian Arab Republic 19’987 19’987 0 0.0% 0 0.0% Taiwan 8’759 9’536 777 8.9% 6’575 222.0% Tajikistan 8’806 10’340 1’534 17.4% 9’949 2546.3% Tanzania’ United Republic of 278’467 278’467 0 0.0% 205’802 283.2% Thailand 95’066 188’451 93’385 98.2% 154’372 453.0% Timor-Leste 63’882 32’472 -31’410 -49.2% 7’722 31.2% Togo 41’323 38’506 -2’817 -6.8% 35’097 1029.5% Tonga 685 1’119 434 63.4% 1’119 Tunisia 286’623 286’623 0 0.0% 111’557 63.7% Turkey 646’247 518’435 -127’812 -19.8% 134’653 35.1% Uganda 183’598 183’598 0 0.0% -44’821 -19.6% Ukraine 309’100 467’980 158’880 51.4% 197’754 73.2% United Arab Emirates 4’687 4’642 -45 -0.9% 4’282 1189.6% United Kingdom 457’377 459’275 1’898 0.4% -240’363 -34.4% United States of America 2’031’277 2’326’551 295’273 14.5% 557’550 31.5% United States Virgin Islands 26 26 0 0.0% 26 Uruguay 2’147’083 2’143’640 -3’443 -0.2% 1’212’675 130.3% Uzbekistan 943 932 -11 -1.2% 867 1333.2% Vanuatu 25’648 8’368 -17’280 -67.4% 5’680 211.3% Viet Nam 51’359 61’901 10’542 20.5% 42’629 221.2% Zambia 1’228 207 -1’021 -83.2% -3’395 -94.3% Zimbabwe 415 848 433 104.3% -1’147 -57.5%
World* 71’172’783 72’285’656 1’112’873 1.6% 36’571’729 102.4%
Source: FiBL survey 2021, based on information from the private sector, certifiers, and governments. For detailed data sources see previous editions of “The World of Organic Agriculture” and annex, page 317 *Total includes correction value for French overseas departments.
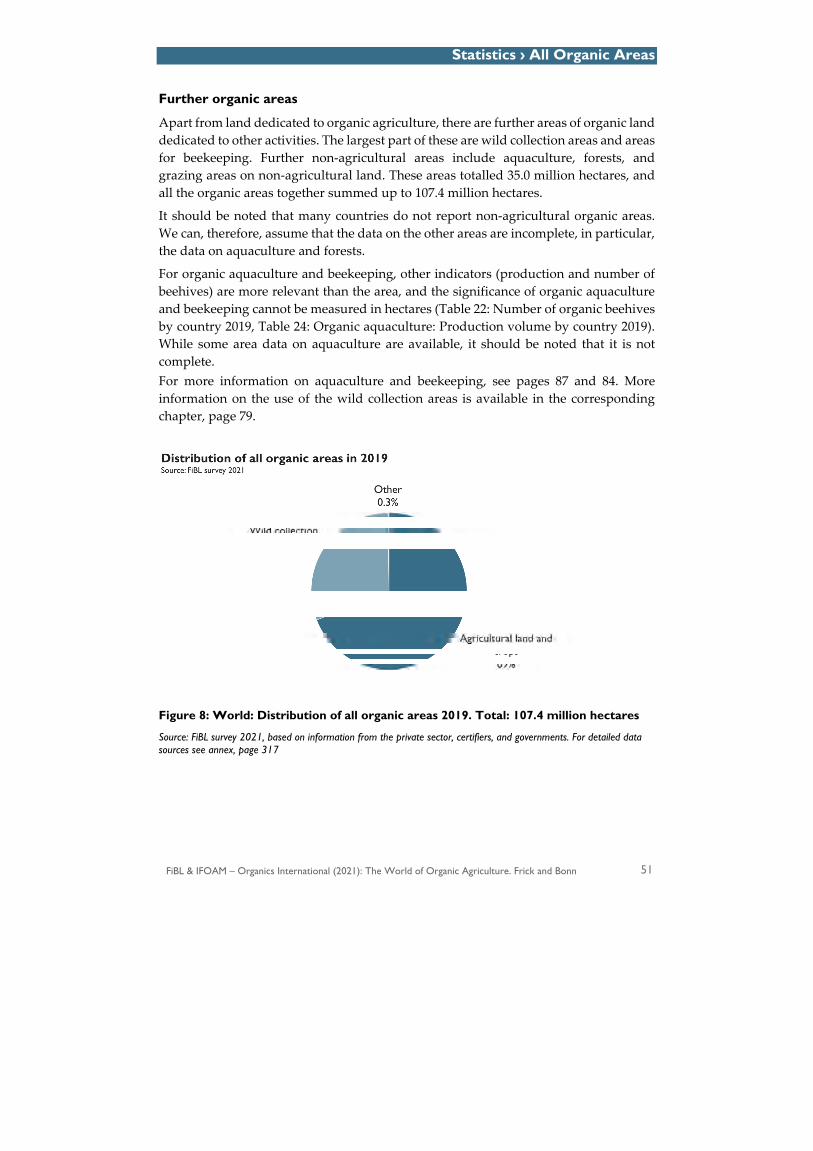
Statistics › All Organic Areas
FiBL & IFOAM – Organics International (2021): The World of Organic Agriculture. Frick and Bonn 51
Further organic areas
Apart from land dedicated to organic agriculture, there are further areas of organic land dedicated to other activities. The largest part of these are wild collection areas and areas for beekeeping. Further non-agricultural areas include aquaculture, forests, and grazing areas on non-agricultural land. These areas totalled 35.0 million hectares, and all the organic areas together summed up to 107.4 million hectares.
It should be noted that many countries do not report non-agricultural organic areas. We can, therefore, assume that the data on the other areas are incomplete, in particular, the data on aquaculture and forests.
For organic aquaculture and beekeeping, other indicators (production and number of beehives) are more relevant than the area, and the significance of organic aquaculture and beekeeping cannot be measured in hectares (Table 22: Number of organic beehives by country 2019, Table 24: Organic aquaculture: Production volume by country 2019). While some area data on aquaculture are available, it should be noted that it is not complete. For more information on aquaculture and beekeeping, see pages 87 and 84. More information on the use of the wild collection areas is available in the corresponding chapter, page 79.
Figure 8: World: Distribution of all organic areas 2019. Total: 107.4 million hectares
Source: FiBL survey 2021, based on information from the private sector, certifiers, and governments. For detailed data sources see annex, page 317
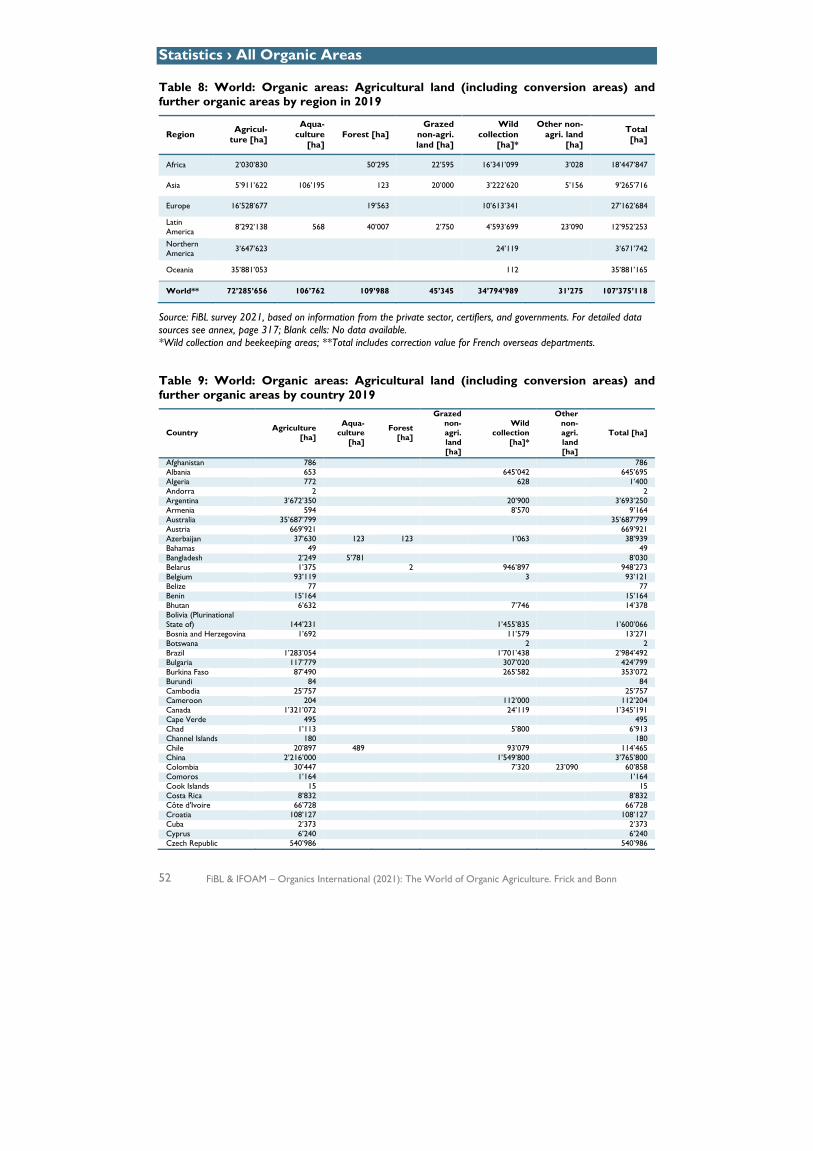
Statistics › All Organic Areas
52 FiBL & IFOAM – Organics International (2021): The World of Organic Agriculture. Frick and Bonn
Table 8: World: Organic areas: Agricultural land (including conversion areas) and further organic areas by region in 2019
Region Agricul-ture [ha]
Aqua-culture
[ha] Forest [ha]
Grazed non-agri. land [ha]
Wild collection
[ha]*
Other non-agri. land
[ha]
Total [ha]
Africa 2’030’830 50’295 22’595 16’341’099 3’028 18’447’847
Asia 5’911’622 106’195 123 20’000 3’222’620 5’156 9’265’716
Europe 16’528’677 19’563 10’613’341 27’162’684
Latin America 8’292’138 568 40’007 2’750 4’593’699 23’090 12’952’253
Northern America 3’647’623 24’119 3’671’742
Oceania 35’881’053 112 35’881’165
World** 72’285’656 106’762 109’988 45’345 34’794’989 31’275 107’375’118
Source: FiBL survey 2021, based on information from the private sector, certifiers, and governments. For detailed data sources see annex, page 317; Blank cells: No data available. *Wild collection and beekeeping areas; **Total includes correction value for French overseas departments.
Table 9: World: Organic areas: Agricultural land (including conversion areas) and further organic areas by country 2019
Country Agriculture [ha]
Aqua-culture
[ha]
Forest [ha]
Grazed non-agri. land [ha]
Wild collection
[ha]*
Other non-agri. land [ha]
Total [ha]
Afghanistan 786 786 Albania 653 645’042 645’695 Algeria 772 628 1’400 Andorra 2 2 Argentina 3’672’350 20’900 3’693’250 Armenia 594 8’570 9’164 Australia 35’687’799 35’687’799 Austria 669’921 669’921 Azerbaijan 37’630 123 123 1’063 38’939 Bahamas 49 49 Bangladesh 2’249 5’781 8’030 Belarus 1’375 2 946’897 948’273 Belgium 93’119 3 93’121 Belize 77 77 Benin 15’164 15’164 Bhutan 6’632 7’746 14’378 Bolivia (Plurinational State of) 144’231 1’455’835 1’600’066 Bosnia and Herzegovina 1’692 11’579 13’271 Botswana 2 2 Brazil 1’283’054 1’701’438 2’984’492 Bulgaria 117’779 307’020 424’799 Burkina Faso 87’490 265’582 353’072 Burundi 84 84 Cambodia 25’757 25’757 Cameroon 204 112’000 112’204 Canada 1’321’072 24’119 1’345’191 Cape Verde 495 495 Chad 1’113 5’800 6’913 Channel Islands 180 180 Chile 20’897 489 93’079 114’465 China 2’216’000 1’549’800 3’765’800 Colombia 30’447 7’320 23’090 60’858 Comoros 1’164 1’164 Cook Islands 15 15 Costa Rica 8’832 8’832 Côte d'Ivoire 66’728 66’728 Croatia 108’127 108’127 Cuba 2’373 2’373 Cyprus 6’240 6’240 Czech Republic 540’986 540’986
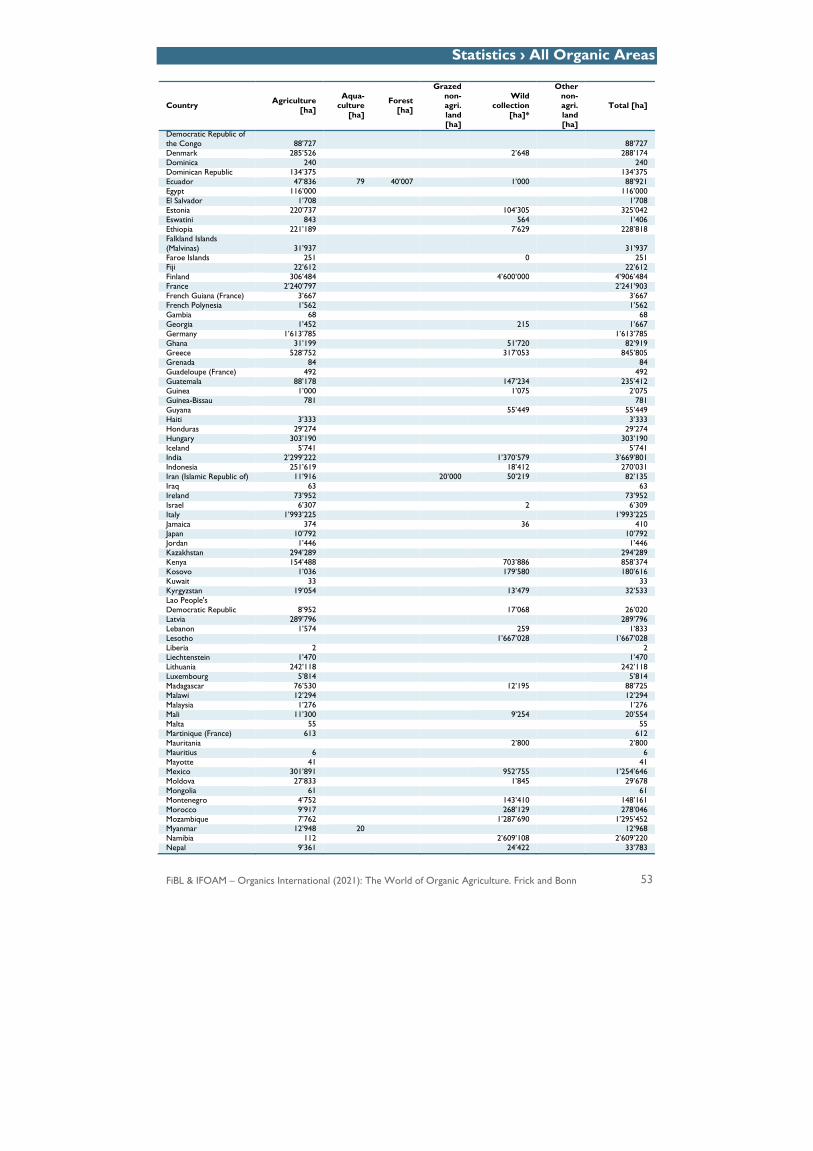
Statistics › All Organic Areas
FiBL & IFOAM – Organics International (2021): The World of Organic Agriculture. Frick and Bonn 53
Country Agriculture [ha]
Aqua-culture
[ha]
Forest [ha]
Grazed non-agri. land [ha]
Wild collection
[ha]*
Other non-agri. land [ha]
Total [ha]
Democratic Republic of the Congo 88’727 88’727 Denmark 285’526 2’648 288’174 Dominica 240 240 Dominican Republic 134’375 134’375 Ecuador 47’836 79 40’007 1’000 88’921 Egypt 116’000 116’000 El Salvador 1’708 1’708 Estonia 220’737 104’305 325’042 Eswatini 843 564 1’406 Ethiopia 221’189 7’629 228’818 Falkland Islands (Malvinas) 31’937 31’937 Faroe Islands 251 0 251 Fiji 22’612 22’612 Finland 306’484 4’600’000 4’906’484 France 2’240’797 2’241’903 French Guiana (France) 3’667 3’667 French Polynesia 1’562 1’562 Gambia 68 68 Georgia 1’452 215 1’667 Germany 1’613’785 1’613’785 Ghana 31’199 51’720 82’919 Greece 528’752 317’053 845’805 Grenada 84 84 Guadeloupe (France) 492 492 Guatemala 88’178 147’234 235’412 Guinea 1’000 1’075 2’075 Guinea-Bissau 781 781 Guyana 55’449 55’449 Haiti 3’333 3’333 Honduras 29’274 29’274 Hungary 303’190 303’190 Iceland 5’741 5’741 India 2’299’222 1’370’579 3’669’801 Indonesia 251’619 18’412 270’031 Iran (Islamic Republic of) 11’916 20’000 50’219 82’135 Iraq 63 63 Ireland 73’952 73’952 Israel 6’307 2 6’309 Italy 1’993’225 1’993’225 Jamaica 374 36 410 Japan 10’792 10’792 Jordan 1’446 1’446 Kazakhstan 294’289 294’289 Kenya 154’488 703’886 858’374 Kosovo 1’036 179’580 180’616 Kuwait 33 33 Kyrgyzstan 19’054 13’479 32’533 Lao People's Democratic Republic 8’952 17’068 26’020 Latvia 289’796 289’796 Lebanon 1’574 259 1’833 Lesotho 1’667’028 1’667’028 Liberia 2 2 Liechtenstein 1’470 1’470 Lithuania 242’118 242’118 Luxembourg 5’814 5’814 Madagascar 76’530 12’195 88’725 Malawi 12’294 12’294 Malaysia 1’276 1’276 Mali 11’300 9’254 20’554 Malta 55 55 Martinique (France) 613 612 Mauritania 2’800 2’800 Mauritius 6 6 Mayotte 41 41 Mexico 301’891 952’755 1’254’646 Moldova 27’833 1’845 29’678 Mongolia 61 61 Montenegro 4’752 143’410 148’161 Morocco 9’917 268’129 278’046 Mozambique 7’762 1’287’690 1’295’452 Myanmar 12’948 20 12’968 Namibia 112 2’609’108 2’609’220 Nepal 9’361 24’422 33’783
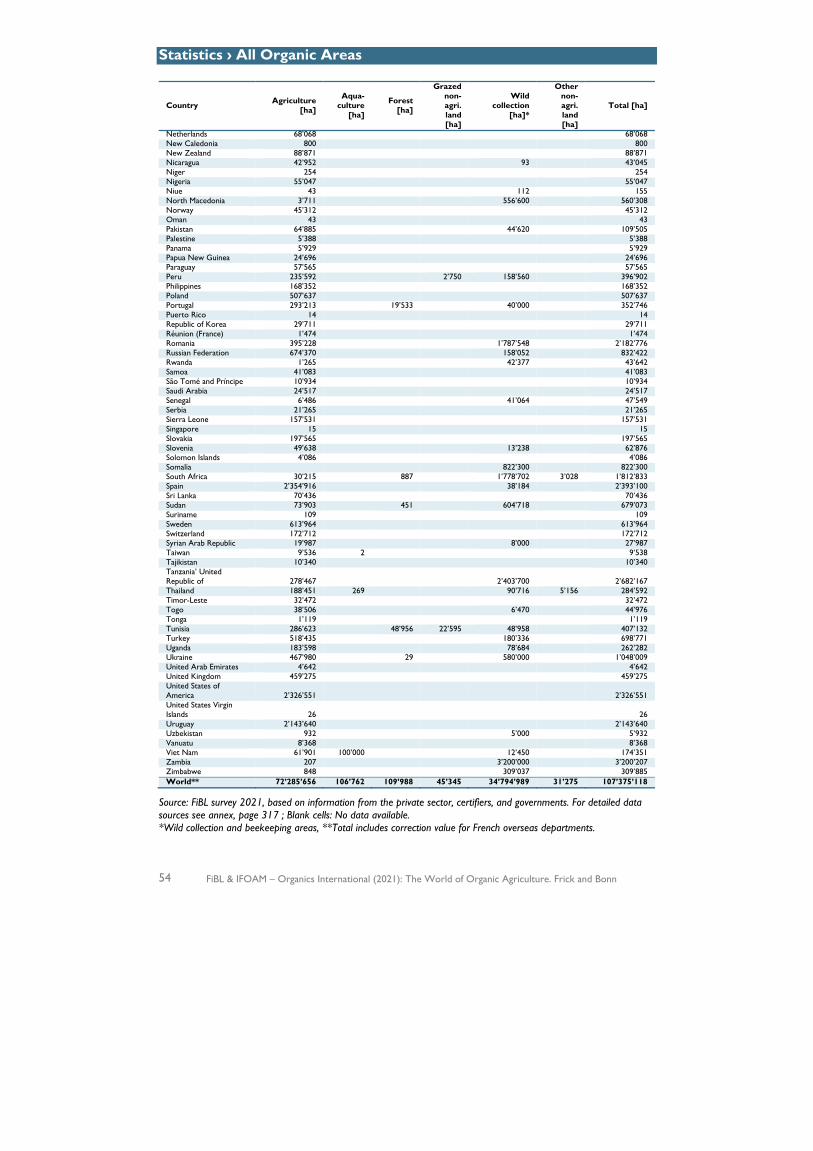
Statistics › All Organic Areas
54 FiBL & IFOAM – Organics International (2021): The World of Organic Agriculture. Frick and Bonn
Country Agriculture [ha]
Aqua-culture
[ha]
Forest [ha]
Grazed non-agri. land [ha]
Wild collection
[ha]*
Other non-agri. land [ha]
Total [ha]
Netherlands 68’068 68’068 New Caledonia 800 800 New Zealand 88’871 88’871 Nicaragua 42’952 93 43’045 Niger 254 254 Nigeria 55’047 55’047 Niue 43 112 155 North Macedonia 3’711 556’600 560’308 Norway 45’312 45’312 Oman 43 43 Pakistan 64’885 44’620 109’505 Palestine 5’388 5’388 Panama 5’929 5’929 Papua New Guinea 24’696 24’696 Paraguay 57’565 57’565 Peru 235’592 2’750 158’560 396’902 Philippines 168’352 168’352 Poland 507’637 507’637 Portugal 293’213 19’533 40’000 352’746 Puerto Rico 14 14 Republic of Korea 29’711 29’711 Réunion (France) 1’474 1’474 Romania 395’228 1’787’548 2’182’776 Russian Federation 674’370 158’052 832’422 Rwanda 1’265 42’377 43’642 Samoa 41’083 41’083 São Tomé and Príncipe 10’934 10’934 Saudi Arabia 24’517 24’517 Senegal 6’486 41’064 47’549 Serbia 21’265 21’265 Sierra Leone 157’531 157’531 Singapore 15 15 Slovakia 197’565 197’565 Slovenia 49’638 13’238 62’876 Solomon Islands 4’086 4’086 Somalia 822’300 822’300 South Africa 30’215 887 1’778’702 3’028 1’812’833 Spain 2’354’916 38’184 2’393’100 Sri Lanka 70’436 70’436 Sudan 73’903 451 604’718 679’073 Suriname 109 109 Sweden 613’964 613’964 Switzerland 172’712 172’712 Syrian Arab Republic 19’987 8’000 27’987 Taiwan 9’536 2 9’538 Tajikistan 10’340 10’340 Tanzania’ United Republic of 278’467 2’403’700 2’682’167 Thailand 188’451 269 90’716 5’156 284’592 Timor-Leste 32’472 32’472 Togo 38’506 6’470 44’976 Tonga 1’119 1’119 Tunisia 286’623 48’956 22’595 48’958 407’132 Turkey 518’435 180’336 698’771 Uganda 183’598 78’684 262’282 Ukraine 467’980 29 580’000 1’048’009 United Arab Emirates 4’642 4’642 United Kingdom 459’275 459’275 United States of America 2’326’551 2’326’551 United States Virgin Islands 26 26 Uruguay 2’143’640 2’143’640 Uzbekistan 932 5’000 5’932 Vanuatu 8’368 8’368 Viet Nam 61’901 100’000 12’450 174’351 Zambia 207 3’200’000 3’200’207 Zimbabwe 848 309’037 309’885 World** 72’285’656 106’762 109’988 45’345 34’794’989 31’275 107’375’118
Source: FiBL survey 2021, based on information from the private sector, certifiers, and governments. For detailed data sources see annex, page 317 ; Blank cells: No data available. *Wild collection and beekeeping areas, **Total includes correction value for French overseas departments.
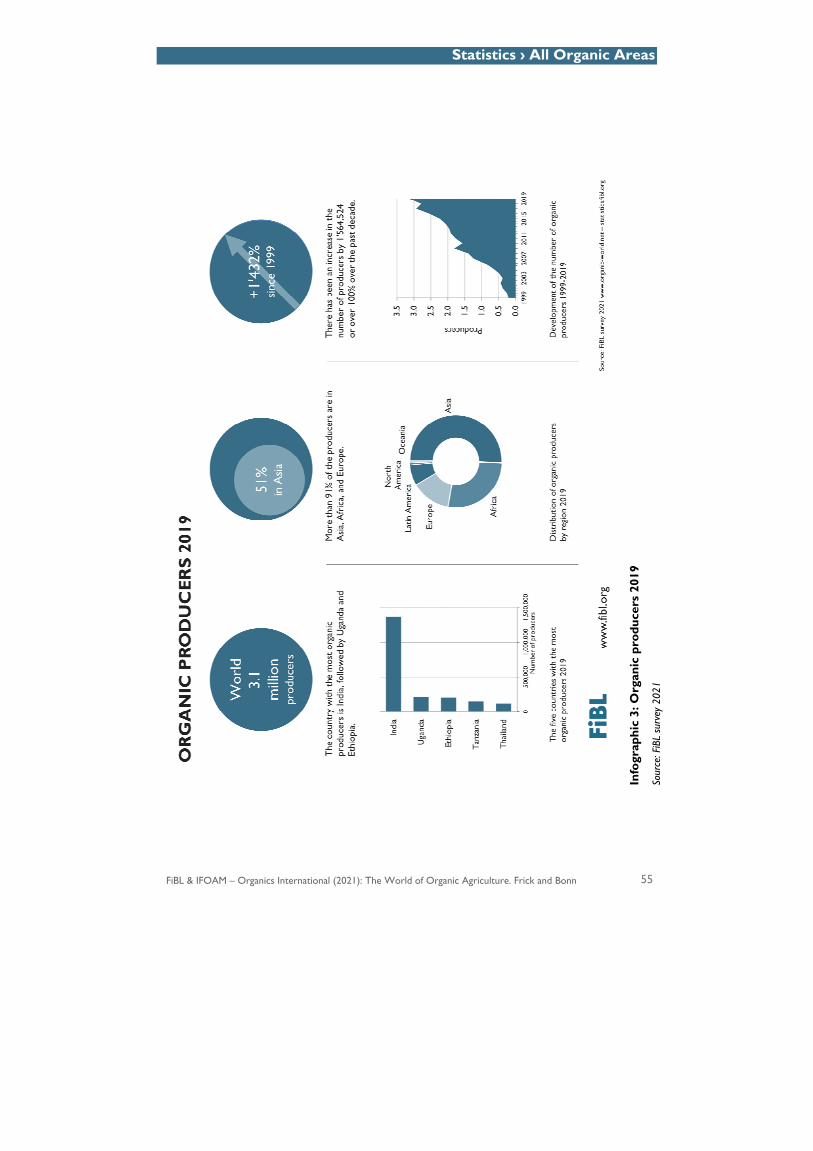
Statistics › All Organic Areas
FiBL & IFOAM – Organics International (2021): The World of Organic Agriculture. Frick and Bonn 55
Info
grap
hic
3: O
rgan
ic p
rodu
cers
201
9
Sour
ce: F
iBL
surv
ey 2
021
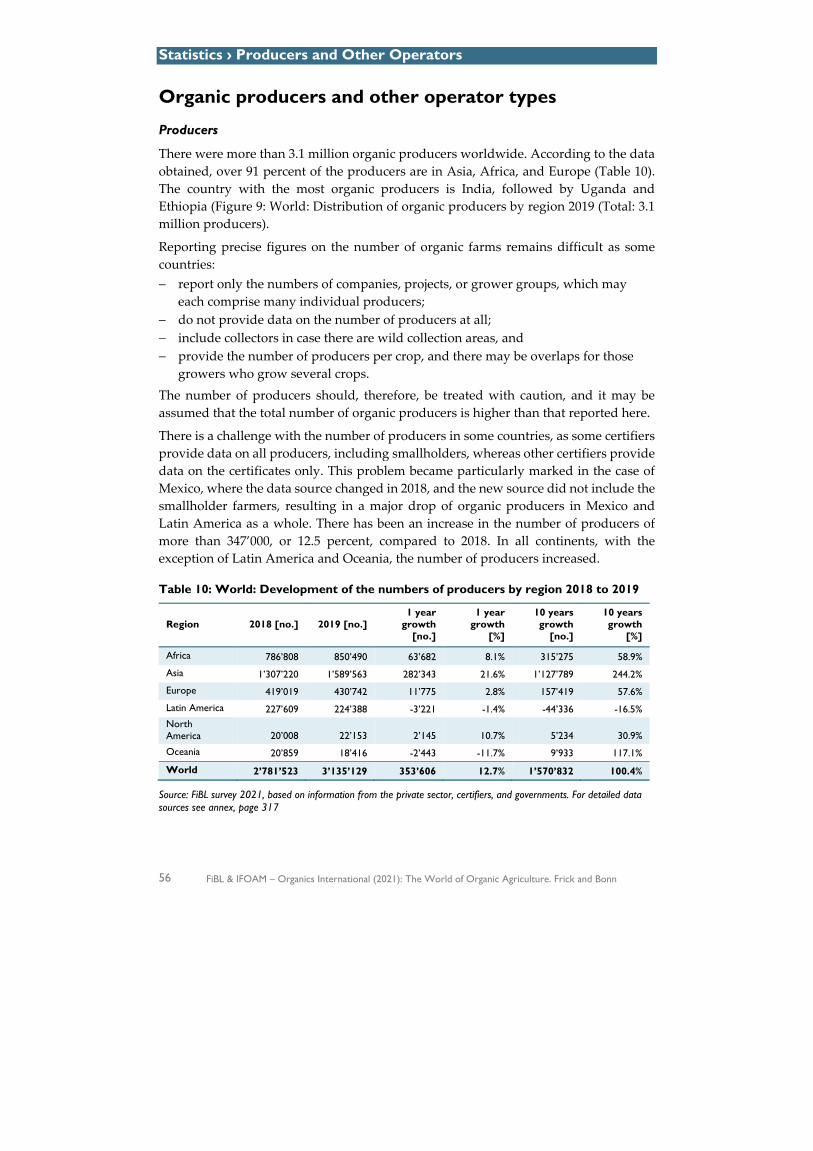
Statistics › Producers and Other Operators
56 FiBL & IFOAM – Organics International (2021): The World of Organic Agriculture. Frick and Bonn
Organic producers and other operator types
Producers
There were more than 3.1 million organic producers worldwide. According to the data obtained, over 91 percent of the producers are in Asia, Africa, and Europe (Table 10). The country with the most organic producers is India, followed by Uganda and Ethiopia (Figure 9: World: Distribution of organic producers by region 2019 (Total: 3.1 million producers).
Reporting precise figures on the number of organic farms remains difficult as some countries: ! report only the numbers of companies, projects, or grower groups, which may
each comprise many individual producers; ! do not provide data on the number of producers at all; ! include collectors in case there are wild collection areas, and ! provide the number of producers per crop, and there may be overlaps for those
growers who grow several crops. The number of producers should, therefore, be treated with caution, and it may be assumed that the total number of organic producers is higher than that reported here.
There is a challenge with the number of producers in some countries, as some certifiers provide data on all producers, including smallholders, whereas other certifiers provide data on the certificates only. This problem became particularly marked in the case of Mexico, where the data source changed in 2018, and the new source did not include the smallholder farmers, resulting in a major drop of organic producers in Mexico and Latin America as a whole. There has been an increase in the number of producers of more than 347’000, or 12.5 percent, compared to 2018. In all continents, with the exception of Latin America and Oceania, the number of producers increased.
Table 10: World: Development of the numbers of producers by region 2018 to 2019
Region 2018 [no.] 2019 [no.] 1 year
growth [no.]
1 year growth
[%]
10 years growth
[no.]
10 years growth
[%]
Africa 786’808 850’490 63’682 8.1% 315’275 58.9%
Asia 1’307’220 1’589’563 282’343 21.6% 1’127’789 244.2%
Europe 419’019 430’742 11’775 2.8% 157’419 57.6%
Latin America 227’609 224’388 -3’221 -1.4% -44’336 -16.5% North America 20’008 22’153 2’145 10.7% 5’234 30.9%
Oceania 20’859 18’416 -2’443 -11.7% 9’933 117.1%
World 2’781’523 3’135’129 353’606 12.7% 1’570’832 100.4%
Source: FiBL survey 2021, based on information from the private sector, certifiers, and governments. For detailed data sources see annex, page 317
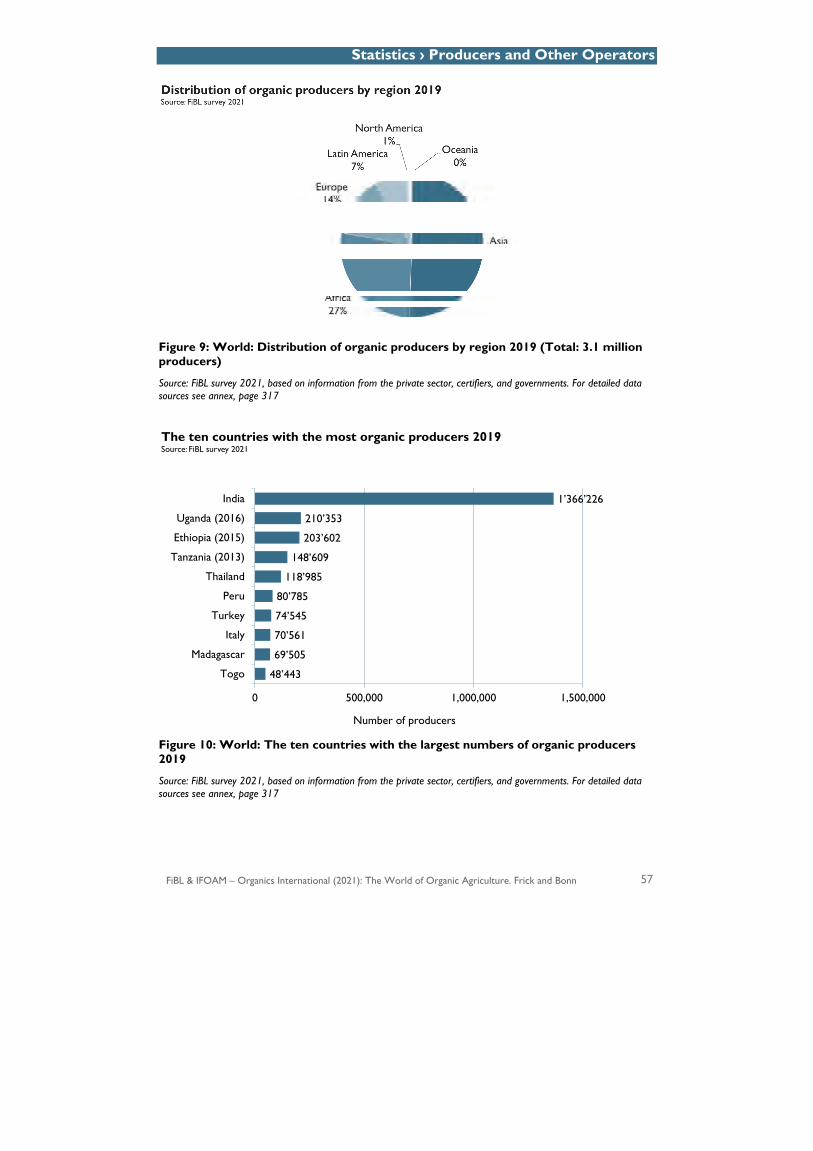
Statistics › Producers and Other Operators
FiBL & IFOAM – Organics International (2021): The World of Organic Agriculture. Frick and Bonn 57
Figure 9: World: Distribution of organic producers by region 2019 (Total: 3.1 million producers)
Source: FiBL survey 2021, based on information from the private sector, certifiers, and governments. For detailed data sources see annex, page 317
Figure 10: World: The ten countries with the largest numbers of organic producers 2019
Source: FiBL survey 2021, based on information from the private sector, certifiers, and governments. For detailed data sources see annex, page 317
48’443
69’505
70’561
74’545
80’785
118’985
148’609
203’602
210’353
1’366’226
0 500,000 1,000,000 1,500,000
Togo
Madagascar
Italy
Turkey
Peru
Thailand
Tanzania (2013)
Ethiopia (2015)
Uganda (2016)
India
Number of producers
The ten countries with the most organic producers 2019Source: FiBL survey 2021
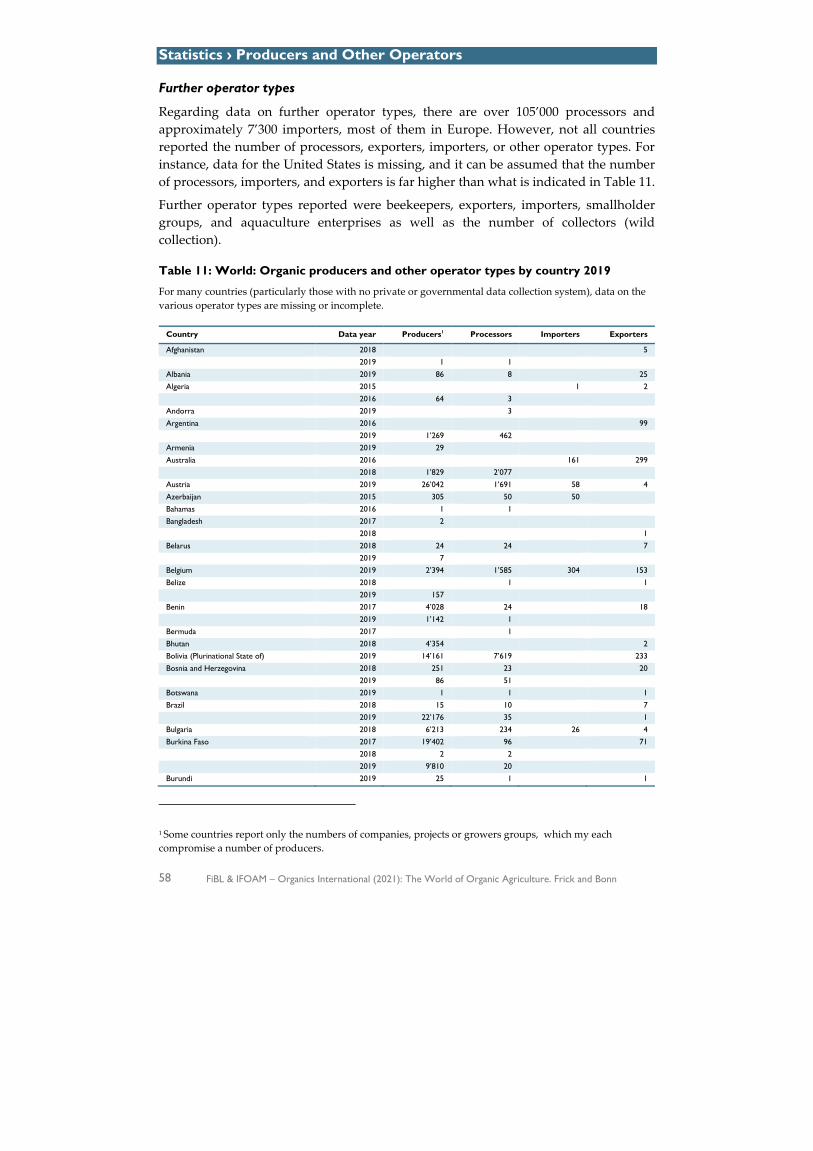
Statistics › Producers and Other Operators
58 FiBL & IFOAM – Organics International (2021): The World of Organic Agriculture. Frick and Bonn
Further operator types
Regarding data on further operator types, there are over 105’000 processors and approximately 7’300 importers, most of them in Europe. However, not all countries reported the number of processors, exporters, importers, or other operator types. For instance, data for the United States is missing, and it can be assumed that the number of processors, importers, and exporters is far higher than what is indicated in Table 11.
Further operator types reported were beekeepers, exporters, importers, smallholder groups, and aquaculture enterprises as well as the number of collectors (wild collection).
Table 11: World: Organic producers and other operator types by country 2019
For many countries (particularly those with no private or governmental data collection system), data on the various operator types are missing or incomplete.
Country Data year Producers1 Processors Importers Exporters
Afghanistan 2018 5 2019 1 1
Albania 2019 86 8 25 Algeria 2015 1 2 2016 64 3
Andorra 2019 3 Argentina 2016 99 2019 1’269 462
Armenia 2019 29 Australia 2016 161 299 2018 1’829 2’077
Austria 2019 26’042 1’691 58 4 Azerbaijan 2015 305 50 50 Bahamas 2016 1 1 Bangladesh 2017 2 2018
1
Belarus 2018 24 24 7 2019 7
Belgium 2019 2’394 1’585 304 153 Belize 2018 1 1 2019 157
Benin 2017 4’028 24 18 2019 1’142 1
Bermuda 2017 1 Bhutan 2018 4’354 2 Bolivia (Plurinational State of) 2019 14’161 7’619 233 Bosnia and Herzegovina 2018 251 23 20 2019 86 51
Botswana 2019 1 1 1 Brazil 2018 15 10 7 2019 22’176 35
1
Bulgaria 2018 6’213 234 26 4 Burkina Faso 2017 19’402 96 71 2018 2 2
2019 9’810 20
Burundi 2019 25 1 1
1 Some countries report only the numbers of companies, projects or growers groups, which my each compromise a number of producers.
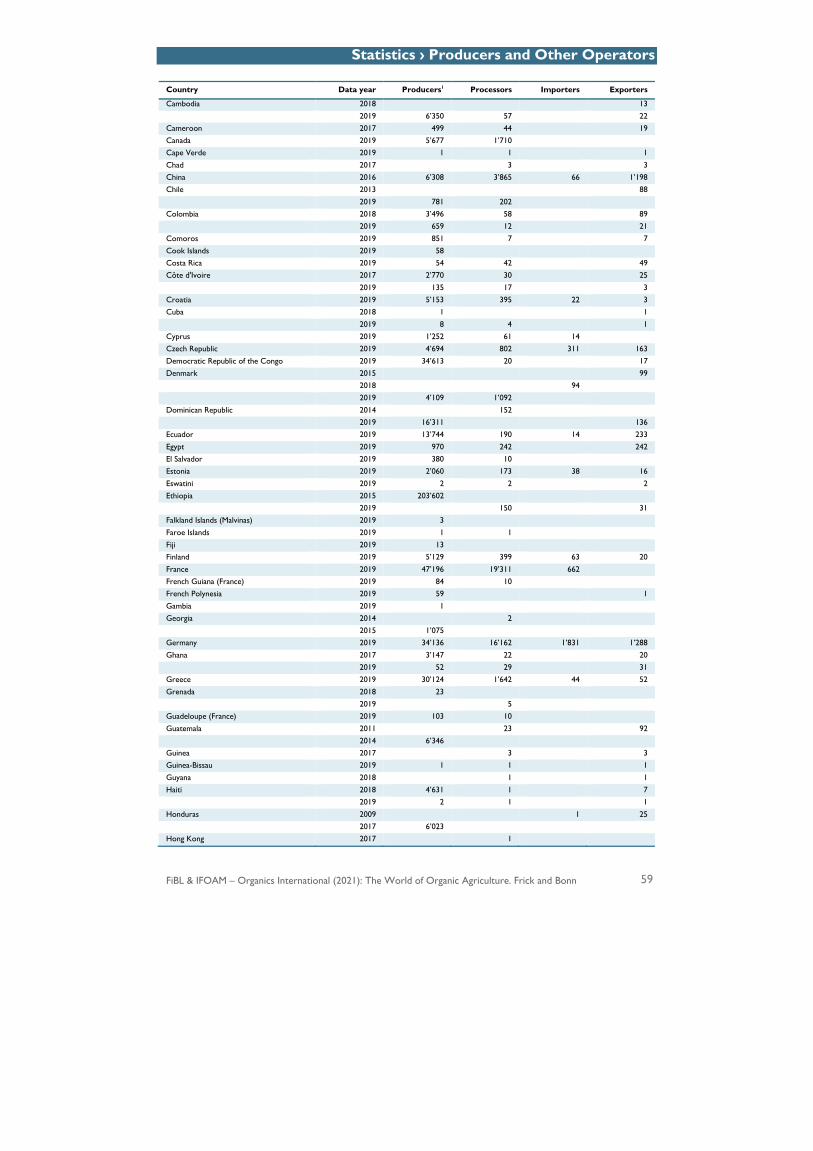
Statistics › Producers and Other Operators
FiBL & IFOAM – Organics International (2021): The World of Organic Agriculture. Frick and Bonn 59
Country Data year Producers1 Processors Importers Exporters
Cambodia 2018 13 2019 6’350 57
22
Cameroon 2017 499 44 19 Canada 2019 5’677 1’710 Cape Verde 2019 1 1 1 Chad 2017 3 3 China 2016 6’308 3’865 66 1’198 Chile 2013 88 2019 781 202
Colombia 2018 3’496 58 89 2019 659 12
21
Comoros 2019 851 7 7 Cook Islands 2019 58 Costa Rica 2019 54 42 49 Côte d'Ivoire 2017 2’770 30 25 2019 135 17
3
Croatia 2019 5’153 395 22 3 Cuba 2018 1 1 2019 8 4
1
Cyprus 2019 1’252 61 14 Czech Republic 2019 4’694 802 311 163 Democratic Republic of the Congo 2019 34’613 20 17 Denmark 2015 99 2018
94
2019 4’109 1’092
Dominican Republic 2014 152 2019 16’311
136
Ecuador 2019 13’744 190 14 233 Egypt 2019 970 242 242 El Salvador 2019 380 10 Estonia 2019 2’060 173 38 16 Eswatini 2019 2 2 2 Ethiopia 2015 203’602 2019 150
31
Falkland Islands (Malvinas) 2019 3 Faroe Islands 2019 1 1 Fiji 2019 13 Finland 2019 5’129 399 63 20 France 2019 47’196 19’311 662 French Guiana (France) 2019 84 10 French Polynesia 2019 59 1 Gambia 2019 1 Georgia 2014 2 2015 1’075
Germany 2019 34’136 16’162 1’831 1’288 Ghana 2017 3’147 22 20 2019 52 29
31
Greece 2019 30’124 1’642 44 52 Grenada 2018 23 2019 5
Guadeloupe (France) 2019 103 10 Guatemala 2011 23 92 2014 6’346
Guinea 2017 3 3 Guinea-Bissau 2019 1 1 1 Guyana 2018 1 1 Haiti 2018 4’631 1 7 2019 2 1
1
Honduras 2009 1 25 2017 6’023
Hong Kong 2017 1

Statistics › Producers and Other Operators
60 FiBL & IFOAM – Organics International (2021): The World of Organic Agriculture. Frick and Bonn
Country Data year Producers1 Processors Importers Exporters
Hungary 2019 5’136 523 44 Iceland 2019 26 20 2 India 2019 1’366’226 1’667 Indonesia 2017 17’836 120 2018 326 655
224
2019 5
Iran (Islamic Republic of) 2019 24 50 28 Ireland 2016 24 2017 1’725 26
2
Israel 2019 350 144 78 48 Italy 2019 70’561 21’940 527 741 Jamaica 2016 127 2019 4
Japan 2018 3’678 3’361 302 Jordan 2016 4 2017 23 5
Kazakhstan 2015 7 2017 10
2018 19 1
2 2019 12 6
Kenya 2018 37’295 22 15 32 2019 4
Kosovo 2019 200 35 8 Kuwait 2019 1 1 1 1 Kyrgyzstan 2019 1’051 9 6 Lao People's Democratic Republic 2011 1’342 1 2019 823 1
Latvia 2017 4’178 51 10 0 Lebanon 2019 122 69 5 Lesotho 2019 3 3 1 Liberia 2019 1 Liechtenstein 2019 47 Lithuania 2019 2’417 124 3 Luxembourg 2019 105 101 7 Madagascar 2017 1’728 2019 67’777 196
148
Malawi 2018 1 1 1 2019 4 4 1 4 Malaysia 2019 31 34 13 Mali 2017 12’272 13 16 Malta 2019 24 7 14 Martinique (France) 2019 80 21 Mauritania 2017 1 1 Mauritius 2019 19 5 5 Mayotte 2019 11 Mexico 2018 39 24 2019 36’587
Moldova 2019 241 21 3 52 Monaco 2019 2 Mongolia 2019 112 1 Montenegro 2019 393 11 Morocco 2016 75 2018 277
215
Mozambique 2018 2 2019 149 12
10
Myanmar 2018 27 2019 48 81
1
Namibia 2019 13 15 1 Nepal 2017 983 2018 6
Netherlands 2019 1’867 1’021 462 120
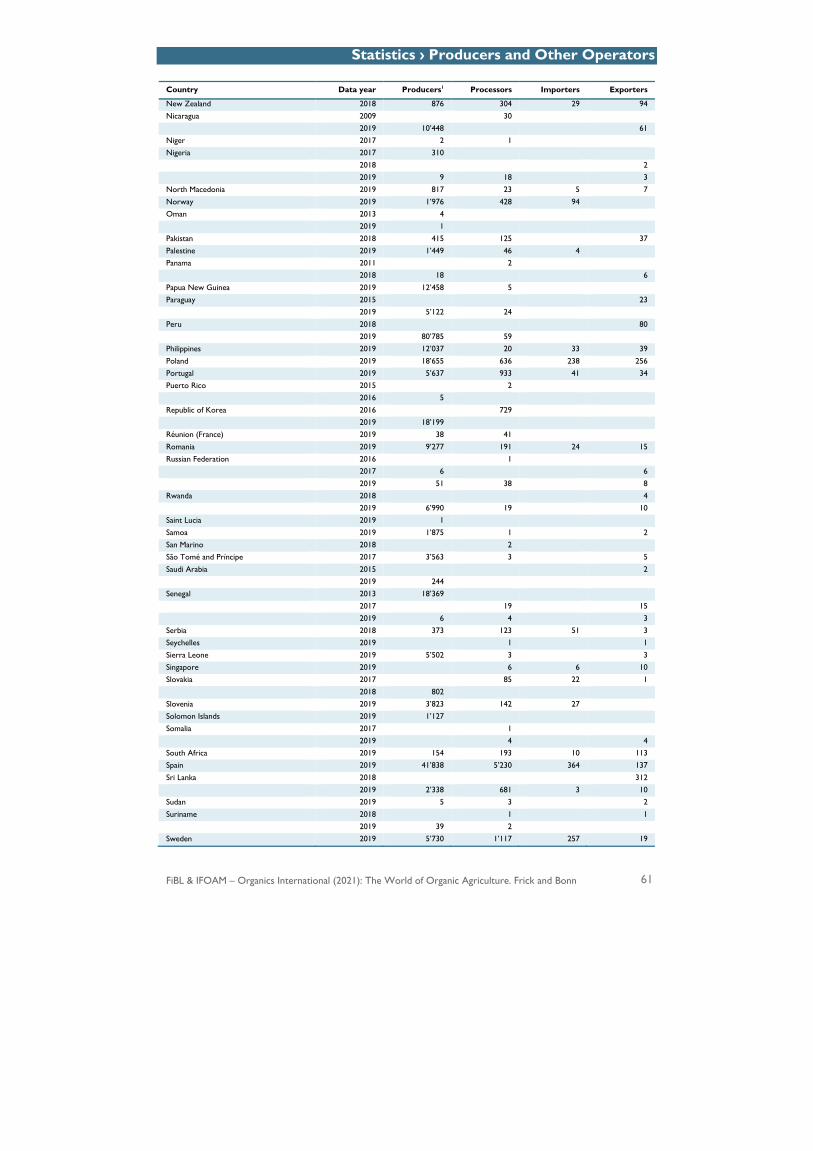
Statistics › Producers and Other Operators
FiBL & IFOAM – Organics International (2021): The World of Organic Agriculture. Frick and Bonn 61
Country Data year Producers1 Processors Importers Exporters
New Zealand 2018 876 304 29 94 Nicaragua 2009 30 2019 10’448
61
Niger 2017 2 1 Nigeria 2017 310 2018
2
2019 9 18
3 North Macedonia 2019 817 23 5 7 Norway 2019 1’976 428 94 Oman 2013 4 2019 1
Pakistan 2018 415 125 37 Palestine 2019 1’449 46 4 Panama 2011 2 2018 18
6
Papua New Guinea 2019 12’458 5 Paraguay 2015 23 2019 5’122 24
Peru 2018 80 2019 80’785 59
Philippines 2019 12’037 20 33 39 Poland 2019 18’655 636 238 256 Portugal 2019 5’637 933 41 34 Puerto Rico 2015 2 2016 5 Republic of Korea 2016 729 2019 18’199 Réunion (France) 2019 38 41 Romania 2019 9’277 191 24 15 Russian Federation 2016 1 2017 6 6 2019 51 38 8 Rwanda 2018 4 2019 6’990 19 10 Saint Lucia 2019 1 Samoa 2019 1’875 1 2 San Marino 2018 2 São Tomé and Príncipe 2017 3’563 3 5 Saudi Arabia 2015 2 2019 244 Senegal 2013 18’369 2017 19 15 2019 6 4 3 Serbia 2018 373 123 51 3 Seychelles 2019 1 1 Sierra Leone 2019 5’502 3 3 Singapore 2019 6 6 10 Slovakia 2017 85 22 1 2018 802 Slovenia 2019 3’823 142 27 Solomon Islands 2019 1’127 Somalia 2017 1 2019 4 4 South Africa 2019 154 193 10 113 Spain 2019 41’838 5’230 364 137 Sri Lanka 2018 312 2019 2’338 681 3 10 Sudan 2019 5 3 2 Suriname 2018 1 1 2019 39 2 Sweden 2019 5’730 1’117 257 19

Statistics › Producers and Other Operators
62 FiBL & IFOAM – Organics International (2021): The World of Organic Agriculture. Frick and Bonn
Country Data year Producers1 Processors Importers Exporters
Switzerland 2017 1’289 548 18 2019 7’284 Syrian Arab Republic 2009 9 2010 2’458 Taiwan 2019 3’761 11 Tajikistan 2018 949 1 Tanzania’ United Republic of 2011 28 2013 148’607 2019 2 2 Thailand 2018 2 2019 118’985 214 Timor-Leste 2018 4 2019 4 16 Togo 2017 19’708 42 31 2018 1’770 2019 26’965 1 Tonga 2019 81 1 1 Trinidad and Tobago 2019 4 Tunisia 2018 7’456 330 12 149 Turkey 2019 74’545 1’356 58 209 Uganda 2016 210’352 2019 1 66 19 Ukraine 2018 470 20 18 United Arab Emirates 2017 95 2019 7 5 8 10 United Kingdom 2019 3’581 2’566 216 United States of America 2019 16’476 United States Virgin Islands 2017 1 Uruguay 2018 21 6 2019 748 1 10 Uzbekistan 2018 1 2019 1 Vanuatu 2019 40 Venezuela (Bolivarian Republic of) 2018 1 1 Viet Nam 2018 555 40 60 2019 17’174 Zambia 2019 5 5 5 Zimbabwe 2019 8 8 6
World* 3’135’129 109’230 7’355 8’622
Source: FiBL survey 2021, based on information from the private sector, certifiers, and governments. For detailed data sources see annex, page 317 Blank cells: No data available. *Total number includes data for countries with less than three operators.
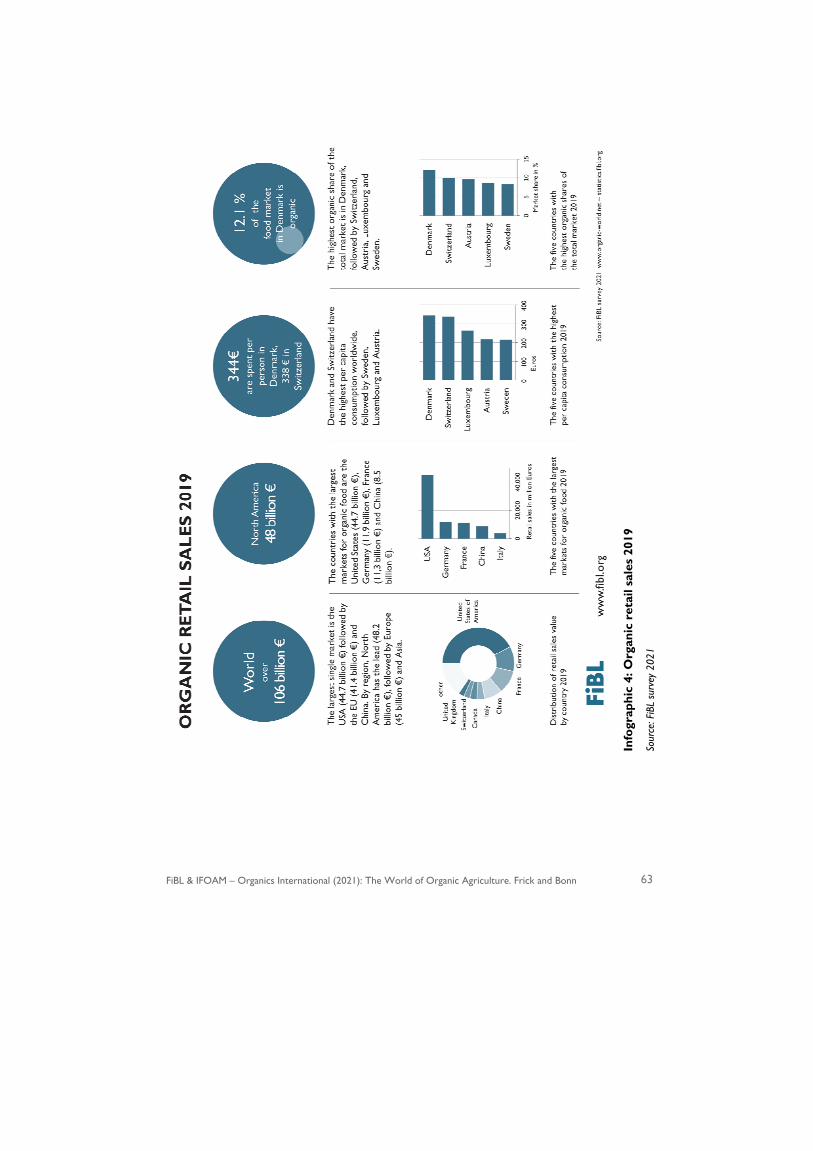
FiBL & IFOAM – Organics International (2021): The World of Organic Agriculture. Frick and Bonn 63
Info
grap
hic
4: O
rgan
ic r
etai
l sal
es 2
019
Sour
ce: F
iBL
surv
ey 2
021
Statistics › Retail Sales and International Trade
64 FiBL & IFOAM – Organics International (2021): The World of Organic Agriculture. Frick and Bonn
Retail sales and international trade data1
Retail sales
Whereas Amarjit Sahota presents global trends for the organic market along with much background information (page 136), in this chapter, we show the country-related market data that was compiled under the framework of the FiBL survey on organic agriculture. Data on total retail sales value was available for 57 countries (30 percent of the total countries with organic data), which means that for many countries with organic farming activities, such data is missing.
Total retail sales according to the FiBL survey amounted to over 106 billion euros in 2019. The country with the largest market for organic food was the United States (44.7 billion euros), followed by Germany (12.0 billion euros), France (11.3 billion euros) and China (8.5 billion euros). The largest single market was the United States, followed by the European Union (41.4 billion euros) and China (Figure 84). By region, North America had the lead (48.2 billion euros), followed by Europe (45.0 billion euros) and Asia (Table 12).
Market growth was noted in all countries for which 2019 data were available, and in some cases, it was in the double digits. Estonia was the country that registered the biggest growth; the market increased by 13.2 percent. Whereas the highest per capita consumption by continent is in North America (132 euros), by country it is highest in European countries. In 2019, Denmark had the highest per capita consumption (344 euros) worldwide, followed by Switzerland (338 euros), Luxembourg (265 euros) and Austria (216 euros) (Table 13).
Looking at the shares the organic market has of the total market, the leader is Denmark (12.1 percent), followed by Switzerland (10.4 percent), Austria (9.3 percent), Sweden (9 percent) and Luxembourg (8.6 percent) (Table 13).
Export data
International trade data is becoming available for more and more countries. These can be expressed as total export/import volumes in metric tons or as values. Some countries also provide breakdowns by crop and product. Table 13 shows the values of total exports where available. More than 50 countries provided data on export values.
Import data
Import data are not available for many countries. Since 2018, the European Union has collected import data; these are available on page 140. Data on US organic imports and exports (values and quantity) are available on the USDA website.2
1 Please note that due to differences in the methodology, some of the figures presented in this chapter differ from those collected in by Ecovia Intelligence (see chapter by Amarjit Sahota on page 146). 2 The data can be found at http://apps.fas.usda.gov/gats/ExpressQuery1.aspx. Go to “standard query” and choose “Organics selected”.
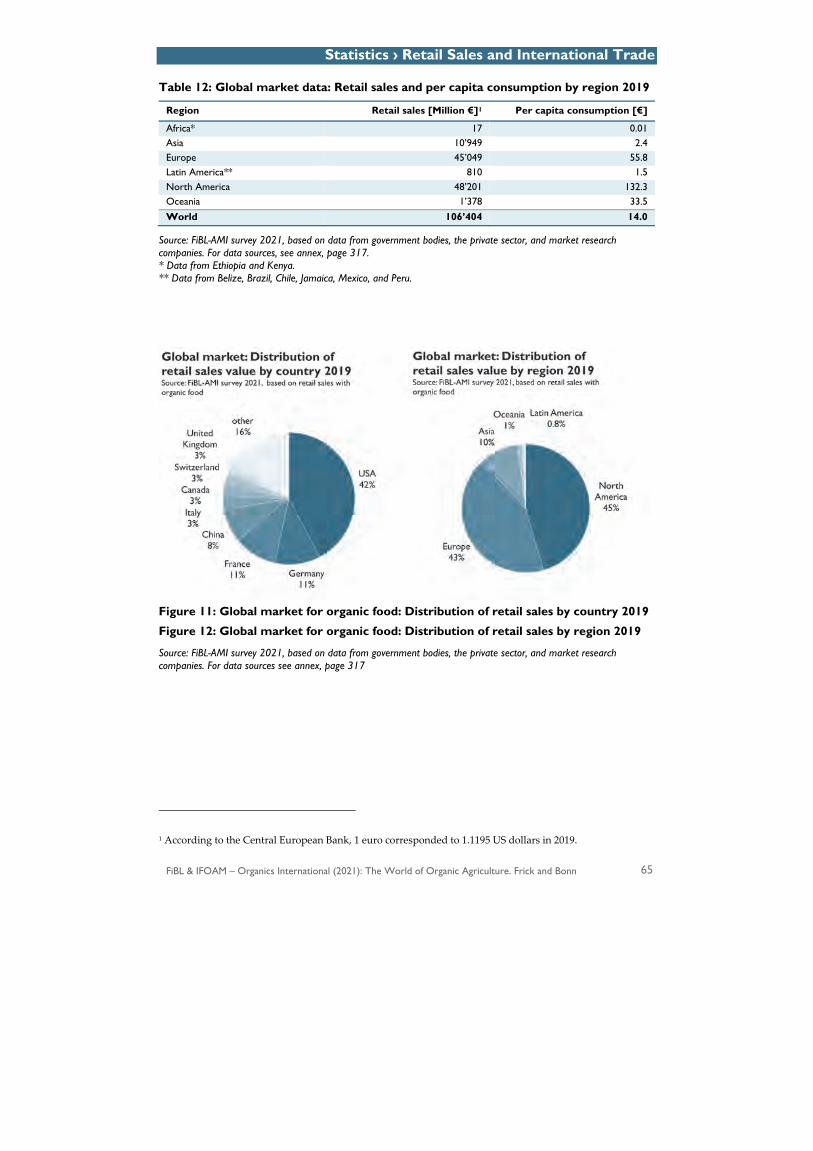
Statistics › Retail Sales and International Trade
FiBL & IFOAM – Organics International (2021): The World of Organic Agriculture. Frick and Bonn 65
Table 12: Global market data: Retail sales and per capita consumption by region 2019
Region Retail sales [Million €]1 Per capita consumption [€]
Africa* 17 0.01 Asia 10’949 2.4 Europe 45’049 55.8 Latin America** 810 1.5 North America 48’201 132.3 Oceania 1’378 33.5 World 106’404 14.0
Source: FiBL-AMI survey 2021, based on data from government bodies, the private sector, and market research companies. For data sources, see annex, page 317. * Data from Ethiopia and Kenya. ** Data from Belize, Brazil, Chile, Jamaica, Mexico, and Peru.
Figure 11: Global market for organic food: Distribution of retail sales by country 2019
Figure 12: Global market for organic food: Distribution of retail sales by region 2019
Source: FiBL-AMI survey 2021, based on data from government bodies, the private sector, and market research companies. For data sources see annex, page 317
1 According to the Central European Bank, 1 euro corresponded to 1.1195 US dollars in 2019.
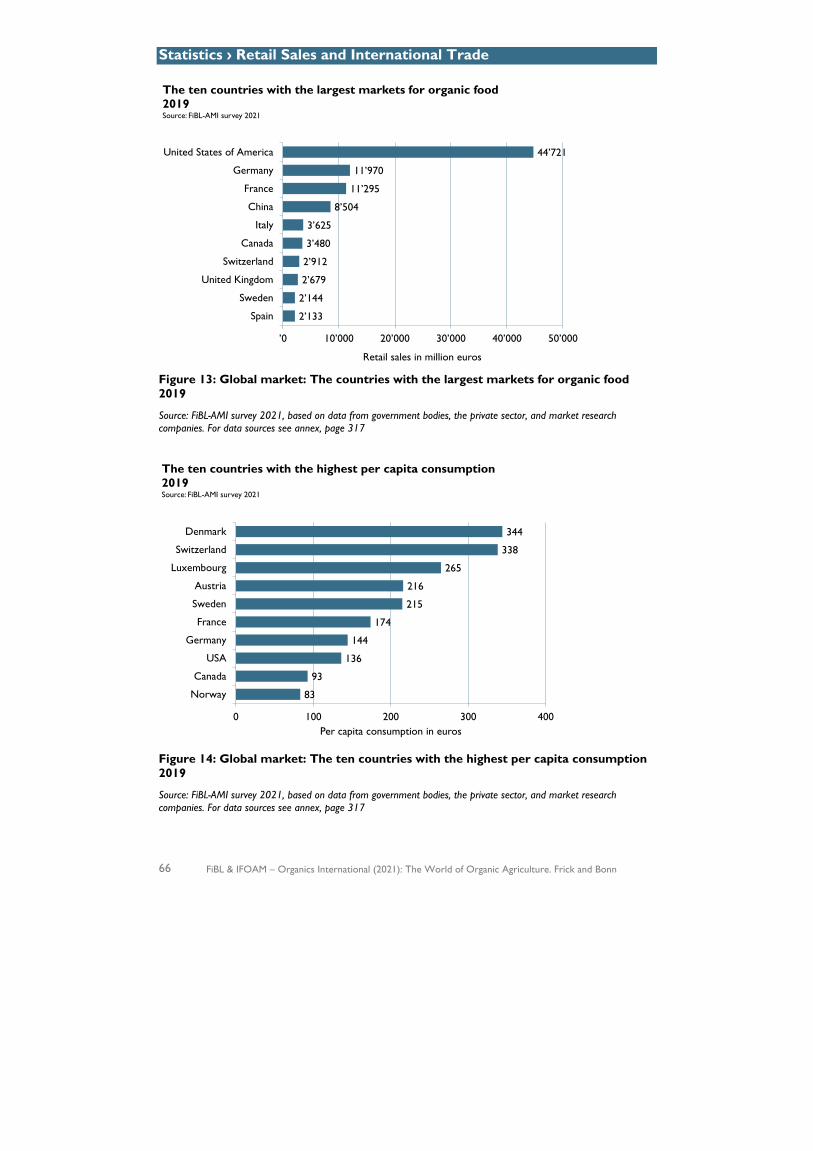
Statistics › Retail Sales and International Trade
66 FiBL & IFOAM – Organics International (2021): The World of Organic Agriculture. Frick and Bonn
Figure 13: Global market: The countries with the largest markets for organic food 2019
Source: FiBL-AMI survey 2021, based on data from government bodies, the private sector, and market research companies. For data sources see annex, page 317
Figure 14: Global market: The ten countries with the highest per capita consumption 2019
Source: FiBL-AMI survey 2021, based on data from government bodies, the private sector, and market research companies. For data sources see annex, page 317
2’133
2’144
2’679
2’912
3’480
3’625
8’504
11’295
11’970
44’721
’0 10’000 20’000 30’000 40’000 50’000
Spain
Sweden
United Kingdom
Switzerland
Canada
Italy
China
France
Germany
United States of America
Retail sales in million euros
The ten countries with the largest markets for organic food 2019Source: FiBL-AMI survey 2021
83
93
136
144
174
215
216
265
338
344
0 100 200 300 400
Norway
Canada
USA
Germany
France
Sweden
Austria
Luxembourg
Switzerland
Denmark
Per capita consumption in euros
The ten countries with the highest per capita consumption 2019Source: FiBL-AMI survey 2021
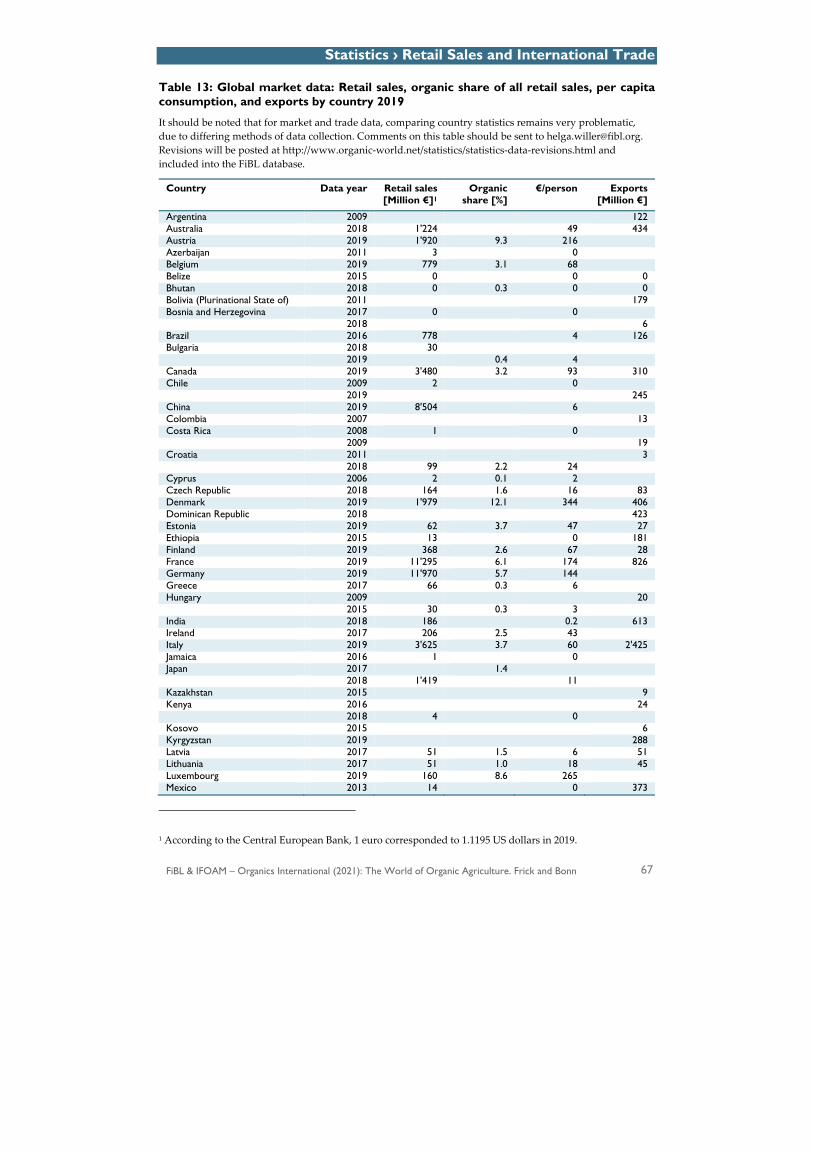
Statistics › Retail Sales and International Trade
FiBL & IFOAM – Organics International (2021): The World of Organic Agriculture. Frick and Bonn 67
Table 13: Global market data: Retail sales, organic share of all retail sales, per capita consumption, and exports by country 2019
It should be noted that for market and trade data, comparing country statistics remains very problematic, due to differing methods of data collection. Comments on this table should be sent to [email protected]. Revisions will be posted at http://www.organic-world.net/statistics/statistics-data-revisions.html and included into the FiBL database.
Country Data year Retail sales [Million €]1
Organic share [%]
€/person Exports [Million €]
Argentina 2009
122 Australia 2018 1'224
49 434
Austria 2019 1'920 9.3 216
Azerbaijan 2011 3
0
Belgium 2019 779 3.1 68
Belize 2015 0
0 0 Bhutan 2018 0 0.3 0 0 Bolivia (Plurinational State of) 2011
179
Bosnia and Herzegovina 2017 0
0
2018
6
Brazil 2016 778
4 126 Bulgaria 2018 30
2019
0.4 4
Canada 2019 3'480 3.2 93 310 Chile 2009 2
0
2019
245 China 2019 8'504
6
Colombia 2007
13 Costa Rica 2008 1
0
2009
19 Croatia 2011
3
2018 99 2.2 24
Cyprus 2006 2 0.1 2
Czech Republic 2018 164 1.6 16 83 Denmark 2019 1'979 12.1 344 406 Dominican Republic 2018
423
Estonia 2019 62 3.7 47 27 Ethiopia 2015 13
0 181
Finland 2019 368 2.6 67 28 France 2019 11'295 6.1 174 826 Germany 2019 11'970 5.7 144
Greece 2017 66 0.3 6
Hungary 2009
20 2015 30 0.3 3
India 2018 186
0.2 613 Ireland 2017 206 2.5 43
Italy 2019 3'625 3.7 60 2'425 Jamaica 2016 1
0
Japan 2017
1.4
2018 1'419
11
Kazakhstan 2015
9 Kenya 2016
24
2018 4
0
Kosovo 2015
6 Kyrgyzstan 2019
288
Latvia 2017 51 1.5 6 51 Lithuania 2017 51 1.0 18 45 Luxembourg 2019 160 8.6 265
Mexico 2013 14
0 373
1 According to the Central European Bank, 1 euro corresponded to 1.1195 US dollars in 2019.
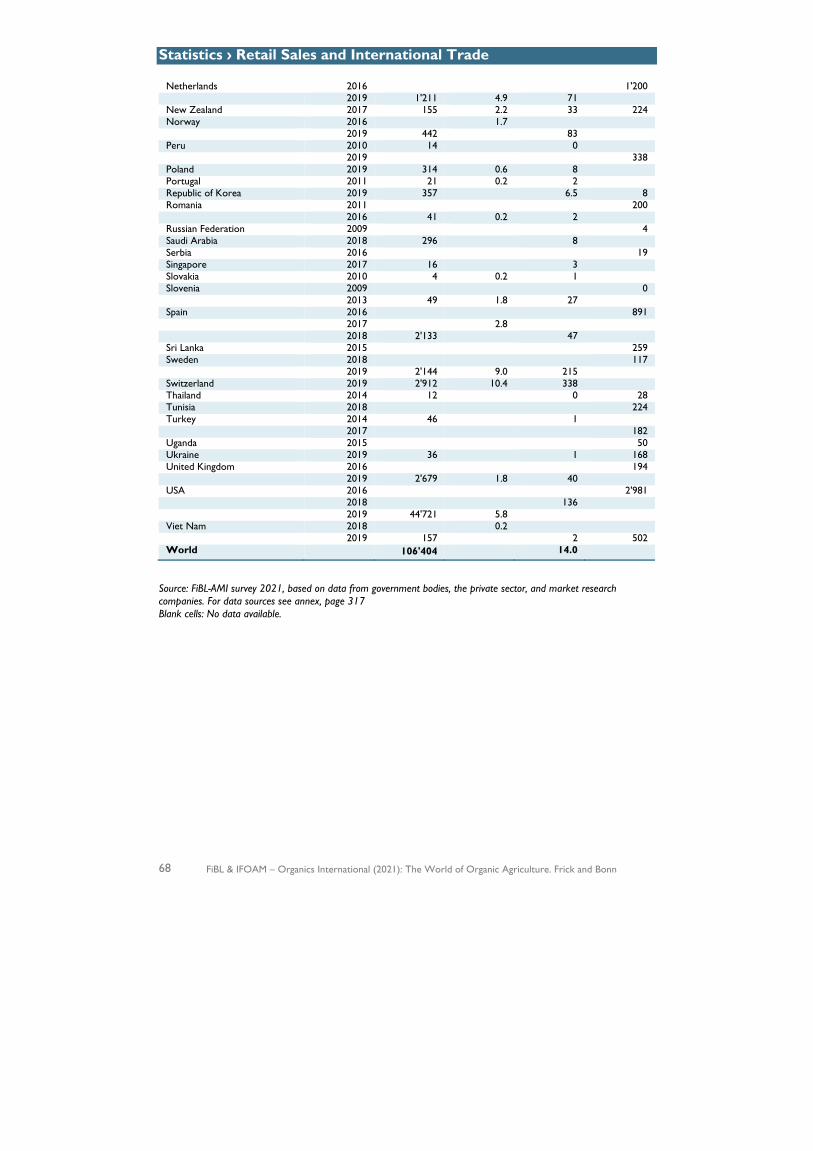
Statistics › Retail Sales and International Trade
68 FiBL & IFOAM – Organics International (2021): The World of Organic Agriculture. Frick and Bonn
Netherlands 2016
1'200 2019 1'211 4.9 71
New Zealand 2017 155 2.2 33 224 Norway 2016
1.7
2019 442
83
Peru 2010 14
0
2019
338
Poland 2019 314 0.6 8
Portugal 2011 21 0.2 2
Republic of Korea 2019 357
6.5 8 Romania 2011
200
2016 41 0.2 2
Russian Federation 2009
4 Saudi Arabia 2018 296
8
Serbia 2016
19 Singapore 2017 16
3
Slovakia 2010 4 0.2 1
Slovenia 2009
0 2013 49 1.8 27
Spain 2016
891 2017
2.8
2018 2'133
47
Sri Lanka 2015
259 Sweden 2018
117
2019 2'144 9.0 215
Switzerland 2019 2'912 10.4 338
Thailand 2014 12
0 28 Tunisia 2018
224
Turkey 2014 46
1
2017
182
Uganda 2015
50 Ukraine 2019 36
1 168
United Kingdom 2016
194 2019 2'679 1.8 40
USA 2016
2'981 2018
136
2019 44'721 5.8
Viet Nam 2018
0.2
2019 157 2 502 World 106'404 14.0
Source: FiBL-AMI survey 2021, based on data from government bodies, the private sector, and market research companies. For data sources see annex, page 317 Blank cells: No data available.

Statistics › DAC Countries
FiBL & IFOAM – Organics International (2021): The World of Organic Agriculture. Frick and Bonn 69
Organic farming in developing countries and emerging markets
The Development Assistance Committee (DAC) of the Organisation for Economic Co-operation and Development (OECD) is a forum to discuss issues surrounding aid, development and poverty reduction in developing countries. The recipients of Official Development Assistance (ODA) according to the DAC are studied in this section.
More than 2.7 million organic producers from the countries on the DAC list1 were counted (87 percent of all organic producers). More than a fifth of the world’s organic agricultural land, 15.1 million hectares, is located in countries listed on the DAC list.
If wild collection and beekeeping areas are included, the total area is 41.5 million hectares. Almost half of the agricultural land of the countries on the DAC list is located in Latin American countries (almost 6.1 million hectares), with Asia (5.8 million) and Africa (2.0 million) in second and third place. The countries with the largest areas of organic agricultural land are Argentina, India, China and Brazil, in that order. Not surprisingly, all of them are large countries (Figure 15).
However, when it comes to organic agricultural land as a percentage of the total area under cultivation, the order is different. The countries on the DAC list with the highest percentages of organic agricultural land are São Tomé and Príncipe (24.9 percent), Samoa (14.5 percent) and Timor-Leste (8.5 percent). Argentina, with by far the largest area under organic cultivation (with 3.7 million hectares), is ranked thirteenth when the organic agricultural area is expressed as a share of the total agricultural area. The organic share of the total agricultural land of the top ten countries on the DAC list is comparable to that of many European countries, and they can be attributed in part to a high production potential for, and focus on, exports. Support activities may also play a role. However, out of all the countries on the DAC list, only 18 percent of them have an organic share higher than one percent of the total agricultural area (Figure 16).
Land use details were available for almost 80 percent of the agricultural land of the countries on the DAC list; crop data is missing for some of the world’s largest producing countries (India and Brazil). Available statistics show that organic arable land areas constitute over 29 percent of the organic agricultural land, organic grassland/grazing over 25 percent, and organic permanent crops almost 20 percent. Exports play an important role, either for meat products (mainly from Argentina and Uruguay) or for unprocessed permanent and arable crops. The most important crops are export crops, such as cereals, coffee, oilseeds, textile crops (mainly cotton), nuts, coconuts, olives, cocoa, etc. For Africa, coffee and olives, for Asia, cereals and oilseeds, and for Latin America, coffee and cocoa are the most important crops.
1 The country list of the Development Assistance Committee DAC is available on the OECD website at http://www.oecd.org/dac/stats/daclist.htm
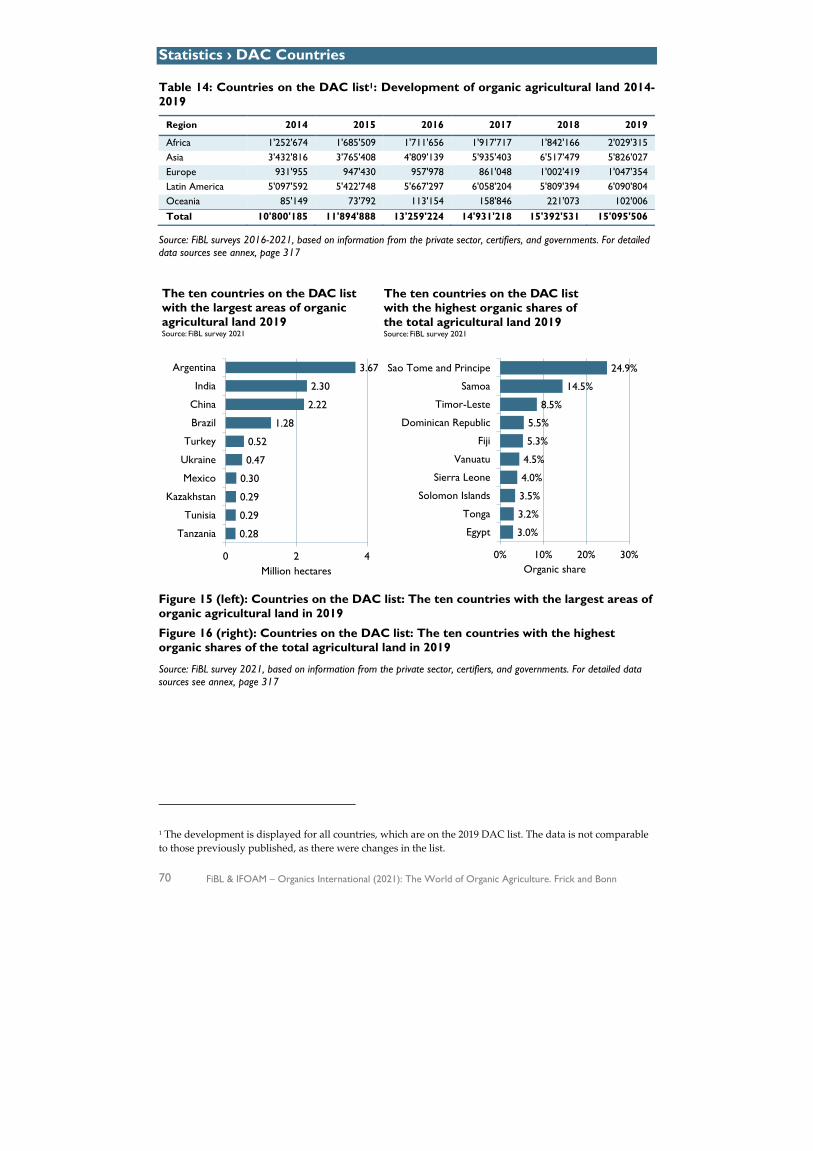
Statistics › DAC Countries
70 FiBL & IFOAM – Organics International (2021): The World of Organic Agriculture. Frick and Bonn
Table 14: Countries on the DAC list1: Development of organic agricultural land 2014-2019
Region 2014 2015 2016 2017 2018 2019
Africa 1'252'674 1'685'509 1'711'656 1'917'717 1'842'166 2'029'315 Asia 3'432'816 3'765'408 4'809'139 5'935'403 6'517'479 5'826'027 Europe 931'955 947'430 957'978 861'048 1'002'419 1'047'354 Latin America 5'097'592 5'422'748 5'667'297 6'058'204 5'809'394 6'090'804 Oceania 85'149 73'792 113'154 158'846 221'073 102'006 Total 10'800'185 11'894'888 13'259'224 14'931'218 15'392'531 15'095'506
Source: FiBL surveys 2016-2021, based on information from the private sector, certifiers, and governments. For detailed data sources see annex, page 317
Figure 15 (left): Countries on the DAC list: The ten countries with the largest areas of organic agricultural land in 2019
Figure 16 (right): Countries on the DAC list: The ten countries with the highest organic shares of the total agricultural land in 2019
Source: FiBL survey 2021, based on information from the private sector, certifiers, and governments. For detailed data sources see annex, page 317
1 The development is displayed for all countries, which are on the 2019 DAC list. The data is not comparable to those previously published, as there were changes in the list.
0.28
0.29
0.29
0.30
0.47
0.52
1.28
2.22
2.30
3.67
0 2 4
Tanzania
Tunisia
Kazakhstan
Mexico
Ukraine
Turkey
Brazil
China
India
Argentina
Million hectares
The ten countries on the DAC list with the largest areas of organic agricultural land 2019Source: FiBL survey 2021
3.0%
3.2%
3.5%
4.0%
4.5%
5.3%
5.5%
8.5%
14.5%
24.9%
0% 10% 20% 30%
Egypt
Tonga
Solomon Islands
Sierra Leone
Vanuatu
Fiji
Dominican Republic
Timor-Leste
Samoa
Sao Tome and Principe
Organic share
The ten countries on the DAC list with the highest organic shares of the total agricultural land 2019Source: FiBL survey 2021

Statistics › Land Use
FiBL & IFOAM – Organics International (2021): The World of Organic Agriculture. Frick and Bonn 71
Land use and key commodities in organic agriculture
Land use
Over two-thirds of the 72.3 million hectares of organic agricultural land in 2019 were grassland/grazing areas (almost 48.9 million hectares). The cropland area (arable land with 13.1 million hectares and permanent crops with 4.7 million hectares) constituted 17.8 million hectares, and about a quarter of the organic agricultural land. The cropland area is probably much higher because details on land use are not available for some countries with large organic agricultural areas such as Brazil and India. General land use information was available for 92 percent of the organic agricultural land; however, this does not mean that detailed crop information is available for all areas as not all countries provided detailed crop data.1 The FAO classification2 of land use was utilized for this survey with slight modifications. A system similar to that of Eurostat was used for the classification of crops. The following main levels were used to classify the land use data: arable land, permanent crops, cropland for which no further details were available (cropland = arable land + permanent cropland), permanent grassland/grazing areas, other agricultural areas (such as hedges) and agricultural land for which no details were available at all. For crop groups by land use type, see Table 16.
Aquaculture, forest, and grazed non-agricultural land were distinguished from “agricultural land” with a separate category, as were organic wild collection areas and beekeeping areas.
The land use information can be summarized by geographical region as follows (Table 15): ! Africa: Land use information was available for more than 91 percent of the total
organic agricultural land in Africa. Almost two-thirds of the agricultural land is used for permanent crops. The main permanent crops are cash crops, such as coffee, cocoa and olives; among the main arable crops are oilseeds (sesame, and soybeans) and cotton. For land use details in Africa, see page 189.
! Asia: Land use details are known for almost two-thirds of the total organic agricultural land in Asia. Arable land is mainly used for cereals, including rice. Furthermore, oilseeds, dry pulses and textile crops are important. For land use details in Asia, see page 208.
! Europe: In Europe, agricultural land use is well known, and the main crop categories are well documented. Permanent grassland accounts for almost 40 percent of the organic agricultural land. Arable land (48 percent) is mainly used for the cultivation of cereals and by green fodder (almost 3 million hectares and
1 For some countries, only information on the main uses (arable crops, permanent crops, and permanent grassland) was available. For other countries, very detailed statistical land use information can be found. 2 For more details, see the FAOSTAT homepage, faostat.fao.org: Home > Concepts and Definitions > Glossary, or http://faostat.fao.org/site/379/DesktopDefault.aspx?PageID=379
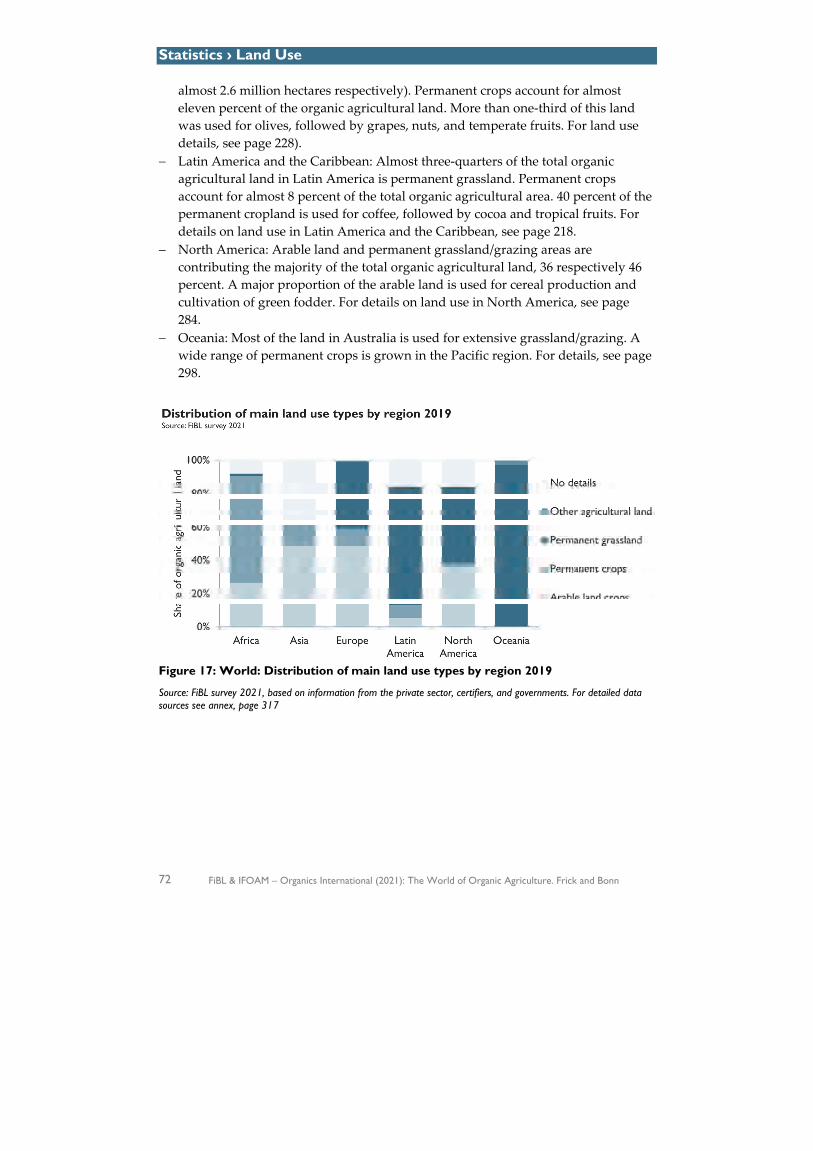
Statistics › Land Use
72 FiBL & IFOAM – Organics International (2021): The World of Organic Agriculture. Frick and Bonn
almost 2.6 million hectares respectively). Permanent crops account for almost eleven percent of the organic agricultural land. More than one-third of this land was used for olives, followed by grapes, nuts, and temperate fruits. For land use details, see page 228).
! Latin America and the Caribbean: Almost three-quarters of the total organic agricultural land in Latin America is permanent grassland. Permanent crops account for almost 8 percent of the total organic agricultural area. 40 percent of the permanent cropland is used for coffee, followed by cocoa and tropical fruits. For details on land use in Latin America and the Caribbean, see page 218.
! North America: Arable land and permanent grassland/grazing areas are contributing the majority of the total organic agricultural land, 36 respectively 46 percent. A major proportion of the arable land is used for cereal production and cultivation of green fodder. For details on land use in North America, see page 284.
! Oceania: Most of the land in Australia is used for extensive grassland/grazing. A wide range of permanent crops is grown in the Pacific region. For details, see page 298.
Figure 17: World: Distribution of main land use types by region 2019
Source: FiBL survey 2021, based on information from the private sector, certifiers, and governments. For detailed data sources see annex, page 317
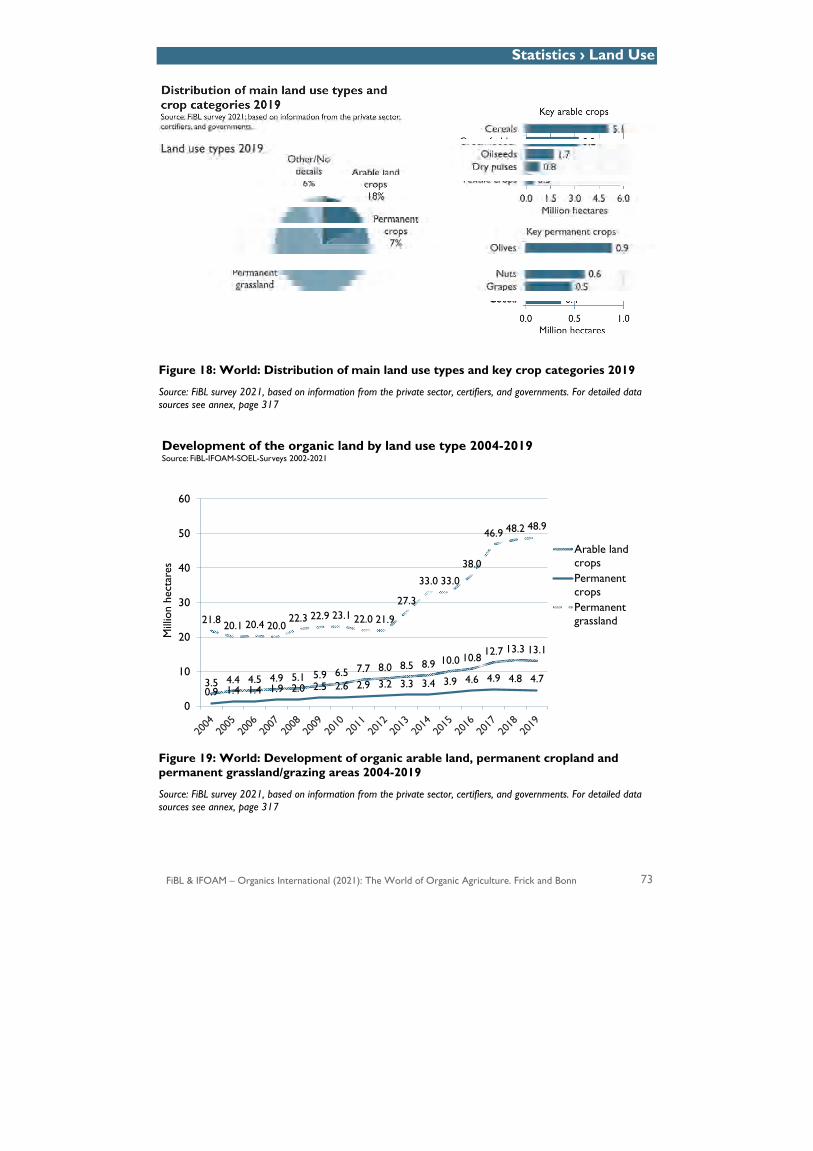
Statistics › Land Use
FiBL & IFOAM – Organics International (2021): The World of Organic Agriculture. Frick and Bonn 73
Figure 18: World: Distribution of main land use types and key crop categories 2019
Source: FiBL survey 2021, based on information from the private sector, certifiers, and governments. For detailed data sources see annex, page 317
Figure 19: World: Development of organic arable land, permanent cropland and permanent grassland/grazing areas 2004-2019
Source: FiBL survey 2021, based on information from the private sector, certifiers, and governments. For detailed data sources see annex, page 317
3.5 4.4 4.5 4.9 5.1 5.9 6.5 7.7 8.0 8.5 8.9 10.0 10.8 12.7 13.3 13.1
0.9 1.4 1.4 1.9 2.0 2.5 2.6 2.9 3.2 3.3 3.4 3.9 4.6 4.9 4.8 4.7
21.8 20.1 20.4 20.022.3 22.9 23.1 22.0 21.9
27.3
33.0 33.0
38.0
46.9 48.2 48.9
0
10
20
30
40
50
60
Mill
ion
hect
ares
Development of the organic land by land use type 2004-2019Source: FiBL-IFOAM-SOEL-Surveys 2002-2021
Arable landcropsPermanentcropsPermanentgrassland
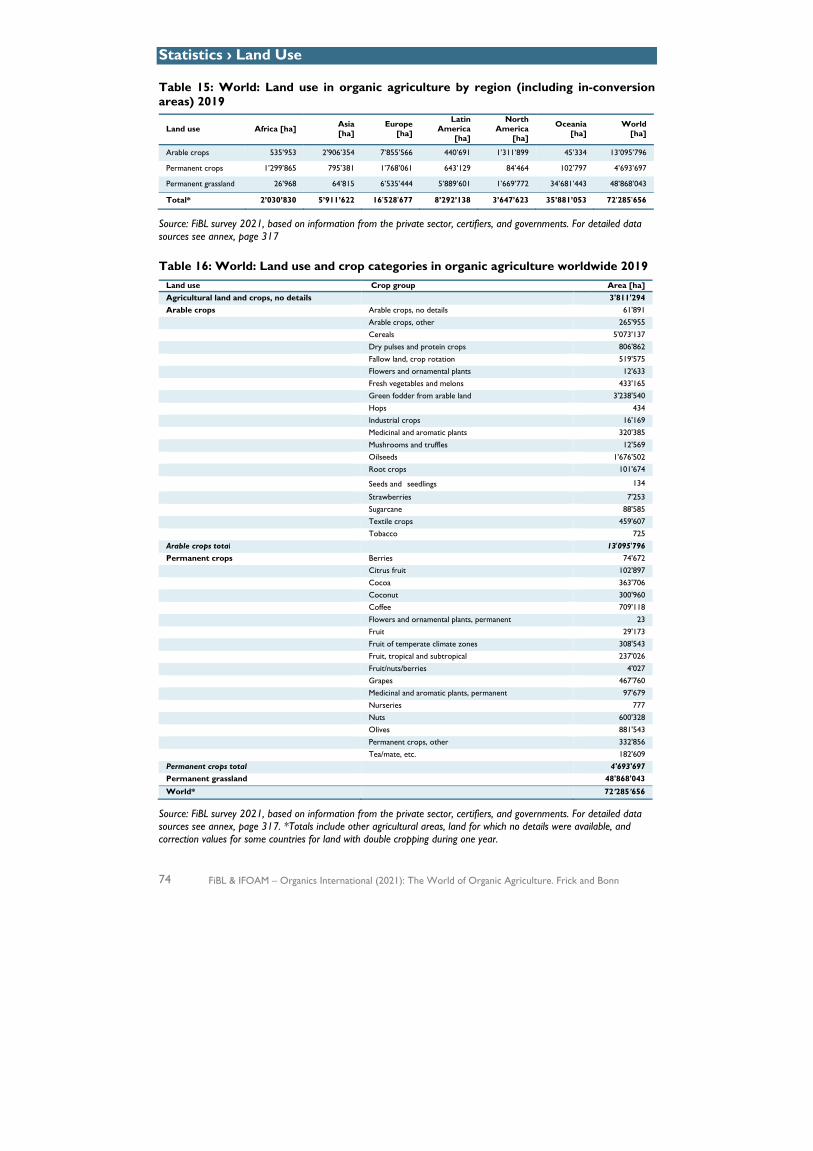
Statistics › Land Use
74 FiBL & IFOAM – Organics International (2021): The World of Organic Agriculture. Frick and Bonn
Table 15: World: Land use in organic agriculture by region (including in-conversion areas) 2019
Land use Africa [ha] Asia [ha]
Europe [ha]
Latin America
[ha]
North America
[ha]
Oceania [ha]
World [ha]
Arable crops 535’953 2'906’354 7’855’566 440’691 1’311’899 45’334 13’095’796
Permanent crops 1’299’865 795’381 1’768’061 643’129 84’464 102’797 4’693’697
Permanent grassland 26’968 64’815 6’535’444 5’889’601 1’669’772 34’681’443 48’868’043
Total* 2’030’830 5’911’622 16’528’677 8’292’138 3’647’623 35’881’053 72’285’656
Source: FiBL survey 2021, based on information from the private sector, certifiers, and governments. For detailed data sources see annex, page 317
Table 16: World: Land use and crop categories in organic agriculture worldwide 2019 Land use Crop group Area [ha] Agricultural land and crops, no details 3'811'294 Arable crops Arable crops, no details 61'891 Arable crops, other 265'955 Cereals 5'073'137 Dry pulses and protein crops 806'862 Fallow land, crop rotation 519'575 Flowers and ornamental plants 12'633 Fresh vegetables and melons 433'165 Green fodder from arable land 3'238'540 Hops 434 Industrial crops 16'169 Medicinal and aromatic plants 320'385 Mushrooms and truffles 12'569 Oilseeds 1'676'502 Root crops 101'674 Seeds and seedlings 134
Strawberries 7'253 Sugarcane 88'585 Textile crops 459'607 Tobacco 725 Arable crops total 13'095'796 Permanent crops Berries 74'672 Citrus fruit 102'897 Cocoa 363'706 Coconut 300'960 Coffee 709'118 Flowers and ornamental plants, permanent 23 Fruit 29'173 Fruit of temperate climate zones 308'543 Fruit, tropical and subtropical 237'026 Fruit/nuts/berries 4'027 Grapes 467'760 Medicinal and aromatic plants, permanent 97'679 Nurseries 777 Nuts 600'328 Olives 881'543 Permanent crops, other 332'856 Tea/mate, etc. 182'609 Permanent crops total 4'693'697 Permanent grassland 48'868'043
World* 72'285'656 Source: FiBL survey 2021, based on information from the private sector, certifiers, and governments. For detailed data sources see annex, page 317. *Totals include other agricultural areas, land for which no details were available, and correction values for some countries for land with double cropping during one year.
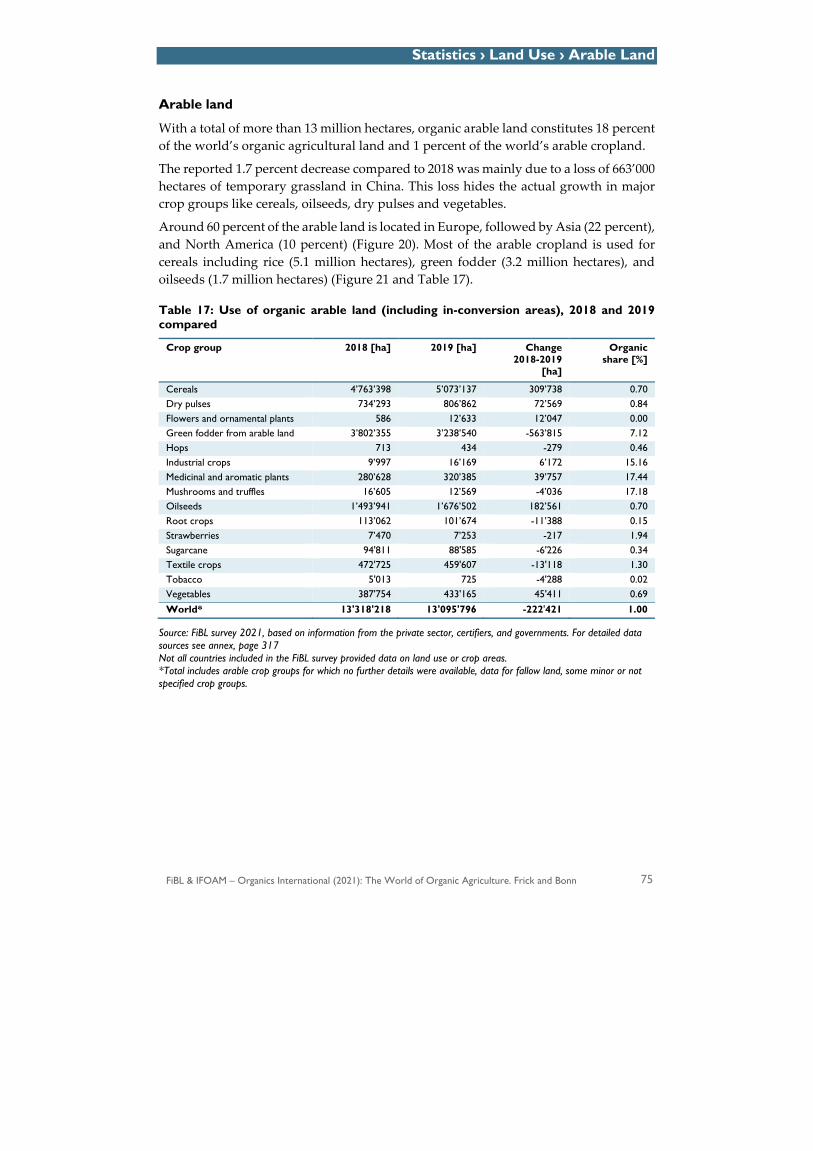
Statistics › Land Use › Arable Land
FiBL & IFOAM – Organics International (2021): The World of Organic Agriculture. Frick and Bonn 75
Arable land
With a total of more than 13 million hectares, organic arable land constitutes 18 percent of the world’s organic agricultural land and 1 percent of the world’s arable cropland.
The reported 1.7 percent decrease compared to 2018 was mainly due to a loss of 663’000 hectares of temporary grassland in China. This loss hides the actual growth in major crop groups like cereals, oilseeds, dry pulses and vegetables.
Around 60 percent of the arable land is located in Europe, followed by Asia (22 percent), and North America (10 percent) (Figure 20). Most of the arable cropland is used for cereals including rice (5.1 million hectares), green fodder (3.2 million hectares), and oilseeds (1.7 million hectares) (Figure 21 and Table 17).
Table 17: Use of organic arable land (including in-conversion areas), 2018 and 2019 compared
Crop group 2018 [ha] 2019 [ha] Change 2018-2019
[ha]
Organic share [%]
Cereals 4’763’398 5’073’137 309’738 0.70 Dry pulses 734’293 806’862 72’569 0.84 Flowers and ornamental plants 586 12’633 12’047 0.00 Green fodder from arable land 3’802’355 3’238’540 -563’815 7.12 Hops 713 434 -279 0.46 Industrial crops 9’997 16’169 6’172 15.16 Medicinal and aromatic plants 280’628 320’385 39’757 17.44 Mushrooms and truffles 16’605 12’569 -4’036 17.18 Oilseeds 1’493’941 1’676’502 182’561 0.70 Root crops 113’062 101’674 -11’388 0.15 Strawberries 7’470 7’253 -217 1.94 Sugarcane 94'811 88'585 -6'226 0.34 Textile crops 472'725 459'607 -13'118 1.30 Tobacco 5'013 725 -4'288 0.02 Vegetables 387'754 433'165 45'411 0.69 World* 13'318'218 13'095'796 -222'421 1.00
Source: FiBL survey 2021, based on information from the private sector, certifiers, and governments. For detailed data sources see annex, page 317 Not all countries included in the FiBL survey provided data on land use or crop areas. *Total includes arable crop groups for which no further details were available, data for fallow land, some minor or not specified crop groups.
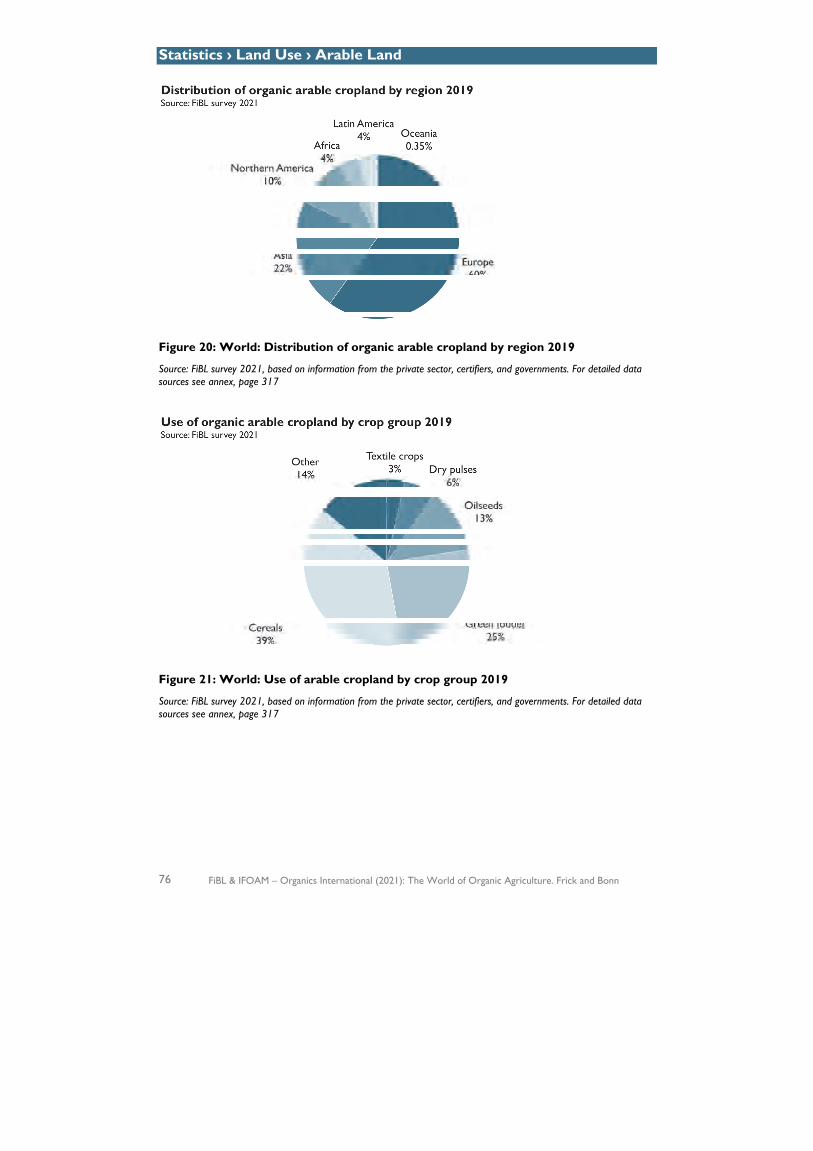
Statistics › Land Use › Arable Land
76 FiBL & IFOAM – Organics International (2021): The World of Organic Agriculture. Frick and Bonn
Figure 20: World: Distribution of organic arable cropland by region 2019
Source: FiBL survey 2021, based on information from the private sector, certifiers, and governments. For detailed data sources see annex, page 317
Figure 21: World: Use of arable cropland by crop group 2019
Source: FiBL survey 2021, based on information from the private sector, certifiers, and governments. For detailed data sources see annex, page 317
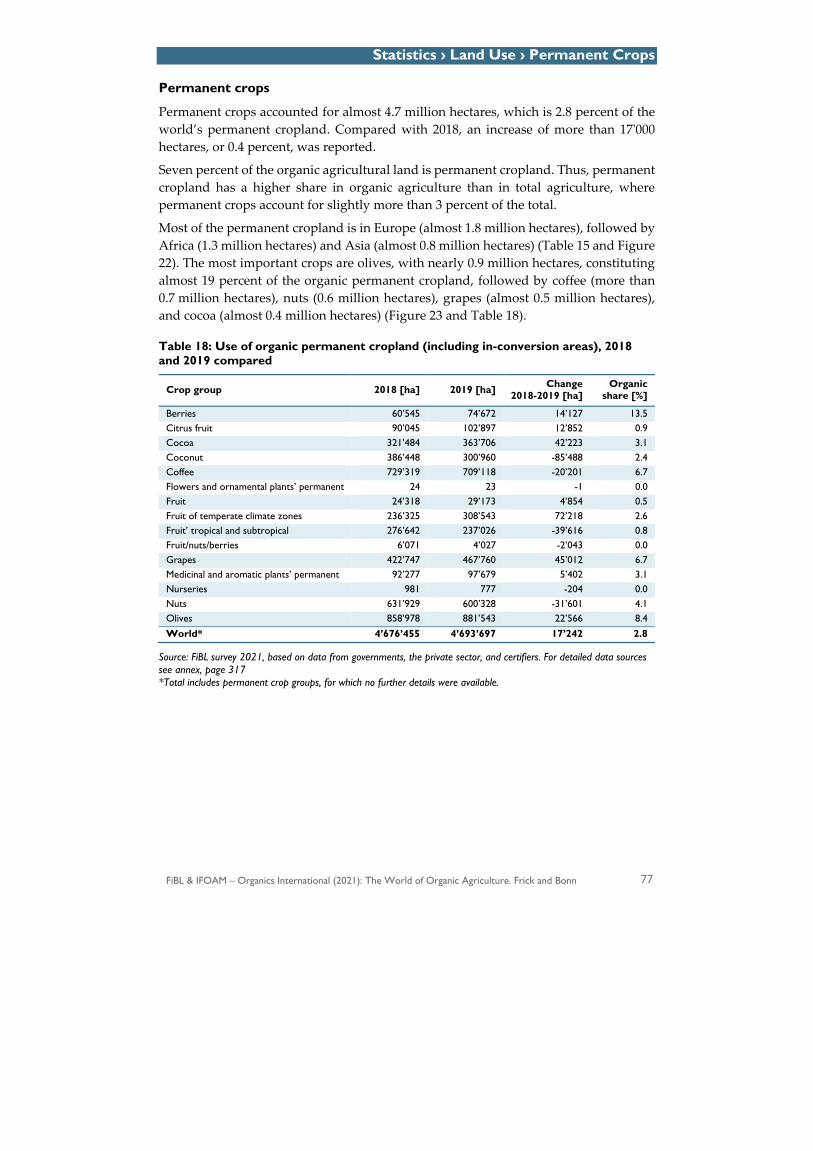
Statistics › Land Use › Permanent Crops
FiBL & IFOAM – Organics International (2021): The World of Organic Agriculture. Frick and Bonn 77
Permanent crops
Permanent crops accounted for almost 4.7 million hectares, which is 2.8 percent of the world’s permanent cropland. Compared with 2018, an increase of more than 17'000 hectares, or 0.4 percent, was reported.
Seven percent of the organic agricultural land is permanent cropland. Thus, permanent cropland has a higher share in organic agriculture than in total agriculture, where permanent crops account for slightly more than 3 percent of the total.
Most of the permanent cropland is in Europe (almost 1.8 million hectares), followed by Africa (1.3 million hectares) and Asia (almost 0.8 million hectares) (Table 15 and Figure 22). The most important crops are olives, with nearly 0.9 million hectares, constituting almost 19 percent of the organic permanent cropland, followed by coffee (more than 0.7 million hectares), nuts (0.6 million hectares), grapes (almost 0.5 million hectares), and cocoa (almost 0.4 million hectares) (Figure 23 and Table 18).
Table 18: Use of organic permanent cropland (including in-conversion areas), 2018 and 2019 compared
Crop group 2018 [ha] 2019 [ha] Change 2018-2019 [ha]
Organic share [%]
Berries 60’545 74’672 14’127 13.5 Citrus fruit 90’045 102’897 12’852 0.9 Cocoa 321’484 363’706 42’223 3.1 Coconut 386’448 300’960 -85’488 2.4 Coffee 729’319 709’118 -20’201 6.7 Flowers and ornamental plants’ permanent 24 23 -1 0.0 Fruit 24’318 29’173 4’854 0.5 Fruit of temperate climate zones 236’325 308’543 72’218 2.6 Fruit’ tropical and subtropical 276’642 237’026 -39’616 0.8 Fruit/nuts/berries 6’071 4’027 -2’043 0.0 Grapes 422’747 467’760 45’012 6.7 Medicinal and aromatic plants’ permanent 92’277 97’679 5’402 3.1 Nurseries 981 777 -204 0.0 Nuts 631’929 600’328 -31’601 4.1 Olives 858’978 881’543 22’566 8.4 World* 4’676’455 4’693’697 17’242 2.8
Source: FiBL survey 2021, based on data from governments, the private sector, and certifiers. For detailed data sources see annex, page 317 *Total includes permanent crop groups, for which no further details were available.
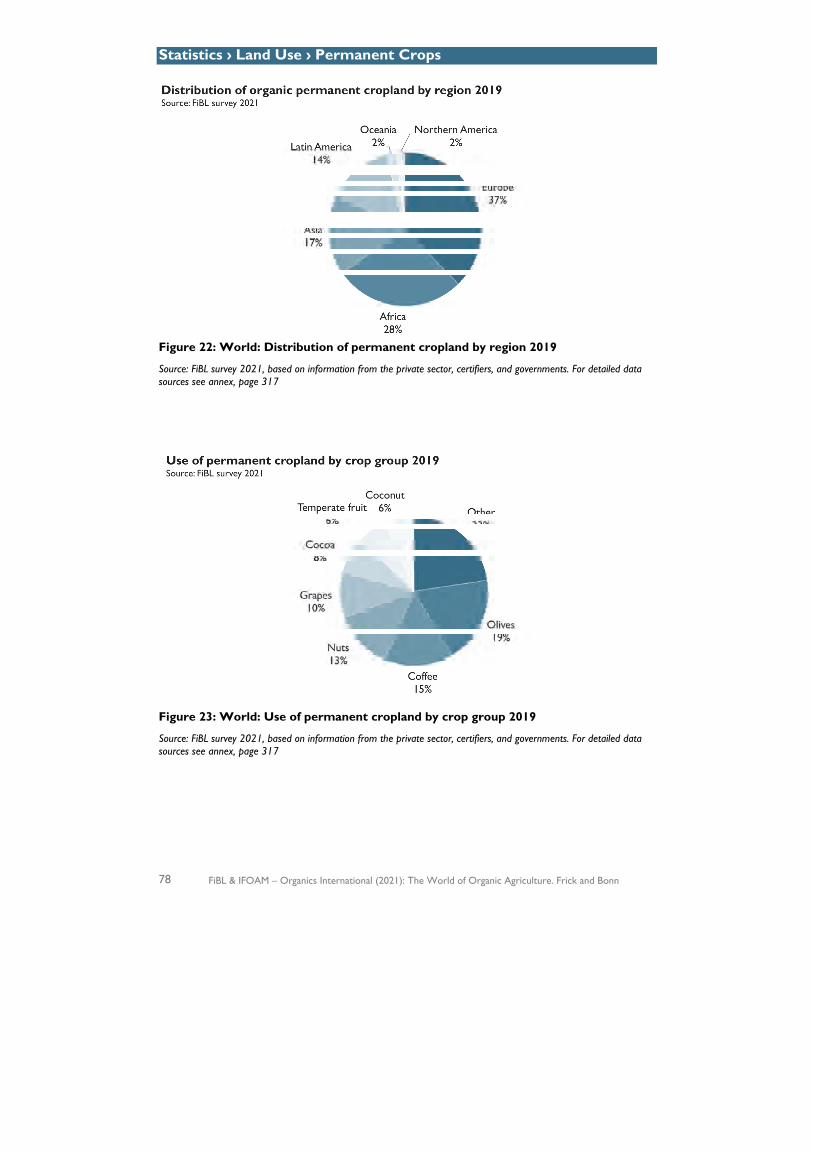
Statistics › Land Use › Permanent Crops
78 FiBL & IFOAM – Organics International (2021): The World of Organic Agriculture. Frick and Bonn
Figure 22: World: Distribution of permanent cropland by region 2019
Source: FiBL survey 2021, based on information from the private sector, certifiers, and governments. For detailed data sources see annex, page 317
Figure 23: World: Use of permanent cropland by crop group 2019
Source: FiBL survey 2021, based on information from the private sector, certifiers, and governments. For detailed data sources see annex, page 317
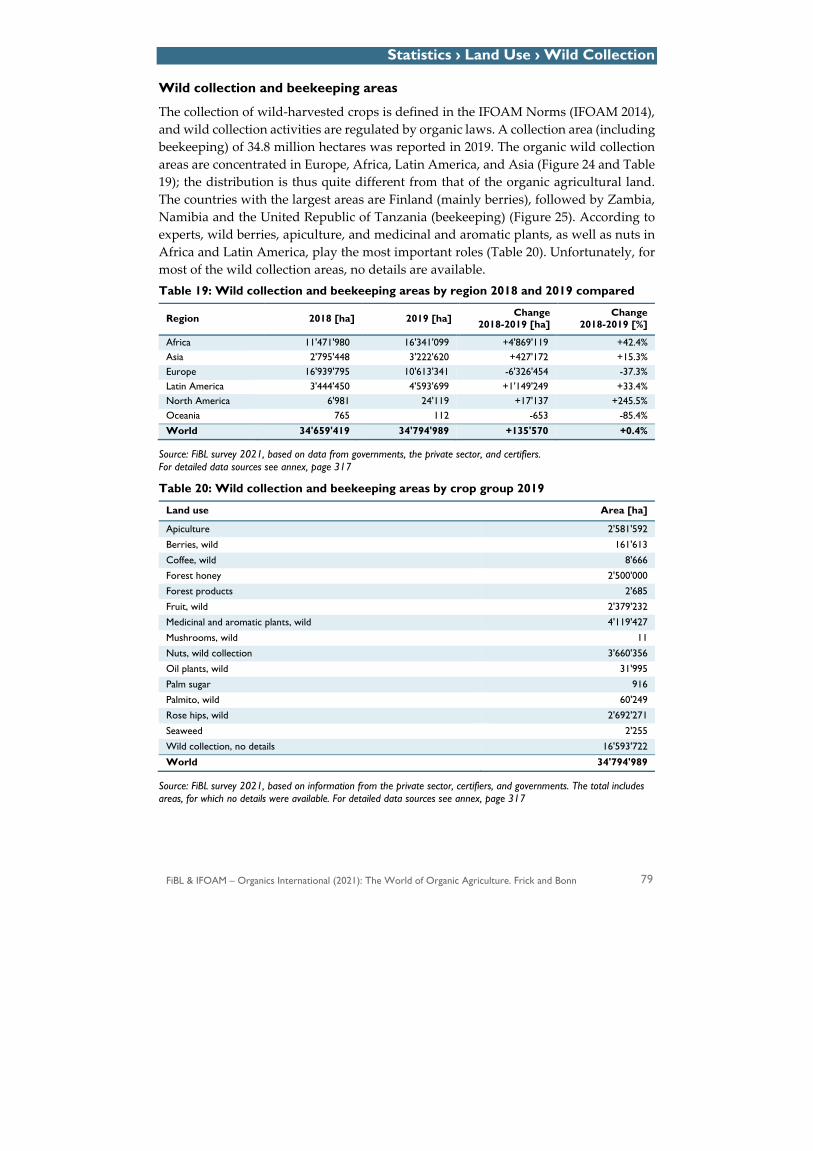
Statistics › Land Use › Wild Collection
FiBL & IFOAM – Organics International (2021): The World of Organic Agriculture. Frick and Bonn 79
Wild collection and beekeeping areas
The collection of wild-harvested crops is defined in the IFOAM Norms (IFOAM 2014), and wild collection activities are regulated by organic laws. A collection area (including beekeeping) of 34.8 million hectares was reported in 2019. The organic wild collection areas are concentrated in Europe, Africa, Latin America, and Asia (Figure 24 and Table 19); the distribution is thus quite different from that of the organic agricultural land. The countries with the largest areas are Finland (mainly berries), followed by Zambia, Namibia and the United Republic of Tanzania (beekeeping) (Figure 25). According to experts, wild berries, apiculture, and medicinal and aromatic plants, as well as nuts in Africa and Latin America, play the most important roles (Table 20). Unfortunately, for most of the wild collection areas, no details are available. Table 19: Wild collection and beekeeping areas by region 2018 and 2019 compared
Region 2018 [ha] 2019 [ha] Change 2018-2019 [ha]
Change 2018-2019 [%]
Africa 11'471'980 16'341'099 +4'869'119 +42.4% Asia 2'795'448 3'222'620 +427'172 +15.3% Europe 16'939'795 10'613'341 -6'326'454 -37.3% Latin America 3'444'450 4'593'699 +1'149'249 +33.4% North America 6'981 24'119 +17'137 +245.5% Oceania 765 112 -653 -85.4% World 34'659'419 34'794'989 +135'570 +0.4%
Source: FiBL survey 2021, based on data from governments, the private sector, and certifiers. For detailed data sources see annex, page 317
Table 20: Wild collection and beekeeping areas by crop group 2019
Land use Area [ha]
Apiculture 2'581'592
Berries, wild 161'613
Coffee, wild 8'666
Forest honey 2'500'000
Forest products 2'685
Fruit, wild 2'379'232
Medicinal and aromatic plants, wild 4'119'427
Mushrooms, wild 11
Nuts, wild collection 3'660'356
Oil plants, wild 31'995
Palm sugar 916
Palmito, wild 60'249
Rose hips, wild 2'692'271
Seaweed 2'255
Wild collection, no details 16'593'722
World 34'794'989
Source: FiBL survey 2021, based on information from the private sector, certifiers, and governments. The total includes areas, for which no details were available. For detailed data sources see annex, page 317
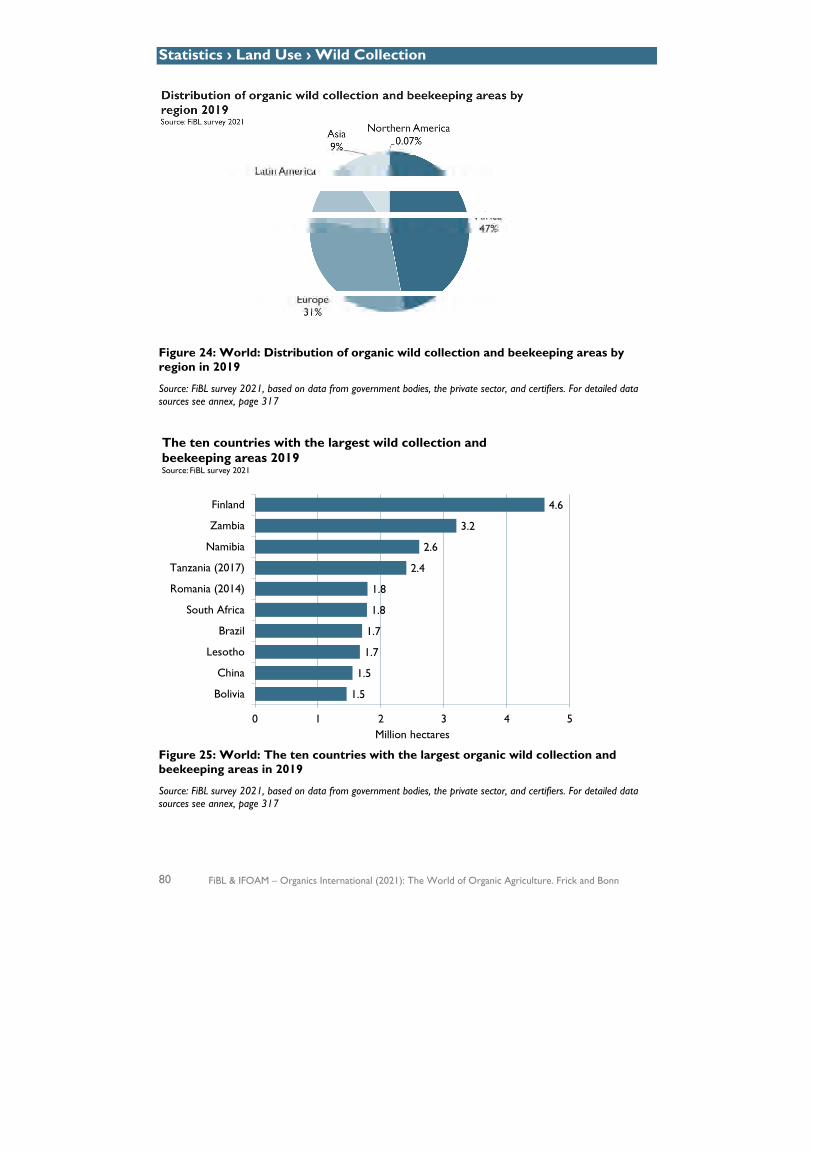
Statistics › Land Use › Wild Collection
80 FiBL & IFOAM – Organics International (2021): The World of Organic Agriculture. Frick and Bonn
Figure 24: World: Distribution of organic wild collection and beekeeping areas by region in 2019
Source: FiBL survey 2021, based on data from government bodies, the private sector, and certifiers. For detailed data sources see annex, page 317
Figure 25: World: The ten countries with the largest organic wild collection and beekeeping areas in 2019
Source: FiBL survey 2021, based on data from government bodies, the private sector, and certifiers. For detailed data sources see annex, page 317
1.5
1.5
1.7
1.7
1.8
1.8
2.4
2.6
3.2
4.6
0 1 2 3 4 5
Bolivia
China
Lesotho
Brazil
South Africa
Romania (2014)
Tanzania (2017)
Namibia
Zambia
Finland
Million hectares
The ten countries with the largest wild collection and beekeeping areas 2019Source: FiBL survey 2021

Statistics › Land Use › Wild Collection
FiBL & IFOAM – Organics International (2021): The World of Organic Agriculture. Frick and Bonn 81
Table 21: Wild collection and beekeeping areas by country 2019
Country Land use Area [ha]
Albania Wild collection, no details 645'042 Algeria Wild collection, no details 628 Argentina Wild collection, no details 20'900 Armenia Wild collection, no details 8'570 Azerbaijan Blackberries, wild 8 Buckthorn, wild 3 Chestnuts, wild 49 Cornel, wild 374 Fruit, wild, other 167 Hawthorn, wild 150 Medicinal and aromatic plants, wild, other 56 Walnuts, wild 130 Wild collection, no details 126 Belarus Strawberries, wild 3 Wild collection, no details 946'895 Belgium Wild collection, no details 3 Bhutan Wild collection, no details 7'746 Bolivia Berries, wild 69'073 Medicinal and aromatic plants, wild, other 1 Brazil nuts, wild collection 1'386'761 Bosnia and Herzegovina Wild collection, no details 11'579 Botswana Fruit, wild, other 2 Brazil Bamboo, wild 27 Brazil nuts, wild collection 1'693'830 Acai, wild collection 7'581 Bulgaria Wild collection, no details 307'020 Burkina Faso Shea nuts, wild 229'172 Wild collection, no details 36'410 Cameroon Fruit, wild 112'000 Canada Wild collection, no details 24'119 Chad Gums natural 5'800 Chile Berries, wild, other 92'092 Blackberries, wild 187 Seaweed 800 China Wild collection, no details 1'549'800 Colombia Palmito, wild 6'800 Wild collection, other 520 Denmark Wild collection, no details 2'648 Ecuador Wild collection, no details 1'000 Estonia Wild collection, no details 104'305 Eswatini Forest products 564 Ethiopia Coffee, wild 7'629 Faroe Islands Wild collection, no details 0 Finland Wild collection, no details 4'600'000 Georgia Wild collection, no details 215 Ghana Coconuts, wild 44'750 Medicinal and aromatic plants, wild 3'777 Shea nuts, wild 3'193 Greece Wild collection, no details 317'053 Guatemala Wild collection, no details 147'234
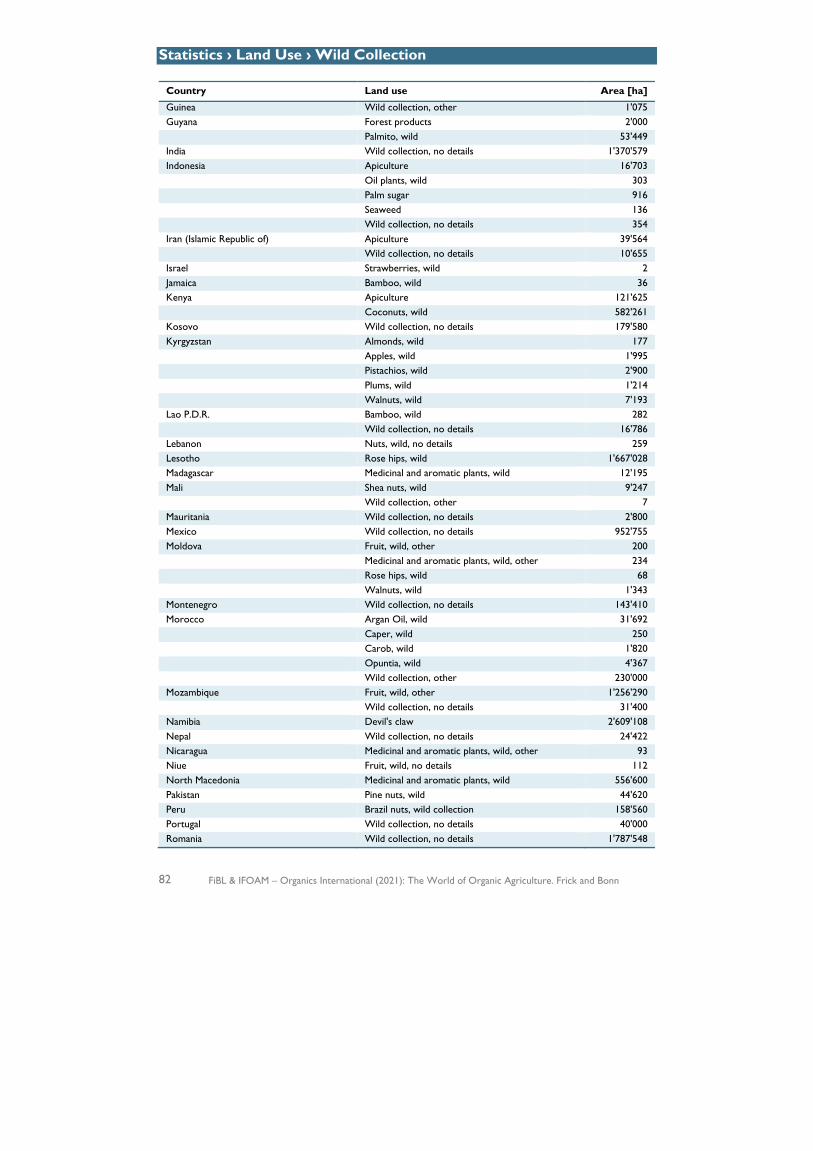
Statistics › Land Use › Wild Collection
82 FiBL & IFOAM – Organics International (2021): The World of Organic Agriculture. Frick and Bonn
Country Land use Area [ha]
Guinea Wild collection, other 1'075 Guyana Forest products 2'000 Palmito, wild 53'449 India Wild collection, no details 1'370'579 Indonesia Apiculture 16'703 Oil plants, wild 303 Palm sugar 916 Seaweed 136 Wild collection, no details 354 Iran (Islamic Republic of) Apiculture 39'564 Wild collection, no details 10'655 Israel Strawberries, wild 2 Jamaica Bamboo, wild 36 Kenya Apiculture 121'625 Coconuts, wild 582'261 Kosovo Wild collection, no details 179'580 Kyrgyzstan Almonds, wild 177 Apples, wild 1'995 Pistachios, wild 2'900 Plums, wild 1'214 Walnuts, wild 7'193 Lao P.D.R. Bamboo, wild 282 Wild collection, no details 16'786 Lebanon Nuts, wild, no details 259 Lesotho Rose hips, wild 1'667'028 Madagascar Medicinal and aromatic plants, wild 12'195 Mali Shea nuts, wild 9'247 Wild collection, other 7 Mauritania Wild collection, no details 2'800 Mexico Wild collection, no details 952'755 Moldova Fruit, wild, other 200 Medicinal and aromatic plants, wild, other 234 Rose hips, wild 68 Walnuts, wild 1'343 Montenegro Wild collection, no details 143'410 Morocco Argan Oil, wild 31'692 Caper, wild 250 Carob, wild 1'820 Opuntia, wild 4'367 Wild collection, other 230'000 Mozambique Fruit, wild, other 1'256'290 Wild collection, no details 31'400 Namibia Devil's claw 2'609'108 Nepal Wild collection, no details 24'422 Nicaragua Medicinal and aromatic plants, wild, other 93 Niue Fruit, wild, no details 112 North Macedonia Medicinal and aromatic plants, wild 556'600 Pakistan Pine nuts, wild 44'620 Peru Brazil nuts, wild collection 158'560 Portugal Wild collection, no details 40'000 Romania Wild collection, no details 1'787'548

Statistics › Land Use › Wild Collection
FiBL & IFOAM – Organics International (2021): The World of Organic Agriculture. Frick and Bonn 83
Country Land use Area [ha]
Russian Federation Pine nuts, wild 121 Seaweed 1'317 Wild collection, no details 156'614 Rwanda Medicinal and aromatic plants, wild 42'377 Senegal Gums natural 20'240 Nuts, wild 20'724 Wild collection, other 100 Slovenia Wild collection, no details 13'238 Somalia Gums natural 801'000 Medicinal and aromatic plants, wild, no details 14'000 Wild collection, no details 7'300 South Africa Aloe vera, wild collection 45'000 Devil's claw 10'000 Forest products 6 Honeybush 1'358 Medicinal and aromatic plants, wild 667'354 Mushrooms, wild 11 Rooibos tea, wild 28'756 Rose hips, wild 1'025'175 Wild collection, no details 5 Coffee, wild 1'037 Spain Wild collection, no details 38'184 Sudan Baobab 1'340 Fruit, wild 98'026 Gum Olibanum 1'053 Gums natural 404'300 Wild collection, other 100'000 Syrian Arab Republic Wild collection, no details 8'000 Tanzania, United Republic of Apiculture 2'403'700 Thailand Wild collection, no details 90'716 Togo Fruit, wild 6'455 Wild collection, other 15 Tunisia Seaweed 2 Wild collection, other 48'956 Turkey Berries, wild 95 Medicinal and aromatic plants, wild 9'796 Nuts, wild 23'392 Wild collection, other 147'053 Uganda Shea nuts, wild 78'684 Ukraine Wild collection, no details 580'000 Uzbekistan Wild collection, no details 5'000 Viet Nam Wild collection, no details 12'450 Zambia Forest honey 2'500'000 Fruit, wild, other 700'000 Zimbabwe Forest products 115 Fruit, wild, other 190'450 Medicinal and aromatic plants, wild 118'472 World 34'794'989
Source: FiBL survey 2021, based on information from the private sector, certifiers, and governments. For detailed data sources see annex, page 317
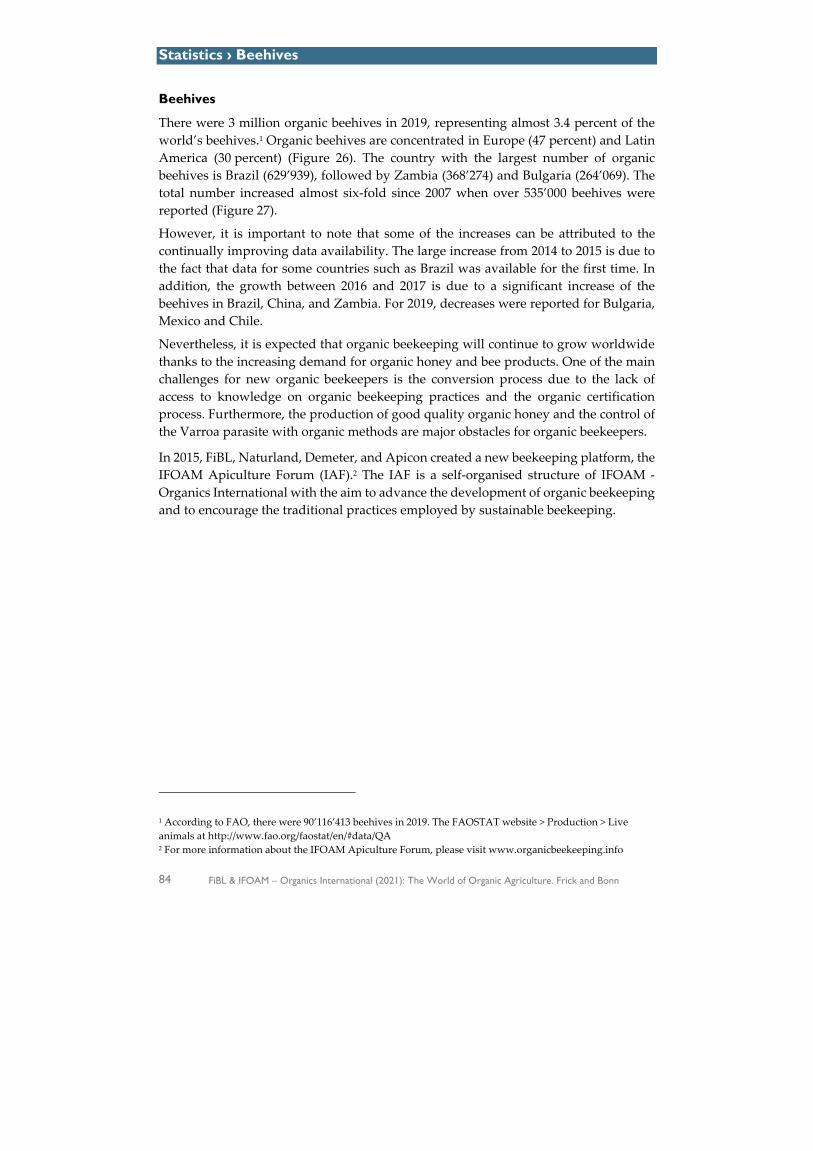
Statistics › Beehives
84 FiBL & IFOAM – Organics International (2021): The World of Organic Agriculture. Frick and Bonn
Beehives
There were 3 million organic beehives in 2019, representing almost 3.4 percent of the world’s beehives.1 Organic beehives are concentrated in Europe (47 percent) and Latin America (30 percent) (Figure 26). The country with the largest number of organic beehives is Brazil (629’939), followed by Zambia (368’274) and Bulgaria (264’069). The total number increased almost six-fold since 2007 when over 535’000 beehives were reported (Figure 27).
However, it is important to note that some of the increases can be attributed to the continually improving data availability. The large increase from 2014 to 2015 is due to the fact that data for some countries such as Brazil was available for the first time. In addition, the growth between 2016 and 2017 is due to a significant increase of the beehives in Brazil, China, and Zambia. For 2019, decreases were reported for Bulgaria, Mexico and Chile.
Nevertheless, it is expected that organic beekeeping will continue to grow worldwide thanks to the increasing demand for organic honey and bee products. One of the main challenges for new organic beekeepers is the conversion process due to the lack of access to knowledge on organic beekeeping practices and the organic certification process. Furthermore, the production of good quality organic honey and the control of the Varroa parasite with organic methods are major obstacles for organic beekeepers.
In 2015, FiBL, Naturland, Demeter, and Apicon created a new beekeeping platform, the IFOAM Apiculture Forum (IAF).2 The IAF is a self-organised structure of IFOAM - Organics International with the aim to advance the development of organic beekeeping and to encourage the traditional practices employed by sustainable beekeeping.
1 According to FAO, there were 90’116’413 beehives in 2019. The FAOSTAT website > Production > Live animals at http://www.fao.org/faostat/en/#data/QA 2 For more information about the IFOAM Apiculture Forum, please visit www.organicbeekeeping.info
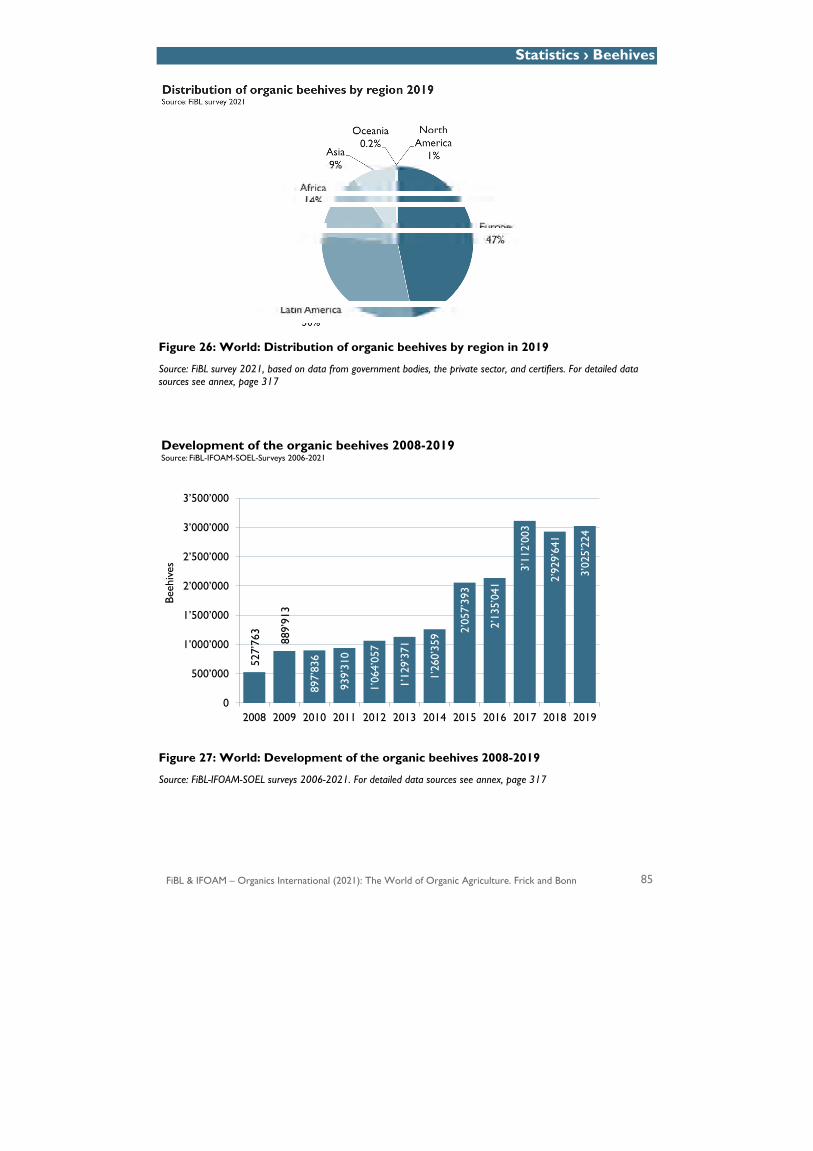
Statistics › Beehives
FiBL & IFOAM – Organics International (2021): The World of Organic Agriculture. Frick and Bonn 85
Figure 26: World: Distribution of organic beehives by region in 2019
Source: FiBL survey 2021, based on data from government bodies, the private sector, and certifiers. For detailed data sources see annex, page 317
Figure 27: World: Development of the organic beehives 2008-2019
Source: FiBL-IFOAM-SOEL surveys 2006-2021. For detailed data sources see annex, page 317
527’
763
889’
913
897’
836
939’
310
1’06
4’05
7
1’12
9’37
1
1’26
0’35
9 2’05
7’39
3
2’13
5’04
1
3’11
2’00
3
2’92
9’64
1
3’02
5’22
4
0
500’000
1’000’000
1’500’000
2’000’000
2’500’000
3’000’000
3’500’000
2008 2009 2010 2011 2012 2013 2014 2015 2016 2017 2018 2019
Beeh
ives
Development of the organic beehives 2008-2019Source: FiBL-IFOAM-SOEL-Surveys 2006-2021
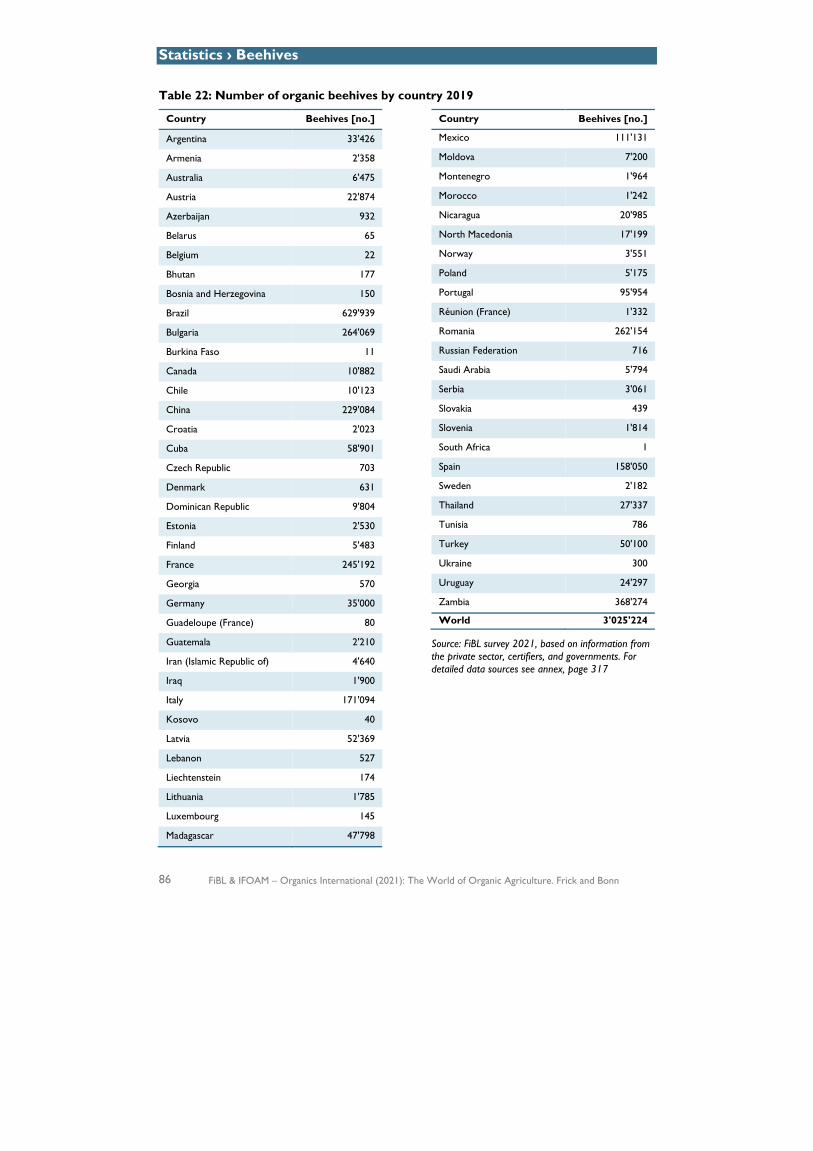
Statistics › Beehives
86 FiBL & IFOAM – Organics International (2021): The World of Organic Agriculture. Frick and Bonn
Table 22: Number of organic beehives by country 2019
Country Beehives [no.]
Argentina 33'426
Armenia 2'358
Australia 6'475
Austria 22'874
Azerbaijan 932
Belarus 65
Belgium 22
Bhutan 177
Bosnia and Herzegovina 150
Brazil 629'939
Bulgaria 264'069
Burkina Faso 11
Canada 10'882
Chile 10'123
China 229'084
Croatia 2'023
Cuba 58'901
Czech Republic 703
Denmark 631
Dominican Republic 9'804
Estonia 2'530
Finland 5'483
France 245'192
Georgia 570
Germany 35'000
Guadeloupe (France) 80
Guatemala 2'210
Iran (Islamic Republic of) 4'640
Iraq 1'900
Italy 171'094
Kosovo 40
Latvia 52'369
Lebanon 527
Liechtenstein 174
Lithuania 1'785
Luxembourg 145
Madagascar 47'798
Country Beehives [no.]
Mexico 111'131
Moldova 7'200
Montenegro 1'964
Morocco 1'242
Nicaragua 20'985
North Macedonia 17'199
Norway 3'551
Poland 5'175
Portugal 95'954
Réunion (France) 1'332
Romania 262'154
Russian Federation 716
Saudi Arabia 5'794
Serbia 3'061
Slovakia 439
Slovenia 1'814
South Africa 1
Spain 158'050
Sweden 2'182
Thailand 27'337
Tunisia 786
Turkey 50'100
Ukraine 300
Uruguay 24'297
Zambia 368'274
World 3'025'224
Source: FiBL survey 2021, based on information from the private sector, certifiers, and governments. For detailed data sources see annex, page 317
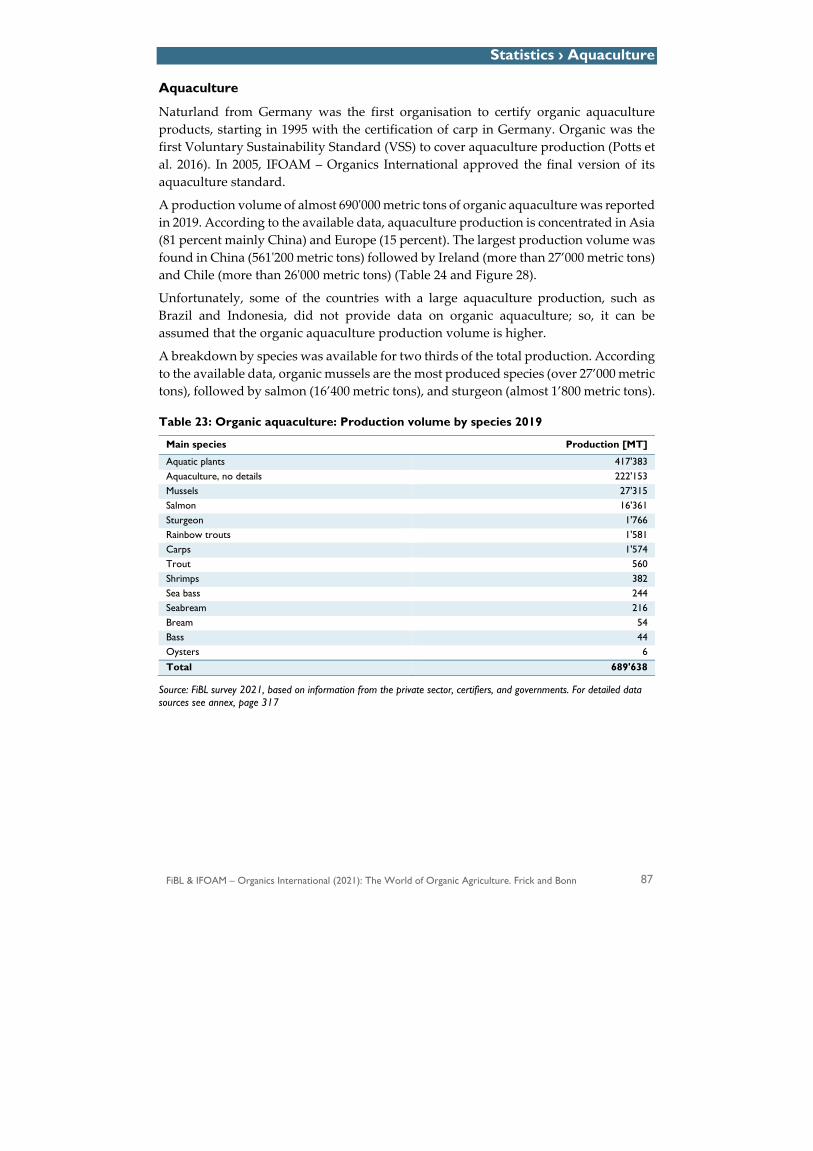
Statistics › Aquaculture
FiBL & IFOAM – Organics International (2021): The World of Organic Agriculture. Frick and Bonn 87
Aquaculture
Naturland from Germany was the first organisation to certify organic aquaculture products, starting in 1995 with the certification of carp in Germany. Organic was the first Voluntary Sustainability Standard (VSS) to cover aquaculture production (Potts et al. 2016). In 2005, IFOAM – Organics International approved the final version of its aquaculture standard.
A production volume of almost 690'000 metric tons of organic aquaculture was reported in 2019. According to the available data, aquaculture production is concentrated in Asia (81 percent mainly China) and Europe (15 percent). The largest production volume was found in China (561'200 metric tons) followed by Ireland (more than 27’000 metric tons) and Chile (more than 26'000 metric tons) (Table 24 and Figure 28).
Unfortunately, some of the countries with a large aquaculture production, such as Brazil and Indonesia, did not provide data on organic aquaculture; so, it can be assumed that the organic aquaculture production volume is higher.
A breakdown by species was available for two thirds of the total production. According to the available data, organic mussels are the most produced species (over 27’000 metric tons), followed by salmon (16’400 metric tons), and sturgeon (almost 1’800 metric tons).
Table 23: Organic aquaculture: Production volume by species 2019
Main species Production [MT]
Aquatic plants 417'383 Aquaculture, no details 222'153 Mussels 27'315 Salmon 16'361 Sturgeon 1'766 Rainbow trouts 1'581 Carps 1'574 Trout 560 Shrimps 382 Sea bass 244 Seabream 216 Bream 54 Bass 44 Oysters 6 Total 689'638
Source: FiBL survey 2021, based on information from the private sector, certifiers, and governments. For detailed data sources see annex, page 317
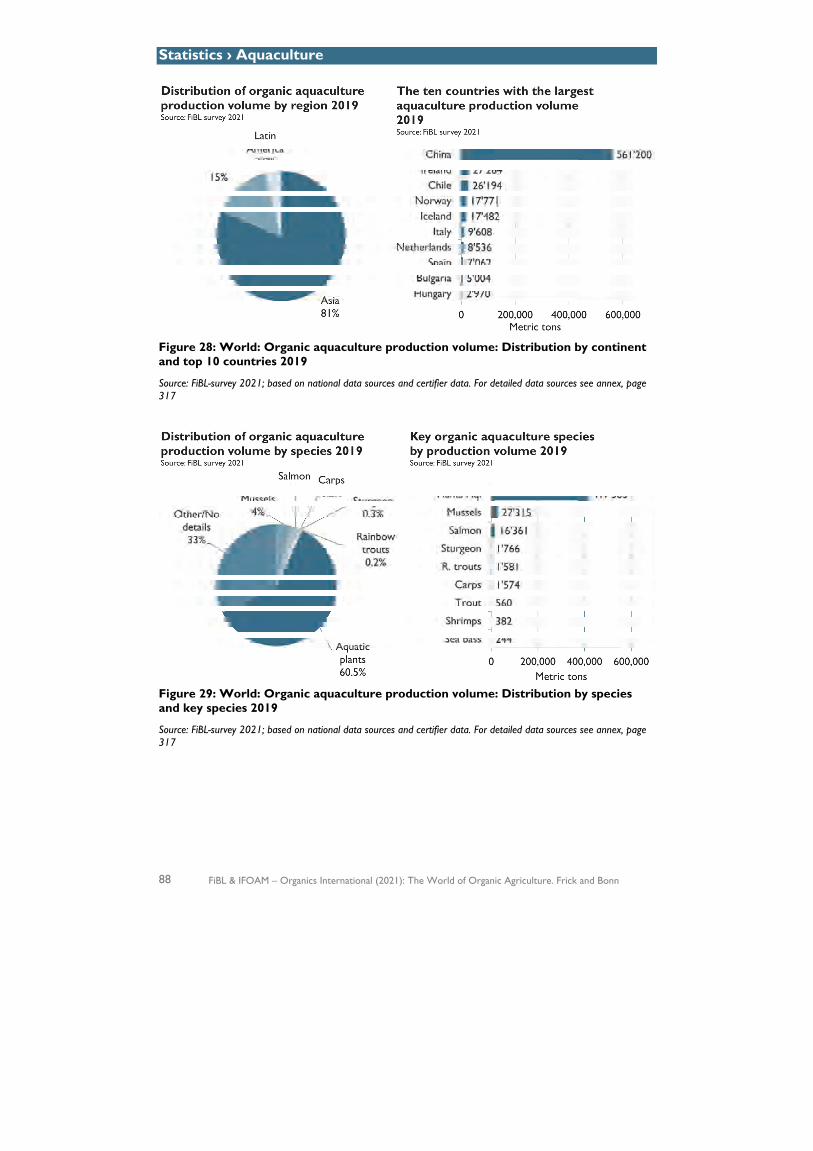
Statistics › Aquaculture
88 FiBL & IFOAM – Organics International (2021): The World of Organic Agriculture. Frick and Bonn
Figure 28: World: Organic aquaculture production volume: Distribution by continent and top 10 countries 2019
Source: FiBL-survey 2021; based on national data sources and certifier data. For detailed data sources see annex, page 317
Figure 29: World: Organic aquaculture production volume: Distribution by species and key species 2019
Source: FiBL-survey 2021; based on national data sources and certifier data. For detailed data sources see annex, page 317
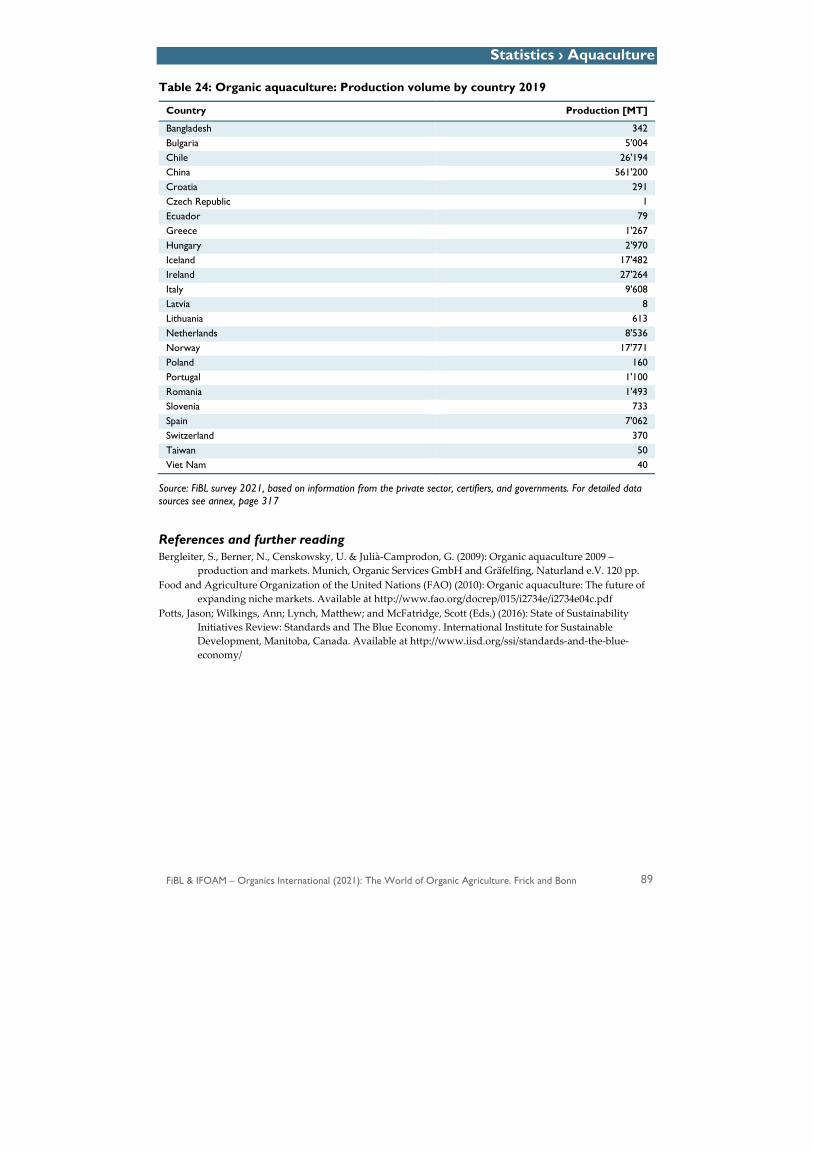
Statistics › Aquaculture
FiBL & IFOAM – Organics International (2021): The World of Organic Agriculture. Frick and Bonn 89
Table 24: Organic aquaculture: Production volume by country 2019
Country Production [MT]
Bangladesh 342 Bulgaria 5'004 Chile 26'194 China 561'200 Croatia 291 Czech Republic 1 Ecuador 79 Greece 1'267 Hungary 2'970 Iceland 17'482 Ireland 27'264 Italy 9'608 Latvia 8 Lithuania 613 Netherlands 8'536 Norway 17'771 Poland 160 Portugal 1'100 Romania 1'493 Slovenia 733 Spain 7'062 Switzerland 370 Taiwan 50 Viet Nam 40
Source: FiBL survey 2021, based on information from the private sector, certifiers, and governments. For detailed data sources see annex, page 317
References and further reading Bergleiter, S., Berner, N., Censkowsky, U. & Julià-Camprodon, G. (2009): Organic aquaculture 2009 –
production and markets. Munich, Organic Services GmbH and Gräfelfing, Naturland e.V. 120 pp. Food and Agriculture Organization of the United Nations (FAO) (2010): Organic aquaculture: The future of
expanding niche markets. Available at http://www.fao.org/docrep/015/i2734e/i2734e04c.pdf Potts, Jason; Wilkings, Ann; Lynch, Matthew; and McFatridge, Scott (Eds.) (2016): State of Sustainability
Initiatives Review: Standards and The Blue Economy. International Institute for Sustainable Development, Manitoba, Canada. Available at http://www.iisd.org/ssi/standards-and-the-blue-economy/
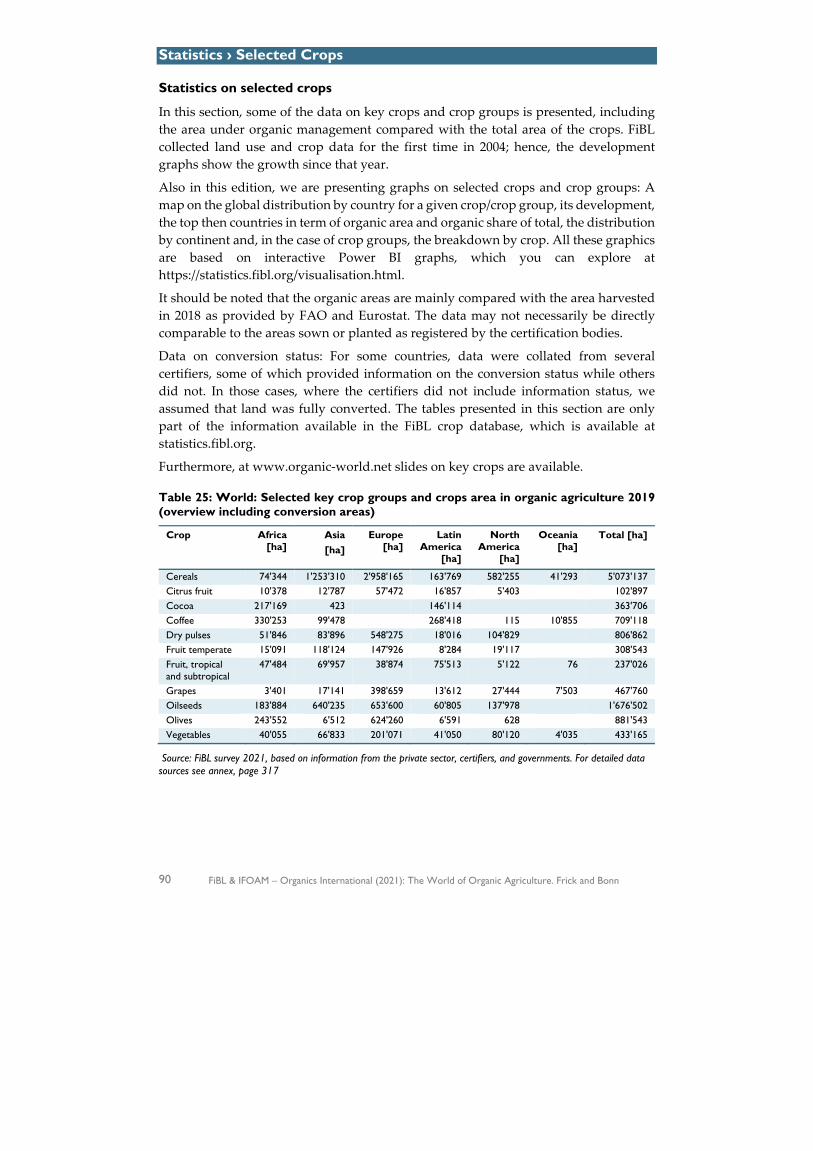
Statistics › Selected Crops
90 FiBL & IFOAM – Organics International (2021): The World of Organic Agriculture. Frick and Bonn
Statistics on selected crops
In this section, some of the data on key crops and crop groups is presented, including the area under organic management compared with the total area of the crops. FiBL collected land use and crop data for the first time in 2004; hence, the development graphs show the growth since that year.
Also in this edition, we are presenting graphs on selected crops and crop groups: A map on the global distribution by country for a given crop/crop group, its development, the top then countries in term of organic area and organic share of total, the distribution by continent and, in the case of crop groups, the breakdown by crop. All these graphics are based on interactive Power BI graphs, which you can explore at https://statistics.fibl.org/visualisation.html.
It should be noted that the organic areas are mainly compared with the area harvested in 2018 as provided by FAO and Eurostat. The data may not necessarily be directly comparable to the areas sown or planted as registered by the certification bodies.
Data on conversion status: For some countries, data were collated from several certifiers, some of which provided information on the conversion status while others did not. In those cases, where the certifiers did not include information status, we assumed that land was fully converted. The tables presented in this section are only part of the information available in the FiBL crop database, which is available at statistics.fibl.org.
Furthermore, at www.organic-world.net slides on key crops are available.
Table 25: World: Selected key crop groups and crops area in organic agriculture 2019 (overview including conversion areas)
Crop Africa [ha]
Asia [ha]
Europe [ha]
Latin America
[ha]
North America
[ha]
Oceania [ha]
Total [ha]
Cereals 74'344 1'253'310 2'958'165 163'769 582'255 41'293 5'073'137 Citrus fruit 10'378 12'787 57'472 16'857 5'403 102'897 Cocoa 217'169 423 146'114 363'706 Coffee 330'253 99'478 268'418 115 10'855 709'118 Dry pulses 51'846 83'896 548'275 18'016 104'829 806'862 Fruit temperate 15'091 118'124 147'926 8'284 19'117 308'543 Fruit, tropical and subtropical
47'484 69'957 38'874 75'513 5'122 76 237'026
Grapes 3'401 17'141 398'659 13'612 27'444 7'503 467'760 Oilseeds 183'884 640'235 653'600 60'805 137'978 1'676'502 Olives 243'552 6'512 624'260 6'591 628 881'543 Vegetables 40'055 66'833 201'071 41'050 80'120 4'035 433'165
Source: FiBL survey 2021, based on information from the private sector, certifiers, and governments. For detailed data sources see annex, page 317
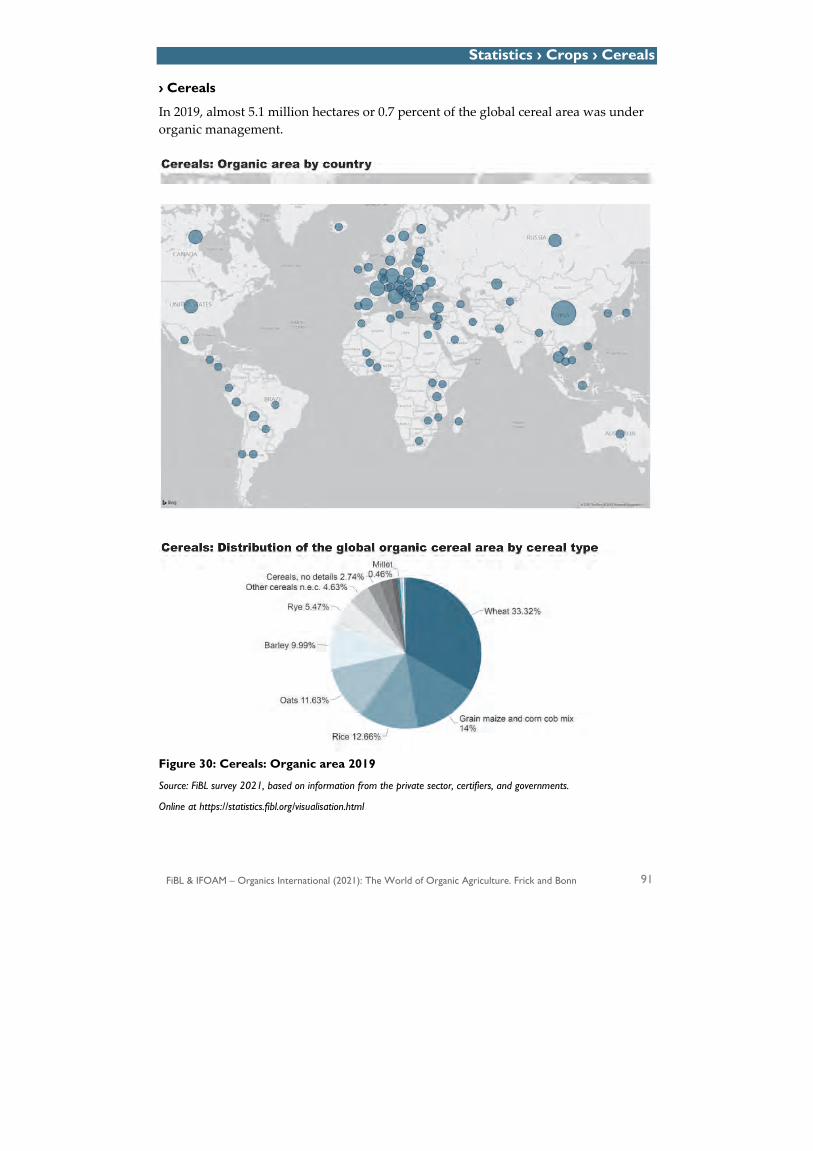
Statistics › Crops › Cereals
FiBL & IFOAM – Organics International (2021): The World of Organic Agriculture. Frick and Bonn 91
› Cereals
In 2019, almost 5.1 million hectares or 0.7 percent of the global cereal area was under organic management.
Figure 30: Cereals: Organic area 2019
Source: FiBL survey 2021, based on information from the private sector, certifiers, and governments.
Online at https://statistics.fibl.org/visualisation.html
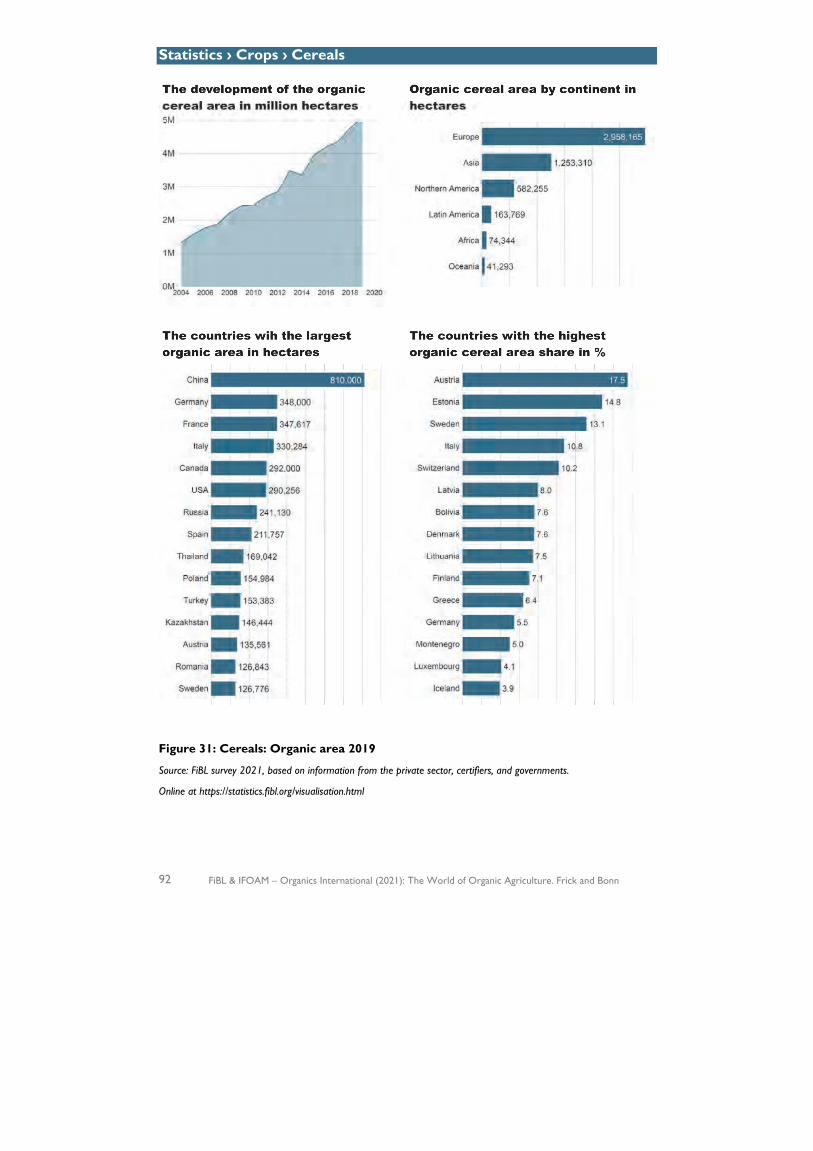
Statistics › Crops › Cereals
92 FiBL & IFOAM – Organics International (2021): The World of Organic Agriculture. Frick and Bonn
Figure 31: Cereals: Organic area 2019
Source: FiBL survey 2021, based on information from the private sector, certifiers, and governments.
Online at https://statistics.fibl.org/visualisation.html
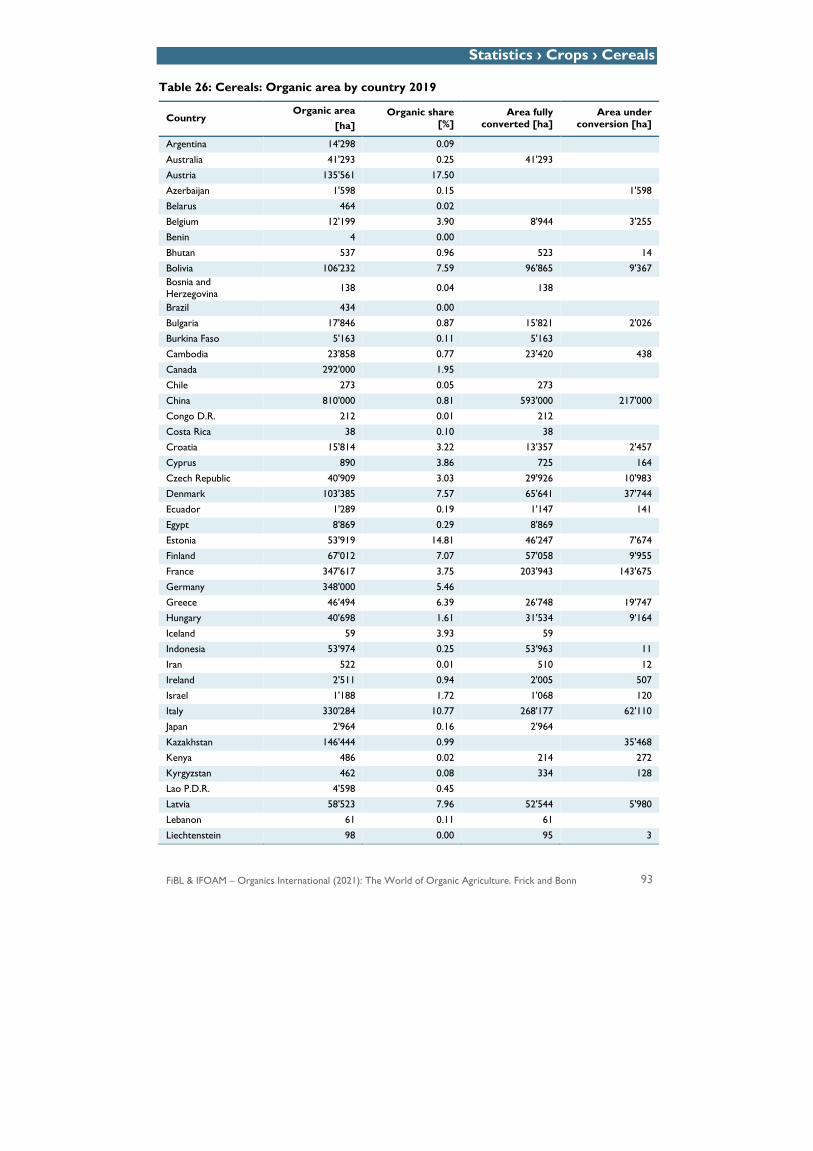
Statistics › Crops › Cereals
FiBL & IFOAM – Organics International (2021): The World of Organic Agriculture. Frick and Bonn 93
Table 26: Cereals: Organic area by country 2019
Country Organic area
[ha] Organic share
[%] Area fully
converted [ha] Area under
conversion [ha]
Argentina 14'298 0.09
Australia 41'293 0.25 41'293
Austria 135'561 17.50
Azerbaijan 1'598 0.15 1'598
Belarus 464 0.02
Belgium 12'199 3.90 8'944 3'255
Benin 4 0.00
Bhutan 537 0.96 523 14
Bolivia 106'232 7.59 96'865 9'367 Bosnia and Herzegovina 138 0.04 138
Brazil 434 0.00
Bulgaria 17'846 0.87 15'821 2'026
Burkina Faso 5'163 0.11 5'163
Cambodia 23'858 0.77 23'420 438
Canada 292'000 1.95
Chile 273 0.05 273
China 810'000 0.81 593'000 217'000
Congo D.R. 212 0.01 212
Costa Rica 38 0.10 38
Croatia 15'814 3.22 13'357 2'457
Cyprus 890 3.86 725 164
Czech Republic 40'909 3.03 29'926 10'983
Denmark 103'385 7.57 65'641 37'744
Ecuador 1'289 0.19 1'147 141
Egypt 8'869 0.29 8'869
Estonia 53'919 14.81 46'247 7'674
Finland 67'012 7.07 57'058 9'955
France 347'617 3.75 203'943 143'675
Germany 348'000 5.46
Greece 46'494 6.39 26'748 19'747
Hungary 40'698 1.61 31'534 9'164
Iceland 59 3.93 59
Indonesia 53'974 0.25 53'963 11
Iran 522 0.01 510 12
Ireland 2'511 0.94 2'005 507
Israel 1'188 1.72 1'068 120
Italy 330'284 10.77 268'177 62'110
Japan 2'964 0.16 2'964
Kazakhstan 146'444 0.99 35'468
Kenya 486 0.02 214 272
Kyrgyzstan 462 0.08 334 128
Lao P.D.R. 4'598 0.45
Latvia 58'523 7.96 52'544 5'980
Lebanon 61 0.11 61
Liechtenstein 98 0.00 95 3

Statistics › Crops › Cereals
94 FiBL & IFOAM – Organics International (2021): The World of Organic Agriculture. Frick and Bonn
Country Organic area [ha]
Organic share [%]
Area fully converted [ha]
Area under conversion [ha]
Lithuania 100'938 7.45 95'248 5'690
Luxembourg 1'114 4.09 999 114
Madagascar 56 0.01 46 10
Mali 260 0.00 260
Malta 4 0.00 4
Mexico 3'888 0.04 3'888
Moldova 11'401 1.23 8'201 3'200
Montenegro 110 4.98 79 31
Morocco 12 0.00 12
Mozambique 4 0.00 4
Netherlands 3'807 2.12 3'259 548
North Macedonia 1'145 0.71 638 507
Norway 6'427 2.30 5'783 644
Pakistan 31'179 0.23 27'327 3'851
Palestine 95 0.40 51 44
Paraguay 250 0.01 250
Peru 37'067 2.98
Poland 154'984 2.20 117'875 37'109
Portugal 4'513 1.99 4'079 435
Republic of Korea 1'686 0.20
Romania 126'843 2.28 83'470 43'373
Russian Federation 241'130 0.57 2'650
Saudi Arabia 430 0.17 367 63
Serbia 4'789 0.28 2'741 2'048
Slovakia 22'691 2.95 18'662 4'029
Slovenia 2'267 2.30 2'068 198
South Africa 1'797 0.06 1'607 190
Spain 211'757 3.55 190'547 21'212
Sweden 126'776 13.14 111'079 15'697
Switzerland 14'482 10.19
Taiwan 3'033 1.00 3'033
Tanzania 50'860 0.77 50'860
Thailand 169'042 1.44
Tunisia 1'595 0.10 1'595
Turkey 153'383 1.41 120'368 33'015
Uganda 5'016 0.27
Ukraine 107'537 0.76 8'057
United Kingdom 39'647 1.23 36'674 2'973
USA 290'256 0.54 290'256
Viet Nam 1'640 0.02 1'263 377
Zimbabwe 10 0.00 10
World 5'073'137 0.70 2'835'482 766'079
Source: FiBL survey 2021, based on information from the private sector, certifiers, and governments. For detailed data sources see annex, page 317 Blank cells: No data available
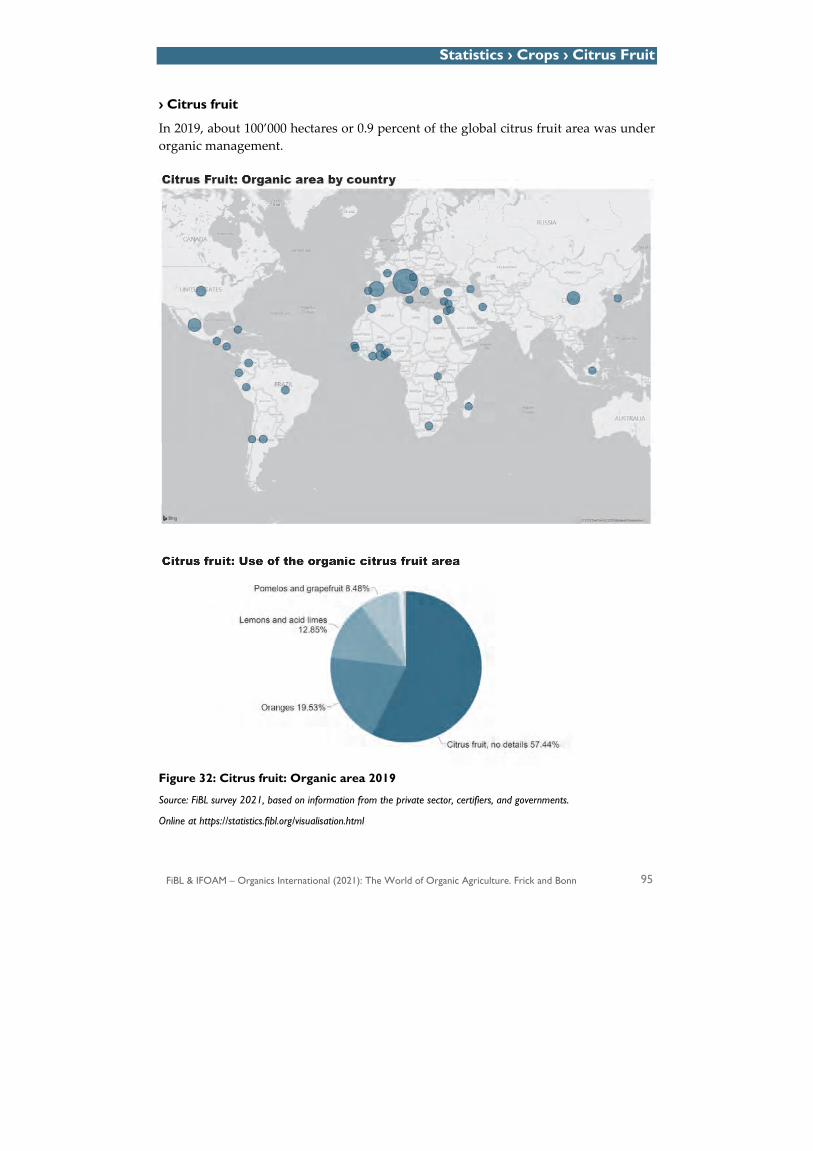
Statistics › Crops › Citrus Fruit
FiBL & IFOAM – Organics International (2021): The World of Organic Agriculture. Frick and Bonn 95
› Citrus fruit
In 2019, about 100’000 hectares or 0.9 percent of the global citrus fruit area was under organic management.
Figure 32: Citrus fruit: Organic area 2019
Source: FiBL survey 2021, based on information from the private sector, certifiers, and governments.
Online at https://statistics.fibl.org/visualisation.html
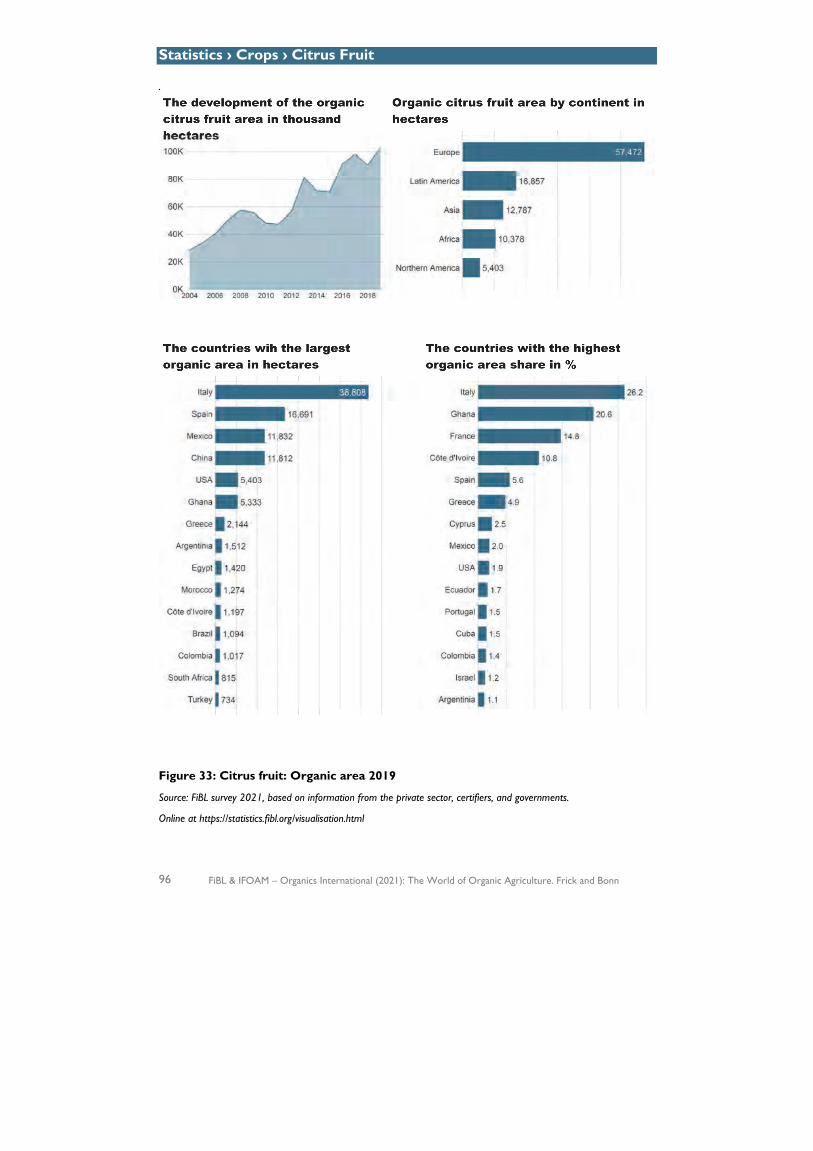
Statistics › Crops › Citrus Fruit
96 FiBL & IFOAM – Organics International (2021): The World of Organic Agriculture. Frick and Bonn
.
Figure 33: Citrus fruit: Organic area 2019
Source: FiBL survey 2021, based on information from the private sector, certifiers, and governments.
Online at https://statistics.fibl.org/visualisation.html
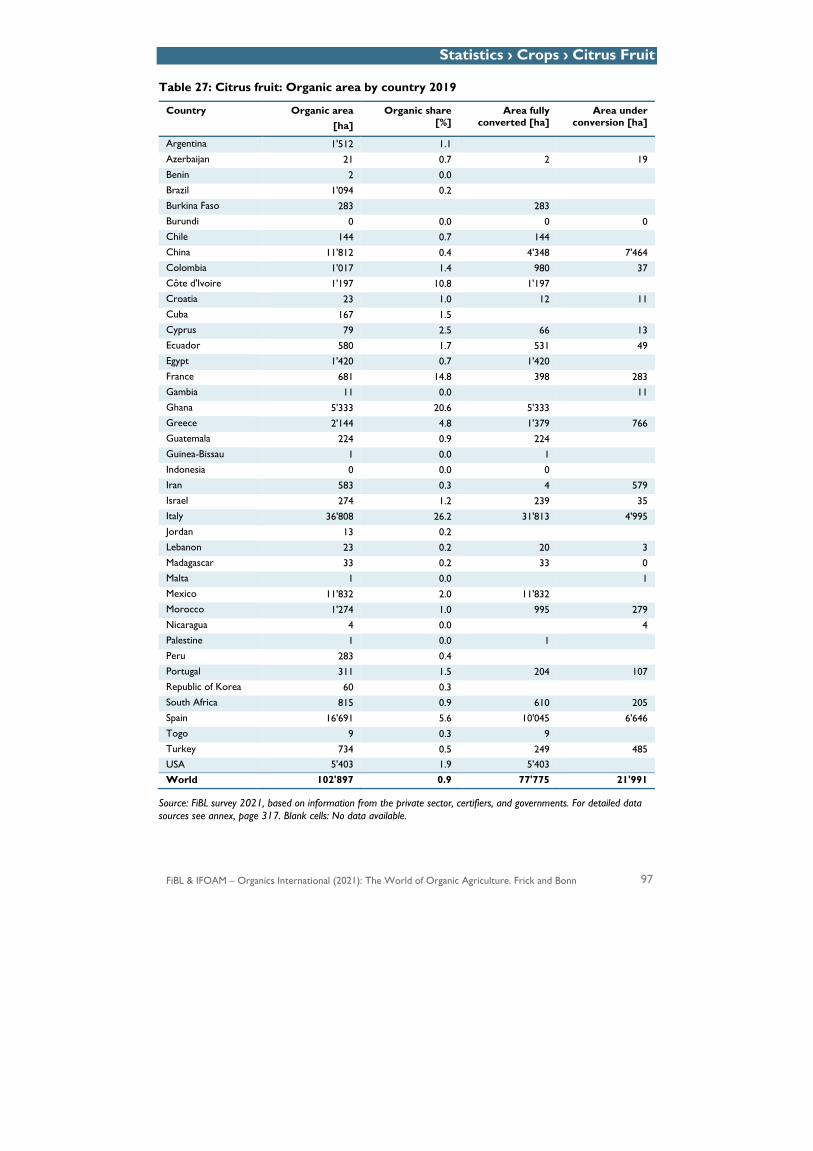
Statistics › Crops › Citrus Fruit
FiBL & IFOAM – Organics International (2021): The World of Organic Agriculture. Frick and Bonn 97
Table 27: Citrus fruit: Organic area by country 2019
Country Organic area [ha]
Organic share [%]
Area fully converted [ha]
Area under conversion [ha]
Argentina 1'512 1.1 Azerbaijan 21 0.7 2 19Benin 2 0.0 Brazil 1'094 0.2Burkina Faso 283 283 Burundi 0 0.0 0 0Chile 144 0.7 144 China 11'812 0.4 4'348 7'464Colombia 1'017 1.4 980 37 Côte d'Ivoire 1'197 10.8 1'197Croatia 23 1.0 12 11 Cuba 167 1.5Cyprus 79 2.5 66 13 Ecuador 580 1.7 531 49Egypt 1'420 0.7 1'420 France 681 14.8 398 283Gambia 11 0.0 11 Ghana 5'333 20.6 5'333Greece 2'144 4.8 1'379 766 Guatemala 224 0.9 224Guinea-Bissau 1 0.0 1 Indonesia 0 0.0 0Iran 583 0.3 4 579 Israel 274 1.2 239 35Italy 36'808 26.2 31'813 4'995 Jordan 13 0.2Lebanon 23 0.2 20 3 Madagascar 33 0.2 33 0Malta 1 0.0 1 Mexico 11'832 2.0 11'832Morocco 1'274 1.0 995 279 Nicaragua 4 0.0 4Palestine 1 0.0 1 Peru 283 0.4Portugal 311 1.5 204 107 Republic of Korea 60 0.3South Africa 815 0.9 610 205 Spain 16'691 5.6 10'045 6'646Togo 9 0.3 9 Turkey 734 0.5 249 485USA 5'403 1.9 5'403 World 102'897 0.9 77'775 21'991
Source: FiBL survey 2021, based on information from the private sector, certifiers, and governments. For detailed data sources see annex, page 317. Blank cells: No data available.
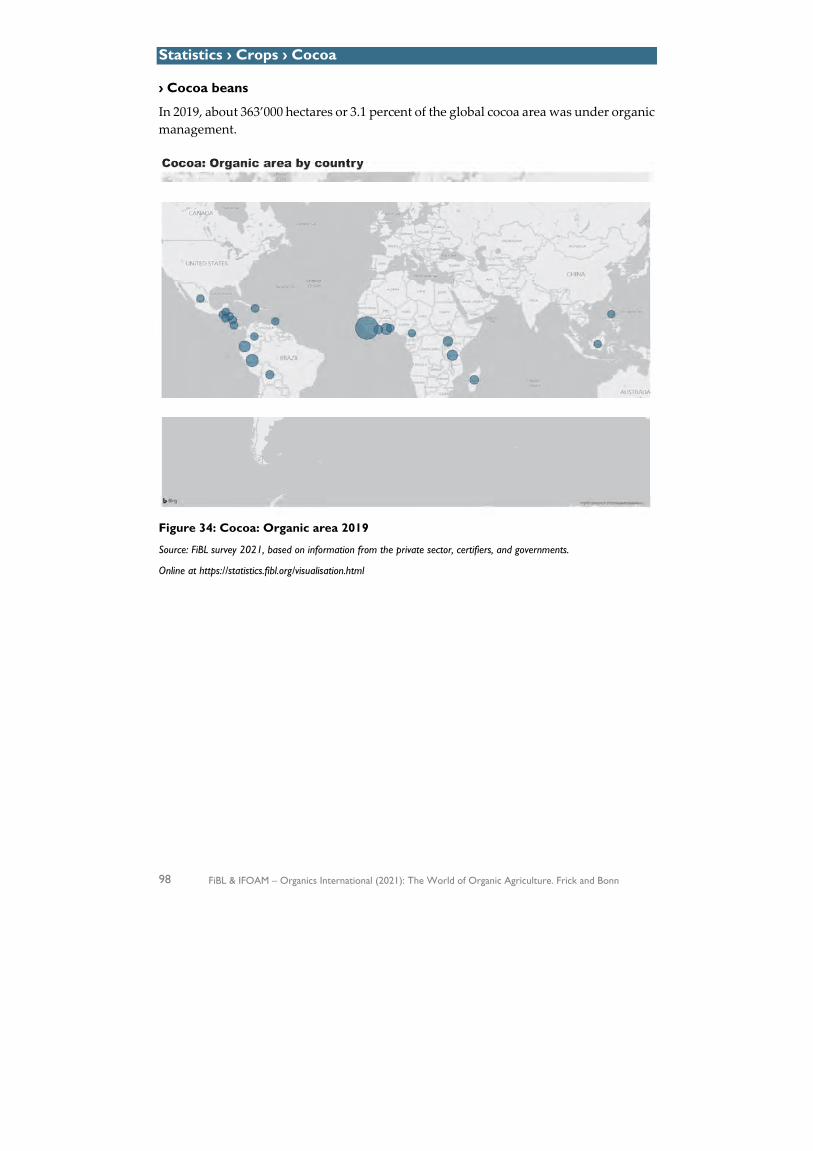
Statistics › Crops › Cocoa
98 FiBL & IFOAM – Organics International (2021): The World of Organic Agriculture. Frick and Bonn
› Cocoa beans
In 2019, about 363’000 hectares or 3.1 percent of the global cocoa area was under organic management.
Figure 34: Cocoa: Organic area 2019
Source: FiBL survey 2021, based on information from the private sector, certifiers, and governments.
Online at https://statistics.fibl.org/visualisation.html
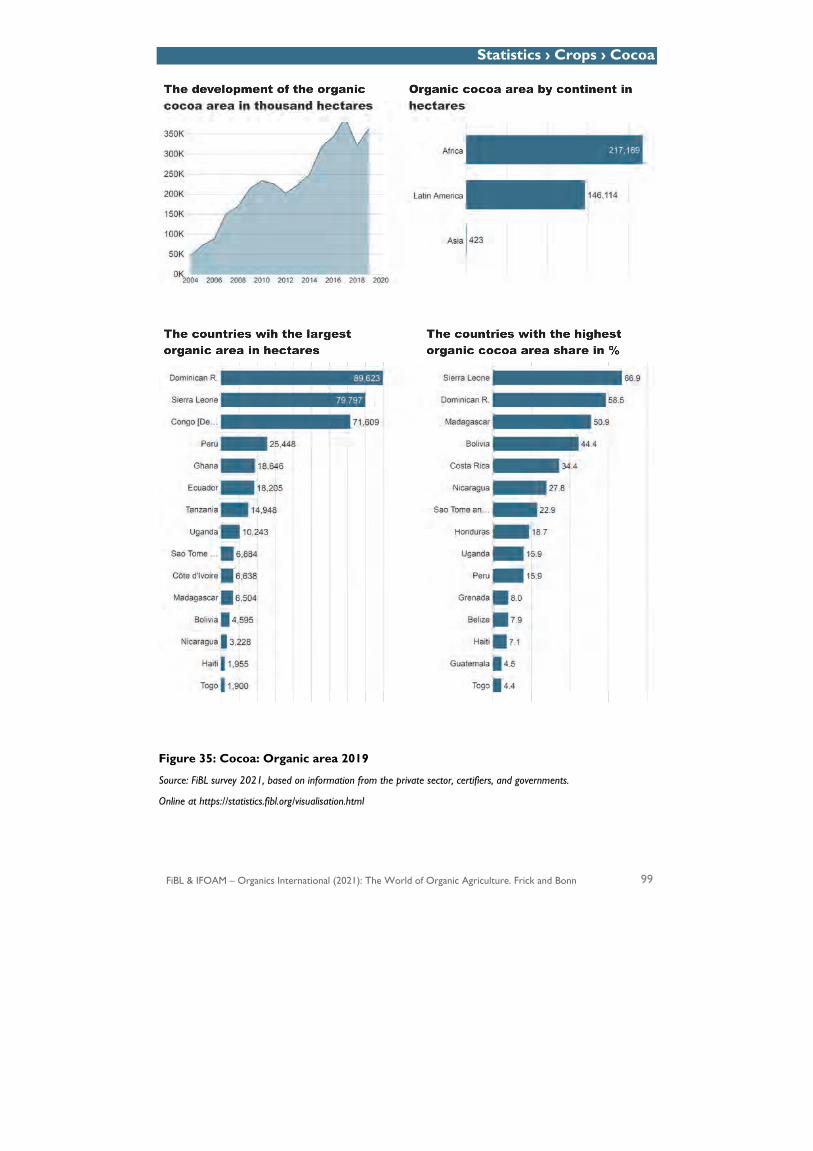
Statistics › Crops › Cocoa
FiBL & IFOAM – Organics International (2021): The World of Organic Agriculture. Frick and Bonn 99
Figure 35: Cocoa: Organic area 2019
Source: FiBL survey 2021, based on information from the private sector, certifiers, and governments.
Online at https://statistics.fibl.org/visualisation.html
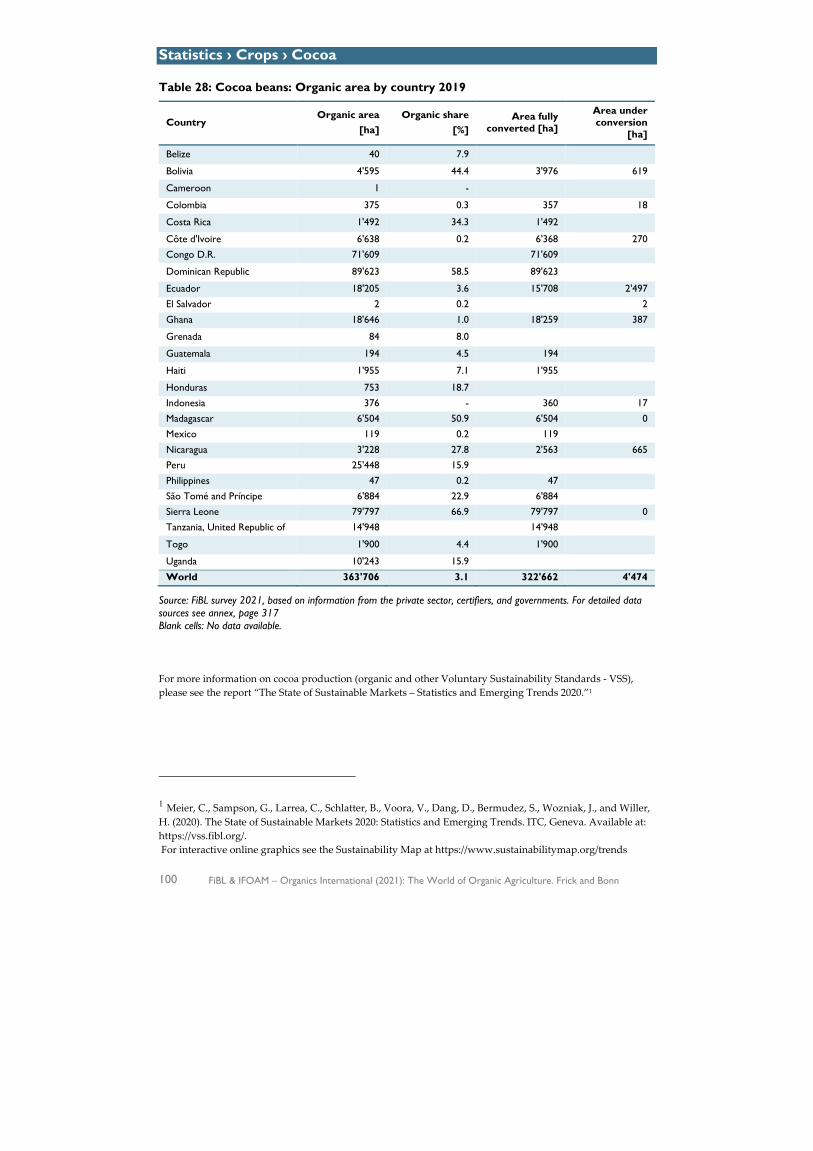
Statistics › Crops › Cocoa
100 FiBL & IFOAM – Organics International (2021): The World of Organic Agriculture. Frick and Bonn
Table 28: Cocoa beans: Organic area by country 2019
Country Organic area
[ha] Organic share
[%] Area fully
converted [ha]
Area under conversion
[ha]
Belize 40 7.9
Bolivia 4'595 44.4 3'976 619
Cameroon 1 -
Colombia 375 0.3 357 18
Costa Rica 1'492 34.3 1'492
Côte d'Ivoire 6'638 0.2 6'368 270
Congo D.R. 71'609 71'609
Dominican Republic 89'623 58.5 89'623
Ecuador 18'205 3.6 15'708 2'497
El Salvador 2 0.2 2
Ghana 18'646 1.0 18'259 387
Grenada 84 8.0
Guatemala 194 4.5 194
Haiti 1'955 7.1 1'955
Honduras 753 18.7
Indonesia 376 - 360 17
Madagascar 6'504 50.9 6'504 0
Mexico 119 0.2 119
Nicaragua 3'228 27.8 2'563 665
Peru 25'448 15.9
Philippines 47 0.2 47
São Tomé and Príncipe 6'884 22.9 6'884
Sierra Leone 79'797 66.9 79'797 0
Tanzania, United Republic of 14'948 14'948
Togo 1'900 4.4 1'900
Uganda 10'243 15.9
World 363'706 3.1 322'662 4'474
Source: FiBL survey 2021, based on information from the private sector, certifiers, and governments. For detailed data sources see annex, page 317 Blank cells: No data available.
For more information on cocoa production (organic and other Voluntary Sustainability Standards - VSS), please see the report “The State of Sustainable Markets – Statistics and Emerging Trends 2020.”1
1 Meier, C., Sampson, G., Larrea, C., Schlatter, B., Voora, V., Dang, D., Bermudez, S., Wozniak, J., and Willer, H. (2020). The State of Sustainable Markets 2020: Statistics and Emerging Trends. ITC, Geneva. Available at: https://vss.fibl.org/. For interactive online graphics see the Sustainability Map at https://www.sustainabilitymap.org/trends
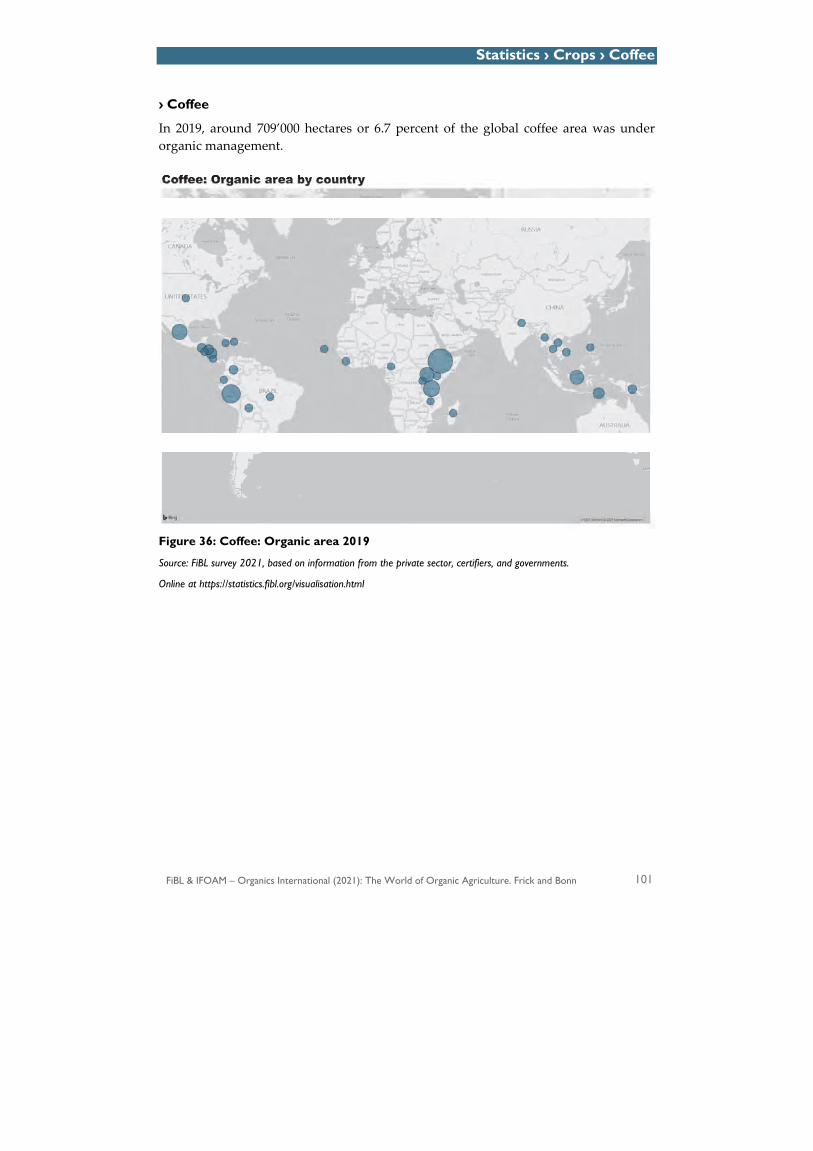
Statistics › Crops › Coffee
FiBL & IFOAM – Organics International (2021): The World of Organic Agriculture. Frick and Bonn 101
› Coffee
In 2019, around 709’000 hectares or 6.7 percent of the global coffee area was under organic management.
Figure 36: Coffee: Organic area 2019
Source: FiBL survey 2021, based on information from the private sector, certifiers, and governments.
Online at https://statistics.fibl.org/visualisation.html
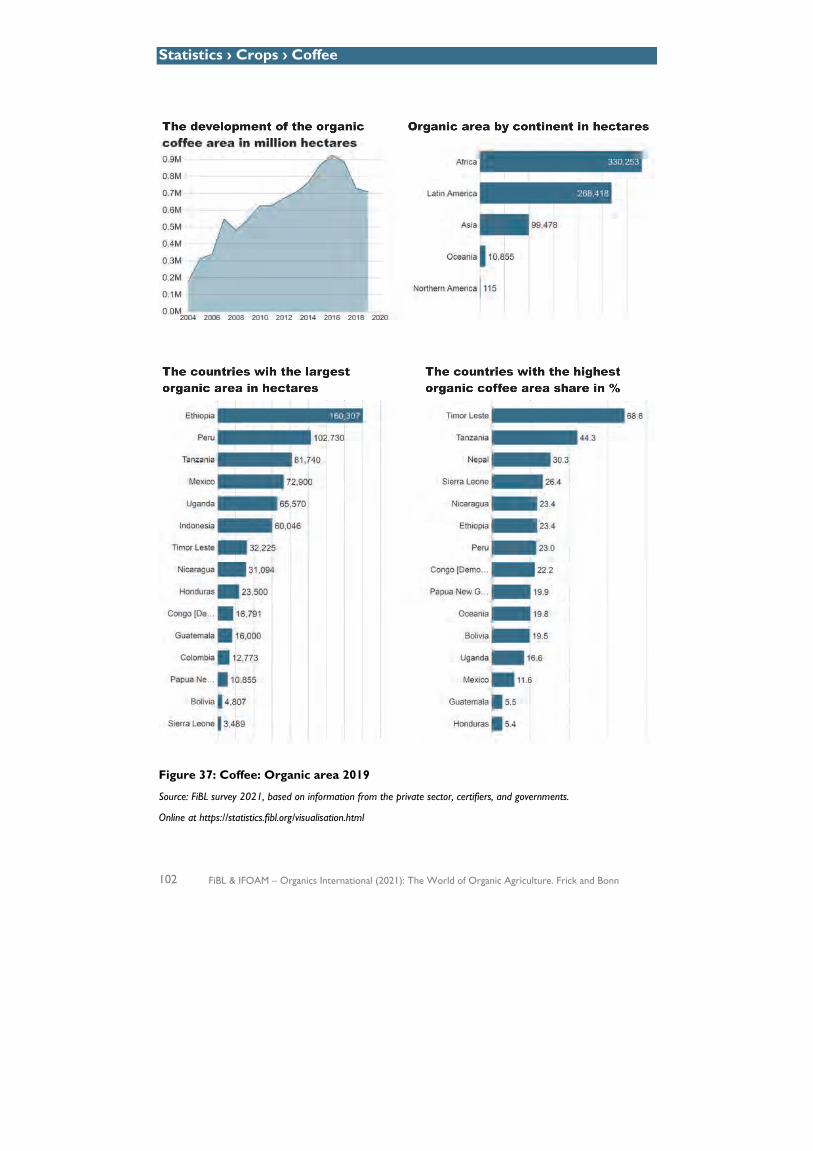
Statistics › Crops › Coffee
102 FiBL & IFOAM – Organics International (2021): The World of Organic Agriculture. Frick and Bonn
Figure 37: Coffee: Organic area 2019
Source: FiBL survey 2021, based on information from the private sector, certifiers, and governments.
Online at https://statistics.fibl.org/visualisation.html
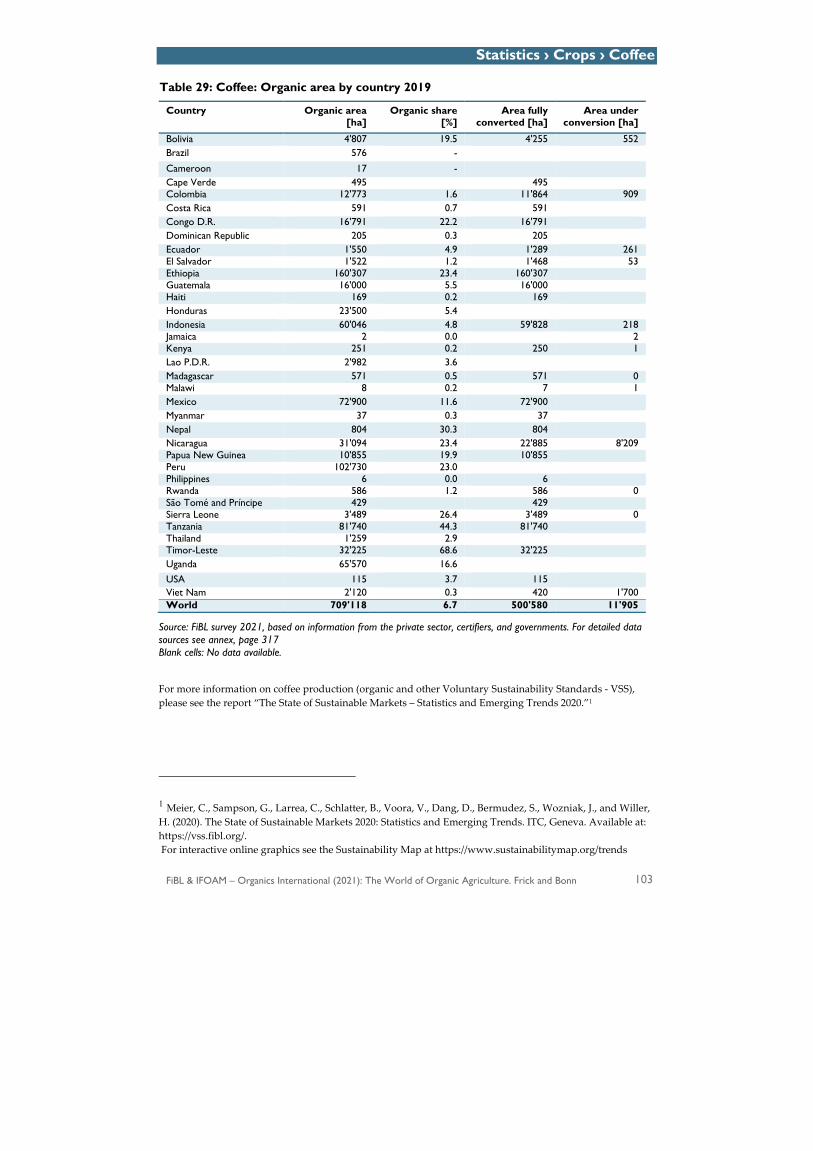
Statistics › Crops › Coffee
FiBL & IFOAM – Organics International (2021): The World of Organic Agriculture. Frick and Bonn 103
Table 29: Coffee: Organic area by country 2019
Country Organic area [ha]
Organic share [%]
Area fully converted [ha]
Area under conversion [ha]
Bolivia 4'807 19.5 4'255 552 Brazil 576 -
Cameroon 17 - Cape Verde 495 495 Colombia 12'773 1.6 11'864 909Costa Rica 591 0.7 591 Congo D.R. 16'791 22.2 16'791 Dominican Republic 205 0.3 205 Ecuador 1'550 4.9 1'289 261 El Salvador 1'522 1.2 1'468 53 Ethiopia 160'307 23.4 160'307 Guatemala 16'000 5.5 16'000Haiti 169 0.2 169 Honduras 23'500 5.4Indonesia 60'046 4.8 59'828 218 Jamaica 2 0.0 2Kenya 251 0.2 250 1 Lao P.D.R. 2'982 3.6 Madagascar 571 0.5 571 0 Malawi 8 0.2 7 1Mexico 72'900 11.6 72'900 Myanmar 37 0.3 37Nepal 804 30.3 804 Nicaragua 31'094 23.4 22'885 8'209Papua New Guinea 10'855 19.9 10'855 Peru 102'730 23.0Philippines 6 0.0 6 Rwanda 586 1.2 586 0São Tomé and Príncipe 429 429 Sierra Leone 3'489 26.4 3'489 0 Tanzania 81'740 44.3 81'740 Thailand 1'259 2.9Timor-Leste 32'225 68.6 32'225 Uganda 65'570 16.6USA 115 3.7 115 Viet Nam 2'120 0.3 420 1'700 World 709'118 6.7 500'580 11'905
Source: FiBL survey 2021, based on information from the private sector, certifiers, and governments. For detailed data sources see annex, page 317 Blank cells: No data available.
For more information on coffee production (organic and other Voluntary Sustainability Standards - VSS), please see the report “The State of Sustainable Markets – Statistics and Emerging Trends 2020.”1
1 Meier, C., Sampson, G., Larrea, C., Schlatter, B., Voora, V., Dang, D., Bermudez, S., Wozniak, J., and Willer, H. (2020). The State of Sustainable Markets 2020: Statistics and Emerging Trends. ITC, Geneva. Available at: https://vss.fibl.org/. For interactive online graphics see the Sustainability Map at https://www.sustainabilitymap.org/trends
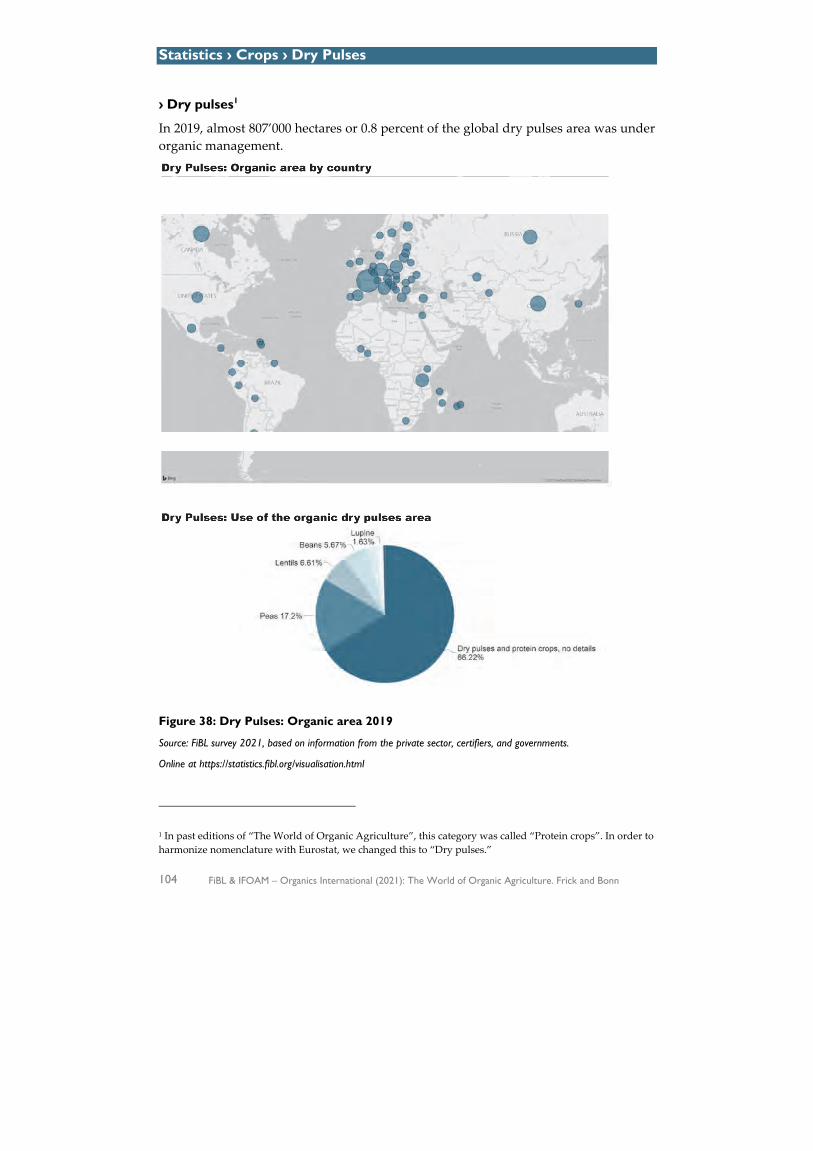
Statistics › Crops › Dry Pulses
104 FiBL & IFOAM – Organics International (2021): The World of Organic Agriculture. Frick and Bonn
› Dry pulses1
In 2019, almost 807’000 hectares or 0.8 percent of the global dry pulses area was under organic management.
Figure 38: Dry Pulses: Organic area 2019
Source: FiBL survey 2021, based on information from the private sector, certifiers, and governments.
Online at https://statistics.fibl.org/visualisation.html
1 In past editions of “The World of Organic Agriculture”, this category was called “Protein crops”. In order to harmonize nomenclature with Eurostat, we changed this to “Dry pulses.”

Statistics › Crops › Dry Pulses
FiBL & IFOAM – Organics International (2021): The World of Organic Agriculture. Frick and Bonn 105
Figure 39: Dry Pulses: Organic area 2019
Source: FiBL survey 2021 based on information from the private sector, certifiers, and governments.
Online at https://statistics.fibl.org/visualisation.html

Statistics › Crops › Dry Pulses
106 FiBL & IFOAM – Organics International (2021): The World of Organic Agriculture. Frick and Bonn
Table 30: Dry pulses: Organic area by country 2019
Country Organic area [ha]
Organic share [%]
Area fully converted [ha]
Area under conversion [ha]
Argentina 1'224 0.2
Austria 12'374 70.0
Azerbaijan 6 0.0 2 4
Belarus 40 0.0
Belgium 384 8.3 326 58
Benin 0 0.0
Bolivia 31 0.0 21 10
Bosnia and Herzegovina 24 0.2 24
Bulgaria 12'380 29.4 11'154 1'227
Burkina Faso 16 0.0 16
Canada 73'248 2.3
China 70'000 2.5 57'000 13'000
Colombia 4 0.0 4
Croatia 97 3.9 84 12
Czech Republic 4'115 12.2 2'882 1'233
Denmark 10'645 48.0 4'924 5'722
Ecuador 49 0.2 25 24
Estonia 8'544 19.9 7'034 1'511
Finland 20'614 65.2 16'312 4'302
France 131'070 41.9 92'666 38'404
French Guiana (France) 114 0.0 74 40
Germany 52'000 31.2
Greece 19'282 15.0 13'041 6'241
Guadeloupe (France) 66 97.1 45 21
Hungary 3'244 18.5 2'923 321
Ireland 101 1.2 78 24
Israel 38 0.5 32 6
Italy 47'523 41.0 39'653 7'869
Kazakhstan 13'388 1.6 8'880
Kenya 215 0.0 215
Kyrgyzstan 400 0.4 400
Latvia 10'902 27.0 9'903 999
Lithuania 23'882 16.1 22'338 1'544
Luxembourg 96 23.4 96
Macao 0.0
Madagascar 183 0.2 183 0
Martinique (France) 46 2.6 43 3
Mauritius 0 0.0 0
Mayotte 4 0.0 3 1
Mexico 16'273 0.9 16'273
Moldova 1'658 4.3 889 769
Montenegro 1 0.2 1
Netherlands 242 6.9 212 30
Nicaragua 205 0.1 205
Norway 426 13.1 355 71
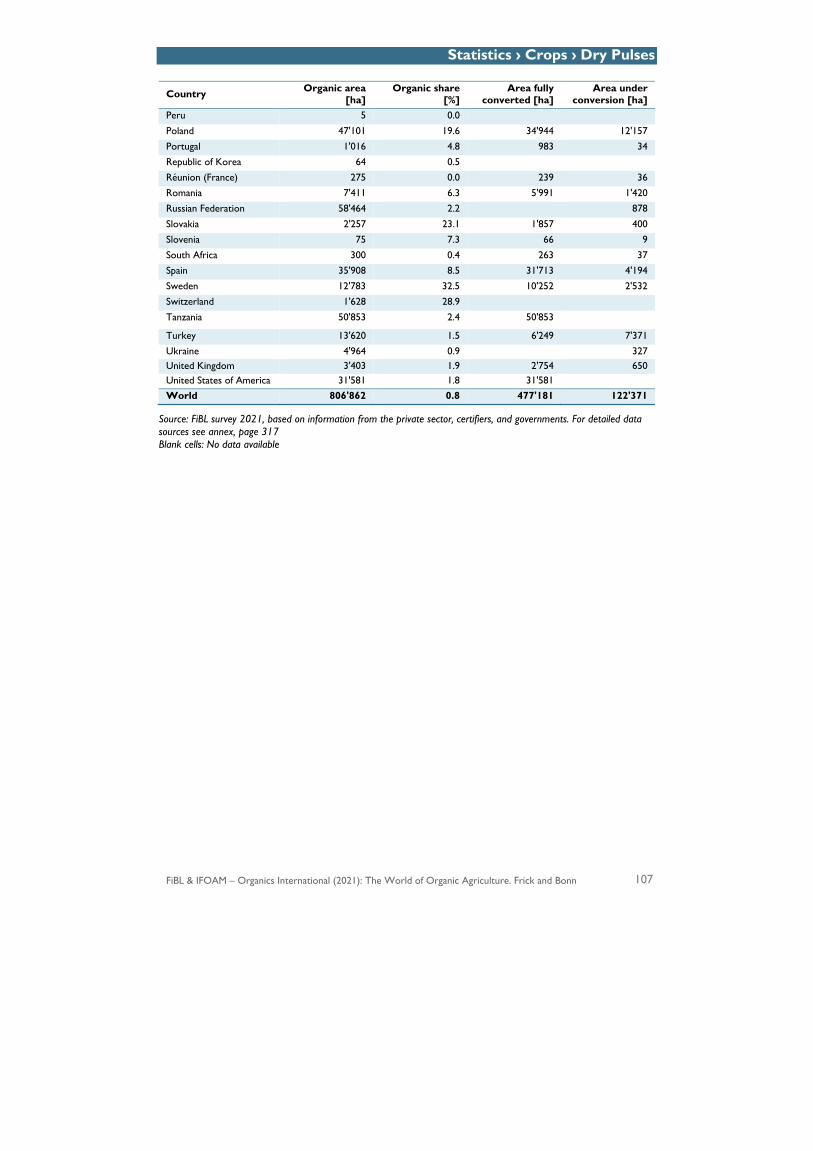
Statistics › Crops › Dry Pulses
FiBL & IFOAM – Organics International (2021): The World of Organic Agriculture. Frick and Bonn 107
Country Organic area [ha]
Organic share [%]
Area fully converted [ha]
Area under conversion [ha]
Peru 5 0.0
Poland 47'101 19.6 34'944 12'157
Portugal 1'016 4.8 983 34
Republic of Korea 64 0.5
Réunion (France) 275 0.0 239 36
Romania 7'411 6.3 5'991 1'420
Russian Federation 58'464 2.2 878
Slovakia 2'257 23.1 1'857 400
Slovenia 75 7.3 66 9
South Africa 300 0.4 263 37
Spain 35'908 8.5 31'713 4'194
Sweden 12'783 32.5 10'252 2'532
Switzerland 1'628 28.9
Tanzania 50'853 2.4 50'853
Turkey 13'620 1.5 6'249 7'371
Ukraine 4'964 0.9 327 United Kingdom 3'403 1.9 2'754 650 United States of America 31'581 1.8 31'581 World 806'862 0.8 477'181 122'371
Source: FiBL survey 2021, based on information from the private sector, certifiers, and governments. For detailed data sources see annex, page 317 Blank cells: No data available

Statistics › Crops › Temperate Fruit
108 FiBL & IFOAM – Organics International (2021): The World of Organic Agriculture. Frick and Bonn
Temperate Fruit
In 2019, more than 308’000 hectares or 2.6 percent of the global temperate fruit area was under organic management.
Figure 40: Temperate Fruit: Organic area 2019
Source: FiBL survey 2021, based on information from the private sector, certifiers, and governments.
Online at https://statistics.fibl.org/visualisation.html
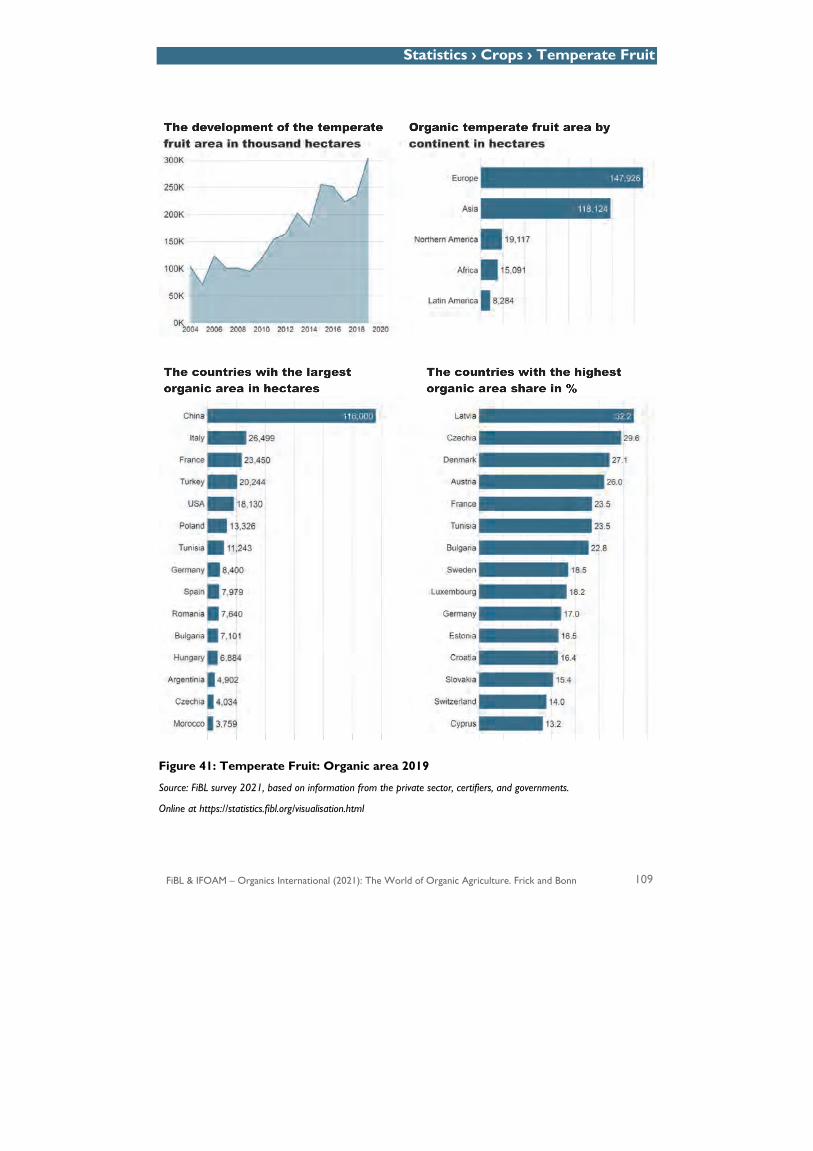
Statistics › Crops › Temperate Fruit
FiBL & IFOAM – Organics International (2021): The World of Organic Agriculture. Frick and Bonn 109
Figure 41: Temperate Fruit: Organic area 2019
Source: FiBL survey 2021, based on information from the private sector, certifiers, and governments.
Online at https://statistics.fibl.org/visualisation.html
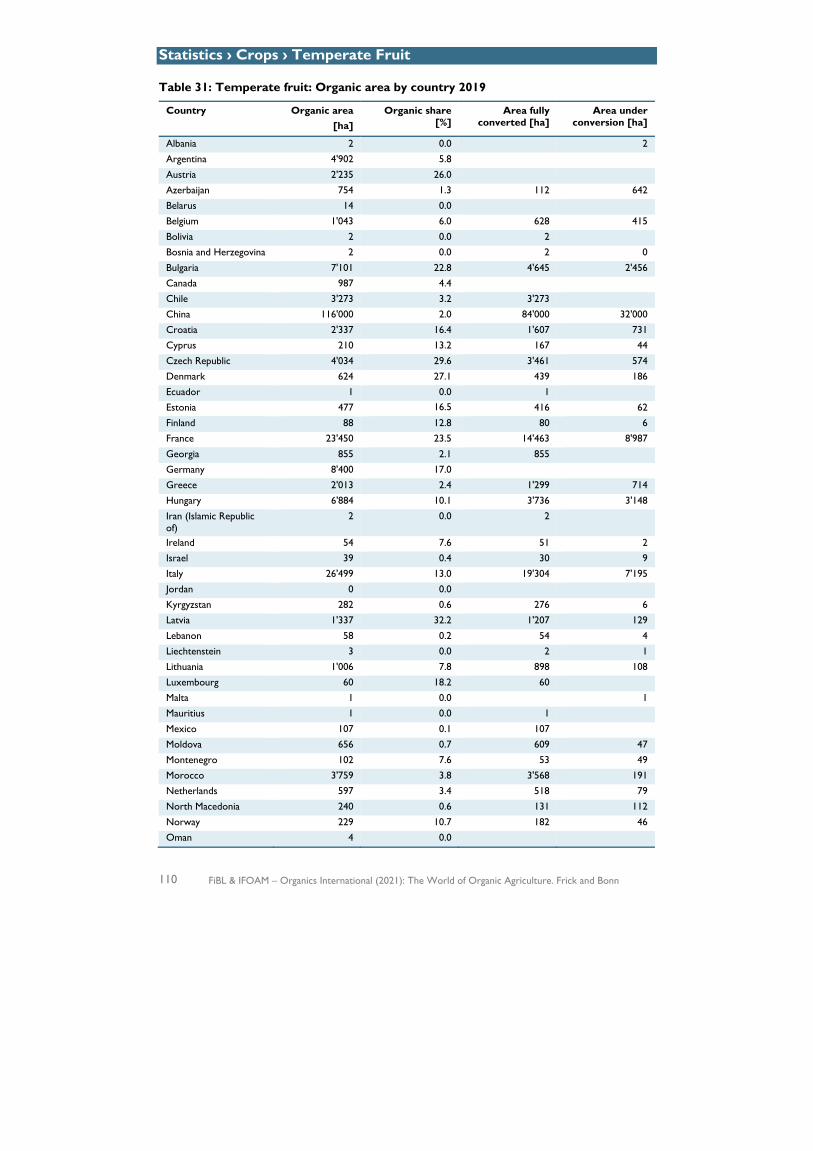
Statistics › Crops › Temperate Fruit
110 FiBL & IFOAM – Organics International (2021): The World of Organic Agriculture. Frick and Bonn
Table 31: Temperate fruit: Organic area by country 2019
Country Organic area [ha]
Organic share [%]
Area fully converted [ha]
Area under conversion [ha]
Albania 2 0.0 2
Argentina 4'902 5.8
Austria 2'235 26.0
Azerbaijan 754 1.3 112 642
Belarus 14 0.0
Belgium 1'043 6.0 628 415
Bolivia 2 0.0 2
Bosnia and Herzegovina 2 0.0 2 0
Bulgaria 7'101 22.8 4'645 2'456
Canada 987 4.4
Chile 3'273 3.2 3'273
China 116'000 2.0 84'000 32'000
Croatia 2'337 16.4 1'607 731
Cyprus 210 13.2 167 44
Czech Republic 4'034 29.6 3'461 574
Denmark 624 27.1 439 186
Ecuador 1 0.0 1
Estonia 477
16.5 416 62
Finland 88 12.8 80 6
France 23'450 23.5 14'463 8'987
Georgia 855 2.1 855
Germany 8'400 17.0
Greece 2'013 2.4 1'299 714
Hungary 6'884 10.1 3'736 3'148
Iran (Islamic Republic of)
2 0.0 2
Ireland 54 7.6 51 2
Israel 39 0.4 30 9
Italy 26'499 13.0 19'304 7'195
Jordan 0 0.0
Kyrgyzstan 282 0.6 276 6
Latvia 1'337 32.2 1'207 129
Lebanon 58 0.2 54 4
Liechtenstein 3 0.0 2 1
Lithuania 1'006 7.8 898 108
Luxembourg 60 18.2 60
Malta 1 0.0 1
Mauritius 1 0.0 1
Mexico 107 0.1 107
Moldova 656 0.7 609 47
Montenegro 102 7.6 53 49
Morocco 3'759 3.8 3'568 191
Netherlands 597 3.4 518 79
North Macedonia 240 0.6 131 112
Norway 229 10.7 182 46
Oman 4 0.0
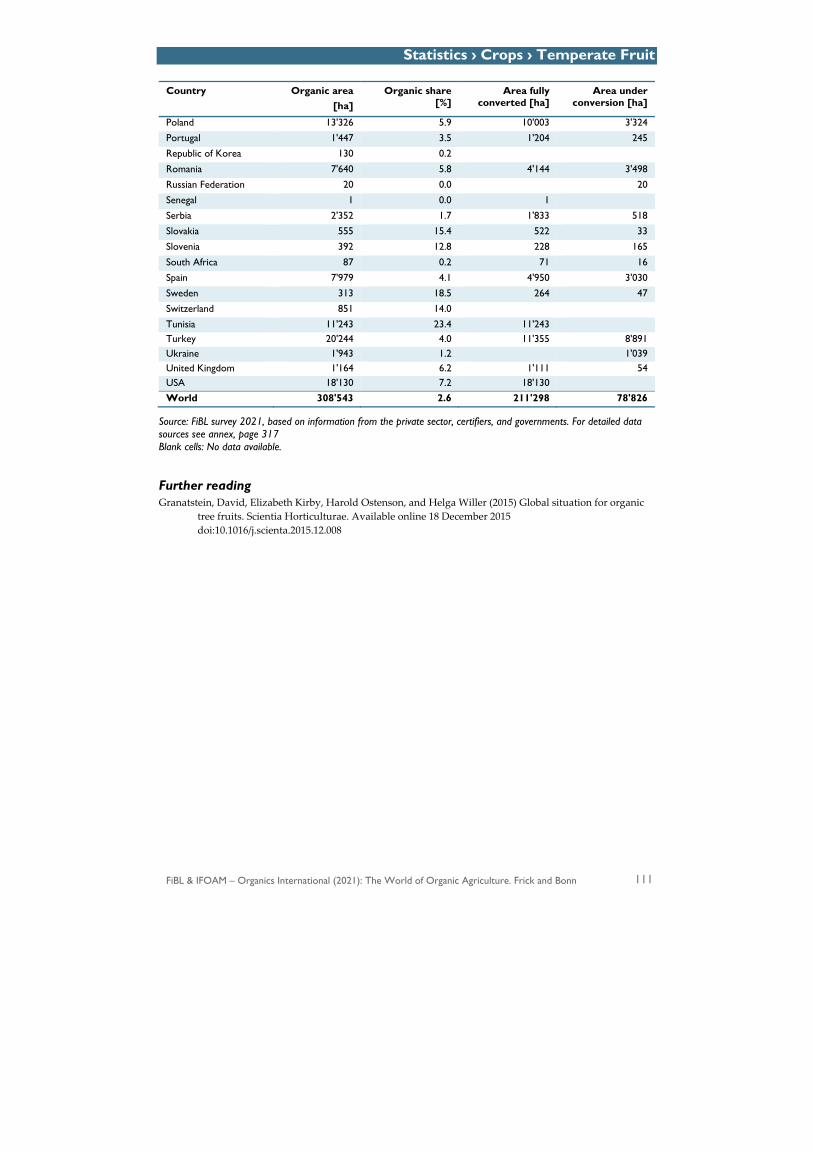
Statistics › Crops › Temperate Fruit
FiBL & IFOAM – Organics International (2021): The World of Organic Agriculture. Frick and Bonn 111
Country Organic area [ha]
Organic share [%]
Area fully converted [ha]
Area under conversion [ha]
Poland 13'326 5.9 10'003 3'324
Portugal 1'447 3.5 1'204 245
Republic of Korea 130 0.2
Romania 7'640 5.8 4'144 3'498
Russian Federation 20 0.0 20
Senegal 1 0.0 1
Serbia 2'352 1.7 1'833 518
Slovakia 555 15.4 522 33
Slovenia 392 12.8 228 165
South Africa 87 0.2 71 16
Spain 7'979 4.1 4'950 3'030
Sweden 313 18.5 264 47
Switzerland 851 14.0
Tunisia 11'243 23.4 11'243 Turkey 20'244 4.0 11'355 8'891Ukraine 1'943 1.2 1'039 United Kingdom 1'164 6.2 1'111 54 USA 18'130 7.2 18'130 World 308'543 2.6 211'298 78'826
Source: FiBL survey 2021, based on information from the private sector, certifiers, and governments. For detailed data sources see annex, page 317 Blank cells: No data available.
Further reading Granatstein, David, Elizabeth Kirby, Harold Ostenson, and Helga Willer (2015) Global situation for organic
tree fruits. Scientia Horticulturae. Available online 18 December 2015 doi:10.1016/j.scienta.2015.12.008
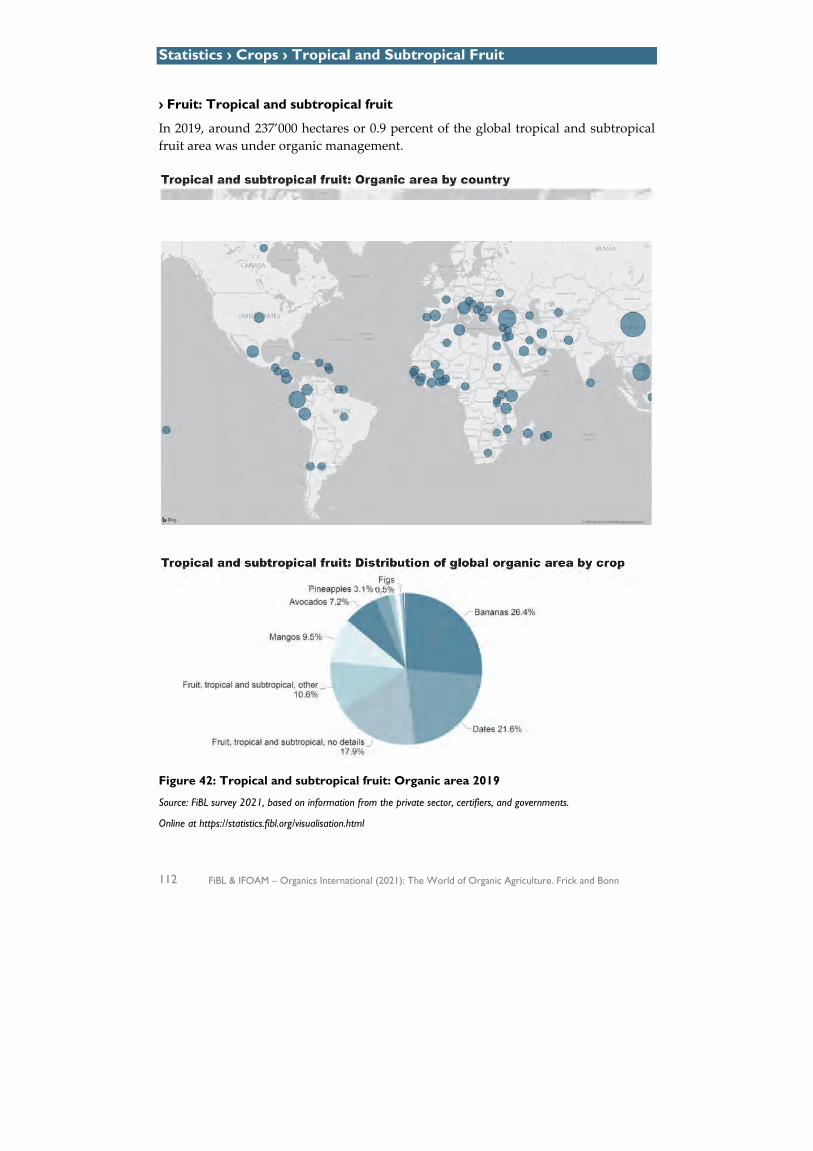
Statistics › Crops › Tropical and Subtropical Fruit
112 FiBL & IFOAM – Organics International (2021): The World of Organic Agriculture. Frick and Bonn
› Fruit: Tropical and subtropical fruit
In 2019, around 237’000 hectares or 0.9 percent of the global tropical and subtropical fruit area was under organic management.
Figure 42: Tropical and subtropical fruit: Organic area 2019
Source: FiBL survey 2021, based on information from the private sector, certifiers, and governments.
Online at https://statistics.fibl.org/visualisation.html
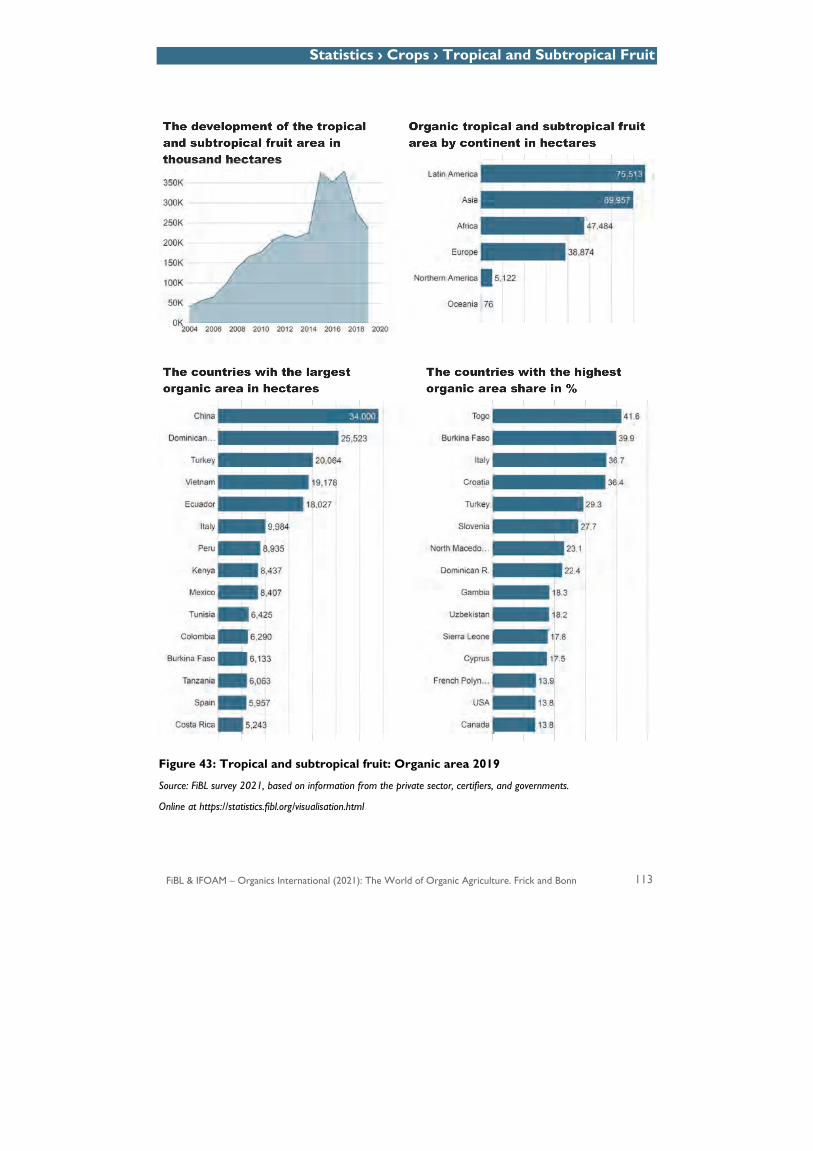
Statistics › Crops › Tropical and Subtropical Fruit
FiBL & IFOAM – Organics International (2021): The World of Organic Agriculture. Frick and Bonn 113
Figure 43: Tropical and subtropical fruit: Organic area 2019
Source: FiBL survey 2021, based on information from the private sector, certifiers, and governments.
Online at https://statistics.fibl.org/visualisation.html

Statistics › Crops › Tropical and Subtropical Fruit
114 FiBL & IFOAM – Organics International (2021): The World of Organic Agriculture. Frick and Bonn
Table 32: Tropical and subtropical fruit: Organic area by country 2019
Country Organic area [ha]
Organic share [%]
Area fully converted [ha]
Area under conversion [ha]
Algeria 564 0.3 564
Argentina 19 0.2
Azerbaijan 495 4.0 180 315
Benin 58 0.4
Brazil 180 0.0
Bulgaria 36 0.0 32 4
Burkina Faso 6'133 39.9 6'115 18
Burundi 83 0.0 83 0
Cameroon 183 0.0
Canada 1 13.8
Chile 315 0.8 315
China 34'000 1.1 11'000 23'000
Colombia 6'290 0.9 5'553 737
Cook Islands 15 13.5 15
Costa Rica 5'243 4.6 5'243
Côte d'Ivoire 2'777 0.4 2'406 371
Croatia 153 36.4 49 104
Cuba 68 0.1
Cyprus 142 17.5 75 67
Democratic Republic of the Congo
7 0.0 7
Dominican Republic 25'523 22.4 25'523
Ecuador 18'027 5.8 15'006 3'021
Egypt 542 0.2 542
El Salvador 12 0.1 12
France 284 1.5 125 158
French Guiana (France) 326 11.0 237 89
French Polynesia 61 13.9 61
Gambia 48 18.3 48
Ghana 1'034 0.3 1'034
Greece 1'182 7.6 770 413
Guadeloupe (France) 131 3.7 62 69
Guatemala 270 0.2 270
Guinea 1'000 0.4 1'000
Guinea-Bissau 98 0.5 98
Indonesia 888 0.1 888
Iran (Islamic Republic of)
4'750 1.7 4'619 131
Israel 1'021 4.1 837 184
Italy 9'984 36.7 7'625 2'359
Jordan 167 3.2
Kenya 8'437 5.2 3'272 5'165
Kuwait 10 0.3 10
Lebanon 55 1.3 28 27
Madagascar 3'303 1.5 3'303 0
Mali 1'800 2.1 1'720 80
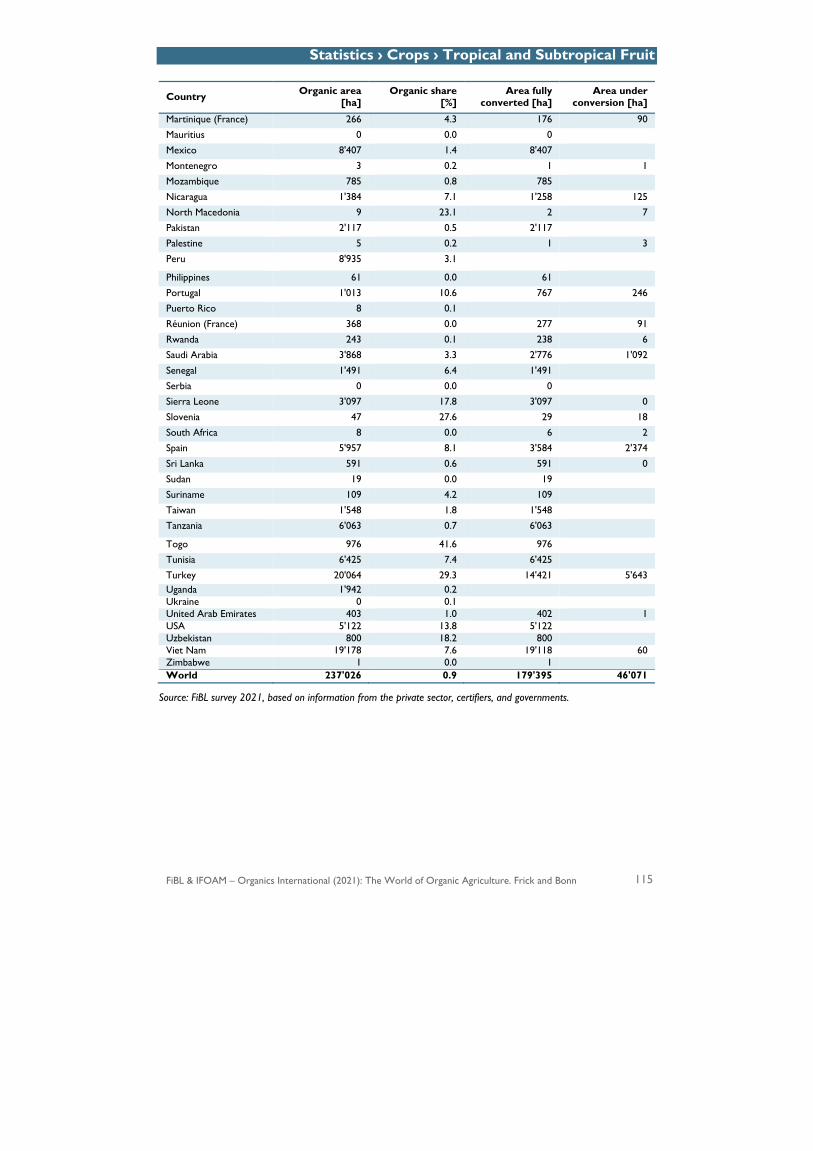
Statistics › Crops › Tropical and Subtropical Fruit
FiBL & IFOAM – Organics International (2021): The World of Organic Agriculture. Frick and Bonn 115
Country Organic area [ha]
Organic share [%]
Area fully converted [ha]
Area under conversion [ha]
Martinique (France) 266 4.3 176 90
Mauritius 0 0.0 0
Mexico 8'407 1.4 8'407
Montenegro 3 0.2 1 1
Mozambique 785 0.8 785
Nicaragua 1'384 7.1 1'258 125
North Macedonia 9 23.1 2 7
Pakistan 2'117 0.5 2'117
Palestine 5 0.2 1 3
Peru 8'935 3.1
Philippines 61 0.0 61
Portugal 1'013 10.6 767 246
Puerto Rico 8 0.1
Réunion (France) 368 0.0 277 91
Rwanda 243 0.1 238 6
Saudi Arabia 3'868 3.3 2'776 1'092
Senegal 1'491 6.4 1'491
Serbia 0 0.0 0
Sierra Leone 3'097 17.8 3'097 0
Slovenia 47 27.6 29 18
South Africa 8 0.0 6 2
Spain 5'957 8.1 3'584 2'374
Sri Lanka 591 0.6 591 0
Sudan 19 0.0 19
Suriname 109 4.2 109
Taiwan 1'548 1.8 1'548
Tanzania 6'063 0.7 6'063
Togo 976 41.6 976
Tunisia 6'425 7.4 6'425
Turkey 20'064 29.3 14'421 5'643Uganda 1'942 0.2 Ukraine 0 0.1United Arab Emirates 403 1.0 402 1 USA 5'122 13.8 5'122Uzbekistan 800 18.2 800 Viet Nam 19'178 7.6 19'118 60 Zimbabwe 1 0.0 1 World 237'026 0.9 179'395 46'071
Source: FiBL survey 2021, based on information from the private sector, certifiers, and governments.

Statistics › Crops › Grapes
116 FiBL & IFOAM – Organics International (2021): The World of Organic Agriculture. Frick and Bonn
› Grapes
In 2019, almost 468’000 hectares or 6.7% of the global grape area was under organic management.
Figure 44: Grapes: Organic area 2019
Source: FiBL survey 2021, based on information from the private sector, certifiers, and governments.
Online at https://statistics.fibl.org/visualisation.html

Statistics › Crops › Grapes
FiBL & IFOAM – Organics International (2021): The World of Organic Agriculture. Frick and Bonn 117
Figure 45: Grapes: Organic area 2019
Source: FiBL survey 2021, based on information from the private sector, certifiers, and governments.
Online at https://statistics.fibl.org/visualisation.html
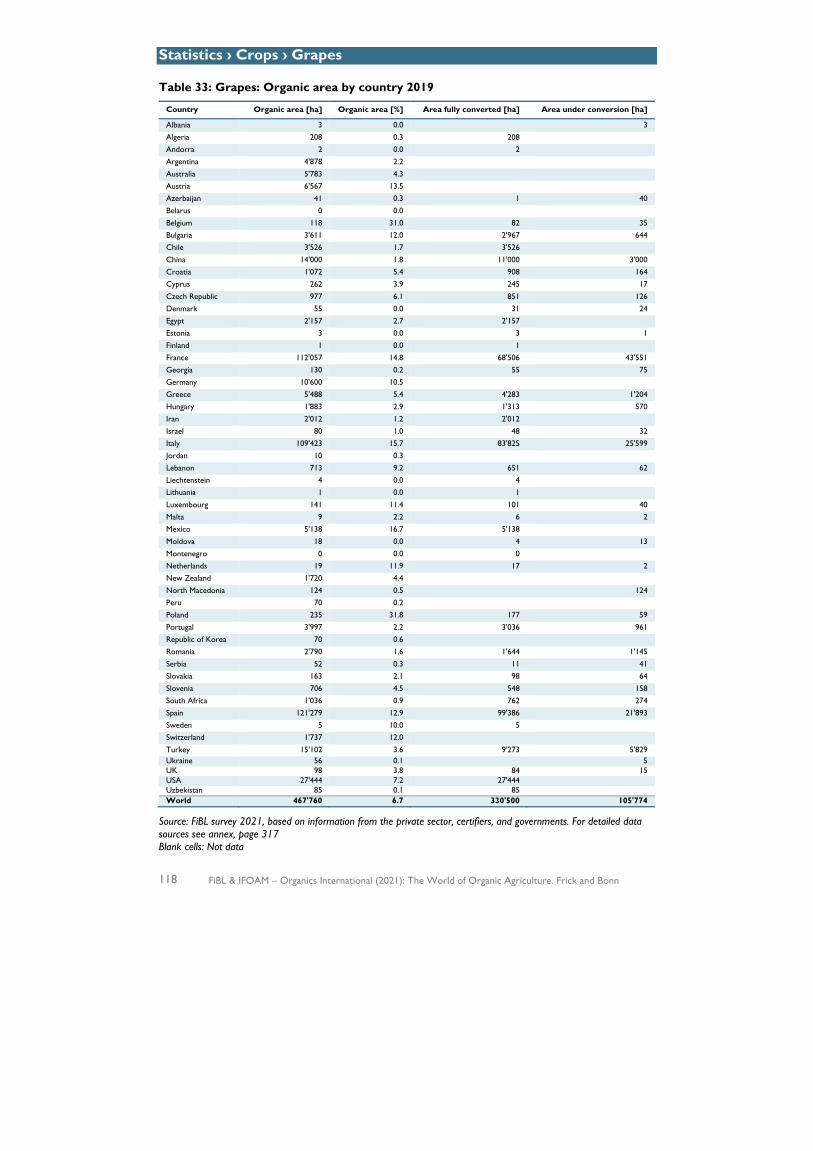
Statistics › Crops › Grapes
118 FiBL & IFOAM – Organics International (2021): The World of Organic Agriculture. Frick and Bonn
Table 33: Grapes: Organic area by country 2019
Country Organic area [ha] Organic area [%] Area fully converted [ha] Area under conversion [ha]
Albania 3 0.0 3 Algeria 208 0.3 208Andorra 2 0.0 2 Argentina 4'878 2.2Australia 5'783 4.3 Austria 6'567 13.5Azerbaijan 41 0.3 1 40 Belarus 0 0.0Belgium 118 31.0 82 35 Bulgaria 3'611 12.0 2'967 644Chile 3'526 1.7 3'526 China 14'000 1.8 11'000 3'000Croatia 1'072 5.4 908 164 Cyprus 262 3.9 245 17Czech Republic 977 6.1 851 126 Denmark 55 0.0 31 24Egypt 2'157 2.7 2'157 Estonia 3 0.0 3 1Finland 1 0.0 1 France 112'057 14.8 68'506 43'551Georgia 130 0.2 55 75 Germany 10'600 10.5Greece 5'488 5.4 4'283 1'204 Hungary 1'883 2.9 1'313 570Iran 2'012 1.2 2'012 Israel 80 1.0 48 32Italy 109'423 15.7 83'825 25'599 Jordan 10 0.3Lebanon 713 9.2 651 62 Liechtenstein 4 0.0 4Lithuania 1 0.0 1 Luxembourg 141 11.4 101 40Malta 9 2.2 6 2 Mexico 5'138 16.7 5'138Moldova 18 0.0 4 13 Montenegro 0 0.0 0Netherlands 19 11.9 17 2 New Zealand 1'720 4.4 North Macedonia 124 0.5 124 Peru 70 0.2Poland 235 31.8 177 59 Portugal 3'997 2.2 3'036 961Republic of Korea 70 0.6 Romania 2'790 1.6 1'644 1'145Serbia 52 0.3 11 41 Slovakia 163 2.1 98 64Slovenia 706 4.5 548 158 South Africa 1'036 0.9 762 274 Spain 121'279 12.9 99'386 21'893 Sweden 5 10.0 5Switzerland 1'737 12.0 Turkey 15'102 3.6 9'273 5'829Ukraine 56 0.1 5 UK 98 3.8 84 15 USA 27'444 7.2 27'444 Uzbekistan 85 0.1 85World 467'760 6.7 330'500 105'774
Source: FiBL survey 2021, based on information from the private sector, certifiers, and governments. For detailed data sources see annex, page 317 Blank cells: Not data
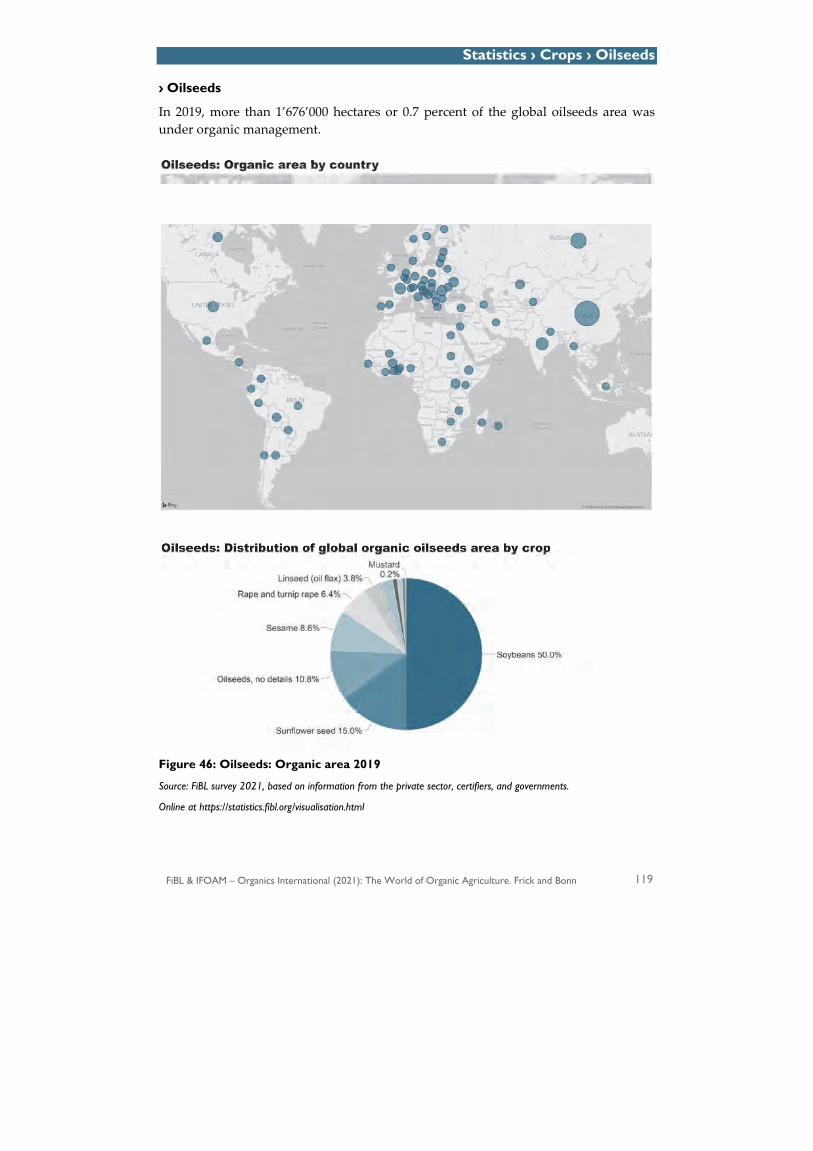
Statistics › Crops › Oilseeds
FiBL & IFOAM – Organics International (2021): The World of Organic Agriculture. Frick and Bonn 119
› Oilseeds
In 2019, more than 1’676’000 hectares or 0.7 percent of the global oilseeds area was under organic management.
Figure 46: Oilseeds: Organic area 2019
Source: FiBL survey 2021, based on information from the private sector, certifiers, and governments.
Online at https://statistics.fibl.org/visualisation.html
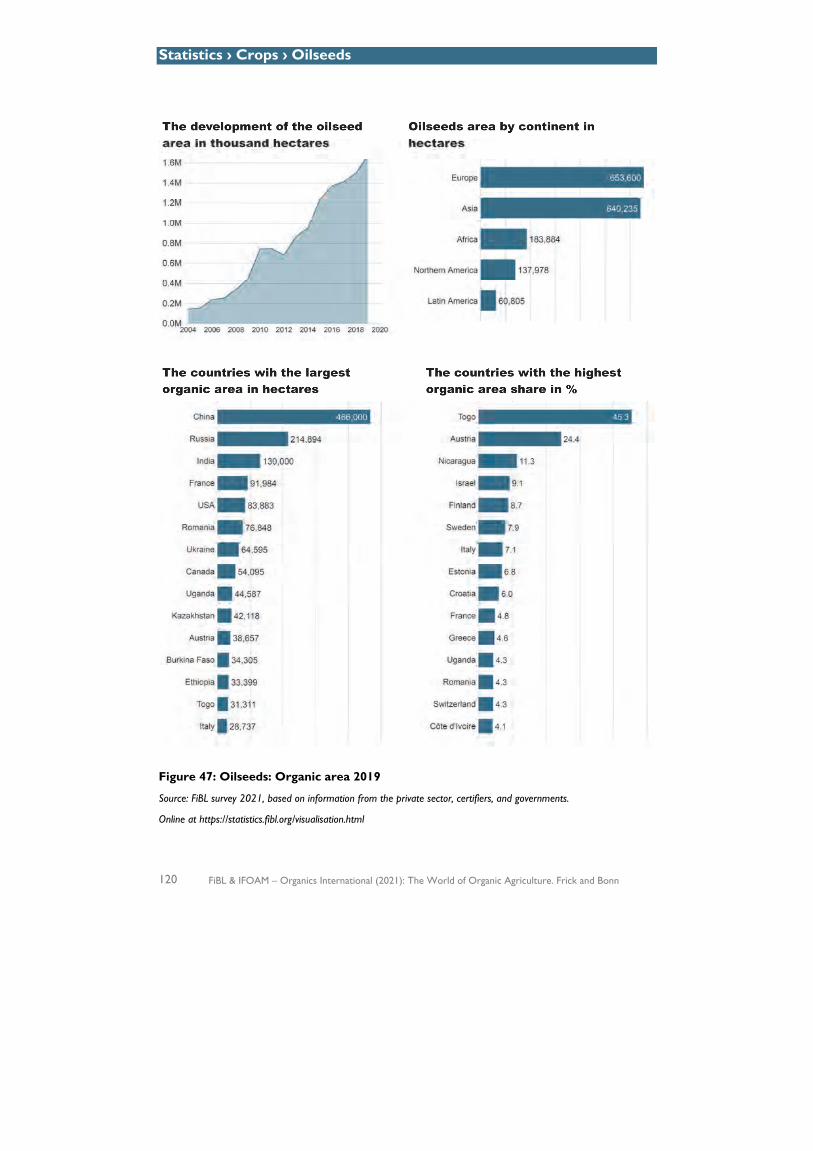
Statistics › Crops › Oilseeds
120 FiBL & IFOAM – Organics International (2021): The World of Organic Agriculture. Frick and Bonn
Figure 47: Oilseeds: Organic area 2019
Source: FiBL survey 2021, based on information from the private sector, certifiers, and governments.
Online at https://statistics.fibl.org/visualisation.html
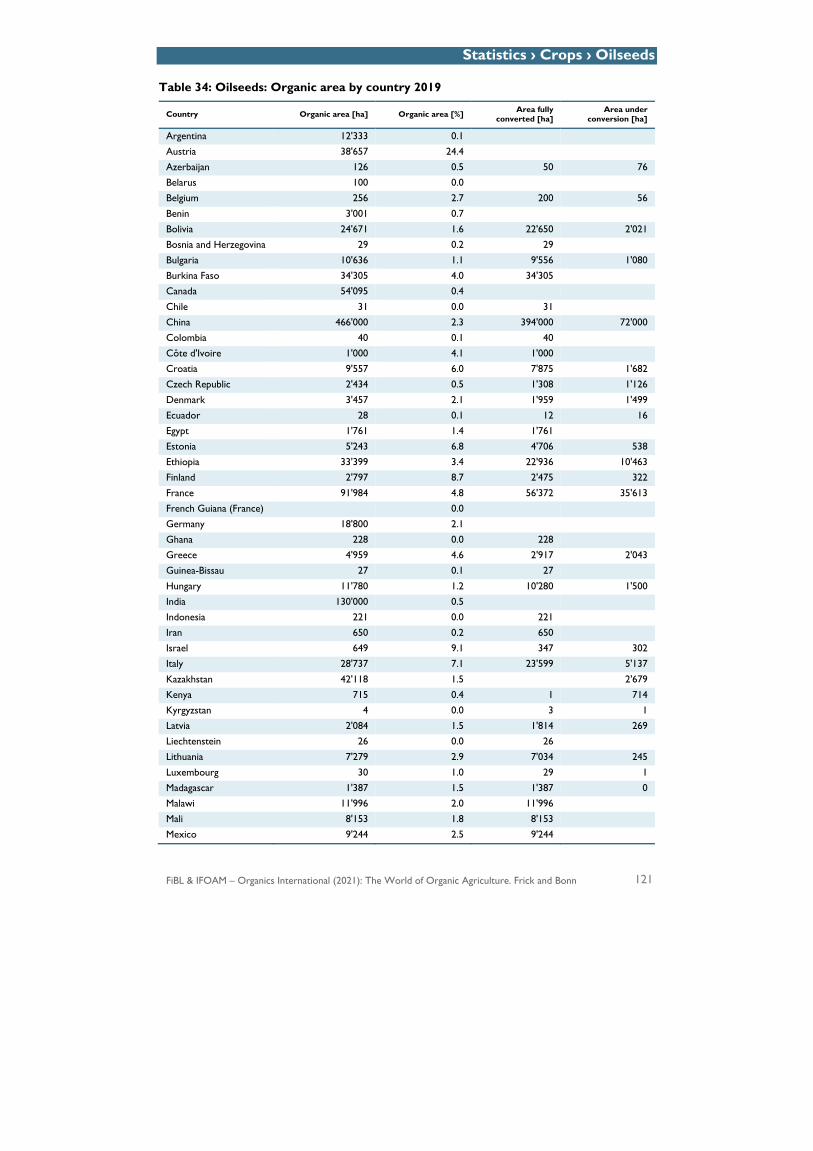
Statistics › Crops › Oilseeds
FiBL & IFOAM – Organics International (2021): The World of Organic Agriculture. Frick and Bonn 121
Table 34: Oilseeds: Organic area by country 2019
Country Organic area [ha] Organic area [%] Area fully converted [ha]
Area under conversion [ha]
Argentina 12'333 0.1
Austria 38'657 24.4
Azerbaijan 126 0.5 50 76
Belarus 100 0.0
Belgium 256 2.7 200 56
Benin 3'001 0.7
Bolivia 24'671 1.6 22'650 2'021
Bosnia and Herzegovina 29 0.2 29
Bulgaria 10'636 1.1 9'556 1'080
Burkina Faso 34'305 4.0 34'305
Canada 54'095 0.4
Chile 31 0.0 31
China 466'000 2.3 394'000 72'000
Colombia 40 0.1 40
Côte d'Ivoire 1'000 4.1 1'000
Croatia 9'557 6.0 7'875 1'682
Czech Republic 2'434 0.5 1'308 1'126
Denmark 3'457 2.1 1'959 1'499
Ecuador 28 0.1 12 16
Egypt 1'761 1.4 1'761
Estonia 5'243 6.8 4'706 538
Ethiopia 33'399 3.4 22'936 10'463
Finland 2'797 8.7 2'475 322
France 91'984 4.8 56'372 35'613
French Guiana (France) 0.0
Germany 18'800 2.1
Ghana 228 0.0 228
Greece 4'959 4.6 2'917 2'043
Guinea-Bissau 27 0.1 27
Hungary 11'780 1.2 10'280 1'500
India 130'000 0.5
Indonesia 221 0.0 221
Iran 650 0.2 650
Israel 649 9.1 347 302
Italy 28'737 7.1 23'599 5'137
Kazakhstan 42'118 1.5 2'679
Kenya 715 0.4 1 714
Kyrgyzstan 4 0.0 3 1
Latvia 2'084 1.5 1'814 269
Liechtenstein 26 0.0 26
Lithuania 7'279 2.9 7'034 245
Luxembourg 30 1.0 29 1
Madagascar 1'387 1.5 1'387 0
Malawi 11'996 2.0 11'996
Mali 8'153 1.8 8'153
Mexico 9'244 2.5 9'244

Statistics › Crops › Oilseeds
122 FiBL & IFOAM – Organics International (2021): The World of Organic Agriculture. Frick and Bonn
Country Organic area [ha] Organic area [%] Area fully converted [ha]
Area under conversion [ha]
Moldova 9'192 2.1 6'818 2'374
Myanmar 345 0.0 345
Nepal 122 0.0 122
Netherlands 69 1.9 61 8
Nicaragua 6'389 11.3 4'639 1'750
Nigeria 4'581 0.1 4'581
North Macedonia 23 0.5 16 7
Norway 72 2.2 52 20
Paraguay 7'783 0.2 7'783
Peru 183 3.1
Poland 4'292 0.5 1'551 2'741
Portugal 29 0.4 22 7
Réunion (France) 4 0.0 3 1
Romania 76'848 4.3 54'519 22'329
Russian Federation 214'894 1.6 179
Serbia 2'172 0.4 2'091 82
Slovakia 5'733 2.2 2'766 2'968
Slovenia 318 3.7 265 52
South Africa 219 0.0 209 10
Spain 10'544 1.3 8'353 2'192
Sudan 7'209 0.1 7'209
Sweden 8'441 7.8 7'892 548
Switzerland 1'225 4.3
Togo 31'311 45.3 30'410 901
Turkey 16'201 1.7 8'550 7'6511
Turkmenistan 0.0
Uganda 44'587 4.3
Ukraine 64'595 0.7 5'143
United Kingdom 107 0.0 16 91
USA 83'883 0.2 83'883
Zimbabwe 3 0.0 3
World 1'676'502 0.7 871'255 188'558
Source: FiBL survey 2021 based on information from the private sector, certifiers, and governments. For detailed data sources see annex, page 317. Blank cells: no data.
For more information on soybean production (organic and other Voluntary Sustainability Standards - VSS), please see the report “The State of Sustainable Markets – Statistics and Emerging Trends 2020.”2
2 Meier, C., Sampson, G., Larrea, C., Schlatter, B., Voora, V., Dang, D., Bermudez, S., Wozniak, J., and Willer, H. (2020). The State of Sustainable Markets 2020: Statistics and Emerging Trends. ITC, Geneva. Available at: https://vss.fibl.org/. For interactive online graphics see the Sustainability Map at https://www.sustainabilitymap.org/trends

Statistics › Crops › Olives
FiBL & IFOAM – Organics International (2021): The World of Organic Agriculture. Frick and Bonn 123
› Olives
In 2019, over 881’000 hectares or 8.4 percent of the global olive area was under organic management.
Figure 48: Olives: Organic area 2019
Source: FiBL survey 2021, based on information from the private sector, certifiers, and governments.
Online at https://statistics.fibl.org/visualisation.html
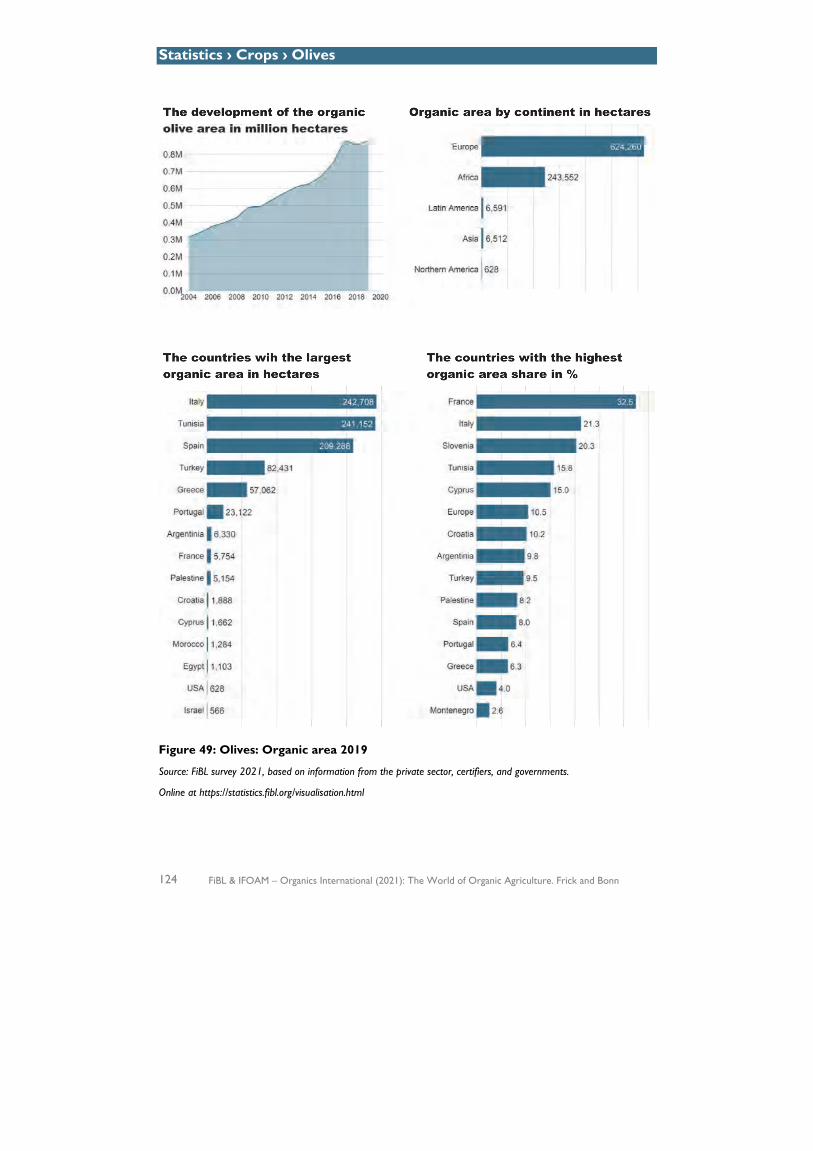
Statistics › Crops › Olives
124 FiBL & IFOAM – Organics International (2021): The World of Organic Agriculture. Frick and Bonn
Figure 49: Olives: Organic area 2019
Source: FiBL survey 2021, based on information from the private sector, certifiers, and governments.
Online at https://statistics.fibl.org/visualisation.html
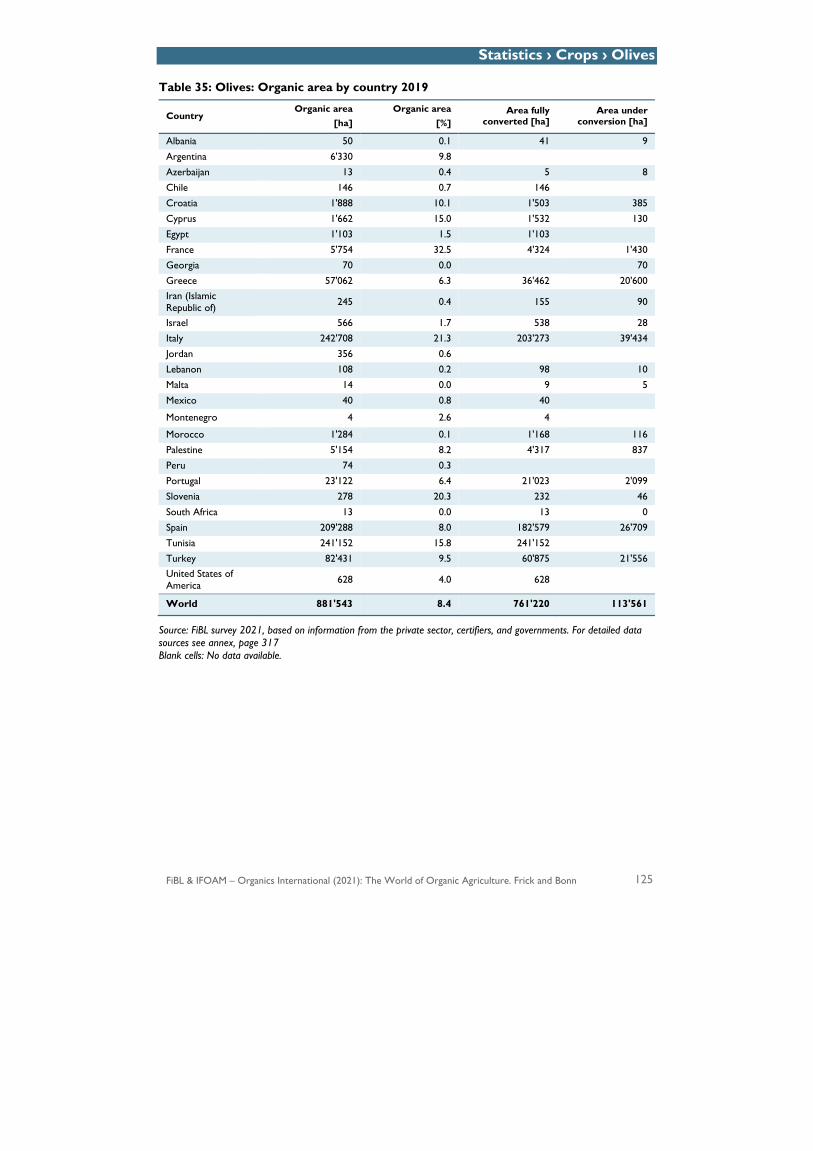
Statistics › Crops › Olives
FiBL & IFOAM – Organics International (2021): The World of Organic Agriculture. Frick and Bonn 125
Table 35: Olives: Organic area by country 2019
Country Organic area
[ha] Organic area
[%] Area fully
converted [ha] Area under
conversion [ha]
Albania 50 0.1 41 9
Argentina 6'330 9.8
Azerbaijan 13 0.4 5 8
Chile 146 0.7 146
Croatia 1'888 10.1 1'503 385
Cyprus 1'662 15.0 1'532 130
Egypt 1'103 1.5 1'103
France 5'754 32.5 4'324 1'430
Georgia 70 0.0 70
Greece 57'062 6.3 36'462 20'600Iran (Islamic Republic of) 245 0.4 155 90
Israel 566 1.7 538 28
Italy 242'708 21.3 203'273 39'434
Jordan 356 0.6
Lebanon 108 0.2 98 10
Malta 14 0.0 9 5
Mexico 40 0.8 40
Montenegro 4 2.6 4
Morocco 1'284 0.1 1'168 116
Palestine 5'154 8.2 4'317 837
Peru 74 0.3
Portugal 23'122 6.4 21'023 2'099
Slovenia 278 20.3 232 46
South Africa 13 0.0 13 0
Spain 209'288 8.0 182'579 26'709
Tunisia 241'152 15.8 241'152
Turkey 82'431 9.5 60'875 21'556United States of America 628 4.0 628
World 881'543 8.4 761'220 113'561
Source: FiBL survey 2021, based on information from the private sector, certifiers, and governments. For detailed data sources see annex, page 317 Blank cells: No data available.
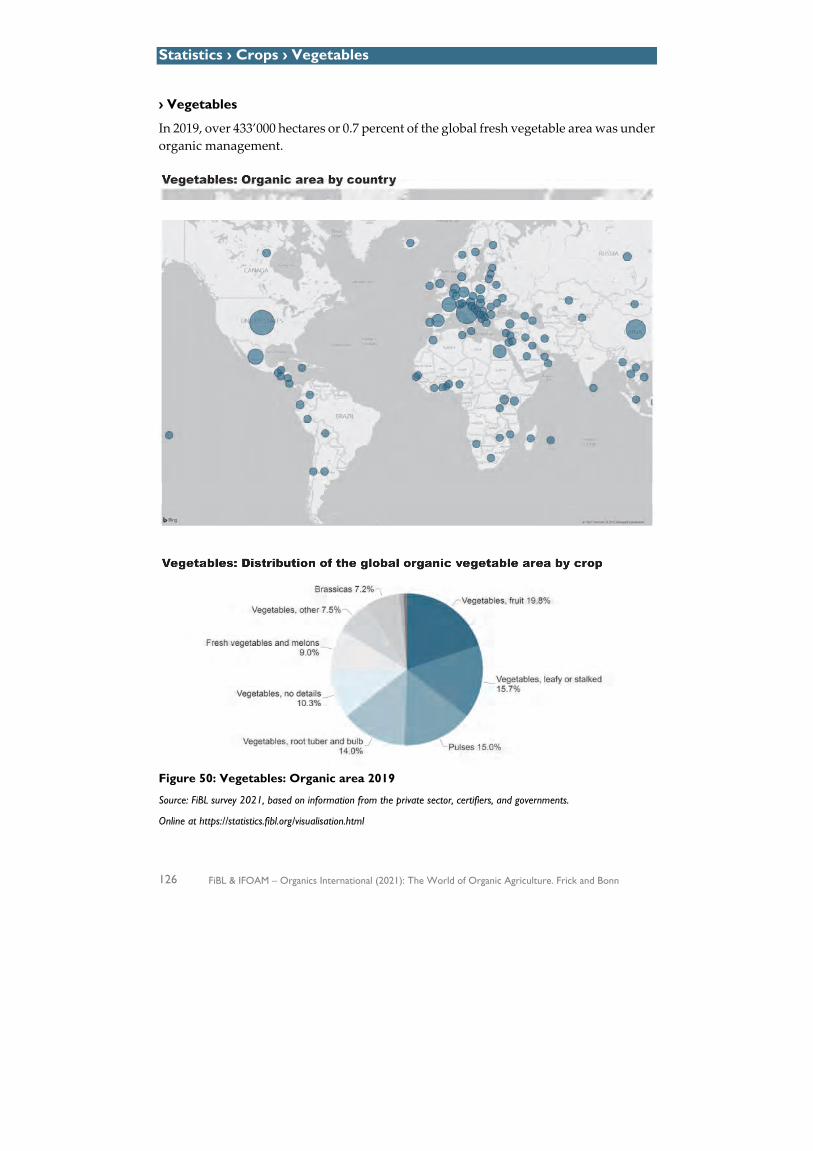
Statistics › Crops › Vegetables
126 FiBL & IFOAM – Organics International (2021): The World of Organic Agriculture. Frick and Bonn
› Vegetables
In 2019, over 433’000 hectares or 0.7 percent of the global fresh vegetable area was under organic management.
Figure 50: Vegetables: Organic area 2019
Source: FiBL survey 2021, based on information from the private sector, certifiers, and governments.
Online at https://statistics.fibl.org/visualisation.html
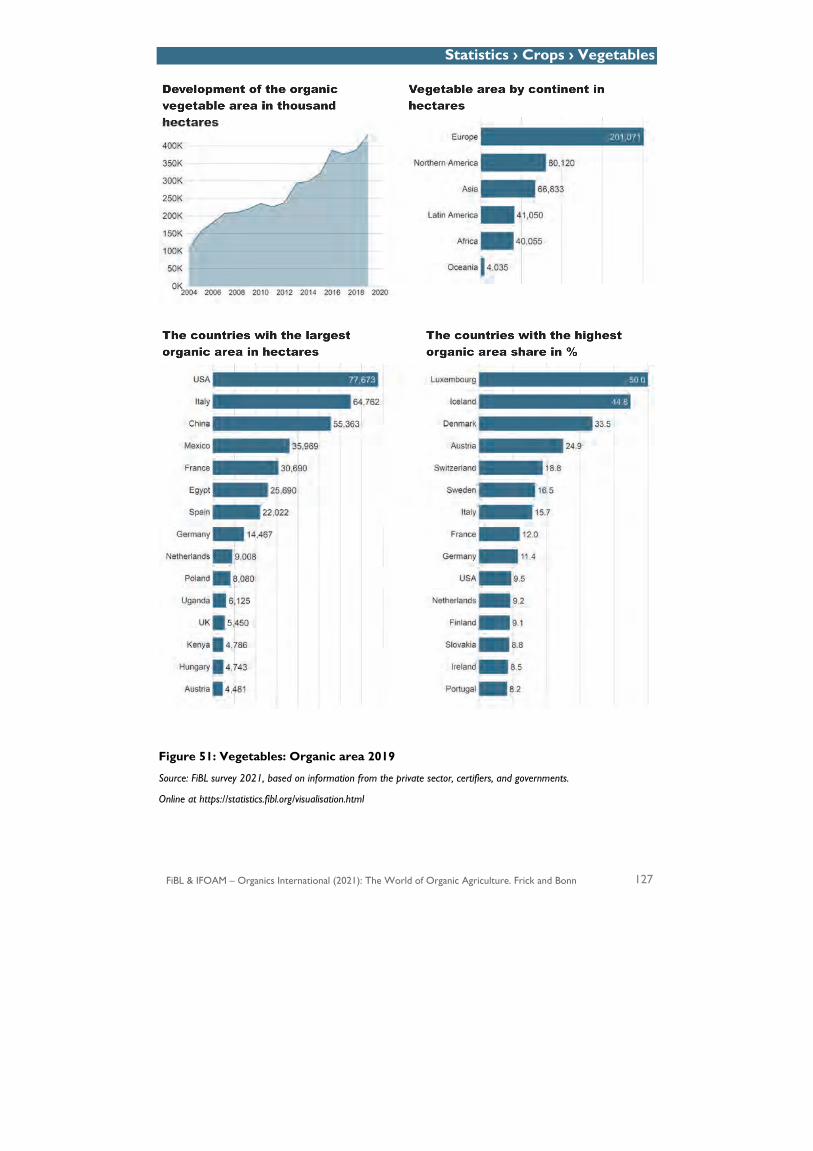
Statistics › Crops › Vegetables
FiBL & IFOAM – Organics International (2021): The World of Organic Agriculture. Frick and Bonn 127
Figure 51: Vegetables: Organic area 2019
Source: FiBL survey 2021, based on information from the private sector, certifiers, and governments.
Online at https://statistics.fibl.org/visualisation.html
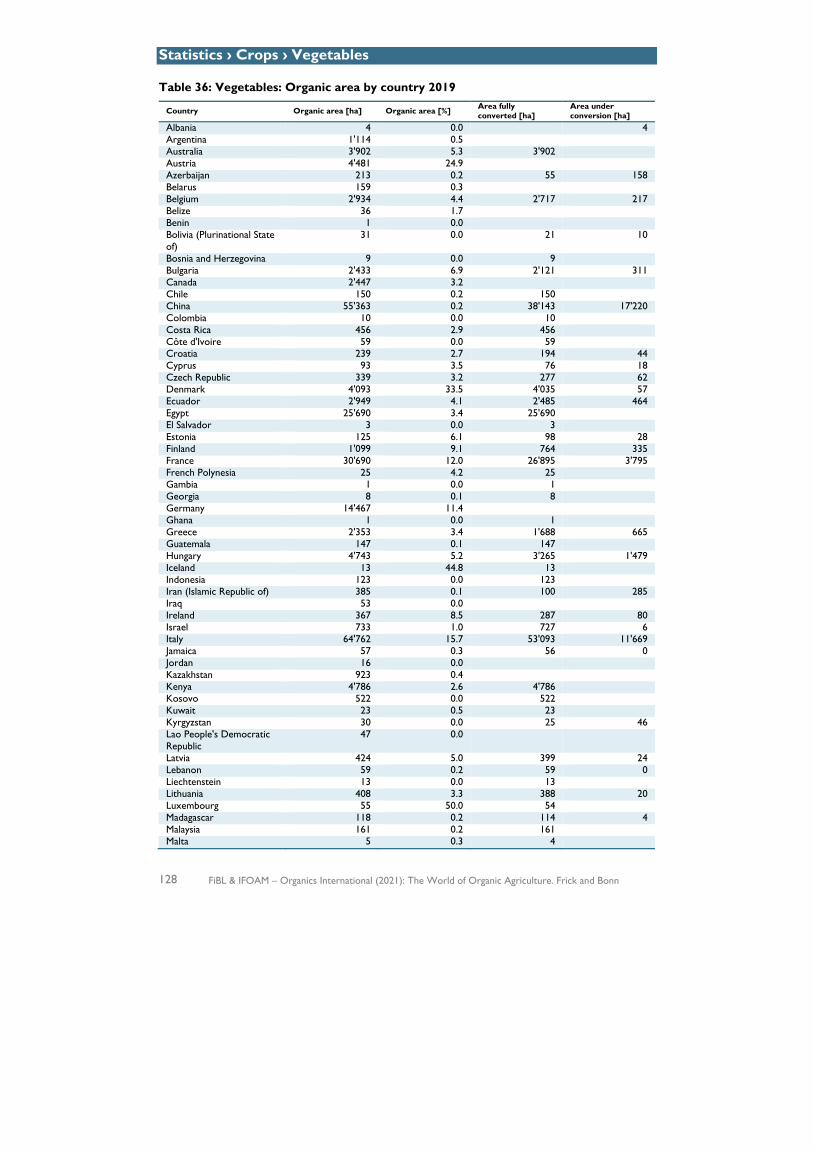
Statistics › Crops › Vegetables
128 FiBL & IFOAM – Organics International (2021): The World of Organic Agriculture. Frick and Bonn
Table 36: Vegetables: Organic area by country 2019
Country Organic area [ha] Organic area [%] Area fully converted [ha]
Area under conversion [ha]
Albania 4 0.0 4 Argentina 1'114 0.5 Australia 3'902 5.3 3'902 Austria 4'481 24.9 Azerbaijan 213 0.2 55 158 Belarus 159 0.3 Belgium 2'934 4.4 2'717 217 Belize 36 1.7 Benin 1 0.0 Bolivia (Plurinational State of)
31 0.0 21 10
Bosnia and Herzegovina 9 0.0 9 Bulgaria 2'433 6.9 2'121 311 Canada 2'447 3.2 Chile 150 0.2 150 China 55'363 0.2 38'143 17'220 Colombia 10 0.0 10 Costa Rica 456 2.9 456 Côte d'Ivoire 59 0.0 59 Croatia 239 2.7 194 44 Cyprus 93 3.5 76 18 Czech Republic 339 3.2 277 62 Denmark 4'093 33.5 4'035 57 Ecuador 2'949 4.1 2'485 464 Egypt 25'690 3.4 25'690 El Salvador 3 0.0 3 Estonia 125 6.1 98 28 Finland 1'099 9.1 764 335 France 30'690 12.0 26'895 3'795 French Polynesia 25 4.2 25 Gambia 1 0.0 1 Georgia 8 0.1 8 Germany 14'467 11.4 Ghana 1 0.0 1 Greece 2'353 3.4 1'688 665 Guatemala 147 0.1 147 Hungary 4'743 5.2 3'265 1'479 Iceland 13 44.8 13 Indonesia 123 0.0 123 Iran (Islamic Republic of) 385 0.1 100 285 Iraq 53 0.0 Ireland 367 8.5 287 80 Israel 733 1.0 727 6 Italy 64'762 15.7 53'093 11'669 Jamaica 57 0.3 56 0 Jordan 16 0.0 Kazakhstan 923 0.4 Kenya 4'786 2.6 4'786 Kosovo 522 0.0 522 Kuwait 23 0.5 23 Kyrgyzstan 30 0.0 25 46 Lao People's Democratic Republic
47 0.0
Latvia 424 5.0 399 24 Lebanon 59 0.2 59 0 Liechtenstein 13 0.0 13 Lithuania 408 3.3 388 20 Luxembourg 55 50.0 54 Madagascar 118 0.2 114 4 Malaysia 161 0.2 161 Malta 5 0.3 4
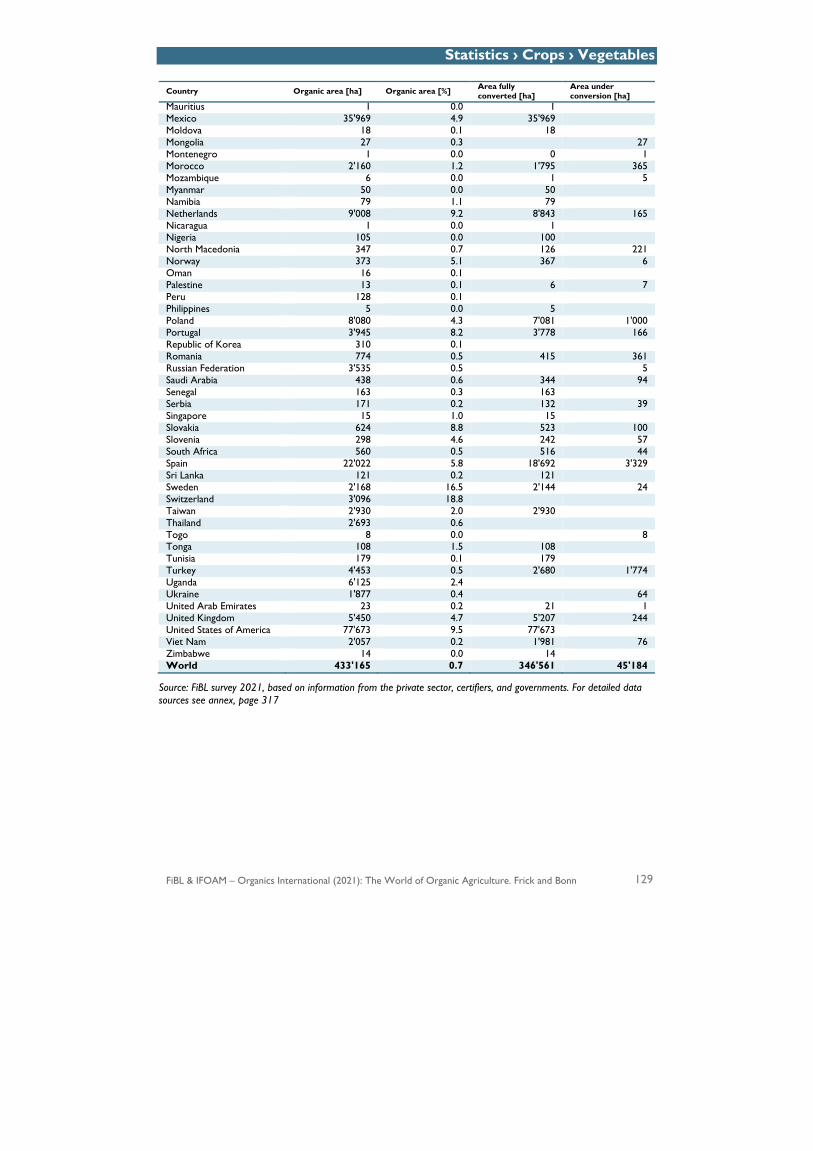
Statistics › Crops › Vegetables
FiBL & IFOAM – Organics International (2021): The World of Organic Agriculture. Frick and Bonn 129
Country Organic area [ha] Organic area [%] Area fully converted [ha]
Area under conversion [ha]
Mauritius 1 0.0 1 Mexico 35'969 4.9 35'969 Moldova 18 0.1 18 Mongolia 27 0.3 27 Montenegro 1 0.0 0 1 Morocco 2'160 1.2 1'795 365 Mozambique 6 0.0 1 5 Myanmar 50 0.0 50 Namibia 79 1.1 79 Netherlands 9'008 9.2 8'843 165 Nicaragua 1 0.0 1 Nigeria 105 0.0 100 North Macedonia 347 0.7 126 221 Norway 373 5.1 367 6 Oman 16 0.1 Palestine 13 0.1 6 7 Peru 128 0.1 Philippines 5 0.0 5 Poland 8'080 4.3 7'081 1'000 Portugal 3'945 8.2 3'778 166 Republic of Korea 310 0.1 Romania 774 0.5 415 361 Russian Federation 3'535 0.5 5 Saudi Arabia 438 0.6 344 94 Senegal 163 0.3 163 Serbia 171 0.2 132 39 Singapore 15 1.0 15 Slovakia 624 8.8 523 100 Slovenia 298 4.6 242 57 South Africa 560 0.5 516 44 Spain 22'022 5.8 18'692 3'329 Sri Lanka 121 0.2 121 Sweden 2'168 16.5 2'144 24 Switzerland 3'096 18.8 Taiwan 2'930 2.0 2'930 Thailand 2'693 0.6 Togo 8 0.0 8 Tonga 108 1.5 108 Tunisia 179 0.1 179 Turkey 4'453 0.5 2'680 1'774 Uganda 6'125 2.4 Ukraine 1'877 0.4 64 United Arab Emirates 23 0.2 21 1 United Kingdom 5'450 4.7 5'207 244 United States of America 77'673 9.5 77'673 Viet Nam 2'057 0.2 1'981 76 Zimbabwe 14 0.0 14World 433'165 0.7 346'561 45'184
Source: FiBL survey 2021, based on information from the private sector, certifiers, and governments. For detailed data sources see annex, page 317
Organic Cotton
130 FiBL & IFOAM – Organics International (2021): The World of Organic Agriculture. Frick and Bonn
Organic Cotton1
LISA BARSLEY,2 EVONNE TAN,3 SUET YIN,4 AMISH GOSAI5 AND LIESL TRUSCOTT6
Global Trends
The significant growth in organic cotton production seen in 2017/18, when global fibre volumes rose 56 percent, continued into 2018/19 with a further 31 percent growth. Global production reached 239´787 metric tons (MT), which is just shy of the largest ever organic cotton harvest, seen in 2009/10, just before the financial crash that prompted a dramatic decline. Estimates show that the current growth trend will continue next year, though to a slightly lesser degree, with growth expected to be around ten percent.
Globally, an estimated 222’134 farmers were growing certified organic cotton in 2018/19, spread across 19 countries and 418’935 hectares of certified land. Although the number of countries growing organic cotton remained the same, the list changed slightly, with Senegal temporarily dropping out of certification, and Pakistan joining the line up with its first harvest of certified production in 2018/19.
The top seven countries producing organic cotton remained the same, although Tanzania jumped marginally ahead of the US as the sixth biggest producer. Ranked by production, the top seven producing countries were: India (51 percent), China (17 percent), Kyrgyzstan (ten percent), Turkey (ten percent), Tajikistan (five percent), Tanzania (two percent), and the US (two percent). These seven countries continue to account for the vast majority (97 percent) of global organic cotton.
India was by far the biggest contributor to the global growth seen in 2018/19, adding 37’138 MT to the worldwide total. Turkey was also a significant contributor, followed by Tajikistan, China and Uganda. India and Pakistan had the most land in conversion to organic in 2018/19, with 23’251 ha and 17’632 ha, respectively, followed by Turkey, Greece, and Tajikistan.
1 This article is a condensed version of the 2019 Organic Cotton Market Report produced by Lisa Barsley, Evonne Tan, Liesl Truscott, and Amish Gosai, with production data collected by the following Textile Exchange Regional Ambassadors: Atila Ertem (Turkey and Central Asia), Amish Gosai (India), Sandra Marquardt (United States), Silvio Moraes (Latin America), Leonard Mtama (East Africa), Silvère Tovignan (West Africa), and Lazare Yombi (West Africa). The full 2020 Organic Cotton Market Report is available here: https://store.textileexchange.org/product/2020-organic-cotton-market-report/ More information about Textile Exchange is available here: https://textileexchange.org/ More information about organic cotton is available on www.aboutorganiccotton.org 2 Lisa Barsley, Materials Program Manager, Textile Exchange, UK 3 Evonne Tan, Data Management & China Strategy Director, Textile Exchange, Malaysia 4 Suet Yin Siew, Senior Data Analyst & Statistician, Textile Exchange, Malaysia 5 Amish Gosai, South Asia Manager, Textile Exchange, India 6 Liesl Truscott, European and Materials Strategy Director, Textile Exchange, UK
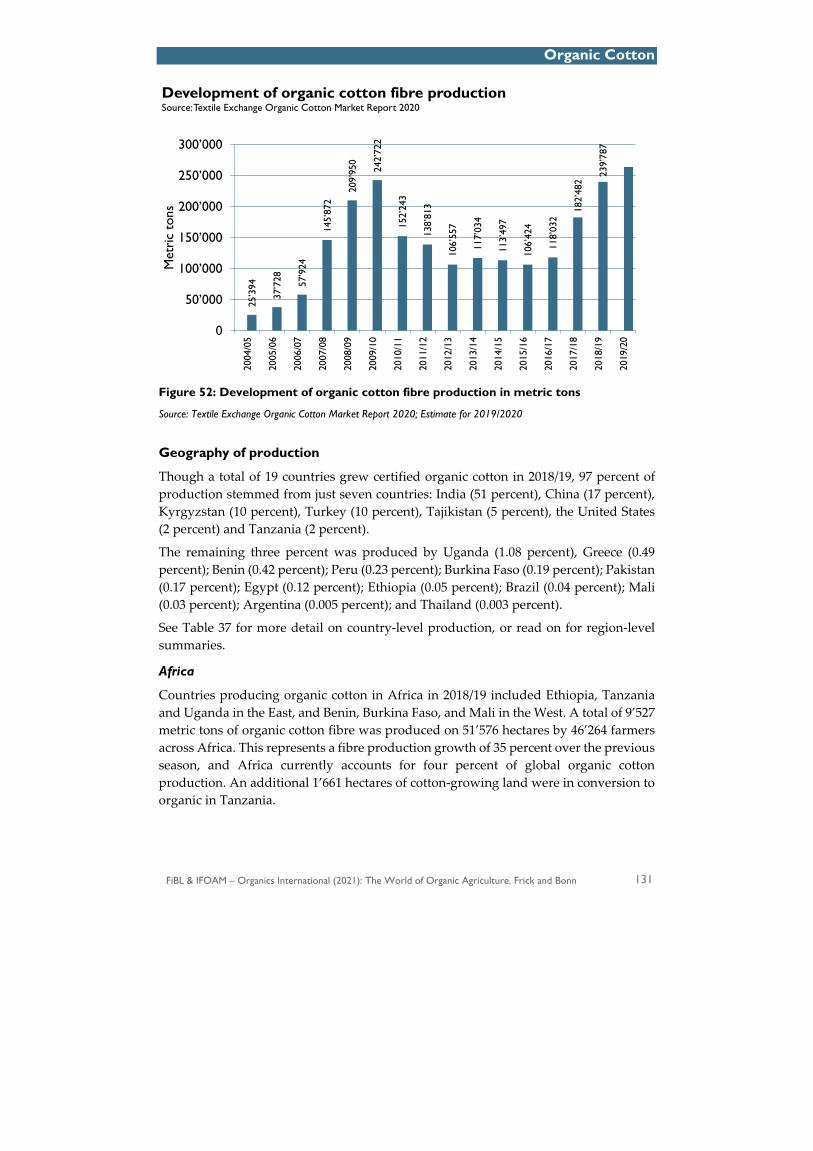
Organic Cotton
FiBL & IFOAM – Organics International (2021): The World of Organic Agriculture. Frick and Bonn 131
Figure 52: Development of organic cotton fibre production in metric tons
Source: Textile Exchange Organic Cotton Market Report 2020; Estimate for 2019/2020
Geography of production
Though a total of 19 countries grew certified organic cotton in 2018/19, 97 percent of production stemmed from just seven countries: India (51 percent), China (17 percent), Kyrgyzstan (10 percent), Turkey (10 percent), Tajikistan (5 percent), the United States (2 percent) and Tanzania (2 percent).
The remaining three percent was produced by Uganda (1.08 percent), Greece (0.49 percent); Benin (0.42 percent); Peru (0.23 percent); Burkina Faso (0.19 percent); Pakistan (0.17 percent); Egypt (0.12 percent); Ethiopia (0.05 percent); Brazil (0.04 percent); Mali (0.03 percent); Argentina (0.005 percent); and Thailand (0.003 percent).
See Table 37 for more detail on country-level production, or read on for region-level summaries.
Africa
Countries producing organic cotton in Africa in 2018/19 included Ethiopia, Tanzania and Uganda in the East, and Benin, Burkina Faso, and Mali in the West. A total of 9’527 metric tons of organic cotton fibre was produced on 51’576 hectares by 46’264 farmers across Africa. This represents a fibre production growth of 35 percent over the previous season, and Africa currently accounts for four percent of global organic cotton production. An additional 1’661 hectares of cotton-growing land were in conversion to organic in Tanzania.
25’3
94
37’7
28
57’9
24
145’
872
209’
950
242’
722
152’
243
138’
813
106’
557
117’
034
113’
497
106’
424
118’
032
182’
482
239’
787
0
50’000
100’000
150’000
200’000
250’000
300’000
2004
/05
2005
/06
2006
/07
2007
/08
2008
/09
2009
/10
2010
/11
2011
/12
2012
/13
2013
/14
2014
/15
2015
/16
2016
/17
2017
/18
2018
/19
2019
/20
Met
ric
tons
Development of organic cotton fibre production Source: Textile Exchange Organic Cotton Market Report 2020

Org
anic
Cot
ton
132
FiBL
& IF
OA
M –
Org
anic
s In
tern
atio
nal (
2021
): T
he W
orld
of O
rgan
ic A
gric
ultu
re. F
rick
and
Bon
n
Tab
le 3
7: O
rgan
ic c
otto
n fa
rmer
s, a
rea
and
prod
ucti
on 2
018/
2019
1, 2
Reg
ion
Cou
ntry
N
o. o
f fa
rmer
s
Cer
tifie
d or
gani
c la
nd
area
[ha
]*
Org
anic
see
d co
tton
[M
T]
Org
anic
co
tton
fibr
e [M
T]
Shar
e of
gl
obal
org
anic
fib
re p
rod.
[%
]
Tot
al in
-co
nver
sion
la
nd a
rea
[ha]
Afr
ica
Beni
n 4’
402
3
’879
2
’473
9
98
0.4
2 -
Burk
ina
Faso
7
’027
2
’726
1
’098
4
53
0.1
9 -
Ethi
opia
2
00
174
3
64
130
0
.05
-
Mal
i 3
’506
7
’900
2
28
84
0.0
3 -
Sene
gal
-
-
-
-
-
-
Tan
zani
a 1
0’72
9 2
6’60
8 1
3’14
4
5’2
81
2.2
0
1’6
61
Uga
nda
20’
400
10’
290
6’4
01
2’5
81
1.0
8 -
Afr
ica
Tot
al
46’
264
51’
576
23’
709
9’5
27
3.9
7 1
’661
Chi
na
1’2
79
19’
464
108
’808
4
1’24
7 1
7.20
7
10
Mid
dle
Eas
t &
Cen
tral
Asi
a Eg
ypt
18
219
7
76
287
0
.12
-
Gre
ece
-1’
460
3’5
40
1’1
68
0.4
9 2
’592
Kyr
gyzs
tan
220
12
’852
59’
093
23’
637
9.8
6 1
03
Taj
ikis
tan
955
8
’114
3
0’44
6 1
2’17
8 5
.08
2’2
26
1 Ple
ase
note
that
the
land
are
a fig
ures
repo
rted
by
Text
ile E
xcha
nge
refe
r to
tota
l lan
d ar
ea c
ertif
ied
to a
n or
gani
c st
anda
rd b
y a
prod
ucer
gro
up g
row
ing
orga
nic
cotto
n. T
he
sam
e pi
ece
of la
nd c
ould
be,
and
incr
easi
ngly
is b
eing
, use
d to
gro
w o
ther
org
anic
cro
ps in
add
ition
to c
otto
n as
par
t of a
rota
tion
syst
em; a
fund
amen
tal e
lem
ent o
f org
anic
ag
ricu
lture
. Thi
s m
eans
that
repo
rted
land
are
a fig
ures
do
not n
eces
sari
ly re
flect
the
land
are
a us
ed to
gro
w o
nly
orga
nic
cotto
n an
d, a
s a
resu
lt, m
ay s
eem
dis
prop
ortio
nate
ly
high
com
pare
d to
the
orga
nic
cotto
n vo
lum
es h
arve
sted
. 2 P
leas
e al
so n
ote
that
som
e or
gani
c co
tton
farm
ers a
re in
volv
ed in
gro
up c
ertif
icat
ion
unde
r IC
S (I
nter
nal c
ontr
ol s
yste
m),
so n
ot a
ll la
nd li
sted
is n
eces
sari
ly a
lloca
ted
to o
rgan
ic
cotto
n, o
r not
all
farm
ers
liste
d ar
e ne
cess
arily
und
er o
rgan
ic c
otto
n cu
ltiva
tion.
The
figu
res
mig
ht a
lso
incl
ude
land
/farm
ers
in-c
onve
rsio
n to
org
anic
.
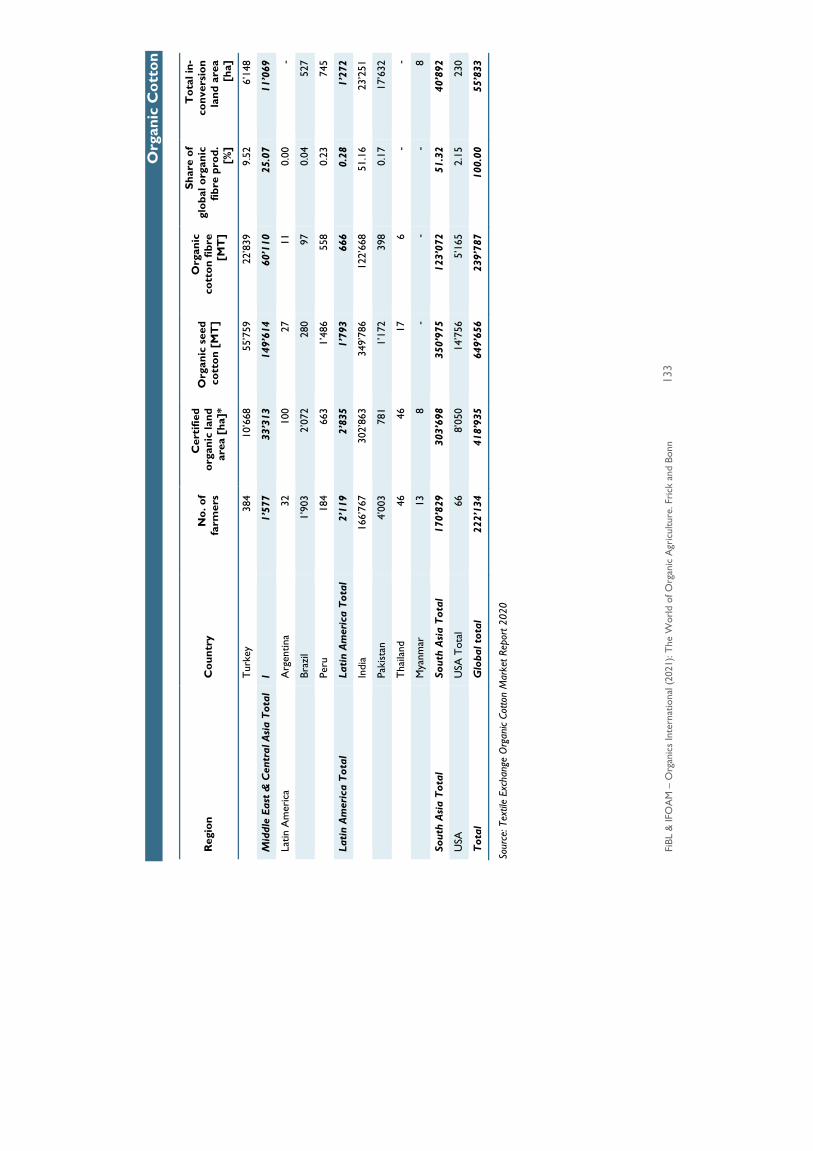
Org
anic
Cot
ton
FiBL
& IF
OA
M –
Org
anic
s In
tern
atio
nal (
2021
): T
he W
orld
of O
rgan
ic A
gric
ultu
re. F
rick
and
Bon
n13
3
Reg
ion
Cou
ntry
N
o. o
f fa
rmer
s
Cer
tifie
d or
gani
c la
nd
area
[ha
]*
Org
anic
see
d co
tton
[M
T]
Org
anic
co
tton
fibr
e [M
T]
Shar
e of
gl
obal
org
anic
fib
re p
rod.
[%
]
Tot
al in
-co
nver
sion
la
nd a
rea
[ha]
Tur
key
384
1
0’66
8 5
5’75
9 2
2’83
9 9
.52
6’1
48
Mid
dle
East
& C
entr
al A
sia
Tot
al
l 1
’577
3
3’31
3 1
49’6
14
60’
110
25.
07
11’
069
Latin
Am
eric
a A
rgen
tina
32
100
2
7 1
1 0
.00
-
Braz
il 1
’903
2
’072
2
80
97
0.0
4 5
27
Peru
1
84
663
1
’486
5
58
0.2
3 7
45
Lati
n A
mer
ica
Tot
al
Lati
n A
mer
ica
Tot
al
2’1
19
2’8
35
1’7
93
666
0
.28
1’2
72
Indi
a 1
66’7
67
302
’863
3
49’7
86
122
’668
5
1.16
2
3’25
1
Paki
stan
4
’003
7
81
1’1
72
398
0
.17
17’
632
Tha
iland
4
6 4
6 1
7 6
-
-
Mya
nmar
1
3 8
-
-
-
8
Sout
h A
sia
Tot
al
Sout
h A
sia
Tot
al
170
’829
3
03’6
98
350
’975
1
23’0
72
51.
32
40’
892
USA
U
SA T
otal
6
6 8
’050
1
4’75
6 5
’165
2
.15
230
Tot
al
Glo
bal t
otal
22
2’13
4 4
18’9
35
649
’656
2
39’7
87
100
.00
55’
833
Sour
ce: T
extil
e Ex
chan
ge O
rgan
ic Co
tton
Mar
ket R
epor
t 202
0

134 FiBL & IFOAM – Organics International (2021): The World of Organic Agriculture. Frick and Bonn
FiBL & IFOAM – Organics International (2021): The World of Organic Agriculture. Frick and Bonn 135
Global Market
Organic Imports

Global Market for Organic Food and Drink
136 FiBL & IFOAM – Organics International (2021): The World of Organic Agriculture. Frick and Bonn
The Global Market for Organic Food & Drink1
BY AMARJIT SAHOTA2
Introduction
The coronavirus pandemic is described as a multi-layered crisis with health, social and economic impacts. Since it began in spring 2020, it has been having a profound impact on our lives. It is also elevating consumer demand for organic foods.
Organic food sales are seeing an uplift during the coronavirus pandemic. Retailers across the globe are reporting significant sales increases since the virus outbreak in March. Consumers are turning to organic foods as they look more closely at personal health, wellness and nutrition.
Ecovia Intelligence predicts demand will continue to follow the positive trajectory in the coming years. Previous health and food scares have caused an initial spike in organic food sales, followed by sustained demand. The current crisis is, however, likely to have long-term ramifications. Sustainability issues, such as food security, transparency and supply chain integrity, are likely to become more prominent. Organic, as the most sustainable form of agriculture, is likely to benefit as the food industry makes the transition to a post-COVID world.
Global market overview
International sales of organic food and drink reached 112 billion US dollars in 2019. The market has expanded by 55 percent since 2013.3
Figure 53 shows that although North America and Europe generate most sales, their share (roughly 90 percent) is shrinking. The two regions generated 97 percent of global sales in 2000. The coronavirus crisis is predicted to accelerate this trend as more regional markets for organic foods develop. In particular, the share of developing countries such as China, India, Brazil and Indonesia is likely to grow at a fast rate in the coming years.
1 This chapter has been prepared by Ecovia Intelligence (formerly known as Organic Monitor) from its ongoing research on the Global Market for Organic Food & Drink. No part of this chapter maybe reproduced or used in other commercial publications without written consent from Ecovia Intelligence. To request permission, write to Ecovia Intelligence, 79 Western Road, London W5 5DT, UK, Tel. +44 20 8567 0788, e-mail [email protected], www.ecoviaint.com 2 Amarjit Sahota, President of Ecovia Intelligence, Ecovia Intelligence, 79 Western Road, London W5 5DT, UK, www.ecoviaint.com Amarjit Sahota is the Founder and President of Ecovia Intelligence (formerly Organic Monitor), a specialist research, consulting & training firm that focuses on global sustainable product industries. More details are on www.ecoviaint.com 3 Please note that there are some differences in organic food sales between the calculations of Ecovia Intelligence and those of FiBL due to different methodologies.
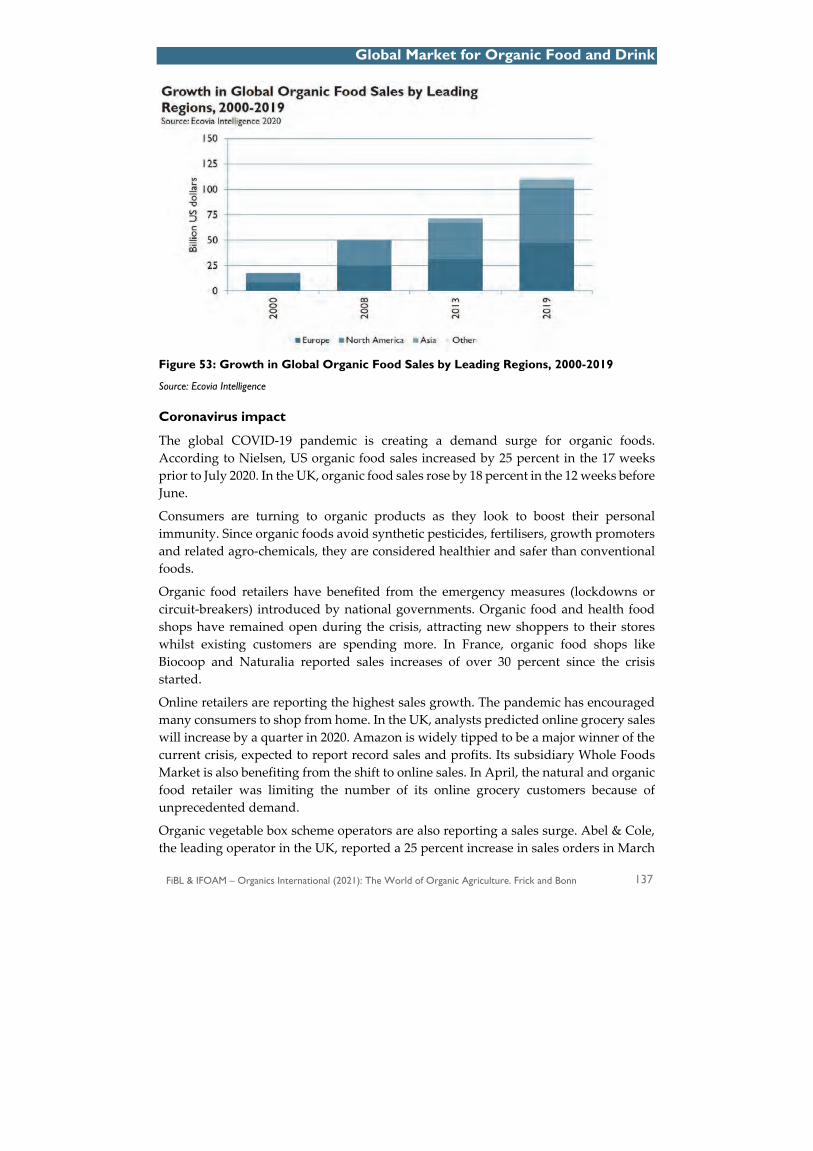
Global Market for Organic Food and Drink
FiBL & IFOAM – Organics International (2021): The World of Organic Agriculture. Frick and Bonn 137
Figure 53: Growth in Global Organic Food Sales by Leading Regions, 2000-2019
Source: Ecovia Intelligence
Coronavirus impact
The global COVID-19 pandemic is creating a demand surge for organic foods. According to Nielsen, US organic food sales increased by 25 percent in the 17 weeks prior to July 2020. In the UK, organic food sales rose by 18 percent in the 12 weeks before June.
Consumers are turning to organic products as they look to boost their personal immunity. Since organic foods avoid synthetic pesticides, fertilisers, growth promoters and related agro-chemicals, they are considered healthier and safer than conventional foods.
Organic food retailers have benefited from the emergency measures (lockdowns or circuit-breakers) introduced by national governments. Organic food and health food shops have remained open during the crisis, attracting new shoppers to their stores whilst existing customers are spending more. In France, organic food shops like Biocoop and Naturalia reported sales increases of over 30 percent since the crisis started.
Online retailers are reporting the highest sales growth. The pandemic has encouraged many consumers to shop from home. In the UK, analysts predicted online grocery sales will increase by a quarter in 2020. Amazon is widely tipped to be a major winner of the current crisis, expected to report record sales and profits. Its subsidiary Whole Foods Market is also benefiting from the shift to online sales. In April, the natural and organic food retailer was limiting the number of its online grocery customers because of unprecedented demand.
Organic vegetable box scheme operators are also reporting a sales surge. Abel & Cole, the leading operator in the UK, reported a 25 percent increase in sales orders in March
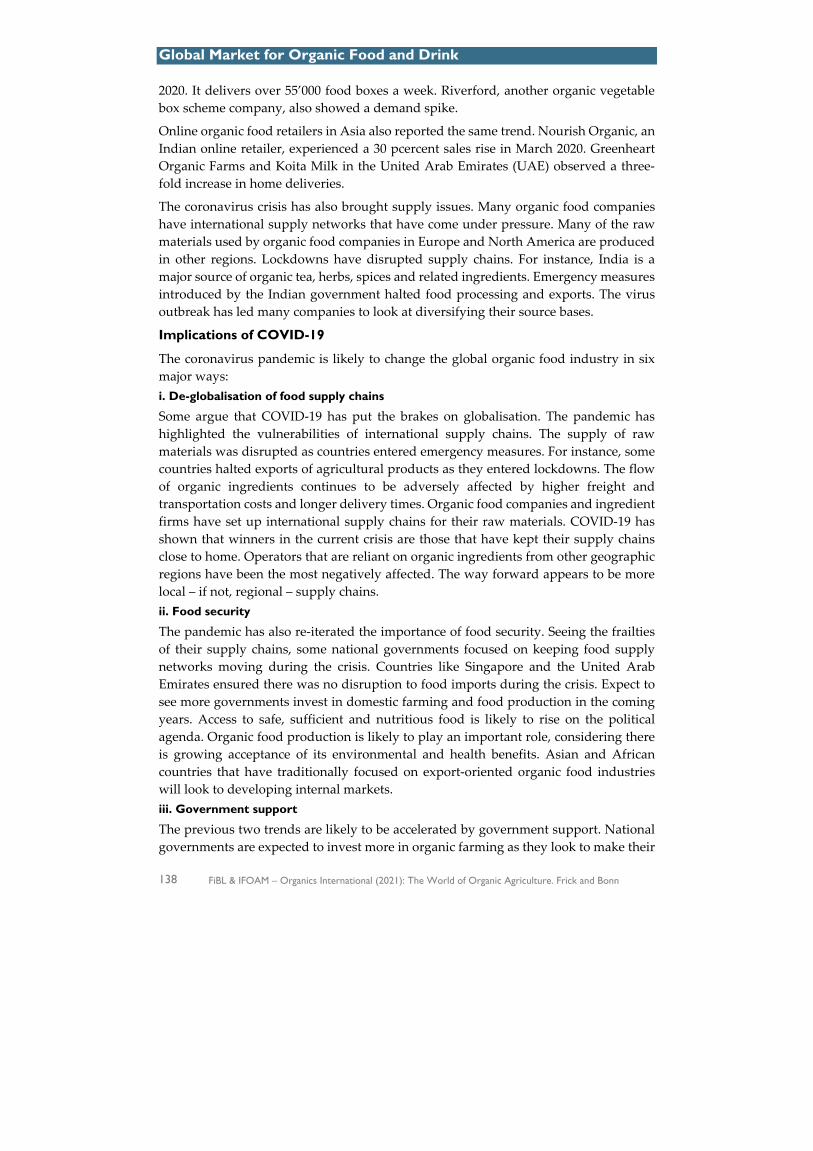
Global Market for Organic Food and Drink
138 FiBL & IFOAM – Organics International (2021): The World of Organic Agriculture. Frick and Bonn
2020. It delivers over 55’000 food boxes a week. Riverford, another organic vegetable box scheme company, also showed a demand spike.
Online organic food retailers in Asia also reported the same trend. Nourish Organic, an Indian online retailer, experienced a 30 pcercent sales rise in March 2020. Greenheart Organic Farms and Koita Milk in the United Arab Emirates (UAE) observed a three-fold increase in home deliveries.
The coronavirus crisis has also brought supply issues. Many organic food companies have international supply networks that have come under pressure. Many of the raw materials used by organic food companies in Europe and North America are produced in other regions. Lockdowns have disrupted supply chains. For instance, India is a major source of organic tea, herbs, spices and related ingredients. Emergency measures introduced by the Indian government halted food processing and exports. The virus outbreak has led many companies to look at diversifying their source bases.
Implications of COVID-19
The coronavirus pandemic is likely to change the global organic food industry in six major ways: i. De-globalisation of food supply chains
Some argue that COVID-19 has put the brakes on globalisation. The pandemic has highlighted the vulnerabilities of international supply chains. The supply of raw materials was disrupted as countries entered emergency measures. For instance, some countries halted exports of agricultural products as they entered lockdowns. The flow of organic ingredients continues to be adversely affected by higher freight and transportation costs and longer delivery times. Organic food companies and ingredient firms have set up international supply chains for their raw materials. COVID-19 has shown that winners in the current crisis are those that have kept their supply chains close to home. Operators that are reliant on organic ingredients from other geographic regions have been the most negatively affected. The way forward appears to be more local – if not, regional – supply chains. ii. Food security
The pandemic has also re-iterated the importance of food security. Seeing the frailties of their supply chains, some national governments focused on keeping food supply networks moving during the crisis. Countries like Singapore and the United Arab Emirates ensured there was no disruption to food imports during the crisis. Expect to see more governments invest in domestic farming and food production in the coming years. Access to safe, sufficient and nutritious food is likely to rise on the political agenda. Organic food production is likely to play an important role, considering there is growing acceptance of its environmental and health benefits. Asian and African countries that have traditionally focused on export-oriented organic food industries will look to developing internal markets. iii. Government support
The previous two trends are likely to be accelerated by government support. National governments are expected to invest more in organic farming as they look to make their

Global Market for Organic Food and Drink
FiBL & IFOAM – Organics International (2021): The World of Organic Agriculture. Frick and Bonn 139
food industries more resilient. Organic farming will also be encouraged as countries look to reduce pesticide usage and improve soil fertility. In May 2020, as part of the European Green Deal, the EU announced the target of reaching 25 percent of farmland organic by 2030. The EU’s farm to fork strategy aims to improve food security in Europe. The strategy plans to reduce the environmental impact of the European food system, reduce chemical pesticide use by 50 percent, hazardous pesticide use by 50 percent, fertiliser use by 20 percent and nutrient losses by 50 percent by 2030. iv. Transparency and traceability
The move towards traceability and transparency in supply chains of agricultural products is expected to gain impetus. As supply of organic ingredients/products becomes tighter, risks of fraud and adulteration increase. Traceability tools will be deployed to maintain the integrity of organic products. Blockchain technology is expected to play a key role. Carrefour, Europe’s largest supermarket chain, is already using blockchain to provide transparency for some of its private label organic products. The Thai government is also planning to use blockchain to promote its organic rice in export markets. v. Changing consumer behaviour
COVID-19 is arguably having the most impact on us as consumers, changing the way we shop and eat. From initial panic-buying and stockpiling to less frequent shopping visits and online purchasing, the coronavirus is causing a major shift in consumer attitudes and behaviour. Organic food sales are rising during the crisis. However, demand for plant-based foods, nutritional supplements, and natural products is also increasing. Consumers are turning to health and wellness products as they look more closely at disease prevention and maintenance. The challenge for the industry is to ensure organic product sales meet the needs of changing consumer behaviour. Organic dairy product sales have already been adversely affected by the rise of plant-based products. Organic meat sales could suffer the same fate if consumers do not associate them with ethics and nutrition. vi. Food retailing
Online retailers are clear winners of the current crisis. Amazon, along with Whole Foods Market, has capitalised on the shift to home shopping. Online retailers are expected to take a bigger chunk of organic food sales in the coming years. Large conventional grocery chains and dedicated organic food online retailers will gain market share. Organic food retailers, especially those in Europe and Asia, will need to adapt. The growing purchasing power of millennials and Gen Z is expected to accelerate this trend.
Conclusions
Organic foods were first introduced on a large-scale in the early 1990s. It took over 15 years for global organic product sales to reach 50 billion US dollars in 2008. Ten years later (2018), they surpassed the 100 billion US dollar mark. With COVID-19 changing the way we shop and eat, the next leap to 150 billion US dollars could possibly be within the next few years.
Organic Imports to the European Union
140 FiBL & IFOAM – Organics International (2021): The World of Organic Agriculture. Frick and Bonn
Imports of Organic Agri-food Products into the European Union ‒ Summary of the EU Agricultural Market Brief on EU Organic Imports 20191
This is a summary prepared by FiBL of the EU Agricultural market brief “EU imports of organic agri-food products - Key developments in 2019” published by the European Commission, DG Agriculture and Rural Development.
The present brief describes data on EU organic imports2 of agri-food products in 2019 and reflects on key developments compared to 2018. It characterises these imports in terms of origin and destination, as well as product categories.
Figure 54: Organic agri-food import volumes by import country
Source: Traces/European Commission 2020
In 2019, the EU imported 3.24 million metric tons (MT) of organic agri-food products. This represents a negligible increase compared to the 3.23 million metric tons imported in 2018 (+0.4 percent). Almost one-third of the 2019 organic imports into the EU were imported by the Netherlands (32 percent). Other EU Member States that imported a
1 European Commission (2020): EU imports of organic agri-food productsKey developments in 2019. EU Agricultural Market Briefs No 17, June 2020. https://ec.europa.eu/info/sites/info/files/food-farming-fisheries/farming/documents/market-brief-organic-imports-june2020_en.pdf 2 These data include the 28 countries that were member states of the European Union in 2019.
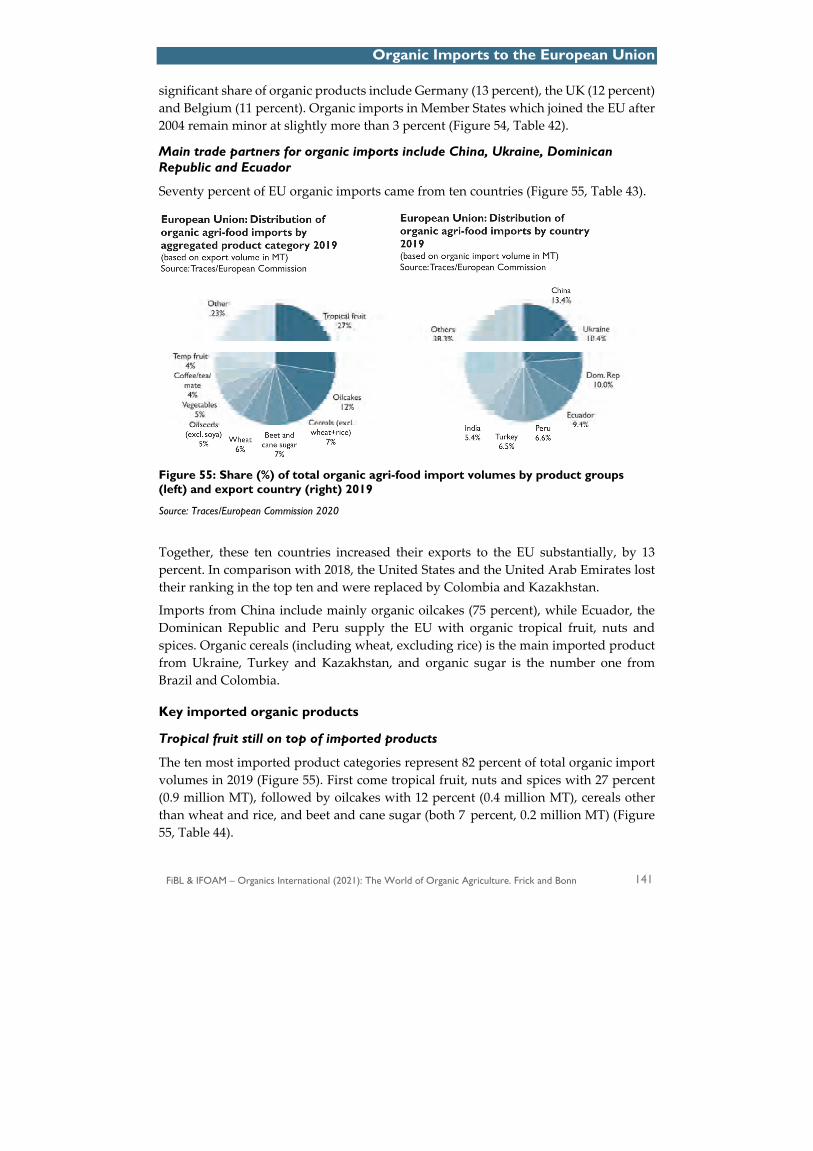
Organic Imports to the European Union
FiBL & IFOAM – Organics International (2021): The World of Organic Agriculture. Frick and Bonn 141
significant share of organic products include Germany (13 percent), the UK (12 percent) and Belgium (11 percent). Organic imports in Member States which joined the EU after 2004 remain minor at slightly more than 3 percent (Figure 54, Table 42).
Main trade partners for organic imports include China, Ukraine, Dominican Republic and Ecuador
Seventy percent of EU organic imports came from ten countries (Figure 55, Table 43).
Figure 55: Share (%) of total organic agri-food import volumes by product groups (left) and export country (right) 2019
Source: Traces/European Commission 2020
Together, these ten countries increased their exports to the EU substantially, by 13 percent. In comparison with 2018, the United States and the United Arab Emirates lost their ranking in the top ten and were replaced by Colombia and Kazakhstan.
Imports from China include mainly organic oilcakes (75 percent), while Ecuador, the Dominican Republic and Peru supply the EU with organic tropical fruit, nuts and spices. Organic cereals (including wheat, excluding rice) is the main imported product from Ukraine, Turkey and Kazakhstan, and organic sugar is the number one from Brazil and Colombia.
Key imported organic products
Tropical fruit still on top of imported products
The ten most imported product categories represent 82 percent of total organic import volumes in 2019 (Figure 55). First come tropical fruit, nuts and spices with 27 percent (0.9 million MT), followed by oilcakes with 12 percent (0.4 million MT), cereals other than wheat and rice, and beet and cane sugar (both 7 percent, 0.2 million MT) (Figure 55, Table 44).
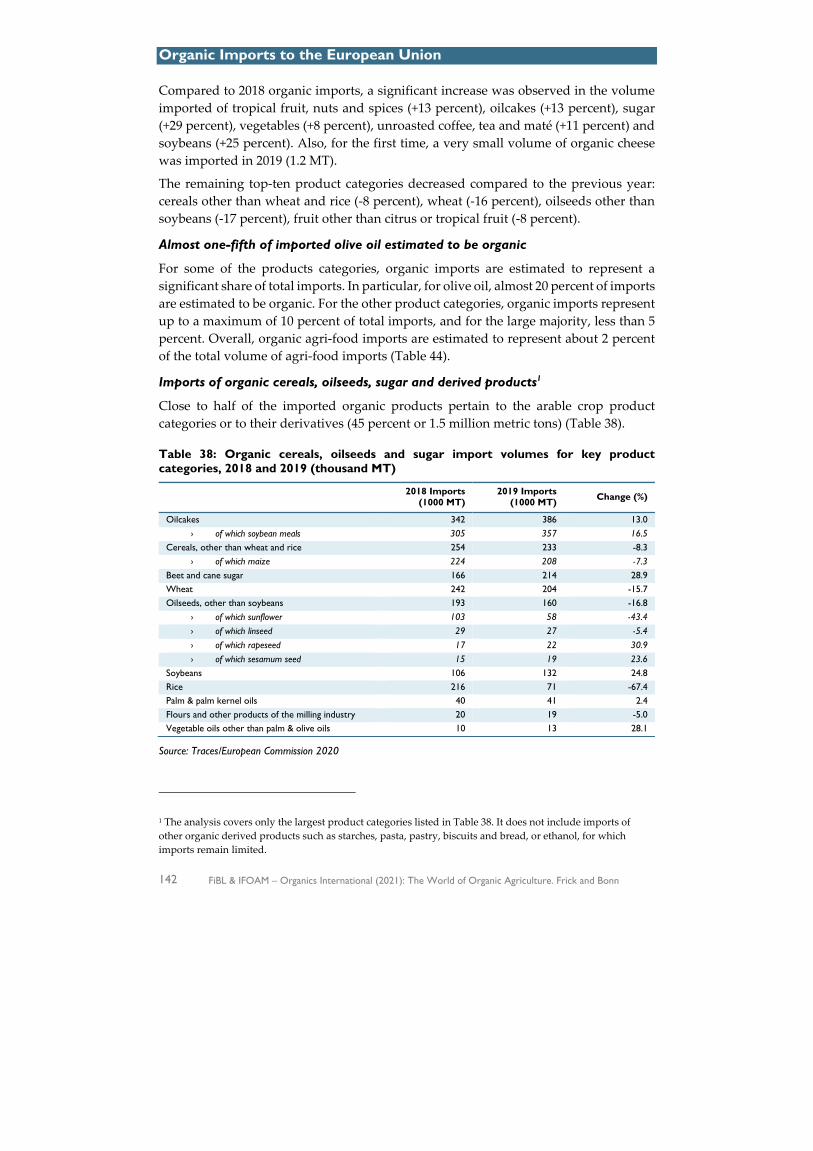
Organic Imports to the European Union
142 FiBL & IFOAM – Organics International (2021): The World of Organic Agriculture. Frick and Bonn
Compared to 2018 organic imports, a significant increase was observed in the volume imported of tropical fruit, nuts and spices (+13 percent), oilcakes (+13 percent), sugar (+29 percent), vegetables (+8 percent), unroasted coffee, tea and maté (+11 percent) and soybeans (+25 percent). Also, for the first time, a very small volume of organic cheese was imported in 2019 (1.2 MT).
The remaining top-ten product categories decreased compared to the previous year: cereals other than wheat and rice (-8 percent), wheat (-16 percent), oilseeds other than soybeans (-17 percent), fruit other than citrus or tropical fruit (-8 percent).
Almost one-fifth of imported olive oil estimated to be organic
For some of the products categories, organic imports are estimated to represent a significant share of total imports. In particular, for olive oil, almost 20 percent of imports are estimated to be organic. For the other product categories, organic imports represent up to a maximum of 10 percent of total imports, and for the large majority, less than 5 percent. Overall, organic agri-food imports are estimated to represent about 2 percent of the total volume of agri-food imports (Table 44).
Imports of organic cereals, oilseeds, sugar and derived products1
Close to half of the imported organic products pertain to the arable crop product categories or to their derivatives (45 percent or 1.5 million metric tons) (Table 38).
Table 38: Organic cereals, oilseeds and sugar import volumes for key product categories, 2018 and 2019 (thousand MT)
2018 Imports (1000 MT)
2019 Imports (1000 MT) Change (%)
Oilcakes 342 386 13.0 › of which soybean meals 305 357 16.5
Cereals, other than wheat and rice 254 233 -8.3 › of which maize 224 208 -7.3
Beet and cane sugar 166 214 28.9 Wheat 242 204 -15.7 Oilseeds, other than soybeans 193 160 -16.8
› of which sunflower 103 58 -43.4 › of which linseed 29 27 -5.4 › of which rapeseed 17 22 30.9 › of which sesamum seed 15 19 23.6
Soybeans 106 132 24.8 Rice 216 71 -67.4 Palm & palm kernel oils 40 41 2.4 Flours and other products of the milling industry 20 19 -5.0 Vegetable oils other than palm & olive oils 10 13 28.1
Source: Traces/European Commission 2020
1 The analysis covers only the largest product categories listed in Table 38. It does not include imports of other organic derived products such as starches, pasta, pastry, biscuits and bread, or ethanol, for which imports remain limited.
Organic Imports to the European Union
FiBL & IFOAM – Organics International (2021): The World of Organic Agriculture. Frick and Bonn 143
Of these, oilseeds, oilcakes and vegetable oils cover slightly more than 0.7 million MT (50 percent), with the largest category being oilcakes (of which 92 percent are soybean meals). Oilcakes are an important feed component for EU livestock production, in particular for organic pig meat and poultry. A further 0.5 million MT is composed of cereals and flours (36 percent), mainly wheat and maize. The remaining 0.2 million MT is sugar (15 percent).
Imports of organic oilseeds and derivative products increased on average by 6 percent in 2019. Among these product categories, only imports of oilseeds other than soybeans decreased compared to 2018. For cereals (including wheat and rice), organic imports show a decline over all product categories, resulting in an average decrease of 28 percent in 2019 imports. With regard to sugar, an additional volume of 29 percent was imported.
Over 80 percent of organic oilcakes are imported from China. With regard to oilseeds, important origins include China, Ukraine and India, as well as Togo for soybeans and Turkey for other oilseeds. The vast majority of organic cereals (excluding rice) are imported from Ukraine (32 percent of wheat, 77 percent of other cereals) and Turkey (22 percent of wheat, 11 percent of other cereals) as well as from Kazakhstan for wheat (31 percent). Pakistan and India are the main origin countries of imported organic rice (respectively 36 percent and 25 percent of total organic rice imports). Three-quarters of organic sugar is imported from four countries: Brazil (27 percent), Colombia, India (both 18 percent) and Paraguay (14 percent).
Imports of organic fruit and vegetables
Fruit and vegetables is the second largest category of imported organic products, with 1.35 million MT imported in 2019 (42 percent of total organic imports). The largest share is composed of tropical fruit, nuts and spices (66 percent) which include mainly bananas (85 percent of tropical fruit) (Table 39).
Imports of organic fruit and vegetables increased by 8 percent in 2019. A particularly strong increase is observed in imports of tropical fruit, nuts and spices, with 2019 imports close to 0.9 million MT (+13 percent). Two categories show, however, a decrease compared to the previous year: fruit other than exotic and citrus fruit (-8 percent) and fruit juices (-3 percent).
Organic tropical fruit, nuts and spices are imported mainly from the Dominican Republic (34 percent of total, equal to 0.3 million MT), Ecuador (31 percent) and Peru (15 percent). Almost half of the imported organic citrus fruit originates from South Africa (46 percent), while other organic fruits come from mainly from Turkey (25 percent) and Argentina (17 percent). Half of the organic fruit juices imported come from Turkey and Mexico (both 25 percent). Middle Eastern countries are the main origin of organic vegetables, including Egypt (26 percent), Israel (22 percent) and Turkey (17 percent). For preparations of vegetables, fruit or nuts, none of the origin countries export significantly more to the EU than the others.
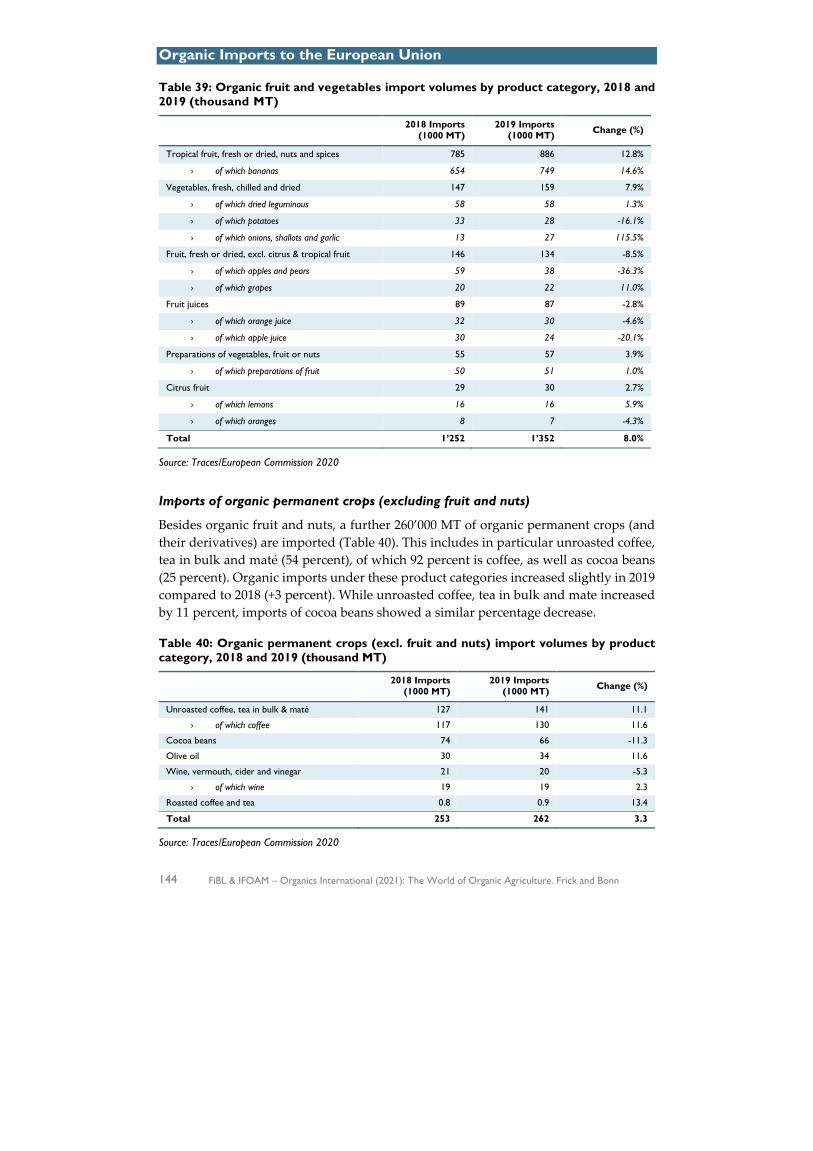
Organic Imports to the European Union
144 FiBL & IFOAM – Organics International (2021): The World of Organic Agriculture. Frick and Bonn
Table 39: Organic fruit and vegetables import volumes by product category, 2018 and 2019 (thousand MT)
2018 Imports (1000 MT)
2019 Imports (1000 MT) Change (%)
Tropical fruit, fresh or dried, nuts and spices 785 886 12.8%
› of which bananas 654 749 14.6%
Vegetables, fresh, chilled and dried 147 159 7.9%
› of which dried leguminous 58 58 1.3%
› of which potatoes 33 28 -16.1%
› of which onions, shallots and garlic 13 27 115.5%
Fruit, fresh or dried, excl. citrus & tropical fruit 146 134 -8.5%
› of which apples and pears 59 38 -36.3%
› of which grapes 20 22 11.0%
Fruit juices 89 87 -2.8%
› of which orange juice 32 30 -4.6%
› of which apple juice 30 24 -20.1%
Preparations of vegetables, fruit or nuts 55 57 3.9%
› of which preparations of fruit 50 51 1.0%
Citrus fruit 29 30 2.7%
› of which lemons 16 16 5.9%
› of which oranges 8 7 -4.3%
Total 1’252 1’352 8.0%
Source: Traces/European Commission 2020
Imports of organic permanent crops (excluding fruit and nuts)
Besides organic fruit and nuts, a further 260’000 MT of organic permanent crops (and their derivatives) are imported (Table 40). This includes in particular unroasted coffee, tea in bulk and maté (54 percent), of which 92 percent is coffee, as well as cocoa beans (25 percent). Organic imports under these product categories increased slightly in 2019 compared to 2018 (+3 percent). While unroasted coffee, tea in bulk and mate increased by 11 percent, imports of cocoa beans showed a similar percentage decrease.
Table 40: Organic permanent crops (excl. fruit and nuts) import volumes by product category, 2018 and 2019 (thousand MT)
2018 Imports (1000 MT)
2019 Imports (1000 MT) Change (%)
Unroasted coffee, tea in bulk & maté 127 141 11.1
› of which coffee 117 130 11.6
Cocoa beans 74 66 -11.3
Olive oil 30 34 11.6
Wine, vermouth, cider and vinegar 21 20 -5.3
› of which wine 19 19 2.3
Roasted coffee and tea 0.8 0.9 13.4
Total 253 262 3.3
Source: Traces/European Commission 2020
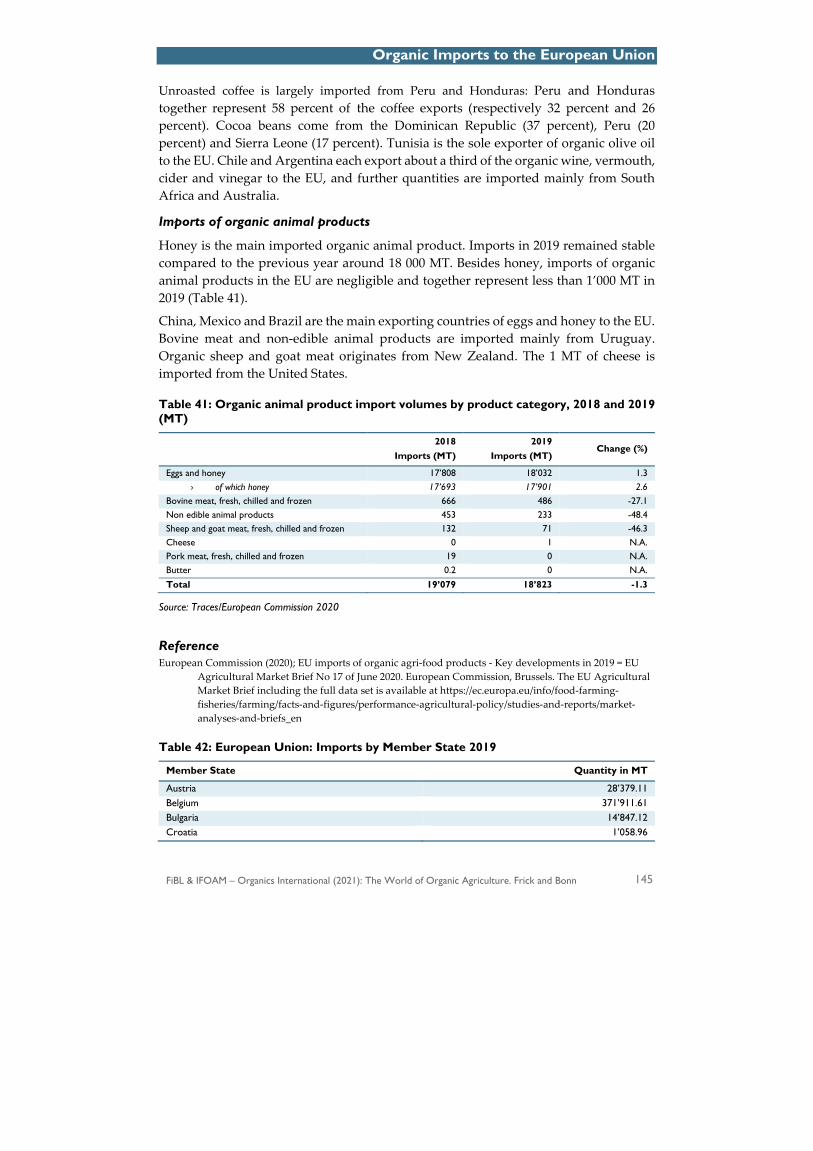
Organic Imports to the European Union
FiBL & IFOAM – Organics International (2021): The World of Organic Agriculture. Frick and Bonn 145
Unroasted coffee is largely imported from Peru and Honduras: Peru and Honduras together represent 58 percent of the coffee exports (respectively 32 percent and 26 percent). Cocoa beans come from the Dominican Republic (37 percent), Peru (20 percent) and Sierra Leone (17 percent). Tunisia is the sole exporter of organic olive oil to the EU. Chile and Argentina each export about a third of the organic wine, vermouth, cider and vinegar to the EU, and further quantities are imported mainly from South Africa and Australia.
Imports of organic animal products
Honey is the main imported organic animal product. Imports in 2019 remained stable compared to the previous year around 18 000 MT. Besides honey, imports of organic animal products in the EU are negligible and together represent less than 1’000 MT in 2019 (Table 41).
China, Mexico and Brazil are the main exporting countries of eggs and honey to the EU. Bovine meat and non-edible animal products are imported mainly from Uruguay. Organic sheep and goat meat originates from New Zealand. The 1 MT of cheese is imported from the United States.
Table 41: Organic animal product import volumes by product category, 2018 and 2019 (MT)
2018 Imports (MT)
2019 Imports (MT)
Change (%)
Eggs and honey 17’808 18’032 1.3 › of which honey 17’693 17’901 2.6
Bovine meat, fresh, chilled and frozen 666 486 -27.1 Non edible animal products 453 233 -48.4 Sheep and goat meat, fresh, chilled and frozen 132 71 -46.3 Cheese 0 1 N.A. Pork meat, fresh, chilled and frozen 19 0 N.A. Butter 0.2 0 N.A.
Total 19’079 18’823 -1.3
Source: Traces/European Commission 2020
Reference European Commission (2020); EU imports of organic agri-food products - Key developments in 2019 = EU
Agricultural Market Brief No 17 of June 2020. European Commission, Brussels. The EU Agricultural Market Brief including the full data set is available at https://ec.europa.eu/info/food-farming-fisheries/farming/facts-and-figures/performance-agricultural-policy/studies-and-reports/market-analyses-and-briefs_en
Table 42: European Union: Imports by Member State 2019
Member State Quantity in MT
Austria 28’379.11 Belgium 371’911.61 Bulgaria 14’847.12 Croatia 1’058.96
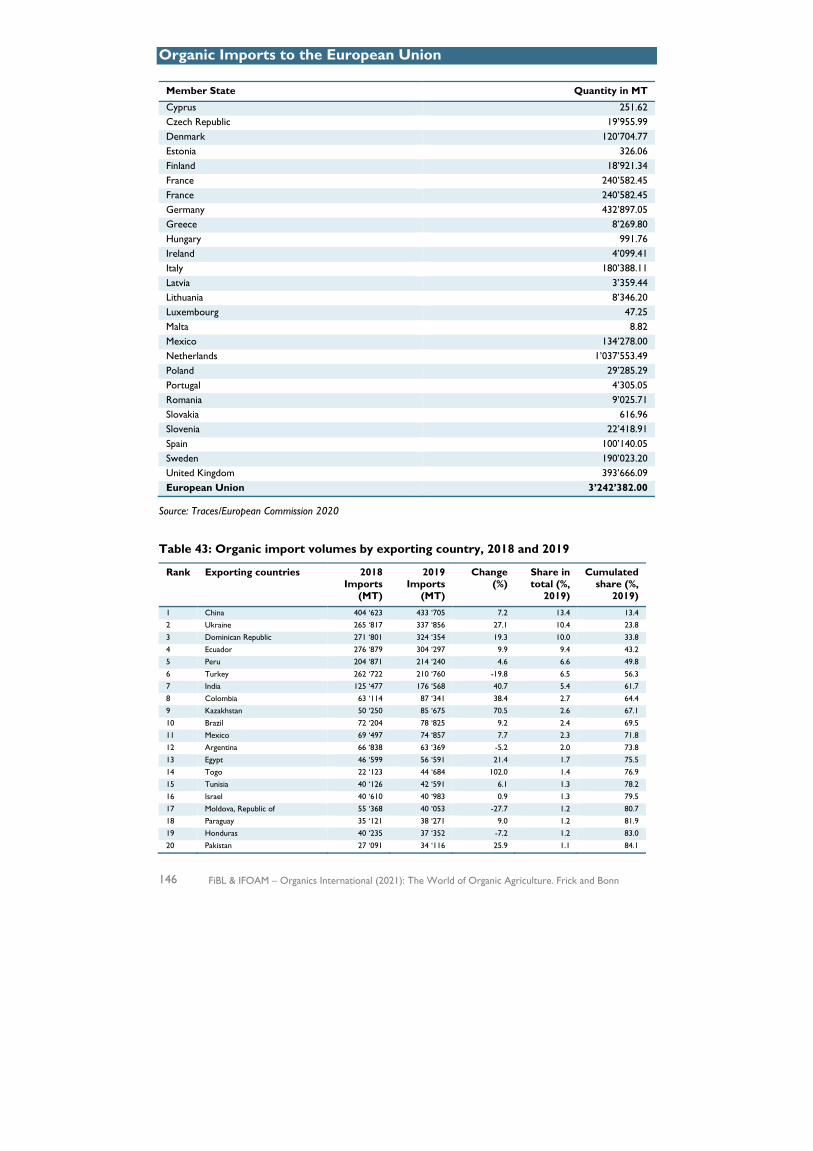
Organic Imports to the European Union
146 FiBL & IFOAM – Organics International (2021): The World of Organic Agriculture. Frick and Bonn
Member State Quantity in MT
Cyprus 251.62 Czech Republic 19’955.99 Denmark 120’704.77 Estonia 326.06 Finland 18’921.34 France 240’582.45 France 240’582.45 Germany 432’897.05 Greece 8’269.80 Hungary 991.76 Ireland 4’099.41 Italy 180’388.11 Latvia 3’359.44 Lithuania 8’346.20 Luxembourg 47.25 Malta 8.82 Mexico 134’278.00 Netherlands 1’037’553.49 Poland 29’285.29 Portugal 4’305.05 Romania 9’025.71 Slovakia 616.96 Slovenia 22’418.91 Spain 100’140.05 Sweden 190’023.20 United Kingdom 393’666.09 European Union 3’242’382.00
Source: Traces/European Commission 2020
Table 43: Organic import volumes by exporting country, 2018 and 2019
Rank Exporting countries 2018 Imports
(MT)
2019 Imports
(MT)
Change (%)
Share in total (%,
2019)
Cumulated share (%,
2019)
1 China 404 ‘623 433 ‘705 7.2 13.4 13.4 2 Ukraine 265 ‘817 337 ‘856 27.1 10.4 23.8 3 Dominican Republic 271 ‘801 324 ‘354 19.3 10.0 33.8 4 Ecuador 276 ‘879 304 ‘297 9.9 9.4 43.2 5 Peru 204 ‘871 214 ‘240 4.6 6.6 49.8 6 Turkey 262 ‘722 210 ‘760 -19.8 6.5 56.3 7 India 125 ‘477 176 ‘568 40.7 5.4 61.7 8 Colombia 63 ‘114 87 ‘341 38.4 2.7 64.4 9 Kazakhstan 50 ‘250 85 ‘675 70.5 2.6 67.1 10 Brazil 72 ‘204 78 ‘825 9.2 2.4 69.5 11 Mexico 69 ‘497 74 ‘857 7.7 2.3 71.8 12 Argentina 66 ‘838 63 ‘369 -5.2 2.0 73.8 13 Egypt 46 ‘599 56 ‘591 21.4 1.7 75.5 14 Togo 22 ‘123 44 ‘684 102.0 1.4 76.9 15 Tunisia 40 ‘126 42 ‘591 6.1 1.3 78.2 16 Israel 40 ‘610 40 ‘983 0.9 1.3 79.5 17 Moldova, Republic of 55 ‘368 40 ‘053 -27.7 1.2 80.7 18 Paraguay 35 ‘121 38 ‘271 9.0 1.2 81.9 19 Honduras 40 ‘235 37 ‘352 -7.2 1.2 83.0 20 Pakistan 27 ‘091 34 ‘116 25.9 1.1 84.1
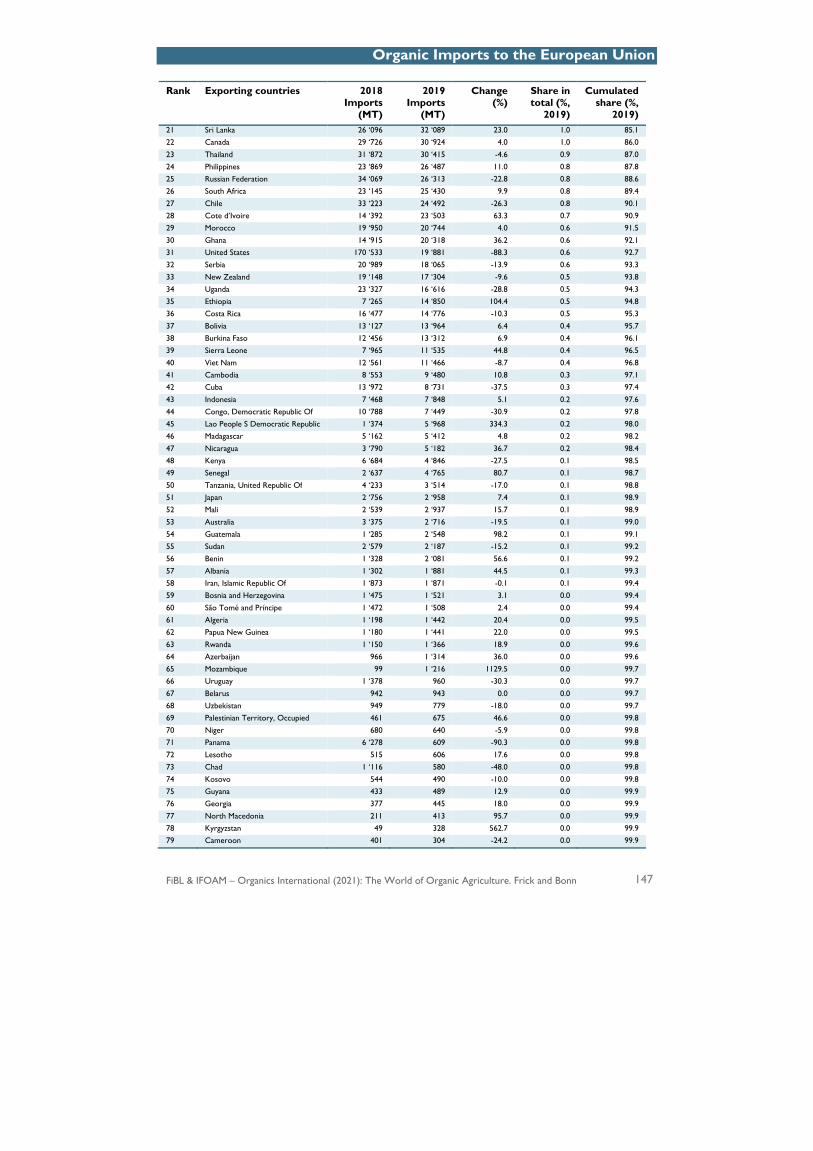
Organic Imports to the European Union
FiBL & IFOAM – Organics International (2021): The World of Organic Agriculture. Frick and Bonn 147
Rank Exporting countries 2018 Imports
(MT)
2019 Imports
(MT)
Change (%)
Share in total (%,
2019)
Cumulated share (%,
2019) 21 Sri Lanka 26 ‘096 32 ‘089 23.0 1.0 85.1 22 Canada 29 ‘726 30 ‘924 4.0 1.0 86.0 23 Thailand 31 ‘872 30 ‘415 -4.6 0.9 87.0 24 Philippines 23 ‘869 26 ‘487 11.0 0.8 87.8 25 Russian Federation 34 ‘069 26 ‘313 -22.8 0.8 88.6 26 South Africa 23 ‘145 25 ‘430 9.9 0.8 89.4 27 Chile 33 ‘223 24 ‘492 -26.3 0.8 90.1 28 Cote d’Ivoire 14 ‘392 23 ‘503 63.3 0.7 90.9 29 Morocco 19 ‘950 20 ‘744 4.0 0.6 91.5 30 Ghana 14 ‘915 20 ‘318 36.2 0.6 92.1 31 United States 170 ‘533 19 ‘881 -88.3 0.6 92.7 32 Serbia 20 ‘989 18 ‘065 -13.9 0.6 93.3 33 New Zealand 19 ‘148 17 ‘304 -9.6 0.5 93.8 34 Uganda 23 ‘327 16 ‘616 -28.8 0.5 94.3 35 Ethiopia 7 ‘265 14 ‘850 104.4 0.5 94.8 36 Costa Rica 16 ‘477 14 ‘776 -10.3 0.5 95.3 37 Bolivia 13 ‘127 13 ‘964 6.4 0.4 95.7 38 Burkina Faso 12 ‘456 13 ‘312 6.9 0.4 96.1 39 Sierra Leone 7 ‘965 11 ‘535 44.8 0.4 96.5 40 Viet Nam 12 ‘561 11 ‘466 -8.7 0.4 96.8 41 Cambodia 8 ‘553 9 ‘480 10.8 0.3 97.1 42 Cuba 13 ‘972 8 ‘731 -37.5 0.3 97.4 43 Indonesia 7 ‘468 7 ‘848 5.1 0.2 97.6 44 Congo, Democratic Republic Of 10 ‘788 7 ‘449 -30.9 0.2 97.8 45 Lao People S Democratic Republic 1 ‘374 5 ‘968 334.3 0.2 98.0 46 Madagascar 5 ‘162 5 ‘412 4.8 0.2 98.2 47 Nicaragua 3 ‘790 5 ‘182 36.7 0.2 98.4 48 Kenya 6 ‘684 4 ‘846 -27.5 0.1 98.5 49 Senegal 2 ‘637 4 ‘765 80.7 0.1 98.7 50 Tanzania, United Republic Of 4 ‘233 3 ‘514 -17.0 0.1 98.8 51 Japan 2 ‘756 2 ‘958 7.4 0.1 98.9 52 Mali 2 ‘539 2 ‘937 15.7 0.1 98.9 53 Australia 3 ‘375 2 ‘716 -19.5 0.1 99.0 54 Guatemala 1 ‘285 2 ‘548 98.2 0.1 99.1 55 Sudan 2 ‘579 2 ‘187 -15.2 0.1 99.2 56 Benin 1 ‘328 2 ‘081 56.6 0.1 99.2 57 Albania 1 ‘302 1 ‘881 44.5 0.1 99.3 58 Iran, Islamic Republic Of 1 ‘873 1 ‘871 -0.1 0.1 99.4 59 Bosnia and Herzegovina 1 ‘475 1 ‘521 3.1 0.0 99.4 60 São Tomé and Príncipe 1 ‘472 1 ‘508 2.4 0.0 99.4 61 Algeria 1 ‘198 1 ‘442 20.4 0.0 99.5 62 Papua New Guinea 1 ‘180 1 ‘441 22.0 0.0 99.5 63 Rwanda 1 ‘150 1 ‘366 18.9 0.0 99.6 64 Azerbaijan 966 1 ‘314 36.0 0.0 99.6 65 Mozambique 99 1 ‘216 1129.5 0.0 99.7 66 Uruguay 1 ‘378 960 -30.3 0.0 99.7 67 Belarus 942 943 0.0 0.0 99.7 68 Uzbekistan 949 779 -18.0 0.0 99.7 69 Palestinian Territory, Occupied 461 675 46.6 0.0 99.8 70 Niger 680 640 -5.9 0.0 99.8 71 Panama 6 ‘278 609 -90.3 0.0 99.8 72 Lesotho 515 606 17.6 0.0 99.8 73 Chad 1 ‘116 580 -48.0 0.0 99.8 74 Kosovo 544 490 -10.0 0.0 99.8 75 Guyana 433 489 12.9 0.0 99.9 76 Georgia 377 445 18.0 0.0 99.9 77 North Macedonia 211 413 95.7 0.0 99.9 78 Kyrgyzstan 49 328 562.7 0.0 99.9 79 Cameroon 401 304 -24.2 0.0 99.9
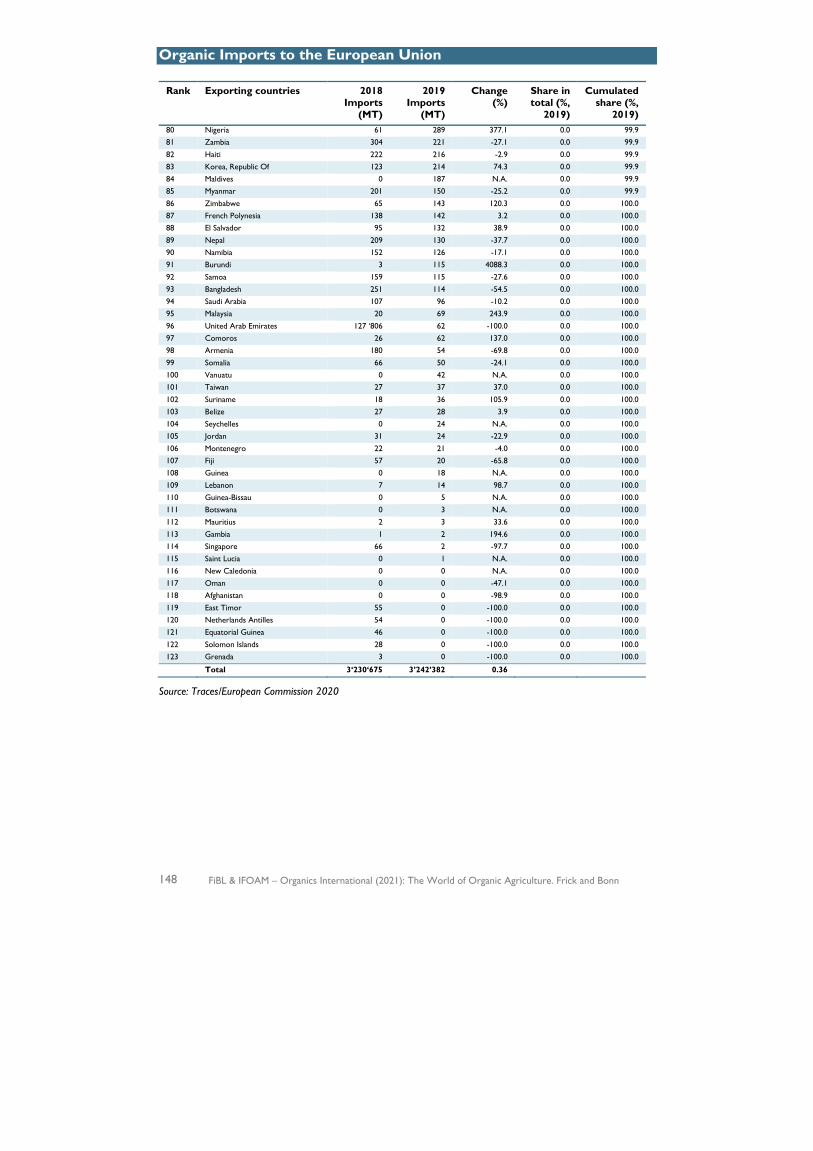
Organic Imports to the European Union
148 FiBL & IFOAM – Organics International (2021): The World of Organic Agriculture. Frick and Bonn
Rank Exporting countries 2018 Imports
(MT)
2019 Imports
(MT)
Change (%)
Share in total (%,
2019)
Cumulated share (%,
2019) 80 Nigeria 61 289 377.1 0.0 99.9 81 Zambia 304 221 -27.1 0.0 99.9 82 Haiti 222 216 -2.9 0.0 99.9 83 Korea, Republic Of 123 214 74.3 0.0 99.9 84 Maldives 0 187 N.A. 0.0 99.9 85 Myanmar 201 150 -25.2 0.0 99.9 86 Zimbabwe 65 143 120.3 0.0 100.0 87 French Polynesia 138 142 3.2 0.0 100.0 88 El Salvador 95 132 38.9 0.0 100.0 89 Nepal 209 130 -37.7 0.0 100.0 90 Namibia 152 126 -17.1 0.0 100.0 91 Burundi 3 115 4088.3 0.0 100.0 92 Samoa 159 115 -27.6 0.0 100.0 93 Bangladesh 251 114 -54.5 0.0 100.0 94 Saudi Arabia 107 96 -10.2 0.0 100.0 95 Malaysia 20 69 243.9 0.0 100.0 96 United Arab Emirates 127 ‘806 62 -100.0 0.0 100.0 97 Comoros 26 62 137.0 0.0 100.0 98 Armenia 180 54 -69.8 0.0 100.0 99 Somalia 66 50 -24.1 0.0 100.0 100 Vanuatu 0 42 N.A. 0.0 100.0 101 Taiwan 27 37 37.0 0.0 100.0 102 Suriname 18 36 105.9 0.0 100.0 103 Belize 27 28 3.9 0.0 100.0 104 Seychelles 0 24 N.A. 0.0 100.0 105 Jordan 31 24 -22.9 0.0 100.0 106 Montenegro 22 21 -4.0 0.0 100.0 107 Fiji 57 20 -65.8 0.0 100.0 108 Guinea 0 18 N.A. 0.0 100.0 109 Lebanon 7 14 98.7 0.0 100.0 110 Guinea-Bissau 0 5 N.A. 0.0 100.0 111 Botswana 0 3 N.A. 0.0 100.0 112 Mauritius 2 3 33.6 0.0 100.0 113 Gambia 1 2 194.6 0.0 100.0 114 Singapore 66 2 -97.7 0.0 100.0 115 Saint Lucia 0 1 N.A. 0.0 100.0 116 New Caledonia 0 0 N.A. 0.0 100.0 117 Oman 0 0 -47.1 0.0 100.0 118 Afghanistan 0 0 -98.9 0.0 100.0 119 East Timor 55 0 -100.0 0.0 100.0 120 Netherlands Antilles 54 0 -100.0 0.0 100.0 121 Equatorial Guinea 46 0 -100.0 0.0 100.0 122 Solomon Islands 28 0 -100.0 0.0 100.0 123 Grenada 3 0 -100.0 0.0 100.0
Total 3‘230‘675 3’242’382 0.36
Source: Traces/European Commission 2020
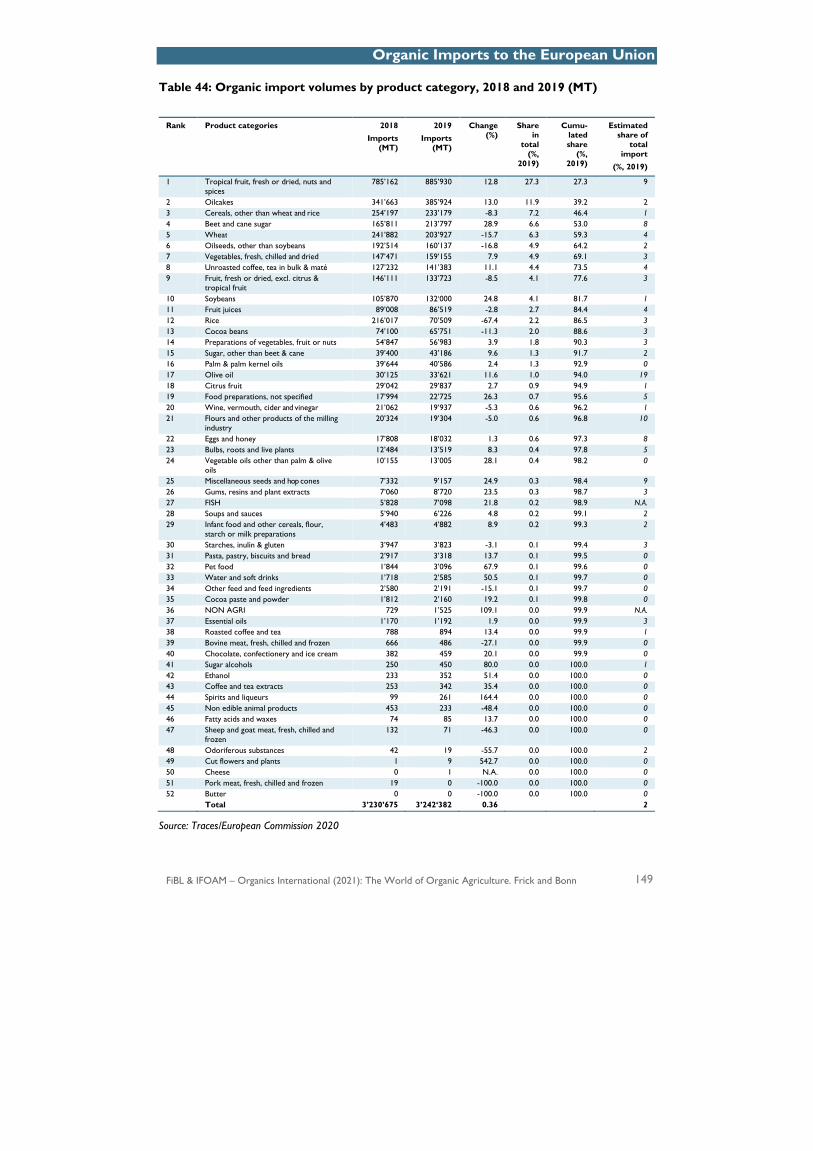
Organic Imports to the European Union
FiBL & IFOAM – Organics International (2021): The World of Organic Agriculture. Frick and Bonn 149
Table 44: Organic import volumes by product category, 2018 and 2019 (MT)
Rank Product categories 2018 Imports
(MT)
2019 Imports
(MT)
Change (%)
Share in
total (%,
2019)
Cumu-lated share
(%, 2019)
Estimated share of
total import
(%, 2019)
1 Tropical fruit, fresh or dried, nuts and spices
785’162 885’930 12.8 27.3 27.3 9
2 Oilcakes 341’663 385’924 13.0 11.9 39.2 2 3 Cereals, other than wheat and rice 254’197 233’179 -8.3 7.2 46.4 1 4 Beet and cane sugar 165’811 213’797 28.9 6.6 53.0 8 5 Wheat 241’882 203’927 -15.7 6.3 59.3 4 6 Oilseeds, other than soybeans 192’514 160’137 -16.8 4.9 64.2 2 7 Vegetables, fresh, chilled and dried 147’471 159’155 7.9 4.9 69.1 3 8 Unroasted coffee, tea in bulk & maté 127’232 141’383 11.1 4.4 73.5 4 9 Fruit, fresh or dried, excl. citrus &
tropical fruit 146’111 133’723 -8.5 4.1 77.6 3
10 Soybeans 105’870 132‘000 24.8 4.1 81.7 1 11 Fruit juices 89’008 86’519 -2.8 2.7 84.4 4 12 Rice 216’017 70’509 -67.4 2.2 86.5 3 13 Cocoa beans 74’100 65’751 -11.3 2.0 88.6 3 14 Preparations of vegetables, fruit or nuts 54’847 56’983 3.9 1.8 90.3 3 15 Sugar, other than beet & cane 39’400 43’186 9.6 1.3 91.7 2 16 Palm & palm kernel oils 39’644 40’586 2.4 1.3 92.9 0 17 Olive oil 30’125 33’621 11.6 1.0 94.0 19 18 Citrus fruit 29’042 29’837 2.7 0.9 94.9 1 19 Food preparations, not specified 17’994 22’725 26.3 0.7 95.6 5 20 Wine, vermouth, cider and vinegar 21’062 19’937 -5.3 0.6 96.2 1 21 Flours and other products of the milling
industry 20’324 19’304 -5.0 0.6 96.8 10
22 Eggs and honey 17’808 18’032 1.3 0.6 97.3 8 23 Bulbs, roots and live plants 12’484 13’519 8.3 0.4 97.8 5 24 Vegetable oils other than palm & olive
oils 10’155 13’005 28.1 0.4 98.2 0
25 Miscellaneous seeds and hop cones 7’332 9’157 24.9 0.3 98.4 9 26 Gums, resins and plant extracts 7’060 8’720 23.5 0.3 98.7 3 27 FISH 5’828 7’098 21.8 0.2 98.9 N.A. 28 Soups and sauces 5’940 6’226 4.8 0.2 99.1 2 29 Infant food and other cereals, flour,
starch or milk preparations 4’483 4’882 8.9 0.2 99.3 2
30 Starches, inulin & gluten 3’947 3’823 -3.1 0.1 99.4 3 31 Pasta, pastry, biscuits and bread 2’917 3’318 13.7 0.1 99.5 0 32 Pet food 1’844 3’096 67.9 0.1 99.6 0 33 Water and soft drinks 1’718 2’585 50.5 0.1 99.7 0 34 Other feed and feed ingredients 2’580 2’191 -15.1 0.1 99.7 0 35 Cocoa paste and powder 1’812 2’160 19.2 0.1 99.8 0 36 NON AGRI 729 1’525 109.1 0.0 99.9 N.A. 37 Essential oils 1’170 1’192 1.9 0.0 99.9 3 38 Roasted coffee and tea 788 894 13.4 0.0 99.9 1 39 Bovine meat, fresh, chilled and frozen 666 486 -27.1 0.0 99.9 0 40 Chocolate, confectionery and ice cream 382 459 20.1 0.0 99.9 0 41 Sugar alcohols 250 450 80.0 0.0 100.0 1 42 Ethanol 233 352 51.4 0.0 100.0 0 43 Coffee and tea extracts 253 342 35.4 0.0 100.0 0 44 Spirits and liqueurs 99 261 164.4 0.0 100.0 0 45 Non edible animal products 453 233 -48.4 0.0 100.0 0 46 Fatty acids and waxes 74 85 13.7 0.0 100.0 0 47 Sheep and goat meat, fresh, chilled and
frozen 132 71 -46.3 0.0 100.0 0
48 Odoriferous substances 42 19 -55.7 0.0 100.0 2 49 Cut flowers and plants 1 9 542.7 0.0 100.0 0 50 Cheese 0 1 N.A. 0.0 100.0 0 51 Pork meat, fresh, chilled and frozen 19 0 -100.0 0.0 100.0 0 52 Butter 0 0 -100.0 0.0 100.0 0 Total 3’230’675 3’242‘382 0.36 2
Source: Traces/European Commission 2020

150 FiBL & IFOAM – Organics International (2021): The World of Organic Agriculture. Frick and Bonn

FiBL & IFOAM – Organics International (2021): The World of Organic Agriculture. Frick and Bonn 151
Standards and Legislation,
Policy Support

Standards, Legislation, Policies › Public Standards and Regulations
152 FiBL & IFOAM – Organics International (2021): The World of Organic Agriculture. Frick and Bonn
Organic Agriculture Regulations Worldwide: Current Situation
CORNELIA KIRCHNER,1 JOELLE KATTO-ANDRIGHETTO2 AND FLÁVIA MOURA E CASTRO3
According to data collected by IFOAM – Organics International and FiBL, 72 countries had fully implemented organic regulations as of 2020. Twenty-two countries had regulations, which were not fully implemented, while 14 countries were in the process of drafting legislation (Table 45, Table 46).
Among the countries that passed new organic regulations in 2020 are Madagascar and Egypt. There are also countries that are going through major revisions of their existing regulations; among these are the European Union and the United States. Countries that have concluded significant amendments of their existing regulations in 2020 include the Philippines and Peru.
Table 45: Status of organic agriculture regulation: Number of countries by region 2020
Region Drafting Fully Implemented
Not fully Implemented
Total countries
Africa 5 1 4 10 Asia 7 10 11 28 Europe 39 4 43 Latin America and the Caribbean 2 16 3 21 North America 2 2 Oceania 4 4 Total 14 72 22 108
Source: IFOAM – Organics International 2021
In an increasingly regulated world and with a growing global organic market, trade and equivalence agreements are increasingly relevant and desired in order to lift trade barriers. In 2020, Taiwan was the most active actor in negotiating equivalence agreements. Taiwan’s revised organic regulation that came into force in May 2019 included a one-year timeline for converting existing unilateral recognitions by Taiwan into bilateral equivalency agreements; otherwise, they would expire. By autumn 2020 Taiwan had signed five new bilateral equivalency agreements with Japan, Australia,
1 Cornelia Kirchner, Policy & Guarantee Senior Coordinator, IFOAM – Organics International, 53113 Bonn, Germany, www.ifoam.bio, [email protected] 2 Joelle Katto-Andrighetto, Senior Manager Policy & Guarantee, IFOAM – Organics International, 53113 Bonn, Germany, www.ifoam.bio, [email protected] 3 Flávia Moura e Castro, Policy & Guarantee Senior Coordinator at IFOAM – Organics International, 53113 Bonn, Germany, www.ifoam.bio, [email protected]
Standards, Legislation, Policies › Public Standards and Regulations
FiBL & IFOAM – Organics International (2021): The World of Organic Agriculture. Frick and Bonn 153
Canada, New Zealand and the United States. With Brexit advancing, the United Kingdom is a new player entering trade agreement negotiations.1
New organic regulations were adopted in Madagascar, Egypt and Russia
New organic law passed in Madagascar ensures organic integrity without hindering growth
In May 2020, Madagascar approved its first organic regulation, the law No. 10/2019 of 28 November, 2019. The law was developed in close collaboration with the private sector, producer organizations, NGOs, certification bodies, research institutions, and corresponding Ministries. The law establishes the framework to develop a national organic standard for producers wishing to produce for the local market. However, it also recognizes the equivalence of other organic standards, particularly those already used for exports, so that the products certified against those standards will continue to be marketable as organic on the domestic market. Another strength of this organic law is that it encourages the participation of small producers in the sector by recognizing Participatory Guarantee Systems (PGS) as a valid means of certification for the domestic market. These are expected to be cheaper and more appropriate than third-party certification for small farmers aiming to operate in the domestic market. The next steps will be the development of complementary legislation, including the national organic standard and the development of the first national organic strategy for organic agriculture.
New organic law approved in Egypt
In January 2020, the Egyptian Parliament passed its first organic regulation. The law aims to limit the negative effects of farming methods that depend on synthetic chemicals in planting and animal feeding. Many details, including the production rules, control procedures and conditions for import and export still need to be defined.
Organic law came into force in Russia
In Russia, the organic regulation that was passed in July 2018 - Federal Law No. 280 - came into force in January 2020. For the first time, the law regulates production, storage, transportation, labelling, and marketing of organic products in the country. The law also includes the creation of a unified state registry for organic producers.
Important revisions are ongoing or were finalized in the US, the European Union, the Philippines, Peru and Mexico
Revision of the US Organic Regulation aims to strengthen organic enforcement
In August 2020, the US National Organic Program (NOP) published a proposal to revise the USDA organic regulation, with a view to strengthen oversight and enforcement in
1 Information about current equivalence agreements can be accessed at https://www.ifoam.bio/equivalence-tracker.
Standards, Legislation, Policies › Public Standards and Regulations
154 FiBL & IFOAM – Organics International (2021): The World of Organic Agriculture. Frick and Bonn
the organic supply chain. Among the main changes proposed in the first public draft are:
! Fewer exemptions from organic certification for handlers ! Mandatory use of electronic NOP import certificates ! Increased traceability and mass-balance/supply chain audits ! Revision of grower group requirements to standardize and strengthen oversight
The revision process is expected to continue well into 2021.
Revision process of the European Union (EU) organic regulation continues
The new EU organic regulation 2018/848 was adopted in 2018 when the basic act was published. Drafting of the secondary legislation – the implementing and delegated acts – for production, labelling, controls, and trade started in 2018 and will continue in 2021. The timelines for the new regulation to come into force are as follows:
! New EU regulation comes into force: 1. January 2022. ! Transition period for certification bodies to apply the EU Standard and move
from equivalence to compliance: up to three years from the date the regulations comes into force.
! Transition period for negotiation of trade agreements with countries currently recognized as equivalent: 5 years from the date the regulations comes into force.
Law that recognizes PGS in the Philippines is celebrated as achievement
In 2020 an amendment of the Organic Agriculture Law – the Republic Act 10068 from 2010 – was approved by the Senate. The amendment includes official recognition of PGS as a verification system for organic agriculture alongside third-party certification. The Philippines is among the world’s leading countries in terms of PGS implementation with a more than 15-year history. Many local government units actively support PGS. The system has proven to be a reliable tool to guarantee organic quality on the domestic market that is also accessible for small producers. This change in the law in favour of PGS recognition is the result of a decade of intense advocacy efforts by stakeholders from the organic sector in the Philippines. The rules applicable to the PGS initiatives in the country have been drafted in close consultation with the sector.
Amendment of organic law in Peru that recognizes PGS is met by criticism
Peru is another country that now officially recognizes PGS. In February 2020, the government approved an amendment to its organic regulation – law 29196 from 2012. The amendment recognizes PGS initiatives as certification entities for organic agriculture on the same level as third-party certification bodies. Despite having gained recognition, the law is viewed critically by many actors involved in PGS and the organic movement in Peru. They are concerned about the country’s existing PGS laws and structures being neglected and the heavy bureaucracy proposed. It is expected that many existing PGS groups will find it difficult to enter into the government recognition scheme and that barriers are high, especially for smallholders and remote initiatives.
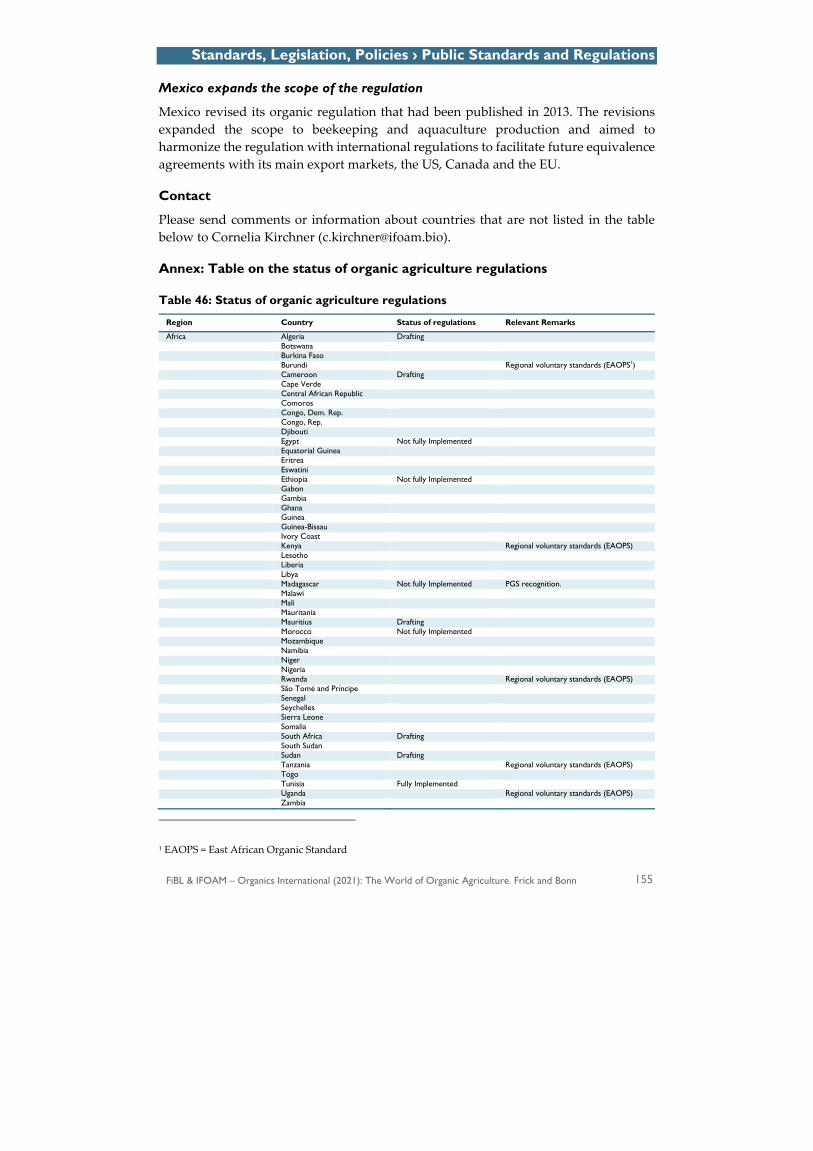
Standards, Legislation, Policies › Public Standards and Regulations
FiBL & IFOAM – Organics International (2021): The World of Organic Agriculture. Frick and Bonn 155
Mexico expands the scope of the regulation
Mexico revised its organic regulation that had been published in 2013. The revisions expanded the scope to beekeeping and aquaculture production and aimed to harmonize the regulation with international regulations to facilitate future equivalence agreements with its main export markets, the US, Canada and the EU.
Contact
Please send comments or information about countries that are not listed in the table below to Cornelia Kirchner ([email protected]).
Annex: Table on the status of organic agriculture regulations
Table 46: Status of organic agriculture regulations
Region Country Status of regulations Relevant Remarks
Africa Algeria Drafting Botswana Burkina Faso Burundi Regional voluntary standards (EAOPS1) Cameroon Drafting Cape Verde Central African Republic Comoros Congo, Dem. Rep. Congo, Rep. Djibouti Egypt Not fully Implemented Equatorial Guinea Eritrea Eswatini Ethiopia Not fully Implemented Gabon Gambia Ghana Guinea Guinea-Bissau Ivory Coast Kenya Regional voluntary standards (EAOPS) Lesotho Liberia Libya Madagascar Not fully Implemented PGS recognition. Malawi Mali Mauritania Mauritius Drafting Morocco Not fully Implemented Mozambique Namibia Niger Nigeria Rwanda Regional voluntary standards (EAOPS) São Tomé and Príncipe Senegal Seychelles Sierra Leone Somalia South Africa Drafting South Sudan Sudan Drafting Tanzania Regional voluntary standards (EAOPS) Togo Tunisia Fully Implemented Uganda Regional voluntary standards (EAOPS) Zambia
1 EAOPS = East African Organic Standard
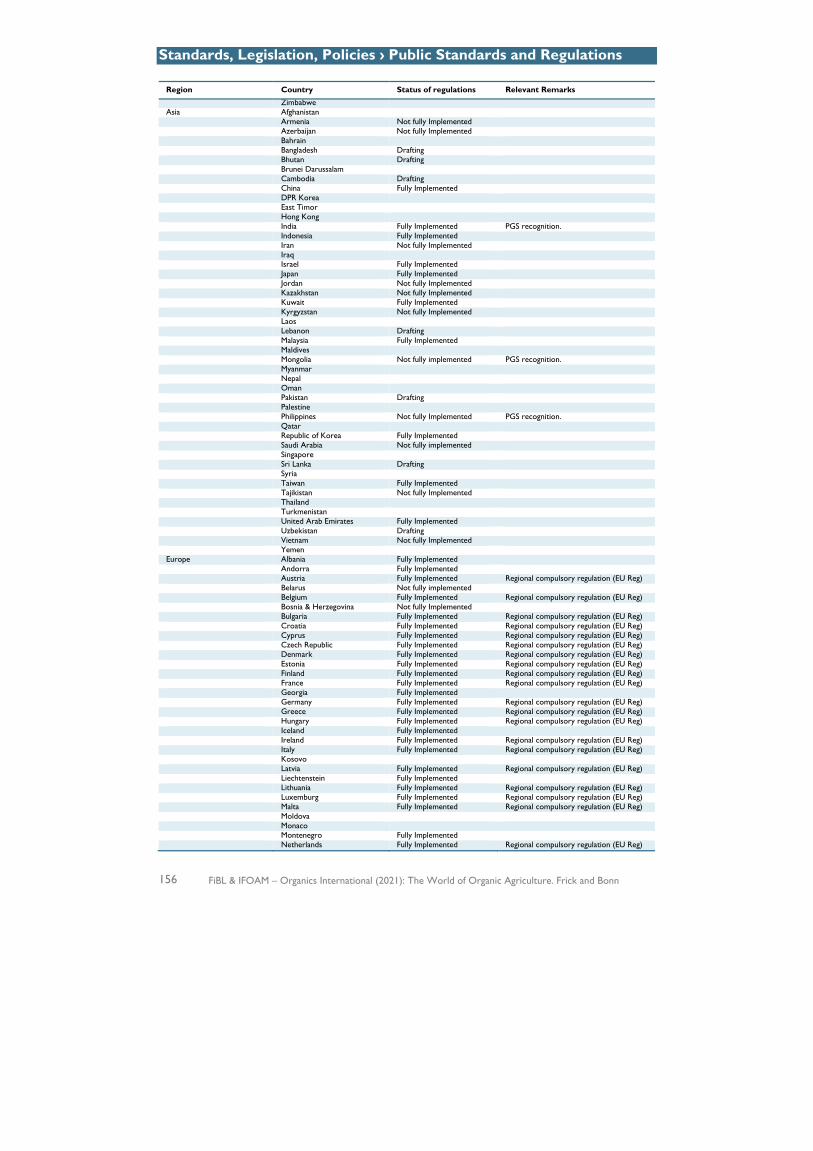
Standards, Legislation, Policies › Public Standards and Regulations
156 FiBL & IFOAM – Organics International (2021): The World of Organic Agriculture. Frick and Bonn
Region Country Status of regulations Relevant Remarks Zimbabwe Asia Afghanistan Armenia Not fully Implemented Azerbaijan Not fully Implemented Bahrain Bangladesh Drafting Bhutan Drafting Brunei Darussalam Cambodia Drafting China Fully Implemented DPR Korea East Timor Hong Kong India Fully Implemented PGS recognition. Indonesia Fully Implemented Iran Not fully Implemented Iraq Israel Fully Implemented Japan Fully Implemented Jordan Not fully Implemented Kazakhstan Not fully Implemented Kuwait Fully Implemented Kyrgyzstan Not fully Implemented Laos Lebanon Drafting Malaysia Fully Implemented Maldives Mongolia Not fully implemented PGS recognition. Myanmar Nepal Oman Pakistan Drafting Palestine Philippines Not fully Implemented PGS recognition. Qatar Republic of Korea Fully Implemented Saudi Arabia Not fully implemented Singapore Sri Lanka Drafting Syria Taiwan Fully Implemented Tajikistan Not fully Implemented Thailand Turkmenistan United Arab Emirates Fully Implemented Uzbekistan Drafting Vietnam Not fully Implemented Yemen Europe Albania Fully Implemented Andorra Fully Implemented Austria Fully Implemented Regional compulsory regulation (EU Reg) Belarus Not fully implemented Belgium Fully Implemented Regional compulsory regulation (EU Reg) Bosnia & Herzegovina Not fully Implemented Bulgaria Fully Implemented Regional compulsory regulation (EU Reg) Croatia Fully Implemented Regional compulsory regulation (EU Reg) Cyprus Fully Implemented Regional compulsory regulation (EU Reg) Czech Republic Fully Implemented Regional compulsory regulation (EU Reg) Denmark Fully Implemented Regional compulsory regulation (EU Reg) Estonia Fully Implemented Regional compulsory regulation (EU Reg) Finland Fully Implemented Regional compulsory regulation (EU Reg) France Fully Implemented Regional compulsory regulation (EU Reg) Georgia Fully Implemented Germany Fully Implemented Regional compulsory regulation (EU Reg) Greece Fully Implemented Regional compulsory regulation (EU Reg) Hungary Fully Implemented Regional compulsory regulation (EU Reg) Iceland Fully Implemented Ireland Fully Implemented Regional compulsory regulation (EU Reg) Italy Fully Implemented Regional compulsory regulation (EU Reg) Kosovo Latvia Fully Implemented Regional compulsory regulation (EU Reg) Liechtenstein Fully Implemented Lithuania Fully Implemented Regional compulsory regulation (EU Reg) Luxemburg Fully Implemented Regional compulsory regulation (EU Reg) Malta Fully Implemented Regional compulsory regulation (EU Reg) Moldova Monaco Montenegro Fully Implemented Netherlands Fully Implemented Regional compulsory regulation (EU Reg)
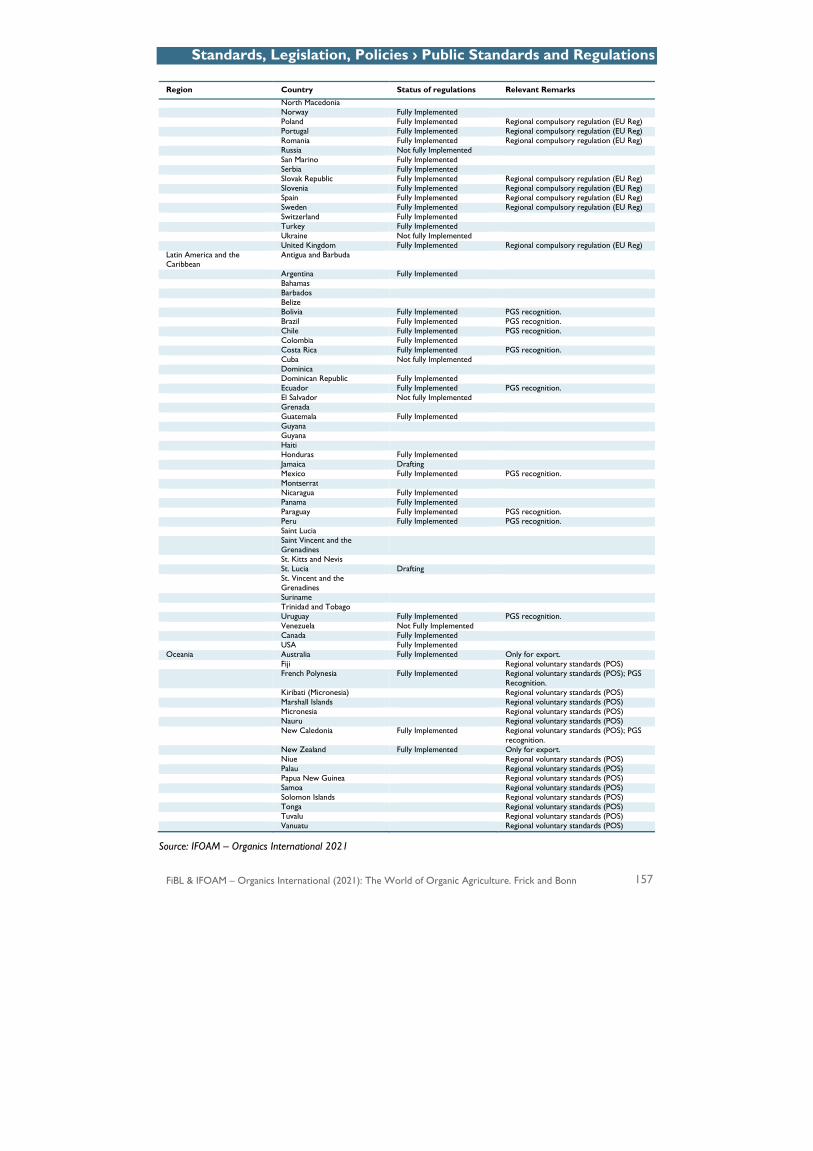
Standards, Legislation, Policies › Public Standards and Regulations
FiBL & IFOAM – Organics International (2021): The World of Organic Agriculture. Frick and Bonn 157
Region Country Status of regulations Relevant Remarks North Macedonia Norway Fully Implemented Poland Fully Implemented Regional compulsory regulation (EU Reg) Portugal Fully Implemented Regional compulsory regulation (EU Reg) Romania Fully Implemented Regional compulsory regulation (EU Reg) Russia Not fully Implemented San Marino Fully Implemented Serbia Fully Implemented Slovak Republic Fully Implemented Regional compulsory regulation (EU Reg) Slovenia Fully Implemented Regional compulsory regulation (EU Reg) Spain Fully Implemented Regional compulsory regulation (EU Reg) Sweden Fully Implemented Regional compulsory regulation (EU Reg) Switzerland Fully Implemented Turkey Fully Implemented Ukraine Not fully Implemented United Kingdom Fully Implemented Regional compulsory regulation (EU Reg) Latin America and the Caribbean
Antigua and Barbuda
Argentina Fully Implemented Bahamas Barbados Belize Bolivia Fully Implemented PGS recognition. Brazil Fully Implemented PGS recognition. Chile Fully Implemented PGS recognition. Colombia Fully Implemented Costa Rica Fully Implemented PGS recognition. Cuba Not fully Implemented Dominica Dominican Republic Fully Implemented Ecuador Fully Implemented PGS recognition. El Salvador Not fully Implemented Grenada Guatemala Fully Implemented Guyana Guyana Haiti Honduras Fully Implemented Jamaica Drafting Mexico Fully Implemented PGS recognition. Montserrat Nicaragua Fully Implemented Panama Fully Implemented Paraguay Fully Implemented PGS recognition. Peru Fully Implemented PGS recognition. Saint Lucia Saint Vincent and the
Grenadines
St. Kitts and Nevis St. Lucia Drafting St. Vincent and the
Grenadines
Suriname Trinidad and Tobago Uruguay Fully Implemented PGS recognition. Venezuela Not Fully Implemented Canada Fully Implemented USA Fully Implemented Oceania Australia Fully Implemented Only for export. Fiji Regional voluntary standards (POS) French Polynesia Fully Implemented Regional voluntary standards (POS); PGS
Recognition. Kiribati (Micronesia) Regional voluntary standards (POS) Marshall Islands Regional voluntary standards (POS) Micronesia Regional voluntary standards (POS) Nauru Regional voluntary standards (POS) New Caledonia Fully Implemented Regional voluntary standards (POS); PGS
recognition. New Zealand Fully Implemented Only for export. Niue Regional voluntary standards (POS) Palau Regional voluntary standards (POS) Papua New Guinea Regional voluntary standards (POS) Samoa Regional voluntary standards (POS) Solomon Islands Regional voluntary standards (POS) Tonga Regional voluntary standards (POS) Tuvalu Regional voluntary standards (POS) Vanuatu Regional voluntary standards (POS)
Source: IFOAM – Organics International 2021

Standards, Legislation, Policies › PGS
158 FiBL & IFOAM – Organics International (2021): The World of Organic Agriculture. Frick and Bonn
Participatory Guarantee Systems in 2020
FLÁVIA MOURA E CASTRO,1 SARA ANSELMI,2 CORNELIA KIRCHNER3 AND FEDERICA VARINI4
Participatory Guarantee Systems (PGS) are locally focused quality assurance systems. They certify producers based on the active participation of stakeholders and are built on a foundation of trust, social networks, and knowledge exchange (IFOAM definition, 20085). Despite the difficulties related to the impact of the COVID-19 pandemic in 2020, the number of PGS initiatives and producers involved in and certified by them has been growing on all regions of the world (for definitions see the end of the article). They represent today a well-established guarantee system for organic agriculture in many countries.
In 2020, Peru, the Philippines and Madagascar included PGS as recognised guarantee systems to ensure the organic quality of products at the national level. India and Mongolia are also in the process of implementing recently approved regulations, including PGS, bringing the total number of countries and territories that recognise PGS in their legal framework for organic agriculture to 15.6
IFOAM – Organics International is the only organisation collecting data about PGS on a global level. During 2020 many PGS initiatives were affected by the measures restricting contact and physical interaction, which were adopted worldwide due to the COVID-19 pandemic. Regular meetings and peer reviews could not be carried out as planned or not including all their members. This is partly reflected in the data reported here, as it was not possible to collect recent figures for all countries. Notwithstanding, the overall trend towards an increase in the number of PGS initiatives and producers certified is maintained and, to date,7 we have recorded in our PGS database 235 PGS initiatives in 77 countries, with at least 1’153’220 producers involved and 1’110’964
1 Flávia Moura e Castro, Policy & Guarantee Senior Coordinator at IFOAM – Organics International, 53113 Bonn, Germany, www.ifoam.bio, [email protected] 2 Sara Anselmi, Policy & Guarantee Junior Coordinator at IFOAM – Organics International, 53113 Bonn, Germany, www.ifoam.bio, [email protected] 3 Cornelia Kirchner, Policy & Guarantee Senior Coordinator at IFOAM – Organics International, 53113 Bonn, Germany, www.ifoam.bio, [email protected] 4 Federica Varini, Policy & Guarantee Coordinator at IFOAM – Organics International, 53113 Bonn, Germany, www.ifoam.bio, ([email protected]) 5 More information about the IFOAM definition of organic agriculture is available on the IFOAM website at https://www.ifoam.bio/en/organic-landmarks/definition-organic-agriculture. A definition of PGS is available at https://www.ifoam.bio/en/organic-policy-guarantee/participatory-guarantee-systems-pgs, 6 The 15 countries and territories are: Bolivia, Brazil, Chile, Costa Rica, Ecuador, India, Madagascar, Mexico, Mongolia, Paraguay, Peru, Philippines, Uruguay, French Polynesia and New Caledonia. Some of these have recently approved regulations that are not yet fully implemented. 7 Data collection was completed on 10 December 2020.

Standards, Legislation, Policies > PGS
FiBL & IFOAM – Organics International (2021): The World of Organic Agriculture. Frick and Bonn 159
producers certified (Figure 56). It is estimated that these producers manage over 755’000 ha of land1.
Figure 56: Development of PGS certified producers worldwide
Source: IFOAM – Organics International 2020
The absolute majority of PGS certified producers and producers involved in PGS are found in India, where according to the data from the Indian Ministry of Agriculture and Farmers Welfare, a total of 1’078’535 PGS certified producers manage 614’504 hectares of agricultural land. These figures represent a significant growth compared to 2019: an increase of over 120 percent in the number of PGS certified producers and a 65% increase in hectares of PGS certified area in India. Alongside the governmental PGS initiative, the civil society organisations gathered under “PGS Organic Council” in India certified a total of 5’553 producers, of which 632 are also included in the governmental program. The total of PGS certified producers in India has reached the impressive figure of 1’083’4562.
Worldwide, there are seven other countries with more than 1’000 producers certified by PGS: Brazil (7’821), Thailand (2’029), Uganda (2’044), Peru (1’790), Bolivia (1’287), Vanuatu (1’269) and France (1’147).
1 Unfortunately, data referring to the area under organic management that is PGS certified is not available for all PGS initiatives and countries. 2 Data collection was carried out until 10 December 2020.
6’00
0
9’00
0
11’0
00
25’0
00
17’0
00
46’9
45
76’0
00
76’7
50
142’
955
496’
104
1’11
0’96
4
0
200’000
400’000
600’000
800’000
1’000’000
1’200’000
2010 2011 2012 2013 2014 2015 2016 2017 2018 2019 2020
Prod
ucer
s
Development of PGS-certified producers worldwideSource: IFOAM – Organics International 2020

Standards, Legislation, Policies › PGS
160 FiBL & IFOAM – Organics International (2021): The World of Organic Agriculture. Frick and Bonn
Regional development
Africa
This region has seen an overall increase in the figures compared to what we reported in 2019: it is estimated that there are 20’161 producers involved in PGS, 5’345 of whom are certified in African countries. Eleven PGS initiatives are under development in and 21 are operational in the region. Cameroon is now also included in this overview, where the PGS initiative Etso Mbong, involving 170 producers, is currently operational and has granted PGS certification to 22 of them.
Burkina Faso, Ghana, Togo and São Tomé and Príncipe, the four countries involved in the project Organic Market for Development (OM4D),1 all reported increased figures for the total producers involved in PGS. In Burkina Faso, the total of PGS certified producers almost doubled since the past year. In Ghana, the first 18 PGS certificates have been granted.
Asia
Asia counts more PGS producers than any other region, with at least 1’102’198 producers involved, of which 1’088’432 are certified: over 600’000 more than what was reported in 2019. This development is related to the continuous increase in numbers of farmers joining the governmental initiative “PGS-India” implemented by the National Center of Organic Farming (NCOF) in the past two years, since the approval of the new legal framework that recognises PGS alongside third-party certification for organic certification in the domestic market.2 After India, the highest numbers for producers involved in PGS in Asia are now found in Kyrgyzstan (3000), which has also seen an increase in the numbers of producers certified (682 in 2019 to 889 in 2020), Thailand (2’155) and South Korea (2’000). In terms of certified producers, Thailand (2’029) continues to hold second place in the region, after India. Asia remains the second region, after Latin and Central America, with the highest number of operational PGS initiatives (35).
Europe and North America
The situation presented here for Europe and North America3 refers mainly to data collected in 2019 and updates or new entries reported throughout 2020 via the Global Map of PGS initiatives4. There has been a minor increase in most indicators in Europe: 2’070 is the total number of producers involved in PGS, of whom 1’667 are certified. The majority of them are located in France, where 1’147 are certified producers. The
1 This project is implemented by IFOAM – Organics International and Agro Eco – Louis Bolk Institute, together with local and regional partners, and it is funded by the Dutch Ministry of Foreign Affairs; to learn more visit: https://www.ifoam.bio/en/OM4D 2 The number of certified producers and the hectares certified organic by PGS-India are constantly updated on the national PGS platform: https://www.pgsindia-ncof.gov.in/ 3 No relevant updates are available for this region. 4 To access the map, please visit: https://pgs.ifoam.bio/
Standards, Legislation, Policies > PGS
FiBL & IFOAM – Organics International (2021): The World of Organic Agriculture. Frick and Bonn 161
number of PGS initiatives under development reported this year is also slightly higher: 14 in 2020, instead of 12 in 2019.
Latin and Central America
Brazil and Chile are the two countries responsible for the increase in overall PGS figures observed in this region in 2020. The total number of producers involved in PGS initiatives has increased by 1’437, reaching 23’584, among which 12’609 are certified producers (14% increase compared to 2019). The total area that is PGS certified in the region is likely to have increased, but unfortunately, we do not have access to this information.
Latin and Central America is again the region with the highest number of operational PGS initiatives, 88 in total. While six of these new PGS initiatives are based in Chile (4) and Brazil (2), one is based in El Salvador and has granted PGS certificates for the first time in 2020.
In 2020 Peru, the country in the region with the second-highest number of producers certified (at least 1’790 producers certified), approved an amendment to the organic regulation (Law 29196 from 2012) that recognises PGS initiatives as certification entities for organic agriculture at the same level as third-party certification bodies. Even though advocacy towards this recognition had been ongoing for over a decade, various national PGS stakeholders have manifested concern towards what they see as a neglect of the law for the country's existing PGS structures and the heavy bureaucracy proposed (see contribution by Kirchner et al. on organic regulations, page 152).
Oceania
Oceania saw a decrease of 22 percent in total of PGS certified producers compared to 2019: PGS initiatives in the region reported 2’256 producers and at least 3’447 producers involved in PGS. The reduction in PGS certified producers in this region is seen mainly in Fiji (405 less than in 2019) and French Polynesia1. Vanuatu remains the country in the region with the highest number of PGS certified producers (1’269). A decrease has also been observed in the total area that is managed by PGS certified producers: 4’531 ha compared to 7’214 hectares in 2019.
General notes on the data
Every two years IFOAM – Organics International conducts a global PGS survey. The last survey was conducted in 2019; therefore, most PGS figures are from October 2019. Additional data were collected through bilateral communication with PGS initiatives, competent authorities and PGS experts. If new data is not received, data from the previous year or older data is used, unless there is no update for several years. In such cases, initiatives might be considered no longer active and thus excluded from the
1 The decrease observed for French Polynesia is most likely related to the fact that the over 200 producers, members of 7 local groups, who were considered as individual operators in previous reports. For 2020 only the 7 groups were included in the overview.
Standards, Legislation, Policies › PGS
162 FiBL & IFOAM – Organics International (2021): The World of Organic Agriculture. Frick and Bonn
current statistics. When PGS are recognised under national organic regulation, data collected and published by competent authorities is used, this is the case in Brazil,1 Chile,2 Bolivia,3 Costa Rica,4 Mexico,5 and India.6
Definitions used
PGS initiative: Entity or organisation that has defined/chosen/adopted a common set of standards for organic agriculture and a common set of procedures (i.e. they have a common manual describing those procedures), and that has a coordination body (i.e. secretary, association) that has the overview of the data coming from the regional/subgroups, local groups or the individual farmers directly. A PGS initiative will also typically use one common label to identify the products of their farmers as organic and/or a logo that is used by other PGS initiatives, such as a national/regional organic logo.
Explanatory note: A PGS initiative can be composed of one single local group, especially at the initial stage of development. Even though it is common for PGS initiatives to be composed of various local groups, it is also possible that the PGS producers in a PGS initiative work together based on geographic proximity or technical expertise, without forming a local group.
PGS status: Setting up a PGS is a long process and requires two or more years before the producers involved can be fully certified. In our data collection, we distinguish between two situations:
(a) Operational PGS: a PGS that is implementing a functional certification system to certify their producers and has emitted at least one certificate to one farmer.
(b) PGS under development: a PGS that is in the process of developing a functional certification system to certify their producers and has not yet emitted any certificates.
Number of producers within a PGS: There are two categories of producers considered for a PGS initiative:
1 Ministério da Agricultura, Pecuária e Abastecimento, Brasil: Cadastro Nacional de Produtores Orgânicos. Available at http://www.agricultura.gov.br/assuntos/sustentabilidade/organicos/cadastro-nacional-produtores-organicos 2 Servicio Agrícola y Ganadero, Chile: Certificación de Productos orgánicos. Available at http://www.sag.cl/ambitos-de-accion/certificacion-de-productos-organicos/132/registros 3 Consejo Nacional de Producción Ecológica (UC-CNAPE), email communication, data for 2016. 4 Servicio Fitosanitario del Estado, MAG, Costa Rica: Registrados en Arao - Certificación Participativa. Available at https://www.sfe.go.cr/SitePages/ARAO/InicioARAO.aspx 5 Servicio Nacional de Sanidad, Inocuidad y Calidad Agroalimentaria, Mexico: Padrón de Organismos de Certificación Participativa de productos orgánicos a pequeños productores y producción familiar. 6 Department of Agriculture & Cooperation, India: Participatory Guarantee System for India. Available at http://pgsindia-ncof.gov.in
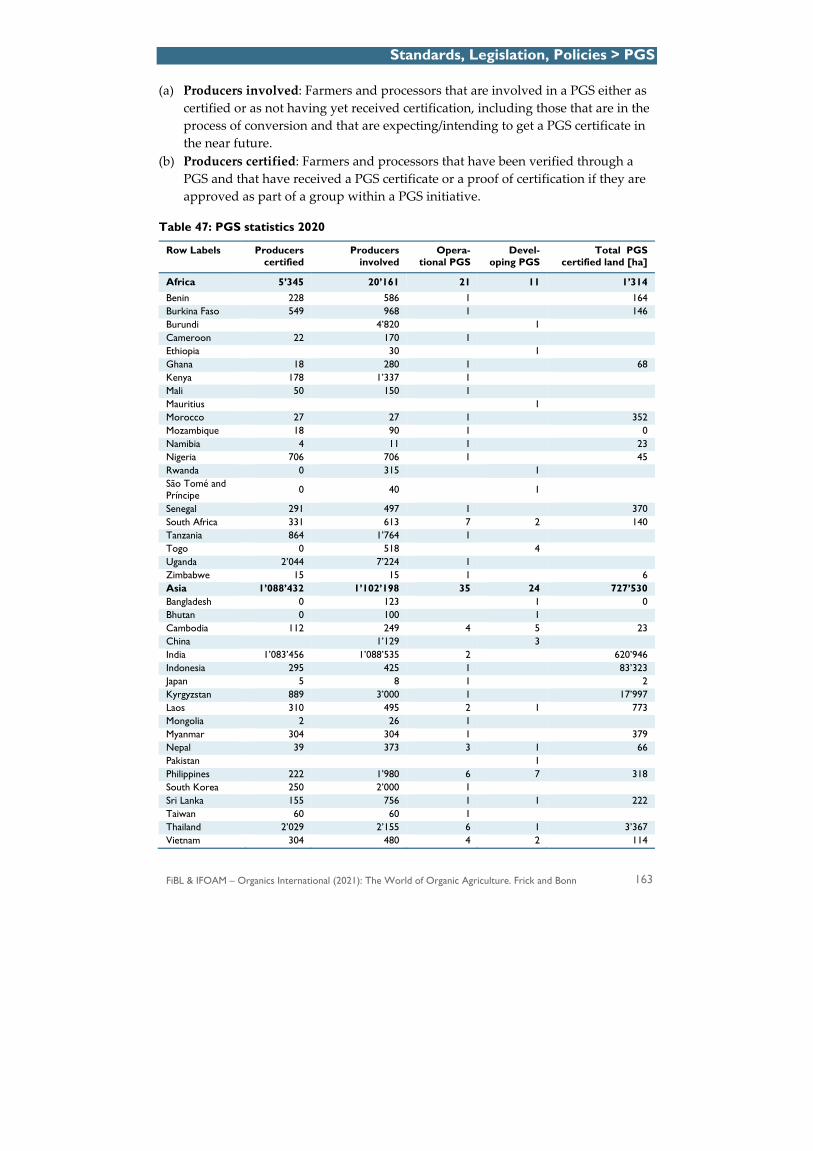
Standards, Legislation, Policies > PGS
FiBL & IFOAM – Organics International (2021): The World of Organic Agriculture. Frick and Bonn 163
(a) Producers involved: Farmers and processors that are involved in a PGS either as certified or as not having yet received certification, including those that are in the process of conversion and that are expecting/intending to get a PGS certificate in the near future.
(b) Producers certified: Farmers and processors that have been verified through a PGS and that have received a PGS certificate or a proof of certification if they are approved as part of a group within a PGS initiative.
Table 47: PGS statistics 2020
Row Labels Producers certified
Producers involved
Opera-tional PGS
Devel-oping PGS
Total PGS certified land [ha]
Africa 5’345 20’161 21 11 1’314 Benin 228 586 1 164 Burkina Faso 549 968 1 146 Burundi 4’820 1
Cameroon 22 170 1 Ethiopia 30 1
Ghana 18 280 1 68 Kenya 178 1’337 1 Mali 50 150 1 Mauritius 1
Morocco 27 27 1 352 Mozambique 18 90 1 0 Namibia 4 11 1 23 Nigeria 706 706 1 45 Rwanda 0 315 1
São Tomé and Príncipe 0 40 1
Senegal 291 497 1 370 South Africa 331 613 7 2 140 Tanzania 864 1’764 1 Togo 0 518 4
Uganda 2’044 7’224 1 Zimbabwe 15 15 1 6 Asia 1’088’432 1’102’198 35 24 727’530 Bangladesh 0 123 1 0 Bhutan 0 100 1
Cambodia 112 249 4 5 23 China 1’129 3
India 1’083’456 1’088’535 2 620’946 Indonesia 295 425 1 83’323 Japan 5 8 1 2 Kyrgyzstan 889 3’000 1 17’997 Laos 310 495 2 1 773 Mongolia 2 26 1 Myanmar 304 304 1 379 Nepal 39 373 3 1 66 Pakistan 1
Philippines 222 1’980 6 7 318 South Korea 250 2’000 1 Sri Lanka 155 756 1 1 222 Taiwan 60 60 1 Thailand 2’029 2’155 6 1 3’367 Vietnam 304 480 4 2 114
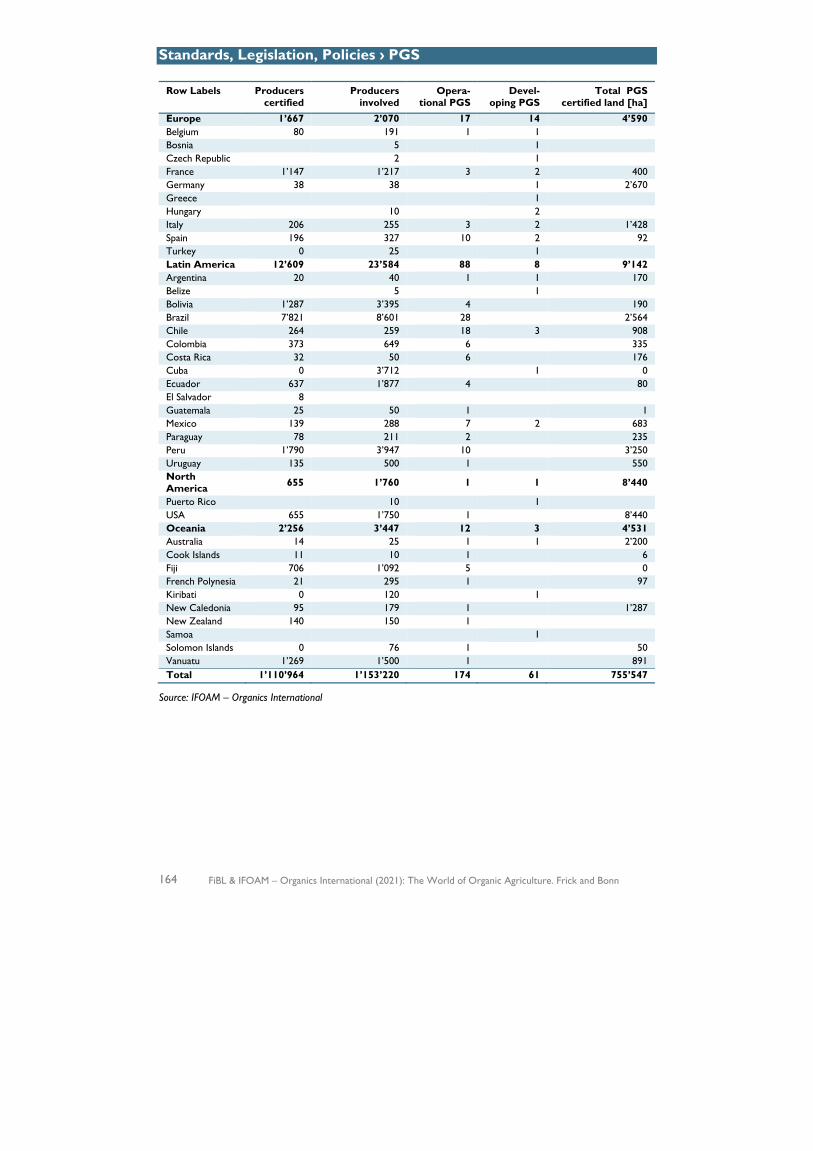
Standards, Legislation, Policies › PGS
164 FiBL & IFOAM – Organics International (2021): The World of Organic Agriculture. Frick and Bonn
Row Labels Producers certified
Producers involved
Opera-tional PGS
Devel-oping PGS
Total PGS certified land [ha]
Europe 1’667 2’070 17 14 4’590 Belgium 80 191 1 1
Bosnia 5 1
Czech Republic 2 1
France 1’147 1’217 3 2 400 Germany 38 38 1 2’670 Greece 1
Hungary 10 2
Italy 206 255 3 2 1’428 Spain 196 327 10 2 92 Turkey 0 25 1
Latin America 12’609 23’584 88 8 9’142 Argentina 20 40 1 1 170 Belize 5 1
Bolivia 1’287 3’395 4 190 Brazil 7’821 8’601 28 2’564 Chile 264 259 18 3 908 Colombia 373 649 6 335 Costa Rica 32 50 6 176 Cuba 0 3’712 1 0 Ecuador 637 1’877 4 80 El Salvador 8 Guatemala 25 50 1 1 Mexico 139 288 7 2 683 Paraguay 78 211 2 235 Peru 1’790 3’947 10 3’250 Uruguay 135 500 1 550 North America 655 1’760 1 1 8’440
Puerto Rico 10 1
USA 655 1’750 1 8’440 Oceania 2’256 3’447 12 3 4’531 Australia 14 25 1 1 2’200 Cook Islands 11 10 1 6 Fiji 706 1’092 5 0 French Polynesia 21 295 1 97 Kiribati 0 120 1
New Caledonia 95 179 1 1’287 New Zealand 140 150 1 Samoa 1
Solomon Islands 0 76 1 50 Vanuatu 1’269 1’500 1 891 Total 1’110’964 1’153’220 174 61 755’547
Source: IFOAM – Organics International
Standards, Legislation, Policies > Demeter Statistics
FiBL & IFOAM – Organics International (2021): The World of Organic Agriculture. Frick and Bonn 165
Demeter International – Current Statistics
CHRISTOPH SIMPFENDÖRFER1 AND SARAH FISCHER2
Demeter is the only ecological association that has built up a worldwide network of individual certification organisations. In 1997 Demeter International was founded for closer cooperation in the legal, economic and spiritual spheres. The joint organisation, which is now the Biodynamic Federation – Demeter International, has 45 member organisations in 36 countries working biodynamically. Of these, 19 are certifying organisations. In all other countries, the International Certification Office (ICO) is certifying. There are currently 6’400 Demeter farmers with more than 220’000 hectares in 62 countries (Table 48, Table 49).
The Biodynamic Federation is a non-profit organisation, and its member organisations work together in the spirit of an international confederation with democratic principles. Membership requires a functioning Demeter certification programme. Associations which support the objectives of Biodynamic Federation - Demeter International can be elected as associated members. Its basis is the Biodynamic agriculture method, originated by Rudolf Steiner in his “Agriculture Course” given in Koberwitz in 1924, and developed further in practice and research.
The main tasks of Biodynamic Federation - Demeter International are:
• Development and approval of International Demeter Standards for production and processing as minimum requirements for the worldwide trade of Demeter products,
• International registration and protection of the Demeter trademark, • Certification of single farms/operations in countries without their own Demeter
organisation, • Harmonisation of the Demeter certification program - worldwide, • Commitment to advancing the public understanding and acceptance of the
Biodynamic method in relevant international institutions, • Support for the establishment of autonomous Biodynamic associations and
Demeter organisations where none exist.
Demeter has seen continuous growth in certified farms over the past decades. Since the turn of the millennium, the number of Demeter farms worldwide has increased by around 3’500 to almost 6’500 (Figure 57, Figure 58). The latest developments show a strong interest in Demeter certification. As a result of the growth in recent years, today, more than 220’000 hectares of agricultural land is cultivated biodynamically. Demeter
1 Christoph Simpfendörfer, Demeter-International e.V., Office Echterdingen, Hauptstraße 82, 70771 Echterdingen, Germany, www.demeter.net 2 Sarah Fischer, Demeter-International e.V., Office Echterdingen, Hauptstraße 82, 70771 Echterdingen, Germany, www.demeter.net

Standards, Legislation, Policies > Demeter Statistics
166 FiBL & IFOAM – Organics International (2021): The World of Organic Agriculture. Frick and Bonn
bananas, for example, are currently a very dynamic sector. Due to the great interest in the conversion and the newly created distribution channels, large areas have been converted to biodynamic cultivation.
Figure 57: Development of the number of Demeter-certified farms
Source: Demeter International
Figure 58: Development of the Demeter-certified area
Source: Demeter International
2’78
52’
827
2’81
32’
931
2’98
83’
016
3’22
33’
303
3’28
2 4’05
24’
068
4’21
54’
386
4’58
34’
637
4’74
24’
800
4’92
04’
950
5’09
15’
279
5’38
7 5’99
86’
429
0
1’000
2’000
3’000
4’000
5’000
6’000
7’000
1997
1998
1999
2000
2001
2002
2003
2004
2005
2006
2007
2008
2009
2010
2011
2012
2013
2014
2015
2016
2017
2018
2019
2020
Farm
s
Development of Demeter-certified farmsSource: Demeter International 2020
87’1
0188
’539
92’9
7796
’837
98’5
3310
0’58
810
6’97
010
1’99
210
4’99
411
8’70
912
1’23
912
8’39
114
2’37
314
0’35
214
4’33
514
7’00
915
3’24
615
6’40
016
1’07
417
0’83
318
0’70
618
7’54
919
1’23
022
0’72
5
0
50’000
100’000
150’000
200’000
250’000
1997
1998
1999
2000
2001
2002
2003
2004
2005
2006
2007
2008
2009
2010
2011
2012
2013
2014
2015
2016
2017
2018
2019
2020
Hec
tare
s
Development of the Demeter-certified areaSource: Demeter International 2020
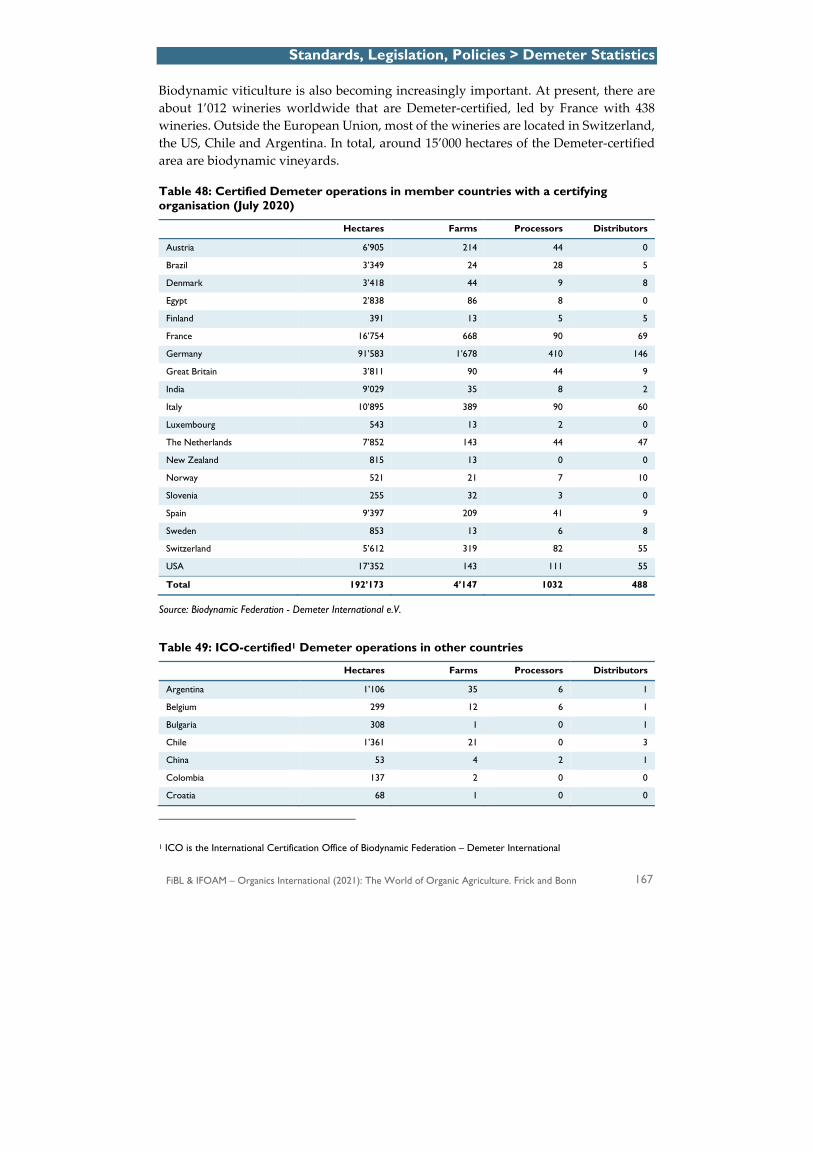
Standards, Legislation, Policies > Demeter Statistics
FiBL & IFOAM – Organics International (2021): The World of Organic Agriculture. Frick and Bonn 167
Biodynamic viticulture is also becoming increasingly important. At present, there are about 1’012 wineries worldwide that are Demeter-certified, led by France with 438 wineries. Outside the European Union, most of the wineries are located in Switzerland, the US, Chile and Argentina. In total, around 15’000 hectares of the Demeter-certified area are biodynamic vineyards.
Table 48: Certified Demeter operations in member countries with a certifying organisation (July 2020)
Hectares Farms Processors Distributors
Austria 6’905 214 44 0
Brazil 3’349 24 28 5
Denmark 3’418 44 9 8
Egypt 2’838 86 8 0
Finland 391 13 5 5
France 16’754 668 90 69
Germany 91’583 1’678 410 146
Great Britain 3’811 90 44 9
India 9’029 35 8 2
Italy 10’895 389 90 60
Luxembourg 543 13 2 0
The Netherlands 7’852 143 44 47
New Zealand 815 13 0 0
Norway 521 21 7 10
Slovenia 255 32 3 0
Spain 9’397 209 41 9
Sweden 853 13 6 8
Switzerland 5’612 319 82 55
USA 17’352 143 111 55
Total 192’173 4’147 1032 488
Source: Biodynamic Federation - Demeter International e.V.
Table 49: ICO-certified1 Demeter operations in other countries
Hectares Farms Processors Distributors
Argentina 1’106 35 6 1
Belgium 299 12 6 1
Bulgaria 308 1 0 1
Chile 1’361 21 0 3
China 53 4 2 1
Colombia 137 2 0 0
Croatia 68 1 0 0
1 ICO is the International Certification Office of Biodynamic Federation – Demeter International
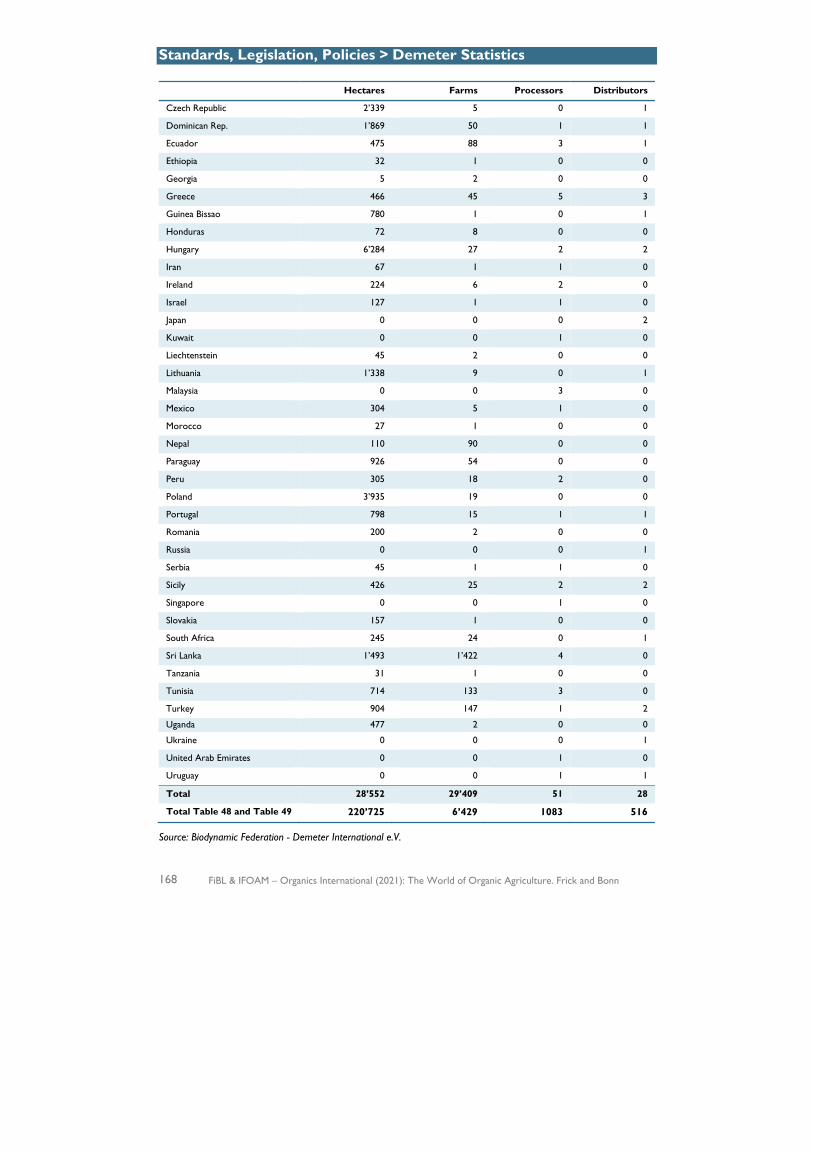
Standards, Legislation, Policies > Demeter Statistics
168 FiBL & IFOAM – Organics International (2021): The World of Organic Agriculture. Frick and Bonn
Hectares Farms Processors Distributors
Czech Republic 2’339 5 0 1
Dominican Rep. 1’869 50 1 1
Ecuador 475 88 3 1
Ethiopia 32 1 0 0
Georgia 5 2 0 0
Greece 466 45 5 3
Guinea Bissao 780 1 0 1
Honduras 72 8 0 0
Hungary 6’284 27 2 2
Iran 67 1 1 0
Ireland 224 6 2 0
Israel 127 1 1 0
Japan 0 0 0 2
Kuwait 0 0 1 0
Liechtenstein 45 2 0 0
Lithuania 1’338 9 0 1
Malaysia 0 0 3 0
Mexico 304 5 1 0
Morocco 27 1 0 0
Nepal 110 90 0 0
Paraguay 926 54 0 0
Peru 305 18 2 0
Poland 3’935 19 0 0
Portugal 798 15 1 1
Romania 200 2 0 0
Russia 0 0 0 1
Serbia 45 1 1 0
Sicily 426 25 2 2
Singapore 0 0 1 0
Slovakia 157 1 0 0
South Africa 245 24 0 1
Sri Lanka 1’493 1’422 4 0
Tanzania 31 1 0 0
Tunisia 714 133 3 0
Turkey 904 147 1 2
Uganda 477 2 0 0
Ukraine 0 0 0 1
United Arab Emirates 0 0 1 0
Uruguay 0 0 1 1
Total 28’552 29’409 51 28
Total Table 48 and Table 49 220’725 6’429 1083 516
Source: Biodynamic Federation - Demeter International e.V.
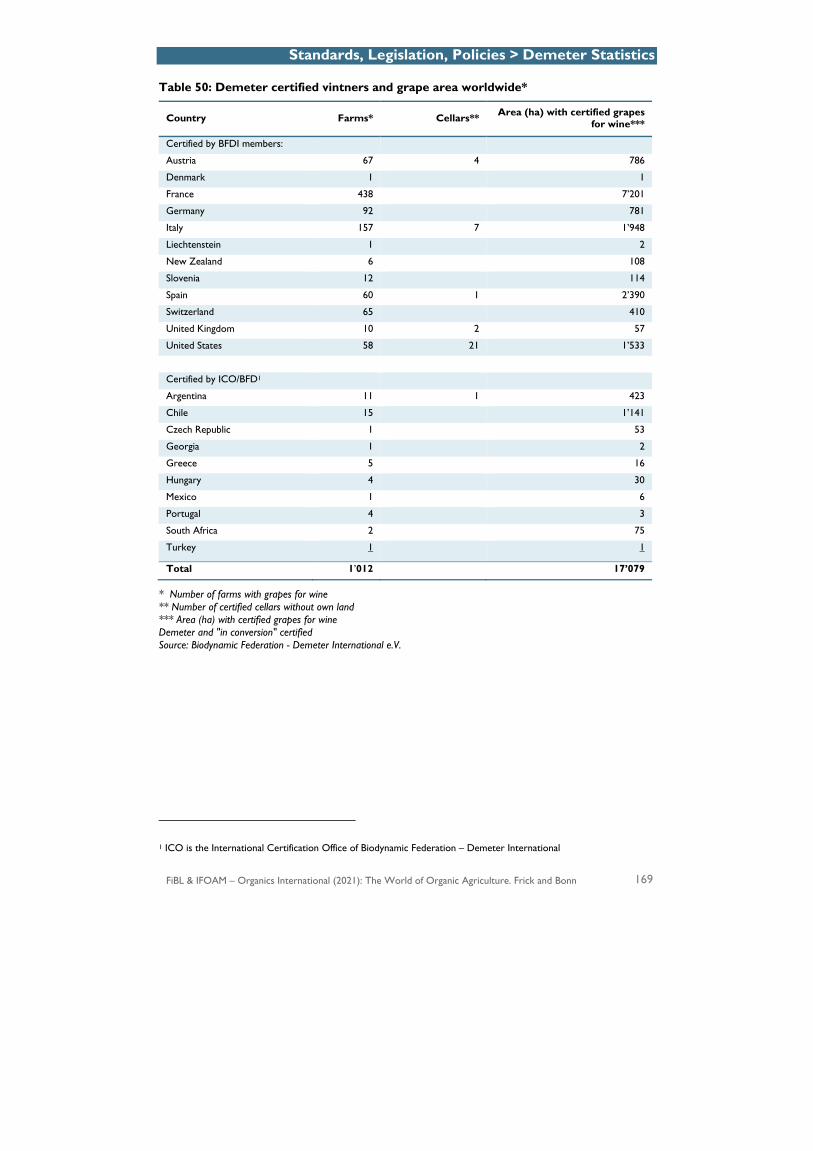
Standards, Legislation, Policies > Demeter Statistics
FiBL & IFOAM – Organics International (2021): The World of Organic Agriculture. Frick and Bonn 169
Table 50: Demeter certified vintners and grape area worldwide*
Country Farms* Cellars** Area (ha) with certified grapes for wine***
Certified by BFDI members:
Austria 67 4 786
Denmark 1 1
France 438 7’201
Germany 92 781
Italy 157 7 1’948
Liechtenstein 1 2
New Zealand 6 108
Slovenia 12 114
Spain 60 1 2’390
Switzerland 65 410
United Kingdom 10 2 57
United States 58 21 1’533
Certified by ICO/BFD1
Argentina 11 1 423
Chile 15 1’141
Czech Republic 1 53
Georgia 1 2
Greece 5 16
Hungary 4 30
Mexico 1 6
Portugal 4 3
South Africa 2 75
Turkey 1 1
Total 1’012 17’079
* Number of farms with grapes for wine ** Number of certified cellars without own land *** Area (ha) with certified grapes for wine Demeter and "in conversion" certified Source: Biodynamic Federation - Demeter International e.V.
1 ICO is the International Certification Office of Biodynamic Federation – Demeter International
Standards, Legislation, Policies > Public Food Procurement
170 FiBL & IFOAM – Organics International (2021): The World of Organic Agriculture. Frick and Bonn
The Power of Public Food Procurement: Fostering Organic Production and Consumption
FEDERICA VARINI1 AND XHONA HYSA2
Public food procurement as a lever for sustainable food systems
Governments are estimated to spend around 15 to 20 percent of their Gross domestic product (GDP) on the procurement of goods, work and services, representing a significant part of the global economy (World Bank, 2017). Considering the environmental and societal challenges we are facing today, we can´t afford to miss the opportunity to couple environmental and social conditionality criteria to public sector spending.
Of particular interest to the organic sector is the adoption of sustainability-oriented Public Food Procurement (PFP) policies and standards applied to food and catering services serving public institutions. Such measures can shift buying power to support environmental, health and socio-economic objectives in line with the principles of organic agriculture3. As illustrated in the continental cases reported in this chapter, PFP can help create new and stable markets for organic products, stimulate changes in food habits and foster conversion to organic agriculture.
PFP can be implemented at different scales, ranging from single canteens to local, national or regional schemes. The examples reported below represent policies mainly addressing school meals. However, PFP concerns many more institutions purchasing food such as hospitals, correction facilities, and military and governmental apparatuses.
These cases illustrate the importance of coupling PFP guidelines and policies with other support measures such as capacity building for kitchen staff to strategically plan and gradually increase the amount of organic ingredients in the meals while improving nutritional value and reducing meat and food waste. Wholesalers and local supply chains, in which producers are organised, also play a crucial role in ensuring reliable supplies. In addition to fostering organic production, PFP guidelines should also address other dimensions such as fair work conditions, local purchasing and energy consumption. Thus, PFP can be regarded as a concrete policy pathway towards the achievements of multiple Sustainable Development Goals, striving to transform our food systems towards more sustainability.
1 Federica Varini, IFOAM – Organics International, 53113 Bonn, Germany, [email protected], www.ifoam.bio 2 Xhona Hysa, IFOAM – Organics International, 53113 Bonn, Germany, [email protected], www.ifoam.bio 3 Health, Ecology, Fairness, and Care.
Standards, Legislation, Policies > Public Food Procurement
FiBL & IFOAM – Organics International (2021): The World of Organic Agriculture. Frick and Bonn 171
Continental examples
Asia
According to our knowledge, the most well-established public food procurement program in Asia that includes ecological criteria was implemented in South Korea in 2011. A recent article (Gaddis & Jeon, 2020) highlights the main steps taken to establish of the Universal Free, Eco-Friendly (UFEF) school lunch program, which today provides free meals to students from kindergarten to high school across the whole country. In the wake of a long tradition of school feeding programs that started in the country in the 1950s with the aim to distribute food aid, the UFEF finally moved away from a system prioritising lower prices. Today the program supports small-scale producers by directly awarding contracts for services under a certain threshold (i.e., up to 16’000 euros in Seoul). It offers meals based on traditional recipes made with unprocessed ingredients and encourages the adoption of eco-friendly1 and organic products with the highest food safety standards. Since its launch, the program has reached out to an increasing number of students, reaching over 4 million students in 2017 (Gaddis and Jeon, 2020). The UFEF has a total annual budget of over two billion euros, partially financed by the Korean government and partly by the districts and cities, which resulted in non-homogeneous implementation across the country due to budget constraints.
The capital, Seoul, is a leading example. In 2018, the city announced its intention to double the budget earmarked to the program by 2021 in order to extend it to the entire compulsory education system, which has almost one million students and 1300 institutions. The higher budget resulted in a 70 percent increase in certified eco-friendly and organic food ingredients used for high school meals2. The program is therefore fostering the transition to more sustainable agricultural practices, encouraging Korean conventional producers to decrease the use of synthetic inputs, such as antibiotics and pesticides, or to convert to organic agriculture in order to obtain the certifications necessary to be included in the school feeding program. However, there are no studies assessing the direct correlation between the establishment of the program and the positive trends visible in the South Korean organic sector in the last five years. Thanks to the wide public support, a replication of this program to other public institutions, such as hospitals and correctional facilities, is now in the pipeline. This upscaling will result in a consistent increase of public demand for eco-friendly products.
Another interesting public food scheme in South Korea is dedicated to pregnant women. This started in January 2020 with the aim of providing eco-friendly food to 45’000 pregnant women and new mothers. With the onset of the COVID-19 pandemic,
1 In South Korea, eco-friendly agricultural or livestock products are classified by law into organic agricultural products, organic livestock products, pesticide free products and antibiotic-free livestock products, according to production methods and materials used. https://www.naqs.go.kr/eng/contents/contents.do?menuId=MN20568 2 http://english.seoul.go.kr/seoul-provides-eco-friendly-school-meals/
Standards, Legislation, Policies > Public Food Procurement
172 FiBL & IFOAM – Organics International (2021): The World of Organic Agriculture. Frick and Bonn
the program was doubled to reach 80’000 women. According to the scheme, the beneficiaries must place orders online on specific websites set up by the local government authorities. The women can order food for up to 360 euros annually, of which 20 percent is self-financed while the central and local governments cover the rest1.
Information in English regarding other public food procurement programs supporting organic production and consumptions in Asia is rather limited. In order to get a better insight of what governments across the Asian countries are doing to promote these types of policy frameworks, the Asian Local Governments in Organic Agriculture (ALGOA) will launch the ALGOA Center for Public Procurement in New Taipei City in 2021. In the first three years, the center will concentrate on research on organic school meal programs. It will focus on three Asian countries (South Korea, Taiwan and Japan) and link up with some European countries with similar initiatives.
Africa
In Africa, agriculture sustains a significant portion of most African economies, and smallholder farmers can be regarded as the backbones of this sector since they account for over 80% of the continent’s food production. Therefore, it isn´t surprising that several African countries started to implement public food procurement initiatives with the aim to generate positive impacts on smallholder livelihoods and promote market creation for locally grown food. In 2003, the African Union, under the food security pillar of the Comprehensive Africa Agriculture Development Programme (CAADP) within the New Partnership for Africa´s Development (NEPAD), started to promote the Home Grown School Feeding (HGSF) programme: “a school feeding model that is designed to provide children in schools with safe, diverse and nutritious food, sourced locally from smallholders”. According to Fernandes et al. (2016), by 2014, at least 47 out of 54 countries were realising school feeding programs in Africa, and of these, at least 20 countries2 were adopting the HGSF programme. The aim of HGSF is to decentralise procurement of foods for school meals and to source food locally from smallholders. It addresses food and nutrition security through the promotion of local food production, simultaneously promoting school enrolment. The HGSF introduced the School Meals Planner Tool, which supports the creation of menus linking culturally appropriate agricultural production and nutrition objectives. In the future, the inclusion of environmental criteria, such as promoting climate-resilient production and particularly organic farming, could – coupled with other support measures – contribute to the conversion to organic practices of smallholders in many African countries.
1 More information about the “Pregnant Women Food Scheme” in South Korea can be found on the IFOAM website at https://www.ifoam.bio/news/launch-pregnant-women-food-scheme-south-korea 2 NEPAD launched home-grown school feeding pilots in Côte d’Ivoire, Ghana, Kenya, Mali, Nigeria, the United Republic of Tanzania, Ethiopia, Malawi, Mozambique, Senegal, Uganda and Zambia (FAO & WFP, 2018)

Standards, Legislation, Policies > Public Food Procurement
FiBL & IFOAM – Organics International (2021): The World of Organic Agriculture. Frick and Bonn 173
The Ghana School Feeding Program (GSFP) is an example of a decentralised procurement policy created to comply with the African Union’s HGSF programme. It was launched in 2005 to improve food security while reducing malnutrition, increasing school enrolment levels and boosting domestic food production (Fernandes et al., 2016). In Ghana, the issue of market development for smallholders is crucial. Thus, one of the objectives of the GSFP is to link the increased demand for agricultural products that could be created by the school feeding program to smallholder farmers’ production. The program was also coupled with an intense campaign of awareness-raising and training for caterers, cooks and school directors, to not only teach them how to use the School Meal Planner Tool but also to provide general education on nutrition and food safety issues. The GSFP meal plans, designed by dedicated nutrition departments at the district level, foresee one hot meal per school, per day, made up of local seasonal ingredients. The meals are prepared and served by private caterers, who are also tasked with procuring the raw ingredients from the local market. In accordance with the guidelines of the GSPF, the caterers must procure 80 per cent of raw ingredients from local smallholder farmers (FAO & WFP, 2018). The government compensates the purchase of the ingredients and the work of the caterers through bi-weekly allowances. As of 2016, the program reached over 1.7 million primary school children in over 2000 districts (Mensah, 2018).
Europe
Support through public procurement for organic production and consumption has increased in Europe in the last decade. The importance of this policy measure is expected to grow in Europe; thanks to the newly launched Farm to Fork Strategy (May 2020). The strategy sets a target of “reaching at least 25 percent of the EU agricultural land under organic farming by 2030” and anticipates that the Commission will define “mandatory criteria for sustainable food procurement […] to boost sustainable farming systems, such as organic farming” (European Commission, 2020). There is, therefore, the expectation that this strategy will create pressure to develop a more uniform and binding system since the current legal framework is still rather patchy and differs across countries.
The vision of the Farm to Fork strategy for public food procurement is embedded in the European Union’s (EU) Green Public Procurement (GPP) policy. It is an EU voluntary framework through which public purchasing power is directed towards choosing environmentally friendly goods, services and works, thus investing public money towards sustainable consumption and production. In 2014, a series of Directives1 were issued to increase flexibility and adoption of Green Public Procurement procedures to obtain “better value for public money, to deliver better outcomes for societal and other public policy objectives while increasing efficiency of public spending “, thus taking a step away from the lower price criteria (European Commission, 2017). In October 2019, the
1 Directive 2014/23/EU (concessions), Directive 2014/24/EU (general) and Directive 2014/25/EU (utilities)
Standards, Legislation, Policies > Public Food Procurement
174 FiBL & IFOAM – Organics International (2021): The World of Organic Agriculture. Frick and Bonn
Commission published new voluntary EU GPP guidelines for food, catering services and vending machines. Among the core criteria to limit the food and catering sector’s environmental impact, organic product sourcing appears as pivotal (European Commission, 2019).
Currently, several public initiatives promoting organic ingredients in school meals exist across Europe. Generally, they have procedures that include adopting a certain percentage of organic products in the meals provided. However, there is no comprehensive database that shows to which extent green criteria, including the use of organic ingredients, are applied across Europe. Yet, across Europe, there are many examples at the national, regional and local level, including those in Austria, Belgium, Denmark, Finland, France, Germany, Denmark, Ireland, Italy, Latvia, Malta, The Netherlands, Slovenia, Spain, Sweden (EPHA & HCWH Europe, 2019; Neto & Gama Caldas, 2018; IFOAM - Organics International, 2017).
One of the most famous examples is in Copenhagen, the capital of Denmark. In 2018, organic ingredients accounted for 88 percent of the ingredients in the meals served by the city’s 1000 public schools1. A key success factor was the effort dedicated to capacity building for kitchen employees, which focused on creating meals with better nutritional value and improved climate and environmental performance. Concretely, this means that the amount of unprocessed ingredients has increased while meat consumption and food waste has decreased, in order to reduce the higher price of meals due to the use of more organic products2. It was also crucial to work with national wholesalers to provide more fresh organic products. Public tenders were issued that specifically requested the availability of a wide assortment of fresh organic products, such as meat. Recently, Denmark issued one of the most ambitious climate plans worldwide, aiming to reduce greenhouse gas emissions by 70 percent by 2030. In May 2020, a broad coalition of Danish stakeholders representing thousands of farmers, restaurants and food companies launched a joint proposal for the Danish Climate Plan suggesting using public and private catering services as the driving force to achieve the 70 percent reduction target3. One of the strategies proposed is to set as a national policy target, adopting 90 percent organic ingredients in meals provided by all public and private catering services across Denmark by 20304 (the current national average for public kitchens is 60 percent).
1 The City of Copenhagen website: Copenhagen welcomes the UN SDG’S. Available at https://international.kk.dk/artikel/copenhagen-welcomes-un-sdgs 2 On average it is estimated that the conversion to 100 percent organic ingredients of a school meal implies an increase of 20-30 percent on the final price. It is nevertheless important to highlight that the costs of the basic ingredients often represent only a small portion of the final cost of a meal. 3 Organic in Public Danish Kitchens and Private Eateries. Organic without boundaries website. Available at https://www.organicwithoutboundaries.bio/2020/06/18/organic-in-public-danish-kitchens-and-private-eateries/ 4 https://paulholmbeck.com/wp-content/uploads/2020/05/Klimavirkemiddel_Klima-og-percentC3percentB8kologiomstilling-i-de-professionelle-kpercentC3percentB8kkener_sendt.pdf
Standards, Legislation, Policies > Public Food Procurement
FiBL & IFOAM – Organics International (2021): The World of Organic Agriculture. Frick and Bonn 175
Italy represents another remarkable example. Here, organic ingredients have been included in school meals since 1986. The first legislation to promote organic products in school canteens was issued in the early 2000s. Furthermore, since 2015, a national law1 established a requirement for school canteens to source at least 15 percent of meat and 40 percent of other ingredients, such as fruits and vegetables, from certified organic producers. According to the census of Italian organic school canteens performed by BioBank in 2018, the total food catering sector was worth 80.3 billion euros in 2016. Organic catering reached 377 million euros; an increase of 135 percent compared to the previous decade (Bertino et al., 2018). In 2018, more than 1300 institutions were using organic ingredients in their meals. Of these institutions, 25 percent reached 70 to 100 percent organic, accounting for a total of 1.3 million meals served daily. In order to further support this system, Italy issued a ministerial decree2 in 2018, which awards a gold certificate to canteens that use over 90 percent organic ingredients. The canteens using 70 percent are awarded a silver certification. This award scheme also aims to decrease food waste, increase the use of products from local producers (150 kilometres distance) and introduce educational activities in the schools. Certified organic canteens can request public support from a dedicated budget of 44 million euros for 2018 to 2021. This fund also helps decrease the costs of meals borne by Italian families. The BioBank census concludes that the policy measures positively impacted the adoption of organic ingredients in public kitchens. In 2004 to 2017, the quantity of certified organic raw ingredients increased by 26.4 percent, reaching almost 50 percent at the national level.
A recent article assessing the case of Sweden shows that the adoption of policy measures supporting public organic food procurement since 2006 have had a positive impact on the development of organic farmland in Sweden (Lindström et al., 2020). In 2006, a first GPP policy laid down the framework for increasing public sector investments in the food and catering service, targeting 25 percent organic food served in public canteens by 2010. This policy goal was meant to contribute to another political commitment to reach 20 percent organic farmland by the same year. Ten years later, the objective concerning organic food consumption in public institutions was exceeded, reaching 33 percent; however, the organic land area was lagging behind the target, reaching only 15.6 percent.
For this reason, the government decided in 2017 to adopt a more ambitious policy target: to increase the use of organic produce in school canteens to up to 60 percent by 2030, while the organic farmland target was increased to 30 percent. In Sweden, public institutions represent only 4 percent of the demand for organic products. However, the statistical analysis performed by Lindström et al. (2020) showed that public institutions acting together exert sufficient buying power to influence national wholesalers’ purchasing choices. This has a positive impact on organic farmland. The research also highlights that PFP should be coupled with direct subsidies since the greatest impact on organic farmland was associated with the significant positive effects of direct 1 Law 28th December 2015, n. 221 2 Law 18th December 2017, n. 14771
Standards, Legislation, Policies > Public Food Procurement
176 FiBL & IFOAM – Organics International (2021): The World of Organic Agriculture. Frick and Bonn
payments for conversion to organic production, as provided under the Common Agriculture Policy.
Latin America
The most famous and well-studied program promoting organic and agroecological production in Latin America through public procurement is, without a doubt, the Brazilian National School Feeding Program (PNAE), implemented in Brazil in 2009. This legal framework stands out among other policy frameworks of this kind for its holistic vision and its ability to combine the supply of healthy and nutritious foods with the strengthening of family farming, the promotion of environmentally friendly products and the enforcement of the right to food. Although PNAE has existed since the early 1950s, its current framework is regulated by (Law 11.947 / 2009, and in Resolution n. 26 de 2013). These laws introduced a series of changes compared to the past program. Emphasis is now on purchasing food not only from local producers but specifically from family farmers, and priority is given to organic or agroecological products. According to the new law, 30 percent of the financial resources for school meals earmarked by the National Fund for Education Development (FNDE) should be spent to purchase food produced by family farmers (Drake et al., 2016). The law also requires that organic products purchased from farmers include a 30 percent price premium. The new legislation also introduced a set of guidelines to improve the nutritional value of the meals. PNAE is one of the few national school feeding programs worldwide to be universal and free, reaching almost all municipalities of Brazil (more than 5300 in 2016). It provides quality meals to more than 40 million students from public education institutions.
Schneider et al. (2016) concluded that the share of products produced by family farmers relative to the total volume of resources allocated to the program has increased since 2011. However, they also emphasised several challenges in including family farmers, for instance, related to logistical issues and incapacity to provide constant supply and meet the demand of large municipalities. Over the years, the experience of PNAE has been acknowledged at an international level by several multilateral organisations, such as the World Food Program and FAO (FAO & WFP, 2018). Recent reports, however, indicate that PNAE is at risk due to substantial budget cuts; first under the Temer government and now under Bolsonaro´s. The policy has also been weakened by the dismantlement of some key bodies, such, as the National System of Food and Nutrition Security (Sisan), the National Board of Food and Nutrition Security (Consea) and the Interministerial Chamber of Food and Nutrition Security (Caisan) (de Amorim et al., 2020). These bodies were the program’s vital organs and had the mandate to create formal spaces for social participation through the Food and Nutrition Security Councils (Consea) in order to ensure the implementation of the program at an inter-ministerial level through the adoption of guidelines, planning and budgeting.
North America
In the USA, there are currently no uniform public food procurement policies and standards applied at the federal or state level. However, the potential of redirecting

Standards, Legislation, Policies > Public Food Procurement
FiBL & IFOAM – Organics International (2021): The World of Organic Agriculture. Frick and Bonn 177
public expenditures for catering services towards green procurement practices is enormous. One needs only to look at the National School Lunch Program implemented by the US Department of Agriculture (USDA) which alone allocates more than 9 billion EUR in public funds to provide meals annually for over 30 million children. Such funds are currently allocated to food and catering services almost indiscriminately without applying environmental or social precautionary principles (Farnsworth et al., 2018).
In this context, the Good Food Purchasing Programme (GFPP) stands out. The GFPP started in 2012 when the Los Angeles Food Policy Council Procurement working group developed the Good Food Purchasing Guidelines for Food Service Institutions. These were adopted by the City of Los Angeles and by the Los Angeles Unified School District through a municipal decree, impacting the serving of approximately 750’000 meals a day. In 2015, in response to the interest from other cities and institutions across the country, the Center for Good Food Purchasing1 was created. Today, the Center houses the national initiative with the aim to transfer, scale and network the Good Food Purchasing Program across the country. Since then, many institutions have joined the programme; striving to “create a transparent and equitable food system, which prioritises the health and well-being of people, animals, and the environment”. Today the Center is working with 43 institutions and local coalitions in 16 cities across the country, including Los Angeles, Buffalo, Boston, Austin, Chicago, New York, Oakland, San Diego, San Francisco and Washington DC. Together, these institutions spend nearly 1 billion euros on food each year, following purchasing guidelines that are grounded on five values: local economies, nutrition, valued workforce, environmental sustainability and animal welfare. Through its program, the Center is helping public bodies to institutionalise fair and sustainable food purchasing. Several of the participating cities have not only adopted voluntary guidelines, but they have also succeeded in implementing food policies that mandate the adoption of GFPP for all institutions providing public food services under their jurisdiction.
Additionally, the GFPP established a strategic planning framework for local food policy directors and staff. This planning framework aims to inform, support better choices and improve transparency in sourcing raw materials while accounting for the economic and social sustainability dimension of the food purchased. Finally, the program provides a tool to stimulate food businesses, such as wholesalers, to develop new products and new sourcing practices in accordance with the values of the programme (Farnsworth et al., 2018). GFPP transcends “organic” but gives rightful credit to organic production through its point system for tracking progress, described in the Good Food Purchasing Standards. –In this system, organic is considered a best practice in two categories: environment sustainability and animal welfare.
References AU. (2018). Sustainable School Feeding across The African Union. Addis Ababa: The African Union.
1 The website of the Center for Good Food Purchasing: https://goodfoodpurchasing.org/

Standards, Legislation, Policies > Public Food Procurement
178 FiBL & IFOAM – Organics International (2021): The World of Organic Agriculture. Frick and Bonn
Bertino R. M., Mingozzi A., & Mingozzi E. (2018). Focus Bio Bank: il Bio nelle mense scolastiche in Italia: evoluzione e trend storico secondo i censimenti Bio Bank.
De Amorim, A. L. B., Ribeiro Junior, J. R. S., & Bandoni, D. H. (2020). National school feeding program: Strategies to overcome food insecurities during and after the covid-19 pandemic. Revista de Administracao Publica, 54(4), 1134–1145. https://doi.org/10.1590/0034-761220200349x
Drake, L., Woolnough, A., Burbano, C., & Bundy, D. (2016). Global School Feeding Sourcebook. In Global School Feeding Sourcebook. Imperial College Press. https://doi.org/10.1142/p1070
European Commission. (2017). COM (2017) 572 final, Making Public Procurement work in and for Europe Making Public Procurement work in and for Europe. https://ec.europa.eu/commission/priorities/jobs-growth-and-investment/investment-plan_en
European Commission. (2019). EU GPP Criteria for food, catering services and vending machines. European Commission. (2020) Farm to Fork Strategy. European Public Health Alliance (EPHA), & Health Care Without Harm (HCWH) Europe. (2019). Public
Food Procurement for sustainable food systems. How can the EU Farm to Fork Strategy contribute? FAO & WFP. (2018). Home-Grown School Feeding - Resource Framework. Rome: FAO. Farnsworth, L. D., Delwiche, A., & McKinney, C. (2018). The good food purchasing program: A policy tool
for promoting supply chain transparency and food system change. In Institutions as Conscious Food Consumers: Leveraging Purchasing Power to Drive Systems Change (pp. 103–126). Elsevier. https://doi.org/10.1016/B978-0-12-813617-1.00005-8
Fernandes, M., Rae, G., Gelli, A., Mumuni, D., Hamdani, S., & Kiamba, J. (2016). Enhancing Linkages Between Healthy Diets, Local Agriculture, and Sustainable Food Systems: The School Meals Planner Package in Ghana. Food and Nutrition Bulletin, 571-584.
Gaddis, J. E., & Jeon, J. (2020). Sustainability transitions in agri-food systems: insights from South Korea’s universal free, eco-friendly school lunch program. Agriculture and Human Values, 37(4), 1055–1071. https://doi.org/10.1007/s10460-020-10137-2
IFOAM - Organics International. (2017). Guidelines for public support to organic agriculture. Lindström, H., Lundberg, S., & Marklund, P. O. (2020). How Green Public Procurement can drive conversion
of farmland: An empirical analysis of an organic food policy. Ecological Economics, 172. https://doi.org/10.1016/j.ecolecon.2020.106622
Mensah, C. (2018). Incentivising smallholder farmer livelihoods and constructing food security through home-grown school feeding: evidence from Northern Ghana. Revista de direito internacional Brazilian journal of international law, v. 15, n. 3.
Neto, B., & Gama Caldas, M. (2018). The use of green criteria in the public procurement of food products and catering services: a review of EU schemes. In Environment, Development and Sustainability (Vol. 20, Issue 5, pp. 1905–1933). Springer Netherlands. https://doi.org/10.1007/s10668-017-9992-y
Sakho-Jimbira, S., & Hathie, I. (2020). The future of agriculture in Sub-Saharan Africa. Southern Voice - Policy Brief No. 2.
Schneider S., Thies V. F., Grisa C., & Belik W. (2016). Potential of Public Purchases as Markets for Family Farming: An Analysis of the Brazilian School Feeding Program Between 2011 and 2014 (Barling D., Ed.). Elsevier.
World Bank. (2017). Assessing public procurement regulatory systems in 180 economies. Benchmarking Public Procurement. www.worldbank.org
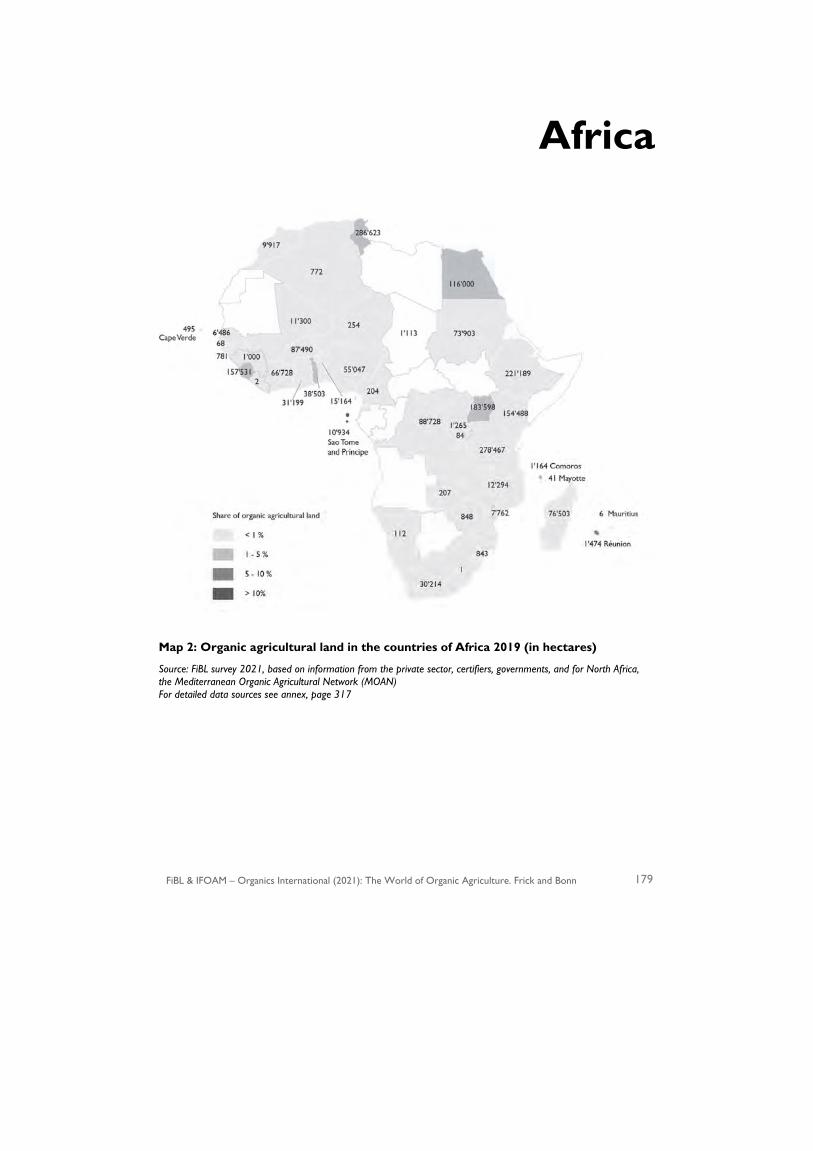
FiBL & IFOAM – Organics International (2021): The World of Organic Agriculture. Frick and Bonn 179
Africa
Map 2: Organic agricultural land in the countries of Africa 2019 (in hectares)
Source: FiBL survey 2021, based on information from the private sector, certifiers, governments, and for North Africa, the Mediterranean Organic Agricultural Network (MOAN) For detailed data sources see annex, page 317
Africa › Overview
180 FiBL & IFOAM – Organics International (2021): The World of Organic Agriculture. Frick and Bonn
Latest Developments in Organic Agriculture in Africa
DAVID M. AMUDAVI,1 VENANCIA WAMBUA,2 ALEX MUTUNG,3 MOSES AISU4 AND OLUGBENGA O. ADEOLUWA5
The potential of organic agriculture in Africa (now increasingly referred to as ecological organic agriculture, EOA) continues to receive attention among farmers, practitioners, policymakers and other stakeholders to address food insecurity, land degradation, poverty, climate change and resilience to shocks, among other benefits. Despite challenges including the latest COVID-19 pandemic, efforts continue to be made in mainstreaming organic agriculture into policy, national extension systems, marketing and value chain development, curricula of academic institutions and African-led research activities in the continent.
The Ecological Organic Agriculture (EOA) Initiative
Key achievements
Despite the COVID-19 pandemic, the Ecological Organic Agriculture Initiative (EOA-I) realised several achievements during 2020. The Swiss Agency for Development and Cooperation (SDC) approved the 2nd Phase of the initiative for the period 2019-2023 with the support of 6.3 million US dollars. Geographical coverage expanded to include Rwanda as the ninth country. The value chain and market development approach was adopted. Participating partners in all nine countries in Eastern and West Africa selected key value chains under a network of teams approach, which focuses on concentration, coordination and targeting specific groups. The selected value chains included livestock, fruits (bananas, avocado, mangoes, and pineapples), vegetables (tomatoes, potatoes, indigenous vegetables and onions), herbs, legumes (beans, soybean, nuts, sesame and nuts), and cereals (rice, maize, millet and sorghum). The value chains contributed to improved food security, nutrition and income to farmers.
The initiative’s databases continued to be strengthened to make research findings and knowledge on EOA available and accessible by various users6. About 24 EOA-I practices were promoted during this period. Key practices included the incorporation of farm residues, mulching, cover crops, use of farmyard manure, crop rotation, intercropping, green manure, green fallow, animal manure, nitrogen-fixing plants,
1 Dr. David Amudavi, Biovision Africa Trust, Nairobi, Kenya 2 Venancia Wambua, AfroNet, Dar es Salaam, Tanzania 3 Alex Mutung, AfroNet, Dar es Salaam, Tanzania 4 Moses Aisu, Network of Organic Agriculture Research in Africa (NOARA), C/O NOAN, University of Ibadan, Nigeria 5 Olugbenga O. Adeoluwa, Network of Organic Agriculture Research in Africa (NOARA), C/O NOAN, University of Ibadan, Nigeria 6 For more information, see the EOA website http://eoai-africa.org/research

Africa › Overview
FiBL & IFOAM – Organics International (2021): The World of Organic Agriculture. Frick and Bonn 181
water conservation, correction of soil pH, soil testing, compost, push-pull management strategy, zero tillage, bio-slurry, liming, cover crops, certification and processing.
At the national level, the EOA-I governance structure brought key ministry officials on board to help govern the EOA and chair the National Steering Committees. In Uganda, the National Organic Agriculture Policy was launched in October 2020. EOA-I partners were among the actors that collaborated with relevant ministries to support the new policy development and approval. At the continental level, focus was put on getting a picture of the status of policy and legislation in support of EOA in Africa, building on the 2019 assessment.
Two studies commissioned by the Africa Union Commission (AUC) and the Biovision Africa Trust in 2019 showed that of 55 African countries:
• Three countries (Morocco, Tunisia and Uganda) have an Ecological Organic Agriculture (EOA) policy, organic production standards, strong government support for EOA and a well-developed National Organic Agriculture Movement (NOAM).
• Fourteen have some government support with policy development underway and strong National Organic Movements (NOAMs)1.
• Another ten have strong civil society organisations, significant EOA production, including some export, but little government support.
• A further 11 have some civil society capacity, no organic guidelines, little or no export and not much government support.
• Finally, there are 17 countries with minimal institutional capacity, no government support and no exports.
Much of Africa’s development budget is spent on food safety nets and Farm Input Support Programmes (FISP). FISP focus on cheap fertilisers, hybrid seeds and agrochemical inputs, which are largely unsustainable and ineffective, leading to wasteful resource use. However, with a long-term vision, some elements of a FISP approach can contribute to sustainable development. Mauritius is the only African country to have focused on the positive elements of FISP to support compost making, leading to long-term soil fertility improvement and elongating the soil’s production capacity, while at the same time empowering farmers to produce their own low-cost fertiliser. Lessons can be learned from long-term research in Britain, Denmark, Switzerland and the United States, which shows that after a few years of organic
1 Two studies were commissioned by the African Union Commission (AUC) to assess the status of policy towards EOA development in North, Central, West and Southern Africa (Auerbach 2013) and by the Biovision Africa Trus progress in East Africa in 2019 undertaken by Dr. Edith Kareko-Munene (CITE). Tthe two studies were integrated in 2020 and supplemented with country (Eastern Africa) and regional policy briefs being prepared.
Africa › Overview
182 FiBL & IFOAM – Organics International (2021): The World of Organic Agriculture. Frick and Bonn
management, the soil’s productivity can be increased in a robust way, improving soil water- and nutrient-holding capacity.
The challenges facing the realisation of favourable policy and legislation for EOA include:
• limited material capacity (e.g. financial and technological constraints) and human resources,
• limited knowledge and technical expertise in Eastern Africa of best practices and management for organic practices (soil fertility, weed control, pest or disease control);
• poor policy coherence (no policy or EOA guidelines are available, lack of adequate incentives, poor/insufficient cross-sectoral coordination, incentives and subsidies available for conventional farmers, e.g. fertilisers, hybrid seed);
• weak integration of by smallholder farmers and youth (top-down policymaking, one-way extension services, gender imbalances).
The Knowledge Center for Organic Agriculture in Africa
The Knowledge Center for Organic Agriculture in Africa (KCOA) is part of the BMZ1 Special Initiative ONE WORLD - no Hunger with a project implementation period from 01/2019 – 06/2024 and a budget of 16 million euros (23 million US dollars). It is coordinated by GIZ, the German Corporation for International Cooperation. KCOA aims to develop knowledge hubs in West, East, North and South Africa, and later in Central Africa. These hubs are introduced as an innovative strategy for promoting organic agriculture with actors in Africa. This will be achieved through three main strategies:
Integrated Knowledge Management Systems Strategy: This involves collecting, adapting, and validating knowledge and ensuring that it is made widely available in user-friendly formats for different target groups in the region. The knowledge assembly draws on evidence (research findings), experiential and indigenous knowledge and values that farmers, researchers, policymakers and service providers use in their practice and decision making. This further involves validation of knowledge of available research and practical findings on EOA. The hubs generate content on important thematic areas including nutrition and food security, climate change, water management, resilience and sustainability of farming systems, markets and market development and technology transfer and learning. The communication tools include knowledge databases/websites, publications, videos, Information and communications technology (ICT) applications and social media (Facebook, Twitter, Flickr and YouTube).
1 BMZ is the German Federal Ministry for Economic Cooperation and Development (Bundesministerium für wirtschaftliche zusammenabreit und Entwicklung). More information is available on https://www.bmz.de/en/index.html .
Africa › Overview
FiBL & IFOAM – Organics International (2021): The World of Organic Agriculture. Frick and Bonn 183
Dissemination and Capacity Building Strategy: This involves developing a holistic, context-specific and gender-sensitive extension system for knowledge sharing with various target groups along the value chain, based on the target groups’ needs and constraints. It is intended to have a multiplier effect throughout the value chain. Regional and country training programmes (Training of Teams of Trainers/Facilitators will lead to multipliers (i.e. innovators, entrepreneurs, model farmers, extensionists), who can show others how to access and use knowledge in the repositories, how to use the various tools to disseminate the knowledge to diverse target groups and how to catalyse and strengthen local markets supported by local affordable certification systems.
Market Systems Development and Networking Strategy: This involves networking and facilitating market linkages to create incomes, provide services, and improve livelihoods for farm households and other community members. To promote complementary and shared learning, the strategy is linked to other existent initiatives, such as the EOA-I and its country organisations, the Network of Organic Agriculture Researchers in Africa (NOARA), the Forum for Agricultural Research in Africa (FARA), the FARA eRails network on knowledge exchange for agriculture in Africa and the GIZ Green Innovation Centers.
This strategy aims to build the capacity and resilience of local systems, leveraging the incentives and resources of the private sector, ensuring the beneficial inclusion of smallholder farmers and stimulating change and innovation that will grow beyond this project’s life.
The strategy involves:
• A Business Development Services approach to link target groups to service providers (for inputs, marketing, training, information, technology development and transfer) and making markets work for the poor;
• Certification and standards within context-adapted Participatory Guarantee Systems (PGS) and third-party certification; and
• A value chain approach focusing on strategic value chains and taking into account the specific needs of the value chain actors.
The countries currently involved are:
• West Africa: Senegal, Benin, Gambia, Mali, Nigeria; • Eastern Africa: Uganda, Kenya, Rwanda, Tanzania; • Southern Africa: Zambia, Namibia, South Africa, Malawi; • Northern Africa: Egypt, Morocco, Tunisia; and • Central Africa: Cameroon and others to be confirmed.
Various partners are involved including regional and country partners (e.g. Biovision Africa Trust and PELUM Uganda for Eastern Africa, the Sustainability Institute for South Africa, ENDA ProNat, FENAB & Agrecol Afrique for West Africa) and international partners (IFOAM - Organics International, Access Agriculture, the
Africa › Overview
184 FiBL & IFOAM – Organics International (2021): The World of Organic Agriculture. Frick and Bonn
Research Institute of Organic Agriculture FiBL and the International Centre of Insect Physiology and Ecology (ICIPE)).
Institutional Developments
The Continental Steering Committee (CSC) of the African Union (AU)-led EOA-Initiative1 has continued to provide strategic guidance and patronage for the implementation of EOA in Africa, despite the challenges brought about by the COVID-19 pandemic in Africa from March 2020. Several key achievements were realised.
In 2020, the CSC, at its 13th and 14th meetings, commissioned the secretariat, which is hosted by the Biovision Africa trust, to develop EOA indicators. A technical working group, which was established for this purpose, has since produced a concept note.
The 14th CSC further endorsed the decision to investigate the possibility of having a continental EOA certification system and see how stakeholders can benefit from the recently launched Africa Continental Free Trade Area. The secretariat will mobilise stakeholders and implementing partners to meet with the African Organization for Standardisation to discuss the opportunities available for certification and how best to facilitate the certification process. Further, in elaborating principles and practices of the EOA-I, the secretariat should develop a strategy paper on how to adapt the ten FAO principles on agroecology into EOA activities.
The CSC further requested its secretariat to draft terms of reference for a rapid assessment of the impact of the COVID-19 pandemic on organic and conventional farming systems. It will look at how responsive and resilient farmers are in coping with the pandemic to inform measures for mitigation and policy actions. This study will be undertaken in the first quarter of 2021, and results will be shared widely. The CSC also agreed to strengthen the CSC Secretariat in terms of knowledge management, policy and advocacy
The African Union’s Department of Rural Economy and Agriculture (DREA) organised a virtual workshop of key stakeholders in seed sector development in Africa on September 4, 2020, under the umbrella of the African Seed and Biotechnology Platform. The general objective of the meeting was to hold sector-wide consultations with key seed stakeholders in Africa on the operationalisation of the governance structure of the African Seed and Biotechnology Programme. Following spirited negotiation of the CSC technical working group on seed systems, the EOA-I was endorsed to be part of the Steering Committee of the African Seed and Biotechnology Platform to contribute to the overall governance of programs on seed systems and capacity development in Africa. The EOA-I will also contribute to other technical areas such as seed legislation, seed regulations or biosafety regulations. This development marks another milestone for the EOA-I seed policy development in Africa. Through this, the EOA-I finds itself
1 Secretariat: Biovision Africa Trust-https://biovisionafricatrust.org

Africa › Overview
FiBL & IFOAM – Organics International (2021): The World of Organic Agriculture. Frick and Bonn 185
inside important seed discussions in the continent, giving it the opportunity to champion organic seed policies and programmes.
Data on the status of organic agriculture
Data on organic agriculture in Africa remains scanty and perhaps not precise. The survey tool developed by the EOA CSC in collaboration with IFOAM – Organics International, to support the gathering of relevant data1 on programmes and initiatives was not applied. The tool was expected to be regularly used with other strategies, bringing Ministries of Agriculture and National Bureaus of Statistics on board to provide relevant data on organic agriculture and identify gaps and opportunities for further actions. An important step in this direction was taken with the development of some relevant indicators to monitor the performance of EOA in the continent, which was reported on in CAADP’s biennial review reporting process. This has been further elaborated by a complementary framework addressing key priority area 5 of the Policy and Programme Development of EOA, utilising six criteria:
1. The extent to which a national policy is in place and supported by a budgetary allocation.
2. The extent to which organic regulations have been promulgated and implemented.
3. The extent to which national standards and certification are in place. 4. The extent of government support to the organic sector. 5. The degree to which civil society is involved in the development of the EOA
sector. 6. The performance of the domestic and export EOA market.
These criteria will be used to locate and track a country’s development on EOA and assess and report the multiple components of a country’s development pathway. Processes and outcomes need to be monitored systematically in order to support the transition towards sustainable food production as part of sustainable development in Africa. Monitoring and evaluation indicators shall be linked to government and African Union budgets so that there are financial incentives associated with environmentally responsible production. The criteria, desired outcomes and process indicators should help both governments and EOA stakeholders keep track of progress within the sector and allow the African Union and the EOA-I Continental Steering Committee to evaluate the overall progress towards sustainable development.
Achievements by the African Organic Network (AfrONet)
The African Organic Network (AfrONet) is a custodian of the African organic movements and organic sector development, which aims to strengthen and support national, regional and continental networks, overseeing the development and growth of the Ecological Organic Agriculture (EOA) Initiative for Africa. It is a member of the
1 The Survey on EOA initiatives in Africa is available at https://www.surveymonkey.de/r/C7JQ537
Africa › Overview
186 FiBL & IFOAM – Organics International (2021): The World of Organic Agriculture. Frick and Bonn
EOA’s Continental Steering Committee and Regional/Cluster Steering Committees.1 AfrONet has been bringing together all the networks, partners, and other stakeholders under the platform of the African Organic Conference (AOC). Morocco shall be hosting the 5th AOC at Marrakesh in November 2021.
The year 2020 saw AfrONet take on efforts to promote greener agriculture in Africa through the inauguration of the ‘Innovative Institutions for Ecological Organic Agriculture in Africa’ (IIABA) financed by the French Development Agency (AFD). The project aims to support the strengthening of National Organic Agriculture Movements. AFD has allocated a 1.5 million euro grant to AfrONet and its partners to scale up ecological and organic agriculture in Tanzania, Uganda, and Morocco. The partners will implement institutional innovations and consolidate the capacities of AfrONet and its members. Main areas of action will involve building innovative markets, Participatory Guarantee Systems (PGS) and public policy analysis. The action ‘building innovative markets’ aims to establish conducive and accommodative opportunities for farmers of all levels to have platforms to sell their products to willing buyers through formal and informal markets. The project partners include the Moroccan Interprofessional Federation for Organic Agriculture (FIMABio), the National Organic Agriculture Movement of Uganda (NOGAMU), the Moroccan Network of Agroecology Initiatives (RIAM), Tanzania Organic Agriculture Movement (TOAM), the French Agricultural Research Centre for International Development (CIRAD) and the French National Research Institute for Agriculture, Food, and Environment (INRAE).
AfrONet has taken steps to strengthen its human resources by recruiting more personnel to improve its capacities to execute duties across the continent. This has been made possible by the grant to AfrONet by the French Development Agency (AFD).
NOGAMU and other actors in Uganda participated in the launch of the National Organic Agriculture Policy in September 2020 courtesy of financial support from the ‘Innovative Institutions for Ecological Organic Agriculture in Africa’ (IIABA) project. NOGAMU has disseminated the National Organic Agriculture Policy in four major regions of Uganda (Western, Eastern, Northern and Central) in preparation for the development of the Organic Agriculture Bill to be presented to the Ugandan parliament.
AfrONet has reached out to the organic movement of the Democratic Republic of the Congo, and activities have been planned for 2021, which include linking the partner in the Congo to the EOA-Initiative.
1 The EOA initiative in Africa is a response to support and implement the African Union Council Decision on Organic Farming passed during the Eighteenth Ordinary Session, 24-28 January 2011, EX.CL/Dec.621 (XVIII). The overall goal of the initiative is to mainstream Ecological Organic Agriculture into national agricultural production systems by 2025 to improve agricultural productivity, food security, access to markets and sustainable development in Africa. This is to be realized through scaling up ecologically and organically sound strategies and practices through institutional capacity development, scientific innovations, market participation, public policies and programs, outreach and communication, efficient coordination, networking and partnerships in Africa.
Africa › Overview
FiBL & IFOAM – Organics International (2021): The World of Organic Agriculture. Frick and Bonn 187
AfrONet’s regional affiliates also achieved various milestones in 2020. Planning for the 6th West African Organic Conference (WAOC) to be held in Burkina Faso from October 13 to 16, 2021, kick-started under the leadership of the ECOWAS Commission-led Regional Planning Committee. The committee includes significant organisations working in the region. The Local Organizing Committee in Burkina Faso is anchored by CNABio with the Ministry of Agriculture's support.
The initial draft of a harmonised organic agriculture standard by Participatory Guarantee System (PGS) in West Africa to facilitate trade across the region was achieved and is ready for validation and approval by stakeholders in 2021. Also, work is in progress on BioWest Africa Fair - an annual regional organic agriculture exhibition/ trade fair to be mainstreamed into the regional agricultural exhibition by the Economic Community of West African States (ECOWAS) Commission, the West African Center for Agricultural Research and Development (Centre Africain pour la Recherche et le Développement Agricoles/West) and the Central African Council for Agricultural Research and Development.
Preparations started for the 5th African Organic Conference in Morocco, and FIMABIO, the Organic Federation of Morocco, an important actor coordinating producers, processors and distributors of organic products, will take a key role of coordination. This will strengthen INRA Morocco’s planned four-year research program on Organic and Ecological Agriculture (2021-2024), to be funded by the Moroccan government along with FIMABIO.
The Network of Organic Agriculture Researchers in Africa (NOARA)
NOARA is a network established by African organic agriculture researchers. The network is officially registered and hosted in Nigeria with a Board of Trustees. The vision of NOARA is Africa with zero hunger, poverty eradicated, improved livelihoods and a sustained ecosystem through innovative organic and ecological agriculture research.1
The roles of NOARA include: spearheading organic agriculture research, extension, training and value chains and market development; undertaking lobbying and advocacy on organic and ecological agriculture research at high levels; supporting capacity building for key players in organic and ecological agriculture across the continent; mobilising resources for NOARA’s endeavours in promoting organic agriculture on the continent; providing management and administrative consultancy to like-minded programmes and partners on organic agriculture research; and undertaking any other functions as deemed necessary to address NOARA’s objectives.
In the reporting year, NOARA published the Proceedings the 5th West Africa Organic Conference hosted by Ghana and worked on Volumes 3 and 4 of the African Journal of Organic Agriculture and Ecology (AJOAE). NOARA also published the maiden edition
1 For more information see www.noara.bio
Africa › Overview
188 FiBL & IFOAM – Organics International (2021): The World of Organic Agriculture. Frick and Bonn
of its bulletin – African Organic Agriculture focusing on organic, ecological, and botanical solutions to COVID-19 and 5G issues. NOARA also had its first and second biannual meetings virtually in June and December 2020, respectively and marked the 2020 World Food Day with a key presentation by Prof. Dr Gerold Rahmann (the President of the International Society of Organic Agriculture Research (ISOFAR)).
The development of the demand-driven Organic Agriculture Research Agenda for Africa 2030 with a multi-stakeholder approach, is yet to be fully achieved due to funding limitations. However, 60 percent of the project has been achieved through support by NOARA members and some partners. NOARA hopes to complete the project in 2021 for uptake by researchers, policymakers and development partners in the area of organic and ecological agriculture in Africa.
Outlook
Increased research and development activities targeted towards organic production hope to unlock the sector's potential for millions of smallholder farmers and their families. Drawing on growing evidence and implementing innovations provide opportunities for organic agriculture to enhance productivity, resilience, and profitability of smallholder farming in Africa. Making investments to research and development of ecologically sustainable systems and working on markets for organic produce would guarantee sustainable food systems in Africa. Therefore, the necessary intensification of agricultural production in Africa should be ecological, maintain ecosystem services, and restore, build, and maintain the natural resource base, particularly soil, water, and biodiversity. A better future for the organic sector requires African governments and their relevant institutions, farmers and farmer organisations, development partners and the private sector to invest resources in research, policy and programmes and establish platforms for experience sharing, learning and collaboration, thereby building the basis for sustainable, long-term food and nutrition security and poverty reduction.
References African Union, Executive Council (2011). Decision on organic farming. Doc. EX.CL/631 (XVIII). Eighteenth
Ordinary Session. 24 - 28 January 2011, Addis Ababa, Ethiopia. Available at http://www.au.int/en/sites/default/files/decisions/9646 council_en_24_28_january_2011_executive_council_eighteenth_ordinary_session.pdf
Auerbach, (2013), Chapter 2: Transforming African Agriculture, p.30. Ecological Organic Agriculture (EOA) Initiative, Continental Steering Committee (2015). The Ecological
Organic Agriculture (EOA)-Initiative. 2015-2025 Strategic Plan. EOA Continental Steering Committee, African Union Commission.
Africa › Statistics
FiBL & IFOAM – Organics International (2021): The World of Organic Agriculture. Frick and Bonn 189
Africa: Current Statistics
CLAUDIA MEIER,1 BERNHARD SCHLATTER,2 OLIVIA KELLER3 AND JAN TRÁVNÍČEK4
There were more than 2.0 million hectares of organic agricultural land in Africa in 2019, representing 0.2 percent of the continent’s total agricultural area and 2.8 percent of the global organic agricultural area. The organic agricultural land in Africa has increased by more than 176’000 hectares or 9.5 percent compared to 2018, and it increased by almost 2 million hectares since 2000. In 2019, 42 African countries reported data on organic activities. Since 2017, Tunisia has been the country with the largest organic area, with almost 287’000 hectares. Uganda remained the country with the highest number of organic producers, with over 210’000 producers in 2019, followed by Ethiopia with nearly 204’000 producers and Tanzania with nearly 149’000 producers. For at least the last ten years, the island state of São Tomé and Príncipe has been the country with the highest organic share of the total agricultural land, reaching a share of 24.9 percent in 2019. For the first time in 2019, Sierra Leone and Réunion (France) were among the top three countries with the highest organic share, reaching 4 percent and 3.1 percent, respectively. Egypt was right below with an organic share of 3.0 percent. So was Tunisia with an organic share of 2.9 percent.
Land use
In 2019, land use information was available for more than 91 percent of the organic agricultural area in Africa. Almost two-thirds of all organic agricultural land was used for permanent crops (almost 1.3 million hectares). Almost 30 percent was used for arable crops (nearly 536’000 hectares), and only 1.3 percent (nearly 27’000 hectares) was grassland/grazing area.
Tunisia (nearly 260’000 hectares, mainly olives), Ethiopia (over 160’000 hectares, mainly coffee), Sierra Leone (nearly 158’000 hectares, mainly cocoa), Kenya (nearly 110’000 hectares, mainly nuts), and Tanzania (nearly 107’000 hectares, mainly coffee) had the largest organic permanent crop areas.
As in previous years, coffee was the key organic permanent crop in Africa in 2019, with over 330’000 hectares reported, representing 12.5 percent of the total coffee area of the continent and 47 percent of the world’s organic coffee area. In 2019, the largest organic coffee areas were in Ethiopia (over 160’000 hectares) and Tanzania (almost 82’000 hectares). Since 2010, the organic coffee area in Africa has almost doubled. The other key organic permanent crops in the continent in 2019 were olives (nearly 244’000
1 Claudia Meier, Research Institute of Organic Agriculture FiBL, Frick, Switzerland, www.fibl.org 2 Bernhard Schlatter, Research Institute of Organic Agriculture FiBL, Frick, Switzerland, www.fibl.org 3 Olivia Keller, Research Institute of Organic Agriculture FiBL, Frick, Switzerland, www.fibl.org 4 Jan Trávníček, Research Institute of Organic Agriculture FiBL, Frick, Switzerland, www.fibl.org
Africa › Statistics
190 FiBL & IFOAM – Organics International (2021): The World of Organic Agriculture. Frick and Bonn
hectares), cocoa (more than 217’000 hectares), and nuts (nearly 187’000 hectares; mainly cashew nuts). Organic olives were grown on nearly 244’000 hectares, representing 7.3 percent of the continent’s olives area and 28 percent of the world’s organic olives area. Nearly all of the organic olives areas were in Tunisia (over 241’000 hectares). Since 2010, the organic olive area in Africa has doubled. Organic cocoa was grown on more than 217’000 hectares, representing 2.7 percent of the continent’s cocoa area and 60 percent of the world’s organic cocoa area. The largest organic cocoa areas were in Sierra Leone (nearly 80’000 hectares) and in the Democratic Republic of the Congo (nearly 72’000 hectares). Since 2010, the organic cocoa area grew more than 7-fold. Organic nuts were grown on nearly 187’000 hectares (mainly cashew nuts), representing 3.8 percent of the continent’s nuts area and 31 percent of the world’s organic nuts area. The largest organic nuts areas were in Kenya (nearly 70’000 hectares), Côte d’Ivoire (over 51’000 hectares), and Burkina Faso (nearly 36’000 hectares). Since 2010, the organic nuts area in Africa grew more than 9-fold.
The largest organic arable crop areas in 2019 were in Tanzania (over 171’000 hectares, mainly textile crops), Egypt (over 97’000 hectares, mainly medicinal and aromatic plants), and Uganda (nearly 69’000 hectares, mainly oilseeds).
As in previous years, the key organic arable crop in 2019 was oilseeds (mainly sesame), grown in 19 different countries of Africa, covering an area of almost 184’000 hectares, representing 0.6 percent of the total oilseeds area of the continent and 12 percent of the world’s organic oilseeds area. The largest organic oilseeds areas were in Uganda (nearly 45’000 hectares; mainly sesame), Burkina Faso (over 34’000 hectares; mainly sesame), and Ethiopia (over 33’000 hectares; only sesame). Since 2010, the organic oilseeds area in Africa has grown nearly 5-fold. Other key organic arable crops in Africa in 2019 were textile crops (almost exclusively cotton) and cereals (including millet, wheat, and chia). Organic textile crops covered an area of almost 86’000 hectares, representing 1.8 percent of the total textile crops area in the continent and 47 percent of the world’s organic textile crops area. The largest organic textile crop areas were in Tanzania (over 68’000 hectares). Since 2010, the organic textile crop area in Africa almost tripled. Organic cereals covered an area of more than 74’000 hectares, representing 0.1 percent of the total cereals area in the continent and 1.4 percent of the world’s organic cereal area. The key producing country of organic cereals was also Tanzania (nearly 51’000 hectares; no further crop details). Since 2010, the organic cereal area in Africa multiplied by a factor of 21.
Producers
In 2019, there were more than 850’000 organic producers in Africa. The countries with the highest number of organic producers were Uganda (over 210’000), Ethiopia (nearly 204’000), and Tanzania (nearly 149’000). It can be assumed that the total number of producers is higher because some countries only report the number of farm enterprises/companies, excluding the number of farmers/ smallholders.
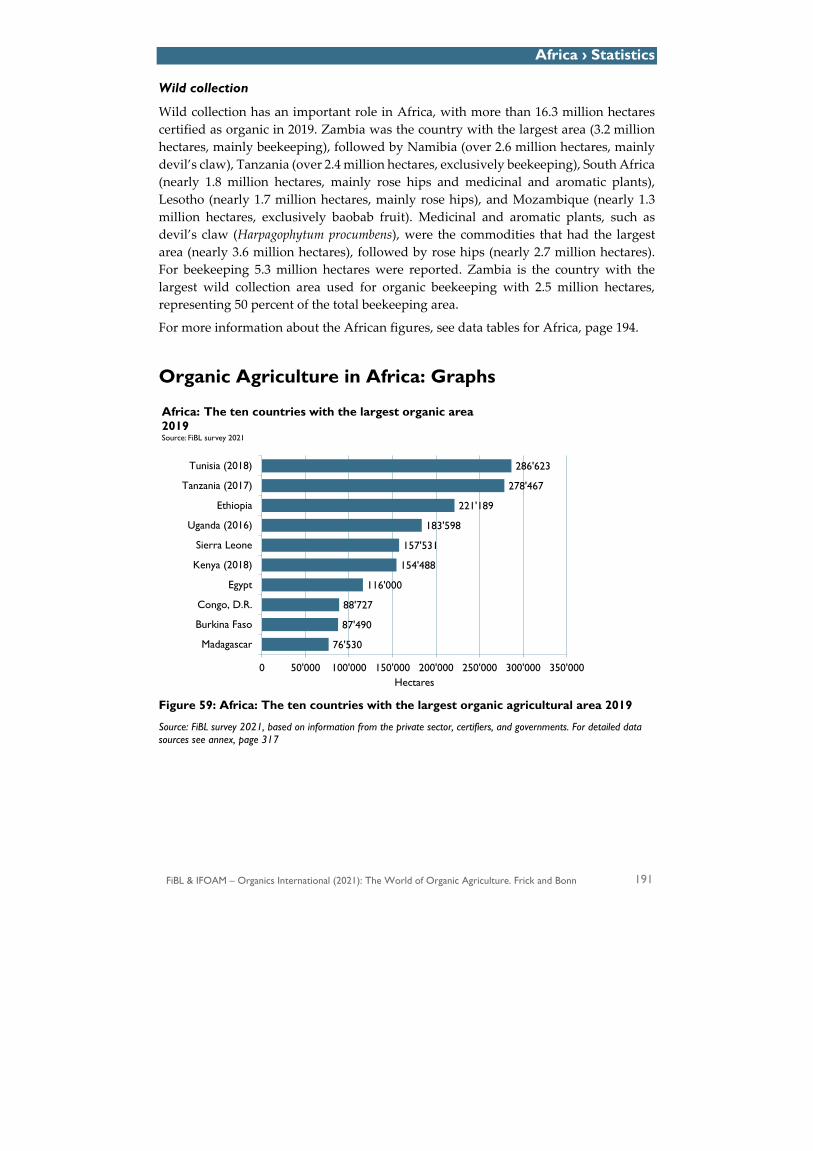
Africa › Statistics
FiBL & IFOAM – Organics International (2021): The World of Organic Agriculture. Frick and Bonn 191
Wild collection
Wild collection has an important role in Africa, with more than 16.3 million hectares certified as organic in 2019. Zambia was the country with the largest area (3.2 million hectares, mainly beekeeping), followed by Namibia (over 2.6 million hectares, mainly devil’s claw), Tanzania (over 2.4 million hectares, exclusively beekeeping), South Africa (nearly 1.8 million hectares, mainly rose hips and medicinal and aromatic plants), Lesotho (nearly 1.7 million hectares, mainly rose hips), and Mozambique (nearly 1.3 million hectares, exclusively baobab fruit). Medicinal and aromatic plants, such as devil’s claw (Harpagophytum procumbens), were the commodities that had the largest area (nearly 3.6 million hectares), followed by rose hips (nearly 2.7 million hectares). For beekeeping 5.3 million hectares were reported. Zambia is the country with the largest wild collection area used for organic beekeeping with 2.5 million hectares, representing 50 percent of the total beekeeping area.
For more information about the African figures, see data tables for Africa, page 194.
Organic Agriculture in Africa: Graphs
Figure 59: Africa: The ten countries with the largest organic agricultural area 2019
Source: FiBL survey 2021, based on information from the private sector, certifiers, and governments. For detailed data sources see annex, page 317
76'530
87'490
88'727
116'000
154'488
157'531
183'598
221'189
278'467
286'623
0 50'000 100'000 150'000 200'000 250'000 300'000 350'000
Madagascar
Burkina Faso
Congo, D.R.
Egypt
Kenya (2018)
Sierra Leone
Uganda (2016)
Ethiopia
Tanzania (2017)
Tunisia (2018)
Hectares
Africa: The ten countries with the largest organic area 2019Source: FiBL survey 2021
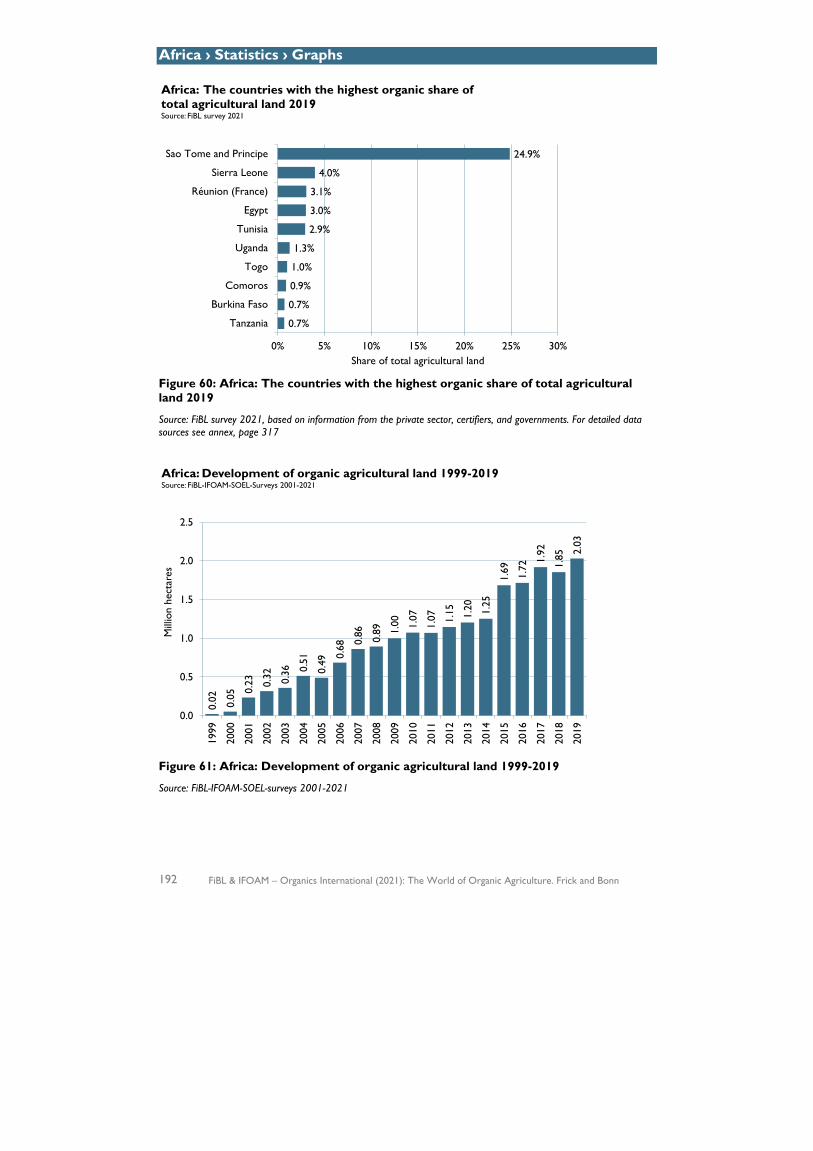
Africa › Statistics › Graphs
192 FiBL & IFOAM – Organics International (2021): The World of Organic Agriculture. Frick and Bonn
Figure 60: Africa: The countries with the highest organic share of total agricultural land 2019
Source: FiBL survey 2021, based on information from the private sector, certifiers, and governments. For detailed data sources see annex, page 317
Figure 61: Africa: Development of organic agricultural land 1999-2019
Source: FiBL-IFOAM-SOEL-surveys 2001-2021
0.7%
0.7%
0.9%
1.0%
1.3%
2.9%
3.0%
3.1%
4.0%
24.9%
0% 5% 10% 15% 20% 25% 30%
Tanzania
Burkina Faso
Comoros
Togo
Uganda
Tunisia
Egypt
Réunion (France)
Sierra Leone
Sao Tome and Principe
Share of total agricultural land
Africa: The countries with the highest organic share of total agricultural land 2019Source: FiBL survey 2021
0.02 0.05 0.
23 0.32 0.36 0.
51
0.49
0.68 0.
86 0.89 1.
00 1.07
1.07 1.15 1.20 1.25
1.69 1.72
1.92
1.85 2.
03
0.0
0.5
1.0
1.5
2.0
2.5
1999
2000
2001
2002
2003
2004
2005
2006
2007
2008
2009
2010
2011
2012
2013
2014
2015
2016
2017
2018
2019
Mill
ion
hect
ares
Africa: Development of organic agricultural land 1999-2019Source: FiBL-IFOAM-SOEL-Surveys 2001-2021

Africa › Statistics › Graphs
FiBL & IFOAM – Organics International (2021): The World of Organic Agriculture. Frick and Bonn 193
Figure 62: Africa: Use of organic agricultural land 2019
Source: FiBL survey 2021, based on information from the private sector, certifiers, and governments. For detailed data sources see annex, page 317
Figure 63: Africa: The ten countries with the largest number of organic producers 2019
Source: FiBL survey 2021, based on information from the private sector, certifiers, and governments. For detailed data sources see annex, page 317
12'272
18'375
29'214
34'613
37'295
48'443
69'505
148'609
203'602
210'353
0 50'000 100'000 150'000 200'000 250'000
Mali
Senegal
Burkina Faso
Congo, D.R.
Kenya
Togo
Madagascar
Tanzania
Ethiopia
Uganda
Producers
Africa: The ten countries with the most organic producers 2019Source: FiBL survey 2021
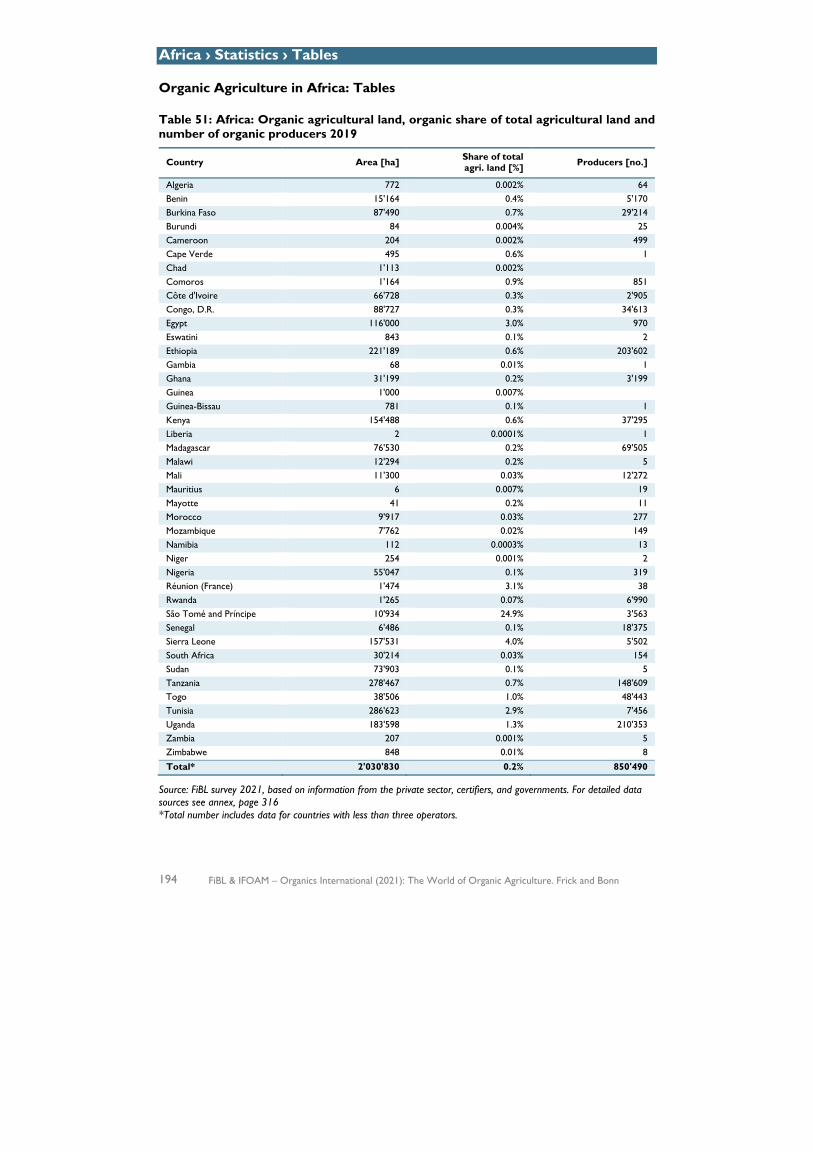
Africa › Statistics › Tables
194 FiBL & IFOAM – Organics International (2021): The World of Organic Agriculture. Frick and Bonn
Organic Agriculture in Africa: Tables
Table 51: Africa: Organic agricultural land, organic share of total agricultural land and number of organic producers 2019
Country Area [ha] Share of total agri. land [%] Producers [no.]
Algeria 772 0.002% 64 Benin 15'164 0.4% 5'170 Burkina Faso 87'490 0.7% 29'214 Burundi 84 0.004% 25 Cameroon 204 0.002% 499 Cape Verde 495 0.6% 1 Chad 1'113 0.002%
Comoros 1'164 0.9% 851 Côte d'Ivoire 66'728 0.3% 2'905 Congo, D.R. 88'727 0.3% 34'613 Egypt 116'000 3.0% 970 Eswatini 843 0.1% 2 Ethiopia 221'189 0.6% 203'602 Gambia 68 0.01% 1 Ghana 31'199 0.2% 3'199 Guinea 1'000 0.007%
Guinea-Bissau 781 0.1% 1 Kenya 154'488 0.6% 37'295 Liberia 2 0.0001% 1 Madagascar 76'530 0.2% 69'505 Malawi 12'294 0.2% 5 Mali 11'300 0.03% 12'272 Mauritius 6 0.007% 19 Mayotte 41 0.2% 11 Morocco 9'917 0.03% 277 Mozambique 7'762 0.02% 149 Namibia 112 0.0003% 13 Niger 254 0.001% 2 Nigeria 55'047 0.1% 319 Réunion (France) 1'474 3.1% 38 Rwanda 1'265 0.07% 6'990 São Tomé and Príncipe 10'934 24.9% 3'563 Senegal 6'486 0.1% 18'375 Sierra Leone 157'531 4.0% 5'502 South Africa 30'214 0.03% 154 Sudan 73'903 0.1% 5 Tanzania 278'467 0.7% 148'609 Togo 38'506 1.0% 48'443 Tunisia 286'623 2.9% 7'456 Uganda 183'598 1.3% 210'353 Zambia 207 0.001% 5 Zimbabwe 848 0.01% 8
Total* 2'030'830 0.2% 850'490
Source: FiBL survey 2021, based on information from the private sector, certifiers, and governments. For detailed data sources see annex, page 316 *Total number includes data for countries with less than three operators.
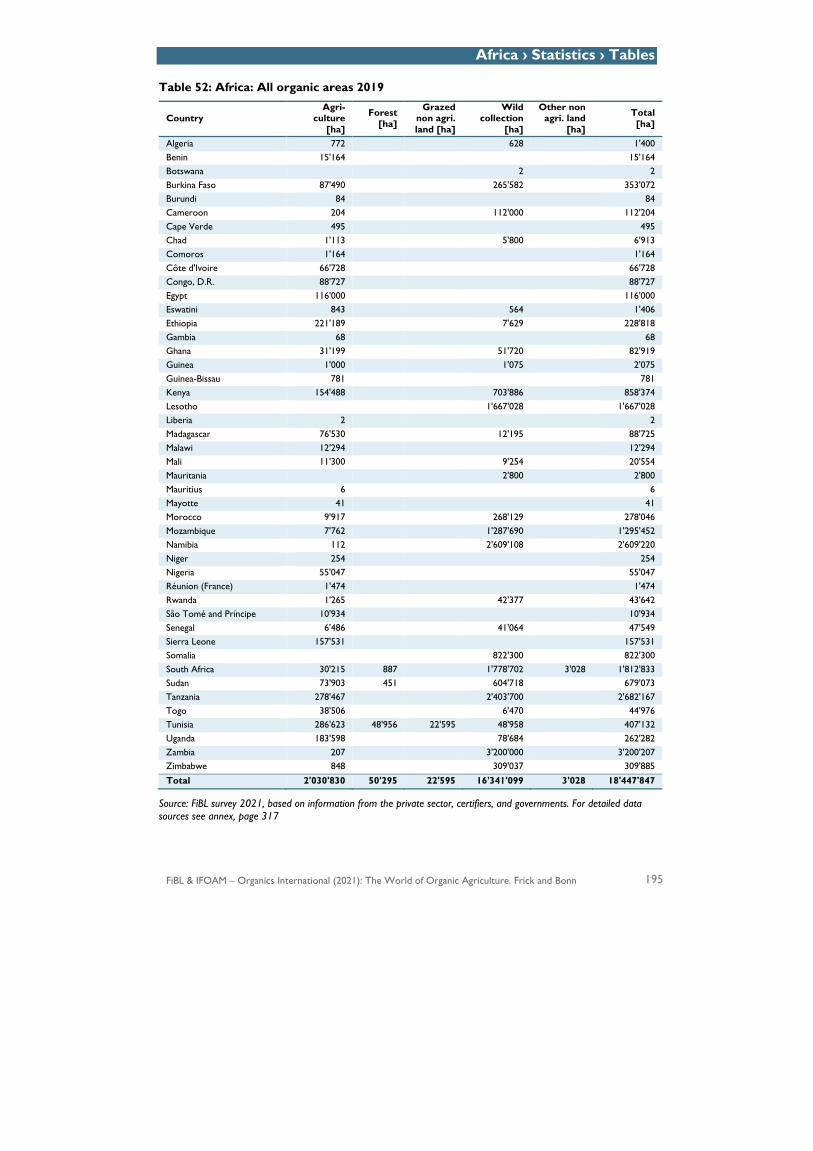
Africa › Statistics › Tables
FiBL & IFOAM – Organics International (2021): The World of Organic Agriculture. Frick and Bonn 195
Table 52: Africa: All organic areas 2019
Country Agri-
culture [ha]
Forest [ha]
Grazed non agri. land [ha]
Wild collection
[ha]
Other non agri. land
[ha]
Total [ha]
Algeria 772 628 1'400 Benin 15'164 15'164 Botswana 2 2 Burkina Faso 87'490 265'582 353'072 Burundi 84 84 Cameroon 204 112'000 112'204 Cape Verde 495 495 Chad 1'113 5'800 6'913 Comoros 1'164 1'164 Côte d'Ivoire 66'728 66'728 Congo, D.R. 88'727 88'727 Egypt 116'000 116'000 Eswatini 843 564 1'406 Ethiopia 221'189 7'629 228'818 Gambia 68 68 Ghana 31'199 51'720 82'919 Guinea 1'000 1'075 2'075 Guinea-Bissau 781 781 Kenya 154'488 703'886 858'374 Lesotho 1'667'028 1'667'028 Liberia 2 2 Madagascar 76'530 12'195 88'725 Malawi 12'294 12'294 Mali 11'300 9'254 20'554 Mauritania 2'800 2'800 Mauritius 6 6 Mayotte 41 41 Morocco 9'917 268'129 278'046 Mozambique 7'762 1'287'690 1'295'452 Namibia 112 2'609'108 2'609'220 Niger 254 254 Nigeria 55'047 55'047 Réunion (France) 1'474 1'474 Rwanda 1'265 42'377 43'642 São Tomé and Príncipe 10'934 10'934 Senegal 6'486 41'064 47'549 Sierra Leone 157'531 157'531 Somalia 822'300 822'300 South Africa 30'215 887 1'778'702 3'028 1'812'833 Sudan 73'903 451 604'718 679'073 Tanzania 278'467 2'403'700 2'682'167 Togo 38'506 6'470 44'976 Tunisia 286'623 48'956 22'595 48'958 407'132 Uganda 183'598 78'684 262'282 Zambia 207 3'200'000 3'200'207 Zimbabwe 848 309'037 309'885
Total 2'030'830 50'295 22'595 16'341'099 3'028 18'447'847
Source: FiBL survey 2021, based on information from the private sector, certifiers, and governments. For detailed data sources see annex, page 317
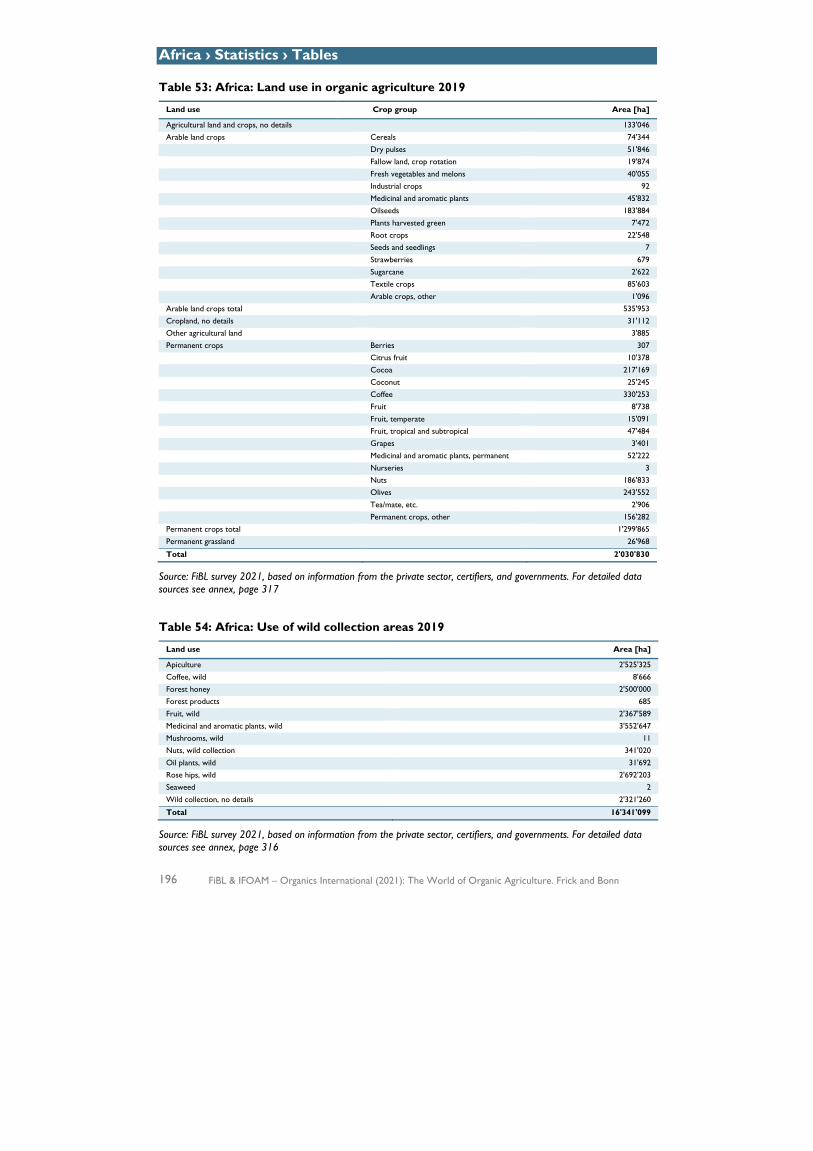
Africa › Statistics › Tables
196 FiBL & IFOAM – Organics International (2021): The World of Organic Agriculture. Frick and Bonn
Table 53: Africa: Land use in organic agriculture 2019
Land use Crop group Area [ha]
Agricultural land and crops, no details 133'046 Arable land crops Cereals 74'344 Dry pulses 51'846 Fallow land, crop rotation 19'874 Fresh vegetables and melons 40'055 Industrial crops 92 Medicinal and aromatic plants 45'832 Oilseeds 183'884 Plants harvested green 7'472 Root crops 22'548 Seeds and seedlings 7 Strawberries 679 Sugarcane 2'622 Textile crops 85'603 Arable crops, other 1'096 Arable land crops total 535'953 Cropland, no details 31'112 Other agricultural land 3'885 Permanent crops Berries 307 Citrus fruit 10'378 Cocoa 217'169 Coconut 25'245 Coffee 330'253 Fruit 8'738 Fruit, temperate 15'091 Fruit, tropical and subtropical 47'484 Grapes 3'401 Medicinal and aromatic plants, permanent 52'222 Nurseries 3 Nuts 186'833 Olives 243'552 Tea/mate, etc. 2'906 Permanent crops, other 156'282 Permanent crops total 1'299'865 Permanent grassland 26'968
Total 2'030'830
Source: FiBL survey 2021, based on information from the private sector, certifiers, and governments. For detailed data sources see annex, page 317
Table 54: Africa: Use of wild collection areas 2019
Land use Area [ha]
Apiculture 2'525'325 Coffee, wild 8'666 Forest honey 2'500'000 Forest products 685 Fruit, wild 2'367'589 Medicinal and aromatic plants, wild 3'552'647 Mushrooms, wild 11 Nuts, wild collection 341'020 Oil plants, wild 31'692 Rose hips, wild 2'692'203 Seaweed 2 Wild collection, no details 2'321'260
Total 16'341'099
Source: FiBL survey 2021, based on information from the private sector, certifiers, and governments. For detailed data sources see annex, page 316
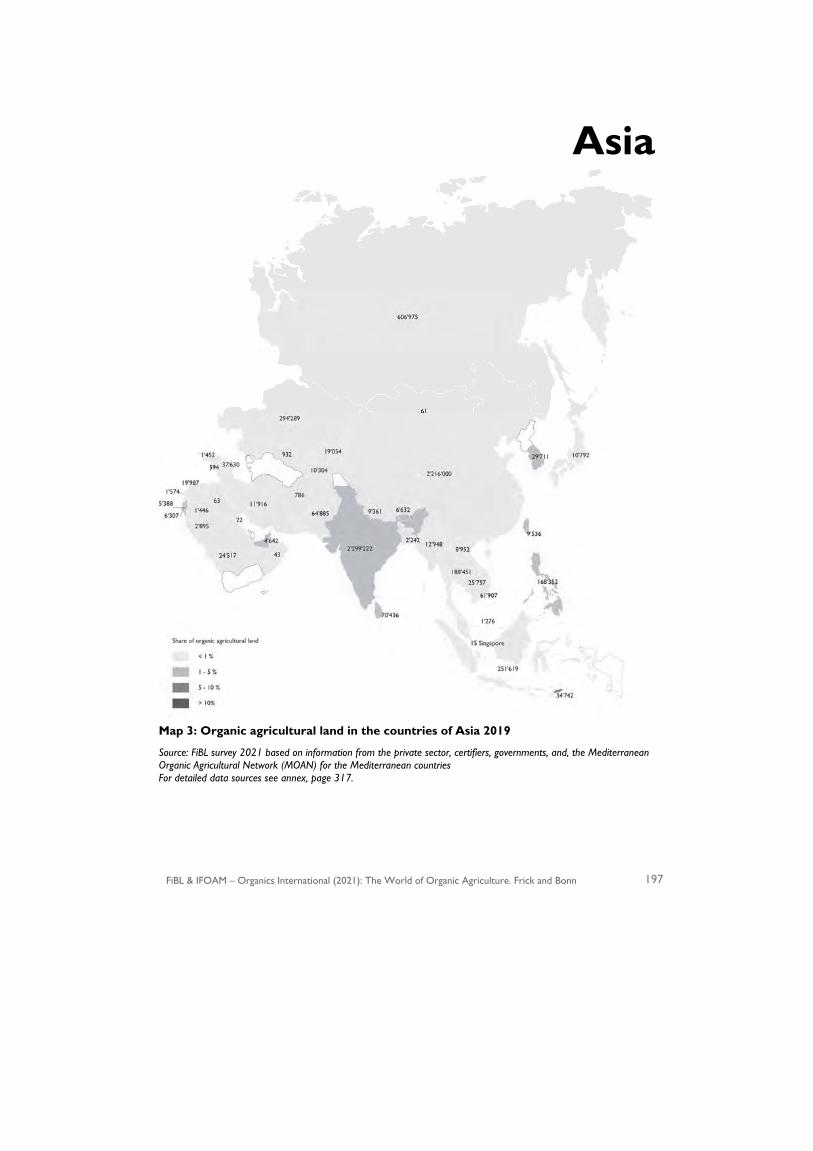
FiBL & IFOAM – Organics International (2021): The World of Organic Agriculture. Frick and Bonn 197
Asia
Map 3: Organic agricultural land in the countries of Asia 2019
Source: FiBL survey 2021 based on information from the private sector, certifiers, governments, and, the Mediterranean Organic Agricultural Network (MOAN) for the Mediterranean countries For detailed data sources see annex, page 317.
Asia › Overview
198 FiBL & IFOAM – Organics International (2021): The World of Organic Agriculture. Frick and Bonn
Developments in the Organic Sector in Asia in 2020
SHAIKH TANVEER HOSSAIN,1 JENNIFER CHANG2 AND VIC ANTHONY JOSEPH FABRE TAGUPA3
Together with the rest of the world, Asia has suffered a lot due to the effects of COVID-19. As traditional markets, schools, offices and other establishments were shut down, every stakeholder across the supply chain was affected in some way. However, the resiliency of many countries in Asia was highlighted, as they searched for ways to mitigate the effects of the pandemic. In South Korea, school closures meant the cessation of school meals, which was a significant income source for many organic farmers. In response, a Countermeasures Committee for COVID-19 was established, providing thousands of food packages of environmentally-friendly farm products to more than 6’000 self-quarantined people.
There have been major policy developments related to the organic sector in some Asian countries. In Japan, there was a major development in the Basic Plan for Agriculture and Management, aiming to triple the number of organic farmers and organic land by 2030. In Indonesia, The National Medium-Term Development Plan IV (2020-2024) will increase the policies related to organic agriculture - under the ‘1000 organic villages’ program through the continuous collaboration of various government ministries. Finally, the Philippines had one of the most significant milestones in organic agriculture with the amendment of the Organic Act of 2010, including Participatory Guarantee Systems (PGS) under the country’s national organic standards.
The pandemic has highlighted the importance of healthy food, and consumers are changing their lifestyles towards healthy and responsible consumption. According to a study by Singapore-based startup Ai Palette, Indonesia and the Philippines saw a significant increase in the demand for fresh produce, with the latter registering a 444 percent year-on-year growth for fresh produce over frozen and canned varieties4. In China, a commerce giant predicted a rise in healthy food options as a result of the pandemic. The organic sector became a hotspot for investment, and up to 89 certification bodies were established in China in 2020 alone.
Bangladesh
In Bangladesh, some products have gained importance in the organic sector, including organic jute, cotton, and livestock, among others. The Bangladesh Jute Research Institute (BJRI) and the Jute Diversification Promotion Center (JDPC) have developed
1 Ambassador, IFOAM Organics International and Former Vice-President, IFOAM Asia 2 Executive Director, IFOAM Asia 3 Chief Operations Officer, IFOAM Asia 4 WARC (6 December, 2020). COVID-19 shifts food trends in Southeast Asia. Available at https://www.warc.com/newsandopinion/news/covid-19-shifts-food-trends-in-southeast-asia/43717

Asia › Overview
FiBL & IFOAM – Organics International (2021): The World of Organic Agriculture. Frick and Bonn 199
a herbal drink technology made from organic jute leaf and has marketed the product as Jute Green Tea.’
A project has been launched in collaboration with Intertrop, a German-based jute product manufacturing company with 7.5 hectares of land and 41 cooperative farmers in Lemubari, Manikgonj, to produce jute organically and to certify it under the European regulations. In 2018-19, around 2.5 metric tons of organic jute tea were exported to Germany.1 A product with excellent potential is a jute bag called ‘Sonali (golden) Bag,’ a biodegradable and environment-friendly product.
According to the Global Organic Textile Standard (GOTS) latest 2019 report, Bangladesh is now leading the global organic textile production and topped the list of organic textile-producing countries in terms of total numbers of GOTS-certified facilities. In 2019, 505 Bangladeshi factories received the GOTS-certification, followed by India (438) and Europe (396). Currently, Bangladesh has 1’194 organic textile facilities, and the growth rate of GOTS certification was more than 73 percent, which is the highest globally, simultaneously with the Netherlands2. Bangladesh has also imported nearly eight million bales of cotton annually, including six percent organic cotton imported from India and the United States3. The Cotton Development Board (CDB) recently launched a program to produce organic cotton to fulfil Bangladesh’s organic cotton demand.
Organic livestock is an emerging sector in Bangladesh. Government, non-governmental organisations (NGOs) and new entrepreneurs have developed livestock enterprises that follow organic practices in the last two years. Supermarkets in big cities have started an ‘Organic corner’ to sell organic products. Many young entrepreneurs were also observed to have started online businesses to sell high-valued organic fruits, vegetables and even livestock products to health-conscious consumers.
Cambodia
Cambodia has been a focus for international development interventions since the early 1990s. After thirty years of civil war, agricultural production was primarily subsistence farming until recent years, with rice as the main crop for self-consumption.
When “value-chain” became the trend word in the development sector in 2010, international development actors’ interest turned to organic products. With no equivalent word for “organic” in the local language, the concept of “organic” itself was not comprehensible for many Cambodians. In most cases, it was understood as farming without chemical input.
1 Daily Sun: Bangladesh to export 5 metric tons tea produced from jute leaves this year, September 9, 2019. Available at https://www.daily-sun.com/post/422234/Bangladesh-to-export-5-metric-tons-tea-produced-from-jute-leaves-this-year 2 The Business Strandard (March 12, 2020): Bangladesh leads global organic textile production. The TBSNews website. Available at https://tbsnews.net/economy/bangladesh-leads-global-organic-textile-production-55339 3 Mirdha, Refayet Ullah (2019): Organic push earns global praise. In: The Daily Star, March 21, 2019 Available at https://www.thedailystar.net/business/organic-textile-manufacturing-earns-global-praise-1718191
Asia › Overview
200 FiBL & IFOAM – Organics International (2021): The World of Organic Agriculture. Frick and Bonn
The Cambodian Organic Agriculture Association (COrAA), the only current domestic organic certification body, was established through an international development initiative in 2006. The organisation still struggles to create a ‘localised’ and ‘self-sustaining’ certification model. In 2019, 34 operators in Cambodia were certified under the US NOP1. The year 2020 saw the expansion of exports of organic products through contract farming with smallholder farmers. Rice remained the main crop, with cassava and cashew nuts in the pilot stage.
The Cambodian Government introduced an organic agriculture policy in April 2020 to boost production and exports. This policy is expected to launch the rules and a unique logo to identify locally produced certified organic food.
China
The COVID-19 pandemic created big challenges for China’s economy and created a significant change in its people’s lifestyle in 2020. E-commerce, especially live-streaming, played an important role in stimulating the economy. COVID-19 raised the issue of healthy food consumption, and the organic sector became a hotspot for investment. As a result, in 2020, 89 certification bodies were established.
The central government has geared its efforts towards developing rural areas by promoting organic agriculture. According to the ‘Two mountains’ theory highlighted by the President Xi Jinping, the annual ‘No 1 central government policy’ and the 2020 ‘Agriculture and Rural Green Development Key Points’ of the Ministry of Agriculture and Rural Affairs of the People’s Republic of China, both emphasise enhancing certified organic management. On September 21st, 2020, the State Administration for Market Regulation launched the Organic Product Certification Promotion Week with the slogan ‘Guard the Green Water and Mountain, Share the Green Life’. 2020 was the first time that one of the provincial governments - Jiangxi Province – stated that organic vegetable certification should be stimulated by their policy ‘developing vegetable production in a high-quality way’.
China is seeking more international cooperation in the organic sector, based on the ‘One Road and One Belt’ national policy. Many organic products were shown in the 3rd China International Import Expo in Shanghai in 2020. The State Administration for Market Regulation launched a project to compare China’s organic regulation and management system with the IFOAM Norms2 and the U.S. National Organic Programme (NOP) standards.
India
The COVID-19 crisis darkened whatever dreams remained for Indian farmers. Even
1 US NOP is the United States National Organic Programme. Information is available at https://www.ams.usda.gov/about-ams/programs-offices/national-organic-program 2 IFOAM – Organic s International (2021 –Online): The IFOAM Norms form the basis of the Organic Guarantee System of IFOAM - Organics International. The IFOAM website., available at https://www.ifoam.bio/our-work/how/standards-certification/organic-guarantee-system/coros
Asia › Overview
FiBL & IFOAM – Organics International (2021): The World of Organic Agriculture. Frick and Bonn 201
though the agriculture sector witnessed a 3.4 percent growth in GDP due to better than average rainfall in most parts of the country, the small-scale and peasant farmers were not part of this growth story. They were unable to access organic markets due to the incessant lockdowns and subsequent limitations of movement.
Meanwhile, India has enacted three major ordinances1 that will have an impact on agriculture:
! The Farmers’ Produce Trade and Commerce (Promotion and Facilitation) Ordinance, 2020: Allowing liberal trade, increasing competition amongst buyers, removing barriers in interstate trade and offering more options to sell and buy.
! The Farmers’ (Empowerment and Protection) Agreement on Price Assurance and Farm Services Ordinance, 2020: Facilitating visibility and assurance of price to farmers at the time of sowing, minimising market risks, solving issues of erratic food pricing and encouraging contract farming.
! The Essential Commodities (Amendment) Ordinance 2020: Boosting private investments in agriculture supply chains, food processing industries, and export infrastructure.
The specific impact of these ordinances on organic farming and organic markets is yet to be assessed.
The country has witnessed a surge in certification, even though there were challenges with inspections and appraisals during the lockdown. The number of Participatory Guarantee System (PGS) certified farmers under the government-administered PGS system has risen to almost one million farmers2 in five years, while about 1.3 million farmers are certified under third party systems.
‘Northeast India can become a huge hub of organic farming and the capital for organic products with its own identity in the world’ Prime Minister Narendra Modi said in one of his recent inaugural addresses. With more than 75 percent of the area under forests in the Northeast region and most farmers practising organic farming by default, there is vast potential for including these farmers within the ambit of certified organic markets. The government policies and interventions are following in Sikkim's footsteps – the first organic state in the country.
Indonesia
In 2020, the National Medium-Term Development Plan IV (2020-2024) was launched to increase organic agriculture programs and policies throughout the country. The plan aims to increase organic agriculture through the ‘1000 organic villages’ program, which is implemented through the Ministry of Agriculture, the Ministry of Villages, 1 Krishi, Atmanirbhar and Aatmanirbhar Bharat (2020): A Step towards Transformation of Agriculture into Sustainable Enterprises. The website of the Government of India mygov.in. Available at https://blog.mygov.in/atmanirbhar-krishi-aatmanirbhar-bharat/ 2 Department of Agriculture & Cooperation, Ministry of Agriculture and Farmers Welfare, Government of India (2020): Participatory Guarantee System for India. The PGS-India website. Available at https://pgsindia-ncof.gov.in/
Asia › Overview
202 FiBL & IFOAM – Organics International (2021): The World of Organic Agriculture. Frick and Bonn
Development of Disadvantaged Regions and Transmigration and the Ministry of Trade.
There was an increase in organic products, mostly driven by demand for organic herbs, essential oils, ingredients for cosmetics, and organic coconuts. During the COVID-19 pandemic, domestic and international demand for organic products increased, particularly for organic spices and herbs.1
At the farm level, there are more and more initiatives to promote PGS. The Indonesia Organic Alliance initiated the foundation PAMOR (Indonesia PGS) in several places in Sumatra and Java. The number of communities or farmer groups under PGS is also increasing.
At the government level, more districts are promoting organic programs through the development of specialty products such as rice, coconuts, coffee, herbs and spices, which are certified organic according to national or international standards. There is also a growing interest among local government to be part of the Asian Local Governments for Organic Agriculture (ALGOA).2 The central government, through the Ministry of Agriculture, the Ministry of Trade and the Ministry of Cooperatives and Small and Medium Enterprises (SMEs), are also more actively supporting farmer groups. For example, SMEs and companies have participated in regional and international trade fairs, such as Biofach.
Japan3
The Ministry of Agriculture, Forestry and Fisheries (MAFF) in Japan revised ‘The Basic Plan for Agricultural Production and Management’ in March 2020, which includes promoting organic agriculture. The Basic Plan acknowledges that organic agriculture contributes to biodiversity enhancement and climate change mitigation and complies with the Sustainable Development Goals (SDGs). The Basic Plan aims to triple the number of organic farmers and organic land in the country by 2030. It also seeks to increase the organic food market to 328 billion yen by 20304, from 185 billion yen in 20175.
Local governments have started responding to demands to support organic agriculture and sustainable food systems, especially during the COVID-19 pandemic. A concrete example is the establishment of the Local Organic SATO Association Chiba (LOSAC). This alliance of local governments, farmer groups, consumer groups, retailers and other businesses and institutions was established in February 2020. The LOSAC aims to build 1 Firman, AR and David W. (2020) Statistik Pertanian Organik Indonesia.Indonesia. Organic Alliance https://www.researchgate.net/publication/342945242_Statistik_Pertanian_Organik_Indonesia_2019 2 A daughter organization of IFOAM Asia, which was set up in 2015 to promote cooperation among local governments promoting organic agriculture. Currently, there are more than 250 members in 16 countries in Asia. 3 Sources: http://www.maff.go.jp/e/ - the website of the Japanese Ministry of Agriculture MAFF and http://www.env.go.jp/en/index.html - the website of the Japanese Ministry of the Environment. 4 Approximatly 2.6 billion euros 5 Approximatly 1.4 billion euros
Asia › Overview
FiBL & IFOAM – Organics International (2021): The World of Organic Agriculture. Frick and Bonn 203
sustainable local and organic food systems, such as the procurement of organic school meals and micro-distribution system for local consumption.
Mongolia
The Mongolian Parliament approved the Law on Organic Food in April 2016. Its Action Plan for 2016-2020 sets a goal of ‘creating a legal environment for organic food production and implementing financial, investment and tax policies to develop this sector’. To ensure the implementation of the Law on Organic Food, the Ministry of Food, Agriculture and Light Industry approved several regulations, including the ‘Order No. A-09 and A-180’ in 2018. With the approval of all the procedures, methodology and the list that accompanied the Law on Organic Food, the legal environment for organic food and agricultural production in Mongolia was successfully implemented.
The organic food registration and information database (www.organic.gov.mn) was launched in 2018 and was funded by the Food and Agriculture Organization (FAO) - Mongolia office. Currently, 16 participatory guarantee systems initiatives and one third-party certification body conduct organic food verification and certification in the country. Consumers can easily contact the manufacturer for information on certified, organic, and in-conversion organic products. In the database, 291 local organic and in-conversion products and 71 imported organic food products were registered as of 2020.
Pakistan
The Directorate of Organic Farming was established in 2008 with the aim to help small farmers. Innovative organic farming techniques were introduced, like bio-fertilisers, bio-herbicides and bio-pesticides. The program was a success, prompting the government to upgrade the Directorate of Organic Farming to the National Institute of Organic Agriculture.
The Government of Pakistan has also developed the Network of Organic Agriculture in Pakistan (NEOAP) to register organic farmers and traders. Private firms can register and be verified as organic farming entities. These organic farms have to be certified according to the EU regulation on organic farming (EC 834/2007) or the U.S. National Organic Program. Farmers sell produce to specified locations or may sell to certified firms. But the certification costs for farmers remain high.
In 2017, the State Government of Punjab proposed the “Punjab Organic Farming Act”. Currently, it is still in draft form, but it covers all aspects of organic farming and establishes accreditation bodies within the province of Punjab's jurisdiction to standardise organic farming in the area.
Philippines
The Organic Act of 2010 outlines the development and promotion of organic agriculture in the Philippines and the establishment of comprehensive organic agriculture programs in the country. It also established the National Organic Agriculture Board (NOAB), which is responsible for the implementation of the policies and programs.

Asia › Overview
204 FiBL & IFOAM – Organics International (2021): The World of Organic Agriculture. Frick and Bonn
In 2020, the Philippines saw one of its most significant milestones with the amendment of the Organic Act of 2010, under which the resolution for the inclusion of PGS in the national organic standards was approved. Finally, smallholder farmers, which comprise most of the country's farmers, will now have the chance to be certified organic through PGS.
The Province of Negros Occidental, with the assistance of the Negros Island Sustainable Agriculture and Rural Development Foundation, Inc. (NISARDFI), has been a pioneer in promoting and driving the organic agricultural movement in the Negros Islands. They have expanded smallholder farmers’ capacities to grow healthy crops and sustain their lives and livelihoods in harmony with the earth and its natural resources.
As of 2019, the cumulative land of all the organic farmers participating in the annual Negros Island Organic Farmers Festival was 20’000 hectares of land planted with different organic crops and more than 10’000 smallholders.
In 2019, 143 scholars graduated from the Agriculture, Forestry, and Agri Engineering track of the Central Philippine State University (CPSU) and the Fisheries track from the Carlos Hilado Memorial College. This results from a joint project between NISARD, the Philippine Reef and Rainforest Conservation Foundation, Inc (PRRCFI) and the Department of Agriculture (DA). As part of the continuing advocacy of NISARD to create a holistic and sustainable organic agriculture ecosystem, some of NISARD trustees along with other private individuals established a social enterprise, FamilyFarms Inc. and set up an organic certified rice mill in Bago City, Negros Occidental, to provide an opportunity for more than 250 organic rice farmers (42 percent women) from all over the island to mill their crops.
South Korea
In 2019, South Korea was affected by unprecedented climatic changes seriously affecting farm harvest, especially fruits, such as pears and oranges. Drastic government measures were set up to develop and implement policies to address climate emergencies and the raging COVID-19 pandemic. The policies aim to stabilise food supply and achieve zero carbon emissions by 2050. A Special Presidential Committee on Farming, Fishery, and Rural Affairs was established to prepare measures for the transformation into a decarbonised-ecological (organic) agriculture.
From 2019, the consumption of environmentally-friendly food1 in the public sector increased as government support was expanded from school meals to the ‘future generations’ under the concept that safe and nutritious food should be served from the early stages of conception to birth. More than 88’000 pregnant women and new mothers received support packages which contained environmentally-friendly food. Furthermore, 5700 tons of environmentally-friendly rice were also provided to military bases nation-wide in 2020.
1 Pesticide-free and organic food.
Asia › Overview
FiBL & IFOAM – Organics International (2021): The World of Organic Agriculture. Frick and Bonn 205
To increase public awareness, June 2nd (same phonetic sound as ‘organic’ in Korean) has been designated as ‘Organic Day’1. Also, Fridays were designated as ‘Save the Planet Day’, and public cafeterias in government agencies have begun serving meals with at least one ingredient from environmentally-friendly production. The ‘Eco-Friday Campaign’ increased consumers’ awareness of the benefits of environmentally-friendly agriculture for the common good.
In 2020, the onset of COVID-19 led to school closures and the cessation of school meals, seriously affecting the local farmers, and the ‘Committee for Environmentally-Friendly Agriculture COVID-19 Countermeasure’ was established to overcome the crisis. The central and local governments supplied 18’000 food packages and provided 6’861 people under self-quarantine with environmentally-friendly produce. Organic cooperatives and more than 11 large scale retail food outlets assisted in selling these products worth over 2.8 million U.S. dollars2. Furthermore, over 5.77 million households with school children received home deliveries of environmentally-friendly food packages. Finally, in August 2020, the certification system for processing was introduced to promote food processing in the organic sector. It uses pesticide-free produce, 70 percent of which is organic produce.
Sri Lanka
The country is considered a pioneer in the Asian region, introducing organic-certified tea and cinnamon to the world market. Currently, Sri Lanka has boosted Ceylon Organic Green Tea production. Sri Lankan coconut farmers have also turned their attention towards organic coconut plantations to meet the growing demand for organic coconut products worldwide. Sri Lankan organic products include tea, coconut-based products, spices such as pepper, cardamom, cloves, nutmeg, cinnamon and ginger, tubers and vegetables, coffee, cocoa, fruits such as pineapple, papaya, banana, lime and mango, juices, rice, cashew, processed products, and products such as kitul treacle, jaggery and bee products.
Today, organic farmers receive higher returns than their conventional counterparts. Consumers are ready to pay a premium of 30 percent for food products free of chemical and genetically modified material.
The Centre of Excellence for Organic Agriculture, which was involved in organic agriculture research, extension and development was merged with the Sustainable Agriculture Research and Development Centre, aiming to develop more technologies, high-quality organic fertiliser and other inputs, PGS and organic certification.
Organic villages were established and promoted, targeting female farmers, initiating village-level markets, and developing a few markets with large-scale market chains via PGS certification. The Sri Lanka Export Development Board and the Sri Lanka Standard
1 In 2019, more than 2´500 shops recorded sales of over 30 million US dollars during the celebrations. In 2020, environmentally-friendly food worth over 2 million US dollars was donated to lower-income families. 2 Approximately 2.3 million euros.
Asia › Overview
206 FiBL & IFOAM – Organics International (2021): The World of Organic Agriculture. Frick and Bonn
Institute are two major institutes involved in promoting organic agriculture, providing export market facilities and training, as well as setting up quality standards for organic products, composts, and liquid fertilisers. Another initiative is the public-private partnership program to commence organic farming on 3’600 hectares in the unpolluted area of Moragahakanda-Kaluganga situated in the Mahaweli F1 Zone.
Vietnam
Several policies were issued in the past several years that paved the way for the continuous development of organic agriculture in Vietnam, including the National Organic Standards TCVN 11041 in 2017, the Organic Decree 109 in 2018, the Circular 16 Guiding Decree in 2019, and most recently the National Organic Development Program for 2020-2030, which was signed in June 2020 by the national government.
Despite the development of policies to support organic, many challenges remain due to the lack of specific organic farming guidelines. Even though already acknowledged as an effective quality assurance system, PGS has not yet been officially recognised as a certification system. Despite some challenges, 2019-2020 is considered a milestone in the history of organic agriculture development in Vietnam due to the series of policies, which have been launched and implemented, boosting the overall development of organic agriculture in the country. IFOAM Asia in 2020
In 2020, IFOAM Asia concentrated on strengthening its internal structures and sectors and expanding the networking activities of the Asian Local Governments for Organic Agriculture (ALGOA).
The IFOAM Asia offices in China and the Philippines have been legally consolidated and are in full operation. The Asian Organic Youth Forum, an active sector under IFOAM Asia, carried out two very successful Forums in New Taipei City and Nagaland and took the initiative to expand its organic youth network globally by launching the Young Organics-Global Network2 in September 2020.
The Asian Local Governments for Organic Agriculture ALGOA celebrated its 5th anniversary. The ALGOA events were held in two virtual live conferences attended by more than a thousand people from 46 countries. Three ALGOA Centers hosted by different local governments and partners were set up to facilitate its work – the ALGOA Center for Organic Leadership (Goesan County), the ALGOA Center for Public Procurement (New Taipei City) and the ALGOA Center for Organic Governance (LOAMCP-Ph3).
1 The Mahaweli Development program is known as the largest multipurpose national development program in the history of Sri Lanka and is also considered as the keystone of the government's development program that was initiated in 1961 2 www.yoglobalnetwork.com – the website of the the Young Organics-Global Network. 3 League of Organic Municipalities, Cities and Provinces of the Philippines
Asia › Overview
FiBL & IFOAM – Organics International (2021): The World of Organic Agriculture. Frick and Bonn 207
The 6th ALGOA Summit was a historic occasion as ALGOA took the initiative in linking with the International Network of eco-regions and other European partners, to launch the Global Alliance of Organic Districts (GAOD)1 – a global alliance of organic districts from all continents. High-level speakers from the United Nation’s Environment Programme (UNEP) and the United Nation’s Food and Agriculture Organisation (FAO) also participated in the events.
Contributors Bangladesh › Dr. Md. Khurshid Alam, Principal Scientific Officer, Bangladesh Agricultural Research Institute (BARI),
Bangladesh › Dr Shaikh Tanveer Hossain, Ambassador IFOAM - Organics International, Former Vice-President, IFOAM
Asia Cambodia › Ayuumi Matsuura, Director, IVY Cambodia China › Li Feng, Country Director, IFOAM Asia China Office Japan › Miyoshi Satoko, Vice President, IFOAM Asia, Ambassador Asian Local Governments
for Organic Agriculture ALGOA India › Joy Daniel, Director, Lipok Social Foundation Indonesia › Dr. agr. Wahyudi David, Faculty Member, Food Science and Technology Program; Universitas Bakrie;
Associate Editor at Journal Organic Agriculture, Editor in Chief at Asia Pacific Journal of Agriculture Food and Energy
Mongolia › Tungalag Davaa, Senior officer, Department of Coordination for Food Production Policy
Implementation, Ministry of Food Agriculture and Light Industry of Mongolia Pakistan › Dr Zuhair Hasnain, Assistant Professor, PMAS Arid Agriculture University Philippines › Edgardo Uychiat, President, Negros Island Sustainable Agriculture and Rural Development Foundation,
Inc. (NISARD) › Victoriano Ihong Tagupa, Executive Director, League of Organic Agriculture Municipalities, Cities and
Provinces in the Philippines (LOAMCP-Ph) South Korea › Dong-Geun Choi, Executive Director, Korea Organic Checkoff Board, Namyangju City, Gyeonggi
Province, Republic of Korea › Manchul Jung, Director, Korea Institute for Local Governance and Rural Affairs, Chungnam Province,
Republic of Korea Sri Lanka › Priyanga S. Dissanayake, Soil Scientist, Assistant Director of Agriculture Research, Sustainable Agriculture
Research and Development Centre, Department of Agriculture, Sri Lanka, › Dr. P.I. Yapa, Professor in Crop Science, Sabaragamuwa University of Sri Lanka, Belihuloya, Sri Lanka › R.P.N. Gunaratne, Agriculture Instructor, Sustainable Agriculture Research and Development Centre,
Department of Agriculture, Makandura, Sri Lanka Vietnam › Dang Thi Bich Huong, Deputy Chief, Vietnam Organic Agriculture Association
1 www.gaod.online – website of the Global Alliance of Organic Districts (GAOD)

Asia › Statistics
208 FiBL & IFOAM – Organics International (2021): The World of Organic Agriculture. Frick and Bonn
Asia: Current statistics
CLAUDIA MEIER,1 BERNHARD SCHLATTER,2 OLIVIA KELLER3 AND JAN TRÁVNÍČEK4
Overview
In 2019, the area of organic agricultural land in Asia was more than 5.9 million hectares, representing 0.4 percent of the total agricultural area in the region. Eight percent of the global organic agricultural land was in Asia. Since 2001, the organic land in the region has grown over fourteen-fold. Between 2018 and 2019, however, there was a decrease in the organic area of 7 percent, mainly due to a decrease of temporary grassland in China (over 663’000 hectares). As in previous years, China and India were the countries with the largest organic agricultural area in Asia in 2019. In 2019, India for the first time surpassed China with a total organic agricultural area of 2.3 million hectares. China’s organic agricultural area was 2.2 million hectares, over 919’000 million hectares less than in 2018, representing a loss of 29 percent. The country with the highest number of organic producers was India, with nearly 1.4 million producers. For more than ten years, the country with the highest organic share of total agricultural land has been Timor-Leste (8.5 percent in 2019).
Land use
In 2019, 49 percent of all organic farmland in Asia was used for arable crops (over 2.9 million hectares), 14 percent (over 795’000 hectares) for permanent crops and 1 percent for grassland/grazing areas (nearly 65´000 hectares). For 36 percent of the organic agricultural land, no land use information was available. Since 2013, cereals have been the key organic arable crop group (mainly wheat, rice, and maize), with almost 1.3 million hectares in 2019, representing 0.4 percent of the total cereal area in Asia and 25 percent of the world’s organic cereal area. In 2019, most organic cereals were grown in China (810’000 hectares), Thailand (over 169’000 hectares) and Kazakhstan (more than 146’000 hectares). The key organic cereals were rice, wheat, and maize. Organic rice represented 47 percent of the total organic cereal area and, together with wheat (25 percent) and grain maize (17 percent), represented 89 percent of the total organic cereal area in Asia. Organic rice was mainly grown in China (298’000 hectares), constituting 51 percent of the total organic rice in the region. The largest organic wheat areas were also in China (178’000 hectares), followed by Kazakhstan (over 133’000 hectares), together representing almost all of the total organic wheat area in Asia. Oilseeds (mainly soybeans) have also been an important arable crop group in Asia for many years, grown on over 640’000 hectares in 2019 (mainly in China 1 Claudia Meier, Research Institute of Organic Agriculture FiBL, Frick, Switzerland, www.fibl.org 2 Bernhard Schlatter, Research Institute of Organic Agriculture FiBL, Frick, Switzerland, www.fibl.org 3 Olivia Keller, Research Institute of Organic Agriculture FiBL, Frick, Switzerland, www.fibl.org 4 Jan Trávníček, Research Institute of Organic Agriculture FiBL, Frick, Switzerland, www.fibl.org

Asia › Statistics
FiBL & IFOAM – Organics International (2021): The World of Organic Agriculture. Frick and Bonn 209
and India), representing 1.1 percent of the total oilseed area in Asia and 38 percent of the world’s organic oilseeds area. The key organic oilseeds were soybeans, with almost 436’000 hectares in 2019, representing 68 percent of the total organic oilseeds area. Organic soybeans were mainly grown in China (291’000 hectares) and India (130’000 hectares), together constituting 97 percent of the total organic soybeans in the region. Other important organic arable crop groups in Asia area were textile crops (almost 339’000 hectares, mainly cotton, mainly in India), green fodder (nearly 303’000 hectares, mainly in China), and medicinal and aromatic plants (over 128’000 hectares, mainly in China). Most of the organic permanent cropland was used for coconuts (nearly 216’000 hectares, 2.2 percent of the total coconut area in the region and 72 percent of the world’s organic coconut area), tea (nearly 128’000 hectares, 3.5 percent of the total tea area in the region and 70 percent of the world’s organic tea area), temperate fruits (over 118’000 hectares, 1.5 percent of the total temperate fruits area in the region and 38 percent of the world’s organic temperate fruits area), coffee (over 99’000 hectares, 3.7 percent of the total coffee area in the region and 14 percent of the world’s organic coffee area), and tropical and subtropical fruits (nearly 70´000 hectares, 0.4 percent of the total tropical and subtropical fruit area in the region and 30 percent of the world’s organic tropical and subtropical fruit area). The Philippines had the largest organic coconut area, with over 132’000 hectares, representing 61 percent of the total organic coconut area of the region. The country with the largest area used to grow organic tea was China. In 2019, China reported 106’000 hectares of organic tea, representing 83 percent of the total organic tea grown in Asia. The largest organic temperate fruit area was also in China, with 116’000 hectares, representing almost the total area of organic temperate fruits in Asia. Most of the organic coffee in Asia was grown in Indonesia, where over 60’000 hectares were reported, followed by Timor-Leste (over 32’000 hectares); both countries represented 93 percent of the organic coffee area in Asia. Most of the organic tropical and subtropical fruits in Asia were grown in China, where 34’000 hectares were reported, representing 49 percent of the organic tropical and subtropical fruit area in Asia.
Producers
In 2019, nearly 1.6 million organic producers were reported in Asia. India remained the country with the highest organic producers (almost 1.4 million), followed by Thailand (nearly 119’000). Unfortunately, many countries do not report the number of producers or only report the number of companies; thus, it can be assumed that the number of producers is higher. Since 2004, when there were 100’000 organic producers, the number has increased almost sixteen-fold.
Wild collection
In 2019, over 3.2 million hectares of organic wild collection were reported in Asia. Unfortunately, detailed data was available for only 4 percent of the reported area. From the details available, wild nuts (over 55’000 hectares) and wild fruit (3’750 hectares) were the key commodities. Furthermore, bee pastures (over 56’000 hectares) played an
Asia › Statistics
210 FiBL & IFOAM – Organics International (2021): The World of Organic Agriculture. Frick and Bonn
important role. China was the country in the region with the largest organic wild collection area, with over 1.5 million hectares, followed by India (nearly 1.4 million hectares), and Thailand (nearly 91´000 hectares).
Market
In Asia, organic market data is still not available for most of the countries, but it can be assumed that the market is continually growing. Nine countries (more than 20 percent of the countries with organic data) provided organic retail sales values (Table 13, page 67). From the data available, we can assume that over 10.8 billion euros of organic products were sold in Asia. For China, over 8.5 billion euros were reported for 2019, and it is the country the world’s fourth-largest market for organic products. Furthermore, Japan has a large organic domestic market valued at 1.4 billion euros (2018), and South Korea reported a market of 357 million euros. More information about the Asian market is available in the chapter about the global market from Amarjit Sahota (page 136). For more information about the Asian figures, see data tables for Asia, page 211. .

Asia › Statistics › Graphs
FiBL & IFOAM – Organics International (2021): The World of Organic Agriculture. Frick and Bonn 211
Organic Agriculture in Asia: Graphs
Figure 64: Asia: The ten countries with the largest organic agricultural area 2019
Source: FiBL survey 2021, based on information from the private sector, certifiers, and governments. For detailed data sources see annex, page 317
Figure 65: Asia: The countries with the highest organic share of total agricultural land 2019
Source: FiBL survey 2021, based on information from the private sector, certifiers, and governments. For detailed data sources see annex, page 317
37'630
61'901
64'885
70'436
168'352
188'451
251'619
294'289
2'216'000
2'299'222
0 500'000 1'000'000 1'500'000 2'000'000 2'500'000
Azerbaijan
Viet Nam
Pakistan
Sri Lanka
Philippines
Thailand
Indonesia
Kazakhstan
China
India
Hectares
Asia: The ten countries with the largest organic area 2019Source: FiBL survey 2021
1.2%
1.2%
1.2%
1.3%
1.3%
1.4%
1.8%
2.2%
2.5%
8.5%
0% 2% 4% 6% 8% 10%
Palestine
Taiwan
United Arab Emirates
India
Bhutan
Philippines
Republic of Korea
Singapore
Sri Lanka
Timor-Leste
Share of total agricultural land
Asia: The countries with the highest organic share of total agricultural land 2019Source: FiBL survey 2021

Asia › Statistics › Graphs
212 FiBL & IFOAM – Organics International (2021): The World of Organic Agriculture. Frick and Bonn
; Figure 66: Asia: Development of organic agricultural land 1999 to 2019
Source: FiBL-IFOAM-SOEL surveys 2001-2021; based on information from the private sector, certifiers, and governments. For detailed data sources see annex, page 317
Figure 67: Asia: Use of organic agricultural land 2019
Source: FiBL survey 2021, based on information from the private sector, certifiers, and governments. For detailed data sources see annex, page 317
0.02
0.06 0.
42
0.43 0.49
3.78
2.68 3.
00
2.90 3.
36 3.58
2.46
3.69
3.21 3.39 3.52 3.
85
4.87
6.00 6.
36
5.91
0.0
1.0
2.0
3.0
4.0
5.0
6.0
7.0
1999
2000
2001
2002
2003
2004
2005
2006
2007
2008
2009
2010
2011
2012
2013
2014
2015
2016
2017
2018
2019
Mill
ion
hect
ares
Asia: Development of organic agricultural land1999- 2019Source: FiBL-IFOAM-SOEL-Surveys 2001-2021
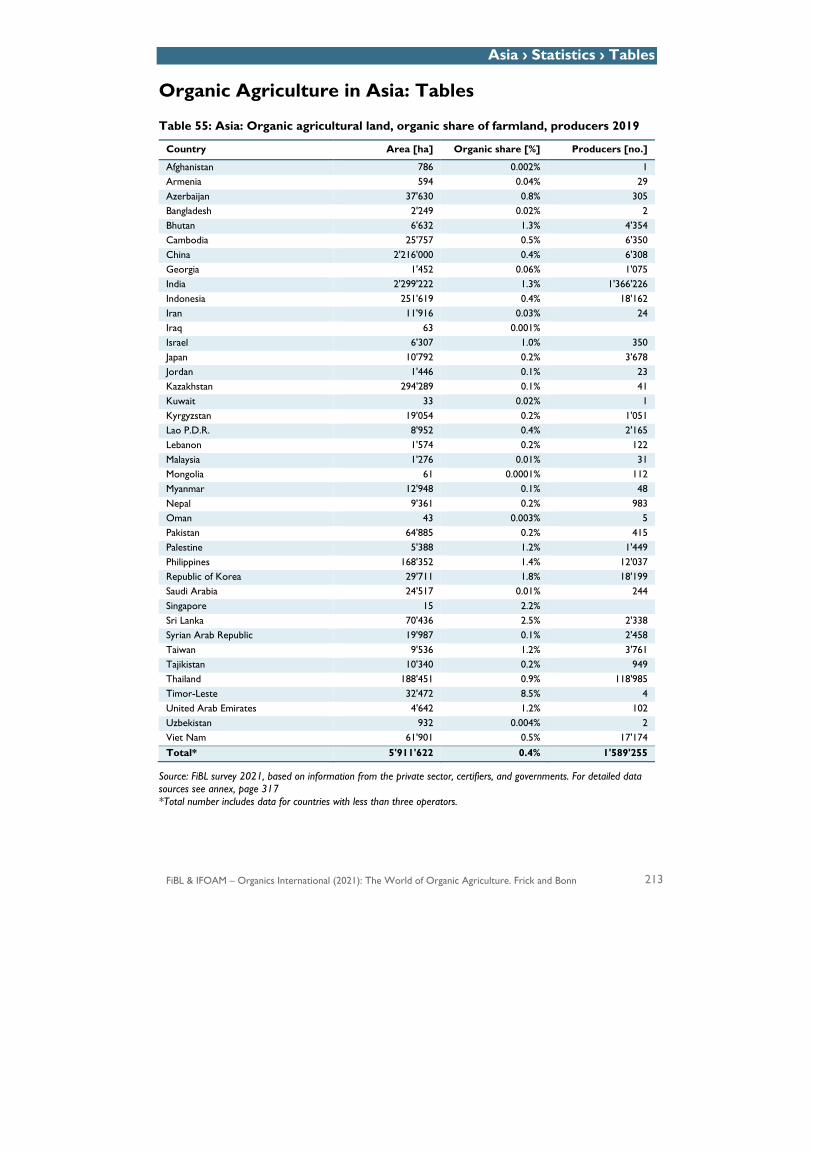
Asia › Statistics › Tables
FiBL & IFOAM – Organics International (2021): The World of Organic Agriculture. Frick and Bonn 213
Organic Agriculture in Asia: Tables
Table 55: Asia: Organic agricultural land, organic share of farmland, producers 2019
Country Area [ha] Organic share [%] Producers [no.]
Afghanistan 786 0.002% 1 Armenia 594 0.04% 29 Azerbaijan 37'630 0.8% 305 Bangladesh 2'249 0.02% 2 Bhutan 6'632 1.3% 4'354 Cambodia 25'757 0.5% 6'350 China 2'216'000 0.4% 6'308 Georgia 1'452 0.06% 1'075 India 2'299'222 1.3% 1'366'226 Indonesia 251'619 0.4% 18'162 Iran 11'916 0.03% 24 Iraq 63 0.001%
Israel 6'307 1.0% 350 Japan 10'792 0.2% 3'678 Jordan 1'446 0.1% 23 Kazakhstan 294'289 0.1% 41 Kuwait 33 0.02% 1 Kyrgyzstan 19'054 0.2% 1'051 Lao P.D.R. 8'952 0.4% 2'165 Lebanon 1'574 0.2% 122 Malaysia 1'276 0.01% 31 Mongolia 61 0.0001% 112 Myanmar 12'948 0.1% 48 Nepal 9'361 0.2% 983 Oman 43 0.003% 5 Pakistan 64'885 0.2% 415 Palestine 5'388 1.2% 1'449 Philippines 168'352 1.4% 12'037 Republic of Korea 29'711 1.8% 18'199 Saudi Arabia 24'517 0.01% 244 Singapore 15 2.2%
Sri Lanka 70'436 2.5% 2'338 Syrian Arab Republic 19'987 0.1% 2'458 Taiwan 9'536 1.2% 3'761 Tajikistan 10'340 0.2% 949 Thailand 188'451 0.9% 118'985 Timor-Leste 32'472 8.5% 4 United Arab Emirates 4'642 1.2% 102 Uzbekistan 932 0.004% 2 Viet Nam 61'901 0.5% 17'174 Total* 5'911'622 0.4% 1'589'255
Source: FiBL survey 2021, based on information from the private sector, certifiers, and governments. For detailed data sources see annex, page 317 *Total number includes data for countries with less than three operators.
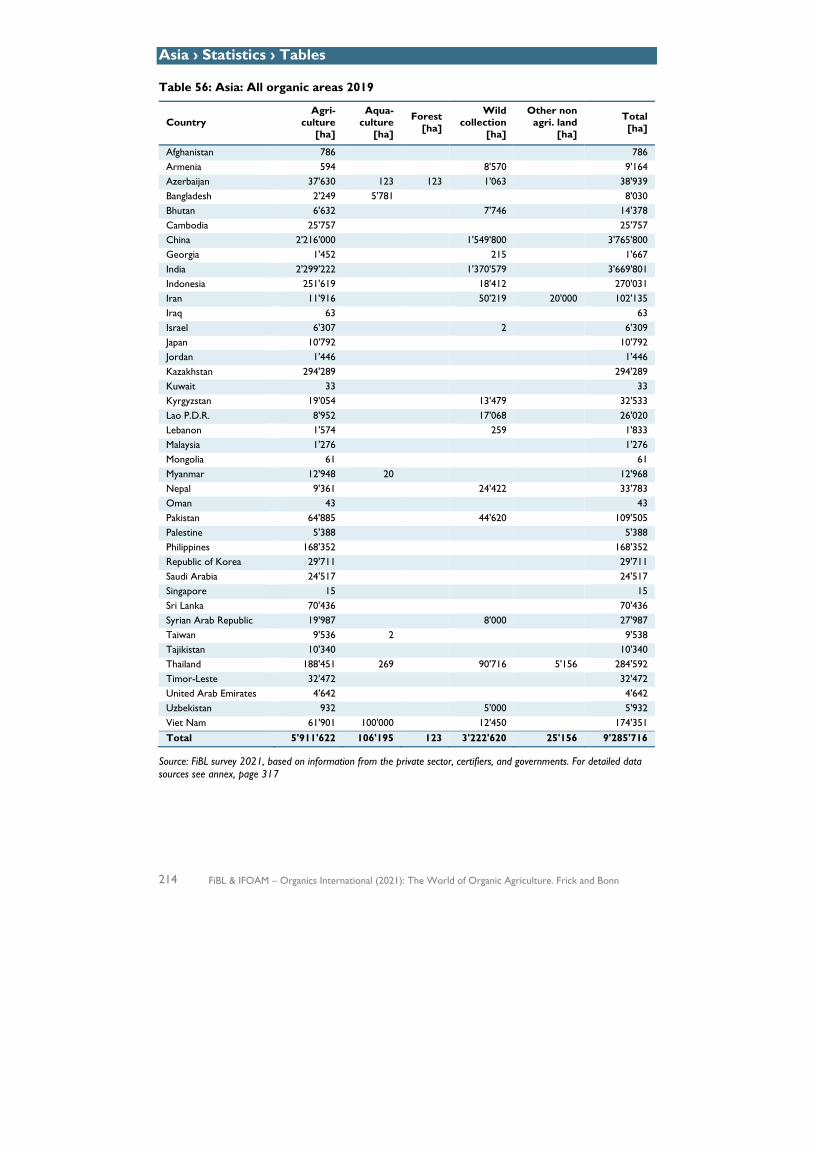
Asia › Statistics › Tables
214 FiBL & IFOAM – Organics International (2021): The World of Organic Agriculture. Frick and Bonn
Table 56: Asia: All organic areas 2019
Country Agri-
culture [ha]
Aqua-culture
[ha]
Forest [ha]
Wild collection
[ha]
Other non agri. land
[ha]
Total [ha]
Afghanistan 786 786 Armenia 594 8'570 9'164 Azerbaijan 37'630 123 123 1'063 38'939 Bangladesh 2'249 5'781 8'030 Bhutan 6'632 7'746 14'378 Cambodia 25'757 25'757 China 2'216'000 1'549'800 3'765'800 Georgia 1'452 215 1'667 India 2'299'222 1'370'579 3'669'801 Indonesia 251'619 18'412 270'031 Iran 11'916 50'219 20'000 102'135 Iraq 63 63 Israel 6'307 2 6'309 Japan 10'792 10'792 Jordan 1'446 1'446 Kazakhstan 294'289 294'289 Kuwait 33 33 Kyrgyzstan 19'054 13'479 32'533 Lao P.D.R. 8'952 17'068 26'020 Lebanon 1'574 259 1'833 Malaysia 1'276 1'276 Mongolia 61 61 Myanmar 12'948 20 12'968 Nepal 9'361 24'422 33'783 Oman 43 43 Pakistan 64'885 44'620 109'505 Palestine 5'388 5'388 Philippines 168'352 168'352 Republic of Korea 29'711 29'711 Saudi Arabia 24'517 24'517 Singapore 15 15 Sri Lanka 70'436 70'436 Syrian Arab Republic 19'987 8'000 27'987 Taiwan 9'536 2 9'538 Tajikistan 10'340 10'340 Thailand 188'451 269 90'716 5'156 284'592 Timor-Leste 32'472 32'472 United Arab Emirates 4'642 4'642 Uzbekistan 932 5'000 5'932 Viet Nam 61'901 100'000 12'450 174'351 Total 5'911'622 106'195 123 3'222'620 25'156 9'285'716
Source: FiBL survey 2021, based on information from the private sector, certifiers, and governments. For detailed data sources see annex, page 317
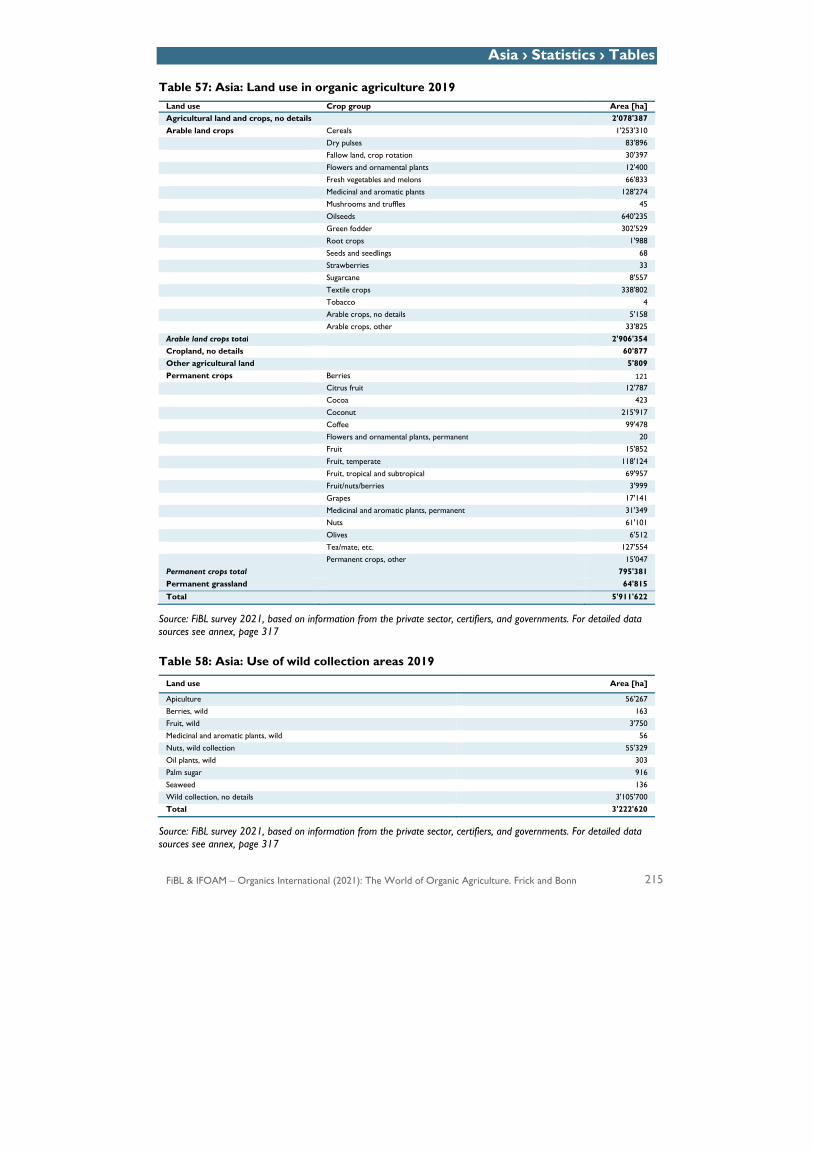
Asia › Statistics › Tables
FiBL & IFOAM – Organics International (2021): The World of Organic Agriculture. Frick and Bonn 215
Table 57: Asia: Land use in organic agriculture 2019 Land use Crop group Area [ha] Agricultural land and crops, no details 2'078'387 Arable land crops Cereals 1'253'310 Dry pulses 83'896 Fallow land, crop rotation 30'397 Flowers and ornamental plants 12'400 Fresh vegetables and melons 66'833 Medicinal and aromatic plants 128'274 Mushrooms and truffles 45 Oilseeds 640'235 Green fodder 302'529 Root crops 1'988 Seeds and seedlings 68 Strawberries 33 Sugarcane 8'557 Textile crops 338'802 Tobacco 4 Arable crops, no details 5'158 Arable crops, other 33'825 Arable land crops total 2'906'354 Cropland, no details 60'877 Other agricultural land 5'809 Permanent crops Berries 121 Citrus fruit 12'787 Cocoa 423 Coconut 215'917 Coffee 99'478 Flowers and ornamental plants, permanent 20 Fruit 15'852 Fruit, temperate 118'124 Fruit, tropical and subtropical 69'957 Fruit/nuts/berries 3'999 Grapes 17'141 Medicinal and aromatic plants, permanent 31'349 Nuts 61'101 Olives 6'512 Tea/mate, etc. 127'554 Permanent crops, other 15'047 Permanent crops total 795'381 Permanent grassland 64'815 Total 5'911'622
Source: FiBL survey 2021, based on information from the private sector, certifiers, and governments. For detailed data sources see annex, page 317
Table 58: Asia: Use of wild collection areas 2019
Land use Area [ha]
Apiculture 56'267 Berries, wild 163 Fruit, wild 3'750 Medicinal and aromatic plants, wild 56 Nuts, wild collection 55'329 Oil plants, wild 303 Palm sugar 916 Seaweed 136 Wild collection, no details 3'105'700 Total 3'222'620
Source: FiBL survey 2021, based on information from the private sector, certifiers, and governments. For detailed data sources see annex, page 317

216 FiBL & IFOAM – Organics International (2021): The World of Organic Agriculture. Frick and Bonn

FiBL & IFOAM – Organics International (2021): The World of Organic Agriculture. Frick and Bonn 217
Europe
Map 4: Organic agricultural land in the countries of Europe 2019 (in hectares)
Source: FiBL-AMI survey 2021; based on information from the private sector, certifiers, governments, Eurostat and the Mediterranean Organic Agriculture Network. For detailed information on sources, please check annex.
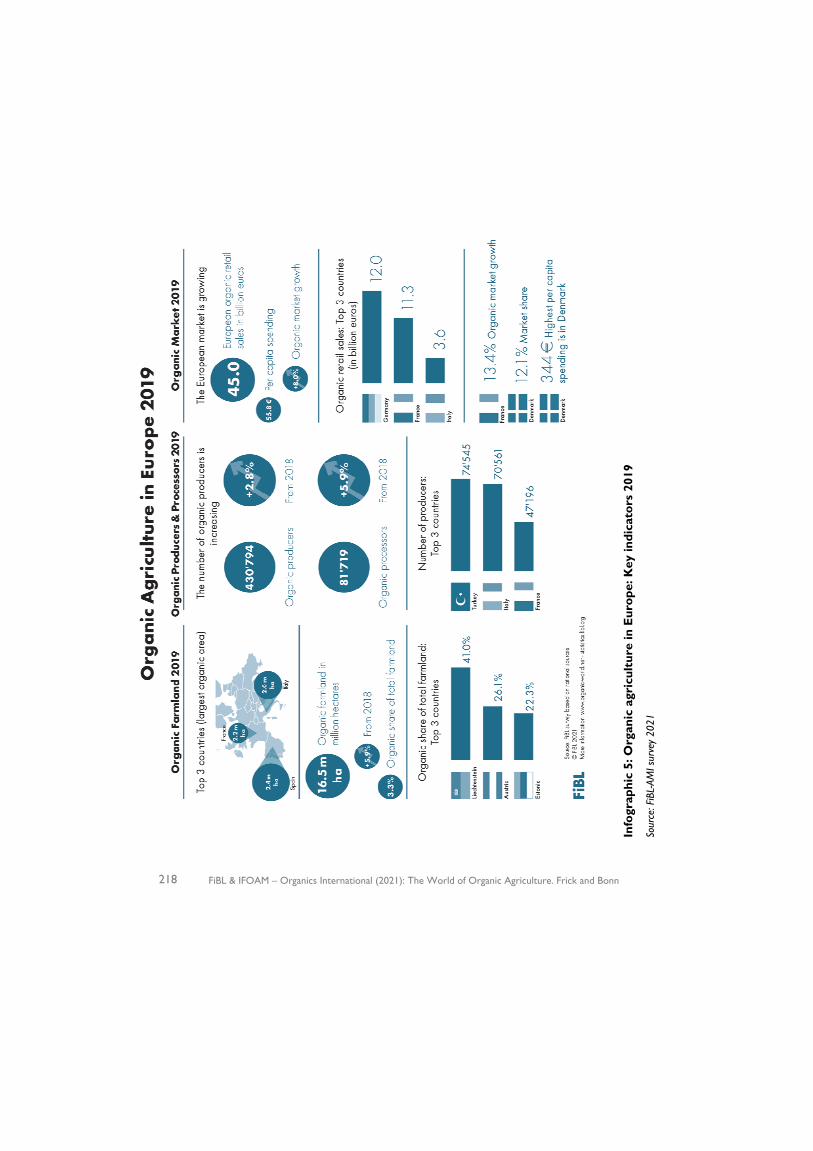
218 FiBL & IFOAM – Organics International (2021): The World of Organic Agriculture. Frick and Bonn
Info
grap
hic
5: O
rgan
ic a
gric
ultu
re in
Eur
ope:
Key
indi
cato
rs 2
019
Sour
ce: F
iBL-
AMI s
urve
y 20
21
Europe › Overview
FiBL & IFOAM – Organics International (2021): The World of Organic Agriculture. Frick and Bonn 219
Organic in Europe: Recent Developments
HELGA WILLER,1 BRAM MOESKOPS,2 EMANUELE BUSACCA,3 LÉNA BRISSET,4 MARIA GERNERT5 AND SILVIA SCHMIDT6
The year 2020 with the COVID-19 crisis was a special year for the organic sector. While the consolidated data for 2019 show a continued growth trend for both organic production and market, in 2020 the market grew considerably faster than in the previous years as consumers turned to health and wellness products and paid more attention to disease prevention.
For the UK, for instance, where annual growth rates had been at around 5 percent in recent years, growth was far higher in 2020. Should this trend continue through the post-pandemic times, it is bound to impact organic farmland growth, making it more likely that the European Commission's aim of achieving an organic area share of 25 percent by 2030 will be reached. Apart from strong consumer interest, political support measures including a good regulatory framework, adequate support under the CAP, action plans and support for research and knowledge building will be crucial to achieving this goal.
The latest data for Europe show that organic farmland has reached about 16.5 million hectares (EU: 14.6 million hectares) or a share of around 3.3 percent (EU: 8.1 percent). The European Union's organic farmland share is far higher than in most countries and regions of the world; globally, about 1.5 percent of the farmland is organic (72.3 million hectares in 2019).
The European Commission aims to reach 25 percent organic area share by 2030. Austria already reached this benchmark in 2019 (more than 26.1 percent of the farmland was organic) and two other Member States are very close to it: Estonia (22.3 percent) and Sweden (20.4 percent).
1 Dr. Helga Willer, Research Institute of Organic Agriculture FiBL, Frick, Switzerland, www.fibl.org 2 Dr. Bram Moeskops, Research and Innovation Manager, International Federation of Organic Agriculture Movements EU Group (IFOAM Organics Europe), Brussels, Belgium, www.organicseurope.bio 3 Emanuele Busacca, IFOAM Organics Europe, Brussels, Belgium, www.organicseurope.bio 4 Léna Brisset, IFOAM Organics Europe, Brussels, Belgium, www.organicseurope.bio 5 Maria Gernert, TP Organics Coordinator, IFOAM Organics Europe, Brussels, Belgium, www.organicseurope.bio 6 Silvia Schmidt, IFOAM Organics Europe, Brussels, Belgium, www.organicseurope.bio
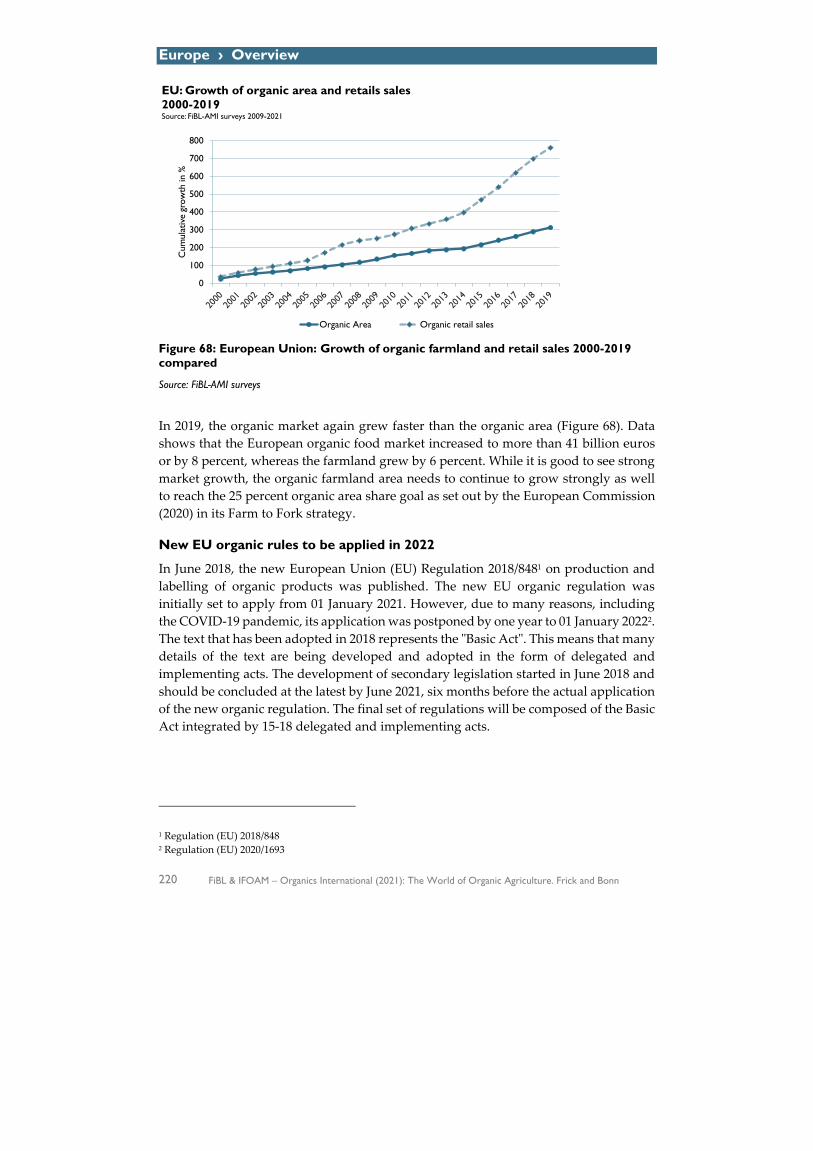
Europe › Overview
220 FiBL & IFOAM – Organics International (2021): The World of Organic Agriculture. Frick and Bonn
Figure 68: European Union: Growth of organic farmland and retail sales 2000-2019 compared
Source: FiBL-AMI surveys
In 2019, the organic market again grew faster than the organic area (Figure 68). Data shows that the European organic food market increased to more than 41 billion euros or by 8 percent, whereas the farmland grew by 6 percent. While it is good to see strong market growth, the organic farmland area needs to continue to grow strongly as well to reach the 25 percent organic area share goal as set out by the European Commission (2020) in its Farm to Fork strategy.
New EU organic rules to be applied in 2022
In June 2018, the new European Union (EU) Regulation 2018/8481 on production and labelling of organic products was published. The new EU organic regulation was initially set to apply from 01 January 2021. However, due to many reasons, including the COVID-19 pandemic, its application was postponed by one year to 01 January 20222. The text that has been adopted in 2018 represents the "Basic Act". This means that many details of the text are being developed and adopted in the form of delegated and implementing acts. The development of secondary legislation started in June 2018 and should be concluded at the latest by June 2021, six months before the actual application of the new organic regulation. The final set of regulations will be composed of the Basic Act integrated by 15-18 delegated and implementing acts.
1 Regulation (EU) 2018/848 2 Regulation (EU) 2020/1693
0
100
200
300
400
500
600
700
800
Cum
ulat
ive
grow
th in
%
EU: Growth of organic area and retails sales 2000-2019Source: FiBL-AMI surveys 2009-2021
Organic Area Organic retail sales
Europe › Overview
FiBL & IFOAM – Organics International (2021): The World of Organic Agriculture. Frick and Bonn 221
Proposal for the Common Agricultural Policy post-2020 launched
In June 2018, the European Commission launched its proposal for the Common Agricultural Policy (CAP) for 2021 to 2027. As negotiations between the three European institutions got delayed, the new CAP will only enter into force in 2023, preceded by a two-year transition period.
The new CAP presents a New Delivery Model founded on a results-based approach, which gives more flexibility to Member States in the implementation of the policy objectives.
Organic farming can make a decisive contribution towards a sustainable food and farming sector while satisfying citizens' preferences. However, large-scale conversion to organic is only possible if the CAP's ambition is raised, allowing more farmers to make the necessary additional efforts and investments. With the right incentives in both pillars, many more farmers could make an even larger contribution to the environment, climate, and rural communities beyond 2020 (IFOAM EU, 2019).
The organic movement is concerned about the significant cuts foreseen to the second pillar, Rural Development, which so far has been providing crucial support to farmers for the conversion to organic and has helped them with maintenance payments. The second pillar should be strengthened, and more than 30 percent of its budget should be dedicated to the climate and environmental CAP objectives (IFOAM EU 2019).
As part of the new green architecture, the newly proposed eco-schemes offer a good opportunity to compensate farmers who want to do more for the climate and the environment. The schemes are 100 percent funded under the first pillar, which constitutes over three-quarters of the total CAP budget. However, essential elements are still missing: eco-schemes should be better defined to favour farming systems that contribute to multiple objectives, including organic farming. Moreover, a minimum of 30 percent of the first pillar should be dedicated to newly proposed eco-schemes.
Finally, the CAP's increased flexibility must be counterbalanced with strong common safeguards and a shared level of ambition. The organic movement defended ring-fencing of at least 70 percent of the entire CAP budget across both pillars, to ensure a level playing field and to avoid a race to the bottom for the climate and environment.
With the Green Deal (European Commission 2019c) and the publication of the Farm to Fork (European Commission 2020a) and Biodiversity strategies (European Commission 2020b) in May 2020, the Commission has put forward clear objectives for transitioning to sustainable food systems by 2030. But since the CAP will play a critical role in providing the means to reach these objectives, it is essential that the CAP – and its implementation at the national level through the National Strategic Plans – explicitly and fully contributes to the Green Deal's implementation and related strategies, which include the 'Farm to Fork strategy' and the ten priorities for the new EU Organic Action Plan to reach 25% organic land in Europe by 2030 (see subsequent chapter).
Europe › Overview
222 FiBL & IFOAM – Organics International (2021): The World of Organic Agriculture. Frick and Bonn
The European Green Deal & the Farm to Fork strategy: shaping a more sustainable EU agenda
The European Green Deal: A vision to climate neutrality for the EU by 2050
The European Green Deal (EGD, European Commission 2019c) is a new growth strategy unveiled by the European Commission in December 2019. The European Green Deal, one of the priorities of the Von der Leyen Commission (2019-2024), aims for Europe to be the first climate-neutral continent by becoming a modern, resource-efficient economy. Specifically, the EGD aims "to transform the EU into a fair and prosperous society, with a modern, resource-efficient and competitive economy where there are no net emissions of greenhouse gases in 2050 and where economic growth is decoupled from resource use". Moreover, the EGD stresses that "the EU has the collective ability to transform its economy and society to put it on a more sustainable path".
The EGD covers several sectors in which the EU can do better in terms of sustainability, including the energy, the transport and the agri-food sector. For this publication, the focus is on the latter sector. The Farm to Fork (F2F) and the EU biodiversity strategies, both a part of the EGD, unveiled in May 2020, aim at achieving the EGD goals for the agri-food sector. The EU biodiversity strategy aims at "bringing nature back into our lives" with many initiatives including the proposal of EU nature restoration targets, the review and possible revision of the Environmental Crime Directive and building an EU Business for Biodiversity movement.
Some initiatives within the Farm to Fork and the EU biodiversity strategies overlap, e.g., the initiatives aim to boost organic and more sustainable practices. As the Farm to Fork strategy includes those initiatives and ambitions relevant to the whole (organic) food supply chain, this chapter will focus on this strategy.
Overview of the Farm to Fork (F2F) strategy
The F2F strategy, at the heart of the European Green Deal, "addresses comprehensively the challenges of sustainable food systems and recognises the inextricable links between healthy people, healthy societies and a healthy planet".
The F2F strategy is composed of a main communication and an annex, the latter serving as an action plan for the strategy. The strategy recognises that food systems are responsible for approximately 29 percent of the world's greenhouse gas (GHG) emissions and that nearly 70 percent of all agricultural GHG emissions come from the animal sector. It explicitly states that "there is an urgent need to reduce dependency on pesticides and antimicrobials, reduce the use of fertilisers, increase organic farming, improve animal welfare, and reverse biodiversity loss". The F2F is meant to lead a global transition towards competitive sustainability from farm to fork.
The goals of the F2F strategy are to:
! Ensure that food production, transport, distribution, marketing, and consumption have a neutral or positive environmental impact,
! Preserve and restore the land and sea-based resources,
Europe › Overview
FiBL & IFOAM – Organics International (2021): The World of Organic Agriculture. Frick and Bonn 223
! Mitigate climate change, ! Reverse the loss of biodiversity, ! Ensure food security, nutrition, and public health.
Notably, the F2F strategy is not legally binding, which means that adequate policies must support initiatives and targets contained therein. In the following section is an overview of how this would work for initiatives that directly impact organic. For the sake of succinctness, only those initiatives that directly impact organic are considered in this publication. Still, many more initiatives are included in the F2F strategy than only the ones hereafter.
Farm to Fork strategy & organic
Organic farming has a prominent place in the Farm to Fork strategy. Perhaps the most significant achievement for the organic sector is the recognition that organic can be part of the solution in addressing the environmental challenges we currently face, as the F2F strategy includes a target which aims at achieving at least 25 percent of the EU's agricultural land under organic farming by 2030 and a significant increase in organic aquaculture. This 25 percent target will not be reached with a business as usual approach, or with only a few favourable policies here and there. To reach the 25 percent target, comprehensive policy support for organic is needed across the EU, aiming to increase the supply and demand for organic products.
As part of the F2F strategy, the Commission pledged to review the EU promotion programme for agricultural and food products to enhance its contribution to sustainable production and consumption. At the end of 2020, the Commission pledged a total of 182.9 million euros to promote European agri-food products, for example via campaigns in the internal market or third countries, with a focus on sustainable agriculture. The budget for campaigns about organic farming, EU sustainable agriculture, and the agri-food sector's role in terms of climate action and the environment accounts for about half of the total budget, i.e. 86 million euros.
Other F2F strategy initiatives that directly impact organic and that are yet to be carried out at the time of writing these lines are:
! The Commission will put forward an Action Plan on organic farming, expected at the beginning of 2021. In this context, push and pull measures that boost both organic production and demand are crucial.
! Determine the best modalities for setting minimum mandatory criteria for sustainable food procurement to promote healthy and sustainable diets, including organic products, in schools and public institutions (indicative timetable: Q3 2021).
! The Commission will take measures to facilitate the registration of seed varieties, including for organic farming, and to ensure easier market access for traditional and locally adapted varieties.
Research Organic farming research is funded under national research programs or national
Europe › Overview
224 FiBL & IFOAM – Organics International (2021): The World of Organic Agriculture. Frick and Bonn
organic action plans and European programmes. Since the mid-1990s, several organic farming research projects have been financed by the EU framework programmes. So far, the following projects focussing on organic agriculture have been funded by the current framework programme Horizon 2020:1 OK-Net Arable, OK-Net EcoFeed, LIVESEED, ECOBREED, BRESOV (three projects on organic seed and plant breeding). RELACS and Organic-PLUS, which investigate alternatives for contentious inputs used in organic farming, started in spring 2018. In 2019, PPilow started as a new project addressing animal welfare in organic farming and a thematic network on organic fruit production, BioFruitNet.
In 2020, the CORE Organic network, which joins forces of the EU Member States to fund transnational research projects, released its 15-year activity report (2004-2019) (CORE Organic 2021), after celebrating its 15th anniversary in 2019. The current CORE Organic Cofund consortium2 consists of 27 partners from 19 countries. In 2016, 12 projects were selected to run until 2021, distributed across four thematic areas: Plant production systems, animal feed, livestock systems, and organic food processing3. The report shows that CORE Organic has primarily achieved its mission to enhance the European research area on organic agriculture: The number of projects funded on topics identified as common priorities while ensuring the participation of SMEs and facilitating the integration of new forms of knowledge generation, innovation and dissemination has allowed the sector to better meet the demand for organic food and products and to develop practices per the organic principles and regulations. Collaboration with the European Technology Platform TP Organics and other relevant sector players has helped ensure that the voice of transnational organisations representing farmers, industry and civil society have been taken into account. With the Organic Eprints open access repository, a shared knowledge reservoir for effective dissemination of research outcomes has been created. The CORE Organic projects' outcomes are archived in Organic Eprints, which today has more than 24'000 entries (Willer/Rasmussen 2019).
Organic Farm Knowledge for farmers and advisers to exchange knowledge
In December 2018, the Horizon 2020-funded project OK-Net Ecofeed launched the extended knowledge platform Organic Farm Knowledge (https://organic-farmknowledge.org/), initially set up in the framework of OK-Net Arable. The platform aims to promote the exchange of information and share practical solutions among farmers across Europe. The platform is available in 14 languages. In 2019, the platform started to be expanded to cover tools and solutions related to organic feed for pigs and poultry and seed, breeding, and many other topics. In 2020, a concept note was developed as an overarching framework for further developing Organic Farm
1 https://ok-net-ecofeed.eu; www.liveseed.eu; http://ecobreed.eu; https://bresov.eu; https://relacs-project.eu; https://organic-plus.net; www.ppilow.eu; https://biofruitnet.eu/ 2 CORE Organic was initiated as a part of the Commission’s ERA-NET Scheme in 2004. It intends to step up cooperation between national research activities and aims to enhance the quality, relevance, and utilisation of European research resources through coordination and collaboration. 3 http://projects.au.dk/coreorganiccofund
Europe › Overview
FiBL & IFOAM – Organics International (2021): The World of Organic Agriculture. Frick and Bonn 225
Knowledge, including an Action Plan outlining the main tasks, which is now being implemented by the newly established Executive and Editorial Boards composed of 14 partners from across Europe. The goal is for the platform to become the European reference hub for practical knowledge on organic farming.
Science Day 2020 at Biofach
On 14 February, TP Organics' Science Day1 took place at Biofach 2020 in Nuremberg, Germany on innovation opportunities for organic companies in the new research programme of the EU, Horizon Europe. TP Organics2 is the European Technology Platform for Organic Food and Farming. Science Day was dedicated to the urgent need to address food and packaging waste, particularly plastic waste, to increase the sustainability of the (organic) food sector. The European Commission highlighted that support for organic and agroecology is seen as an important element to future-proof food and farming systems. Within the European Green Deal, the European Commission aims to address EU food systems' challenges along the whole value chain – from farm to fork. Improving packaging, reducing food loss and waste, and empowering consumers are on the agenda, among others. At least 35% of the funding under Horizon Europe will be dedicated to climate solutions, and €10 billion are expected to be available for Cluster 6, 'Food, bioeconomy, natural resources, agriculture and environment'. TP Organics' new Strategic Research & Innovation Agenda for Organics & Agroecology (TP Organics 2019a) was presented, which identifies 29 research needs in four priority areas: (1) Moving organic further; (2) Redesigning food and agricultural policies; (3) Climate-resilient and diversified farming systems; and (4) Sustainable value chains for better food systems. The importance of meeting consumer demand for minimal processing and supporting innovations to reduce food and packaging waste was highlighted. The companies Bio4Pack and FUTAMURA presented their solutions for sustainable packaging. Closing the loop to a circular economy, bioplastics based on cellulose or organic waste are suitable for composting or recycling. The organic biscuit company SOMMER gave insights into its experience with bioplastic. While bioplastics display good barrier properties and do not reduce the products' shelf life, costs for materials and waste disposal are higher. For widespread use of bioplastic, consumers need to be educated on the right disposal; public waste management needs to adapt to the new material, and the real costs of fossil fuel-based packaging should be reflected in its price.
Organic Innovation Days
The first-ever online edition of the Organic Innovation Days3, TP Organics' annual event that brings together the organic sector and policymakers at an EU level, took place on 24-25 November 2020, in cooperation with the EU H2020 project LIVESEED, which
1 www.tporganics.eu/science-day-2020 2 www.tporganics.eu 3 www.tporganics.eu/organic-innovation-days
Europe › Overview
226 FiBL & IFOAM – Organics International (2021): The World of Organic Agriculture. Frick and Bonn
is coordinated by IFOAM Organics Europe. Through interactive functionalities, the Organic Innovation Days once again provided a unique opportunity to discuss research needs and innovations within and outside the organic sector to transform our food systems together with a broad range of stakeholders – including companies and researchers, farmers and farmer organisations, and policymakers across Europe.
While LIVESEED held its final conference for stakeholders and policymakers and a European workshop presenting key project outcomes, innovations and results, TP Organics sessions focused on how the new EU research programme Horizon Europe can support the transformation towards sustainable food and farming systems by leveraging the potential of organic and agroecology. The European Commission showed that organic and agroecology already play a key role in many different European policies, including the Farm to Fork strategy. Horizon Europe will be a vital enabler of the European Green Deal. Still, instruments beyond research and innovation are needed to support the uptake of organic in a more holistic approach.
Horizon Europe
Horizon Europe, the EU's 9th Framework Programme for research and innovation, will provide a proposed budget of €100 billion for the period 2021-2027. The briefing published by TP Organics in 2019 (TP Organics 2019b) provides an overview of the programme, its structure and content, the policy process, and TP Organics position. The European Parliament and the EU Council reached a provisional agreement on Horizon Europe in Spring 2019. Following this agreement, the European Commission has begun the preparation of the first Strategic Plan. The Strategic Plan will identify missions and European Partnerships and serve to prepare the work programmes' content and calls for proposals for the first four years of Horizon Europe. The first work programme is expected by April 2021. €10 billion are to be allocated to Cluster 6, 'Food, Bioeconomy, Natural Resources, Agriculture and Environment'. Thanks to TP Organics, the legal texts of Horizon Europe state that Horizon Europe should support organic farming and agroecology, and the latest version of the draft Work Programme (from 21 December 2020) includes three calls that specifically address organic research needs: 'Fostering research in organic crop breeding', 'Innovative solutions to prevent adulteration of food-bearing quality labels: focus on organic food and geographical indication' and 'Reaching the Farm to Fork target: R&I scenarios for boosting organic farming and aquaculture in the EU'. In addition, 18 calls mention 'organic'.
TP Organics welcomes the planned Mission for Soil health and food as well as the partnership for 'Accelerating farming systems transition: agroecology living labs and research infrastructures', which will be crucial instruments to support the upscaling of organic farming and agroecology. However, TP Organics is concerned that the inclusion of the 'Innovation Principle' in Horizon Europe could be used to undermine
Europe › Overview
FiBL & IFOAM – Organics International (2021): The World of Organic Agriculture. Frick and Bonn 227
the Precautionary Principle, and hence social and environmental protections in the EU1. Innovation is only useful if it does not harm public and environmental health.
20th Organic World Congress
Every three years, the organic sector comes together to host the world's largest organic gathering, the Organic World Congress (OWC). In 2021 initially planned for 2020, the 20th OWC will be held in Europe for the first time since 2008, and it will take place from 6 to 10 September in Rennes, France. Drawing from the motto, "From its Roots, Organic Inspires Life", OWC 2021 will aim to provide organic and likeminded stakeholders working toward sustainable agriculture, value chains, and consumption with an opportunity to exchange their knowledge, innovations, and experiences. In the days leading up to the congress, delegates have the opportunity to participate in one of eight, topic-specific pre-conferences, one of which will focus on organic farming statistics.
References and further reading CORE Organic (2021) CORE Organic 15-year activity report (2004-2019). CORE Organic, c/o ICROFS, Tjele. Available
at https://projects.au.dk/fileadmin/ingen_mappe_valgt/CO_2020_15_Year_Activity_Report_Final.pdf European Parliament and the Council (2018): Regulation (EU) 2018/848 of the European Parliament and of the
Council of 30 May 2018 on organic production and labelling of organic products and repealing Council Regulation (EC) No 834/2007. OJ L 150, 14.6.2018, p. 1–92. Available at https://eur-lex.europa.eu/eli/reg/2018/848/oj
European Commission (2019a), EU agricultural outlook for markets and income, 2019-2030. European Commission, DG Agriculture and Rural Development, Brussels. https://ec.europa.eu/info/food-farming-fisheries/farming/facts-and-figures/markets/outlook/medium-term_en
European Commission (2019b): CAP and development. The Europa Website. European Commission, Brussels. Available at https://ec.europa.eu/info/food-farming-fisheries/farming/international-cooperation/cap-and-development_en
European Commission (2019c): The European Green Deal. European Commission, Brussels. Available at https://ec.europa.eu/info/sites/info/files/european-green-deal-communication_en.pdf
European Commission (2020a): A Farm to Fork Strategy for a fair, healthy and environmentally-friendly food system. European Commission, Brussels. Available at https://eur-lex.europa.eu/resource.html?uri=cellar:ea0f9f73-9ab2-11ea-9d2d-01aa75ed71a1.0001.02/DOC_1&format=PDF
European Commission (2020b): EU Biodiversity Strategy for 2030. European Commission, Brussels. Available at https://eur-lex.europa.eu/legal-content/EN/TXT/HTML/?uri=CELEX:52020DC0380&from=EN
IFOAM EU (2018): Towards a post-2020 CAP that supports farmers and delivers public goods to Europeans. Avoiding a race to the bottom - An ambitious and better targeted. IFOAM EU, Brussels. Available at https://www.ifoam-eu.org/sites/default/files/ifoameu_policy_cap_position_20181009_2.pdf
TP Organics (2019a): Strategic research & innovation agenda for organics and agroecology leading the transition to sustainable food and farming in Europe. IFOAM EU, Brussels. Available at https://tporganics.eu/wp-content/uploads/2019/12/ifoam-sria-full-final.pdf
TP Organics (2019b): TP Organics Briefing Horizon Europe – The next EU research & innovation framework programme (2021-2027): IFOAM EU, Brussels. Available at tporganics-horizon-europe-briefing.pdf
Willer, Helga and Rasmussen, Ilse A. (2019) International Online Archive Organic Eprints – Current Status. Research Institute of Organic Agriculture FiBL, Frick. https://orgprints.org/37003/
1 This tool was created by industry lobbyists to block and delay important social, health and environmental regulations. Despite several efforts by civil society organisations including TP Organics to remove the Innovation Principle from Horizon Europe, it is still part of the recitals. More information about this dangerous principle making its way into EU law is available at https://tporganics.eu/innovation-principle/
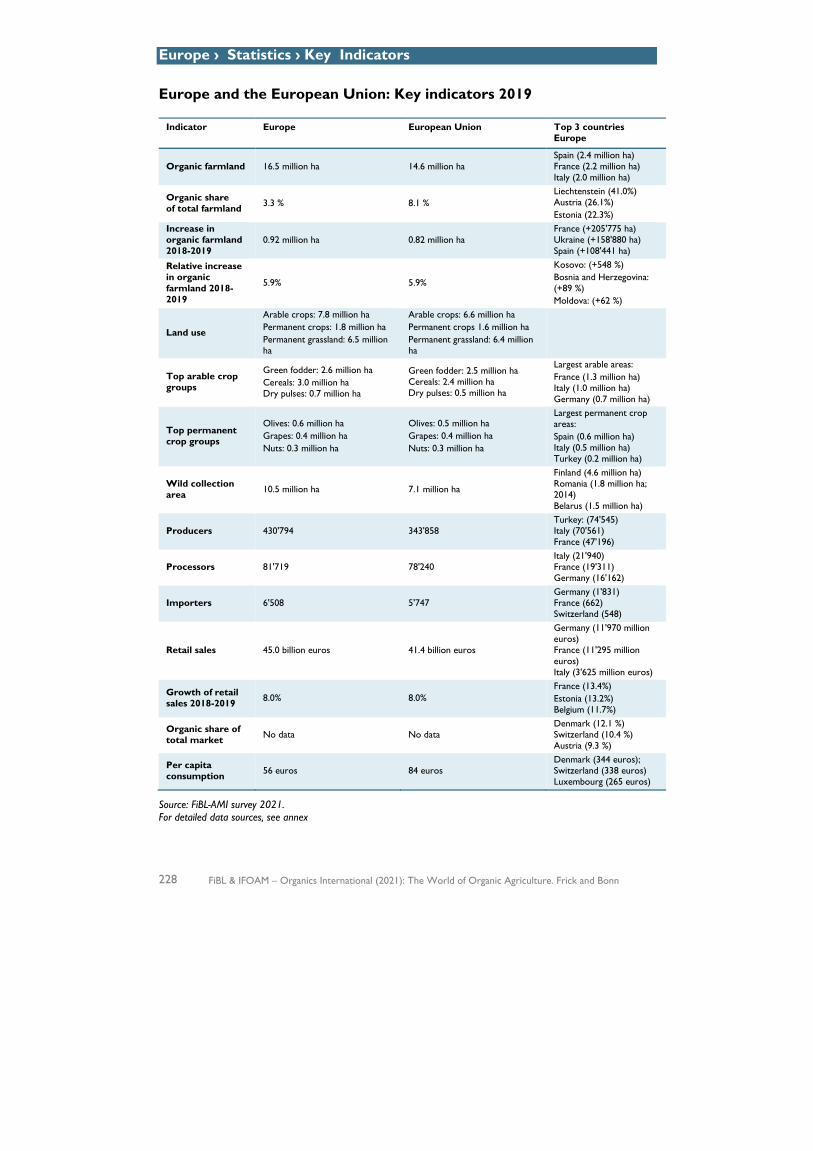
Europe › Statistics › Key Indicators
228 FiBL & IFOAM – Organics International (2021): The World of Organic Agriculture. Frick and Bonn
Europe and the European Union: Key indicators 2019
Indicator Europe European Union Top 3 countries Europe
Organic farmland 16.5 million ha 14.6 million ha Spain (2.4 million ha) France (2.2 million ha) Italy (2.0 million ha)
Organic share of total farmland 3.3 % 8.1 %
Liechtenstein (41.0%) Austria (26.1%) Estonia (22.3%)
Increase in organic farmland 2018-2019
0.92 million ha 0.82 million ha France (+205'775 ha) Ukraine (+158'880 ha) Spain (+108'441 ha)
Relative increase in organic farmland 2018-2019
5.9% 5.9%
Kosovo: (+548 %) Bosnia and Herzegovina: (+89 %) Moldova: (+62 %)
Land use
Arable crops: 7.8 million ha Permanent crops: 1.8 million ha Permanent grassland: 6.5 million ha
Arable crops: 6.6 million ha Permanent crops 1.6 million ha Permanent grassland: 6.4 million ha
Top arable crop groups
Green fodder: 2.6 million ha Cereals: 3.0 million ha Dry pulses: 0.7 million ha
Green fodder: 2.5 million ha Cereals: 2.4 million ha Dry pulses: 0.5 million ha
Largest arable areas: France (1.3 million ha) Italy (1.0 million ha) Germany (0.7 million ha)
Top permanent crop groups
Olives: 0.6 million ha Grapes: 0.4 million ha Nuts: 0.3 million ha
Olives: 0.5 million ha Grapes: 0.4 million ha Nuts: 0.3 million ha
Largest permanent crop areas: Spain (0.6 million ha) Italy (0.5 million ha) Turkey (0.2 million ha)
Wild collection area 10.5 million ha 7.1 million ha
Finland (4.6 million ha) Romania (1.8 million ha; 2014) Belarus (1.5 million ha)
Producers 430'794 343'858 Turkey: (74'545) Italy (70'561) France (47'196)
Processors 81'719 78'240 Italy (21'940) France (19'311) Germany (16'162)
Importers 6'508 5'747 Germany (1'831) France (662) Switzerland (548)
Retail sales 45.0 billion euros 41.4 billion euros
Germany (11'970 million euros) France (11'295 million euros) Italy (3'625 million euros)
Growth of retail sales 2018-2019 8.0% 8.0%
France (13.4%) Estonia (13.2%) Belgium (11.7%)
Organic share of total market No data No data
Denmark (12.1 %) Switzerland (10.4 %) Austria (9.3 %)
Per capita consumption 56 euros 84 euros
Denmark (344 euros); Switzerland (338 euros) Luxembourg (265 euros)
Source: FiBL-AMI survey 2021. For detailed data sources, see annex
Europe › Statistics › Summary
FiBL & IFOAM – Organics International (2021): The World of Organic Agriculture. Frick and Bonn 229
Organic Farming and Market Development in Europe and the European Union
JAN TRÁVNÍČEK,1 HELGA WILLER2 AND DIANA SCHAACK3
In 2019, the development of the organic sector in the European Union was characterised by continued growth in all key indicators. In 2019, the organic market grew more than the organic area, thus continuing the trend of the past several years. Only in 2018 did the organic farmland grow at a faster rate than the market. While it is good to see strong market growth, the organic farmland area needs to continue to grow, as growth will be needed to reach the 25 percent organic area share goal set out by the European Commission (2020) in its Farm to Fork strategy.
1 Key facts and figures: Production and market highlights
More than 16.5 million hectares of farmland were organic in Europe in 2019 – Spain had the largest area
In Europe, 16.5 million hectares were managed organically in 2019 (European Union: 14.6 million hectares). With almost 2.4 million hectares, Spain continued to be the country with the largest organic area in Europe (more than 14 percent of the European organic farmland), followed by France (2.2 million hectares), and Italy (2.0 million hectares).
European organic farmland increased by almost one million hectares
The organic land increased by more than 0.9 million hectares in Europe (with a major increase in farmland in the France and Ukraine) and by more than 0.8 million hectares in the European Union, representing an increase of 5.9 percent in Europe and 5.9 percent in the European Union. Growth was a bit lower than in 2018 but higher than in the first years of the current decade. From 2010 to 2019, the organic agricultural land increased by more than two thirds.
Liechtenstein is the country with the highest organic area share in the world
Organic farmland in Europe constitutes 3.3 percent of the total agricultural land and 8.1 percent in the European Union. In Europe (and globally), Liechtenstein has the highest organic share of all farmland (41.0 percent) followed by Austria, the country in the European Union with the highest organic share of agricultural land (26.1 percent). Organic producers, processors and importers on the rise There were almost 430’000 organic producers in Europe (European Union: more than 343’000), with the largest numbers in Turkey (74’545) and Italy (70’561). While in 2019
1 Jan Trávníček, Research Institute of Organic Agriculture FiBL, Frick, Switzerland, www.fibl.org 2 Dr. Helga Willer, Research Institute of Organic Agriculture FiBL, Frick, Switzerland, www.fibl.org 3 Diana Schaack, Agrarmarkt Informations-Gesellschaft mbH, Bonn, Germany, www.ami-informiert.de
Europe › Statistics › Summary
230 FiBL & IFOAM – Organics International (2021): The World of Organic Agriculture. Frick and Bonn
the number of producers grew by 2.8 percent in Europe (5.0 percent in the European Union), growth was 58 percent in Europe and 56 percent in the European Union from 2010-2019.
There were more than 81'719 organic processors in Europe (+8.5 percent compared to 2018) and almost 78’240 in the European Union (+9.1 percent). The country with the largest number of processors was Italy (21'940).
The number of importers grew faster than the number of producers and processors: More than 6’500 importers (+12.1 percent) were counted in Europe and more than 5’747 in the European Union (+13.9 percent). Germany had the most importers (1'831).
Retail sales reached the 45 billion euro mark - Market continues to grow
Organic retail sales in Europe were valued at 45.0 billion euros (41.4 billion euros in the European Union). The European Union represents the second largest single market for organic products after the United States. With 11.97 billion euros of retail sales, Germany is the biggest market in Europe and the world's second-largest.
The European organic market recorded a growth rate of 8.0 percent (European Union: 8.0 percent). The highest growth was observed in Estonia (13.2 percent). In the decade 2010-2019, the European and European Union organic market values more than doubled.
Organic imports – China is the largest supplier
Data on organic imports to the European Union in 2019 show that a total of 3.2 million metric tons of organic products were imported to the European Union. The largest supplier was China; the key product group was tropical fruit. The largest importer was The Netherlands.
European consumers spend more on organic food
European consumers spent 56 euros on organic food per person in 2019 (European Union: 84 euros). Per capita, consumer spending on organic food has doubled in the last decade. Danish and Swiss consumers spent the most on organic food per capita (344 and 338 euros, respectively).
Highest organic market shares are in Europe
Globally, EU countries account for the highest organic food sales shares as percentages of their respective food markets. Denmark had the highest organic market share globally (12.1 percent) and was the first to pass the 10 percent mark. Austria with 9.3 percent, is expected to reach the 10 percent mark soon.
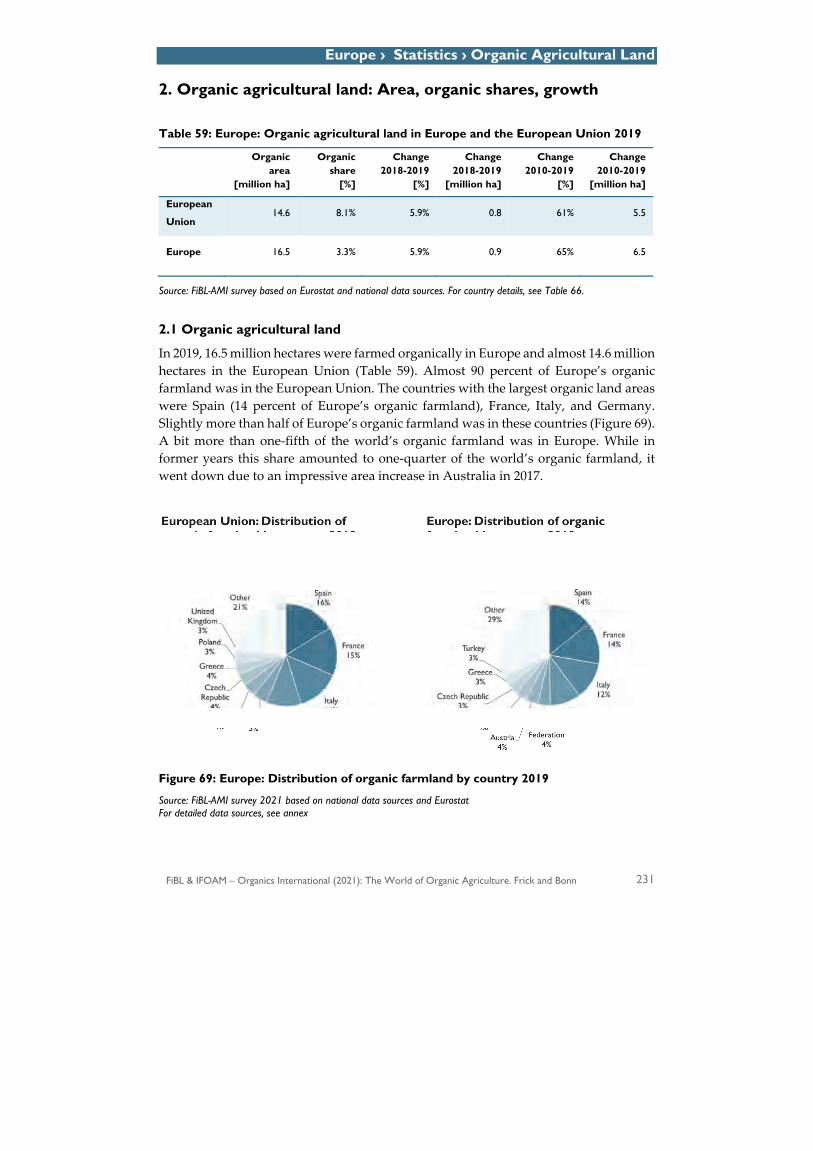
Europe › Statistics › Organic Agricultural Land
FiBL & IFOAM – Organics International (2021): The World of Organic Agriculture. Frick and Bonn 231
2. Organic agricultural land: Area, organic shares, growth
Table 59: Europe: Organic agricultural land in Europe and the European Union 2019
Organic area
[million ha]
Organic share
[%]
Change 2018-2019
[%]
Change 2018-2019
[million ha]
Change 2010-2019
[%]
Change 2010-2019
[million ha]
European
Union 14.6 8.1% 5.9% 0.8 61% 5.5
Europe 16.5 3.3% 5.9% 0.9 65% 6.5
Source: FiBL-AMI survey based on Eurostat and national data sources. For country details, see Table 66.
2.1 Organic agricultural land
In 2019, 16.5 million hectares were farmed organically in Europe and almost 14.6 million hectares in the European Union (Table 59). Almost 90 percent of Europe’s organic farmland was in the European Union. The countries with the largest organic land areas were Spain (14 percent of Europe’s organic farmland), France, Italy, and Germany. Slightly more than half of Europe’s organic farmland was in these countries (Figure 69). A bit more than one-fifth of the world’s organic farmland was in Europe. While in former years this share amounted to one-quarter of the world’s organic farmland, it went down due to an impressive area increase in Australia in 2017.
Figure 69: Europe: Distribution of organic farmland by country 2019
Source: FiBL-AMI survey 2021 based on national data sources and Eurostat For detailed data sources, see annex
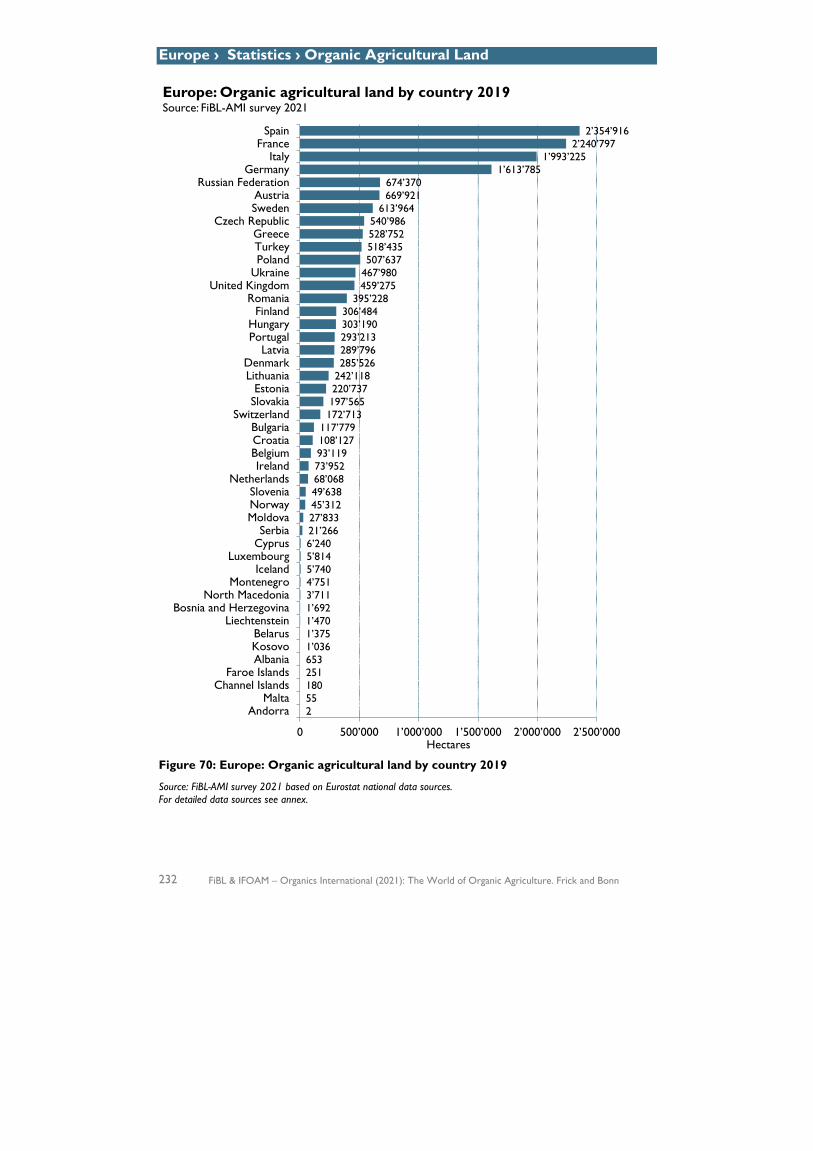
Europe › Statistics › Organic Agricultural Land
232 FiBL & IFOAM – Organics International (2021): The World of Organic Agriculture. Frick and Bonn
Figure 70: Europe: Organic agricultural land by country 2019
Source: FiBL-AMI survey 2021 based on Eurostat national data sources. For detailed data sources see annex.
2551802516531’0361’3751’4701’6923’7114’7515’7405’8146’24021’26627’83345’31249’63868’06873’95293’119108’127117’779
172’713197’565220’737242’118285’526289’796293’213303’190306’484
395’228459’275467’980507’637518’435528’752540’986
613’964669’921674’370
1’613’7851’993’225
2’240’7972’354’916
0 500’000 1’000’000 1’500’000 2’000’000 2’500’000
AndorraMalta
Channel IslandsFaroe Islands
AlbaniaKosovoBelarus
LiechtensteinBosnia and Herzegovina
North MacedoniaMontenegro
IcelandLuxembourg
CyprusSerbia
MoldovaNorwaySlovenia
NetherlandsIreland
BelgiumCroatiaBulgaria
SwitzerlandSlovakiaEstonia
LithuaniaDenmark
LatviaPortugalHungary
FinlandRomania
United KingdomUkrainePolandTurkeyGreece
Czech RepublicSwedenAustria
Russian FederationGermany
ItalyFrance
Spain
Hectares
Europe: Organic agricultural land by country 2019Source: FiBL-AMI survey 2021

Europe › Statistics › Organic Agricultural Land
FiBL & IFOAM – Organics International (2021): The World of Organic Agriculture. Frick and Bonn 233
2.2 Organic shares of total agricultural land
In Europe, 3.3 percent of the agricultural land is organic, and in the European Union, 8.1 percent (Table 59). In twelve countries (European Union: ten), 10 percent or more agricultural land is managed organically (Figure 71). The countries with the highest organic shares are Liechtenstein (41.0 percent), Austria (26.1 percent), Estonia (22.3 percent), and Sweden (20.4 percent). Liechtenstein is the country with the highest organic farmland share in the world.
2.3 Growth of organic agricultural land
In 2019, the organic agricultural land in Europe increased by 0.92 million hectares (EU: 0.82 million hectares) or 5.9 percent (EU: 5.9 percent). In Europe, the absolute growth was higher than in the European Union, due to a major increase in organic farmland in Ukraine (+158’880 hectares).
The countries that contributed the most to the growth were France, Ukraine, Spain, Hungary, Germany, and Portugal, contributing almost 740’000 additional hectares (Figure 74). The highest relative increases were in Kosovo (+548 percent), Bosnia and Herzegovina (+88 percent), Moldova (+62 percent) and Ukraine (+51 percent). However, some countries showed a decrease in organic land, such as Turkey, Ireland, Iceland, and Bulgaria (Table 66).
2.4 Conversion status of organic farmland
Most countries provided data on their fully converted and under-conversion areas, but such details are not available for all countries, such as Austria, Germany and Switzerland (Table 67).
In Europe, of the 16.5 million hectares of organic agricultural land, 11.1 million hectares were fully converted1 (10.0 million out of 14.6 million hectares in the European Union). At least 2.6 million hectares were under conversion (2.3 million in the European Union). The conversion area suggests that, in the near future, an increase in the supply of organic products can be expected (Figure 75).
By country, the largest in-conversion areas are in Western and Southern European countries, notably France (565’571 hectares), Italy (383’127 hectares), Spain (346’622 hectares), and Romania (183’741 hectares) (Table 67).
1 Excluding Austria, Germany and Switzerland

Europe › Statistics › Organic Agricultural Land
234 FiBL & IFOAM – Organics International (2021): The World of Organic Agriculture. Frick and Bonn
Figure 71: Europe: Organic shares of total agricultural land 2019
Source: FiBL-AMI survey 2021 based on national data sources and Eurostat. For detailed data sources, see annex of this book. EU Candidates = Candidates and Potential Candidate countries of the European Union; EFTA = European Free Trade Association; EU = European Union; EU-13 = countries, which became members of the European Union in or after May 2004; EU-15 = countries, which were member countries of the European Union before May 2004.
0.01%0.04%0.1%0.09%0.25%0.3%0.3%0.4%0.4%0.5%0.6%1.1%1.2%1.3%1.4%1.6%1.8%2.0%2.3%2.6%2.9%3.3%3.5%3.7%4.4%4.6%5.0%5.8%5.7%6.3%6.9%7.2%7.7%8.1%8.1%8.4%8.4%8.7%9.0%9.7%9.7%10.3%10.3%10.9%
13.5%14.8%15.2%15.4%
16.5%20.4%
22.3%26.1%
41.0%
0% 10% 20% 30% 40% 50%
AndorraBelarusAlbania
Bosnia and HerzegovinaKosovo
Russian FederationNorth Macedonia
IcelandOther European Countries
MaltaSerbia
UkraineMoldova
EU candidatesTurkeyIreland
MontenegroChannel Islands
BulgariaUnited Kingdom
RomaniaEuropePoland
NetherlandsLuxembourg
NorwayCyprusEU 13
HungaryEFTA
BelgiumCroatiaFrance
European UnionLithuania
Faroe IslandsPortugalGreeceEU 15
GermanySpain
SlovakiaSlovenia
DenmarkFinlandLatvia
ItalyCzech Republic
SwitzerlandSwedenEstoniaAustria
Liechtenstein
Organic share of total agricultural land
Europe: Organic share of total agricultural land by country and country group 2019Source: FiBL-AMI survey 2021

Europe › Statistics › Organic Agricultural Land
FiBL & IFOAM – Organics International (2021): The World of Organic Agriculture. Frick and Bonn 235
Figure 72: Europe and the European Union: Development of organic agricultural land 1985-2019
Source: FiBL-AMI Surveys 2006-2021 based on national data sources and Eurostat. Data from before 2000 based on surveys from Nic Lampkin. The data for the European Union covers all countries that were members of the European Union in 2019.
Figure 73: Europe: Growth rates for organic agricultural land in Europe and the European Union 1985-2019
Source: FiBL-AMI Surveys 2006-2021 based on national data sources and Eurostat. Data from before 2000 based on surveys from Nic Lampkin. For detailed data sources see annex.
16.5
14.6
0.0
2.5
5.0
7.5
10.0
12.5
15.0
17.5
Mill
ion
hect
ares
Europe and European Union: Development of organic agricultural land 1985-2019Source: Nic Lampkin, FiBL-AMI survey 2021, based on national data sources and Eurostat
Europe European Union
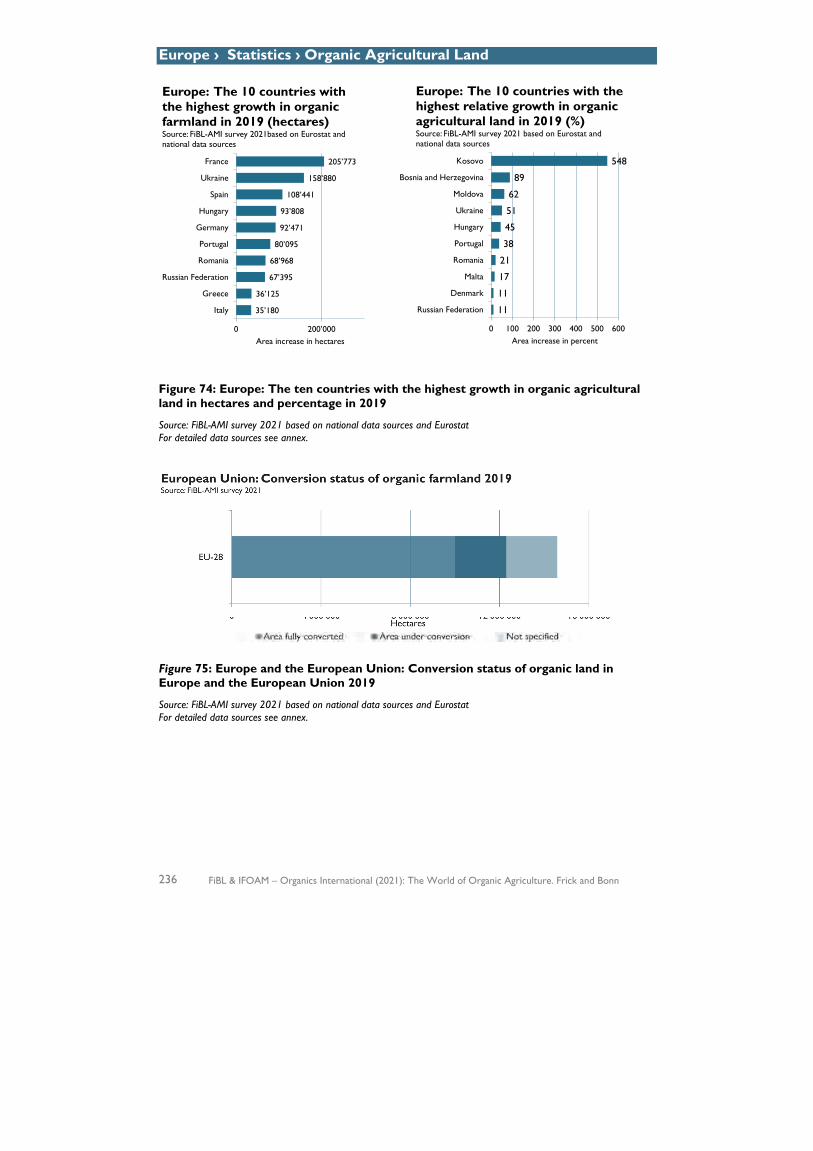
Europe › Statistics › Organic Agricultural Land
236 FiBL & IFOAM – Organics International (2021): The World of Organic Agriculture. Frick and Bonn
Figure 74: Europe: The ten countries with the highest growth in organic agricultural land in hectares and percentage in 2019
Source: FiBL-AMI survey 2021 based on national data sources and Eurostat For detailed data sources see annex.
Figure 75: Europe and the European Union: Conversion status of organic land in Europe and the European Union 2019
Source: FiBL-AMI survey 2021 based on national data sources and Eurostat For detailed data sources see annex.
35’180
36’125
67’395
68’968
80’095
92’471
93’808
108’441
158’880
205’773
0 200’000
Italy
Greece
Russian Federation
Romania
Portugal
Germany
Hungary
Spain
Ukraine
France
Area increase in hectares
Europe: The 10 countries with the highest growth in organic farmland in 2019 (hectares)Source: FiBL-AMI survey 2021based on Eurostat and national data sources
11
11
17
21
38
45
51
62
89
548
0 100 200 300 400 500 600
Russian Federation
Denmark
Malta
Romania
Portugal
Hungary
Ukraine
Moldova
Bosnia and Herzegovina
Kosovo
Area increase in percent
Europe: The 10 countries with the highest relative growth in organic agricultural land in 2019 (%)Source: FiBL-AMI survey 2021 based on Eurostat and national data sources
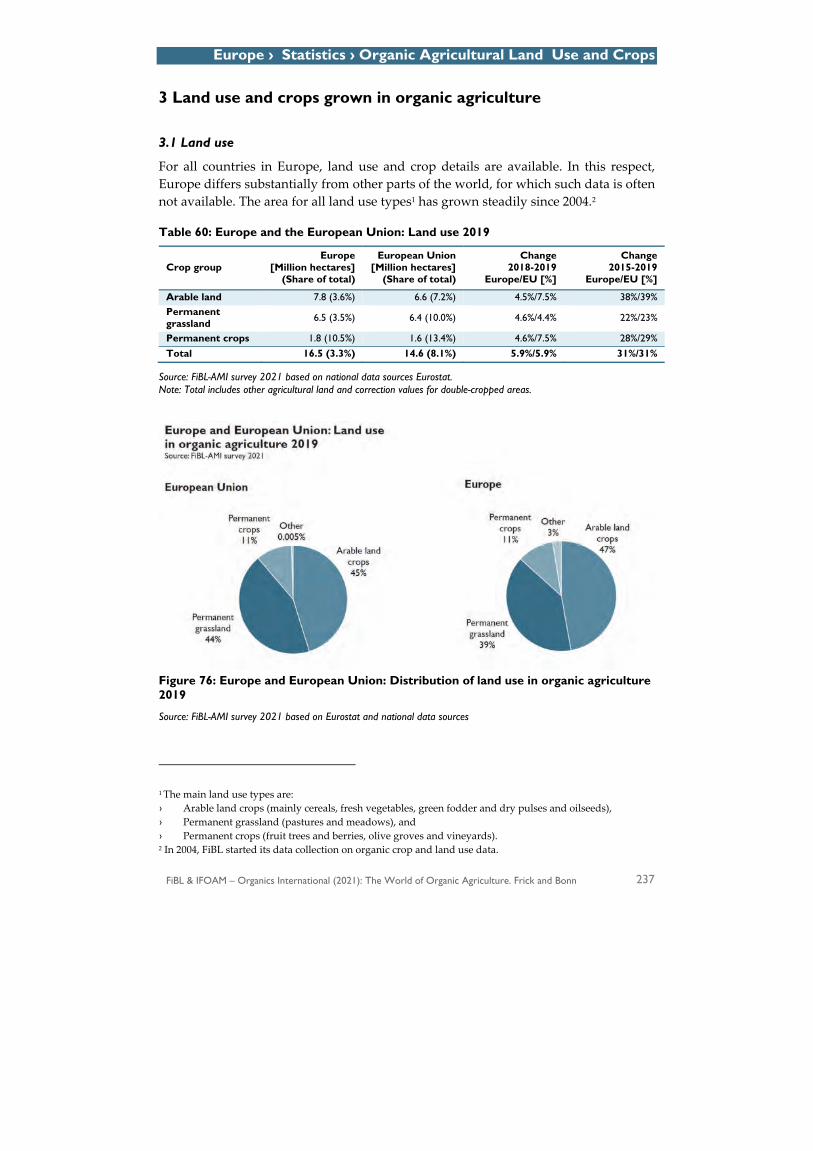
Europe › Statistics › Organic Agricultural Land Use and Crops
FiBL & IFOAM – Organics International (2021): The World of Organic Agriculture. Frick and Bonn 237
3 Land use and crops grown in organic agriculture
3.1 Land use
For all countries in Europe, land use and crop details are available. In this respect, Europe differs substantially from other parts of the world, for which such data is often not available. The area for all land use types1 has grown steadily since 2004.2
Table 60: Europe and the European Union: Land use 2019
Crop group Europe
[Million hectares] (Share of total)
European Union [Million hectares]
(Share of total)
Change 2018-2019
Europe/EU [%]
Change 2015-2019
Europe/EU [%]
Arable land 7.8 (3.6%) 6.6 (7.2%) 4.5%/7.5% 38%/39% Permanent grassland 6.5 (3.5%) 6.4 (10.0%) 4.6%/4.4% 22%/23%
Permanent crops 1.8 (10.5%) 1.6 (13.4%) 4.6%/7.5% 28%/29% Total 16.5 (3.3%) 14.6 (8.1%) 5.9%/5.9% 31%/31%
Source: FiBL-AMI survey 2021 based on national data sources Eurostat. Note: Total includes other agricultural land and correction values for double-cropped areas.
Figure 76: Europe and European Union: Distribution of land use in organic agriculture 2019
Source: FiBL-AMI survey 2021 based on Eurostat and national data sources
1 The main land use types are: › Arable land crops (mainly cereals, fresh vegetables, green fodder and dry pulses and oilseeds), › Permanent grassland (pastures and meadows), and › Permanent crops (fruit trees and berries, olive groves and vineyards). 2 In 2004, FiBL started its data collection on organic crop and land use data.
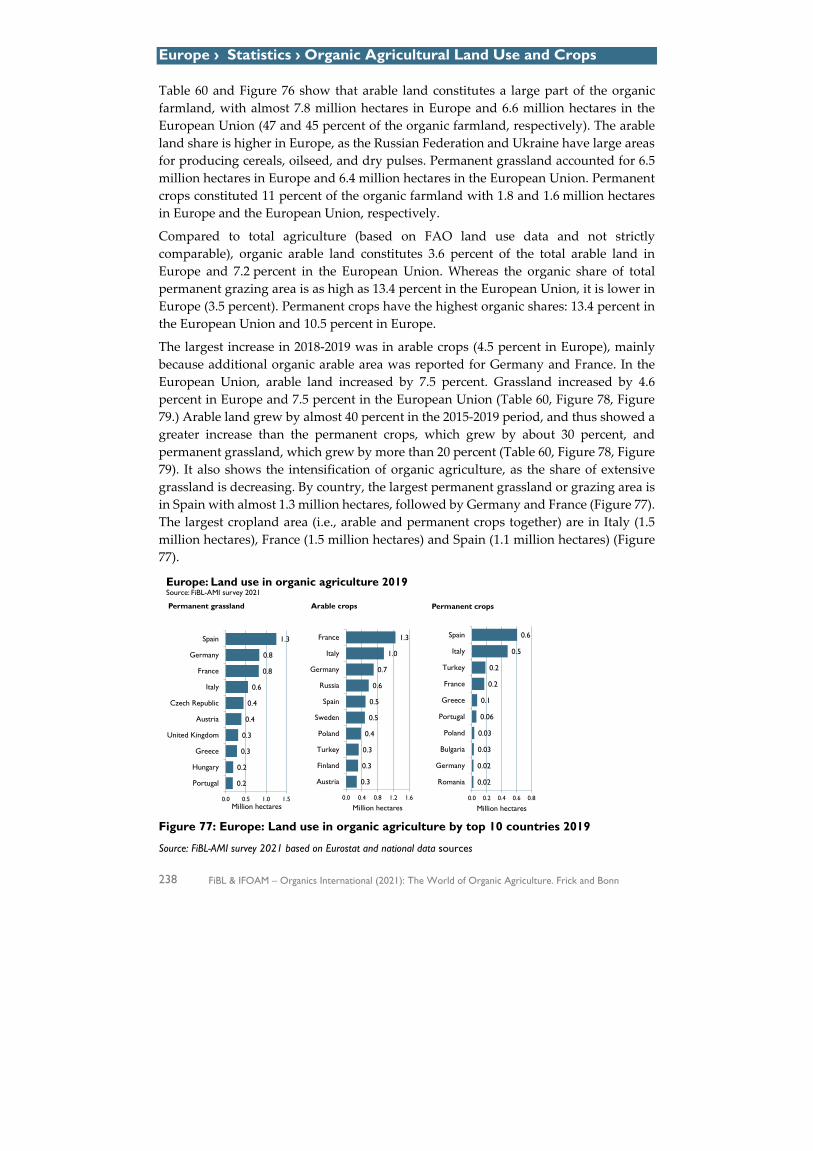
Europe › Statistics › Organic Agricultural Land Use and Crops
238 FiBL & IFOAM – Organics International (2021): The World of Organic Agriculture. Frick and Bonn
Table 60 and Figure 76 show that arable land constitutes a large part of the organic farmland, with almost 7.8 million hectares in Europe and 6.6 million hectares in the European Union (47 and 45 percent of the organic farmland, respectively). The arable land share is higher in Europe, as the Russian Federation and Ukraine have large areas for producing cereals, oilseed, and dry pulses. Permanent grassland accounted for 6.5 million hectares in Europe and 6.4 million hectares in the European Union. Permanent crops constituted 11 percent of the organic farmland with 1.8 and 1.6 million hectares in Europe and the European Union, respectively.
Compared to total agriculture (based on FAO land use data and not strictly comparable), organic arable land constitutes 3.6 percent of the total arable land in Europe and 7.2 percent in the European Union. Whereas the organic share of total permanent grazing area is as high as 13.4 percent in the European Union, it is lower in Europe (3.5 percent). Permanent crops have the highest organic shares: 13.4 percent in the European Union and 10.5 percent in Europe.
The largest increase in 2018-2019 was in arable crops (4.5 percent in Europe), mainly because additional organic arable area was reported for Germany and France. In the European Union, arable land increased by 7.5 percent. Grassland increased by 4.6 percent in Europe and 7.5 percent in the European Union (Table 60, Figure 78, Figure 79.) Arable land grew by almost 40 percent in the 2015-2019 period, and thus showed a greater increase than the permanent crops, which grew by about 30 percent, and permanent grassland, which grew by more than 20 percent (Table 60, Figure 78, Figure 79). It also shows the intensification of organic agriculture, as the share of extensive grassland is decreasing. By country, the largest permanent grassland or grazing area is in Spain with almost 1.3 million hectares, followed by Germany and France (Figure 77). The largest cropland area (i.e., arable and permanent crops together) are in Italy (1.5 million hectares), France (1.5 million hectares) and Spain (1.1 million hectares) (Figure 77).
Figure 77: Europe: Land use in organic agriculture by top 10 countries 2019
Source: FiBL-AMI survey 2021 based on Eurostat and national data sources
0.2
0.2
0.3
0.3
0.4
0.4
0.6
0.8
0.8
1.3
0.0 0.5 1.0 1.5
Portugal
Hungary
Greece
United Kingdom
Austria
Czech Republic
Italy
France
Germany
Spain
Million hectares
Permanent grassland
0.3
0.3
0.3
0.4
0.5
0.5
0.6
0.7
1.0
1.3
0.0 0.4 0.8 1.2 1.6
Austria
Finland
Turkey
Poland
Sweden
Spain
Russia
Germany
Italy
France
Million hectares
Arable crops
0.02
0.02
0.03
0.03
0.06
0.1
0.2
0.2
0.5
0.6
0.0 0.2 0.4 0.6 0.8
Romania
Germany
Bulgaria
Poland
Portugal
Greece
France
Turkey
Italy
Spain
Million hectares
Permanent crops
Europe: Land use in organic agriculture 2019Source: FiBL-AMI survey 2021
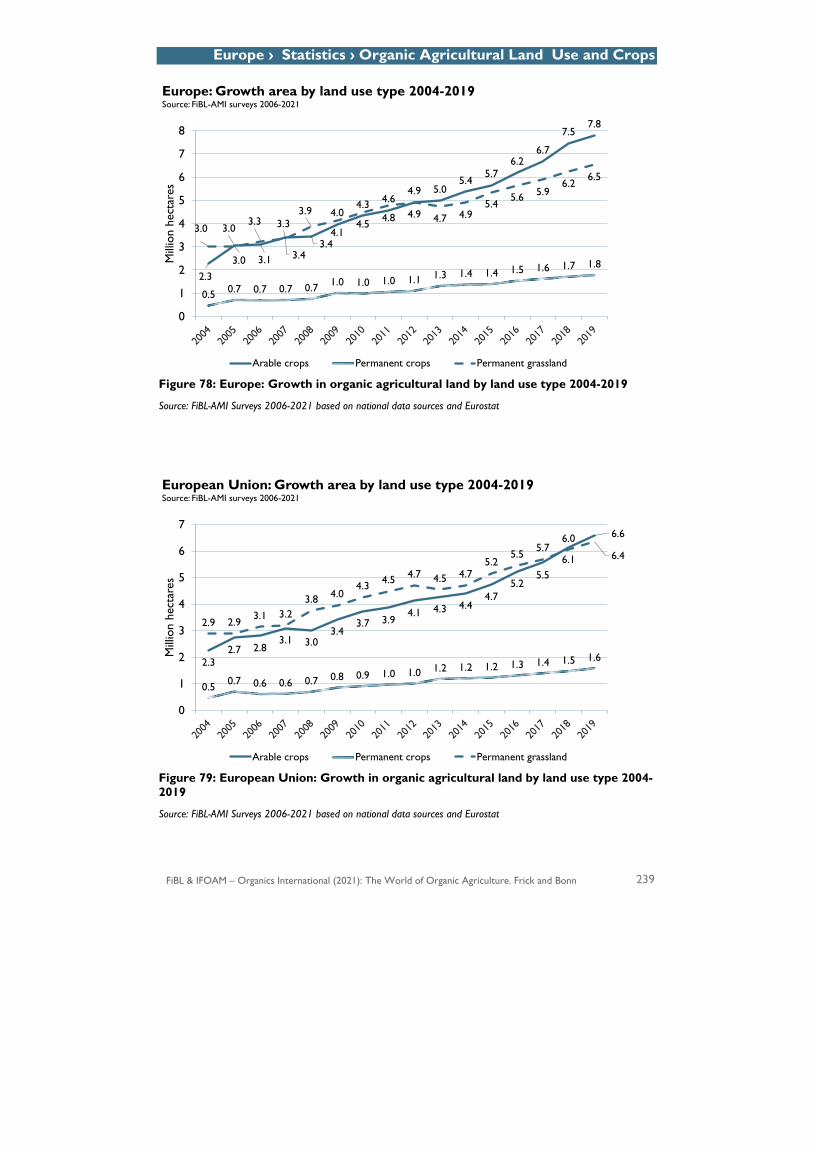
Europe › Statistics › Organic Agricultural Land Use and Crops
FiBL & IFOAM – Organics International (2021): The World of Organic Agriculture. Frick and Bonn 239
Figure 78: Europe: Growth in organic agricultural land by land use type 2004-2019
Source: FiBL-AMI Surveys 2006-2021 based on national data sources and Eurostat
Figure 79: European Union: Growth in organic agricultural land by land use type 2004-2019
Source: FiBL-AMI Surveys 2006-2021 based on national data sources and Eurostat
2.3
3.0
3.1 3.43.4
4.04.3 4.6
4.9 5.05.4
5.76.2
6.7
7.57.8
0.5 0.7 0.7 0.7 0.7 1.0 1.0 1.0 1.1 1.3 1.4 1.4 1.5 1.6 1.7 1.8
3.0
3.0
3.3 3.33.9
4.14.5 4.8 4.9 4.7 4.9
5.45.6 5.9
6.26.5
0
1
2
3
4
5
6
7
8
Mill
ion
hect
ares
Europe: Growth area by land use type 2004-2019Source: FiBL-AMI surveys 2006-2021
Arable crops Permanent crops Permanent grassland
2.32.7 2.8
3.1 3.03.4
3.7 3.94.1 4.3 4.4
4.75.2
5.56.1
6.6
0.5 0.7 0.6 0.6 0.7 0.8 0.9 1.0 1.0 1.2 1.2 1.2 1.3 1.4 1.5 1.6
2.9 2.93.1 3.2
3.8 4.04.3 4.5 4.7 4.5 4.7
5.25.5 5.7
6.0
6.4
0
1
2
3
4
5
6
7
Mill
ion
hect
ares
European Union: Growth area by land use type 2004-2019Source: FiBL-AMI surveys 2006-2021
Arable crops Permanent crops Permanent grassland
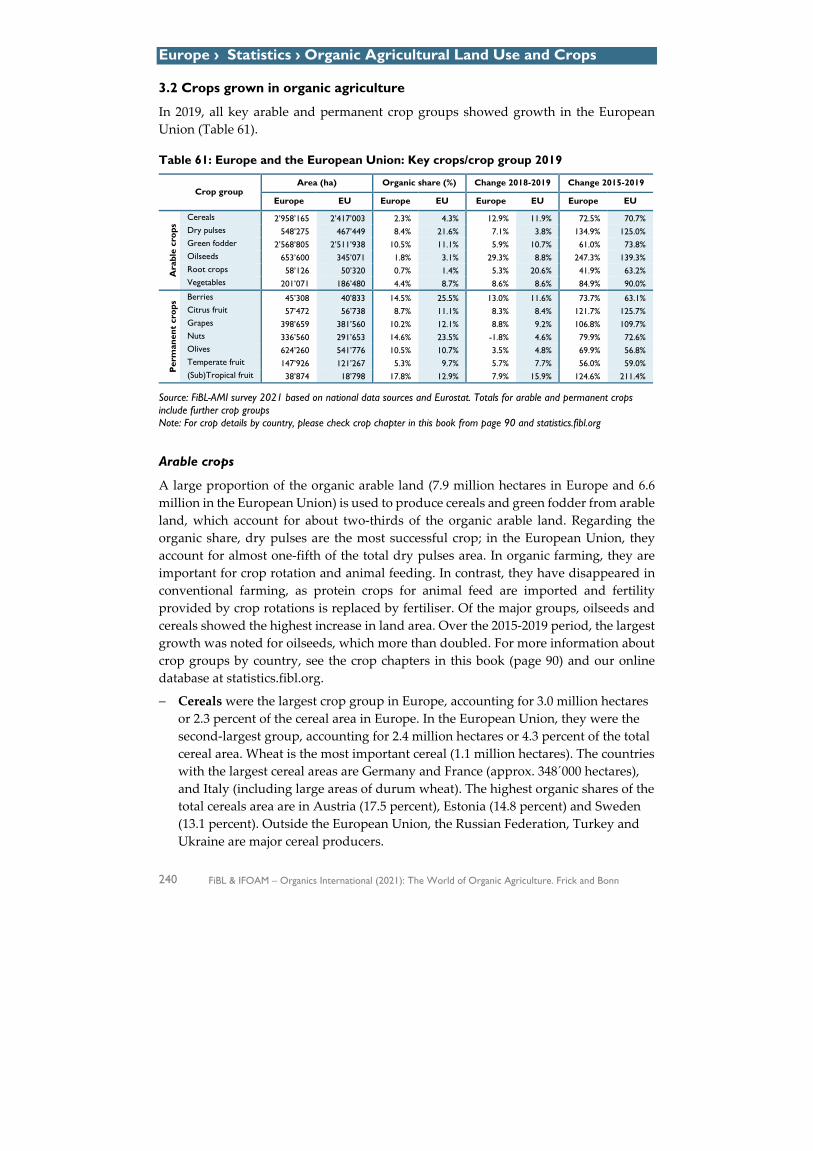
Europe › Statistics › Organic Agricultural Land Use and Crops
240 FiBL & IFOAM – Organics International (2021): The World of Organic Agriculture. Frick and Bonn
3.2 Crops grown in organic agriculture
In 2019, all key arable and permanent crop groups showed growth in the European Union (Table 61).
Table 61: Europe and the European Union: Key crops/crop group 2019
Crop group Area (ha) Organic share (%) Change 2018-2019 Change 2015-2019
Europe EU Europe EU Europe EU Europe EU
Ara
ble
crop
s
Cereals 2’958’165 2’417’003 2.3% 4.3% 12.9% 11.9% 72.5% 70.7% Dry pulses 548’275 467’449 8.4% 21.6% 7.1% 3.8% 134.9% 125.0% Green fodder 2’568’805 2’511’938 10.5% 11.1% 5.9% 10.7% 61.0% 73.8% Oilseeds 653’600 345’071 1.8% 3.1% 29.3% 8.8% 247.3% 139.3% Root crops 58’126 50’320 0.7% 1.4% 5.3% 20.6% 41.9% 63.2% Vegetables 201’071 186’480 4.4% 8.7% 8.6% 8.6% 84.9% 90.0%
Per
man
ent
crop
s Berries 45’308 40’833 14.5% 25.5% 13.0% 11.6% 73.7% 63.1% Citrus fruit 57’472 56’738 8.7% 11.1% 8.3% 8.4% 121.7% 125.7% Grapes 398’659 381’560 10.2% 12.1% 8.8% 9.2% 106.8% 109.7% Nuts 336’560 291’653 14.6% 23.5% -1.8% 4.6% 79.9% 72.6% Olives 624’260 541’776 10.5% 10.7% 3.5% 4.8% 69.9% 56.8% Temperate fruit 147’926 121’267 5.3% 9.7% 5.7% 7.7% 56.0% 59.0% (Sub)Tropical fruit 38’874 18’798 17.8% 12.9% 7.9% 15.9% 124.6% 211.4%
Source: FiBL-AMI survey 2021 based on national data sources and Eurostat. Totals for arable and permanent crops include further crop groups Note: For crop details by country, please check crop chapter in this book from page 90 and statistics.fibl.org
Arable crops
A large proportion of the organic arable land (7.9 million hectares in Europe and 6.6 million in the European Union) is used to produce cereals and green fodder from arable land, which account for about two-thirds of the organic arable land. Regarding the organic share, dry pulses are the most successful crop; in the European Union, they account for almost one-fifth of the total dry pulses area. In organic farming, they are important for crop rotation and animal feeding. In contrast, they have disappeared in conventional farming, as protein crops for animal feed are imported and fertility provided by crop rotations is replaced by fertiliser. Of the major groups, oilseeds and cereals showed the highest increase in land area. Over the 2015-2019 period, the largest growth was noted for oilseeds, which more than doubled. For more information about crop groups by country, see the crop chapters in this book (page 90) and our online database at statistics.fibl.org.
! Cereals were the largest crop group in Europe, accounting for 3.0 million hectares or 2.3 percent of the cereal area in Europe. In the European Union, they were the second-largest group, accounting for 2.4 million hectares or 4.3 percent of the total cereal area. Wheat is the most important cereal (1.1 million hectares). The countries with the largest cereal areas are Germany and France (approx. 348´000 hectares), and Italy (including large areas of durum wheat). The highest organic shares of the total cereals area are in Austria (17.5 percent), Estonia (14.8 percent) and Sweden (13.1 percent). Outside the European Union, the Russian Federation, Turkey and Ukraine are major cereal producers.
Europe › Statistics › Organic Agricultural Land Use and Crops
FiBL & IFOAM – Organics International (2021): The World of Organic Agriculture. Frick and Bonn 241
! In the European Union, the arable crop group with the largest area was for plants harvested green (green fodder from arable land) with 2.6 million hectares (Europe: 2.5 million hectares). Clover, green maize, and grass on arable land were the main crop types.
! In 2019, organic vegetables1 were grown on almost 201’000 hectares of land in Europe, and more than 186’000 hectares in the European Union, covering 4.4 percent and 8.7 percent of the vegetable area, respectively. The largest areas were in Italy (64'762 hectares), France (30'690 hectares), and Spain (22'022 hectares). High organic shares of all vegetables are found in Luxembourg (50 percent), Iceland (44.8 percent) and Denmark (33.5 percent).
! With 548’000 hectares in Europe and 467´000 hectares in the European Union, organic dry pulses accounted for a large share of all dry pulses (8.4 percent in Europe; 21.6 percent in the European Union). One reason is that the conventional crop area has been decreasing for many years due to the availability of cheap protein like soybeans on the world market for both animal feed and human consumption. The strong growth of dry pulses and their high organic shares also reflects European organic farmers' efforts to improve soil fertility and become less dependent on imports of protein crops. The countries with the largest areas of dry pulses were France (131’070 hectares), Germany (52’000 hectares), Italy (47’523) and Poland (47'101 hectares). The highest organic shares were found in Austria (70 percent), Finland (65 percent), and Denmark (48 percent).
Permanent crops
A large part of the permanent cropland (1.8 million hectares in Europe and 1.6 million hectares in the European Union) is used to grow olives, grapes, and nuts. Olives cover one-third of the permanent crop area, and grapes one fifth. Over the 2015-2019 period, the largest growth was noted for tropical and subtropical fruit, which more than doubled. In Europe, olives (0.62 million hectares) and grapes (0.4 million hectares) cover two-thirds of the permanent cropland (Table 61). Both reach an organic share of more than ten percent of their respective totals.
The organic shares for most permanent crops were higher than those for the arable crops. However, it should be noted that the Eurostat data, with which the organic data are compared, do not include all berries or nut types grown in organic agriculture. Thus, a direct comparison is not possible in all cases. For more information about crop groups by country, see the crop chapters in this book (page 90) and our online database at statistics.fibl.org.
! Spain, France, and Italy had an organic grape area of more than 100’000 hectares each. Together with Austria (13.5 percent), they had the highest organic shares of grapes (except some minor organic grape producers that reach even higher shares, such as Poland or Belgium). In Italy, 15.7 percent of the grape area is organic, in France 14.8 percent, and in Spain 12.9 percent.
1 It should be noted that for some countries, potatoes are included in the vegetable category.
Europe › Statistics › Organic Agricultural Land Use and Crops
242 FiBL & IFOAM – Organics International (2021): The World of Organic Agriculture. Frick and Bonn
! For olives, Italy and Spain also have the lead (242'708 hectares and 209'708 hectares, respectively). France (33 percent) and Italy (21 percent) have the highest organic shares. The largest growth occurred in Spain, where the organic olive area increased by more than 9’000 hectares in 2019.
! Temperate fruits were grown on 147'926 hectares (European Union 121'267 hectares), and they covered 5.3 percent of the total temperate fruit area (9.7 percent in the European Union). Several countries in the European Union had a considerable amount of land dedicated to temperate fruit (e.g., apples in Poland and berries in the Baltic countries, both for processing rather than for the fresh market). The most important fruits were apples (66’657 hectares), cherries (17’627 hectares), plums (17’602 hectares) and apricots (16’382 hectares). The largest temperate fruit producers were Italy (26'499 hectares), France (23'450 hectares) and Turkey (20'244 hectares).
3.3 Further organic areas
In addition to the agricultural land, there are further organic areas. Large parts of these are wild collection areas constituting 10.6 million hectares (European Union: 7.2 million hectares). The largest wild collection area in Europe (and in the world) is in Finland with 4.6 million hectares (mainly berries). For country details on wild collection areas, see Table 21.
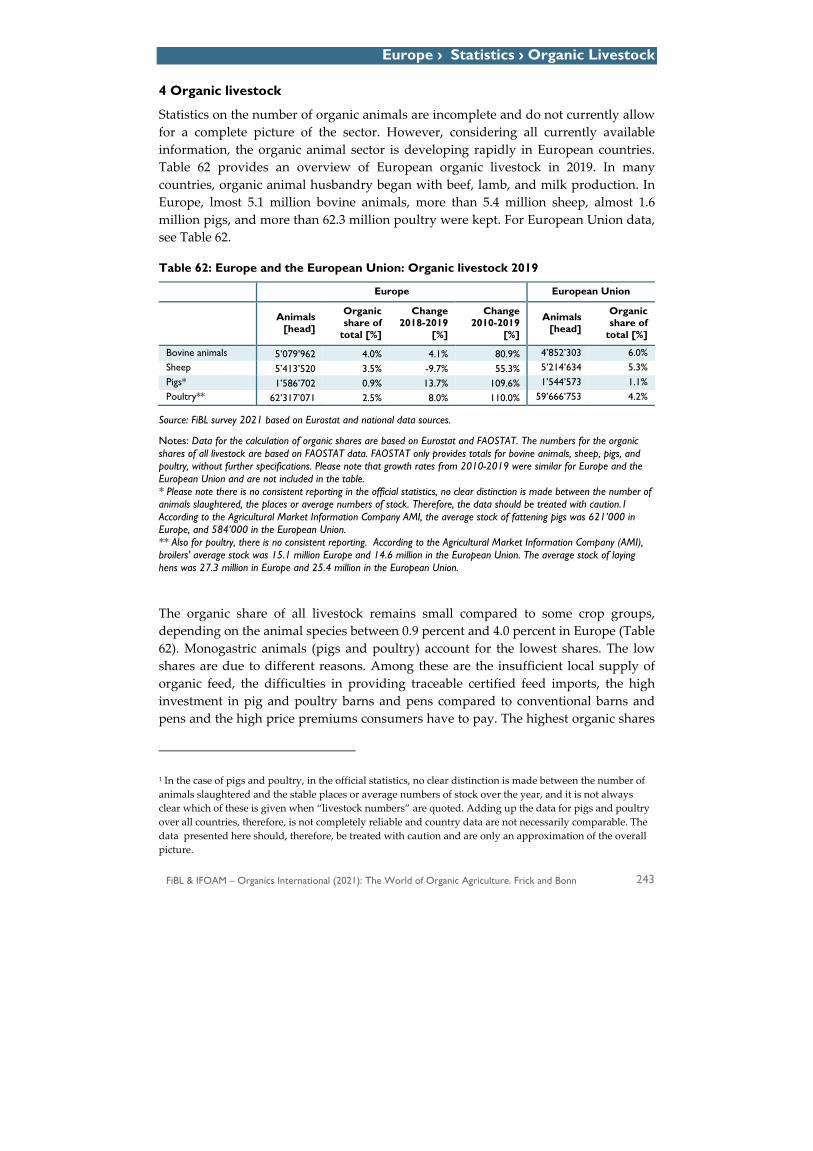
Europe › Statistics › Organic Livestock
FiBL & IFOAM – Organics International (2021): The World of Organic Agriculture. Frick and Bonn 243
4 Organic livestock
Statistics on the number of organic animals are incomplete and do not currently allow for a complete picture of the sector. However, considering all currently available information, the organic animal sector is developing rapidly in European countries. Table 62 provides an overview of European organic livestock in 2019. In many countries, organic animal husbandry began with beef, lamb, and milk production. In Europe, lmost 5.1 million bovine animals, more than 5.4 million sheep, almost 1.6 million pigs, and more than 62.3 million poultry were kept. For European Union data, see Table 62.
Table 62: Europe and the European Union: Organic livestock 2019
Europe European Union
Animals [head]
Organic share of
total [%]
Change 2018-2019
[%]
Change 2010-2019
[%]
Animals [head]
Organic share of
total [%]
Bovine animals 5’079’962 4.0% 4.1% 80.9% 4’852’303 6.0% Sheep 5’413’520 3.5% -9.7% 55.3% 5’214’634 5.3% Pigs* 1’586’702 0.9% 13.7% 109.6% 1’544’573 1.1% Poultry** 62’317’071 2.5% 8.0% 110.0% 59’666’753 4.2%
Source: FiBL survey 2021 based on Eurostat and national data sources.
Notes: Data for the calculation of organic shares are based on Eurostat and FAOSTAT. The numbers for the organic shares of all livestock are based on FAOSTAT data. FAOSTAT only provides totals for bovine animals, sheep, pigs, and poultry, without further specifications. Please note that growth rates from 2010-2019 were similar for Europe and the European Union and are not included in the table. * Please note there is no consistent reporting in the official statistics, no clear distinction is made between the number of animals slaughtered, the places or average numbers of stock. Therefore, the data should be treated with caution.1 According to the Agricultural Market Information Company AMI, the average stock of fattening pigs was 621’000 in Europe, and 584’000 in the European Union. ** Also for poultry, there is no consistent reporting. According to the Agricultural Market Information Company (AMI), broilers' average stock was 15.1 million Europe and 14.6 million in the European Union. The average stock of laying hens was 27.3 million in Europe and 25.4 million in the European Union.
The organic share of all livestock remains small compared to some crop groups, depending on the animal species between 0.9 percent and 4.0 percent in Europe (Table 62). Monogastric animals (pigs and poultry) account for the lowest shares. The low shares are due to different reasons. Among these are the insufficient local supply of organic feed, the difficulties in providing traceable certified feed imports, the high investment in pig and poultry barns and pens compared to conventional barns and pens and the high price premiums consumers have to pay. The highest organic shares
1 In the case of pigs and poultry, in the official statistics, no clear distinction is made between the number of animals slaughtered and the stable places or average numbers of stock over the year, and it is not always clear which of these is given when “livestock numbers” are quoted. Adding up the data for pigs and poultry over all countries, therefore, is not completely reliable and country data are not necessarily comparable. The data presented here should, therefore, be treated with caution and are only an approximation of the overall picture.
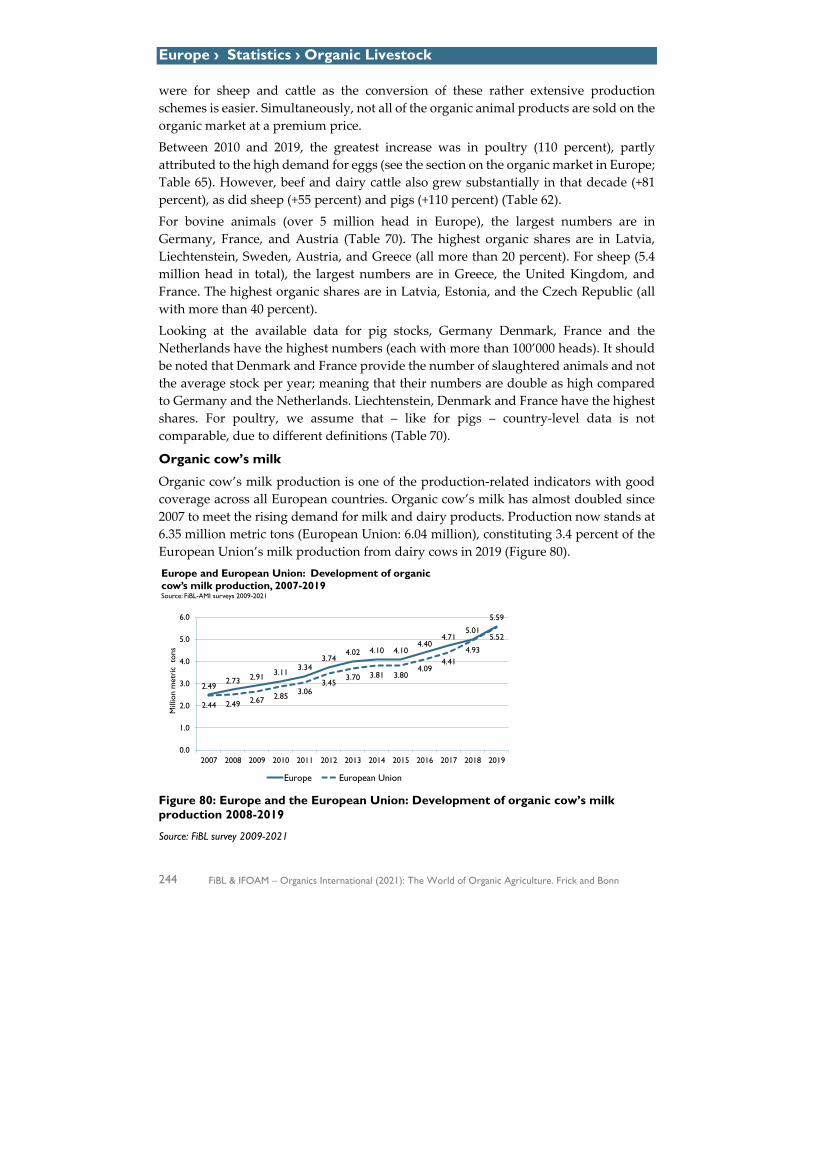
Europe › Statistics › Organic Livestock
244 FiBL & IFOAM – Organics International (2021): The World of Organic Agriculture. Frick and Bonn
were for sheep and cattle as the conversion of these rather extensive production schemes is easier. Simultaneously, not all of the organic animal products are sold on the organic market at a premium price. Between 2010 and 2019, the greatest increase was in poultry (110 percent), partly attributed to the high demand for eggs (see the section on the organic market in Europe; Table 65). However, beef and dairy cattle also grew substantially in that decade (+81 percent), as did sheep (+55 percent) and pigs (+110 percent) (Table 62). For bovine animals (over 5 million head in Europe), the largest numbers are in Germany, France, and Austria (Table 70). The highest organic shares are in Latvia, Liechtenstein, Sweden, Austria, and Greece (all more than 20 percent). For sheep (5.4 million head in total), the largest numbers are in Greece, the United Kingdom, and France. The highest organic shares are in Latvia, Estonia, and the Czech Republic (all with more than 40 percent). Looking at the available data for pig stocks, Germany Denmark, France and the Netherlands have the highest numbers (each with more than 100’000 heads). It should be noted that Denmark and France provide the number of slaughtered animals and not the average stock per year; meaning that their numbers are double as high compared to Germany and the Netherlands. Liechtenstein, Denmark and France have the highest shares. For poultry, we assume that – like for pigs – country-level data is not comparable, due to different definitions (Table 70).
Organic cow’s milk
Organic cow’s milk production is one of the production-related indicators with good coverage across all European countries. Organic cow’s milk has almost doubled since 2007 to meet the rising demand for milk and dairy products. Production now stands at 6.35 million metric tons (European Union: 6.04 million), constituting 3.4 percent of the European Union’s milk production from dairy cows in 2019 (Figure 80).
Figure 80: Europe and the European Union: Development of organic cow’s milk production 2008-2019
Source: FiBL survey 2009-2021
2.492.73 2.91 3.11
3.343.74
4.02 4.10 4.104.40
4.715.01
5.59
2.44 2.49 2.67 2.85 3.063.45
3.70 3.81 3.804.09
4.414.93
5.52
0.0
1.0
2.0
3.0
4.0
5.0
6.0
2007 2008 2009 2010 2011 2012 2013 2014 2015 2016 2017 2018 2019
Mill
ion
met
ric
tons
Europe and European Union: Development of organic cow’s milk production, 2007-2019Source: FiBL-AMI surveys 2009-2021
Europe European Union
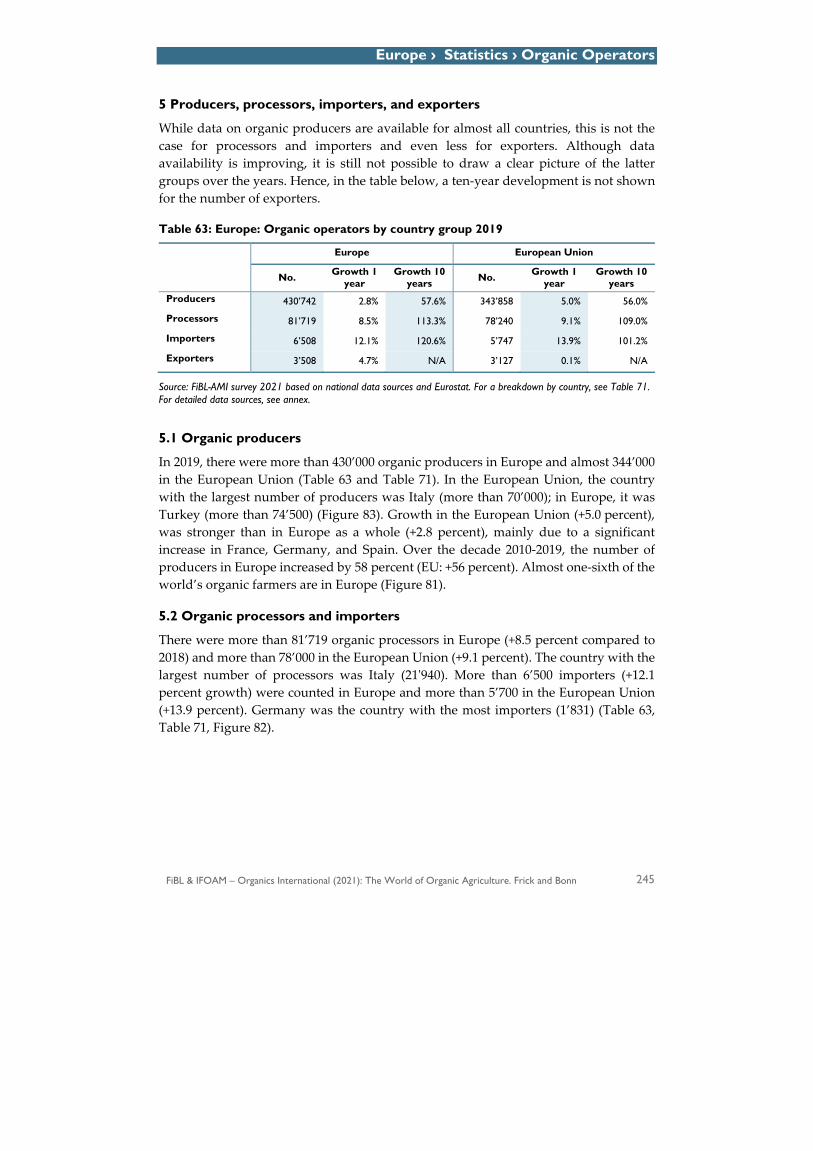
Europe › Statistics › Organic Operators
FiBL & IFOAM – Organics International (2021): The World of Organic Agriculture. Frick and Bonn 245
5 Producers, processors, importers, and exporters
While data on organic producers are available for almost all countries, this is not the case for processors and importers and even less for exporters. Although data availability is improving, it is still not possible to draw a clear picture of the latter groups over the years. Hence, in the table below, a ten-year development is not shown for the number of exporters.
Table 63: Europe: Organic operators by country group 2019
Europe European Union
No. Growth 1 year
Growth 10 years No. Growth 1
year Growth 10
years Producers 430’742 2.8% 57.6% 343’858 5.0% 56.0%
Processors 81’719 8.5% 113.3% 78’240 9.1% 109.0%
Importers 6’508 12.1% 120.6% 5’747 13.9% 101.2%
Exporters 3’508 4.7% N/A 3’127 0.1% N/A
Source: FiBL-AMI survey 2021 based on national data sources and Eurostat. For a breakdown by country, see Table 71. For detailed data sources, see annex.
5.1 Organic producers
In 2019, there were more than 430’000 organic producers in Europe and almost 344’000 in the European Union (Table 63 and Table 71). In the European Union, the country with the largest number of producers was Italy (more than 70’000); in Europe, it was Turkey (more than 74’500) (Figure 83). Growth in the European Union (+5.0 percent), was stronger than in Europe as a whole (+2.8 percent), mainly due to a significant increase in France, Germany, and Spain. Over the decade 2010-2019, the number of producers in Europe increased by 58 percent (EU: +56 percent). Almost one-sixth of the world’s organic farmers are in Europe (Figure 81).
5.2 Organic processors and importers
There were more than 81’719 organic processors in Europe (+8.5 percent compared to 2018) and more than 78’000 in the European Union (+9.1 percent). The country with the largest number of processors was Italy (21'940). More than 6’500 importers (+12.1 percent growth) were counted in Europe and more than 5’700 in the European Union (+13.9 percent). Germany was the country with the most importers (1’831) (Table 63, Table 71, Figure 82).
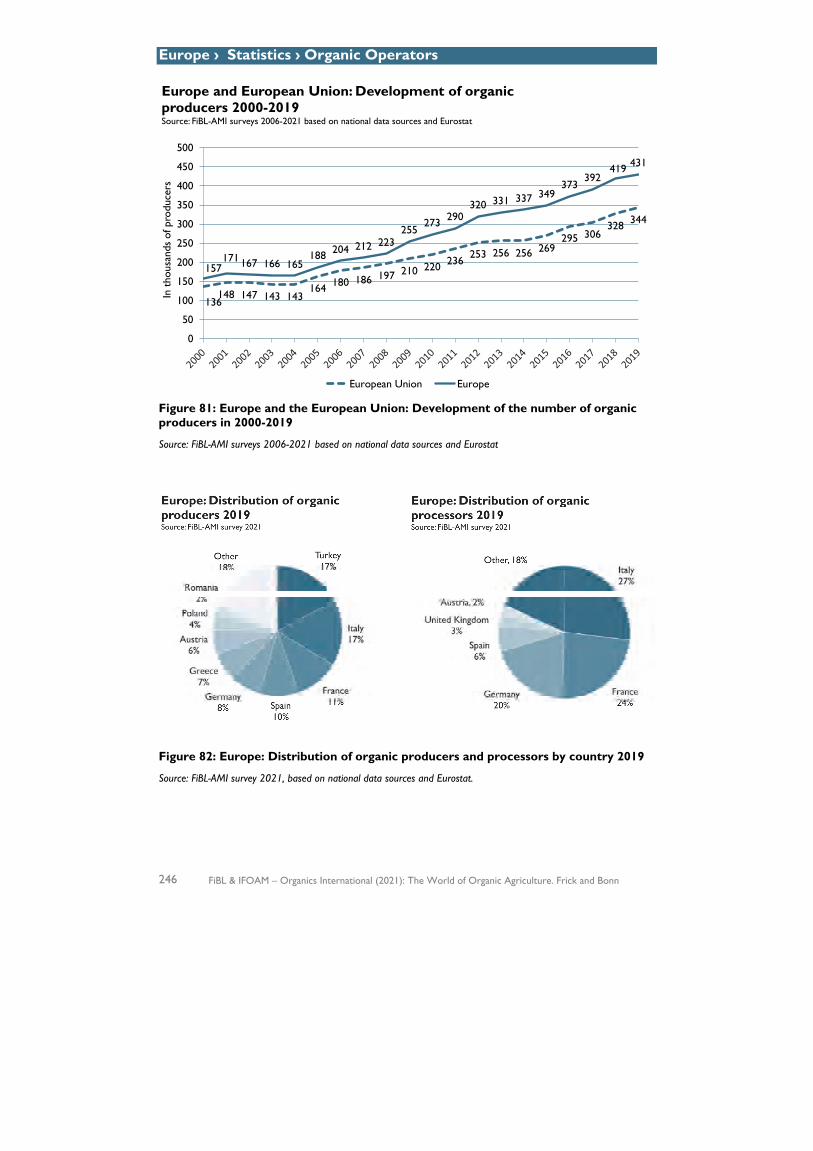
Europe › Statistics › Organic Operators
246 FiBL & IFOAM – Organics International (2021): The World of Organic Agriculture. Frick and Bonn
Figure 81: Europe and the European Union: Development of the number of organic producers in 2000-2019
Source: FiBL-AMI surveys 2006-2021 based on national data sources and Eurostat
Figure 82: Europe: Distribution of organic producers and processors by country 2019
Source: FiBL-AMI survey 2021, based on national data sources and Eurostat.
136148 147 143 143
164 180 186 197 210 220 236253 256 256 269
295 306328 344
157171 167 166 165
188 204 212 223255
273 290320 331 337 349
373392
419 431
0
50
100
150
200
250
300
350
400
450
500
In t
hous
ands
of p
rodu
cers
Europe and European Union: Development of organic producers 2000-2019Source: FiBL-AMI surveys 2006-2021 based on national data sources and Eurostat
European Union Europe
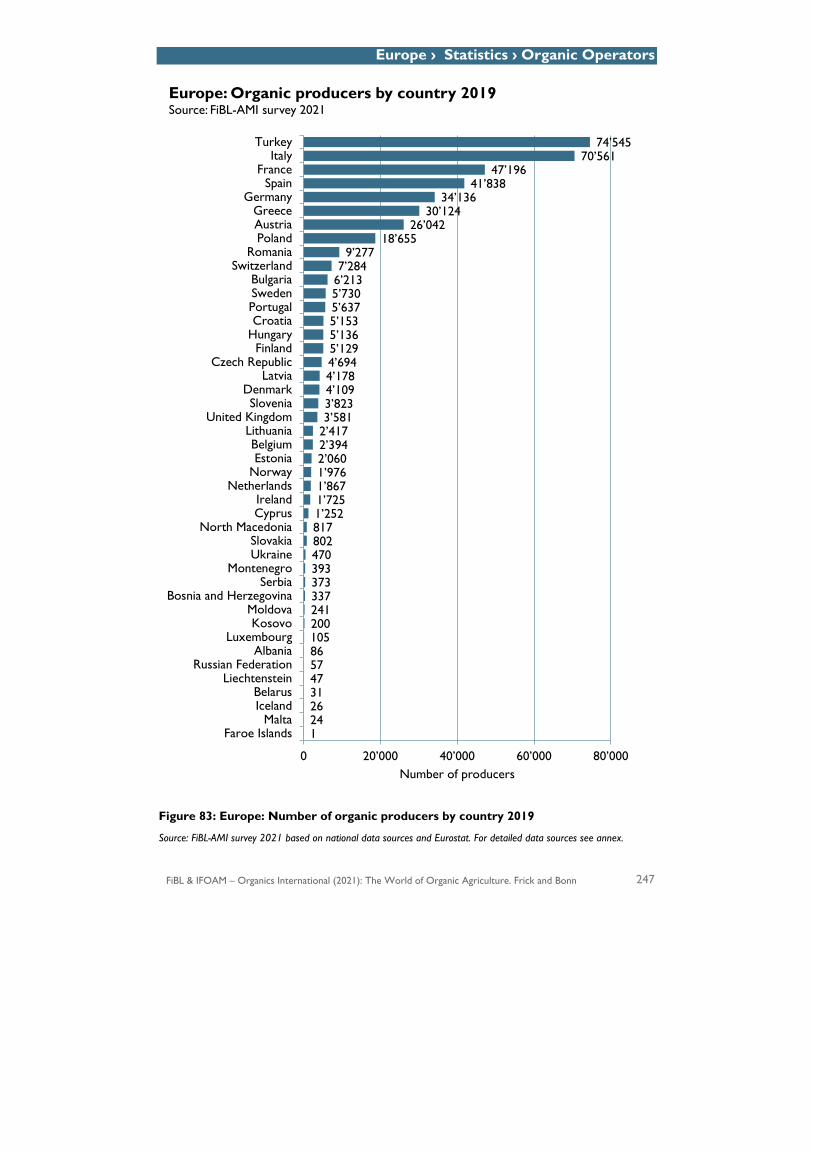
Europe › Statistics › Organic Operators
FiBL & IFOAM – Organics International (2021): The World of Organic Agriculture. Frick and Bonn 247
Figure 83: Europe: Number of organic producers by country 2019
Source: FiBL-AMI survey 2021 based on national data sources and Eurostat. For detailed data sources see annex.
12426314757861052002413373733934708028171’2521’7251’8671’9762’0602’3942’4173’5813’8234’1094’1784’6945’1295’1365’1535’6375’7306’2137’284
9’27718’655
26’04230’124
34’13641’838
47’19670’561
74’545
0 20’000 40’000 60’000 80’000
Faroe IslandsMalta
IcelandBelarus
LiechtensteinRussian Federation
AlbaniaLuxembourg
KosovoMoldova
Bosnia and HerzegovinaSerbia
MontenegroUkraineSlovakia
North MacedoniaCyprusIreland
NetherlandsNorwayEstoniaBelgium
LithuaniaUnited Kingdom
SloveniaDenmark
LatviaCzech Republic
FinlandHungaryCroatia
PortugalSwedenBulgaria
SwitzerlandRomania
PolandAustriaGreece
GermanySpain
FranceItaly
Turkey
Number of producers
Europe: Organic producers by country 2019Source: FiBL-AMI survey 2021
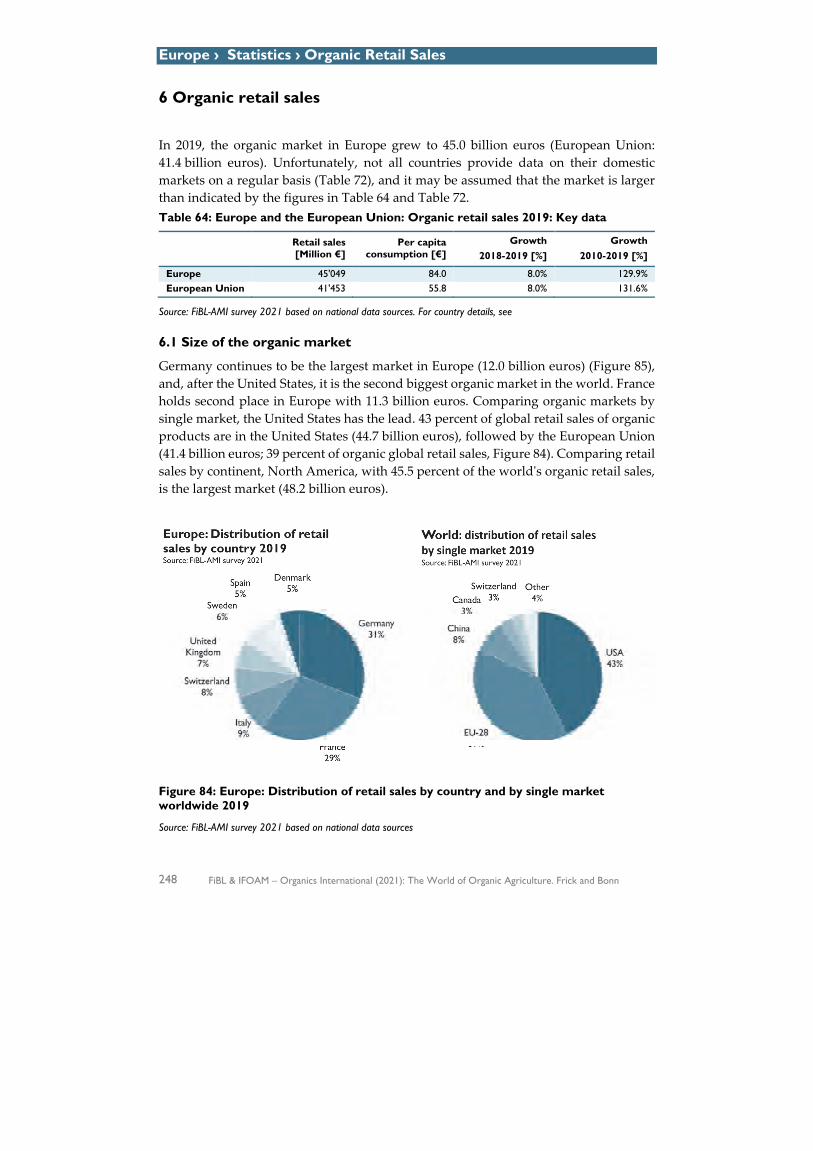
Europe › Statistics › Organic Retail Sales
248 FiBL & IFOAM – Organics International (2021): The World of Organic Agriculture. Frick and Bonn
6 Organic retail sales
In 2019, the organic market in Europe grew to 45.0 billion euros (European Union: 41.4 billion euros). Unfortunately, not all countries provide data on their domestic markets on a regular basis (Table 72), and it may be assumed that the market is larger than indicated by the figures in Table 64 and Table 72. Table 64: Europe and the European Union: Organic retail sales 2019: Key data
Retail sales [Million €]
Per capita consumption [€]
Growth 2018-2019 [%]
Growth 2010-2019 [%]
Europe 45'049 84.0 8.0% 129.9% European Union 41'453 55.8 8.0% 131.6%
Source: FiBL-AMI survey 2021 based on national data sources. For country details, see
6.1 Size of the organic market
Germany continues to be the largest market in Europe (12.0 billion euros) (Figure 85), and, after the United States, it is the second biggest organic market in the world. France holds second place in Europe with 11.3 billion euros. Comparing organic markets by single market, the United States has the lead. 43 percent of global retail sales of organic products are in the United States (44.7 billion euros), followed by the European Union (41.4 billion euros; 39 percent of organic global retail sales, Figure 84). Comparing retail sales by continent, North America, with 45.5 percent of the world's organic retail sales, is the largest market (48.2 billion euros).
Figure 84: Europe: Distribution of retail sales by country and by single market worldwide 2019
Source: FiBL-AMI survey 2021 based on national data sources
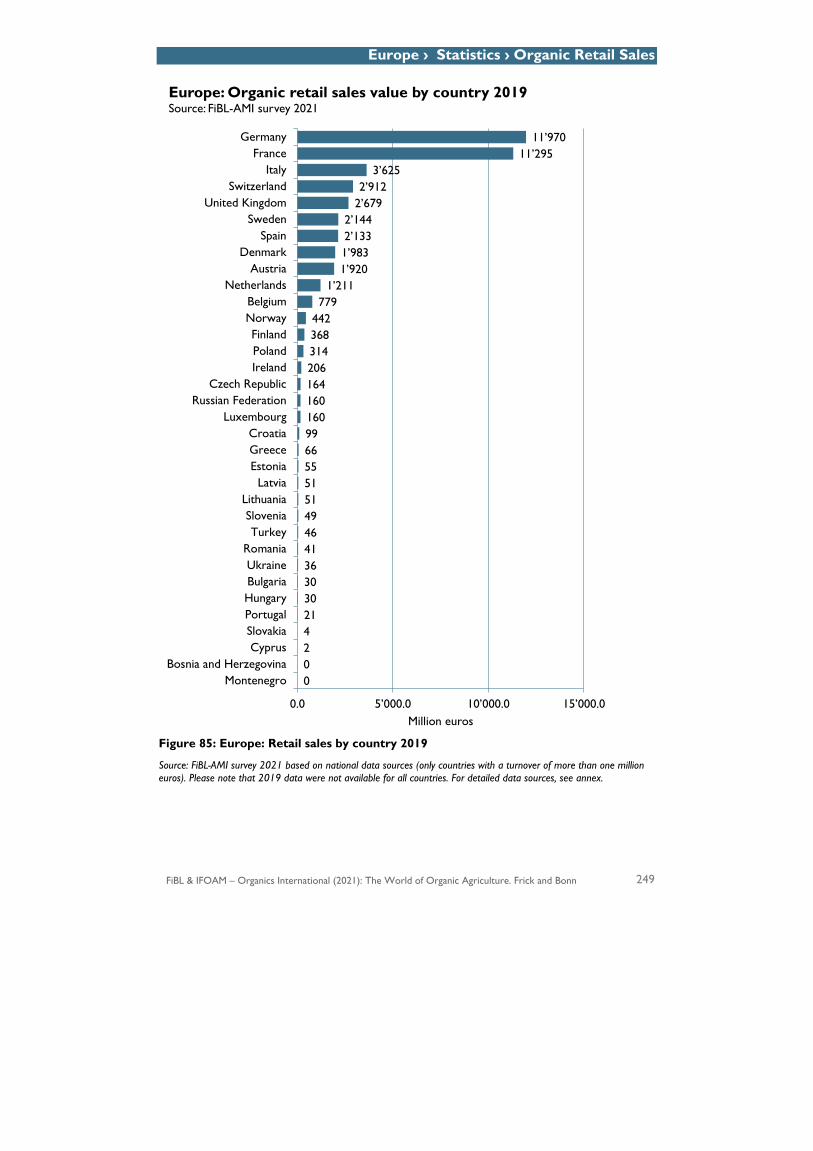
Europe › Statistics › Organic Retail Sales
FiBL & IFOAM – Organics International (2021): The World of Organic Agriculture. Frick and Bonn 249
Figure 85: Europe: Retail sales by country 2019
Source: FiBL-AMI survey 2021 based on national data sources (only countries with a turnover of more than one million euros). Please note that 2019 data were not available for all countries. For detailed data sources, see annex.
0024213030364146495151556699160160164206314368442779
1’2111’9201’9832’1332’144
2’6792’912
3’62511’295
11’970
0.0 5’000.0 10’000.0 15’000.0
MontenegroBosnia and Herzegovina
CyprusSlovakiaPortugalHungaryBulgariaUkraine
RomaniaTurkey
SloveniaLithuania
LatviaEstoniaGreeceCroatia
LuxembourgRussian Federation
Czech RepublicIrelandPolandFinland
NorwayBelgium
NetherlandsAustria
DenmarkSpain
SwedenUnited Kingdom
SwitzerlandItaly
FranceGermany
Million euros
Europe: Organic retail sales value by country 2019Source: FiBL-AMI survey 2021
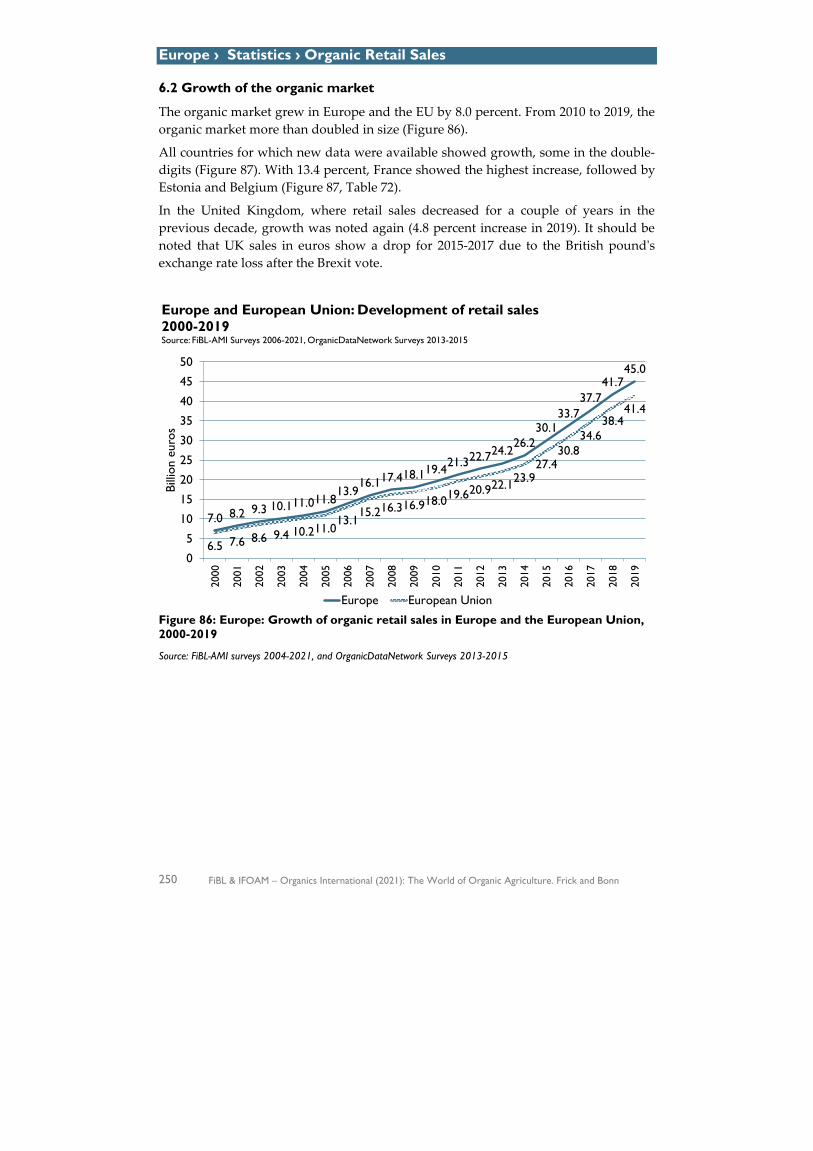
Europe › Statistics › Organic Retail Sales
250 FiBL & IFOAM – Organics International (2021): The World of Organic Agriculture. Frick and Bonn
6.2 Growth of the organic market
The organic market grew in Europe and the EU by 8.0 percent. From 2010 to 2019, the organic market more than doubled in size (Figure 86).
All countries for which new data were available showed growth, some in the double-digits (Figure 87). With 13.4 percent, France showed the highest increase, followed by Estonia and Belgium (Figure 87, Table 72).
In the United Kingdom, where retail sales decreased for a couple of years in the previous decade, growth was noted again (4.8 percent increase in 2019). It should be noted that UK sales in euros show a drop for 2015-2017 due to the British pound's exchange rate loss after the Brexit vote.
Figure 86: Europe: Growth of organic retail sales in Europe and the European Union, 2000-2019
Source: FiBL-AMI surveys 2004-2021, and OrganicDataNetwork Surveys 2013-2015
7.0 8.2 9.3 10.111.011.813.9
16.117.418.119.421.322.724.226.2
30.133.7
37.741.7
45.0
6.5 7.6 8.6 9.4 10.211.013.1
15.216.316.918.019.620.922.123.927.4
30.834.6
38.441.4
0
5
10
15
20
25
30
35
40
45
50
2000
2001
2002
2003
2004
2005
2006
2007
2008
2009
2010
2011
2012
2013
2014
2015
2016
2017
2018
2019
Billi
on e
uros
Europe and European Union: Development of retail sales 2000-2019Source: FiBL-AMI Surveys 2006-2021, OrganicDataNetwork Surveys 2013-2015
Europe European Union
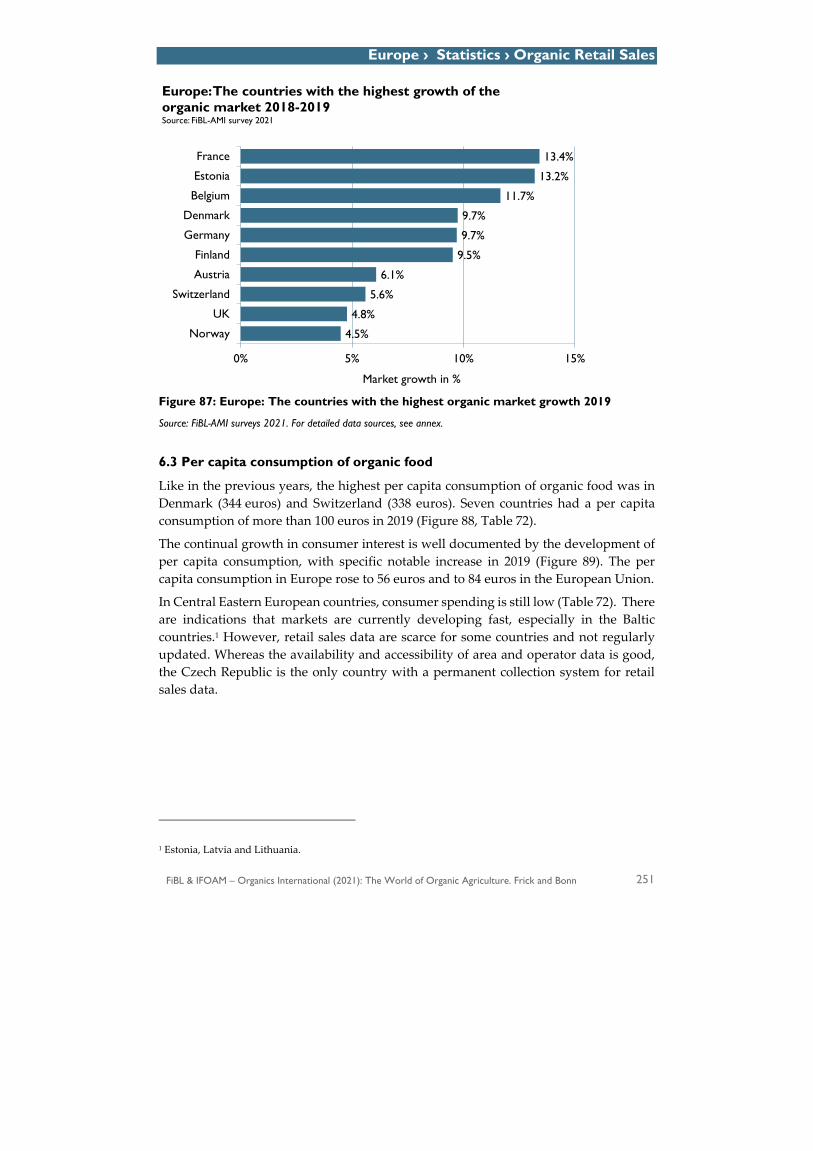
Europe › Statistics › Organic Retail Sales
FiBL & IFOAM – Organics International (2021): The World of Organic Agriculture. Frick and Bonn 251
Figure 87: Europe: The countries with the highest organic market growth 2019
Source: FiBL-AMI surveys 2021. For detailed data sources, see annex.
6.3 Per capita consumption of organic food
Like in the previous years, the highest per capita consumption of organic food was in Denmark (344 euros) and Switzerland (338 euros). Seven countries had a per capita consumption of more than 100 euros in 2019 (Figure 88, Table 72).
The continual growth in consumer interest is well documented by the development of per capita consumption, with specific notable increase in 2019 (Figure 89). The per capita consumption in Europe rose to 56 euros and to 84 euros in the European Union.
In Central Eastern European countries, consumer spending is still low (Table 72). There are indications that markets are currently developing fast, especially in the Baltic countries.1 However, retail sales data are scarce for some countries and not regularly updated. Whereas the availability and accessibility of area and operator data is good, the Czech Republic is the only country with a permanent collection system for retail sales data.
1 Estonia, Latvia and Lithuania.
4.5%
4.8%
5.6%
6.1%
9.5%
9.7%
9.7%
11.7%
13.2%
13.4%
0% 5% 10% 15%
Norway
UK
Switzerland
Austria
Finland
Germany
Denmark
Belgium
Estonia
France
Market growth in %
Europe: The countries with the highest growth of the organic market 2018-2019Source: FiBL-AMI survey 2021
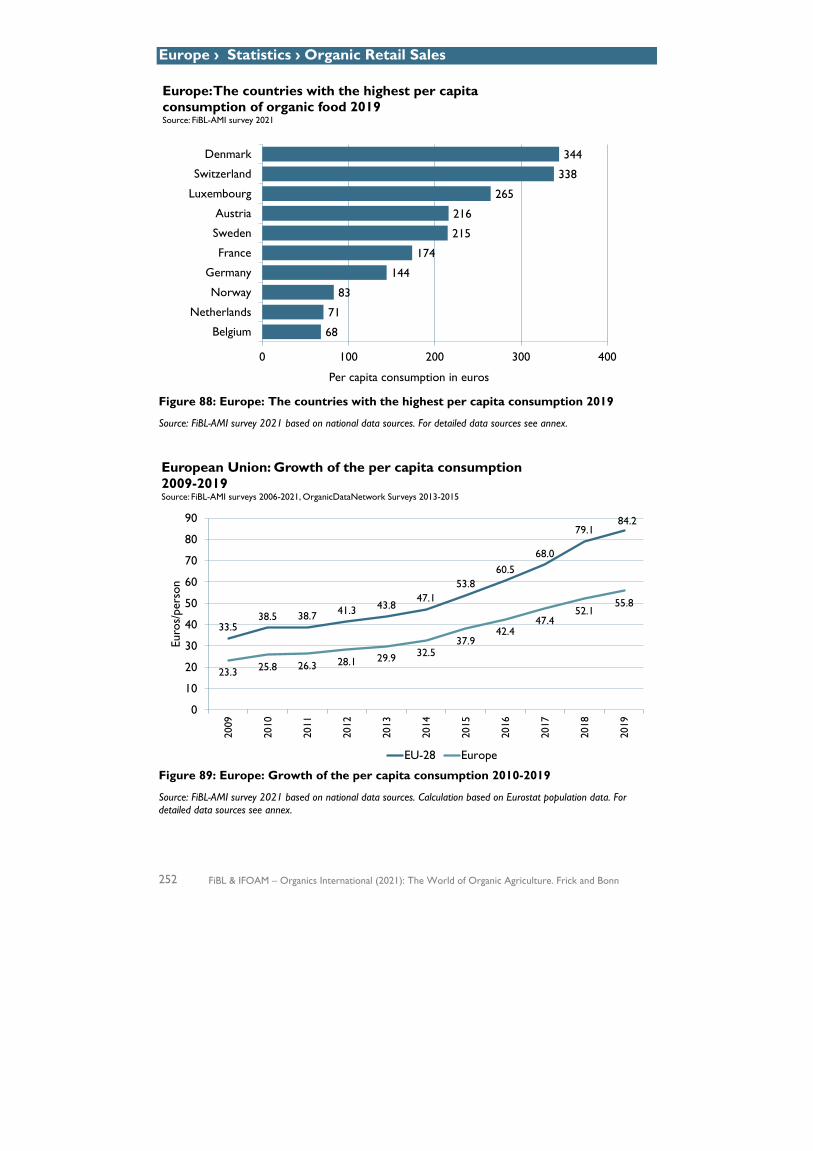
Europe › Statistics › Organic Retail Sales
252 FiBL & IFOAM – Organics International (2021): The World of Organic Agriculture. Frick and Bonn
Figure 88: Europe: The countries with the highest per capita consumption 2019
Source: FiBL-AMI survey 2021 based on national data sources. For detailed data sources see annex.
Figure 89: Europe: Growth of the per capita consumption 2010-2019
Source: FiBL-AMI survey 2021 based on national data sources. Calculation based on Eurostat population data. For detailed data sources see annex.
68
71
83
144
174
215
216
265
338
344
0 100 200 300 400
Belgium
Netherlands
Norway
Germany
France
Sweden
Austria
Luxembourg
Switzerland
Denmark
Per capita consumption in euros
Europe: The countries with the highest per capita consumption of organic food 2019Source: FiBL-AMI survey 2021
33.538.5 38.7 41.3 43.8
47.153.8
60.568.0
79.184.2
23.3 25.8 26.3 28.1 29.9 32.537.9
42.447.4
52.155.8
0
10
20
30
40
50
60
70
80
90
2009
2010
2011
2012
2013
2014
2015
2016
2017
2018
2019
Euro
s/pe
rson
European Union: Growth of the per capita consumption 2009-2019Source: FiBL-AMI surveys 2006-2021, OrganicDataNetwork Surveys 2013-2015
EU-28 Europe
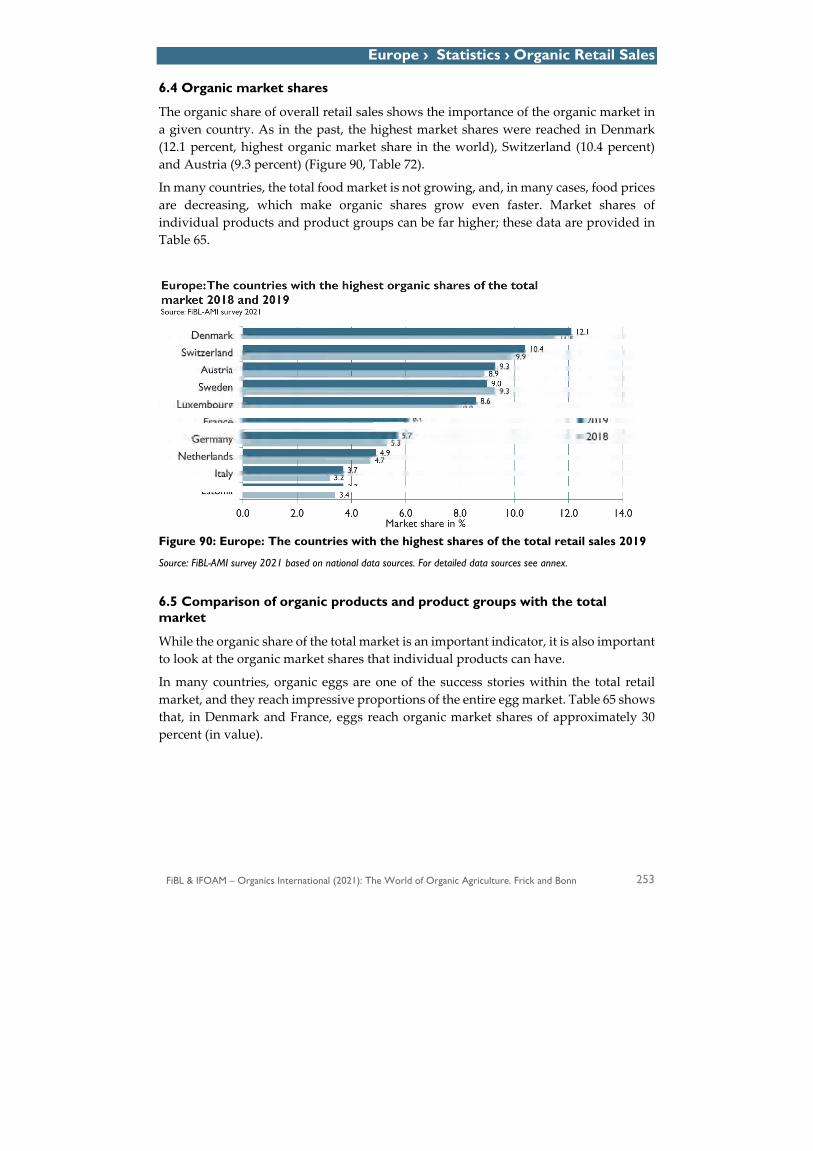
Europe › Statistics › Organic Retail Sales
FiBL & IFOAM – Organics International (2021): The World of Organic Agriculture. Frick and Bonn 253
6.4 Organic market shares
The organic share of overall retail sales shows the importance of the organic market in a given country. As in the past, the highest market shares were reached in Denmark (12.1 percent, highest organic market share in the world), Switzerland (10.4 percent) and Austria (9.3 percent) (Figure 90, Table 72).
In many countries, the total food market is not growing, and, in many cases, food prices are decreasing, which make organic shares grow even faster. Market shares of individual products and product groups can be far higher; these data are provided in Table 65.
Figure 90: Europe: The countries with the highest shares of the total retail sales 2019
Source: FiBL-AMI survey 2021 based on national data sources. For detailed data sources see annex.
6.5 Comparison of organic products and product groups with the total market
While the organic share of the total market is an important indicator, it is also important to look at the organic market shares that individual products can have.
In many countries, organic eggs are one of the success stories within the total retail market, and they reach impressive proportions of the entire egg market. Table 65 shows that, in Denmark and France, eggs reach organic market shares of approximately 30 percent (in value).

Eur
ope
› St
atis
tics
› O
rgan
ic R
etai
l Sal
es
254
FiBL
& IF
OA
M –
Org
anic
s In
tern
atio
nal (
2021
): T
he W
orld
of O
rgan
ic A
gric
ultu
re. F
rick
and
Bon
n T
able
65:
Org
anic
sha
res
for
reta
il sa
les
valu
es (
euro
s) fo
r se
lect
ed p
rodu
cts
2019
Austria
Belgium (2018)
Czech Republic (2018)
Denmark
Finland
France
Germany
Italy
Netherlands (2018)
Norway (2018)
Spain (2017)
Sweden (2017)
Switzerland
UK
Baby
food
23
.0
26.9
4.8
33
.1
55
.4
Beve
rage
s
0.
4 14
.4
(juic
e)
5.
5
3.0
0.
5
5.6
4.0
Br
ead
& b
aker
y pr
oduc
ts
4.5
0.4
5.3
7.4
4.0
2.6
2.1
3.
5 26
.1
0.3
Eggs
22
.1
18.2
29.6
18
.0
37.2
20
.6
19.8
15
.9
9.5
2.9
28.7
8.
8 Fi
sh a
nd fi
sh p
rodu
cts
0.
6
3.1
1.
3 1.
5 0.
6 12
.9
1.1
Fres
h ve
geta
bles
16
.0
4.
5 7.
6 9.
8 4.
7
4.2
3.3
12.2
23
.1
4.3
Frui
t 11
.0
7.
5 8.
8 7.
5 6.
6
2.2
1.7
18.4
17
.5
2.8
Veg
etab
les
and
frui
t 13
.6
1.
3
8.
2
7.7
5.8
20
.3
0.5
Mea
t an
d m
eat
prod
ucts
3.
8
0.2
8.0
(bee
f)
3.2
2.9
2.9
4.7
0.5
1.2
2.9
6.2
1.5
Milk
and
dai
ry p
rodu
cts
12.4
1.4
5.8
8.5
3.6
5.6
2.1
1.1
10.4
11
.0
3.5
- But
ter
11.2
4.
7
16.8
7.4
4.5
2.8
3.
1
-
Che
ese
10.3
6.
8
2.6
4.7
1.0
0.
7
7.
6 1.
1 -
Milk
21
.8
3.3
32
.3
4.5
15.7
12
.4
8.1
4.
4
24
.9
5.5
- Yog
hurt
23
.7
10.1
9.1
8.2
6.1
0.
7
7.8
Sour
ces:
FiBL
-AM
I sur
vey
2021
, bas
ed o
n da
ta fr
om A
ustri
a: R
ollA
MA
base
d on
GfK
, Bel
gium
: LV
base
d on
GFK
; Cze
ch R
epub
lic: U
ZEI;
Den
mar
k: G
fK C
onsu
mer
Scan
, pro
vided
by
LF, F
inla
nd: P
ro
Luom
u; F
ranc
e: A
genc
e Bi
o, fo
r som
e pr
oduc
ts s
uper
mar
ket s
ale
; Ger
man
y: Ag
ricul
tura
l Mar
ket I
nfor
mat
ion
Com
pany
AM
I bas
ed o
n G
fK; I
taly:
sup
erm
arke
ts a
nd d
iscou
nter
s on
ly, d
ata
prov
ided
by
tMar
che
Polyt
echn
ic U
nive
rsity
; Net
herla
nds:
Bion
ext;
Nor
way
: Nie
lsen
Nor
way
; Sw
eden
: Sta
tistic
s Sw
eden
(exc
lude
s al
coho
lic b
ever
ages
); Sw
itzer
land
: Bio
Sui
sse
base
d on
Nie
lsen;
UK:
Soi
l As
socia
tion.
Not
e: D
ue to
cla
ssifi
catio
ns a
nd n
omen
clatu
res
diffe
ring
from
cou
ntry
to c
ount
ry, i
t is
not p
ossib
le to
sup
ply
data
for a
ll pr
oduc
t gro
ups,
even
if d
ata
for i
ndivi
dual
pro
duct
s m
ay b
e av
aila
ble.
Not
all
coun
tries
hav
e da
ta o
n th
e m
arke
t sha
res
of o
rgan
ic pr
oduc
ts.
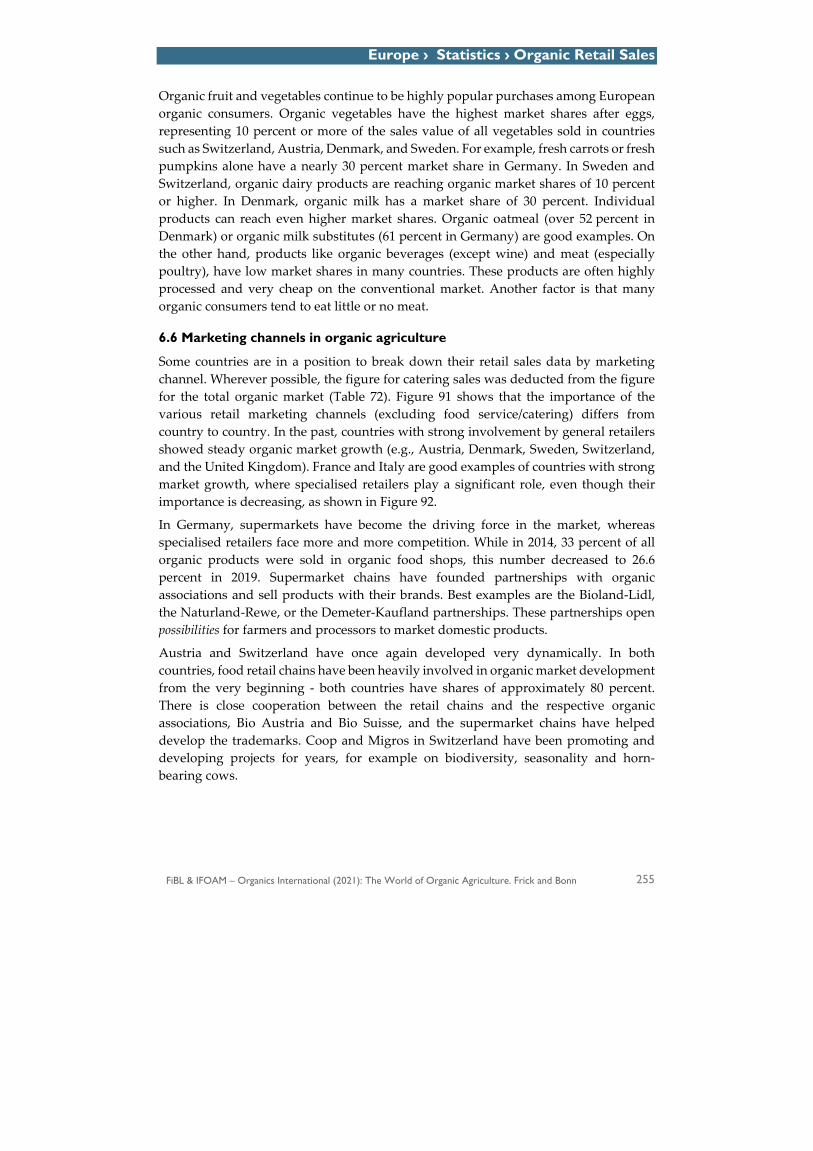
Europe › Statistics › Organic Retail Sales
FiBL & IFOAM – Organics International (2021): The World of Organic Agriculture. Frick and Bonn 255
Organic fruit and vegetables continue to be highly popular purchases among European organic consumers. Organic vegetables have the highest market shares after eggs, representing 10 percent or more of the sales value of all vegetables sold in countries such as Switzerland, Austria, Denmark, and Sweden. For example, fresh carrots or fresh pumpkins alone have a nearly 30 percent market share in Germany. In Sweden and Switzerland, organic dairy products are reaching organic market shares of 10 percent or higher. In Denmark, organic milk has a market share of 30 percent. Individual products can reach even higher market shares. Organic oatmeal (over 52 percent in Denmark) or organic milk substitutes (61 percent in Germany) are good examples. On the other hand, products like organic beverages (except wine) and meat (especially poultry), have low market shares in many countries. These products are often highly processed and very cheap on the conventional market. Another factor is that many organic consumers tend to eat little or no meat.
6.6 Marketing channels in organic agriculture
Some countries are in a position to break down their retail sales data by marketing channel. Wherever possible, the figure for catering sales was deducted from the figure for the total organic market (Table 72). Figure 91 shows that the importance of the various retail marketing channels (excluding food service/catering) differs from country to country. In the past, countries with strong involvement by general retailers showed steady organic market growth (e.g., Austria, Denmark, Sweden, Switzerland, and the United Kingdom). France and Italy are good examples of countries with strong market growth, where specialised retailers play a significant role, even though their importance is decreasing, as shown in Figure 92.
In Germany, supermarkets have become the driving force in the market, whereas specialised retailers face more and more competition. While in 2014, 33 percent of all organic products were sold in organic food shops, this number decreased to 26.6 percent in 2019. Supermarket chains have founded partnerships with organic associations and sell products with their brands. Best examples are the Bioland-Lidl, the Naturland-Rewe, or the Demeter-Kaufland partnerships. These partnerships open possibilities for farmers and processors to market domestic products.
Austria and Switzerland have once again developed very dynamically. In both countries, food retail chains have been heavily involved in organic market development from the very beginning - both countries have shares of approximately 80 percent. There is close cooperation between the retail chains and the respective organic associations, Bio Austria and Bio Suisse, and the supermarket chains have helped develop the trademarks. Coop and Migros in Switzerland have been promoting and developing projects for years, for example on biodiversity, seasonality and horn-bearing cows.
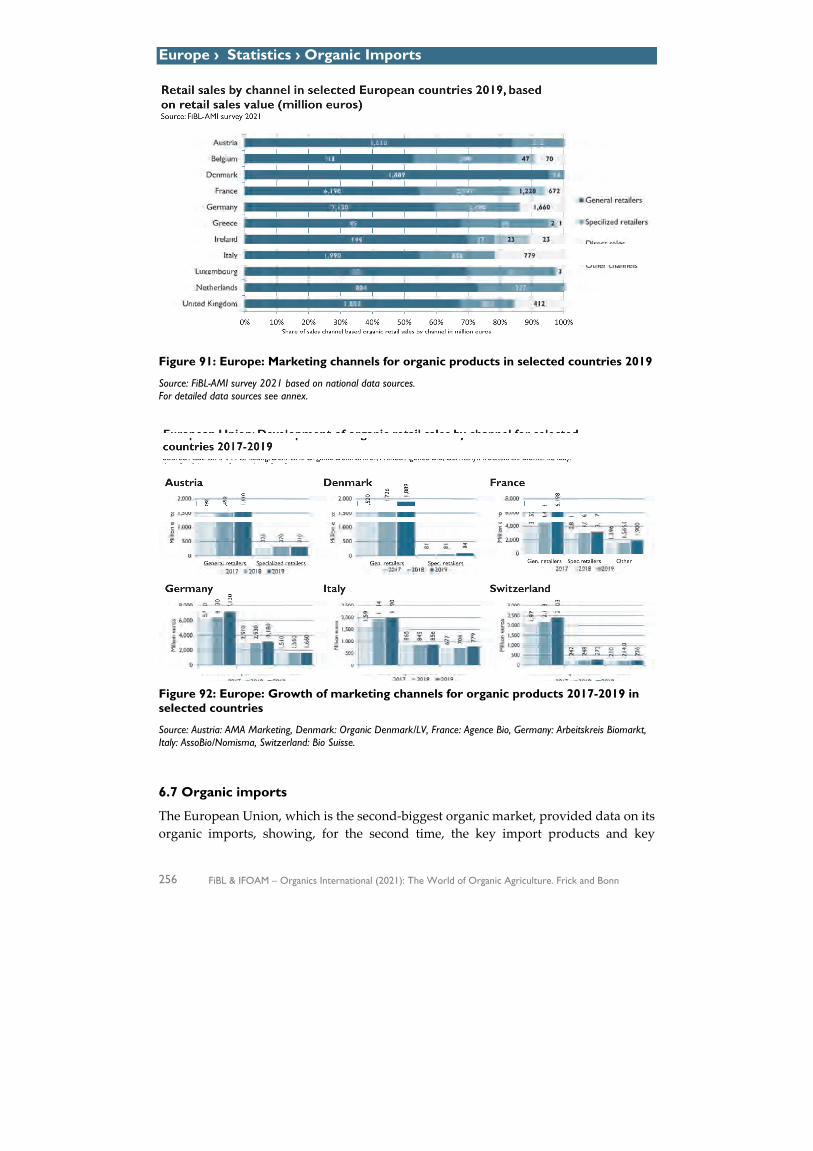
Europe › Statistics › Organic Imports
256 FiBL & IFOAM – Organics International (2021): The World of Organic Agriculture. Frick and Bonn
Figure 91: Europe: Marketing channels for organic products in selected countries 2019
Source: FiBL-AMI survey 2021 based on national data sources. For detailed data sources see annex.
Figure 92: Europe: Growth of marketing channels for organic products 2017-2019 in selected countries
Source: Austria: AMA Marketing, Denmark: Organic Denmark/LV, France: Agence Bio, Germany: Arbeitskreis Biomarkt, Italy: AssoBio/Nomisma, Switzerland: Bio Suisse.
6.7 Organic imports
The European Union, which is the second-biggest organic market, provided data on its organic imports, showing, for the second time, the key import products and key
Europe › Statistics › COVID-19
FiBL & IFOAM – Organics International (2021): The World of Organic Agriculture. Frick and Bonn 257
importing countries (based on volume in metric tons). In 2019, the EU imported a total of 3.2 million tonnes of organic agri-food products. Imports of tropical fruit (fresh or dried), nuts and spices represented the single biggest category, totalling 885’930 tonnes or 27.3 percent of total imports, followed by oilcakes, cereals other than wheat, as well as rice, and wheat. China is the biggest supplier of organic agri-food products to the EU, with 433’705 tonnes; that is 13.4 percent of the total organic import volume. For more information, see the contribution about EU organic imports on page 140.
6.8 Impact of COVID-19 on the organic market
The COVID-19 pandemic has had a tremendous impact on most people's purchasing behaviour and thus has given the organic market an unprecedented upturn in many countries. People stay at home to eat most of the time, and out-of-home meals are reduced to a minimum. On the other hand, in general, food sales in supermarkets have increased rapidly, for example in Germany, an increase of more than ten percent has been observed since the beginning of the pandemic. Organic food sales have accelerated even faster. When consumers have the choice, which they don’t have in canteens and restaurants, they reach more often for organic products, for example, the organic market in Germany in 2020 growth was double as strong as the general food market. Health, environment, and climate change have become big issues among the population – even more in the pandemic. Consuming organic food is a possibility to afford something good, at times, when travelling, restaurant and theatre visits are not possible. And supermarkets, as well as natural food stores and direct marketers, fulfil consumers desire for healthier, more regional, and organic products.
Many shops have become inventive in selling food, adapting to the consumers' preference to not leave the home, or not go too far for shopping. Online-sales such as subscription boxes for organic have grown tremendously and other forms of contactless shopping such as ‘Click and Collect’.
Will this development in the organic sector continue once the pandemic is over? Most experts see at least a similar sales level, as people’s awareness of organic and environmental and health issues will remain. Decreasing incomes in some population groups can reduce retail sales, but this was not observed until now.
On the agricultural side: with the growing market, organic production and processing need grow at the same level, like the market. Up to now, small and medium-sized enterprises have dominated the organic processing. They will need to grow, or new enterprises have to enter the market. Especially intensive crop production and animal production and the processing of these products are needed. The European Union’s Farm to Fork-strategy can support this development with several measures.
7 Conclusion
Available data on organic farming in the global and European market shows that, in an international context, the European organic sector is well developed. Relatively high shares of agricultural land, continual growth in the area and number of operators and
Europe › Statistics › Conclusion/References
258 FiBL & IFOAM – Organics International (2021): The World of Organic Agriculture. Frick and Bonn
a fast-growing market, show the exceptional dynamics that the European organic market and sector has.
In the past years, in many countries, the organic market was growing faster than production, and domestic supply can still not meet demand. Therefore, many organic organisations or market actors are calling for more farmers to convert to organic – and the effects of these efforts are now visible, with production growing at the same pace as the market. Now more processing, storing and distribution facilities are needed to process larger amounts of raw products.
While the COVID19 pandemic has shown that there is a potential for the organic market to expand faster, recent calculations by FiBL, based on past trends, indicate that data availability and quality remain an issue when it come to forecasting trends. International trade data remain scarce. Therefore, a major development is the new European import statistics, which show the products and the major exporting countries targeting the European Union for the second time (European Commission 2019 and 2020). The availability of these statistics is an important step towards making it possible to compare production data on organic agriculture worldwide with international trade data, which could give important hints on potential fraud cases.
Furthermore, while domestic market data availability is improving, it is collected with a wide range of methods and, strictly speaking, is not accurately comparable. Diverging methods and availability remain as challenges. For many countries, particularly in Central and Eastern Europe, retail sales data are not collected on a continual basis. Thus, little is known about the importance of organic product sales. Therefore, we recommend that data availability and accessibility increase, that classifications, nomenclature, and definitions, particularly for organic market data, are harmonised, and data quality is improved.
8 Acknowledgements
The data compiled for this article builds on the collection activities of the OrganicDataNetwork project, which was funded by the European Union (EU) under its seventh framework programme for research, demonstration, and technological development, which ended in 2014.1 The authors would like to thank all of those who have provided data and information for this report, particularly the OrganicDataNetwork project partners.
Data collection was expanded in the framework of a project by IFOAM Organics Europe, which allowed us to further develop our interactive infographics and make progress on forecasting the development of the organic area and market.
1 The project “Data network for better European organic market information” (OrganicDataNetwork) has received funding from the European Union’s Seventh Framework Programme for Research, Technological Development and Demonstration under grant agreement no 289376.
Europe › Statistics › Table
FiBL & IFOAM – Organics International (2021): The World of Organic Agriculture. Frick and Bonn 259
References and further reading European Commission (2020): EU imports of organic agri-food products. Key developments in 2019. EU
Agricultural Market Briefs, No 17, June 2020. https://ec.europa.eu/info/sites/info/files/food-farming-fisheries/farming/documents/market-brief-organic-imports-june2020_en.pdf
Eurostat (2020): Data tables organic agriculture. The Eurostat website eurostat.ec.europa.eu Eurostat, Luxembourg. Available at http://ec.europa.eu/eurostat/data/database
Meredith, S. and Willer, H. (Eds.) (2016): Organic in Europe 2016. IFOAM EU, Brussels Willer, H. and Schaack, D. (2014) Final report on the compilation of key organic market data. Research
Institute of Organic Agriculture (FiBL), Frick, Switzerland.
Note on data collection and countries covered Like in the rest of the world, data collection in Europe is carried out using multiple information sources. However, we would like to point out that Eurostat, the European Union's statistical office, is constantly expanding its data collection effort in the field of organic agriculture, and most of the data on organic areas, livestock, and operators was taken from Eurostat. This article focusses on organic farming and market statistics in Europe and includes: › the 28 Member States of the European Union, which consist of the EU-13 countries that became members
of the European Union in or after May 2004, and the EU-15 countries, who were member countries of the European Union before the accession of ten candidate countries on May 1, 2004. The United Kingdom is still counted as an EU member for 2019 data.
› The EU Candidate and Potential Candidate countries (CPC): Albania, Bosnia-Herzegovina, Kosovo, North Macedonia; Montenegro, Serbia, Turkey),
› the members of the European Free Trade Association (EFTA): Iceland, Norway, Liechtenstein, Switzerland,
› Other European countries: Andorra, Belarus, Moldova, Russian Federation, San Marino and Ukraine.
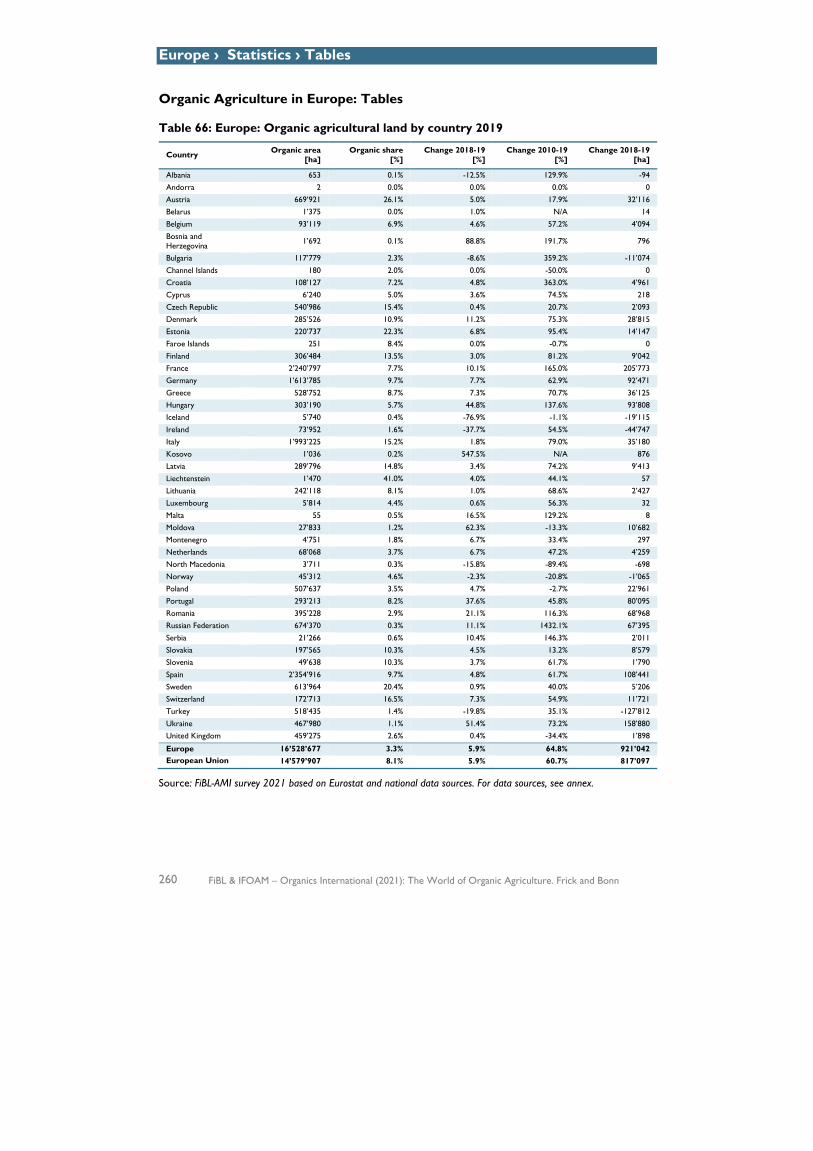
Europe › Statistics › Tables
260 FiBL & IFOAM – Organics International (2021): The World of Organic Agriculture. Frick and Bonn
Organic Agriculture in Europe: Tables Table 66: Europe: Organic agricultural land by country 2019
Country Organic area [ha]
Organic share [%]
Change 2018-19 [%]
Change 2010-19 [%]
Change 2018-19 [ha]
Albania 653 0.1% -12.5% 129.9% -94 Andorra 2 0.0% 0.0% 0.0% 0 Austria 669’921 26.1% 5.0% 17.9% 32’116 Belarus 1’375 0.0% 1.0% N/A 14 Belgium 93’119 6.9% 4.6% 57.2% 4’094 Bosnia and Herzegovina 1’692 0.1% 88.8% 191.7% 796
Bulgaria 117’779 2.3% -8.6% 359.2% -11’074 Channel Islands 180 2.0% 0.0% -50.0% 0 Croatia 108’127 7.2% 4.8% 363.0% 4’961 Cyprus 6’240 5.0% 3.6% 74.5% 218 Czech Republic 540’986 15.4% 0.4% 20.7% 2’093 Denmark 285’526 10.9% 11.2% 75.3% 28’815 Estonia 220’737 22.3% 6.8% 95.4% 14’147 Faroe Islands 251 8.4% 0.0% -0.7% 0 Finland 306’484 13.5% 3.0% 81.2% 9’042 France 2’240’797 7.7% 10.1% 165.0% 205’773 Germany 1’613’785 9.7% 7.7% 62.9% 92’471 Greece 528’752 8.7% 7.3% 70.7% 36’125 Hungary 303’190 5.7% 44.8% 137.6% 93’808 Iceland 5’740 0.4% -76.9% -1.1% -19’115 Ireland 73’952 1.6% -37.7% 54.5% -44’747 Italy 1’993’225 15.2% 1.8% 79.0% 35’180 Kosovo 1’036 0.2% 547.5% N/A 876 Latvia 289’796 14.8% 3.4% 74.2% 9’413 Liechtenstein 1’470 41.0% 4.0% 44.1% 57 Lithuania 242’118 8.1% 1.0% 68.6% 2’427 Luxembourg 5’814 4.4% 0.6% 56.3% 32 Malta 55 0.5% 16.5% 129.2% 8 Moldova 27’833 1.2% 62.3% -13.3% 10’682 Montenegro 4’751 1.8% 6.7% 33.4% 297 Netherlands 68’068 3.7% 6.7% 47.2% 4’259 North Macedonia 3’711 0.3% -15.8% -89.4% -698 Norway 45’312 4.6% -2.3% -20.8% -1’065 Poland 507’637 3.5% 4.7% -2.7% 22’961 Portugal 293’213 8.2% 37.6% 45.8% 80’095 Romania 395’228 2.9% 21.1% 116.3% 68’968 Russian Federation 674’370 0.3% 11.1% 1432.1% 67’395 Serbia 21’266 0.6% 10.4% 146.3% 2’011 Slovakia 197’565 10.3% 4.5% 13.2% 8’579 Slovenia 49’638 10.3% 3.7% 61.7% 1’790 Spain 2’354’916 9.7% 4.8% 61.7% 108’441 Sweden 613’964 20.4% 0.9% 40.0% 5’206 Switzerland 172’713 16.5% 7.3% 54.9% 11’721 Turkey 518’435 1.4% -19.8% 35.1% -127’812 Ukraine 467’980 1.1% 51.4% 73.2% 158’880 United Kingdom 459’275 2.6% 0.4% -34.4% 1’898
Europe 16’528’677 3.3% 5.9% 64.8% 921’042 European Union 14’579’907 8.1% 5.9% 60.7% 817’097
Source: FiBL-AMI survey 2021 based on Eurostat and national data sources. For data sources, see annex.
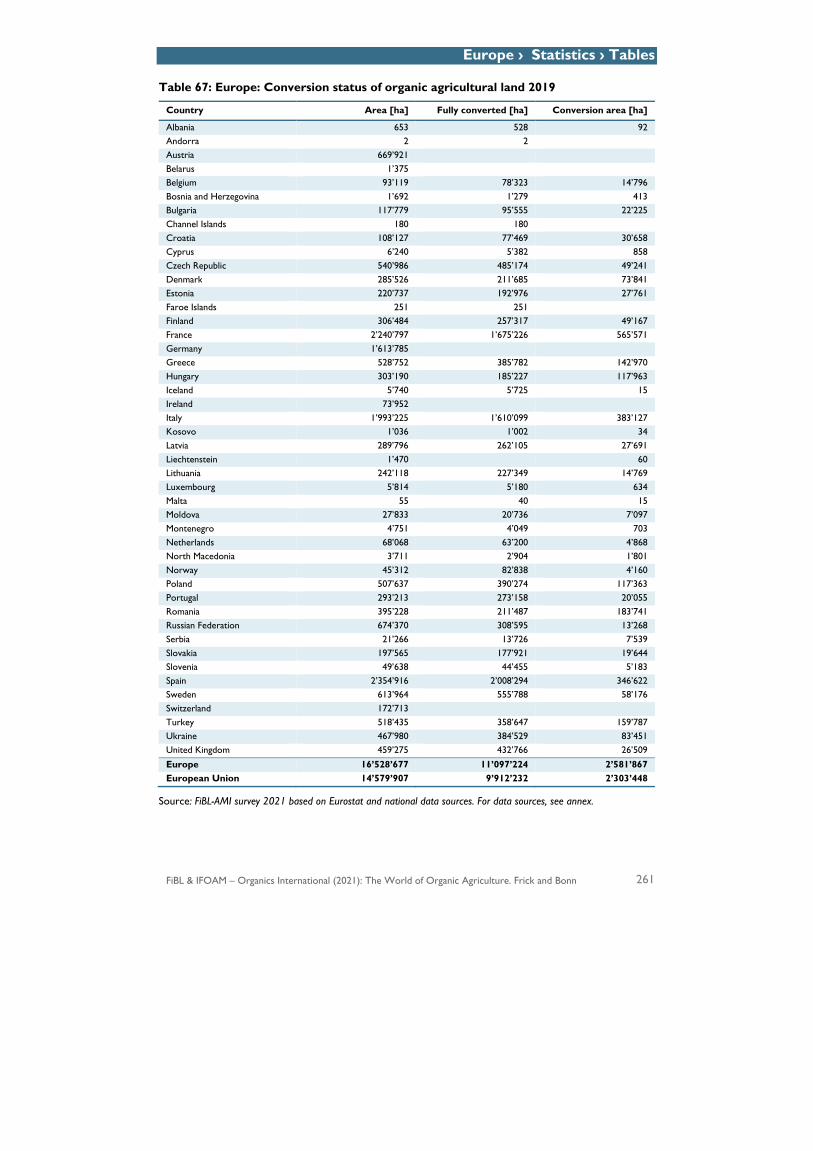
Europe › Statistics › Tables
FiBL & IFOAM – Organics International (2021): The World of Organic Agriculture. Frick and Bonn 261
Table 67: Europe: Conversion status of organic agricultural land 2019
Country Area [ha] Fully converted [ha] Conversion area [ha]
Albania 653 528 92 Andorra 2 2 Austria 669’921 Belarus 1’375 Belgium 93’119 78’323 14’796 Bosnia and Herzegovina 1’692 1’279 413 Bulgaria 117’779 95’555 22’225 Channel Islands 180 180 Croatia 108’127 77’469 30’658 Cyprus 6’240 5’382 858 Czech Republic 540’986 485’174 49’241 Denmark 285’526 211’685 73’841 Estonia 220’737 192’976 27’761 Faroe Islands 251 251 Finland 306’484 257’317 49’167 France 2’240’797 1’675’226 565’571 Germany 1’613’785 Greece 528’752 385’782 142’970 Hungary 303’190 185’227 117’963 Iceland 5’740 5’725 15 Ireland 73’952 Italy 1’993’225 1’610’099 383’127 Kosovo 1’036 1’002 34 Latvia 289’796 262’105 27’691 Liechtenstein 1’470 60 Lithuania 242’118 227’349 14’769 Luxembourg 5’814 5’180 634 Malta 55 40 15 Moldova 27’833 20’736 7’097 Montenegro 4’751 4’049 703 Netherlands 68’068 63’200 4’868 North Macedonia 3’711 2’904 1’801 Norway 45’312 82’838 4’160 Poland 507’637 390’274 117’363 Portugal 293’213 273’158 20’055 Romania 395’228 211’487 183’741 Russian Federation 674’370 308’595 13’268 Serbia 21’266 13’726 7’539 Slovakia 197’565 177’921 19’644 Slovenia 49’638 44’455 5’183 Spain 2’354’916 2’008’294 346’622 Sweden 613’964 555’788 58’176 Switzerland 172’713 Turkey 518’435 358’647 159’787 Ukraine 467’980 384’529 83’451 United Kingdom 459’275 432’766 26’509
Europe 16’528’677 11’097’224 2’581’867 European Union 14’579’907 9’912’232 2’303’448
Source: FiBL-AMI survey 2021 based on Eurostat and national data sources. For data sources, see annex.
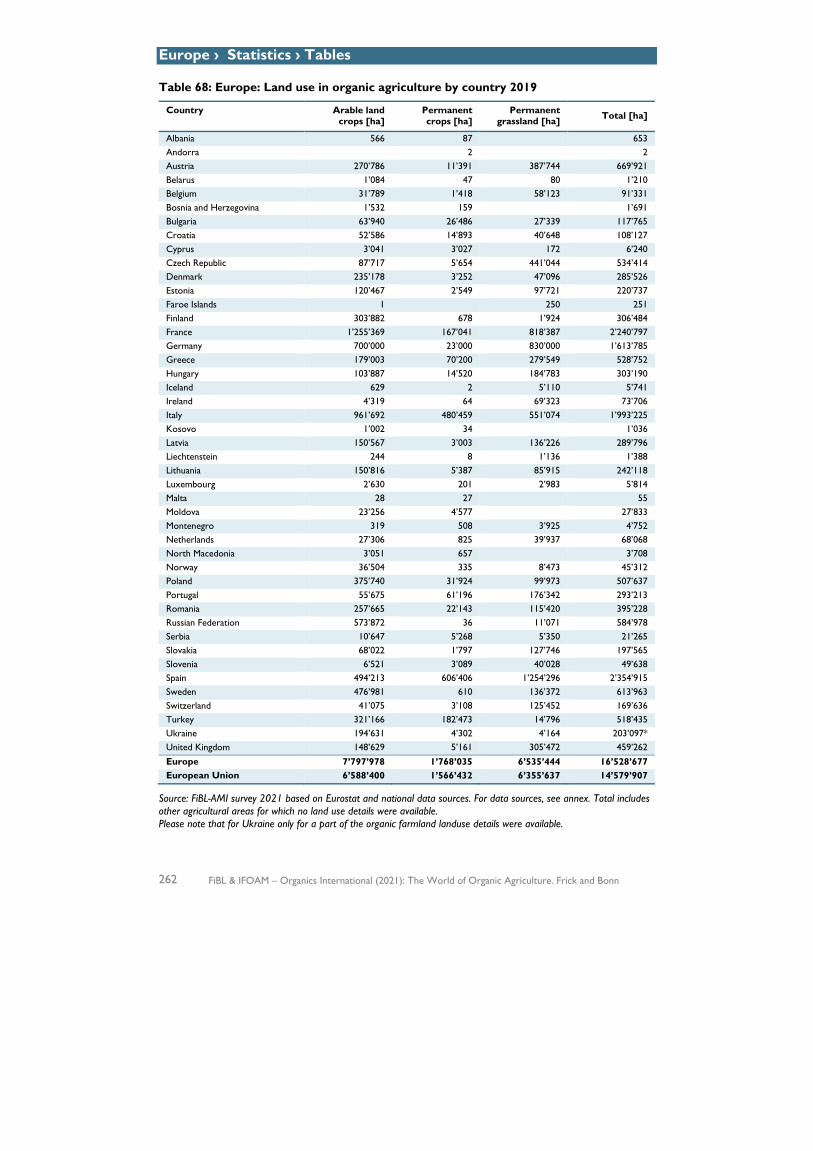
Europe › Statistics › Tables
262 FiBL & IFOAM – Organics International (2021): The World of Organic Agriculture. Frick and Bonn
Table 68: Europe: Land use in organic agriculture by country 2019
Country Arable land crops [ha]
Permanent crops [ha]
Permanent grassland [ha] Total [ha]
Albania 566 87 653 Andorra 2 2 Austria 270’786 11’391 387’744 669’921 Belarus 1’084 47 80 1’210 Belgium 31’789 1’418 58’123 91’331 Bosnia and Herzegovina 1’532 159 1’691 Bulgaria 63’940 26’486 27’339 117’765 Croatia 52’586 14’893 40’648 108’127 Cyprus 3’041 3’027 172 6’240 Czech Republic 87’717 5’654 441’044 534’414 Denmark 235’178 3’252 47’096 285’526 Estonia 120’467 2’549 97’721 220’737 Faroe Islands 1 250 251 Finland 303’882 678 1’924 306’484 France 1’255’369 167’041 818’387 2’240’797 Germany 700’000 23’000 830’000 1’613’785 Greece 179’003 70’200 279’549 528’752 Hungary 103’887 14’520 184’783 303’190 Iceland 629 2 5’110 5’741 Ireland 4’319 64 69’323 73’706 Italy 961’692 480’459 551’074 1’993’225 Kosovo 1’002 34 1’036 Latvia 150’567 3’003 136’226 289’796 Liechtenstein 244 8 1’136 1’388 Lithuania 150’816 5’387 85’915 242’118 Luxembourg 2’630 201 2’983 5’814 Malta 28 27 55 Moldova 23’256 4’577 27’833 Montenegro 319 508 3’925 4’752 Netherlands 27’306 825 39’937 68’068 North Macedonia 3’051 657 3’708 Norway 36’504 335 8’473 45’312 Poland 375’740 31’924 99’973 507’637 Portugal 55’675 61’196 176’342 293’213 Romania 257’665 22’143 115’420 395’228 Russian Federation 573’872 36 11’071 584’978 Serbia 10’647 5’268 5’350 21’265 Slovakia 68’022 1’797 127’746 197’565 Slovenia 6’521 3’089 40’028 49’638 Spain 494’213 606’406 1’254’296 2’354’915 Sweden 476’981 610 136’372 613’963 Switzerland 41’075 3’108 125’452 169’636 Turkey 321’166 182’473 14’796 518’435 Ukraine 194’631 4’302 4’164 203’097* United Kingdom 148’629 5’161 305’472 459’262 Europe 7’797’978 1’768’035 6’535’444 16’528’677 European Union 6’588’400 1’566’432 6’355’637 14’579’907
Source: FiBL-AMI survey 2021 based on Eurostat and national data sources. For data sources, see annex. Total includes other agricultural areas for which no land use details were available. Please note that for Ukraine only for a part of the organic farmland landuse details were available.

Europe › Statistics › Tables
FiBL & IFOAM – Organics International (2021): The World of Organic Agriculture. Frick and Bonn 263
Table 69: Europe: Organic agricultural land and wild collection areas by country 2019
Country Agricultural land [ha] Wild collection [ha] Total [ha]
Albania 653 645’042 645’695 Andorra 2 2 Austria 669’921 669’921 Belarus 1’360 946’897 948’259 Belgium 93’119 3 93’121 Bosnia and Herzegovina 1’692 11’579 13’271 Bulgaria 117’779 307’020 424’799 Channel Islands 180 180 Croatia 108’127 108’127 Cyprus 6’240 6’240 Czech Republic 540’986 540’986 Denmark 285’526 2’648 288’174 Estonia 220’737 104’305 325’042 Faroe Islands 251 0 251 Finland 306’484 4’600’000 4’906’484 France 2’240’797 2’240’797 Germany 1’613’785 1’613’785 Greece 528’752 317’053 845’805 Hungary 303’190 303’190 Iceland 5’741 5’741 Ireland 73’952 73’952 Italy 1’993’225 1’993’225 Kosovo 1’036 179’580 180’616 Latvia 289’796 289’796 Liechtenstein 1’470 1’470 Lithuania 242’118 242’118 Luxembourg 5’814 5’814 Malta 55 55 Moldova 27’833 1’845 29’678 Montenegro 4’752 143’410 148’161 Netherlands 68’068 68’068 North Macedonia 3’708 556’600 560’308 Norway 45’312 45’312 Poland 507’637 507’637 Portugal 293’213 40’000 352’746 Romania 395’228 1’787’548 2’182’776 Russian Federation 673’689 158’052 833’676 Serbia 21’265 21’265 Slovakia 197’565 197’565 Slovenia 49’638 13’238 62’876 Spain 2’354’916 38’184 2’393’100 Sweden 613’964 613’964 Switzerland 172’573 172’573 Turkey 518’435 180’336 698’771 Ukraine 467’980 580’000 1’047’798 United Kingdom 459’275 459’275
Europe 16’528’677 10’613’341 27’162’468 European Union 14’579’907 7’209’999 21’789’906
Source: FiBL-AMI survey 2021 based on Eurostat and national data sources. For data sources, see annex.

Europe › Statistics › Tables
264 FiBL & IFOAM – Organics International (2021): The World of Organic Agriculture. Frick and Bonn
Table 70: Europe: Organic livestock by country 2019
Country Bovine animals Pigs Poultry Sheep
No Share (%) No Share
(%) No Share (%) No Share
(%) Austria 420’693 21.3% 74’603 2.5% 2’840’750 16.8% 123’541 34.2% Belarus 0.0% 0.0% 0.0% 0.0% Belgium 107’690 4.3% 17’081 0.3% 4’592’154 12.7% 27’349 22.9% Bulgaria 9’402 1.7% 91 0.0% 2’260 0.0% 22’780 1.6% Croatia 21’558 4.8% 2’873 0.2% 1’523 0.0% 65’632 9.7% Cyprus 731 1.3% 0.0% 21’233 0.7% 971 0.3% Czech Republic 262’910 19.4% 2’707 0.2% 54’174 0.3% 87’863 39.8% Denmark 224’348 14.0% 490’924 4.0% 3’349’215 22.8% 11’435 7.4% Estonia 42’290 17.2% 683 0.2% 36’315 1.7% 32’504 42.3% Finland 76’173 8.4% 5’156 0.4% 335’538 5.3% 32’883 25.3% France 830’921 4.4% 437’950 3.2% 22’713’723 10.6% 737’091 9.9% Germany 894’460 18.3% 183’850 0.9% 10’209’000 7.8% 159’000 12.2% Greece 142’609 20.8% 8’782 0.8% 252’280 0.8% 1’299’677 13.6% Hungary 54’014 7.7% 10’972 0.4% 131’367 0.3% 11’801 1.1% Iceland 284 0.4% 0.0% 0.0% 1’241 0.3% Ireland 61’819 0.9% 642 0.0% 161’816 1.0% 83’302 1.6% Italy 375’414 6.0% 59’623 0.6% 3’482’435 2.1% 680’369 8.6% Latvia 99’041 26.0% 1’925 0.5% 45’296 1.0% 37’759 47.2%
Liechtenstein 1’618 25.7% 70 4.0% 3’414 1’230 32.4%
Lithuania 58’356 7.8% 131 0.0% 10’108 0.1% 23’076 38.2% Luxembourg 4’814 2.6% 1’026 1.1% 33’982 30.1% 837 10.2% Montenegro 578 0.7% 0.0% 160 0.0% 1’787 0.9% Netherlands 71’817 1.9% 106’458 0.9% 3’926’491 4.1% 15’129 1.5% North Macedonia 6’390 2.5% 0.0% 0.0% 101’317 13.8% Norway 7’932 0.9% 2’820 0.3% 611’427 13.1% 0.0% Poland 30’186 0.5% 4’189 0.0% 484’153 0.4% 22’757 8.5% Portugal 95’306 6.4% 6’757 0.3% 64’630 0.1% 94’117 4.5% Romania 19’358 1.0% 9 0.0% 128’596 0.1% 19’367 0.2% Russia 1’874 0.0% 0.0% 0.0% 1’332 0.0% Serbia 3’594 0.4% 284 0.0% 6’735 0.0% 5’138 0.3% Slovakia 61’432 13.3% 642 0.1% 5’863 0.1% 93’875 23.8% Slovenia 37’126 8.0% 3’252 0.9% 96’641 4.3% 35’225 29.4% Spain 215’802 3.7% 32’343 0.1% 1’826’581 1.3% 594’875 3.6% Sweden 333’245 22.2% 36’649 2.7% 1’395’620 16.6% 119’166 19.5% Switzerland 205’389 13.5% 38’955 2.9% 1’184’263 9.9% 86’679 25.2% Ukraine N/A N/A N/A N/A N/A N/A N/A N/A United Kingdom 300’788 3.0% 55’255 1.2% 3’465’009 2.2% 782’253 2.4%
Europe 5’079’962 4.0% 1’586’702 0.9% 62’317’071 2.5% 5’413’520 3.5%
European Union 4’852’303 6.0% 1’544’573 1.1% 59’666’753 4.2% 5’214’634 5.3%
Source: FiBL survey 2021 based on Eurostat and national data sources. For data sources, see annex. Note: In the case of pigs and poultry, in the official statistics, no clear distinction is made between the number of animals slaughtered and the places or average numbers of stock over the years, and it is not always clear which of these is given when “livestock numbers” are quoted. Therefore, adding up the data for pigs and poultry over all countries is not completely reliable, and country data are not necessarily comparable. Therefore, the data presented here should be treated with caution and only approximate the overall picture.
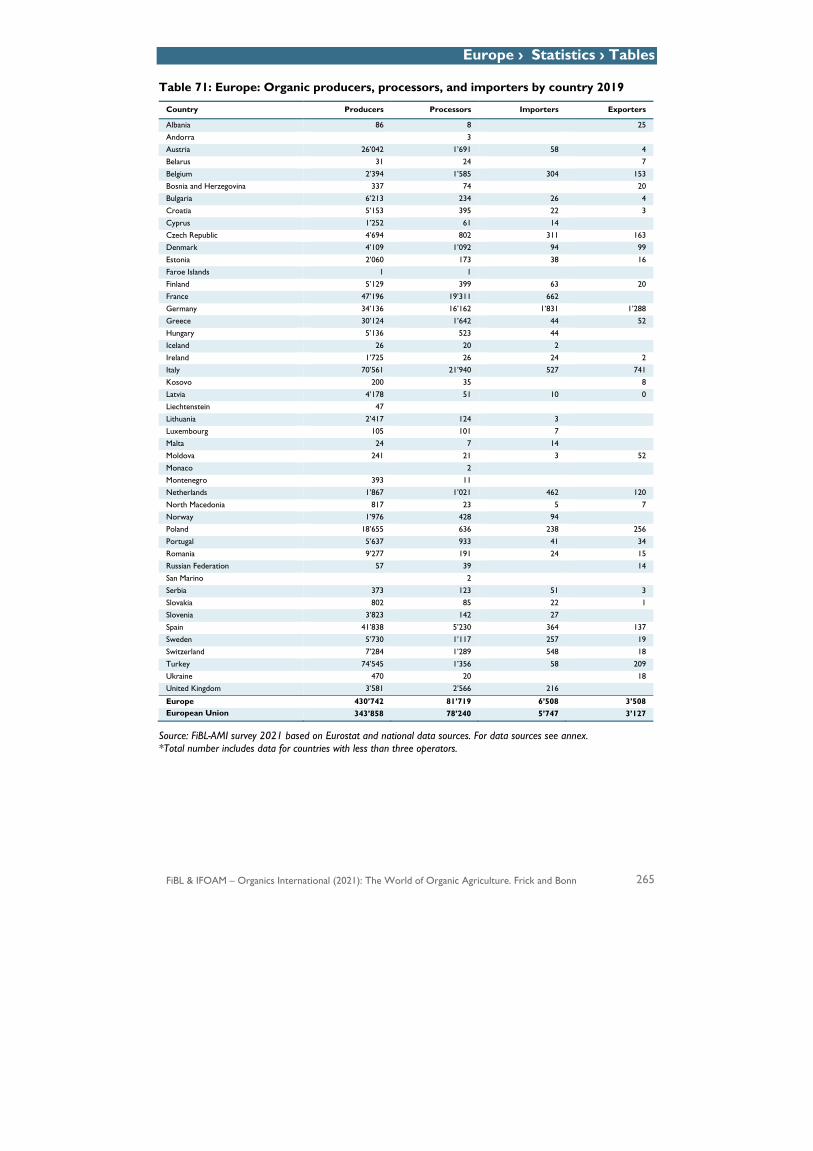
Europe › Statistics › Tables
FiBL & IFOAM – Organics International (2021): The World of Organic Agriculture. Frick and Bonn 265
Table 71: Europe: Organic producers, processors, and importers by country 2019
Country Producers Processors Importers Exporters
Albania 86 8 25 Andorra 3 Austria 26’042 1’691 58 4 Belarus 31 24 7 Belgium 2’394 1’585 304 153 Bosnia and Herzegovina 337 74 20 Bulgaria 6’213 234 26 4 Croatia 5’153 395 22 3 Cyprus 1’252 61 14 Czech Republic 4’694 802 311 163 Denmark 4’109 1’092 94 99 Estonia 2’060 173 38 16 Faroe Islands 1 1 Finland 5’129 399 63 20 France 47’196 19’311 662 Germany 34’136 16’162 1’831 1’288 Greece 30’124 1’642 44 52 Hungary 5’136 523 44 Iceland 26 20 2 Ireland 1’725 26 24 2 Italy 70’561 21’940 527 741 Kosovo 200 35 8 Latvia 4’178 51 10 0 Liechtenstein 47 Lithuania 2’417 124 3 Luxembourg 105 101 7 Malta 24 7 14 Moldova 241 21 3 52 Monaco 2 Montenegro 393 11 Netherlands 1’867 1’021 462 120 North Macedonia 817 23 5 7 Norway 1’976 428 94 Poland 18’655 636 238 256 Portugal 5’637 933 41 34 Romania 9’277 191 24 15 Russian Federation 57 39 14 San Marino 2 Serbia 373 123 51 3 Slovakia 802 85 22 1 Slovenia 3’823 142 27 Spain 41’838 5’230 364 137 Sweden 5’730 1’117 257 19 Switzerland 7’284 1’289 548 18 Turkey 74’545 1’356 58 209 Ukraine 470 20 18 United Kingdom 3’581 2’566 216
Europe 430’742 81’719 6’508 3’508 European Union 343’858 78’240 5’747 3’127
Source: FiBL-AMI survey 2021 based on Eurostat and national data sources. For data sources see annex. *Total number includes data for countries with less than three operators.
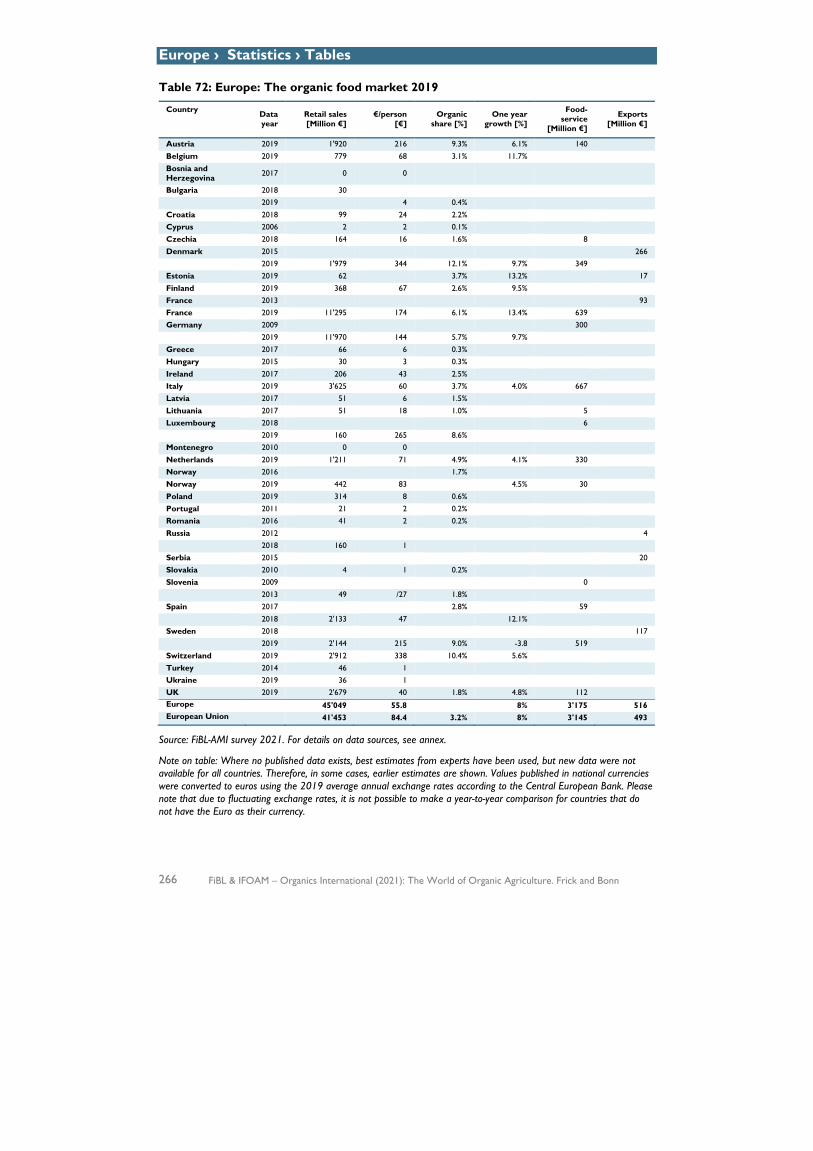
Europe › Statistics › Tables
266 FiBL & IFOAM – Organics International (2021): The World of Organic Agriculture. Frick and Bonn
Table 72: Europe: The organic food market 2019
Country Data year
Retail sales [Million €]
€/person [€]
Organic share [%]
One year growth [%]
Food-service
[Million €]
Exports [Million €]
Austria 2019 1'920 216 9.3% 6.1% 140 Belgium 2019 779 68 3.1% 11.7% Bosnia and Herzegovina 2017 0 0
Bulgaria 2018 30 2019 4 0.4% Croatia 2018 99 24 2.2% Cyprus 2006 2 2 0.1% Czechia 2018 164 16 1.6% 8 Denmark 2015 266 2019 1'979 344 12.1% 9.7% 349 Estonia 2019 62 3.7% 13.2% 17 Finland 2019 368 67 2.6% 9.5% France 2013 93 France 2019 11'295 174 6.1% 13.4% 639 Germany 2009 300 2019 11'970 144 5.7% 9.7% Greece 2017 66 6 0.3% Hungary 2015 30 3 0.3% Ireland 2017 206 43 2.5% Italy 2019 3'625 60 3.7% 4.0% 667 Latvia 2017 51 6 1.5% Lithuania 2017 51 18 1.0% 5 Luxembourg 2018 6 2019 160 265 8.6% Montenegro 2010 0 0 Netherlands 2019 1'211 71 4.9% 4.1% 330 Norway 2016 1.7% Norway 2019 442 83 4.5% 30 Poland 2019 314 8 0.6% Portugal 2011 21 2 0.2% Romania 2016 41 2 0.2% Russia 2012 4 2018 160 1 Serbia 2015 20 Slovakia 2010 4 1 0.2% Slovenia 2009 0 2013 49 /27 1.8% Spain 2017 2.8% 59 2018 2'133 47 12.1% Sweden 2018 117 2019 2'144 215 9.0% -3.8 519 Switzerland 2019 2'912 338 10.4% 5.6% Turkey 2014 46 1 Ukraine 2019 36 1 UK 2019 2'679 40 1.8% 4.8% 112 Europe 45'049 55.8 8% 3'175 516 European Union 41'453 84.4 3.2% 8% 3'145 493
Source: FiBL-AMI survey 2021. For details on data sources, see annex.
Note on table: Where no published data exists, best estimates from experts have been used, but new data were not available for all countries. Therefore, in some cases, earlier estimates are shown. Values published in national currencies were converted to euros using the 2019 average annual exchange rates according to the Central European Bank. Please note that due to fluctuating exchange rates, it is not possible to make a year-to-year comparison for countries that do not have the Euro as their currency.
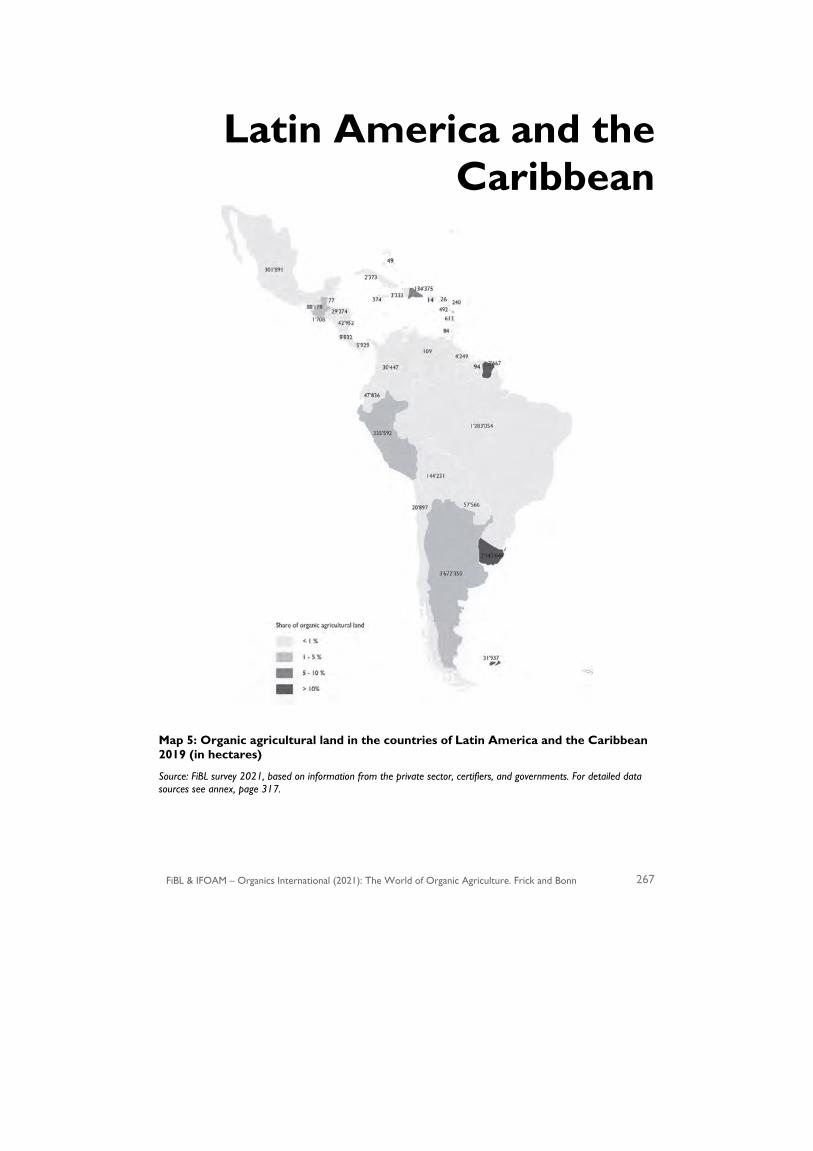
FiBL & IFOAM – Organics International (2021): The World of Organic Agriculture. Frick and Bonn 267
Latin America and the Caribbean
Map 5: Organic agricultural land in the countries of Latin America and the Caribbean 2019 (in hectares)
Source: FiBL survey 2021, based on information from the private sector, certifiers, and governments. For detailed data sources see annex, page 317.

Latin America and the Caribbean › Overview
268 FiBL & IFOAM – Organics International (2021): The World of Organic Agriculture. Frick and Bonn
Latin America: An Insight into the Latest Developments in Organic Agriculture
PATRICIA FLORES 1
Latin America is a vast region with more than 20 countries covering over 20 million km2, populated by 650 million inhabitants. It is characterised by a high biological and cultural diversity, being the centre of origin of important species for the world's food supply. The diverse bio-cultural assets of the region, from ecosystems, languages, to climates and soils, have generated the various agricultural production systems present across the region, making it an important resource for resilient food systems.
In 2019, Latin America had more than 220’000 organic producers and an organic agricultural area of more than eight million hectares (Re stats chapter), approximately 11 percent of the world's organic area. Argentina, Uruguay and Brazil represent approximately 85 percent of the organic area in the region with 7.1 million hectares; a large part of this area is pasture for organic livestock.
In the last 20 years, the organic agriculture sector has developed especially organised export-oriented family farmers focused on international trade to supply markets in the European Union (EU), United States, Canada and Japan. In the last decade, organic production of coffee, cocoa, tropical fruits (banana, mango), ginger, turmeric and Andean grains stand out, adding value to the raw products. This is especially noteworthy in the industry of fine aroma cacao and chocolate – here the cacao value chain has been developed based on native genetic resources and the organisation of cacao growers giving special attention to the quality of the final product. To the same accord, organic and biodynamic products in the region have seen substantial growth, driven by the demand for these fine products like the Chilean and Argentinian wines, chocolates from Ecuador and bananas from the Dominican Republic, Ecuador and Peru.
The ten largest export countries of organic products to the EU represented 70 percent of EU imports in 2019 (based on import quantity/volume in metric tons). This group of countries includes five Latin American countries: Dominican Republic, Ecuador, Peru, Colombia and Brazil, representing 31 percent of the total imports to the EU, with a positive trend compared with 2018 (European Commission 2020, see page 140).
A focus on Brazil
Brazil is a country with a dynamic organic sector that is very different from the rest of the countries, characterised by a robust domestic organic market, highly developed organic value chains and supportive, conscious consumers.
In June 2019, the Brazilian organic agriculture competent authority COAGRE reported during Biofach Latin America 2019 nearly 69'000 organic producers (including non- 1 Patricia Flores, IFOAM Latin America Office Coordinator, Lima, Peru
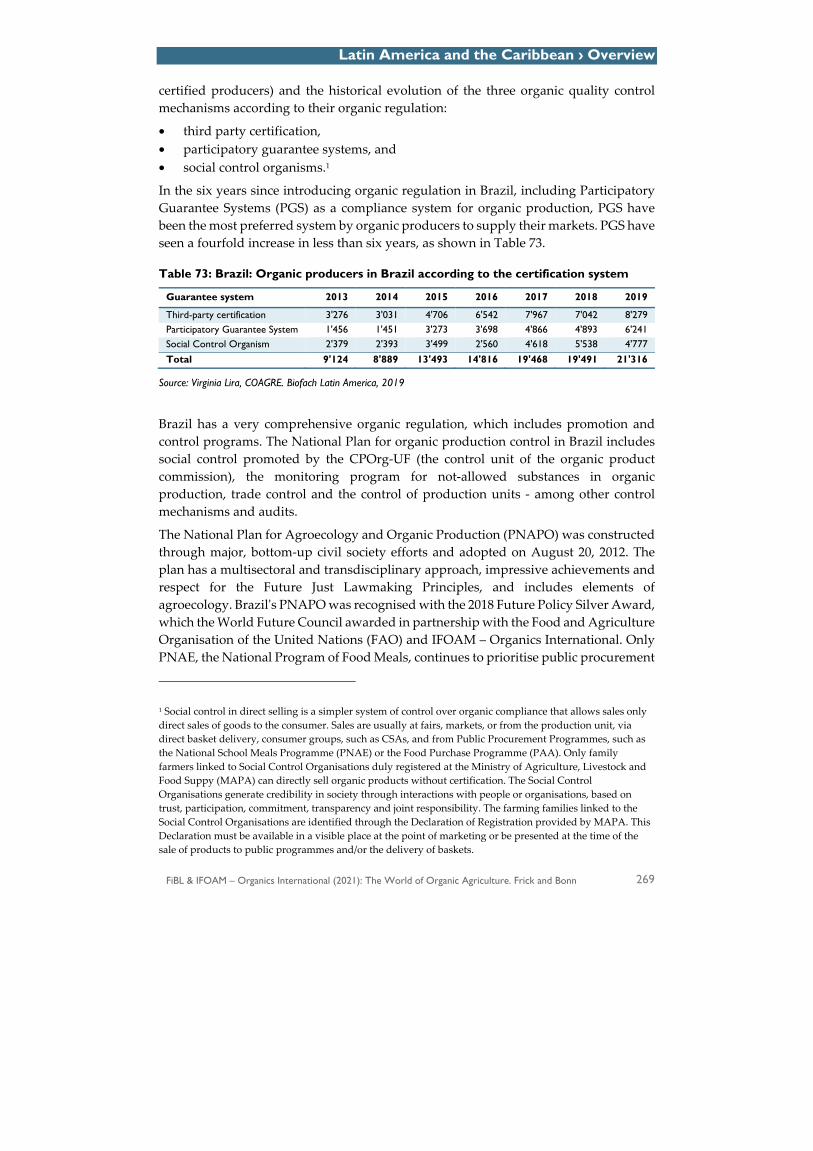
Latin America and the Caribbean › Overview
FiBL & IFOAM – Organics International (2021): The World of Organic Agriculture. Frick and Bonn 269
certified producers) and the historical evolution of the three organic quality control mechanisms according to their organic regulation:
• third party certification, • participatory guarantee systems, and • social control organisms.1
In the six years since introducing organic regulation in Brazil, including Participatory Guarantee Systems (PGS) as a compliance system for organic production, PGS have been the most preferred system by organic producers to supply their markets. PGS have seen a fourfold increase in less than six years, as shown in Table 73.
Table 73: Brazil: Organic producers in Brazil according to the certification system
Guarantee system 2013 2014 2015 2016 2017 2018 2019
Third-party certification 3'276 3'031 4'706 6'542 7'967 7'042 8'279 Participatory Guarantee System 1'456 1'451 3'273 3'698 4'866 4'893 6'241 Social Control Organism 2'379 2'393 3'499 2'560 4'618 5'538 4'777 Total 9'124 8'889 13'493 14'816 19'468 19'491 21'316
Source: Virginia Lira, COAGRE. Biofach Latin America, 2019
Brazil has a very comprehensive organic regulation, which includes promotion and control programs. The National Plan for organic production control in Brazil includes social control promoted by the CPOrg-UF (the control unit of the organic product commission), the monitoring program for not-allowed substances in organic production, trade control and the control of production units - among other control mechanisms and audits.
The National Plan for Agroecology and Organic Production (PNAPO) was constructed through major, bottom-up civil society efforts and adopted on August 20, 2012. The plan has a multisectoral and transdisciplinary approach, impressive achievements and respect for the Future Just Lawmaking Principles, and includes elements of agroecology. Brazil's PNAPO was recognised with the 2018 Future Policy Silver Award, which the World Future Council awarded in partnership with the Food and Agriculture Organisation of the United Nations (FAO) and IFOAM – Organics International. Only PNAE, the National Program of Food Meals, continues to prioritise public procurement
1 Social control in direct selling is a simpler system of control over organic compliance that allows sales only direct sales of goods to the consumer. Sales are usually at fairs, markets, or from the production unit, via direct basket delivery, consumer groups, such as CSAs, and from Public Procurement Programmes, such as the National School Meals Programme (PNAE) or the Food Purchase Programme (PAA). Only family farmers linked to Social Control Organisations duly registered at the Ministry of Agriculture, Livestock and Food Suppy (MAPA) can directly sell organic products without certification. The Social Control Organisations generate credibility in society through interactions with people or organisations, based on trust, participation, commitment, transparency and joint responsibility. The farming families linked to the Social Control Organisations are identified through the Declaration of Registration provided by MAPA. This Declaration must be available in a visible place at the point of marketing or be presented at the time of the sale of products to public programmes and/or the delivery of baskets.
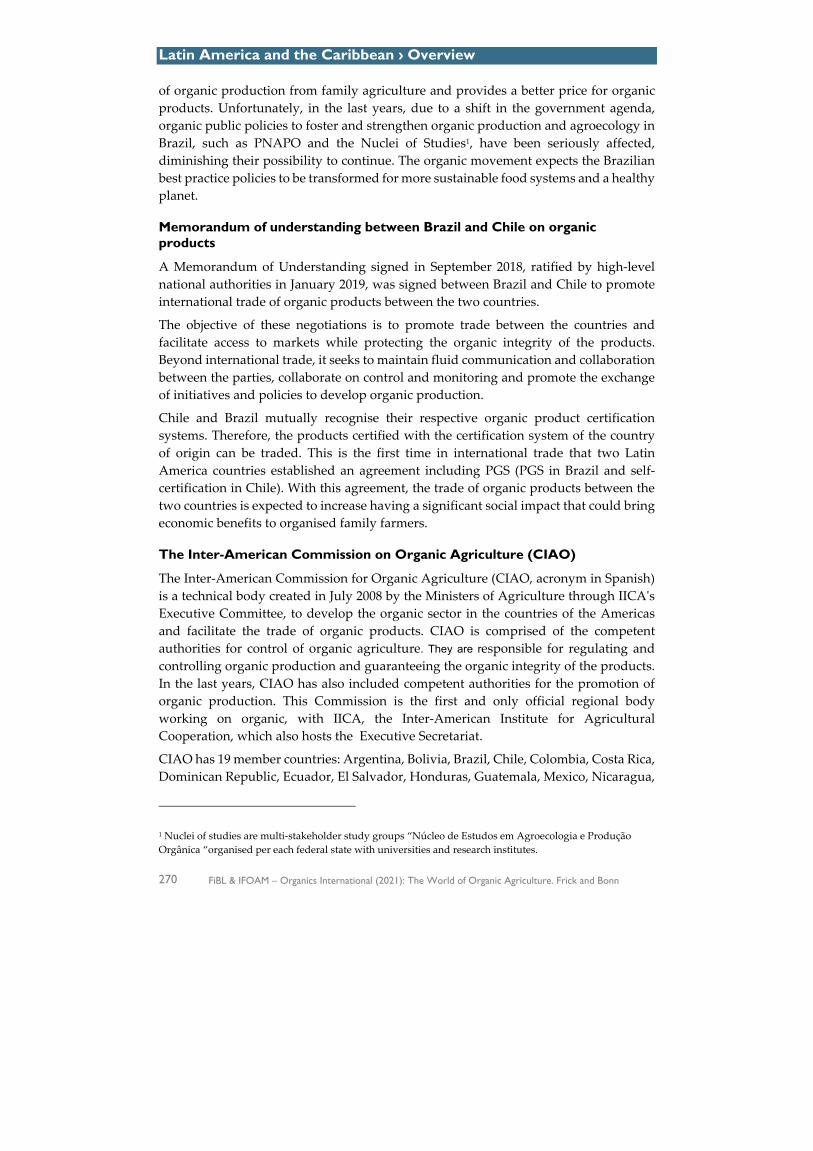
Latin America and the Caribbean › Overview
270 FiBL & IFOAM – Organics International (2021): The World of Organic Agriculture. Frick and Bonn
of organic production from family agriculture and provides a better price for organic products. Unfortunately, in the last years, due to a shift in the government agenda, organic public policies to foster and strengthen organic production and agroecology in Brazil, such as PNAPO and the Nuclei of Studies1, have been seriously affected, diminishing their possibility to continue. The organic movement expects the Brazilian best practice policies to be transformed for more sustainable food systems and a healthy planet.
Memorandum of understanding between Brazil and Chile on organic products
A Memorandum of Understanding signed in September 2018, ratified by high-level national authorities in January 2019, was signed between Brazil and Chile to promote international trade of organic products between the two countries.
The objective of these negotiations is to promote trade between the countries and facilitate access to markets while protecting the organic integrity of the products. Beyond international trade, it seeks to maintain fluid communication and collaboration between the parties, collaborate on control and monitoring and promote the exchange of initiatives and policies to develop organic production.
Chile and Brazil mutually recognise their respective organic product certification systems. Therefore, the products certified with the certification system of the country of origin can be traded. This is the first time in international trade that two Latin America countries established an agreement including PGS (PGS in Brazil and self-certification in Chile). With this agreement, the trade of organic products between the two countries is expected to increase having a significant social impact that could bring economic benefits to organised family farmers.
The Inter-American Commission on Organic Agriculture (CIAO)
The Inter-American Commission for Organic Agriculture (CIAO, acronym in Spanish) is a technical body created in July 2008 by the Ministers of Agriculture through IICA's Executive Committee, to develop the organic sector in the countries of the Americas and facilitate the trade of organic products. CIAO is comprised of the competent authorities for control of organic agriculture. They are responsible for regulating and controlling organic production and guaranteeing the organic integrity of the products. In the last years, CIAO has also included competent authorities for the promotion of organic production. This Commission is the first and only official regional body working on organic, with IICA, the Inter-American Institute for Agricultural Cooperation, which also hosts the Executive Secretariat.
CIAO has 19 member countries: Argentina, Bolivia, Brazil, Chile, Colombia, Costa Rica, Dominican Republic, Ecuador, El Salvador, Honduras, Guatemala, Mexico, Nicaragua,
1 Nuclei of studies are multi-stakeholder study groups “Núcleo de Estudos em Agroecologia e Produção Orgânica “organised per each federal state with universities and research institutes.

Latin America and the Caribbean › Overview
FiBL & IFOAM – Organics International (2021): The World of Organic Agriculture. Frick and Bonn 271
Panama, Paraguay, Peru, United States, Uruguay and Venezuela. Spain and Portugal participate in the Commission as permanent observers. Currently, the Board of Directors has representatives from Ecuador (chair), Mexico, Bolivia, Brazil and IICA.
On May 12, 2020, the Inter-American Commission on Organic Agriculture (CIAO) and IFOAM - Organics International signed a Memorandum of Understanding to strengthen the collaboration among the parties, especially addressing: a) promotion of organic agriculture, b) improve knowledge and dissemination of organic agriculture, c) encourage activities to foster sustainable development, environmental conservation and organic consumption.
Mexico: News on the national organic regulation
To boost the production of certified organic foods, diversify their supply and encourage more medium and small producers to join the value chain, the Mexican Ministry of Agriculture and Rural Development updated the Guidelines for Organic Operations. This was the result of a very demanding process involving diverse Mexican organic stakeholders, with representatives from farmers' organisations, operators and industry.
The modified regulation published in the Official Journal of the Federation (DOF) on June 8, 2020, establishes standards that were lacking in production systems such as melipona honey, which comes from stingless bees, and aquaculture production. The competent Mexican authority SENASICA is also developing equivalence agreements with its main trade partners, the United States of America, Canada and the EU. The equivalence will allow the free flow of Mexican organic products that hold the National Organic Seal to the world's most competitive markets. Likewise, with the new guidelines, Mexico joins Argentina and Ecuador, as the first three countries of the Inter-American Commission on Organic Agriculture (CIAO), to have regulations for organic aquaculture.
Outlook
The pandemic has put into perspective what is important for human life and health at all levels. Organic farmers in the region have incorporated the Principles of Organic Agriculture: Health, Ecology, Care, and Fairness in their daily practice and systems' innovations. This crisis leads us to reflect on how we interact with the environment and natural resources, how we can address problems, and where organic agriculture could provide options to transform the crisis into something better, with benefits for human health. These include slowing down the destruction of habitats that cause the spread of diseases, reducing vulnerability in future food supply and trade disruptions, reconnecting people to food production and transforming our food systems.
References European Commission (2020): EU imports of organic agri-food products – Key developments in 2019. No 17.
June 2020. Willer, H. et al. (Eds.) (2020) The World of Organic Agriculture – Statistics and Emerging Trends 2020.
Research Institute of Organic Agriculture FiBL, Frick, and IFOAM - Organics International, Bonn
Latin America and the Caribbean › CIAO
272 FiBL & IFOAM – Organics International (2021): The World of Organic Agriculture. Frick and Bonn
The Inter-American Commission for Organic Agriculture (CIAO)
GRACIELA LACAZE1 & JUAN MANUEL GÁMEZ2
The Inter-American Commission for Organic Agriculture CIAO3 is a technical entity created in July 2008 by the Ministers of Agriculture of the Americas via the Executive Committee of the Inter-American Institute for Cooperation on Agriculture (IICA), with the aim of contributing to the development of organic agriculture and organic trade in countries in the Americas.
CIAO comprises the Competent Authorities for Control of Organic Agriculture in the member countries. The authorities are the entities responsible for regulating and controlling activities in the field of organic agriculture and guaranteeing the organic status of products. Their responsibilities include registering and auditing producers, processors, traders, input suppliers, inspectors, and organic certification agencies as well as keeping statistical records for the activities and proposing modifications to organic production standards. The Competent Authorities for the Development of Organic Production are also part of CIAO; they focus on the development and promotion of the organic sector in the member countries.
Currently consisting of 19 member countries4, CIAO is the first official regional entity to conduct work on organics. It was established by the Inter-American Board of Agriculture, IICA’s highest-level governing body. The IICA serves as the Executive Secretariat of CIAO.
The Ministries of Agriculture of the Americas established the following objectives of the CIAO:
! To contribute to the development of organic agriculture in the countries of the Americas and trade in its products as well as serve as a technical body for knowledge management and the sharing and dissemination of appropriate information in a timely manner;
! To contribute to the strengthening of the institutional structures of the Competent Authorities in Organic Agriculture in the countries of the Americas;
1 Graciela Lacaze, Inter-American Commission for Organic Agriculture CIAO, CIAO Executive Secretariat, Buenos Aires, Argentina, www.ciaorganico.net and www.iica.int 2 Juan Manuel Gámez, Inter-American Commission for Organic Agriculture CIAO, CIAO Executive Secretariat, Buenos Aires, Argentina, www.ciaorganico.net and www.iica.int 3 CIAO is the acronym of the Inter-American Commission for Organic Agriculture .in Spanish. 4 Argentina, Bolivia, Brazil, Chile, Colombia, Costa Rica, Ecuador, El Salvador, United State, Honduras, Guatemala, Mexico, Nicaragua, Panama, Paraguay, Peru, the Dominican Republic, Uruguay, the United States and Venezuela. Spain and Portugal participate in the Commission as permanent Observer Members. The countries that comprise the Board of Directors of CIAO are Ecuador (president), Mexico, Bolivia, Brazil and the Inter-American Institute for Cooperation on Agriculture (IICA).
Latin America and the Caribbean › CIAO
FiBL & IFOAM – Organics International (2021): The World of Organic Agriculture. Frick and Bonn 273
! To coordinate and promote the development and harmonization of standards and procedures with the aim to stimulate and regulate the production and control of and trade in organic foods in the countries of the Americas;
! To serve as a mechanism for consultation, liaison and reciprocal cooperation with the competent governmental bodies that promote and establish standards for the development and control of organic agriculture in each country of the Americas;
! Within the framework of other functions that contribute to the development of organic agriculture, to sponsor, insofar as possible, the development of organic agriculture and its institutional framework.
CIAO’s work focuses on four strategic areas, through which it provides technical cooperation to contribute to the comprehensive development of organic production:
Facilitation of trade in organic products and the development of organic markets, including harmonizing standards among countries; creating standards for organic production matters that are not yet standardized; assisting countries in processes to enable their standards and control systems to be recognized and validated by their commercial partners and assisting countries in defining strategies to develop socially-inclusive organic markets that include producers and consumers.
Establishment and strengthening of National Control Systems (NCS) for Organic Production, which includes developing methodological instruments to strengthen the NCS, including: creating proposals to strengthen the NCS in the countries and monitoring their implementation and supporting the establishment of institutional frameworks for organic production in countries where they do not exist.
Promotion of organic agriculture, which includes developing methodological instruments to promote organic production; creating proposals for policies and agendas that promote organic production; and supporting the establishment of institutional frameworks needed to promote organic production in the countries of the Americas.
Knowledge management, covering stakeholder access to information of interest, to support and improve decision-making processes and disseminating relevant information among stakeholders involved in organic production.
Since 2019, CIAO and the Research Institute of Organic Agriculture FiBL have been working together on the collection of statistical data on organic production. Both CIAO and FiBL carry out regular data collection on area, land use and operators on organic agriculture, operating in different but complementary contexts. CIAO recognizes that there are many benefits to open and transparent collaboration, which has made it possible to improve data collection, increase information flows and arrive at higher quality results on organic production in the Americas and the world.
Latin America and Caribbean › Statistics
274 FiBL & IFOAM – Organics International (2021): The World of Organic Agriculture. Frick and Bonn
Latin America and the Caribbean: Current statistics
CLAUDIA MEIER,1 BERNHARD SCHLATTER,2 OLIVIA KELLER3 AND JAN TRÁVNÍČEK4
Overview
In 2019, nearly 8.3 million hectares were reported as being under organic production in Latin America and the Caribbean (a total of 44 countries). This corresponded to 1.2 percent of the total agricultural land in that region (Table 74). Hence, of the organic agricultural land worldwide, 11 percent were recorded in Latin America and the Caribbean. Compared to 2018, the organic agricultural area in that region grew by nearly 284’000 hectares. Since 2000 the area more than doubled (an increase of almost 4.4 million hectares) (Figure 95). Since 2001, the countries with the largest organic agricultural area are Argentina, Uruguay, and Brazil. From 2018 to 2019 the organic agricultural area in Argentina grew by 1 percent, reaching nearly 3.7 million hectares, in Uruguay, it decreased by 0.2 percent but remained at over 2.1 million hectares, and in Brazil it increased by 8 percent, reaching nearly 1.3 million hectares (Figure 93). The countries with the highest organic share in 2019 were Uruguay with 15.3 percent (highest share since 2014), French Guiana with 11.3 percent, and the Dominican Republic with 5.5 percent (Figure 94).
Land use
In 2019, land use details were available for 84 percent of the organic agricultural land in Latin America and the Caribbean. Only 5 percent of all organic farmland was utilized for arable crops (almost 441’000 hectares); while 71 percent was used for permanent grassland/grazing areas (nearly 5.9 million hectares). Permanent crops were grown on more than 643’000 hectares (8 percent of the organic area in the region), and for 16 percent of the reported area, no details were available (over 1.3 million hectares) (Figure 96, Table 76). The countries with the largest organic permanent grassland/grazing areas were Argentina (nearly 3.4 million hectares) and Uruguay (over 2.1 million hectares). The largest area of organic arable crops was in Bolivia (nearly 135’000 hectares), followed by Peru (over 96’000 hectares), and Mexico (over 72’000 hectares). The largest area of organic permanent crops was in Peru (over 138’000 hectares), followed by the Dominican Republic (over 115’000 hectares), and Mexico (nearly 107’000 hectares). Since 2010, cereals are the key organic arable crops in Latin America and the Caribbean with nearly 164’000 hectares in 2019 (37 percent of organic arable land). Sugarcane is among the three most important organic arable crops since 2005 (except for 2012), reaching over 77’000 hectares in 2019 (18 percent of organic arable land). Organic
1 Claudia Meier, Research Institute of Organic Agriculture FiBL, Frick, Switzerland, www.fibl.org 2 Bernhard Schlatter, Research Institute of Organic Agriculture FiBL, Frick, Switzerland, www.fibl.org 3 Olivia Keller, Research Institute of Organic Agriculture FiBL, Frick, Switzerland, www.fibl.org 4 Jan Trávníček, Research Institute of Organic Agriculture FiBL, Frick, Switzerland, www.fibl.org
Latin America and Caribbean › Statistics
FiBL & IFOAM – Organics International (2021): The World of Organic Agriculture. Frick and Bonn 275
oilseeds have been gaining importance, reaching nearly 61’000 hectares in 2019 (14 percent of organic arable land) (Figure 96, Table 76). In 2019, organic cereals represented 0.3 percent of the total cereal area in the region and 3 percent of the world’s organic cereal area. The key organic cereal in the region was quinoa (over 117’000 hectares) representing 66 percent of all the quinoa grown in the region and close to 100 percent of the world’s organic quinoa area. The key country producing quinoa was Bolivia with over 106’000 hectares. Organic sugarcane represented 0.6 percent of the total sugarcane area in the region and 87 percent of the world’s organic sugarcane area. Key producing countries were Paraguay (over 32’000 hectares) and Argentina (almost 20’000 hectares). Organic oilseeds represented 0.1 percent of the total oilseeds area in the region and 4 percent of the world’s organic oilseeds area. The key organic oilseed in the region was sesame (over 16’000 hectares) representing 6 percent of all the sesame grown in the region and 11 percent of the world’s organic sesame area. The key country producing organic sesame was Bolivia with nearly 4’000 hectares. As in previous years, coffee, cocoa, and tropical fruit were the three most important organic permanent crops in the region in 2019. Organic coffee reached over 268’000 hectares (42 percent of organic permanent crop area), organic cocoa over 146’000 hectares (23 percent of organic permanent crop area), and organic tropical fruit nearly 76’000 hectares (12 percent of organic permanent crop area) (Figure 96, Table 76). Organic coffee represented 5 percent of the total coffee area in the region and 38 percent of the world’s organic coffee area. The countries with the largest organic coffee areas were Peru (nearly 103’000 hectares), Mexico (nearly 73’000 hectares), and Nicaragua (over 31’000 hectares). Organic cocoa represented 8 percent of the total cocoa area in the region and 40 percent of the world’s organic cocoa area. The countries with the largest organic cocoa areas were the Dominican Republic (almost 90’000 hectares) and Peru (over 25’000 hectares). Organic tropical fruit represented 2 percent of the total tropical fruit area in the region and 35 percent of the world’s organic tropical fruit area. The key tropical fruit in Latin America and the Caribbean are bananas (nearly 57’000 hectares in 2019). In 2019, organic bananas represented 3 percent of the total bananas area in the region and 90 percent of the world’s organic bananas area. The countries with the largest bananas area are the Dominican Republic (over 25’000 hectares) and Ecuador (nearly 17’000 hectares); these two countries represent 74 percent of the regional organic banana area.
Producers
Over 224’000 organic producers were recorded in Latin America and the Caribbean in 2019. The countries with the most organic producers were Peru (nearly 81’000), Mexico (nearly 37’000), and Brazil (over 22’000) (Table 74). However, it is important to note that the number of producers largely depends on the type of operators reported by the country. Some countries only report the number of farm enterprises/companies, whereas others also report the number of smallholders.
Latin America and Caribbean › Statistics
276 FiBL & IFOAM – Organics International (2021): The World of Organic Agriculture. Frick and Bonn
Wild collection
In Latin America and the Caribbean, organic wild collection plays an important role. In 2019, there were nearly 4.6 million hectares of organic wild collection areas. They are mainly used for the collection of wild nuts (over 3.2 million hectares), wild berries (over 161’000 hectares), and palmito (more than 60´000 hectares) (Table 77). The countries with the largest organic wild collection areas were Brazil (over 1.7 million hectares, mainly wild brazil nuts), Bolivia (almost 1.5 million hectares, mainly wild brazil nuts), Mexico (almost 953’000 hectares, no details available), and Peru (almost 159’000 hectares, of wild collection areas, mainly brazil nuts). Information on wild collection is not available for many countries, so it can be assumed that the total organic wild collection area is higher than that presented here. For more information about the Latin American and the Caribbean figures, see data tables for the region, page 279.
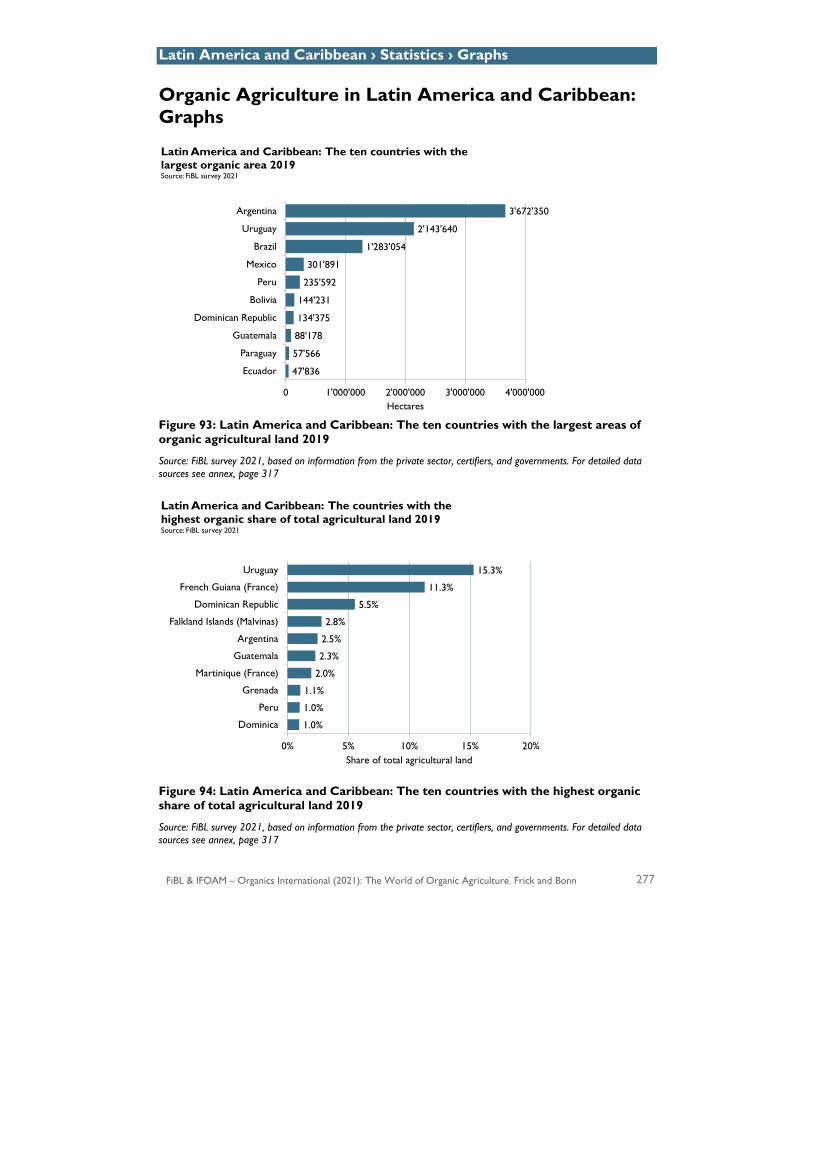
Latin America and Caribbean › Statistics › Graphs
FiBL & IFOAM – Organics International (2021): The World of Organic Agriculture. Frick and Bonn 277
Organic Agriculture in Latin America and Caribbean: Graphs
Figure 93: Latin America and Caribbean: The ten countries with the largest areas of organic agricultural land 2019
Source: FiBL survey 2021, based on information from the private sector, certifiers, and governments. For detailed data sources see annex, page 317
Figure 94: Latin America and Caribbean: The ten countries with the highest organic share of total agricultural land 2019
Source: FiBL survey 2021, based on information from the private sector, certifiers, and governments. For detailed data sources see annex, page 317
47'836
57'566
88'178
134'375
144'231
235'592
301'891
1'283'054
2'143'640
3'672'350
0 1'000'000 2'000'000 3'000'000 4'000'000
Ecuador
Paraguay
Guatemala
Dominican Republic
Bolivia
Peru
Mexico
Brazil
Uruguay
Argentina
Hectares
Latin America and Caribbean: The ten countries with the largest organic area 2019Source: FiBL survey 2021
1.0%
1.0%
1.1%
2.0%
2.3%
2.5%
2.8%
5.5%
11.3%
15.3%
0% 5% 10% 15% 20%
Dominica
Peru
Grenada
Martinique (France)
Guatemala
Argentina
Falkland Islands (Malvinas)
Dominican Republic
French Guiana (France)
Uruguay
Share of total agricultural land
Latin America and Caribbean: The countries with the highest organic share of total agricultural land 2019Source: FiBL survey 2021
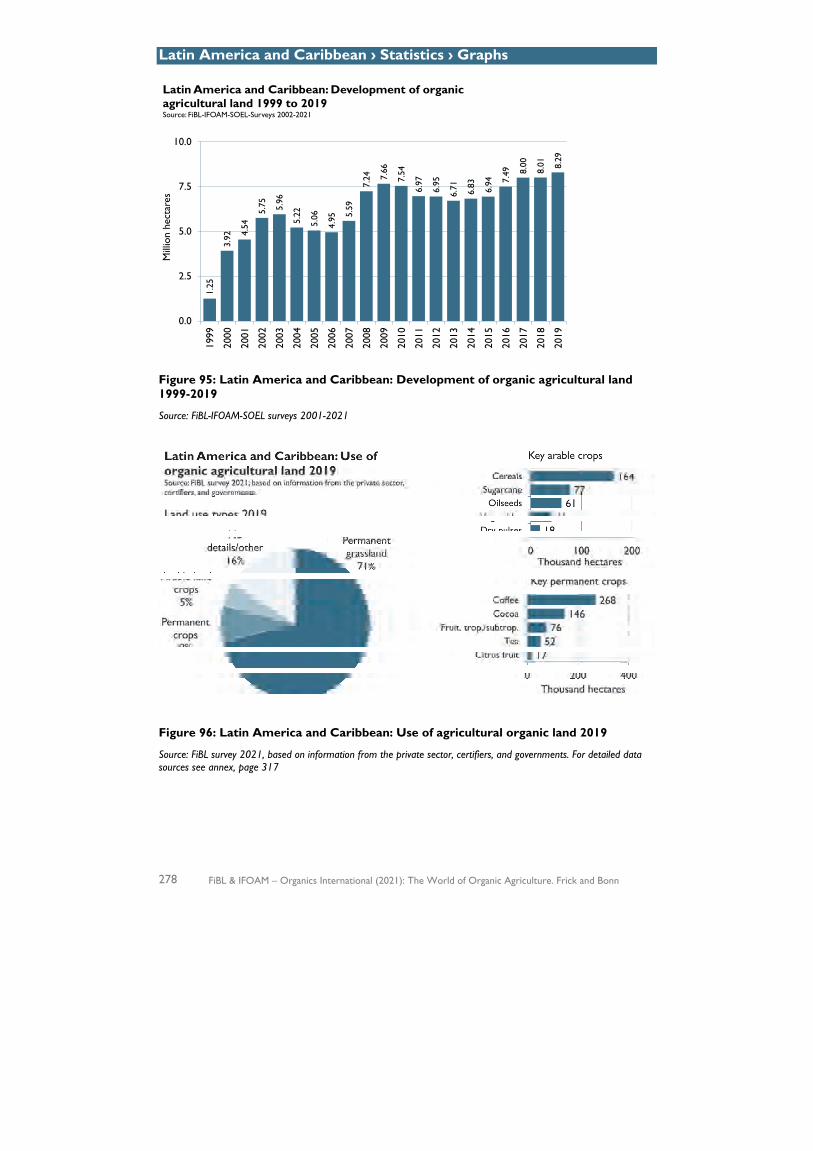
Latin America and Caribbean › Statistics › Graphs
278 FiBL & IFOAM – Organics International (2021): The World of Organic Agriculture. Frick and Bonn
Figure 95: Latin America and Caribbean: Development of organic agricultural land 1999-2019
Source: FiBL-IFOAM-SOEL surveys 2001-2021
Figure 96: Latin America and Caribbean: Use of agricultural organic land 2019
Source: FiBL survey 2021, based on information from the private sector, certifiers, and governments. For detailed data sources see annex, page 317
1.25
3.92 4.
54
5.75 5.96
5.22
5.06
4.95 5.
59
7.24 7.
66
7.54
6.97
6.95
6.71 6.83 6.94 7.
49 8.00
8.01 8.29
0.0
2.5
5.0
7.5
10.0
1999
2000
2001
2002
2003
2004
2005
2006
2007
2008
2009
2010
2011
2012
2013
2014
2015
2016
2017
2018
2019
Mill
ion
hect
ares
Latin America and Caribbean: Development of organic agricultural land 1999 to 2019Source: FiBL-IFOAM-SOEL-Surveys 2002-2021
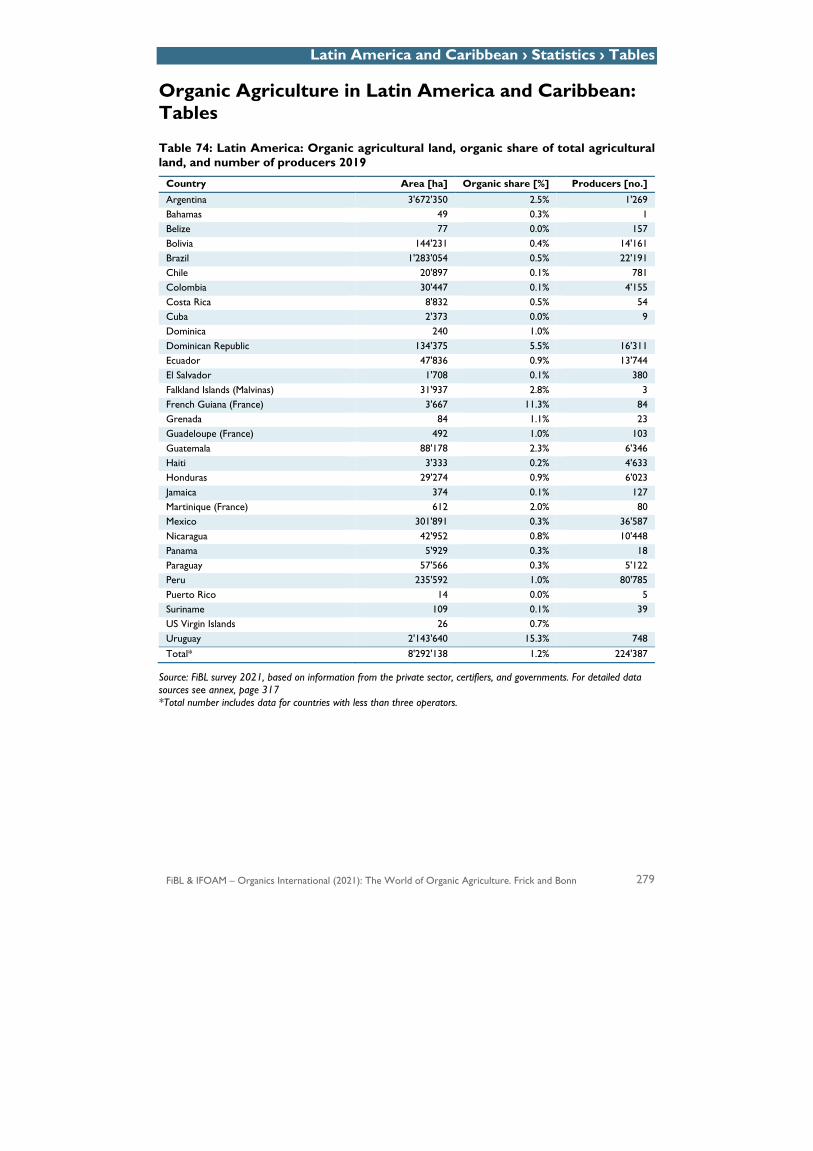
Latin America and Caribbean › Statistics › Tables
FiBL & IFOAM – Organics International (2021): The World of Organic Agriculture. Frick and Bonn 279
Organic Agriculture in Latin America and Caribbean: Tables
Table 74: Latin America: Organic agricultural land, organic share of total agricultural land, and number of producers 2019
Country Area [ha] Organic share [%] Producers [no.] Argentina 3'672'350 2.5% 1'269 Bahamas 49 0.3% 1 Belize 77 0.0% 157 Bolivia 144'231 0.4% 14'161 Brazil 1'283'054 0.5% 22'191 Chile 20'897 0.1% 781 Colombia 30'447 0.1% 4'155 Costa Rica 8'832 0.5% 54 Cuba 2'373 0.0% 9 Dominica 240 1.0%
Dominican Republic 134'375 5.5% 16'311 Ecuador 47'836 0.9% 13'744 El Salvador 1'708 0.1% 380 Falkland Islands (Malvinas) 31'937 2.8% 3 French Guiana (France) 3'667 11.3% 84 Grenada 84 1.1% 23 Guadeloupe (France) 492 1.0% 103 Guatemala 88'178 2.3% 6'346 Haiti 3'333 0.2% 4'633 Honduras 29'274 0.9% 6'023 Jamaica 374 0.1% 127 Martinique (France) 612 2.0% 80 Mexico 301'891 0.3% 36'587 Nicaragua 42'952 0.8% 10'448 Panama 5'929 0.3% 18 Paraguay 57'566 0.3% 5'122 Peru 235'592 1.0% 80'785 Puerto Rico 14 0.0% 5 Suriname 109 0.1% 39 US Virgin Islands 26 0.7%
Uruguay 2'143'640 15.3% 748 Total* 8'292'138 1.2% 224'387
Source: FiBL survey 2021, based on information from the private sector, certifiers, and governments. For detailed data sources see annex, page 317 *Total number includes data for countries with less than three operators.

Latin America and Caribbean › Statistics › Tables
280 FiBL & IFOAM – Organics International (2021): The World of Organic Agriculture. Frick and Bonn
Table 75: Latin America: All organic areas 2019
Country Agriculture [ha]
Aquaculture [ha]
Forest [ha]
Other non agri. land
[ha]
Wild collection
[ha]
Total [ha]
Argentina 3'672'350 20'900 3'693'250 Bahamas 49 49 Belize 77 77 Bolivia 144'231 1'455'835 1'600'066 Brazil 1'283'054 1'701'438 2'984'492 Chile 20'897 489 93'079 114'465 Colombia 30'447 23'090 7'320 60'858 Costa Rica 8'832 8'832 Cuba 2'373 2'373 Dominica 240 240 Dominican Republic 134'375 134'375 Ecuador 47'836 79 40'007 1'000 88'921 El Salvador 1'708 1'708 Falkland Islands (Malvinas) 31'937 31'937
French Guiana (France) 3'667 3'667
Grenada 84 84 Guadeloupe (France) 492 492
Guatemala 88'178 147'234 235'412 Guyana 55'449 55'449 Haiti 3'333 3'333 Honduras 29'274 29'274 Jamaica 374 36 410 Martinique (France) 612 612
Mexico 301'891 952'755 1'254'646 Nicaragua 42'952 93 43'045 Panama 5'929 5'929 Paraguay 57'565 57'565 Peru 235'592 2'750 158'560 396'902 Puerto Rico 14 14 Suriname 109 109 US Virgin Islands 26 26 Uruguay 2'143'640 2'143'640 Total 8'292'138 568 40'007 25'840 4'593'699 12'952'253
Source: FiBL survey 2021, based on information from the private sector, certifiers, and governments. For detailed data sources see annex, page 317
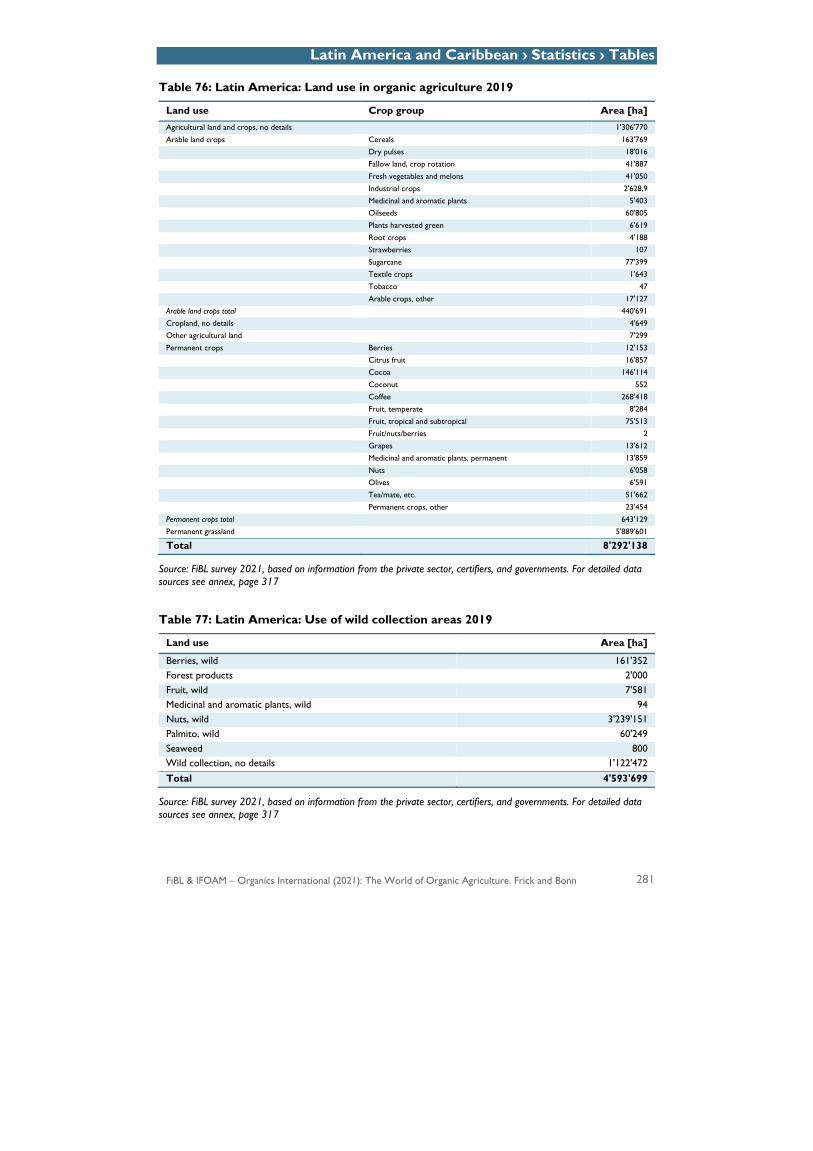
Latin America and Caribbean › Statistics › Tables
FiBL & IFOAM – Organics International (2021): The World of Organic Agriculture. Frick and Bonn 281
Table 76: Latin America: Land use in organic agriculture 2019
Land use Crop group Area [ha] Agricultural land and crops, no details 1'306'770 Arable land crops Cereals 163'769 Dry pulses 18'016 Fallow land, crop rotation 41'887 Fresh vegetables and melons 41'050 Industrial crops 2'628,9 Medicinal and aromatic plants 5'403 Oilseeds 60'805 Plants harvested green 6'619 Root crops 4'188 Strawberries 107 Sugarcane 77'399 Textile crops 1'643 Tobacco 47 Arable crops, other 17'127 Arable land crops total 440'691 Cropland, no details 4'649 Other agricultural land 7'299 Permanent crops Berries 12'153 Citrus fruit 16'857 Cocoa 146'114 Coconut 552 Coffee 268'418 Fruit, temperate 8'284 Fruit, tropical and subtropical 75'513 Fruit/nuts/berries 2 Grapes 13'612 Medicinal and aromatic plants, permanent 13'859 Nuts 6'058 Olives 6'591 Tea/mate, etc. 51'662 Permanent crops, other 23'454 Permanent crops total 643'129 Permanent grassland 5'889'601
Total 8'292'138
Source: FiBL survey 2021, based on information from the private sector, certifiers, and governments. For detailed data sources see annex, page 317
Table 77: Latin America: Use of wild collection areas 2019
Land use Area [ha]
Berries, wild 161'352 Forest products 2'000 Fruit, wild 7'581 Medicinal and aromatic plants, wild 94 Nuts, wild 3'239'151 Palmito, wild 60'249 Seaweed 800 Wild collection, no details 1'122'472 Total 4'593'699
Source: FiBL survey 2021, based on information from the private sector, certifiers, and governments. For detailed data sources see annex, page 317

282 FiBL & IFOAM – Organics International (2021): The World of Organic Agriculture. Frick and Bonn
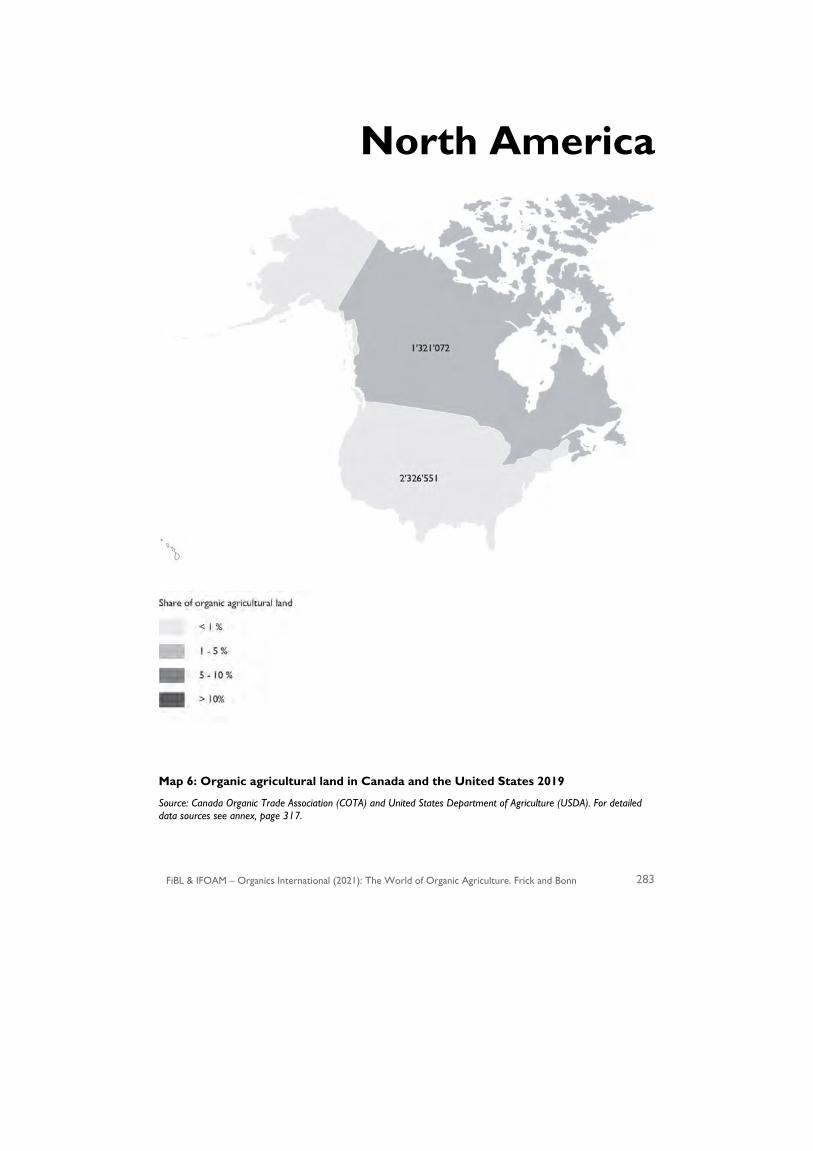
FiBL & IFOAM – Organics International (2021): The World of Organic Agriculture. Frick and Bonn 283
North America
Map 6: Organic agricultural land in Canada and the United States 2019
Source: Canada Organic Trade Association (COTA) and United States Department of Agriculture (USDA). For detailed data sources see annex, page 317.
North America › United States
284 FiBL & IFOAM – Organics International (2021): The World of Organic Agriculture. Frick and Bonn
US Organic Sales Break Through 55 Billion Dollar Mark
BARBARA FITCH HAUMANN1
The US organic sector posted another banner year in 2019, with sales reaching 55.1 billion US dollars,2 up five percent from 2018. According to the Organic Trade Association’s 2020 Organic Industry Survey, both organic food and non-food markets shattered major benchmarks.
Organic food sales hit 50.1 billion US dollars,3 up 4.6 percent. Organic non-food sales totalled just over 5 billion US dollars,4 up 9.2 percent. Both easily outpaced the general market growth rate of around 2 percent for total food sales and 3 percent for total non-food sales.
Organic fruit and vegetable sales in 2019 were up nearly five percent, hitting 18 billion US dollars5, as the category continued to be the star of the sector. Organic produce made up almost a third of all organic food sales, and organic fruits and vegetables, including fresh, frozen, canned, and dried, captured 15 percent of the fruit and vegetable market in the US.
Although 2020 numbers are not yet available, the COVID-19 pandemic has had dramatic consequences for the organic sector. As shoppers searched for healthy, clean food to feed their families, organic proved to be the food of choice for home consumption. Demand for organic fresh produce grew substantially from March onward as consumers continued at-home eating in the face of restaurant closures. In fact, the Organic Produce Network predicted double-digit growth of fresh produce sales in its analysis during the year. Fresh fruit and vegetable sales averaged 18 percent year-over-year growth in each of the first three quarters.
Slower growth categories suddenly experienced outrageous demand. Sales of organic shelf-stable baking mixes and flours were up 46 percent during the summer months, according to SPINS, while organic frozen foods were up 24 percent. For context, organic baking needs grew at 6.9 percent during 2019, while organic frozen food had been nearly stagnant at 7 percent growth.
1 Barbara Fitch Haumann is Senior Writer/Editor for the Organic Trade Association headquartered in Washington, D.C., USA. 2 55.1 billion US dollars corresponded to 49.2 billion euros (based on 2019 average exchange rate according to the European Central Bank). 3 50.1 billion US dollars corresponded to 49.2 billion euros (based on 2019 average exchange rate according to the European Central Bank). 4 5 billion US dollars corresponded 4.5 billion euros (based on 2019 average exchange rate according to the European Central Bank). 5 18 billion US dollars corresponded 16.1 billion euros (based on 2019 average exchange rate according to the European Central Bank).
North America › United States
FiBL & IFOAM – Organics International (2021): The World of Organic Agriculture. Frick and Bonn 285
Despite challenging conditions, those in the organic supply chain adapted their practices to keep pantries and refrigerators stocked, and supported their communities through donations, shifting business models to produce essential supplies, retooling work processes to protect employees, enhancing employee benefits, and taking creative measures to meet demand.
More farmers growing organic
Meanwhile, the U.S. Department of Agriculture’s (USDA’s) National Agricultural Statistics Service (NASS) in October released its 2019 Organic Survey, counting 16'585 certified organic farms, up 17 percent from 14´271 in 2016. These operations represented 5.50 million certified acres (2.2 million hectares), an increase of 9 percent over 2016 figures. Total U.S. farm gate sales reached 9.93 billion U.S. dollars1 in organic products, an increase of 2.37 billion U.S. dollars, or 31 percent, over those in the 2016 NASS survey. California continued to lead the nation in certified organic farm gate sales, followed by Washington, Pennsylvania, Oregon, and Texas.
Nearly 3´000 organic farms reported they directly market to consumers via such methods as farm stands and farmers’ markets. Meanwhile, approximately 3´200 farms sell directly to retail markets, while over 1´300 sell value-added products such as wine, jams and cheeses.
In addition, 1´857 farms are transitioning 255´060 acres (103´263 hectares) to certified organic production, while 710 farms say they are not yet certified but are transitioning approximately 60´600 acres (24´534 hectares).
Global trade
The U.S. international organic program overseen by the Organic Trade Association and funded through USDA yielded 16.7 million U.S. dollars2 in projected sales in 2020 from two trade shows and included Natural Products Expo West meetings and virtual trade events. There were 31 companies participating across activities taking place in Europe, Asia, and the UAE. In addition, the program undertook new consumer promotion efforts in Japan, South Korea and the United Arab Emirates (UAE).
Pre-pandemic, 14 companies exhibited in the program’s booth at Biofach in Germany, featuring grains and flours, to functional beverages, nuts, and baby food. The Organic Trade Association also participated in the Biofach Congress, presenting in six panels and seminars and furthering ties with European partners. The program also exhibited at Gulfood, Dubai, UAE, for the first time, with food ingredients and organic snack foods demonstrating strong market potential. As the world began shutting down due
1 9.93 billion US dollars corresponded 8.9 billion euros (based on 2019 average exchange rate according to the European Central Bank). 2 16.7 million US dollars corresponded 14.9 billion euros (based on 2019 average exchange rate according to the European Central Bank).

North America › United States
286 FiBL & IFOAM – Organics International (2021): The World of Organic Agriculture. Frick and Bonn
to COVID-19, the program’s Expo West effort was able to arrange a few meetings between buyers and local suppliers to generate overseas business for organic exporters in Asia.
During the pandemic, the program held two virtual trade missions in September: one on produce with buyers from across Asia, and a second for processed product companies with buyers from Asia, Europe, and the UAE. More than 100 one-on-one virtual meetings took place, with over 2.1 million U.S. dollars1 in projected sales – a huge success for a first-time virtual event, with 17 U.S. supplier companies and 15 foreign buyers.
Organic fraud prevention
During 2020, U.S. organic businesses gained access to the Organic Trade Association’s ground-breaking Organic Fraud Prevention Solutions and a fraud-fighting training package from USDA.
Designed to meet the unique needs of the organic supply chain, Organic Fraud Prevention Solutions is based on buyer responsibility and supplier verification. Participating companies receive a comprehensive Organic Fraud Prevention Guide and take an online training course, ‘Developing and Implementing an Organic Fraud Prevention Plan.’
USDA has added two free online courses: ‘Preventing the Organic Fraud Opportunity’ and ‘Organic Fraud and the Criminal Mind.’ Both are offered through its Organic Integrity Learning Center and are designed for organic inspectors and certifiers to complement the trade association’s fraud-fighting program. The courses were made possible by a cooperative agreement between the trade association and USDA.
Strengthening enforcement
In 2020, USDA’s National Organic Program (NOP) published its Strengthening Organic Enforcement and Oversight proposed rule to support the continued growth of the organic market and improve oversight at critical links in the supply chain. It is designed to close gaps in current regulations to build consistent certification practices to deter and detect organic fraud, improve transparency and traceability of organic products throughout the supply chain, and protect organic integrity.
It’s the largest single piece of rulemaking since the U.S. organic standards went into effect in 2002. The 2018 Farm Bill authorized spending for this work, including money for NOP to invest in technology systems to modernize and improve international organic trade tracking, and prevent fraud, and to require electronic organic import certificates to ensure full traceability.
1 2.1 million US dollars corresponded 1.9 billion euros (based on 2019 average exchange rate according to the European Central Bank).
North America › United States
FiBL & IFOAM – Organics International (2021): The World of Organic Agriculture. Frick and Bonn 287
Among other provisions, certified operators would be required to maintain a fraud prevention plan. The Organic Trade Association’s Organic Fraud Prevention Solutions is a private sector initiative that addresses this need.
USDA estimates that at least 1´922 U.S. handlers will need to get certified, and the rule will impact 26´408 certified operations in the U.S, 18´352 in foreign countries and 2.6 million growers. The focus now is to move swiftly to a final rule--hopefully in the first half of 2021--and provide support and resources to ensure successful implementation.
Meanwhile, the sector continues to push for animal welfare standards via a lawsuit led by the Organic Trade Association and through advocacy for a final rule on Origin of Livestock.
Animal welfare: Prompting this legal battle was USDA’s repeated refusal to act on ‒ and subsequent withdrawal of ‒ a thoroughly vetted Organic Livestock and Poultry Practices final rule to improve livestock living conditions and care. In doing so, USDA failed to follow the public/private rulemaking process established by the Organic Foods Production Act of 1990 that Congress created. The lawsuit against USDA was filed in 2017. This case has importance to all organic stakeholders because USDA’s refusal to follow the process by which organic regulations are set could reverberate adversely for years if not corrected by the federal judiciary. At the end of 2020, the court granted the trade association’s request to issue a stay to revise the timetable for future filings until the Biden administration was in place. The new timetable allows for filings to resume between February and May 2021.
Origin of Livestock: Meanwhile, the U.S. organic community has long advocated for a final rulemaking on Origin of Livestock to clarify and narrow the allowance to transition dairy animals into organic milk production as a one-time event. In 2015, a proposed Origin of Livestock rule was released clarifying that producers may transition non-organic dairy animals to organic milk production only when converting a conventional herd to organic. Once the transition is complete, the producer is not allowed to transition any additional animals to organic production. All dairy animals added to the operation must be under organic management from the last third of gestation, or transitioned dairy animals sourced from another certified organic dairy farm.
USDA in October 2019 re-opened comments on the proposal. Despite overwhelming consensus and support for the proposed rule, USDA still has not released a final rule despite the congressional Fiscal Year 2020 Appropriations Bill mandating that the agency release a final rule by June 30, 2020.
More recently, NOP announced in October 2020 that it intends to rewrite and publish another proposed rule instead of moving to a final rule. This is opposed by the Organic Trade Association, which points out that USDA’s inaction to resolve the long-standing inconsistency in certifier enforcement of origin of livestock regulations is exacerbating the economic disadvantage of dairy farmers on an uneven playing field and threatening the integrity of the organic sector.
North America › United States
288 FiBL & IFOAM – Organics International (2021): The World of Organic Agriculture. Frick and Bonn
Looking ahead
The U.S. organic sector has numerous priorities going forward. At the top is for organic to have a seat at the table in climate change discussions.
During 2020, the Organic Trade Association’s Board of Directors established a climate task force to develop principles to guide organic’s engagement in climate policy discussions. At the trade association’s annual meeting in June, its Board unanimously endorsed ten principles for climate policy.
On the regulatory front, organic stakeholders are eager for the resolution of reinstating the Organic Livestock and Poultry Practices rule (OLPP), and still seek the publication of a final rule on Origin of Livestock.
The organic sector also is asking for an interim final rule that encompasses the backlog of standards that have been recommended yet not acted on by USDA during more than a decade. In addition, it is awaiting a new framework for standards development through the advancement of the Strengthening Organic Enforcement and Enforcement rule.
Moreover, with the change in governmental administrations, it is calling for the restoration of an Organic and Sustainable Agriculture Policy Advisor role within USDA, along with steps to promote organic agriculture within USDA research programs and integrate organic into federal nutrition and procurement programs. Another priority is to restore full governmental funding for organic certification cost-share.
Meanwhile, the trade association is undertaking an Organic for All: Diversity and Entrepreneurship goal to foster diversity and inclusion. This campaign will encourage organic entrepreneurs and businesses owned by Black, Indigenous and People of Color, and assess the value of establishing an industry foundation focusing on diversity and entrepreneurship within the organic movement.
In U.S. grocery stores, it is possible to purchase organic food products in nearly every category, while organic products are in the kitchens of more than 82% of American households. But this trust comes as a result of consumers’ belief in the veracity of the USDA Organic seal. Strong standards reinforce trust that products bearing the USDA Organic label are held to a high quality, definable, measurable set of standards with robust oversight and enforcement. The integrity of the organic certification process from farm to table is the lifeblood of the organic industry. This will remain the priority for the U.S. organic sector as it continues its advocacy for organic agriculture.
References Organic Trade Association’s 2020 Organic Industry Survey Organic Trade Association, Organic Fraud Prevention Solutions (https://ota.com/OrganicFraudPrevention USDA’s National Agricultural Statistics Service 2019 Organic Survey, October 2020
(www.nass.usda.gov/organics) USDA’s Agricultural Marketing Service (https://www.ams.usda.gov/rules-regulations/strengthening-
organic-enforcement-proposed-rule)
North America › Canada
FiBL & IFOAM – Organics International (2021): The World of Organic Agriculture. Frick and Bonn 289
Canada
TIA LOFTSGARD1
Ramping up global trade
2019 was a successful year for international organic programs overseen by the Canada Organic Trade Association and funded through Agriculture and Agri-Food Canada, with ten international activities in six countries. Overall, 45 US companies participated in international trade shows and trade missions. In 2019 alone, projected organic export sales from international activities with the trade association were over 15 million Canadian dollars (approx. 10 million euros). These activities are crucial to opening and maintaining market access for Canadian organic products across the globe. Activities took place in Asia, Europe, Latin America, and North America, with an increase in demand for organic crops and cereals, snacks, nuts, and pre-packed meals.
Significant increase in certified organic farms and processors The Canadian organic sector continues to attract an important number of new farms each year, despite a stiff decline in the number of non-organic farms between 2011 and 2016 (2016 Census of Agriculture). In 2019, there were 7432 certified operations, an increase of 5 percent from the previous year and 48 percent growth since 2015. This continuous year-to-year growth is an indicator of increased consumer demand for organics. In 2019, the total of certified organic producers reached 5677, an increase of 4 percent from 2018 and 43 percent since 2015. Organic acreage increased from 3.3 to 3.4 million acres (1.3 to 1.4 million hectares, including wild collection) between 2018 and 2019, achieving an organic share of 2.2 percent of total agricultural land in Canada.
According to the data, the number of organic food processors/handlers and manufacturing companies in Canada slightly decreased from 1717 to 1710 between 2018 and 2019. However, it increased by 11 percent between 2015 and 2019. The estimated sales value of organic processed food and beverage was 3.21 billion Canadian dollars in 2020, an increase of 9 percent since 2019. In line with this impressive growth in demand for organic processed products, COTA published in September 2019 its report on Organic Food Processing in Canada based on data collected in 2018 and previous years. According to this research report, the number of processed organic food and beverage products introduced to the Canadian market has been escalating in recent years, with 93 percent of surveyed respondents reporting year-over-year sales growth over 5 percent, while 13 percent reported growth over 50 percent.
Market Growth
New records were made in both the organic food market and organic non-food market. Canada’s food and non-food organic market is estimated to have reached 6.93 billion
1 Tia Loftsgard, Executive Director, Canada Organic Trade Association (COTA), Ottawa, Canada, https://www.canada-organic.ca/
North America › Canada
290 FiBL & IFOAM – Organics International (2021): The World of Organic Agriculture. Frick and Bonn
Canadian dollars (approx. 4.7 billion euros) in 2020, with a compound annual growth rate of 8.7 percent. The market share of organic food and beverages sold through mainstream retailers has grown from 2.6 percent to 3.2 percent in 2019. While the tracking of international trade is limited to Canada’s Harmonized Sales codes and has a limited scope, trade continues to increase. Canadian exports of certified organic products reached 460.9 million Canadian dollars (310 million euros) in 2019, while imports reached 789 million Canadian dollars (approximately 531million euros) in the same year.
Canadian Organic Labour According to the 2016 Census of Agriculture, 2.35 percent of the total labour force works in organic, compared to 2 percent in 2011. Thirty-one percent of the organic labour force was female, a decrease compared to 34 percent in 2011. The 2016 census identified important labour needs, mainly that organic farmers rely a lot on family labour (58 percent compared to 41 percent in conventional farming), while still needing twice the amount of external labour sources (3.09 employees per farm versus 1 in conventional farming). 2016 data also shows that organic farms earn 11 percent more than the average income, a significant increase from 4 percent in 2011.
State of Organic Performance Report
In 2019, COTA published its third State of Organic Performance Report that outlines the most current forms of support for the organic sector from Federal, Provincial and Territorial jurisdictions and provides a broad set of summary recommendations to each level of government. According to the report, there has been little progress in terms of support from provincial, territorial and Federal governments. While there is great consumer confidence in the Canada Organic Regime, and recognition is growing for the Canadian Organic Logo, the lack of comprehensive programming assistance at the provincial/territorial level leaves a patchwork of provincial responses in the application of a standard for intra-provincial trade. There is also a need for the federal government to provide more robust and comprehensive data on production, imports, exports and consumption, which are paramount for good decision making on government objectives related to climate change. The Canada Organic Trade Association will continue its efforts to work with Agriculture and Agri-Food Canada’s 2020 Organic Industry Engagement strategy to move the needle on a federal strategy that incorporates organic agriculture and trade.
References ! Canada Organic Trade Association publications: https://canada-
organic.myshopify.com/collections ! Statistics Canada: https://www.statcan.gc.ca/eng/start
North America › Statistics
FiBL & IFOAM – Organics International (2021): The World of Organic Agriculture. Frick and Bonn 291
North America: Current statistics
CLAUDIA MEIER,1 BERNHARD SCHLATTER,2 OLIVIA KELLER3 AND JAN TRÁVNÍČEK4
Overview
North America’s organic agricultural land was 3.6 million hectares in 2019, which is 0.8 percent of the total agricultural area in the region. The area under organic cultivation has more than tripled from the million hectares in 2000, and now represents 5 percent of the global organic agricultural land. Between 2018 and 2019, the area increased by almost 305’000 hectares or 9 percent. In 2019, over 2.0 percent of the farmland in Canada was organic, and the proportion in the United States is 0.6 percent. There was a total of 22’153 producers in North America; most of them in the United States (74 percent).
Land use
Land use details were available for 84 percent of the organic agricultural land. In 2019, only 2 percent of all organic farmland was utilized for permanent crops (over 84’000 hectares) while 36 percent was used to grow arable crops (over 1.3 million hectares), and 46 percent (nearly 1.7 million hectares) was grassland/grazing area. The United States had over 812’000 hectares of organic grassland/grazing area, and Canada reported almost 858’000 hectares.
The key organic arable crop group was cereals, with more than 582’000 hectares, representing 0.8 percent of the total organic cereal area in the region, and 11 percent of the world’s organic cereal area. In the United States, over 290’000 hectares of organic cereals were grown, and Canada reported 292´000 hectares. The key organic cereal in the region was wheat (more than 219´000 hectares), this represented 0.8 percent of the total wheat grown in the region. Other important organic arable crops in North America were green fodder, with over 353’000 hectares, oilseeds, with almost 138’000 hectares, and dry pulses, with almost 105’000 hectares.
The main organic permanent crops were grapes (over 27’000 hectares), temperate fruits (over 19’000 hectares), and berries (almost 17´000 hectares). Organic temperate fruits represented 7 percent of the total temperate fruit area in the region. The key organic temperate fruits were apples, pears, and peaches. The key organic berries were blueberries (almost 13’000 hectares, 16.8 percent of the total blueberries grown in the region), and cranberries (over 2’000 hectares, 9.6 percent of the region’s cranberries).
1 Claudia Meier, Research Institute of Organic Agriculture FiBL, Frick, Switzerland, www.fibl.org 2 Bernhard Schlatter, Research Institute of Organic Agriculture FiBL, Frick, Switzerland, www.fibl.org 3 Olivia Keller, Research Institute of Organic Agriculture FiBL, Frick, Switzerland, www.fibl.org 4 Jan Trávníček, Research Institute of Organic Agriculture FiBL, Frick, Switzerland, www.fibl.org
North America › Statistics
292 FiBL & IFOAM – Organics International (2021): The World of Organic Agriculture. Frick and Bonn
Producers
In 2019, 22’153 organic producers were reported in North America. The United States was the country with the most organic producers, over 16'000, and Canada reported almost 5´700 organic producers. Since 2004, when there were over 11’000 organic producers, the number almost doubled.
Wild collection
In 2019, the United States reported almost 600 hectares of organic wild blueberries. Unfortunately, there was no more data on organic wild collection for the United States. Canada reported over 24’000 hectares of organic wild collection in 2019, with no details.
Market
In 2019, the organic market continued to grow in North America, reaching over 48.2 billion euros. Since 2018, Canada’s organic market grew by almost 12 percent, and the organic market of the United States grew by 10 percent. The United States is the largest single organic market in the world, and North America continues to be the region with the largest organic market. In the United States, people spent 136 euros per capita on organic products in 2019, while in Canada, the per capita consumption was almost 93 euros. For 2019, Canada reported an organic share of the total retail sales of 3 percent, and in the United States, an organic share 6 percent was noted.
For more information about the North American figures, see data tables, page 291.
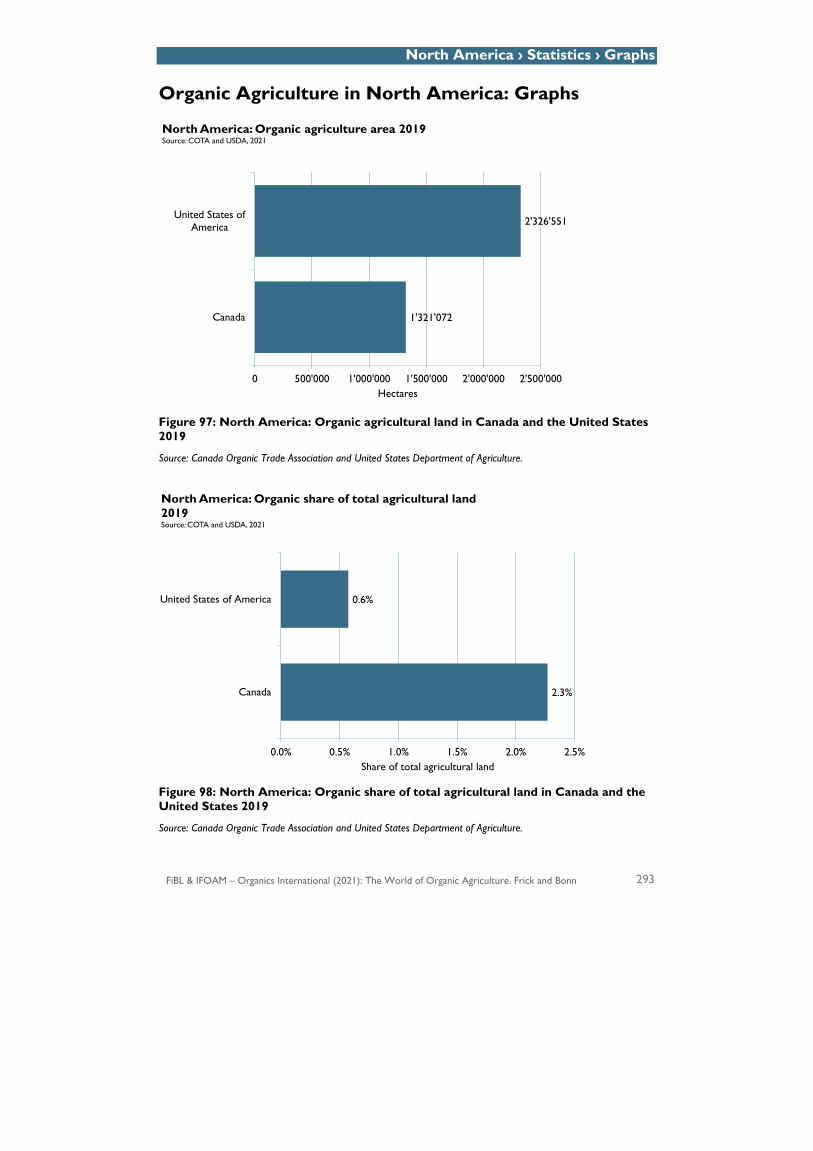
North America › Statistics › Graphs
FiBL & IFOAM – Organics International (2021): The World of Organic Agriculture. Frick and Bonn 293
Organic Agriculture in North America: Graphs
Figure 97: North America: Organic agricultural land in Canada and the United States 2019
Source: Canada Organic Trade Association and United States Department of Agriculture.
Figure 98: North America: Organic share of total agricultural land in Canada and the United States 2019
Source: Canada Organic Trade Association and United States Department of Agriculture.
1'321'072
2'326'551
0 500'000 1'000'000 1'500'000 2'000'000 2'500'000
Canada
United States ofAmerica
Hectares
North America: Organic agriculture area 2019Source: COTA and USDA, 2021
2.3%
0.6%
0.0% 0.5% 1.0% 1.5% 2.0% 2.5%
Canada
United States of America
Share of total agricultural land
North America: Organic share of total agricultural land 2019Source: COTA and USDA, 2021
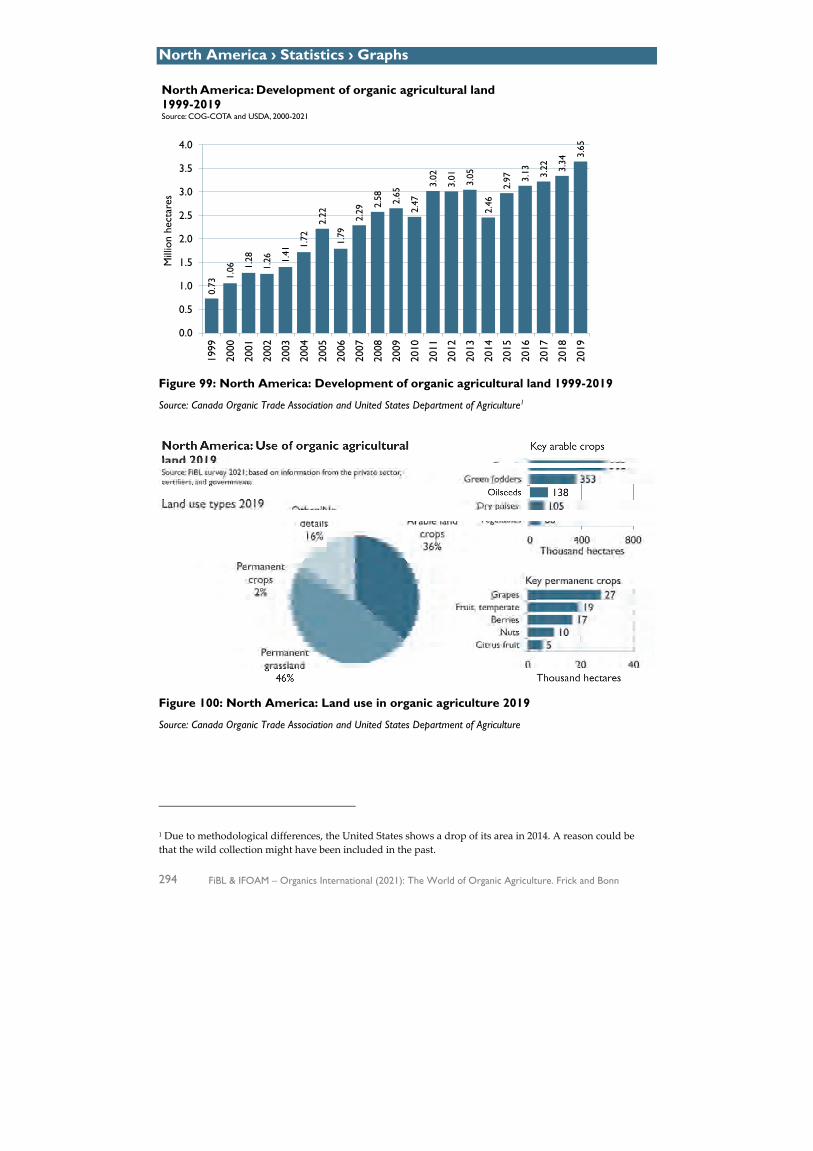
North America › Statistics › Graphs
294 FiBL & IFOAM – Organics International (2021): The World of Organic Agriculture. Frick and Bonn
Figure 99: North America: Development of organic agricultural land 1999-2019
Source: Canada Organic Trade Association and United States Department of Agriculture1
Figure 100: North America: Land use in organic agriculture 2019
Source: Canada Organic Trade Association and United States Department of Agriculture
1 Due to methodological differences, the United States shows a drop of its area in 2014. A reason could be that the wild collection might have been included in the past.
0.73
1.06 1.
28
1.26 1.
41
1.72
2.22
1.79
2.29
2.58 2.65
2.47
3.02
3.01 3.05
2.46
2.97 3.
13 3.22 3.
34
3.65
0.0
0.5
1.0
1.5
2.0
2.5
3.0
3.5
4.0
1999
2000
2001
2002
2003
2004
2005
2006
2007
2008
2009
2010
2011
2012
2013
2014
2015
2016
2017
2018
2019
Mill
ion
hect
ares
North America: Development of organic agricultural land 1999-2019Source: COG-COTA and USDA, 2000-2021
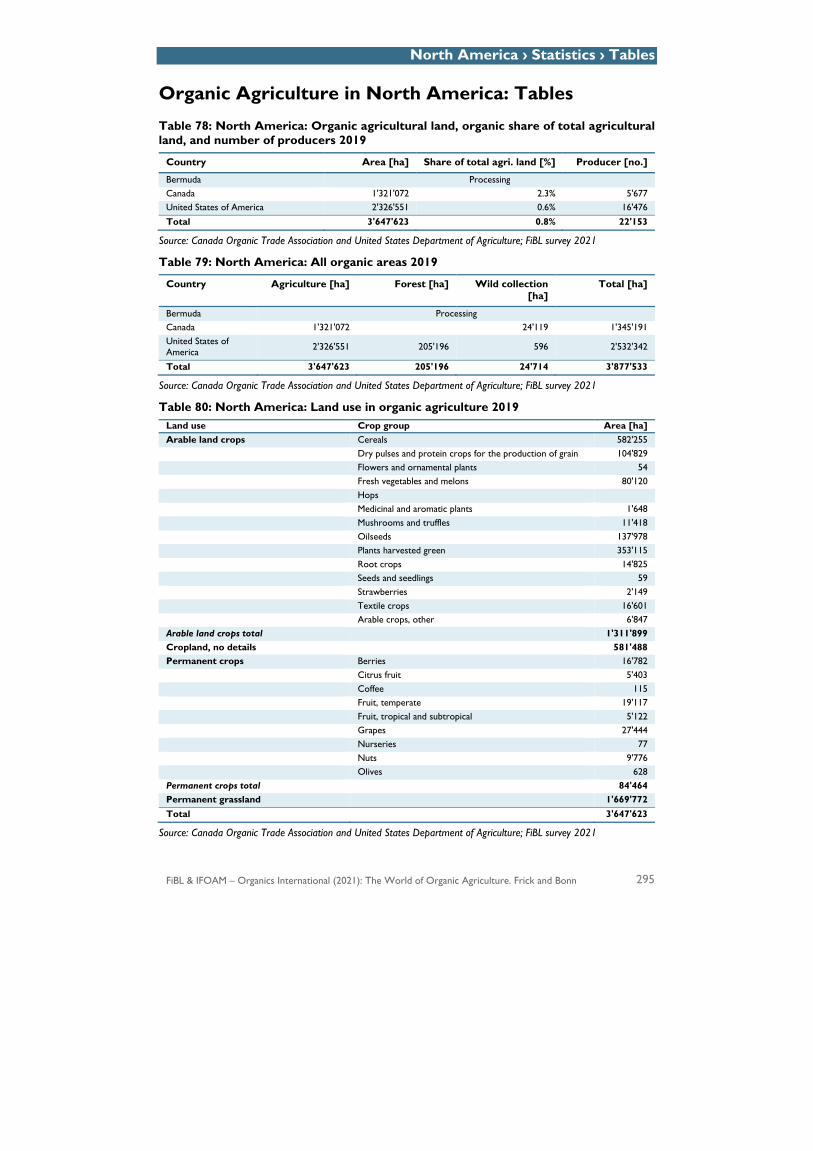
North America › Statistics › Tables
FiBL & IFOAM – Organics International (2021): The World of Organic Agriculture. Frick and Bonn 295
Organic Agriculture in North America: Tables
Table 78: North America: Organic agricultural land, organic share of total agricultural land, and number of producers 2019
Country Area [ha] Share of total agri. land [%] Producer [no.]
Bermuda Processing Canada 1'321'072 2.3% 5'677 United States of America 2'326'551 0.6% 16'476
Total 3'647'623 0.8% 22'153
Source: Canada Organic Trade Association and United States Department of Agriculture; FiBL survey 2021
Table 79: North America: All organic areas 2019
Country Agriculture [ha] Forest [ha] Wild collection [ha]
Total [ha]
Bermuda Processing Canada 1'321'072 24'119 1'345'191 United States of America 2'326'551 205'196 596 2'532'342
Total 3'647'623 205'196 24'714 3'877'533
Source: Canada Organic Trade Association and United States Department of Agriculture; FiBL survey 2021
Table 80: North America: Land use in organic agriculture 2019 Land use Crop group Area [ha] Arable land crops Cereals 582'255 Dry pulses and protein crops for the production of grain 104'829 Flowers and ornamental plants 54 Fresh vegetables and melons 80'120 Hops Medicinal and aromatic plants 1'648 Mushrooms and truffles 11'418 Oilseeds 137'978 Plants harvested green 353'115 Root crops 14'825 Seeds and seedlings 59 Strawberries 2'149 Textile crops 16'601 Arable crops, other 6'847 Arable land crops total 1'311'899 Cropland, no details 581'488 Permanent crops Berries 16'782 Citrus fruit 5'403 Coffee 115 Fruit, temperate 19'117 Fruit, tropical and subtropical 5'122 Grapes 27'444 Nurseries 77 Nuts 9'776 Olives 628 Permanent crops total 84'464 Permanent grassland 1'669'772 Total 3'647'623
Source: Canada Organic Trade Association and United States Department of Agriculture; FiBL survey 2021

296 FiBL & IFOAM – Organics International (2021): The World of Organic Agriculture. Frick and Bonn
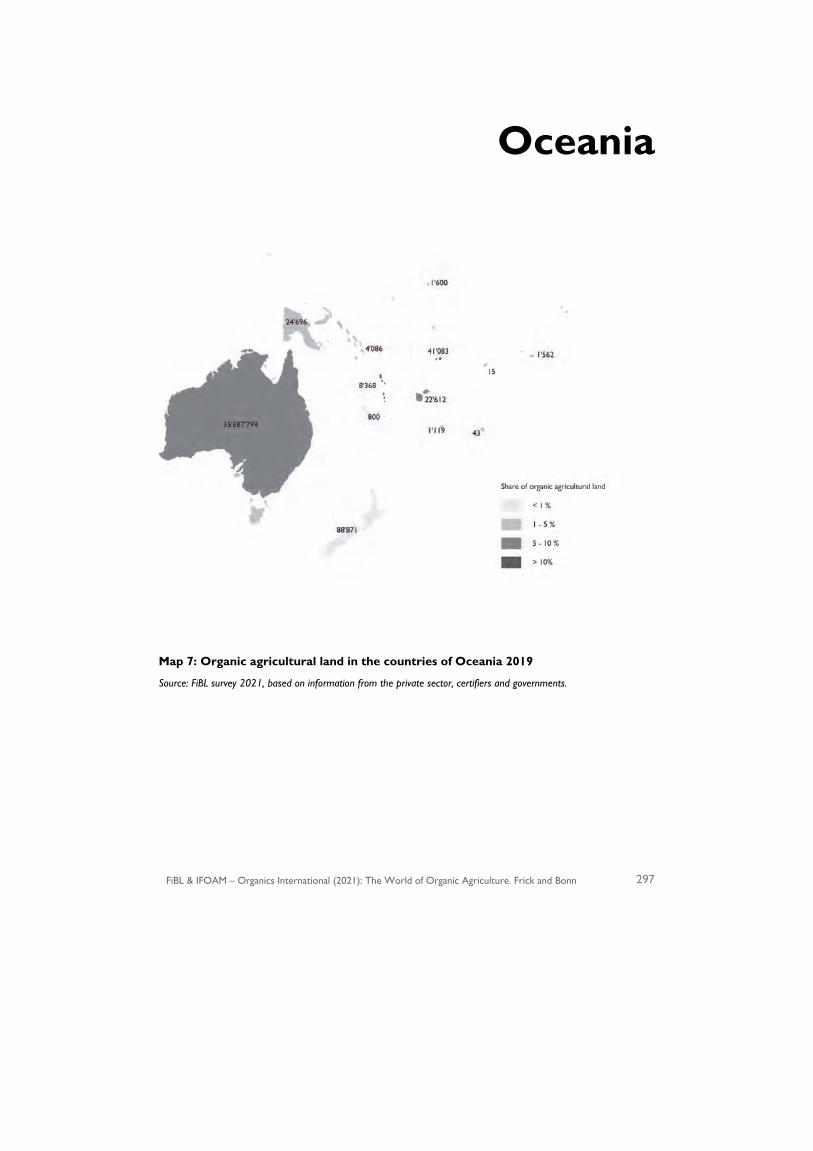
FiBL & IFOAM – Organics International (2021): The World of Organic Agriculture. Frick and Bonn 297
Oceania
Map 7: Organic agricultural land in the countries of Oceania 2019
Source: FiBL survey 2021, based on information from the private sector, certifiers and governments.
Oceania › Australia
298 FiBL & IFOAM – Organics International (2021): The World of Organic Agriculture. Frick and Bonn
Australia
NICOLE FORD1 AND OWEN GWILLIAM2
Introduction
Australia continues to hold the world’s largest area of agricultural land under certified organic management. The vast majority of Australia’s organic farmland is pastoral operations focused particularly on beef cattle. While most of the Australian producers are active in the production of livestock fodder, fruit, vegetables and lamb/sheep meat, the Australian processing and manufacturing sectors are dominated by fruit, vegetables and dairy products.
Certified organic producers and processors are found in all Australian states and territories, each with their particular niches. Due to the drought, shortages of available feed for many livestock producers (particularly in New South Wales (NSW) and Queensland), the year 2020 has seen the largest demand for organic hay and grain for at least a decade with livestock fodder transported from Western Australia, South Australia and Victoria, north to New South Wales and Queensland.
Estimated to be worth 2.6 billion Australian dollars3 (2018), the Australian organic industry (exports and retail sales) has continued to grow despite continuing harsh environmental conditions. The southern and eastern regions of Australia were devastated by extensive damage from multiple bushfires during what is now called The Black Summer.
The Black Summer
It is suggested a significant lightning strike in October 2019 detonated what would become the most devastating fire season in Australia’s living history. Fuelled by years of drought, hot summer temperatures and an abundance of fuel load such as dry leaf litter, over ten million hectares of bushland were incinerated. It is estimated that more than a billion animals were lost, over 3000 homes were burnt, and 33 people lost their lives.
For the first time in the Australian organic industry history, organic operators were represented during key discussions with Australian Organic Limited (AOL), the newly established peak body, who were invited to have a seat at the Parliamentary roundtable alongside all other peak body representatives.
With a commitment to provide swift support, AOL convened an industry advisory committee that provided detailed information and advice for affected operators.
1 Nicole Ford, Chief Executive Officer, Australian Organic Ltd, Nundah, Australia, www.austorganic.com 2 Owen Gwilliam, Chief Technical Officer, Australian Organic Ltd, Nundah, Australia, www.austorganic.com 3 This corresponded to approximately 1.65 billion euros.
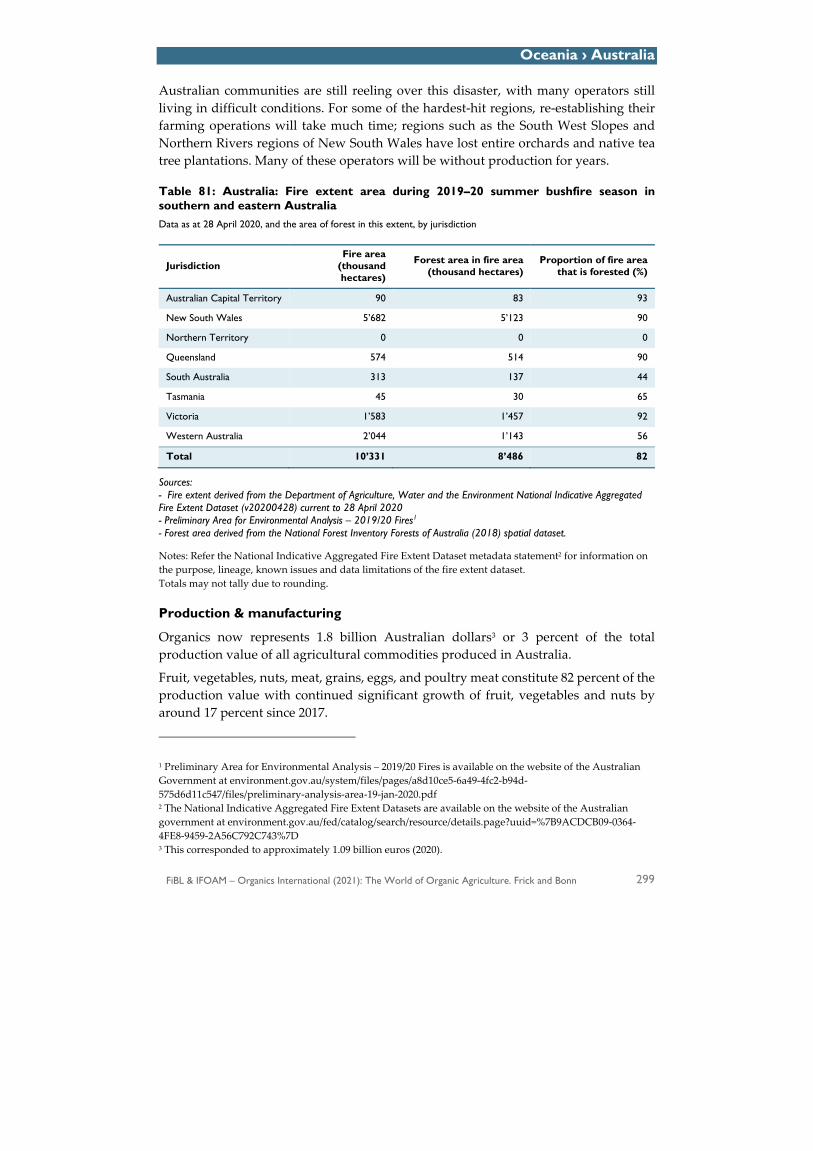
Oceania › Australia
FiBL & IFOAM – Organics International (2021): The World of Organic Agriculture. Frick and Bonn 299
Australian communities are still reeling over this disaster, with many operators still living in difficult conditions. For some of the hardest-hit regions, re-establishing their farming operations will take much time; regions such as the South West Slopes and Northern Rivers regions of New South Wales have lost entire orchards and native tea tree plantations. Many of these operators will be without production for years.
Table 81: Australia: Fire extent area during 2019–20 summer bushfire season in southern and eastern Australia Data as at 28 April 2020, and the area of forest in this extent, by jurisdiction
Jurisdiction Fire area
(thousand hectares)
Forest area in fire area (thousand hectares)
Proportion of fire area that is forested (%)
Australian Capital Territory 90 83 93
New South Wales 5’682 5’123 90
Northern Territory 0 0 0
Queensland 574 514 90
South Australia 313 137 44
Tasmania 45 30 65
Victoria 1’583 1’457 92
Western Australia 2’044 1’143 56
Total 10’331 8’486 82
Sources: - Fire extent derived from the Department of Agriculture, Water and the Environment National Indicative Aggregated Fire Extent Dataset (v20200428) current to 28 April 2020 - Preliminary Area for Environmental Analysis – 2019/20 Fires1 - Forest area derived from the National Forest Inventory Forests of Australia (2018) spatial dataset.
Notes: Refer the National Indicative Aggregated Fire Extent Dataset metadata statement2 for information on the purpose, lineage, known issues and data limitations of the fire extent dataset. Totals may not tally due to rounding.
Production & manufacturing
Organics now represents 1.8 billion Australian dollars3 or 3 percent of the total production value of all agricultural commodities produced in Australia.
Fruit, vegetables, nuts, meat, grains, eggs, and poultry meat constitute 82 percent of the production value with continued significant growth of fruit, vegetables and nuts by around 17 percent since 2017.
1 Preliminary Area for Environmental Analysis – 2019/20 Fires is available on the website of the Australian Government at environment.gov.au/system/files/pages/a8d10ce5-6a49-4fc2-b94d-575d6d11c547/files/preliminary-analysis-area-19-jan-2020.pdf 2 The National Indicative Aggregated Fire Extent Datasets are available on the website of the Australian government at environment.gov.au/fed/catalog/search/resource/details.page?uuid=%7B9ACDCB09-0364-4FE8-9459-2A56C792C743%7D 3 This corresponded to approximately 1.09 billion euros (2020).

Oceania › Australia
300 FiBL & IFOAM – Organics International (2021): The World of Organic Agriculture. Frick and Bonn
There has been substantial growth across all the sectors, with an estimated Compound Annual Growth Rate (CAGR) of 15 percent since 2014. However, there has been a slowing in meat, dairy, grains, eggs and poultry meat, wine, honey and animal feedstuffs, which is indicative of the impacts of drought on commodities. Given the impacts of the drought, overall farm-gate production, processing and export continue to be strong, reflected by the substantial gains since 2012 even though the growth rate has fallen slightly since 2017 across the sectors.
As the major supermarket retailers expand their private label range, an increase in availability is driving more mainstream consumption. Large beverage businesses have also developed new products as demand grows with Australia’s first mainstream organic beer and cider launched in October 2019 and showcased at a large sporting event.
The beverage category grew 7 percent in 2019, while organic food sales have increased by five percent.
According to an IBISWorld report, the Australian organic farming industry’s revenue is forecast to grow at an annualised 15.1 percent over the five years through 2024-25, to 3.7 billion Australian dollars.
Regulatory Framework
By law, Australian-produced products that are labelled as organic and exported from Australia must be certified as organic by one of the six government-accredited certifying organisations: AUS-QUAL, ACO Certification Limited (ACOCL) (formerly known as Australian Certified Organic), BioDynamic Research Institute (BDRI), NASAA Certified Organic (NCO), Organic Food Chain (OFC) and Southern Cross Certified Australia (SXC).
The certifiers must certify to the National Standard for Organic and Bio-Dynamic Produce (National Standard) or another standard deemed equivalent to the National Standard. ACOCL, BDRI and NCO certify operators to their own standards (which incorporate the minimum requirements of the National Standard) for additional market access or branding purposes. OFC, AUSQUAL and SXC certify directly to the National Standard. The National Standard was last updated in 2016 (Edition 3.7) and is maintained by the industry-owned and funded Organic Industry Standards and Certification Council (OISCC) on behalf of the Australian Government’s Department of Agriculture, Water and the Environment (DAWE).
Through 2018 – 2020, the Australian Government conducted a review of Australia’s organic export regulation, the Export Control (Organic Produce Certification) Orders under the Export Control Act 1982. The review considered whether the regulation of exported organic products should continue, and if so, how and to which standard. AOL made various submissions and contributed to the review on behalf of our industry, in a collaborative effort with the Department of Agriculture, Water and the Environment.
The outcome of the review is the publishing of a new Export Control (Organic) Rules document that will come into effect in March 2021. The new rules include sensible and
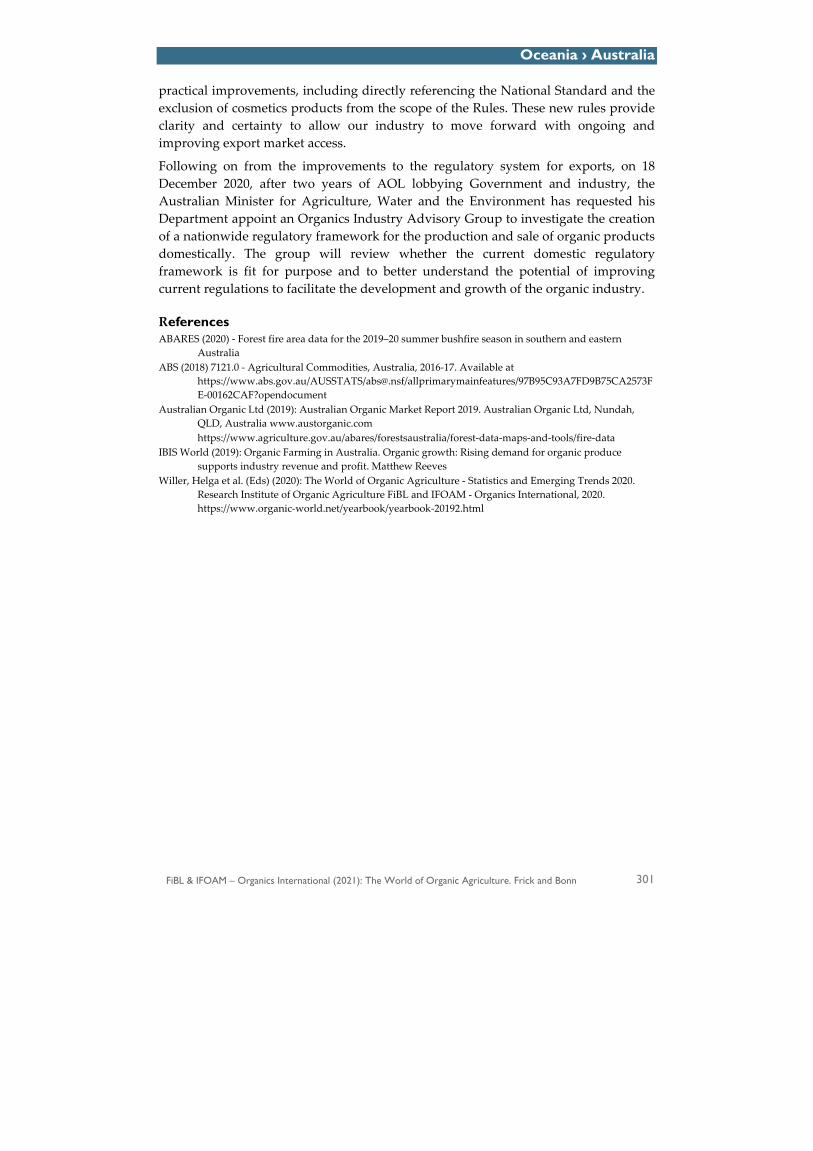
Oceania › Australia
FiBL & IFOAM – Organics International (2021): The World of Organic Agriculture. Frick and Bonn 301
practical improvements, including directly referencing the National Standard and the exclusion of cosmetics products from the scope of the Rules. These new rules provide clarity and certainty to allow our industry to move forward with ongoing and improving export market access.
Following on from the improvements to the regulatory system for exports, on 18 December 2020, after two years of AOL lobbying Government and industry, the Australian Minister for Agriculture, Water and the Environment has requested his Department appoint an Organics Industry Advisory Group to investigate the creation of a nationwide regulatory framework for the production and sale of organic products domestically. The group will review whether the current domestic regulatory framework is fit for purpose and to better understand the potential of improving current regulations to facilitate the development and growth of the organic industry.
References ABARES (2020) - Forest fire area data for the 2019–20 summer bushfire season in southern and eastern
Australia ABS (2018) 7121.0 - Agricultural Commodities, Australia, 2016-17. Available at
https://www.abs.gov.au/AUSSTATS/[email protected]/allprimarymainfeatures/97B95C93A7FD9B75CA2573FE-00162CAF?opendocument
Australian Organic Ltd (2019): Australian Organic Market Report 2019. Australian Organic Ltd, Nundah, QLD, Australia www.austorganic.com
https://www.agriculture.gov.au/abares/forestsaustralia/forest-data-maps-and-tools/fire-data IBIS World (2019): Organic Farming in Australia. Organic growth: Rising demand for organic produce
supports industry revenue and profit. Matthew Reeves Willer, Helga et al. (Eds) (2020): The World of Organic Agriculture - Statistics and Emerging Trends 2020.
Research Institute of Organic Agriculture FiBL and IFOAM - Organics International, 2020. https://www.organic-world.net/yearbook/yearbook-20192.html
Oceania › Pacific Islands
302 FiBL & IFOAM – Organics International (2021): The World of Organic Agriculture. Frick and Bonn
The Pacific Islands
KAREN MAPUSUA1
Recent developments
While generally, certification continues to expand across the Pacific, some countries are reflecting a drop in certified land in recent years. This can be attributed to natural disasters affecting perennial crops, such as coconuts, causing the licensees to suspend or leave certification programs until their crops produce again. Governments are becoming increasingly interested in creating a supportive policy environment. A significant development is regional and national agencies and development partners increasingly recognising the value of organic agriculture as a development tool for the Pacific islands context.
Market, trade and certification
Most of the Pacific's organically certified products are for export; however, there are indications of growing local markets through basket (box) schemes, unverified organic claims on labels, PGS development, organic stalls at farmers markets and increased awareness. In Table 82, the main products that are currently organically certified in the Pacific are listed. Table 82: Pacific Islands: Main certified organic products
Products Countries
Vanilla, ginger & other spices Fiji, Vanuatu, Niue, Samoa Cocoa Vanuatu, Samoa, PNG Virgin Coconut Oil Samoa, Fiji, Solomon Islands, Tonga, Vanuatu Coconut meal Vanuatu Nonu /noni (Morinda Citrifolia) Cook Islands, Samoa, Fiji, Niue, French Polynesia Honey Niue, Fiji Bananas (including processed) PNG, Samoa Coffee PNG, Samoa, Vanuatu Livestock( Beef, Goats and Sheep) Vanuatu, Fiji Fruit & Vegetables ( including processed) Fiji, New Caledonia, Samoa, French Polynesia, Cook Islands, Republic
of the Marshall Islands Rum French Polynesia Forest nuts Solomon Islands
While POETCom has systems in place for collating third part and PGS certification data, until now, there are no mechanisms for collecting local organic market data. Growth can be inferred from the increase in PGS certified farms and the number of organic value chains and market opportunities.
1 Karen Mapusua, Operations Manager Land Resources Division, Pacific Community (SPC), Private Mail Bag, Suva, Fiji, www.spc.int/
Oceania › Pacific Islands
FiBL & IFOAM – Organics International (2021): The World of Organic Agriculture. Frick and Bonn 303
PGS models in the Pacific include wild harvest, 'whole island', as well as more traditional grower groups. Respect for traditional authorities (chiefs) is strong in the Pacific Islands, and in some cases, traditional governance systems have been embraced to provide support to the guarantee system. Processing and value-adding operations are also certified through the PGS process, creating a need to upskill those PGS that include processing to manage the more complex inspection requirements.
In 2019 there were ten PGS approved to use the Organic Pasifika Mark. The number and variety of PGS certified products on local markets and export are expanding, and 2019 saw the range grow to include organic manioc flour, peanuts and coffee from Vanuatu, with over 1000 farmers involved in the PGS. The growth of PGS and improved recognition of organics' value has also contributed to a rise in farmers' markets and supply agreements. Samoa, Niue, Cook Islands and Fiji now have certified produce sold through farmers' markets. The Republic of the Marshall Islands has small amounts of certified fresh produce available in selected supermarkets. Fiji has 135 PGS certified farmers supplying vegetables to the country's only organic restaurant Tukuni, established by the Foundation for Rural Enterprises and Development (FRIEND).
Third-party organic certification continues to grow slowly. Each year shows some withdrawals from certification and some new licences. For some growers of permanent crops, such as coconuts, tropical cyclones' devastation makes maintaining certification through the recovery period uneconomical. These issues are likely to be exacerbated under climate change scenarios with more frequent and stronger climate events.
It remains challenging to obtain export data, but the Central Banks' published export data combined with other market intelligence can provide insights in a few instances. For example, the Central Bank of Samoa published data in 2019 that showed a 3600 percent increase in coconut oil exports within 12 months and a 400 percent increase in coconuts' farm gate price. Cross-referenced with other intelligence, this growth can be attributed to the rapid growth in exports from new players in the coconut industry who exported organic and fair-trade coconut oil in the previous 12 months. Such rapid expansion of organic exports cannot be claimed as regionally widespread, but it does show the potential for some organic value chains.
Legislation
New Caledonia and French Polynesia remain the only Territories to regulate organics. Independent countries of the region have not yet passed organic regulations; however, Samoa has commenced drafting an organic bill. The Government of Vanuatu has endorsed its first national organic policy. The Government of Fiji is now consulting on a draft policy developed by the country's organic sector and presented to Government – a unique bottom-up approach to policy development.
Government and international support
A regional intergovernmental organisation, The Pacific Community, continues to provide support for organics development and houses the secretariat of POETCom, the
Oceania › Pacific Islands
304 FiBL & IFOAM – Organics International (2021): The World of Organic Agriculture. Frick and Bonn
Pacific Organic & Ethical Trade Community. POETCom remains predominantly funded through development projects.
POETCom national affiliates continue to receive assistance from international NGOs and through bilateral development assistance. In a few cases, national governments provide financial support for organic certification costs, as in Samoa and Niue, where the national governments cover certification fees for national grower groups.
The growing interest of development partners in organics as a solution for climate resilience and livelihoods development is demonstrated through the Building Prosperity for Women Producers through Organic Value Chains (BWBP) project, launched in 2018. It is a four-year project implemented in partnership with the Pacific Community (SPC), POETCom and the Australian Department of Foreign Affairs and Trade (DFAT) through the Pacific Women Shaping Pacific Development programme (Pacific Women). Pacific Women recognises the potential for organic value chains and mechanisms such as Participatory Guarantee Systems (PGS) to empower women economically and socially. The organisation worked with POETCom to design the project to work with organic producers, processors, vendors and organic associations and focus on niche organic products that women can develop.
Another example is the PROTÉGÉ project in the Pacific French Territories, funded by the European Union. PROTÉGÉ stands for the 'Projet régional océanien des territoires pour la gestion durable des écosystèmes' (Pacific Territories Regional Project for Sustainable Ecosystem Management). It aims to strengthen the sustainability, climate change adaptation and autonomy of key sectors and enhance ecosystem-services by protecting water resources and biodiversity. Agroecology and organic agriculture form the basis of the agriculture component of the programme.
Outlook
Development partners’ support has been secured to review POETCom's structure and design a sustainable funding mechanism to support the organic movement and the Pacific Organic Guarantee Scheme. Opportunities for scaling organics as a response to climate change are growing with development partners interested in funding programmes of this nature. There is also an expectation that the local market for organic products will continue to expand as the tourism and hospitality industries in the Pacific Islands develop their brand for organic and sustainability.
Links/Further reading › Pacific Organic and Ethical Trade Community www.organicpasifika.com › Pacific Organic Standard http://www.organicpasifika.com/poetcom/wp-
content/uploads/sites/2/2014/08/POS.pdf › Growing Our Future POETCom Strategic Plan 2013 – 2017 http://www.organicpasifika.com/poetcom/wp-
content/uploads/sites/2/2014/08/POETCom-Strategic-Plan.pdf › POETCom Annual Reports http://www.organicpasifika.com/poetcom/who-are-we/annual-reports/ › Pacific Organic Policy Toolkit http://www.organicpasifika.com/pasifikapolicytoolkit/
Oceania › Statistics
FiBL & IFOAM – Organics International (2021): The World of Organic Agriculture. Frick and Bonn 305
Oceania: Current statistics
CLAUDIA MEIER, BERNHARD SCHLATTER, OLIVIA KELLER AND JAN TRÁVNÍČEK
In 2019, the organic agricultural land in Oceania was almost 35.9 million hectares, which constituted 9.6 percent of the total agricultural area in the region. Half of the world’s organic agricultural land was in Oceania. The area under organic production has increased almost seven-fold since 2000 (5.3 million hectares). Between 2018 and 2019, the area in Oceania decreased by 118´000 hectares – 0.3 percent less - due to a drop in the organic agricultural area in Samoa (almost 57´000 hectares, 58 percent loss), Papua New Guinea (nearly 25’000 hectares, 50 percent loss), Fiji (almost 19´000 hectares, 45 percent loss), and Vanuatu (over 17’000 hectares, 67 percent loss). The country with the biggest organic agricultural area is Australia with 35.7 million hectares, and the highest organic share of total agricultural land was in Samoa, with 14.5 percent of all farmland under organic cultivation, followed by Australia with 9.9 percent. In 2019, 97 percent of all organic farmland in Oceania was grassland/grazing areas (34.7 million hectares). Almost all of the organic grassland/grazing areas were in Australia (34.6 million hectares), with a very small share in New Zealand (over 64’000 hectares). Of the almost 103’000 hectares of organic permanent crops, the largest share was used for coconuts (over 59’000 hectares; mainly in Samoa), coffee (almost 11’000 hectares; only Papua New Guinea), and grapes (almost 8’000 hectares; mainly in Australia). Organic permanent crops played an important role in the region. For coconuts, the organic share in the region was 12 percent, for coffee it was 20 percent, for grapes it was 4 percent, and for tea (487 hectares) it was 12 percent. In 2019, almost 20 percent of the world’s organic coconuts area was in Oceania. Organic arable crops were grown on over 45’000 hectares. The key arable crop was cereals, with over 41’000 hectares (only Australia), representing 0.2 percent of the total cereals area in the region and 0.8 percent of the world’s organic cereals area. There were over 18’000 organic producers in the region, with the largest number of producers in Papua New Guinea (over 12’000 producers), Samoa (almost 2´000 producers), and Australia (almost 2’000 producers). Since 2006, when data for most of the countries became available, their number more than doubled. In 2018, the total organic market was almost 1.4 billion euros for the region (new data were not available at the time of writing). Australia reported an organic market of 1.2 billion euros and New Zealand a retail sales value of 155 million euros. For the other countries in the region, no data is available. The annual organic consumption was 49 euros per person in Australia and 33 euros per person in New Zealand. For more information, see the data tables on page 298.
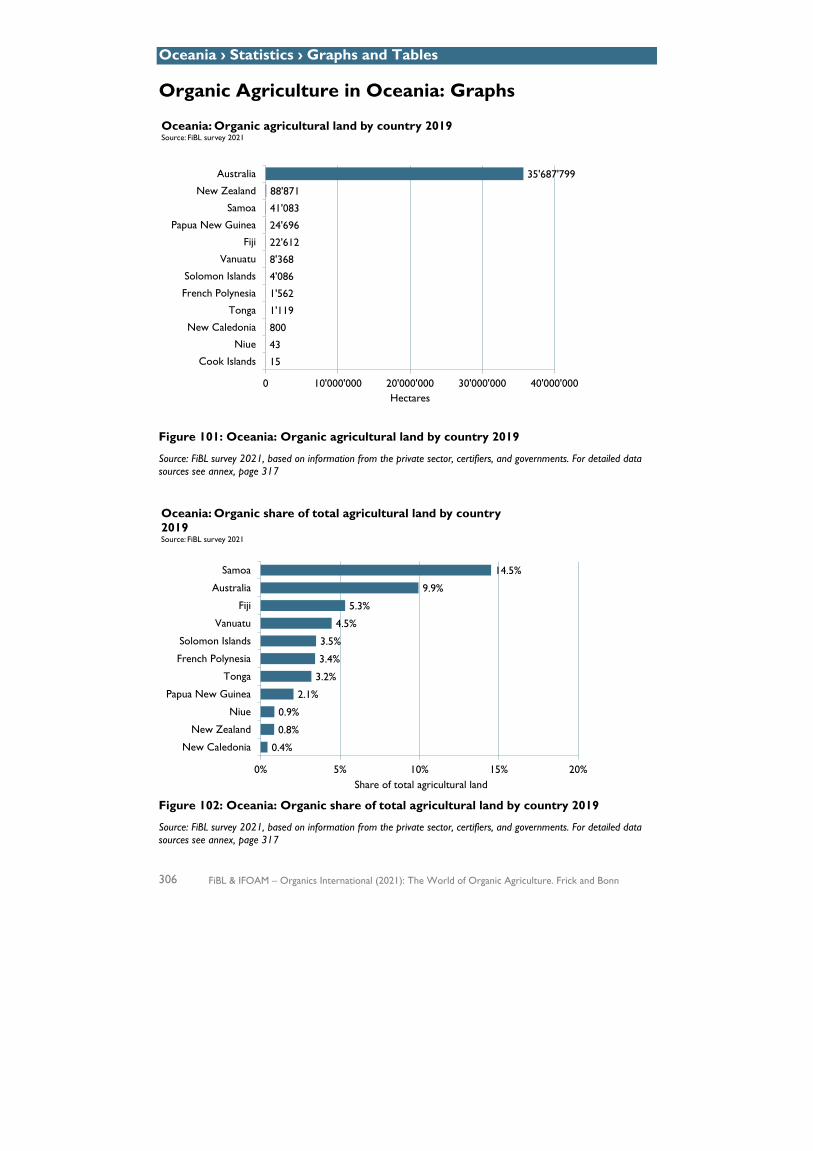
Oceania › Statistics › Graphs and Tables
306 FiBL & IFOAM – Organics International (2021): The World of Organic Agriculture. Frick and Bonn
Organic Agriculture in Oceania: Graphs
Figure 101: Oceania: Organic agricultural land by country 2019
Source: FiBL survey 2021, based on information from the private sector, certifiers, and governments. For detailed data sources see annex, page 317
Figure 102: Oceania: Organic share of total agricultural land by country 2019
Source: FiBL survey 2021, based on information from the private sector, certifiers, and governments. For detailed data sources see annex, page 317
0.4%
0.8%
0.9%
2.1%
3.2%
3.4%
3.5%
4.5%
5.3%
9.9%
14.5%
0% 5% 10% 15% 20%
New Caledonia
New Zealand
Niue
Papua New Guinea
Tonga
French Polynesia
Solomon Islands
Vanuatu
Fiji
Australia
Samoa
Share of total agricultural land
Oceania: Organic share of total agricultural land by country 2019Source: FiBL survey 2021
15
43
800
1'119
1'562
4'086
8'368
22'612
24'696
41'083
88'871
35'687'799
0 10'000'000 20'000'000 30'000'000 40'000'000
Cook Islands
Niue
New Caledonia
Tonga
French Polynesia
Solomon Islands
Vanuatu
Fiji
Papua New Guinea
Samoa
New Zealand
Australia
Hectares
Oceania: Organic agricultural land by country 2019Source: FiBL survey 2021
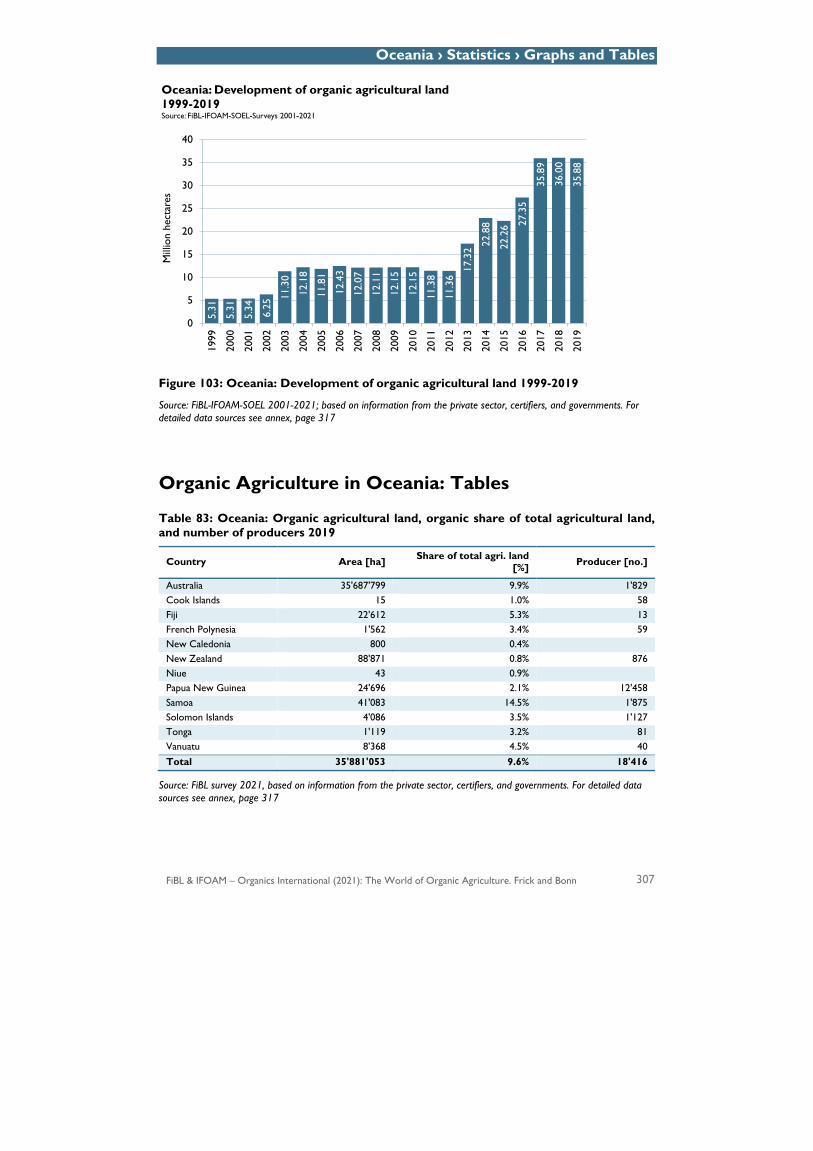
Oceania › Statistics › Graphs and Tables
FiBL & IFOAM – Organics International (2021): The World of Organic Agriculture. Frick and Bonn 307
Figure 103: Oceania: Development of organic agricultural land 1999-2019
Source: FiBL-IFOAM-SOEL 2001-2021; based on information from the private sector, certifiers, and governments. For detailed data sources see annex, page 317
Organic Agriculture in Oceania: Tables
Table 83: Oceania: Organic agricultural land, organic share of total agricultural land, and number of producers 2019
Country Area [ha] Share of total agri. land [%] Producer [no.]
Australia 35'687'799 9.9% 1'829 Cook Islands 15 1.0% 58 Fiji 22'612 5.3% 13 French Polynesia 1'562 3.4% 59 New Caledonia 800 0.4%
New Zealand 88'871 0.8% 876 Niue 43 0.9%
Papua New Guinea 24'696 2.1% 12'458 Samoa 41'083 14.5% 1'875 Solomon Islands 4'086 3.5% 1'127 Tonga 1'119 3.2% 81 Vanuatu 8'368 4.5% 40 Total 35'881'053 9.6% 18'416
Source: FiBL survey 2021, based on information from the private sector, certifiers, and governments. For detailed data sources see annex, page 317
5.31
5.31
5.34 6.25
11.3
0
12.1
8
11.8
1
12.4
3
12.0
7
12.1
1
12.1
5
12.1
5
11.3
8
11.3
6
17.3
2
22.8
8
22.2
6 27.3
5
35.8
9
36.0
0
35.8
8
0
5
10
15
20
25
30
35
40
1999
2000
2001
2002
2003
2004
2005
2006
2007
2008
2009
2010
2011
2012
2013
2014
2015
2016
2017
2018
2019
Mill
ion
hect
ares
Oceania: Development of organic agricultural land 1999-2019Source: FiBL-IFOAM-SOEL-Surveys 2001-2021
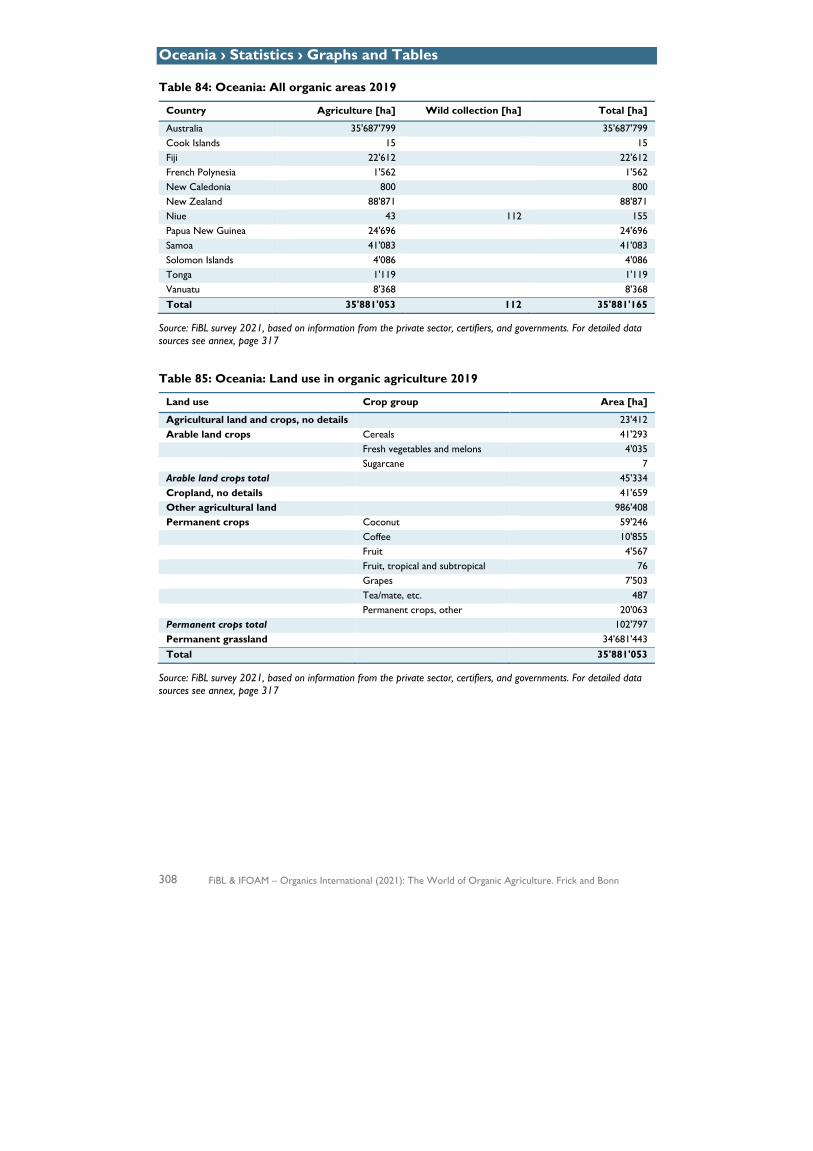
Oceania › Statistics › Graphs and Tables
308 FiBL & IFOAM – Organics International (2021): The World of Organic Agriculture. Frick and Bonn
Table 84: Oceania: All organic areas 2019
Country Agriculture [ha] Wild collection [ha] Total [ha]
Australia 35'687'799 35'687'799 Cook Islands 15 15 Fiji 22'612 22'612 French Polynesia 1'562 1'562 New Caledonia 800 800 New Zealand 88'871 88'871 Niue 43 112 155 Papua New Guinea 24'696 24'696 Samoa 41'083 41'083 Solomon Islands 4'086 4'086 Tonga 1'119 1'119 Vanuatu 8'368 8'368 Total 35'881'053 112 35'881'165
Source: FiBL survey 2021, based on information from the private sector, certifiers, and governments. For detailed data sources see annex, page 317
Table 85: Oceania: Land use in organic agriculture 2019
Land use Crop group Area [ha]
Agricultural land and crops, no details 23'412 Arable land crops Cereals 41'293 Fresh vegetables and melons 4'035 Sugarcane 7 Arable land crops total 45'334 Cropland, no details 41'659 Other agricultural land 986'408 Permanent crops Coconut 59'246 Coffee 10'855 Fruit 4'567 Fruit, tropical and subtropical 76 Grapes 7'503 Tea/mate, etc. 487 Permanent crops, other 20'063 Permanent crops total 102'797 Permanent grassland 34'681'443 Total 35'881'053
Source: FiBL survey 2021, based on information from the private sector, certifiers, and governments. For detailed data sources see annex, page 317

FiBL & IFOAM – Organics International (2021): The World of Organic Agriculture. Frick and Bonn 309
Outlook
Outlook › Building Resilience
310 FiBL & IFOAM – Organics International (2021): The World of Organic Agriculture. Frick and Bonn
Building Resilience
LOUISE LUTTIKHOLT1
The year 2020 will undoubtedly be remembered for the global COVID-19 pandemic, which will not have ended when this book is published at the beginning of 2021. Its impact is likely to be felt for a much longer time. The crisis has provided us with a moment for reflection and revealed the vulnerability of global food systems.2 We need to conclude that industrial agriculture drives habitat loss and helps create the conditions for viruses to emerge and spread in the first place. And this in a world where millions of people are already living with hunger, malnutrition and extreme poverty. There can be only one conclusion here: we need to transition to sustainable and resilient food systems, now and not in the distant future.
The transformation of agriculture and food systems is something which the organic sector has been shaping and practising for decades. We are happy to build on all these experiences and also share them with others. We have the Principles of Health, Ecology, Fairness and Care to guide and shape our vision for a truly sustainable world. Organic farmers are applying good and best practices that are already contributing to our planet's sustainable future. There are legally protected standards on what can be called ‘organic’ and formal and informal ways of verification. The positive impact of organic goes way beyond formal regulations: organic inspires, also beyond our sector. Organic and agroecological practices are studied and shared widely, even if applied in single measures – all contributions count.
There is increasing awareness of the need to value our shared environment, biodiversity and earth. In short, the role of agriculture in achieving the Sustainable Development Goals (SDGs) is obvious. We do observe increasing interest from governments transforming food systems to making them contribute to the common good. And only if governments ensure that policies are coherently aligned with the SDGs will agriculture become part of the solution instead of being part of the problem.3
As a membership-based organisation, IFOAM – Organics International has the task and takes every opportunity to influence government policies and regulations around the world directly. We also work to inform and coach high-level decision-makers by bringing them together in the Food Policy Forum for Change. We are heartened to see
1 Louise Luttikholt, Exceutive Director IFOAM – Organics International, 53113 Bonn, Germany, www.ifoam.org 2 IPES FOOD (010): COVID-19 and the Crisis in Food Systems. Communiqué by IPES-Food, April 14, 2020. Available at http://www.ipes-food.org/_img/upload/files/COVID-19%20Press%20Release%20EN.pdf 3 Eyhorn, F., Muller, A., Reganold, J. P., Frison, E., Herren, H. R., Luttikholt, L., Mueller, A., Sanders, J., Scialabba, N., Seufert, V., & Smith, P. (2019). Sustainability in global agriculture driven by organic farming. Nature Sustainability, 2, 253-255. https://doi.org/10.1038/s41893-019-0266-6
Outlook › Building Resilience
FiBL & IFOAM – Organics International (2021): The World of Organic Agriculture. Frick and Bonn 311
more and more citizen-driven food councils influence their municipalities on a local level, ensuring their local food systems become more resilient.
Indeed, COVID has shown how all living beings are connected. The notion of ‘One Health’ expresses the interdependencies and vulnerable balances in our ‘One Earth System’. We know that good, nutritious food increases our individual resilience; in COVID times, it almost looked as if food was regarded as medicine. Organic agriculture has a lot to offer for systemic, positive health by reducing pesticide levels, contributing to a healthy environment and focussing on seasonality and proximity. We will learn in 2021 whether the Food Systems Summit, which is conceived as high level, inclusive event ‘to launch bold and new actions to transform the way the world produces and consumes food’1 takes these signals seriously.
IFOAM – Organics International will keep up the public pressure, as we know that persistency pays off: our global campaign #IGrowYourFood2 culminating in an action day will run for the third time in 2021. We invite all organic and agroecological farmers to share their motivation, practices and messages on growing organic food. We would like to hear and learn from them and pay them the respect they deserve. We are happy to do so together with our Network, especially the organic farmers gathered in the International Network of Organic Farmers’ Organisations (INOFO), which has gained strength and momentum over the past years.
Many events have been postponed and replanned due to COVID. The Organic World Congress is no exception to this and will now take place from September 7-9, 2021. The venue stays the same: Rennes in France. I sincerely hope that we can reconvene in person by that time. Meanwhile, I wish for us all to stay safe and healthy
1 https://www.un.org/en/food-systems-summit: Website of the United Nations Food Systems Summit 2021 2 https://campaigns.ifoam.bio/igrowyourfood/2020: Website of the IFOAM Campaign #IGrowYourFood

312 FiBL & IFOAM – Organics International (2021): The World of Organic Agriculture. Frick and Bonn

Annex › Statistics › Key indicators
FiBL & IFOAM – Organics International (2021): The World of Organic Agriculture. Frick and Bonn 313
Annex: Key Indicators by Country and Region
Table 86: Key indicators by region 2019
Region Organic area [ha]
Shares of the global
organic farmland area [%]
Organic share of total
farmland area [%]
Growth 2018-2019
[%]
Organic producers [no.]
Organic retail sales [Million €]
Africa* 2’030’830 2.8% 0.2% +10.2 850’490 17
Asia 5’911’622 8% 0.4% -10.3 1’589’563 10’949
Europe 16’528’677 23% 3.3% +5.9 430’742 45’049
Latin America 8’292’139 11% 1.2% +3.5 224’388 810
North America 3’647’623 5% 0.8% +9.1 22’153 48’201
Oceania 35’881’053 50% 9.6% -0.3 18’416 1’378
World** 72’285’656 100% 1.5% +1.2 3’135’129 106’404
Source: FiBL survey 2021. Note: Agricultural land includes in-conversion areas and excludes wild collection, aquaculture, forest, and non-agricultural grazing areas. *Data from Ethiopia and Kenya. **Includes correction value for French overseas departments.
Table 87: Key indicators by country 2019
Country Organic area [ha]
Organic share [%]
Organic producer [no.]*
Organic retail sales [Million €]
Afghanistan 786 0.002% 1 Albania 653 0.1% 86 Algeria 772 0.002% 64 Andorra 2 0.01% Argentina 3’672’350 2.5% 1’269 Armenia 594 0.04% 29 Australia 35’687’799 9.9% 1’829 1’224 Austria 669’921 26.1% 26’042 1’920 Azerbaijan 37’630 0.8% 305 3 Bahamas 49 0.3% 1 Bangladesh 2’249 0.02% 2 Belarus 1’375 0.02% 31 Belgium 93’119 6.9% 2’394 779 Belize 77 0.04% 157 0 Benin 15’164 0.4% 5’170 Bermuda Processing Bhutan 6’632 1.3% 4’354 0 Bolivia (Plurinational State of) 144’231 0.4% 14’161 Bosnia and Herzegovina 1’692 0.1% 337 0 Brazil 1’283’054 0.5% 22’191 778 Brunei Darussalam Aquaculture Bulgaria 117’779 2.3% 6’213 30 Burkina Faso 87’490 0.7% 29’214 Burundi 84 0.004% 25 Cambodia 25’757 0.5% 6’350 Cameroon 204 0.002% 499 Canada 1’321’072 2.3% 5’677 3’480 Cape Verde 495 0.6% 1 Chad 1’113 0.002% Channel Islands 180 2.0% Chile 20’897 0.1% 781 2 China 2’216’000 0.4% 6’308 8’504 Colombia 30’447 0.1% 4’155 Comoros 1’164 0.9% 851
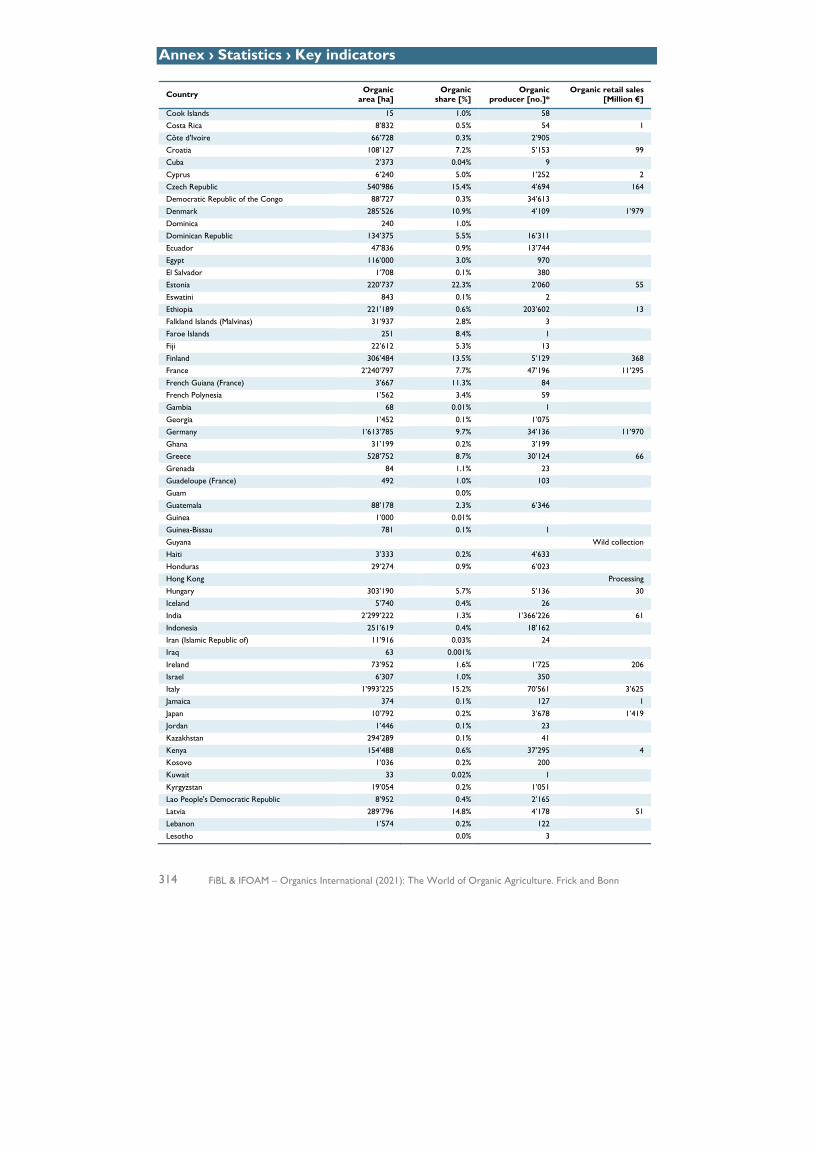
Annex › Statistics › Key indicators
314 FiBL & IFOAM – Organics International (2021): The World of Organic Agriculture. Frick and Bonn
Country Organic area [ha]
Organic share [%]
Organic producer [no.]*
Organic retail sales [Million €]
Cook Islands 15 1.0% 58 Costa Rica 8’832 0.5% 54 1 Côte d'Ivoire 66’728 0.3% 2’905 Croatia 108’127 7.2% 5’153 99 Cuba 2’373 0.04% 9 Cyprus 6’240 5.0% 1’252 2 Czech Republic 540’986 15.4% 4’694 164 Democratic Republic of the Congo 88’727 0.3% 34’613 Denmark 285’526 10.9% 4’109 1’979 Dominica 240 1.0% Dominican Republic 134’375 5.5% 16’311 Ecuador 47’836 0.9% 13’744 Egypt 116’000 3.0% 970 El Salvador 1’708 0.1% 380 Estonia 220’737 22.3% 2’060 55 Eswatini 843 0.1% 2 Ethiopia 221’189 0.6% 203’602 13 Falkland Islands (Malvinas) 31’937 2.8% 3 Faroe Islands 251 8.4% 1 Fiji 22’612 5.3% 13 Finland 306’484 13.5% 5’129 368 France 2’240’797 7.7% 47’196 11’295 French Guiana (France) 3’667 11.3% 84 French Polynesia 1’562 3.4% 59 Gambia 68 0.01% 1 Georgia 1’452 0.1% 1’075 Germany 1’613’785 9.7% 34’136 11’970 Ghana 31’199 0.2% 3’199 Greece 528’752 8.7% 30’124 66 Grenada 84 1.1% 23 Guadeloupe (France) 492 1.0% 103 Guam 0.0% Guatemala 88’178 2.3% 6’346 Guinea 1’000 0.01% Guinea-Bissau 781 0.1% 1 Guyana Wild collection Haiti 3’333 0.2% 4’633 Honduras 29’274 0.9% 6’023 Hong Kong Processing Hungary 303’190 5.7% 5’136 30 Iceland 5’740 0.4% 26 India 2’299’222 1.3% 1’366’226 61 Indonesia 251’619 0.4% 18’162 Iran (Islamic Republic of) 11’916 0.03% 24 Iraq 63 0.001% Ireland 73’952 1.6% 1’725 206 Israel 6’307 1.0% 350 Italy 1’993’225 15.2% 70’561 3’625 Jamaica 374 0.1% 127 1 Japan 10’792 0.2% 3’678 1’419 Jordan 1’446 0.1% 23 Kazakhstan 294’289 0.1% 41 Kenya 154’488 0.6% 37’295 4 Kosovo 1’036 0.2% 200 Kuwait 33 0.02% 1 Kyrgyzstan 19’054 0.2% 1’051 Lao People's Democratic Republic 8’952 0.4% 2’165 Latvia 289’796 14.8% 4’178 51 Lebanon 1’574 0.2% 122 Lesotho 0.0% 3
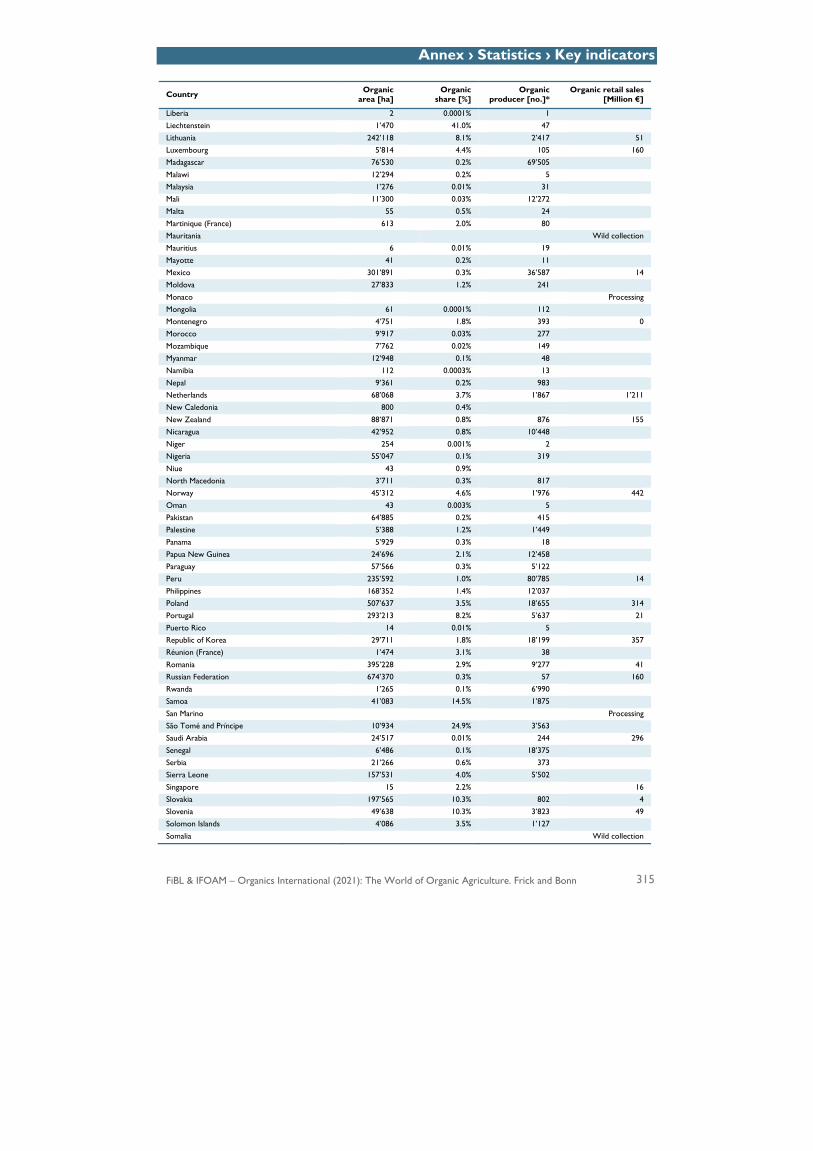
Annex › Statistics › Key indicators
FiBL & IFOAM – Organics International (2021): The World of Organic Agriculture. Frick and Bonn 315
Country Organic area [ha]
Organic share [%]
Organic producer [no.]*
Organic retail sales [Million €]
Liberia 2 0.0001% 1 Liechtenstein 1’470 41.0% 47 Lithuania 242’118 8.1% 2’417 51 Luxembourg 5’814 4.4% 105 160 Madagascar 76’530 0.2% 69’505 Malawi 12’294 0.2% 5 Malaysia 1’276 0.01% 31 Mali 11’300 0.03% 12’272 Malta 55 0.5% 24 Martinique (France) 613 2.0% 80 Mauritania Wild collection Mauritius 6 0.01% 19 Mayotte 41 0.2% 11 Mexico 301’891 0.3% 36’587 14 Moldova 27’833 1.2% 241 Monaco Processing Mongolia 61 0.0001% 112 Montenegro 4’751 1.8% 393 0 Morocco 9’917 0.03% 277 Mozambique 7’762 0.02% 149 Myanmar 12’948 0.1% 48 Namibia 112 0.0003% 13 Nepal 9’361 0.2% 983 Netherlands 68’068 3.7% 1’867 1’211 New Caledonia 800 0.4% New Zealand 88’871 0.8% 876 155 Nicaragua 42’952 0.8% 10’448 Niger 254 0.001% 2 Nigeria 55’047 0.1% 319 Niue 43 0.9% North Macedonia 3’711 0.3% 817 Norway 45’312 4.6% 1’976 442 Oman 43 0.003% 5 Pakistan 64’885 0.2% 415 Palestine 5’388 1.2% 1’449 Panama 5’929 0.3% 18 Papua New Guinea 24’696 2.1% 12’458 Paraguay 57’566 0.3% 5’122 Peru 235’592 1.0% 80’785 14 Philippines 168’352 1.4% 12’037 Poland 507’637 3.5% 18’655 314 Portugal 293’213 8.2% 5’637 21 Puerto Rico 14 0.01% 5 Republic of Korea 29’711 1.8% 18’199 357 Réunion (France) 1’474 3.1% 38 Romania 395’228 2.9% 9’277 41 Russian Federation 674’370 0.3% 57 160 Rwanda 1’265 0.1% 6’990 Samoa 41’083 14.5% 1’875 San Marino Processing São Tomé and Príncipe 10’934 24.9% 3’563 Saudi Arabia 24’517 0.01% 244 296 Senegal 6’486 0.1% 18’375 Serbia 21’266 0.6% 373 Sierra Leone 157’531 4.0% 5’502 Singapore 15 2.2% 16 Slovakia 197’565 10.3% 802 4 Slovenia 49’638 10.3% 3’823 49 Solomon Islands 4’086 3.5% 1’127 Somalia Wild collection
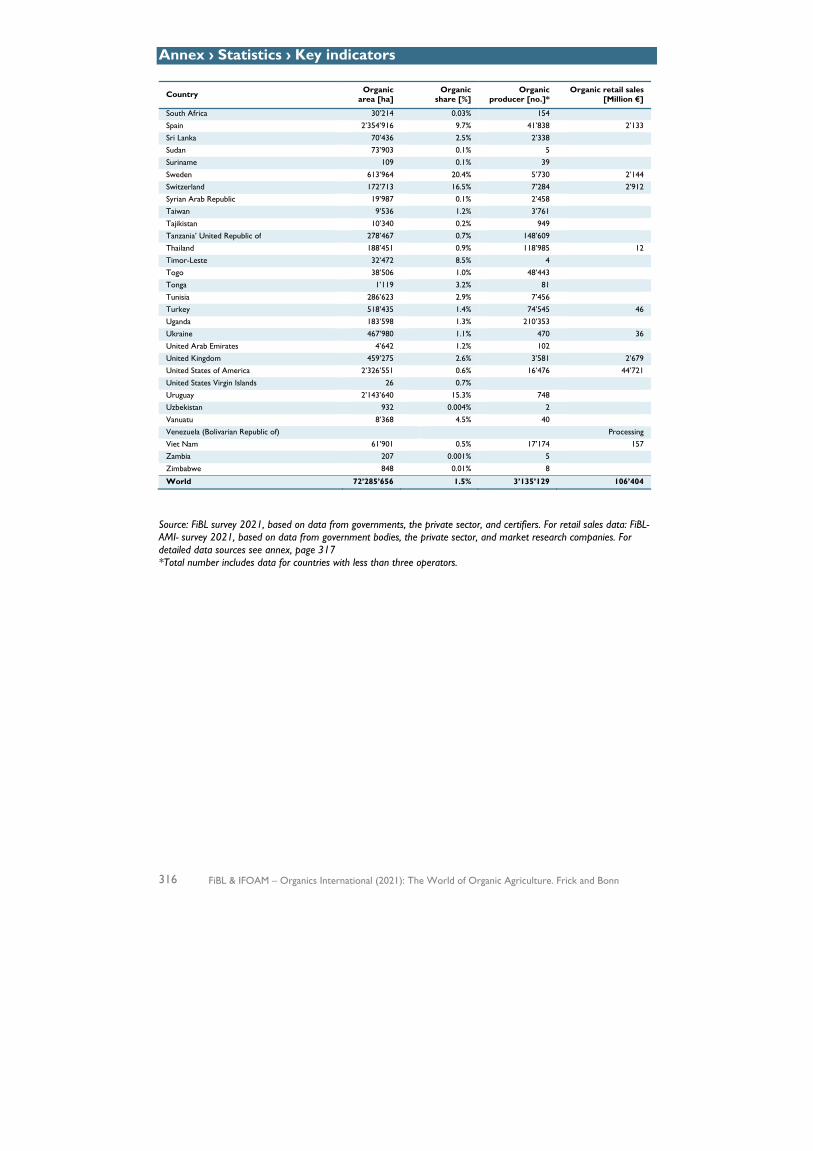
Annex › Statistics › Key indicators
316 FiBL & IFOAM – Organics International (2021): The World of Organic Agriculture. Frick and Bonn
Country Organic area [ha]
Organic share [%]
Organic producer [no.]*
Organic retail sales [Million €]
South Africa 30’214 0.03% 154 Spain 2’354’916 9.7% 41’838 2’133 Sri Lanka 70’436 2.5% 2’338 Sudan 73’903 0.1% 5 Suriname 109 0.1% 39 Sweden 613’964 20.4% 5’730 2’144 Switzerland 172’713 16.5% 7’284 2’912 Syrian Arab Republic 19’987 0.1% 2’458 Taiwan 9’536 1.2% 3’761 Tajikistan 10’340 0.2% 949 Tanzania’ United Republic of 278’467 0.7% 148’609 Thailand 188’451 0.9% 118’985 12 Timor-Leste 32’472 8.5% 4 Togo 38’506 1.0% 48’443 Tonga 1’119 3.2% 81 Tunisia 286’623 2.9% 7’456 Turkey 518’435 1.4% 74’545 46 Uganda 183’598 1.3% 210’353 Ukraine 467’980 1.1% 470 36 United Arab Emirates 4’642 1.2% 102 United Kingdom 459’275 2.6% 3’581 2’679 United States of America 2’326’551 0.6% 16’476 44’721 United States Virgin Islands 26 0.7% Uruguay 2’143’640 15.3% 748 Uzbekistan 932 0.004% 2 Vanuatu 8’368 4.5% 40 Venezuela (Bolivarian Republic of) Processing Viet Nam 61’901 0.5% 17’174 157 Zambia 207 0.001% 5 Zimbabwe 848 0.01% 8
World 72’285’656 1.5% 3’135’129 106’404
Source: FiBL survey 2021, based on data from governments, the private sector, and certifiers. For retail sales data: FiBL-AMI- survey 2021, based on data from government bodies, the private sector, and market research companies. For detailed data sources see annex, page 317 *Total number includes data for countries with less than three operators.
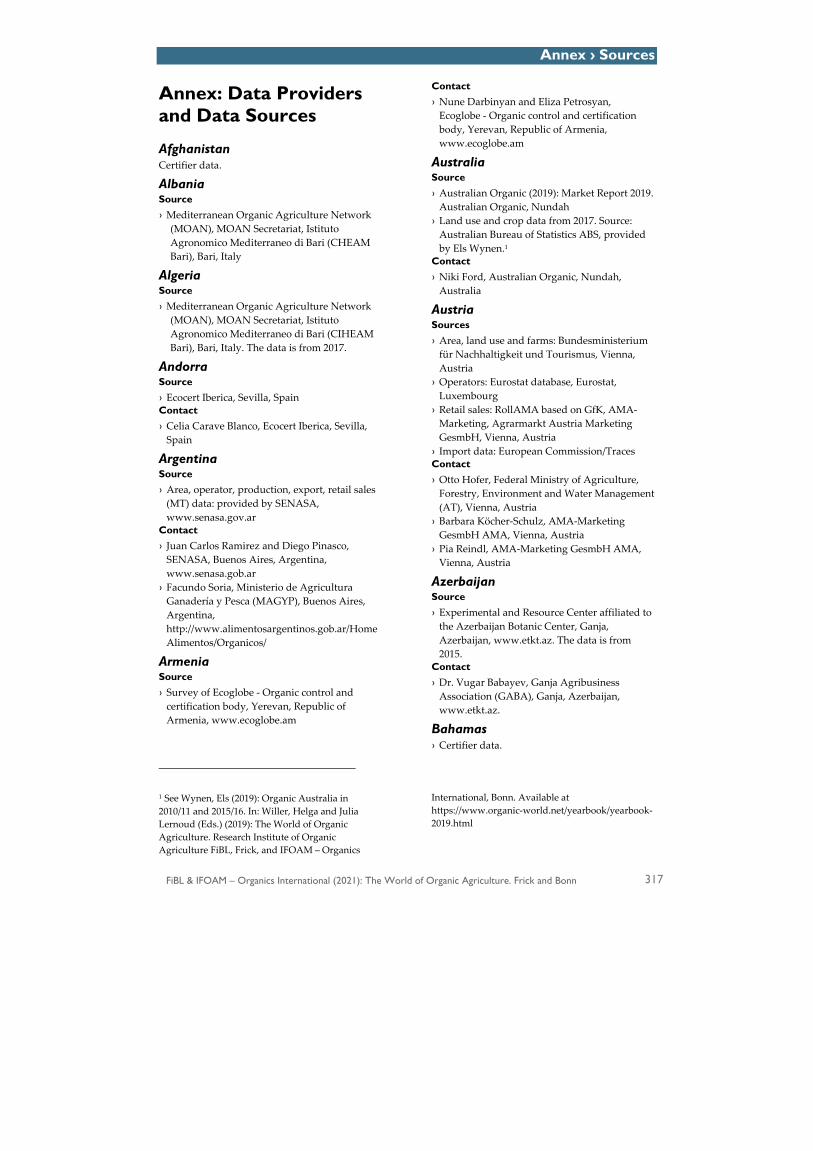
Annex › Sources
FiBL & IFOAM – Organics International (2021): The World of Organic Agriculture. Frick and Bonn 317
Annex: Data Providers and Data Sources
Afghanistan Certifier data.
Albania Source › Mediterranean Organic Agriculture Network
(MOAN), MOAN Secretariat, Istituto Agronomico Mediterraneo di Bari (CHEAM Bari), Bari, Italy
Algeria Source › Mediterranean Organic Agriculture Network
(MOAN), MOAN Secretariat, Istituto Agronomico Mediterraneo di Bari (CIHEAM Bari), Bari, Italy. The data is from 2017.
Andorra Source › Ecocert Iberica, Sevilla, Spain Contact › Celia Carave Blanco, Ecocert Iberica, Sevilla,
Spain
Argentina Source › Area, operator, production, export, retail sales
(MT) data: provided by SENASA, www.senasa.gov.ar
Contact › Juan Carlos Ramirez and Diego Pinasco,
SENASA, Buenos Aires, Argentina, www.senasa.gob.ar
› Facundo Soria, Ministerio de Agricultura Ganadería y Pesca (MAGYP), Buenos Aires, Argentina, http://www.alimentosargentinos.gob.ar/HomeAlimentos/Organicos/
Armenia Source › Survey of Ecoglobe - Organic control and
certification body, Yerevan, Republic of Armenia, www.ecoglobe.am
1 See Wynen, Els (2019): Organic Australia in 2010/11 and 2015/16. In: Willer, Helga and Julia Lernoud (Eds.) (2019): The World of Organic Agriculture. Research Institute of Organic Agriculture FiBL, Frick, and IFOAM – Organics
Contact › Nune Darbinyan and Eliza Petrosyan,
Ecoglobe - Organic control and certification body, Yerevan, Republic of Armenia, www.ecoglobe.am
Australia Source › Australian Organic (2019): Market Report 2019.
Australian Organic, Nundah › Land use and crop data from 2017. Source:
Australian Bureau of Statistics ABS, provided by Els Wynen.1
Contact › Niki Ford, Australian Organic, Nundah,
Australia
Austria Sources › Area, land use and farms: Bundesministerium
für Nachhaltigkeit und Tourismus, Vienna, Austria
› Operators: Eurostat database, Eurostat, Luxembourg
› Retail sales: RollAMA based on GfK, AMA-Marketing, Agrarmarkt Austria Marketing GesmbH, Vienna, Austria
› Import data: European Commission/Traces Contact › Otto Hofer, Federal Ministry of Agriculture,
Forestry, Environment and Water Management (AT), Vienna, Austria
› Barbara Köcher-Schulz, AMA-Marketing GesmbH AMA, Vienna, Austria
› Pia Reindl, AMA-Marketing GesmbH AMA, Vienna, Austria
Azerbaijan Source › Experimental and Resource Center affiliated to
the Azerbaijan Botanic Center, Ganja, Azerbaijan, www.etkt.az. The data is from 2015.
Contact › Dr. Vugar Babayev, Ganja Agribusiness
Association (GABA), Ganja, Azerbaijan, www.etkt.az.
Bahamas › Certifier data.
International, Bonn. Available at https://www.organic-world.net/yearbook/yearbook-2019.html
Annex › Sources
318 FiBL & IFOAM – Organics International (2021): The World of Organic Agriculture. Frick and Bonn
Bangladesh Source › For 2019, no new data were received. › For 2018, data were provided by a local source.
All certifiers active in the country were covered. The certified organic area was 6284.9 hectares. Aquaculture (shrimp) accounted for the major share (5781 hectares) of the certified area, while the rest (503.9 hectares) was used to grow organic tea. According to the source, an additional 152’240 hectares were under non-certified organic production. No producer numbers were supplied.
› Revisions: Some of the data used previously were removed from the database for all years.
› History: For the years 2008-2016, the data on the agricultural land from one international certifier were used (using 2012 data for up to 2016). For the aquaculture area, the data from an other international certifier were used. 850 smallholders active in aquaculture were reported. After 2016, the aquaculture data came from a third international certifier; the 2018 aquaculture data are from a local source, based on data from certifiers (see above). No numbers on the smallholders were provided for 2018.
› Please note that for Bangladesh the number of smallholder farmers is not included.
› Please note that due to the multiple and changing data sources, a direct year-to-year comparison is not possible for Bangladesh.
Contact › Dr. Shaikh Tanveer Hossain, IFOAM Asia › Dr. Khurshid Alam, BARI, Bangladesh
Belarus Source › Certifier data Contact › Lyubomyr Klepach, Center for Environmental
Solutions (CES), 220029 Minsk, Belarus Note The data were collected by FiBL among international certifiers active in the countries. For 2017 and 2018, the Center for Environmental Solutions provided the data.
Belgium Sources › Area and operator data: Landbouw en Visserij,
Brussels, Belgium › Livestock data: Eurostat database, Eurostat,
Luxembourg and Landbouw en Visserij, Brussels, Belgium
› Retail sales: Landbouw en Visserij, Brussels, Belgium
› Import data: European Commission/Traces Contact › Ilse Timmermans, Landbouw en Visserij,
Brussels, Belgium
Belize Source › Area and producers: Certifier data. › Export value and volume data is from 2015 and
provided by the previous data source. Note › Please note that the data source changed in
2018 and that therefore a direct year-to-year comparison is not possible.
Benin Source › CERTISYS, 1150 Bruxelles, Belgium,
www.certisys.eu. › Control Union, Zwolle, The Netherlands,
www.controlunion.org › Ecocert Burkina Faso, Ouaga, Burkina Faso,
www.ecocert.com › Kiwa BCS, Nürnberg, Germany, www.bcs-
oeko.de Contact › Ditta Fetekene, Control Union, Zwolle, The
Netherlands, www.controlunion.org › Tobias Fischer, Kiwa BCS, Nürnberg,
Germany, www.bcs-oeko.de › Emmeline Foubert, CERTISYS, 1150 Bruxelles,
Belgium, www.certisys.eu. › Sisigué Arsène Sanou, Ecocert Burkina Faso,
Ouaga, Burkina Faso, www.ecocert.com
Bermuda › Certifier data (Processing)
Bhutan Source › Ministry of Agriculture (MOA), National
Organic Programme DOA, Thimphu, Bhutan, www.moa.gov.bt
Contact › Kesang Tshomo, Ministry of Agriculture MOA,
National Organic Programme DOA, Thimphu, Bhutan, www.moa.gov.bt
Bolivia Source › Area, operator, production, export data from
SENASAG, provided via Comisión Interamericana de Agricultura Orgánica (CIAO), Buenos Aires, Argentina.
Annex › Sources
FiBL & IFOAM – Organics International (2021): The World of Organic Agriculture. Frick and Bonn 319
› Area and production data for cocoa and sesame are from AOPEB (Bolivian Association of Organic Producers Organisations). This data is from 2014.
Note › For 2019 data, the data source has changed: For
2014 and preceding years, data were based on a survey of the Bolivian Association of Organic Producers Organisations (AOPEP). This data was used up to 2018. For 2019, data were from National Service of Agricultural Health and Food Safety (SENASAG) (except for cocoa and sesame area and production data). Please note that therefore a direct year-to-year comparison is not possible.
› The 2019 data may partly include PGS data. Contact › Claudia Rocabado, SENASAG (Servicio
Nacional de Sanidad Agropecuaria e Inocuidad Alimentaria), Trinidad, Bolivia
Bosnia Herzegovina Source › Mediterranean Organic Agriculture Network
(MOAN), MOAN Secretariat Istituto Agronomico Mediterraneo di Bari (CIHEAM Bari), Bari, Italy
Brazil Sources › Area and operator data: Ministério da
Agricultura, Pecuária e Abastecimento/Ministry of Agriculture, Livestock and Food (MAPA). To this data, the area and operator data of two international certifiers were added by FiBL. The data of these certifiers are currently not registered under the system of the MAPA. For MAPA data see Table 88, page 336 .
› Please note that area and operator data from MAPA may include PGS data.
› Please note that land use and crop details were available only from the international certifiers but do not cover the total organic farmland.
› Export value and retail sales data: Organic Brazil (2016 data)
› Production value data: Organics Brazil (2007) Contact › Virgínia Mendes Cipriano Lira, Ministério da
Agricultura, Pecuária e Abastecimento (DTEC/SDA/MAPA), Coordenadora de Produção Orgânica, Brasilia, Brazil
Brunei Darussalam › For Brunei Darussalam, no data was provided
for 2019. Updates should be sent to [email protected]
Bulgaria Sources › Land area, operators: Eurostat and data from
the Bulgarian Ministry of Agriculture provided by FOA Bioselena, Karlovo, Bulgaria. www.bioselena.com
› Retail sales (from 2018): Boshnakova, Mila (2020): Organic Market Annual Report Bulgaria: GAIN Report Number BU2020-0006, USDA, Foreign Agricultural Service, Washington
› Import data: European Commission/Traces Contact › Dr. Stoilko Apostolov, FOA Bioselena, Karlovo,
Bulgaria. www.bioselena.com
Burkina Faso Sources › CERTISYS, Bruxelles, Belgium,
www.certisys.eu. › Ecocert West Africa, Ouagadougou, Burkina
Faso › LACON GmbH, Offenburg, Germany (2017
data) Contact › Emmeline Foubert, CERTISYS, 1150 Bruxelles,
Belgium, www.certisys.eu › Sisigué Arsène Sanou, Ecocert Burkina Faso,
Ouaga, Burkina Faso, www.ecocert.com
Burundi › Ecocert East Africa, Antananarivo, Madagascar Contact › Brayene Ramanantsoa, Ecocert East Africa,
Antananarivo, Madagascar
Cambodia Source › Certifier data.
Cameroon Source › Ecocert West Africa, Ouagadougou, Burkina
Faso, www.ecocert.com Contact › Sisigué Arsène Sanou, Ecocert Burkina Faso,
Ouaga, Burkina Faso, www.ecocert.com
Canada Source › Land area, producers and other operator types,
market data: Survey of the Canada Organic Trade Association (COTA), Ottawa, Canada, based on information from certifiers.

Annex › Sources
320 FiBL & IFOAM – Organics International (2021): The World of Organic Agriculture. Frick and Bonn
Contact › Diana Zeidan, Special Projects Coordinator,
Canada Organic Trade Association, Ottawa, Canada, http://ota.com/otacanada.html
Note See also the article about organic farming in Canada in this and in previous editions of “The World of Organic Agriculture.”
Cape Verde Certifier data.
Chad Certifier data. Not for all indicators updated data were provided.
Channel Islands Source › FAOSTAT (2016) Organic area data Channel
Islands. The FAOSTAT website, FAOSTAT, Rome, Italy, FAOSTAT > Agri-Environmental Indicators> Inputs. The data is from 2018.
Chile Source › Area data, producers/ smallholders, livestock
and export/import data: Servicio Agrícola y Ganadero (SAG), Santiago, Chile, www.sag.gob.cl, provided via Comisión Interamericana de Agricultura Orgánica (CIAO), Buenos Aires, Argentina
› Retail sales data (2009) according to USDA: Organic Products Report Chile. GAIN Report Number CI0031. November 30, 2010
Contact › Pilar M. Eguillor Recabarren, Oficina de
Estudios y Políticas Agrarias (ODEPA), Ministerio de Agricultura, Teatinos 40, Santiago, Chile, www.odepa.gob.cl
› Claudio Cárdenas Catalán, Servicio Agrícola y Gandero (SAG), Ministerio de Agricultura, Santiago, Chile, http://www.sag.cl
China Sources › Land area, operators, market and export data;
Chinese Agricultural University, Beijing, China Contact › Yuhui Qiao, Chinese Agricultural University,
Beijing, China › Zejiang Zhou, President, Board of IFOAM
Asia, China
Colombia Source › Area, operator, production, and export data
2019: from five international certifiers.
› Area and operator data before 2019: Ministry of Agriculture and Rural Development (Ministerio de Agricultura y Desarrollo Rural), Bogotá, Columbia, to which details from several international certifiers were added. Please note that based on the data from the ministry, the 2017 data for the total area (published in “The World of Organic Agriculture 2019”) were revised.
› Land use and crop data before 2019 were provided by ECONEXOS, Conexion Ecologica, Cali, Colombia, www.econexos.com, based on a survey among the certifiers. The land use and crop data are from 2014.
Contact › Carlos Escobar, ECONEXOS - Desarrollo en
Movimiento, Cali, República de Colombia, www.econexos.com.
Note › The data collection official system from the
Ministry of Agriculture only shows information about the area, products, etc. certified according to the national standard. This means that if an operator has, e.g. EU certification only and is not certified according to the national system, this data is not included. If an operator has EU certification + national certification, the data is included. It might therefore be that the organic area in Colombia is higher.
Comoros Source › Ecocert East Africa, Antananarivo, Madagascar Contact › Brayene Ramanantsoa, Ecocert East Africa,
Antananarivo, Madagascar
Congo, Democratic Republic of Certifier data.
Cook Islands Source › Pacific Organic and Ethical Trade Community
(POETCom), Suva Fiji, www.spc.int. Contact › Karen Mapusua, Secretariat of the Pacific
Community (SPC), Suva Fiji, www.spc.int
Costa Rica Source › Land area, operators and export volume data:
Servicio Fitosanitario del Estado (SFE), M.A.G Costa Rica, San José
› Export value (2009 data) PROMOCER (2011): Costa Rica: exportaciones de Productos orgánicos según destino
Annex › Sources
FiBL & IFOAM – Organics International (2021): The World of Organic Agriculture. Frick and Bonn 321
› Domestic market data (2008) were provided by the organic sector organization MAOCO
Côte d’Ivoire Sources The data were compiled by FiBL based on the data of the following international certifiers: › CERTISYS, B-1150 Bruxelles, Belgium › Control Union, Zwolle, The Netherlands,
www.controlunion.org › Ecocert West Africa, Ouagadougou, Burkina
Faso, www.ecocert.com › Kiwa BCS, Nürnberg, Germany, www.bcs-
oeko.de Not all certifiers provided updated data. Contact › Ditta Fetekene, Control Union, Zwolle, The
Netherlands, www.controlunion.org › Tobias Fischer, Kiwa BCS, Nürnberg,
Germany, www.bcs-oeko.de › Emmeline Foubert, CERTISYS, 1150 Bruxelles,
Belgium, www.certisys.eu. › Sisigué Arsène Sanou, Ecocert Burkina Faso,
Ouaga, Burkina Faso, www.ecocert.com
Croatia Sources › Area and operators: Eurostat database organic
farming, Eurostat, Luxembourg and Mediterranean Organic Agriculture Network MOAN, Bari, Italy
› Market (from 2014) & export data (from 2011): Darko Znaor, Independent Consultant, 10000 Zagreb, Croatia
› Import data: Import data: European Commission/Traces
Contact › Darko Znaor, Independent Consultant, 10000
Zagreb, Croatia
Cuba › Area, operators, and production data from two
international certifiers.
Cyprus Source › Land area and producer data: Department of
Agriculture, Nicosia, Cyprus, and Eurostat database, Eurostat, Luxembourg
› Production data: Eurostat database, Eurostat, Luxembourg
› Market data (from 2006): Organic Retailers Association, Ecozept and Biovista (eds.) (2008): Specialised Organic Retail Report 2008. Freising and Vienna 2008
› Import data: Import data: European Commission/Traces
Contact › Andreas Selearis, Department of Agriculture,
Nicosia, Cyprus
Czech Republic Source › Area, operators, market and international trade
data: Institute of Agricultural Economics and Information (UZEI), Department of Agri-environmental Policy, 602 00 Brno, Czech Republic. The market and international trade data are from 2018.
› Import data: Import data: European Commission/Traces
Contact › Hana Šejnohová, Institute of Agricultural
Economics and Information (UZEI), Department of Agri-environmental Policy, Brno, Czech Republic
› Andrea Hrabalová, Brno, Czech Republic
Denmark Sources › Land area, land use, Operators: Eurostat
database, Eurostat, Luxembourg › Retail sales: Landbrug & Fødevarer. Based on
data from Statistics Denmark (general retail sales) and Organic Denmark (for other marketing channels)
› Foodservice and exports: Statistics Denmark › Import and export values: Statistics Denmark › Import quantity data: European
Commission/Traces Contact › Martin Lundoe, Statistics Denmark,
Copenhagen, www.statbank.dk › Ejvind Pedersen, Danish Agriculture & Food
Council, Agro Food Park 13, 8200 Aarhus N, Denmark
Dominica Source › Division of Agriculture provided by Dominica
Organic Agriculture Movement (DOAM) Inc., PO Box 1953 - Roseau, Commonwealth of Dominica.
› The data is from 2011.
Dominican Republic Source › Area, operators, production, and export data
from Secretaria de Estado de Agricultura, Oficina de Control Orgánico, Santa Domingo, Dominican Republic, www.agricultura.gob.do. Data were provided via Comisión Interamericana de Agricultura Orgánica (CIAO), Buenos Aires, Argentina
Annex › Sources
322 FiBL & IFOAM – Organics International (2021): The World of Organic Agriculture. Frick and Bonn
Contact › Leandro Duarte Nina Fortuna, Director Oficina
de Control de la Agricultura Orgánica, ViceMinisterio de Extensión y Capacitación Agropecuarias, Ministerio de Agricultura, Santa Domingo, Dominican Republic, www.agricultura.gob.do.
Ecuador Source › Area, operators, production, and export data:
Agrocalidad, Quito, Ecuador, www.agrocalidad.gob.ec
› Retail sales and export value data from 2017. Contact › Rommel Aníbal Betancourt Herrera,
Agrocalidad, Quito, Ecuador
Egypt Source › Mediterranean Organic Agriculture Network
(MOAN), MOAN Secretariat Istituto Agronomico Mediterraneo di Bari (CIHEAM Bari), Bari, Italy
El Salvador Source › Area, operators, production, export, retail sales
data from the Ministerio de Agricultura y Ganadería (MAG), Final 1a. Avenida Norte, 13 Calle Poniente y Avenida Manuel, Gallardo, Santa Tecla, El Salvador
Contact › Jose Fernando Maldonado Cestona,
Coordinador Area de Inocuidad de Alimentos y Agricultura Orgánica Ministerio de Agricultura y Ganadería Dirección General de Sanidad Vegetal, El Salvador
Estonia Sources › Land area, land use, operators: Organic
Farming in Estonia 2019. Compiled by the Estonian Organic Farming Foundation based on Ministry of Agriculture, Republic of Estonia, Tallin, and Eurostat database, Eurostat, Luxembourg
› Retail sales data: Estonian Institute of Economic Research, Estonia
› Export data: Estonian Ministry of Agriculture › Import quantity data: European
Commission/Traces › A detailed report about organic farming in
Estonia can be found at http://www.maheklubi.ee/mison/eestis/
Contact › Merit Mikk, Centre of Ecological Engineering,
Tartu, Estonia
Equatorial Guinea › For this country only export data are available
(European Commission/Traces). Information on area and producers should be sent to [email protected]
Eswatini Certifier data
Ethiopia Sources Area data › Ceres, Happburg, Germany, www.ceres-
cert.com › Control Union, Zwolle, The Netherlands › Ecocert South Africa, Stellenbosch, South
Africa › FiBL estimate for coffee area based on 2015
data from the Ethiopian Institute of Agricultural Research, Akaki, Ethiopia
› Onecert, Mansarovar, Jaipur, India, www.onecert.com
› Textile Exchange, London, UK (for Cotton data)
Producers › As the data from the international certifiers do
not always include the smallholder farmers, the number of producers that was provided by the Ethiopian Institute of Agricultural Research, was continued to be used.
Contact › Lisa Barsley, Textile Exchange, London, UK › Albrecht Benzing, Ceres, Happburg, Germany,
www.ceres-cert.com › Ditta Fetekene, Control Union, Zwolle, The
Netherlands › Daniël Kotzé, Ecocert South Africa,
Stellenbosch, South Africa › Ritu Priya, Onecert, Mansarovar, Jaipur, India,
www.onecert.com Note For Ethiopia no new data have been received from the national data source since 2015. Therefore, data from international certifiers were used. A direct year-to-year comparison is therefore not possible.
Falkland Islands/Malvinas Source › Department of Agriculture, Bypass Road,
Stanley, Falkland Islands, www.agriculture.gov.fk.
Annex › Sources
FiBL & IFOAM – Organics International (2021): The World of Organic Agriculture. Frick and Bonn 323
Contact › Lucy Ellis, Department of Agriculture, Bypass
Road, Stanley, Falkland Islands, www.agriculture.gov.fk
Comment The drop in area and number of producers is due to the challenging situation of the wool market, COVID-19 being one factor.
Faroe Islands Source › Vottunarstofan Tún ehf, Laugavegur 7, 101
Reykjavík, Iceland, www.tun.is. Contact › Gunnar Gunnarsson, Vottunarstofan Tún ehf.,
Reykjavík, Iceland, www.tun.is
Fiji Islands Sources › Pacific Organic and Ethical Trade Community
(POETCom), Suva, Fiji, www.spc.int Contact › Karen Mapusua, Pacific Organic and Ethical
Trade Community (POETCom), Suva, Fiji
Finland Sources › Land area and operators: Eurostat database,
Eurostat Luxembourg. › Market data: Pro Luomu, Kauniainen, Finland › Export data: Pro Luomu, Kauniainen, Finland.
Total exports are estimated at 25 to 30 million euros
› Import data: European Commission/Traces Contact › Marja-Riitta Kottila, Pro Luomu, Kauniainen,
Finland
France Source › Area and operators: Agence Bio, Montreuil-
sur-Bois, France. www.agencebio.org, and Eurostat database, Eurostat Luxembourg
› Retail sales: Agence Bio, Montreuil-sur-Bois, France
› Export (2017) and import (2018) data (values in Euros): Agence Bio, Montreuil-sur-Bois, France
› Import data (MT): European Commission/Traces
Contact › Eva Lacarce, Agence Bio, Montreuil-sous-Bois,
France, www.agencebio.fr
French Guyana Source › Agence Bio, Montreuil-sur-Bois, France.
www.agencebio.org.
Contact › Eva Lacarce, Agence Bio, Montreuil sous Bois,
France, www.agencebio.fr
French Polynesia Source › Pacific Organic and Ethical Trade Community
(POETCom), Suva Fiji, www.spc.int. Contact › Karen Mapusua, Secretariat of the Pacific
Community (SPC), Suva Fiji, www.spc.int
Gambia Certifier data.
Georgia Source › Elkana Survey, Elkana, 16 Gazapkhuli Street,
0177 Tbilisi, Georgia, www.elkana.org.ge. The data is from 2015.
Contact › Elene Shatberashvili, Biological Farming
Association Elkana, 16 Gazapkhuli street, 0177 Tbilisi, Georgia, www.elkana.org.ge
› The data is from 2015
Germany Sources › Area and operator data: Federal Agency for
Agriculture BLE, Bonn, Germany › Crop and livestock details: Agrarmarkt
Informations-Gesellschaft mbH (AMI), Bonn, Germany, www.ami-informiert.de.
› Retail sales: Arbeitskreis Biomarkt (Working group organic market), coordinated by AMI based on data of GfK, Nielsen, bioVista und Klaus Braun Kommunikationsberatung
› Import data (MT): European Commission/Traces
Contact › Diana Schaack, Agrarmarkt Informations-
Gesellschaft mbH (AMI), Bonn, Germany, www.ami-informiert.de
Ghana Source The data was compiled by FiBL based on the data of the following international certifiers. Not all certifiers provided updated data. › CERTISYS, Brussels, www.certisys.eu › Control Union, Zwolle, The Netherlands,
www.controlunion.org › Ecocert West Africa, Ouagadougou, Burkina
Faso › Kiwa BCS, Nürnberg, Germany, www.bcs-
oeko.de
Annex › Sources
324 FiBL & IFOAM – Organics International (2021): The World of Organic Agriculture. Frick and Bonn
Contact › Ditta Fetekene, Control Union, Zwolle, The
Netherlands › Tobias Fischer, Kiwa BCS, Nürnberg,
Germany, www.bcs-oeko.de › Emmeline Foubert, CERTISYS, Brussels,
Belgium › Sisigué Arsène Sanou, Ecocert Burkina Faso,
Ouaga, Burkina Faso, www.ecocert.com
Greece Sources › Land area and operators: Eurostat database,
Eurostat, Luxembourg. › Market data: Daso Business Performance PC,
Strategy & Management Consultants, Thessaloniki, Greece
› Wild collection data (2015) Mediterranean Organic Agriculture Network (MOAN), MOAN Secretariat Istituto Agronomico Mediterraneo di Bari (CIHEAM Bari), Bari, Italy
› Import data (MT): European Commission/Traces
Contact › Nicolette van der Smissen, Feres, Greece
Grenada Certifier data. The data is from 2018.
Guadeloupe Source › Agence Bio, Montreuil-sur-Bois, France.
www.agencebio.org. Contact › Eva Lacarce, Agence Bio, Montreuil-sous-Bois,
France, www.agencebio.fr
Guatemala Source › Area, operators, and total export data:
Department of Organic Agriculture, Ministerio de Agricultura, Ganaderia y Alimentación (MAGA), Ciudad de Guatemala, Guatemala C.A. 01013, www2.maga.gob.gt.
› Operators and production volume data (2014): USDA Foreign Agricultural Service, Global Agricultural Information Network (2015): Guatemala. USDA, Washington D.C.
Contact › Álvaro Alfredo Ramos Méndez, Lauro Antonio
Rivera Gramajo, Dirección de Fitozoogenética y Recursos Nativos (DFRN), Viceministerio de Sanidad Agropecuaria y Regulaciones (VISAR), Ministerio Agricultura, Ganadería y Alimentación (MAGA), Ciudad de Guatemala, Guatemala, https://visar.maga.gob.gt/
Guinea Certifier data (from 2017).
Guinea Bissau Certifier data.
Guyana Source
› Rodrigo Misiac, Argencert, Buenos Aires, Argentina
Contact
› Rodrigo Misiac, Argencert, Buenos Aires, Argentina
Haiti Source › IMOcert Latinoamerica LTDA, Cochabamba,
Bolivia › Kiwa BCS, Nürnberg, Germany, www.bcs-
oeko.de › Ecocert France, L'Isle-Jourdain, France Contact › Eva Berre, Ecocert France, L'Isle-Jourdain,
France › Osvaldo Garcia, IMOcert Latinoamerica LTDA,
Cochabamba, Bolivia › Tobias Fischer, Kiwa BCS, Nürnberg,
Germany, www.bcs-oeko.de
Honduras Source › Area, operators, and production data from
Agricultura Orgánica Honduras, Secretaria de Agricultura y Ganadería, Tegucigalpa, Honduras, SENASA Honduras.
› Data is from 2017. Contact › Carlos Galo, Jefe del Departamento de
Agricultura Orgánica (DAO) Sub Dirección de Sanidad Vegetal (SAVE). Servicio Nacional de Sanidad Vegetal (SENASA) Secretaría de Agricultura y Ganadería (SAG) Edificio Senasa Boulevard Centroamérica, Ave. La FAO, antes de INJUPEMH, Tegucigalpa. M.D.C. Honduras.
Hungary Sources › Land area and operator data: National Food
Chain Safety Office, Food and Feed Safety Office, Food Trade Control Department, Hungary, www.nebih.gov.hu, and Eurostat database, Eurostat, Luxembourg
› Market and trade data (2015): Survey/Estimate by Ferenc Frühwald, Budapest, Hungary
› Import data (MT): European Commission/Traces
Annex › Sources
FiBL & IFOAM – Organics International (2021): The World of Organic Agriculture. Frick and Bonn 325
Contact › Dora Drexler and Bence Trugly, Hungarian
Institute of Organic Agriculture ÖMKI, Budapest, Hungary, www.biokutats.hu
Iceland Source › Vottunarstofan Tún ehf. Laugavegur 7, 101
Reykjavík, Iceland, www.tun.is. Contact › Gunnar Gunnarsson Vottunarstofan Tún ehf.,
Reykjavík, Iceland, www.tun.is
India Source › Land area, operators, exports: Agricultural and
Processed Food Products Export Development (APEDA) Ministry of Commerce & Industry, Government of India, New Delhi, India, www.apeda.com.
› Retail sales data (2017): ICCOA- International Competence Centre for Organic Agriculture, Karnataka, India
Note: › In addition to the 3rd party certified area, there
were 649818.02 hectares with PGS certification managed by a total of 1’020’888 farmers organized in 37’344 PGS groups. The data is available at: http://pgsindia-ncof.gov.in.
Contact › Manoj Kumar Menon, International
Competence Centre for Organic Agriculture ICCOA, Bangalore, India
Indonesia Source › Indonesian Organic Alliance, Bangor,
Indonesia (www.organicindonesia.org). To this data (from 2017), the 2019 data from one international certifier were added.
Contact › Lidya Ariesusanty, Indonesian Organic
Alliance, Bangor, Indonesia
Iran Source › Environmental Sciences Research Institute,
Shahid Beheshti University ESRI, Evin, Tehran, Iran. The information is based on the data of the certifiers active in the country. The data is from 2017.
Contact › Hossein Mahmoudi, Environmental Sciences
Research Institute, Shahid Beheshti University ESRI, Tehran, Iran.
Iraq Source › Zakho Small Villages Projects (ZSVP), Dohuk
City, Dohuk, Iraq Contact › Dr. Abid Ali Hasan, Zakho Small Villages
Projects (ZSVP), Program Coordinator in Iraq, Dohuk City, Dohuk, Iraq
Ireland Sources › Area, operators and livestock data: Eurostat,
Luxembourg › Market data (2017): Bord Bia, Dublin, Ireland.
The retail sales presented here are a Bord Bia extrapolation of the Kantar panel data and hence not comparable to the total organic retail sales provided for the years before 2017.
› Import data (MT): European Commission/Traces
Contact › Lorcan Burke, Bord Bia, Dublin, Ireland
Israel Source › Standardization and Accreditation Department
Ministry of Agriculture and Rural Development Plant Protection and Inspection Services (PPIS), Israel, www.ppiseng.moag.gov.il/ppiseng/ISREAL
Contact › Tal Weil Tzameret, Standardization and
Accreditation Department, Ministry of Agriculture and Rural Development, Plant Protection and Inspection Services (PPIS), Israel
Italy Sources › Operator, primary crops, and livestock
products: SINAB (2020): Bio in Cifre 2019. SINAB, Rome, Italy, Eurostat database, Eurostat, Luxembourg, and Mediterranean Organic Network MOAN, Bari, Italy
› Retail sales data provided by Nomisma, Bologna, Italy
› Import data (MT): European Commission/Traces
Contact › Roberto Pinton, Assobio, 35121 Padova, Italy › Silvia Zucconi, Nomisma, Bologna, Italy
Jamaica Source › Jamaica Organic Movement JOAM, P.O. Box
5728, Kingston 6, Jamaica, www.joamltd.org. The data is from 2016.
Annex › Sources
326 FiBL & IFOAM – Organics International (2021): The World of Organic Agriculture. Frick and Bonn
Contact › Trevor Brown, Jamaica Organic Movement
JOAM, www.joamltd.org
Japan Source › Area and producer data: Ministry of
Agriculture, Forestry and Fisheries (MAFF),Tokyo, Japan, http://www.maff.go.jp/j/jas/jas_kikaku/yuuki.html#zisseki
› Domestic market data: Ministry of Agriculture, Forestry and Fisheries (MAFF), Tokyo, Japan. Data provided by the Italian Embassy in Tokyo at a presentation at SANA 2019, Bologna
› All data is from 2018. Contact › Miyoshi Satoko, Global Organic Textile
Standard (GOTS) Japan, Tokyo, Japan
Jordan Source › Mediterranean Organic Agriculture Network
(MOAN), MOAN Secretariat Istituto Agronomico Mediterraneo di Bari (CIHEAM Bari), Bari, Italy. The data is from 2017.
Kazakhstan Sources › Bioinspecta, Frick, Switzerland › Control and Certification for Organic Products
Office Ufficio Attività di Controllo e Certificazione Prodotti Biologici, Bologna, Italy, www.ccpb.it
› Ecocert Balkan, Belgrad, Serbia › Ekoagros, Kaunas, Lithuania › Rosario, Santa Fe, Argentina. › Organic Standard, Kyiv, Ukraine Contact › Sergiy Galashevsky, Organic Standard, Kyiv,
Ukraine › Juan Gilardoni, LETIS, Rosario, Santa Fe,
Argentina › Milana Kosanovic, Ecocert Balkan, Belgrad,
Serbia › Virginija Luksiene, Ekoagros, Kaunas,
Lithuania › Roberto Maresca, Control and Certification for
Organic Products Office CCPB, Bologna, Italy, www.ccpb.it
› Franziska Staubli, Bioinspecta, Frick, Switzerland
Kenya Source › Kenya Organic Movement (KOAN), Nairobi,
Kenya, www.koan.co.ke
› The data is from 2018. Contact › Samuel Ndungu, Kenya Organic Movement
(KOAN), Nairobi, Kenya, www.koan.co.ke
Korea, Republic of Source › Korea Institute of Rural Social Affairs,
Chungnam Province, Republic of Korea, Republic of Korea
Contact › Jennifer Chang, Korean Federation of Organic
Agriculture Organisations (KFSA), Republic of Korea
› Hakkyun Jeong, Korea Institute of Rural Social Affairs, Chungnam Province, Republic of Korea
Kosovo Source › Mediterranean Organic Agriculture Network
(MOAN), MOAN Secretariat Istituto Agronomico Mediterraneo di Bari (CIHEAM Bari), Bari, Italy
Kuwait Source › Ecocert India, Aurangabad, Maharashtra,
India, www.ecocert.com Contact › Amresh Kumar Pandey, Ecocert India,
Aurangabad, Maharashtra, India, www.ecocert.com
Kyrgyzstan Source › Agricultural Commodity and Service
Cooperative "Bio Farmer", Kyrgyzstan. To this data, the data of two international certifiers as well as data from Textile Exchange about Cotton was added
Contact › Gulzaada Aleshova, Helvetas, Jalalabad,
Kyrgyzstan
Lao People’s Democratic Republic Source
› Department of Agriculture (DOA), PO BOX 811, Vientiane, Laos. The data is from 2016.
› To the data of DOA, the data for some crops from an international certifier were added.
Contact › Thavisith Bounyasouk, Department of
Agriculture (DOA), PO BOX 811, Vientiane, Laos
Annex › Sources
FiBL & IFOAM – Organics International (2021): The World of Organic Agriculture. Frick and Bonn 327
Latvia Source › Area and Operators: Eurostat database,
Eurostat, Luxembourg › Market data (from 2017): Retail sales and
export data: Moreganic Sourcing AB (2018): Baltic Organic Market Report 2018/2019. Moreganic Sourcing, Uppsala, Sweden
› Import data (MT): European Commission/Traces
Lebanon Source › CCPB Middle East, Beirut, Lebanon Contact › Angel Atallah, CCPB Middle East, Beirut,
Lebanon
Lesotho › The certifier who provided data in the past is
not active in the country anymore.
Liechtenstein Source › Klaus Büchel Anstalt, Institute of Agriculture
and Environment, 9493 Mauren, Liechtenstein, www.kba.li.
Contact › Florian Bernardi and Klaus Büchel, Institute of
Agriculture and Environment, 9493 Mauren, Liechtenstein, www.kba.li.
Note Retail sales data are not available for Liechtenstein. Data published previously were based on estimates and removed from the database.
Lithuania Source › Land area, production volume, operators:
Eurostat database, Eurostat, Luxembourg › Market data: Retail sales and export data
(2017): Moreganic Sourcing AB (2018): Baltic Organic Market Report 2018/2019. Moreganic Sourcing, Uppsala, Sweden
› Import data (MT): European Commission/Traces
Contact › Virginija Luksiene, Ekoagros, Kaunas,
Lithuania
Luxembourg Source › Land area and operator data: Administration
des Services Techniques de l'Agriculture, Service de la protection des végétaux, Luxembourg, www.asta.etat.lu
› Market data: Oekopolis and Statistical Office of Luxembourg/Ministère de l'Agriculture, de la Viticulture et du Développement rural. Organic shares of total retail sales were calculated by FiBL using Eurostat retail sales data
› Import data (MT): European Commission/Traces
Contact › Claudine Schmit, Ministère de l’Agriculture, de
la Viticulture et de la Protection des consommateurs, Luxembourg, www.asta.etat.lu
› Aender Schanck, Biogros, Munsbach, www.biogros.lu
Madagascar Certifier data.
Malawi Source The data were compiled by FiBL based on the data of the following international certifiers. › Control Union, Zwolle, The Netherlands,
www.controlunion.org › Daniël Kotzé, Ecocert South Africa,
Stellenbosch, South Africa, www.ecocert.com
› Kiwa BCS, Nürnberg, Germany, www.bcs-oeko.de
Contact › Ditta Fetekene, Control Union, Zwolle, The
Netherland › Tobias Fischer, Kiwa BCS, Nürnberg,
Germany, www.bcs-oeko.de › Daniël Kotzé, Ecocert South Africa,
Stellenbosch, South Africa Note The number of producers is higher than in the past, as for the first time the number of smallholders was provided by one certifier.
Malaysia Certifier data.
Mali Certifier data. The data is from 2017.
Malta Source › Area, operators, livestock, production: Eurostat
database, Eurostat, Luxemburg › Import data (MT): European
Commission/Traces
Martinique (France) Source › Agence Bio, Montreuil-sur-Bois, France.
www.agencebio.org

Annex › Sources
328 FiBL & IFOAM – Organics International (2021): The World of Organic Agriculture. Frick and Bonn
› Contact › Eva Lacarce, Agence Bio, Montreuil sous Bois,
France, www.agencebio.fr
Mauritius Source › Ecocert, Antananarivo, Madagascar,
www.ecocert.com Contact › Brayène Ramanantsoa, Ecocert, Antananarivo,
Madagascar, www.ecocert.com
Mayotte (France) Source › Agence Bio, Montreuil-sur-Bois, France.
www.agencebio.org Contact › Eva Lacarce, Agence Bio, Montreuil sous Bois,
France, www.agencebio.fr
Mexico Source › Subdirectora de Autorización y Aprobación de
Organismos de Coadyuvancia, Servicio Nacional de Sanidad, Inocuidad y Calidad Agroalimentaria (SENASICA), Secretaría de Agricultura y Desarrollo Rural (SADER), Ciudad de México, México.
Contact › Aurora Josefina Lobato García, Responsable de
control de productos orgánicos., Servicio Nacional de Sanidad, Inocuidad y Calidad Agroalimentaria (SENASICA), Secretaría de Agricultura y Desarrollo Rural (SADER), Ciudad de México, México
Note Please note that the data source has changed since the 2018 data, and that a direct year-to-year comparison is not possible with the data received after 2017. The current data include data from all certifiers that are registered under the system of the Mexican Ministry of Agriculture (SADER). Previously the data were provided by the Universidad Autónoma Chapingo (Latest data from 2016). Data from the Mexican Ministry of Agriculture only include operators that are certified under the national law for organic products (LPO). In 2018, the Ministry issued a communication that all organic operators, regardless of the destination market of their products, must be certified under the LPO. Therefore, there was a significant increase in the area reported in 2019, compared to 2018, as many operators who initially only certified their products under the standards of the countries to which they exported, were also certified under
the national law in 2019. As to the operators, it should be noted that under the current system, only operations are counted but not the smallholders associated to them. The current number of all operations including smallholders is not available.
Moldova Source › Nadejda Mocanu, Country Director Farmer-to-
Farmer, Cultivating New Frontiers in Agriculture, Chisinau, Moldova, www.cnfa.org based on a survey among the certifiers active in the country
Contact › Nadejda Mocanu, Country Director Farmer-to-
Farmer, Cultivating New Frontiers in Agriculture, Chisinau, Moldova, www.cnfa.org
Mongolia › Department of Coordination for Food
Production Policy Implementation, Ministry of Food Agriculture and Light industry of Mongolia Contact
› TUNGALAG Davaa, Senior officer, Department of Coordination for Food Production Policy Implementation, Ministry of Food Agriculture and Light industry of Mongolia
Note Please note that the data refer to PGS operations certified under the governments’ accreditation system. Historical data are currently revised by the government.
Montenegro Source › Ministry of Agriculture and Rural
Development, Podgorica, Montenegro › Market data (from 2010): Ecozept - Market
research and marketing consulting agency. Freising, Germany
Contact › Andrijana Rakočević, Advisor for Organic
production, Ministry of Agriculture and Rural Development, Podgorica, Montenegro
Morocco Sources › AMABIO, Casa Blanca, Morocco,
www.amabio.org › Mediterranean Organic Agriculture Network
(MOAN), MOAN Secretariat Istituto Agronomico Mediterraneo di Bari (CIHEAM Bari), Bari, Italy
› The data is from 2018.

Annex › Sources
FiBL & IFOAM – Organics International (2021): The World of Organic Agriculture. Frick and Bonn 329
Contact › Zaoui Elhousseine, AMABIO/FIMABIO, Casa
Blanca, Morocco, www.amabio.org
Mozambique Sources › Control Union, Zwolle, The Netherlands › Ecocert, South Africa, Stellenbosch, Namibia › Kiwa BCS, Nürnberg, Germany, www.bcs-
oeko.de Contact › Ditta Fetekene, Control Union, Zwolle, The
Netherlands › Tobias Fischer, Kiwa BCS, Nürnberg,
Germany, www.bcs-oeko.de › Daniël Kotzé, Ecocert South Africa,
Stellenbosch, South Africa › Ritu Priya, Onecert, Mansarovar, Jaipur, India,
www.onecert.com
Myanmar Certifier data (from 2017)
Namibia Source › Certifier data. Note › Please note that previously PGS data were
included. However, these were not confirmed (see also PGS statistics in this book) and therefore this data was removed from the database. This explains the drop in organic farmland in Namibia.
Nepal Source › Maheswar Ghimire, Kathmandu, Nepal. To
this data, some crop details and operator data from certifiers were added.
Netherlands Sources › Land area and operator data: Eurostat
database, Eurostat, Luxembourg. › Retail sales and export data: Bionext, Ede, The
Netherlands; the Bionext website, https://bionext.nl/. The export data is from 2016.
› Import data (MT): European Commission/Traces
Contact › Miriam van Bree, Bionext, Ede, The
Netherlands, www.bionext.nl
New Caledonia Source › Pacific Organic and Ethical Trade Community
(POETCom), Suva Fiji, www.spc.int
Contact › Karen Mapusua, Secretariat of the Pacific
Community (SPC), Suva Fiji, www.spc.int
New Zealand Source › 2018 New Zealand Organic Sector Market
Report. Organics Aotearoa New Zealand, Wellington, New Zealand, www.oanz.org.nz.
› The data is from 2018. Contact › Jon Manhire, the AgriBusiness Group,
Christchurch, New Zealand, www.agribusinessgroup.com
Nicaragua Source › Instituto de Protección y Sanidad Agropecuaria
(IPSA), Departamento de Inspección Certificación Fitosanitaria, Managua, Nicaragua, www.magfor.gob.ni
Contact › Ing. Ramón Ernesto Noguera García, Instituto
de Protección y Sanidad Agropecuaria IPSA, Departamento de Inspección Certificación Fitosanitaria, Managua, Nicaragua, www.magfor.gob.ni
Niger Certifier data.
Nigeria Source › Control Union, Zwolle, The Netherlands,
www.controlunion.org. › Ecocert South Africa, Stellenbosch, South
Africa › LACON, Offenburg, Germany (2017 data) Note › Data provided in the past from the Association
of Organic Agriculture Practitioners of Nigeria (NOAN), Ibadan, Nigeria, and the University of Ibadan, Nigeria, which included PGS data were removed as there seemed duplication with the certifier data.
› Producers: Please note that the certifiers did not provide the total number of producers; in most cases, only the number of companies/projects/certificates were provided. The number of producers must therefore be considerably higher.
Contact › Olugbenga O. AdeOluwa, University of
Ibadan, Nigeria › Ditta Fetekene, Control Union, Zwolle, the
Netherlands, www.controlunion.org.
Annex › Sources
330 FiBL & IFOAM – Organics International (2021): The World of Organic Agriculture. Frick and Bonn
› Daniël Kotzé, Ecocert South Africa, Stellenbosch, South Africa
Niue Source › Pacific Organic and Ethical Trade Community
(POETCom), Suva Fiji, www.spc.int Contact › Karen Mapusua, Secretariat of the Pacific
Community (SPC), Suva Fiji, www.spc.int
North Macedonia Source › Land area and operator data: Eurostat
database, Eurostat, Luxembourg › Wild collection: Certifier data
Norway Sources › Land area and operator data: Eurostat
database, Eurostat, Luxembourg › Market data for general retailers: Norwegian
Agriculture Agency (Landbruksdirektoratet), Oslo, Norway, based on Nielsen data. The total retail sales data were compiled by FiBL based on data from the Norwegian Agriculture Agency and experts estimates on further sales channels.
Contact › Alexandra Forbord, Norwegian Agriculture
Agency (Landbruksdirektoratet), Oslo, Norway
Oman Source Data from one international certifier were added to the data provided previously.
Pakistan Certifier data.
Palestine, State of › Area for agricultural land, production,
beehives, total wild collection area: Mediterranean Organic Agriculture Network (MOAN), MOAN Secretariat Istituto Agronomico Mediterraneo di Bari (CIHEAM Bari), Bari, Italy
Panamá Source › Ministerio de Desarrollo Agropecuario,
Dirección Nacional de Sanidad Vegetal, Panama, www.mida.gob.pa.
› The data is from 2018. Contact › Fermín Vicente Romero Houlstan, Rita
Villareal, Dirección Nacional de Sanidad
Vegetal, Ministerio de Desarrollo Agropecuario (MIDA), Panama, www.mida.gob.pa
Papua New Guinea Source › Pacific Organic and Ethical Trade Community
(POETCom), Suva Fiji, www.spc.int Contact › Karen Mapusua, Secretariat of the Pacific
Community (SPC), Suva Fiji, www.spc.int
Paraguay Source › Servicio Nacional de Calidad y Sanidad
Vegetal y de Semillas (SENAVE), Department of Organic Agriculture, Asuncion, Paraguay, www.senave.gov.py
Contact › Genaro Coronel, Servicio Nacional de Calidad
y Sanidad Vegetal y de Semillas, Department of Organic Agriculture, Asuncion, Paraguay, www.senave.gov.py
› Juana Beatriz Caballero Almada, Coordinadora Ejecutiva de la Dirección de Extensión Agraria (Viceministerio de Agricultura, Ministerio de Agricultura y Ganadería) Coordinadora Alterna - Comité Técnico de Promoción de la Producción Orgánica (CTPPO)
Perú Source › Area and number of producers: SENASA.
Producción Orgánica. Lima, Perú. For some crops no detailed area data was available. Therefore, crop details were used from one certifier who supplied these.
› Domestic market data: PromPeru, Lima, Perú, www.promperu.gob.pe.
› Export data: PromPeru, Lima, Perú, www.promperu.gob.pe
Contact › Félix Oswaldo Maquera Cuayla, Subdirección
de Producción Orgánica, Servicio Nacional de Sanidad Agraria (SENASA), Ministerio de Agricultura y Riego (MINAGRI)
› Marly Cristina López Rengifo, Dirección General Agrícola (DGA – MINAGRI). Secretaria Técnica del Consejo Nacional de Productos Orgánicos (CONAPO)
Philippines Sources The data were compiled by FiBL from a number of certifiers, but there are more certifiers active than those listed below. Certifiers who provided data:
Annex › Sources
FiBL & IFOAM – Organics International (2021): The World of Organic Agriculture. Frick and Bonn 331
› Ceres, Happburg, Germany, www.ceres-cert.com (2018 data)
› Control Union, Zwolle, The Netherlands, www.controlunion.org;
› Ecocert India, Aurangabad, Maharashtra, India, www.ecocert.com
› Kiwa BCS, Nürnberg, Germany, www.bcs-oeko.de
Contact › Albrecht Benzing, Ceres, Happburg, Germany,
www.ceres-cert.com › Ditta Fetekene, Control Union, Zwolle, the
Netherlands, www.controlunion.org. › Tobias Fischer, Kiwa BCS, Nürnberg,
Germany, www.bcs-oeko.de; › Amresh Kumar Pandey, Ecocert India,
Aurangabad, Maharashtra, India, www.ecocert.com
Note › A direct year-to-year comparison over the
years is not possible as not all certifiers provided updates every year. Please note that we undertook a total revision of the historical area and producer data due to the fact that one certifiers provided revised data.
Poland Source › Land area and land use, livestock and
production: Department of Promotion and Food Quality, Ministry of Agriculture and Rural Development, Poland and Eurostat database, Eurostat, Luxembourg
› Retail sales: Biokurier, Bydgoszcz › Import data (MT): European
Commission/Traces Note Please note that retail sales data do not cover all retail sales.
Portugal Source › Organic land and operators: Eurostat database,
Luxembourg › Market data (2011): INTERBIO,
http://www.interbio.pt › Import data (MT): European
Commission/Traces Contact › Catarina Crisostomo, Portugal
Puerto Rico Certifier data (from 2016).
Réunion Source › Agence Bio, Montreuil-sur-Bois, France.
www.agencebio.org Contact › Eva Lacarce, Agence Bio, Montreuil-sous-Bois,
France, www.agencebio.fr
Romania Sources › Organic area, land use, livestock and
production: Eurostat database, Luxemburg. › Wild collection: Ministry of Agriculture
MADR, Bucharest, Romania, see http://www.madr.ro/ro/agricultura-ecologica/dinamica-operatorilor-si-a-suprafetelor-in-agricultura-ecologica.html. The data is from 2014.
› International trade values (in Euros, from 2011): BCG-Global Advisors (2013) Romanian Organic Sector – Business Insight Booklet. Global Advisors, Bio-Romania Association, University of Bucharest. Bucharest 2012
› Retail sales data: Dobrescu, Monica (2017): Romania: Organic production and market overview. GAIN Report No. RO 1702. The USDA FAS website. USDA, Washington. The data is from 2016.
› Import data (MT): European Commission/Traces
Russian Federation Source › The area data was compiled by FiBL based on
the data of the following international certifiers:
› Bio.Inspecta, Frick, Switzerland, www.bio-inspecta.ch
› Control and Certification for Organic Products Office (CCPB), Roberto Maresca, Ufficio Attività di Controllo e Certificazione Prodotti Biologici, , Bologna, www.ccpb.it
› Control Union, Zwolle, The Netherlands, www.controlunion.org
› Ecocert China, Beijing, China › Ekoagros, Kaunas, Lithuania › Ecoglobe - Organic control and certification
body, Yerevan, Republic of Armenia, www.ecoglobe.am
› Kiwa BCS, Nürnberg, Germany, www.bcs-oeko.de
› LETIS, Rosario, Santa Fe, Argentina › Organic Standard, Kyiv, Ukraine › Organización Internacional Agropecuaria
(OIA), Buenos Aires, Argentina › Market data (retail sales)
Annex › Sources
332 FiBL & IFOAM – Organics International (2021): The World of Organic Agriculture. Frick and Bonn
› Prusso, Giuseppe (2019): Il Mercato die Prodotti Bio nella Federazione Russa. Presentation by Prusso, Giuseppe of the Italian Trade Agency at Sana, Bologna, September 6, 2019
Contact › Nune Darbinyan, Ecoglobe - Organic control
and certification body, Yerevan, Republic of Armenia, www.ecoglobe.am.
› Ditta Fetekene, Control Union, Zwolle, The Netherlands, www.controlunion.org
› Tobias Fischer, Kiwa BCS, Nürnberg, Germany, www.bcs-oeko.de
› Sergiy Galashevskyy, Organic Standard, Kyiv, Ukraine
› Juan Gilardoni., LETIS, Rosario, Santa Fe, Argentina
› Pedro Landa, Organización Internacional Agropecuaria (OIA), Buenos Aires, Argentina
› Virginija Luksiene, Ekoagros, Kaunas, Lithuania
› Franziska Staubli, Bio.Inspecta, Frick, Switzerland, www.bio-inspecta.ch
Note A direct year-to-year comparison over the years is not possible as not all certifiers provide updates every year and as certifiers are added not included previously.
Rwanda Certifier data.
Samoa Source › Pacific Organic and Ethical Trade Community
(POETCom), Suva Fiji, www.spc.int Contact › Karen Mapusua, Secretariat of the Pacific
Community (SPC), Suva Fiji, www.spc.int
San Marino Certifier data.
Sao Tome and Prince Source › National Directorate of Planning, Ministry of
Finance, Trade and Blue Economy, São Tome and Principe, www.financas.st. (2017 data) The number of producers was provided by Ecocert (2017 data).
Contact › Geisel de Menezes, Director of Planning and
Prospective, Min. of Finance, Commerce and Blue Economy, São Tome and Principe, www.financas.st.
Saudi Arabia Source › Department of Organic Agriculture (DOA),
http://moa.gov.sa/organice/portale Contact › Eng. Ayman Saad Al-Ghamdi, General
Manager of Organic Agriculture Department (DOA), Saudi Arabia
› Raed Saleh Almusaylim; Manager of Control & Legislation Section, Department of Organic Production, Riyadh, Saudi Arabia
Senegal Sources › Kiwa BCS, Nürnberg, Germany, www.bcs-
oeko.de › CERTISYS, 1150 Bruxelles, Belgium,
www.certisys.eu. › Ecocert Burkina Faso, Ouaga, Burkina Faso,
www.ecocert.com Contacts › Tobias Fischer, Kiwa BCS, Nürnberg,
Germany, www.bcs-oeko.de › Emmeline Foubert, CERTISYS, 1150 Bruxelles,
Belgium, www.certisys.eu. › Sisigué Arsène Sanou, Ecocert Burkina Faso,
Ouaga, Burkina Faso, www.ecocert.com Note No update date had been received from the National Federation for Organic Agriculture, Thiès, Sénégal, and the data were removed, with the exception of the number of producers as the certifiers only provided the number of companies/projects/certificates. Please note that the area data include nuts, some of which might potentially be wild collection.
Serbia Source › Ministry of Agriculture, Forestry and Water
Management, Belgrade, Republic of Serbia Contact › Jelena Milic, Ministry of Agriculture, Forestry
and Water Management, Belgrade, Republic of Serbia
Sierra Leone Certifier data. Please note that one certifier combined the area for cocoa and coffee; FiBL made an estimate of how much of this area was for coffee and how much for cocoa.
Singapore Certifier data.

Annex › Sources
FiBL & IFOAM – Organics International (2021): The World of Organic Agriculture. Frick and Bonn 333
Slovakia Sources › Area, operators, livestock, and crop
production: Eurostat database, Luxemburg › Market data (2010): Ecozept, market research
and marketing consulting agency. Freising, Germany
› Import data (MT): European Commission/Traces
Slovenia Sources › Area, operators, livestock, crop production:
Ministrstvo za kmetijstvo, gozdarstvo in prehrano/Ministry of Agriculture, Forestry and Food, Ljubljana, Slovenia, www.mkgp.gov.si
› Retail sales (from 2103): Institute for Sustainable Development, Ljubljana, Slovenia
› Marketing channels (from 2009): Institute for Sustainable Development, Ljubljana, Slovenia
› Export and import values (in Euros) are from 2009: Institute for Sustainable Development, Ljubljana, Slovenia
› Import data (MT): European Commission/Traces
Contact › Anamarija Slabe, Institute for Sustainable
Development, Ljubljana, Ljubljana, Slovenia
Solomon Islands Source › Pacific Organic and Ethical Trade Community
(POETCom), Suva Fiji, www.spc.int Contact › Karen Mapusua, Secretariat of the Pacific
Community (SPC), Suva Fiji, www.spc.int
Somalia Certifier data.
South Africa Sources › Control Union, Zwolle, The Netherlands,
www.controlunion.org › Ecocert South Africa, Stellenbosch, South
Africa › Kiwa BCS, Nürnberg, Germany, www.bcs-
oeko.de › LACON GmbH, Offenburg, Germany (2017
data) Please note that not all certifiers provided updated data. The total area for 2017 was revised as some areas had been counted as agricultural land, when in fact these were wild collection areas. The revised figure for 2017 is 22’646 hectares. Also for 2018, the area for 2018 was revised as some areas had been counted as
agricultural land, when in fact these were wild collection areas. The revised figure for 2018 is 23’278 hectares. Contact › Ditta Fetekene, Control Union, Zwolle, The
Netherland › Tobias Fischer, Kiwa BCS, Nürnberg,
Germany, www.bcs-oeko.de › Daniël Kotzé, Ecocert South Africa,
Stellenbosch, South Africa
Spain Sources › Area and land use, operators: Ministerio de
Agricultura y Pesca, Alimentación y Medio Ambiente (2010): Estrategias de vertebración del sector de la producción ecológica de España – Año 2019. MAPAMA, Madrid
› Retail Sales: Ecovalia (2018 data) › Import data (MT): European
Commission/Traces › International trade data (values) MAPAMA -
Ministerio de Agricultura, Pesca y Alimentación (MAPA) (2018) Caracterizacion y analisis de la viabilidad de una organizacion interprofesional agroalimentria en el sector de la produccion ecologica de Espana. MAPA, Madrid. The market data is from 2017.
› Import data (MT): European Commission/Traces
Contact › Pedro López, Pro-Voc-Association, Madrid,
Spain, www.provotec.es
Sri Lanka Source › The data were compiled by FiBL using the data
from several international certifiers.
Sudan (former) Source Certifier data
Suriname › Certifier data
Sweden Sources › Area, livestock and operators: Eurostat
database, Luxembourg › Market data: Ecoweb Sweden. Please note that
the data source was changed in 2017 from Statistics Sweden to Ecoweb, also for historical data. Per capita consumption and growth rates were recalculated.
› Import data (MT): European Commission/Traces

Annex › Sources
334 FiBL & IFOAM – Organics International (2021): The World of Organic Agriculture. Frick and Bonn
Contact › Olle Ryegård, Ecoweb, Sweden.
Switzerland Sources › Land area and crop data, producers: Federal
Agency for Statistics (BfS), Neuchatel, Switzerland.
› Processors: Bio Suisse, Basel, Switzerland › Retail sales data: Bio Suisse, Basel, Switzerland,
www.biosuisse.ch/de/bioinzahlen.php. Contact › Helga Willer, FiBL, Frick, Switzerland
Syria › Source for all data: Mediterranean Organic
Agriculture Network (MOAN), MOAN Secretariat Istituto Agronomico Mediterraneo di Bari (CIHEAM Bari), Bari, Italy
› No separate figure for the number of producers was available; the figure communicated is that for all operators in the country.
All data is from 2010.
Taiwan Source › Agriculture and Food Agency, Council of
Agriculture, Executive Yuan, R.O.C. Taiwan. Available at https://info.organic.org.tw/category/english/statistics/
Contact › Ray Tzeng, Organic Center, National I-lan
University, Taiwan
Tajikistan Source Please note that previous data for after 2013 from various sources were removed, as no updates were received. Instead, the data from Textile Exchange on cotton and cotton producers were used.
Tanzania Source › Tanzania Organic Agriculture Movement
(TOAM), PO Box 70089, Dar es Salaam, Tanzania, www.kilimohai.net. Survey among the organic operators in the country. The data is from 2017.
› To the TOAM data, wild collection data from international certifiers were added.
Thailand Source › Green Net Survey among the international and
domestic certifiers; Green Net, 10330 Bangkok,
Thailand. Domestic market and international trade data are from 2014.
Contact › Vitoon Panyakul, Green Net, 10330 Bangkok,
Thailand, www.greennet.or.th. The big increase in the organic area is due to the increase of organic rice
Timor-Leste Certifier data.
Togo Sources The data was compiled by FiBL based on the data of the following international certifiers. Not all certifiers provided updated information. › Ceres, Happburg, Germany › CERTISYS, Brussels, Belgium, www.certisys.eu › Ecocert, Ecocert West Africa, Ouagadougou,
Burkina Faso, www.ecocert.com › LACON GmbH, Offenburg, Germany
Tonga Source › Pacific Organic and Ethical Trade Community
(POETCom), Suva Fiji, www.spc.int Contact › Karen Mapusua, Secretariat of the Pacific
Community (SPC), Suva Fiji, www.spc.int
Tunisia Source › Direction Générale de L’Agriculture Biologique
(DGAB), Tunis, Tunisia › The data is from 2018. Contact › Samia Maamer Belkhiria, Direction Générale
de L’Agriculture Biologique (DGAB), Ministry of Agriculture and Hydraulic Resources, Tunis, Tunisia
Turkey Source › Republic of Turkey Ministry of Agriculture
and Forestry, Ankara, Turkey › Market data (2014): USDA Foreign Agricultural
Services (2016): Turkish Organic Market Overview. USDA, Washington, USA. Available at https://gain.fas.usda.gov/Recent%20GAIN%20Publications/Turkish%20Organic%20Market%20Overview_Ankara_Turkey_1-26-2016.pdf
Contact › Elif Bayraktar Öktem, Republic of Turkey
Ministry of Agriculture and Forestry, Ankara, Turkey
Annex › Sources
FiBL & IFOAM – Organics International (2021): The World of Organic Agriculture. Frick and Bonn 335
Notes Some areas contain crops that can be harvested from the same parcel. Therefore, the total of the land use/crop data exceeds the actual area surface cultivated for organic farming. A correction value was used in order to calculate the correct total.
Uganda Source › National Organic Agricultural Movement of
Uganda (NOGAMU), PO Box 70071, Clock Tower, Kampala, Uganda, www.nogamu.org.ug. The data is from 2016.
› Revisions were undertaken; some of the areas that were reported as organic agricultural land were put under wild collection.
Ukraine Sources › Area and operator data: Ministry for
Development of Economy, Trade and Agriculture of Ukraine, Kyiv, Ukraine
› Crop data: Based on the data of four certifiers but are therefore not complete.
› Domestic market, export value and wild collection data: Organic Federation of Ukraine (OFU), Kyiv, Ukraine, www.organic.com.ua
Contact › Valentyna Zaiets, Ministry for Development of
Economy, Trade and Agriculture of Ukraine, http://www.me.gov.ua
› Eugene Milovanov, Organic Federation of Ukraine, Kyiv, Ukraine, www.organic.com.ua
United Arab Emirates Source › Ministry of Environment and Water (MOEW),
United Arab Emirates. › Please note that by error the correct data was
not entered into the database by the time of printing. The correct number for certified organic farmland in the United Arab Emirates for 2019 was 5041 hectares.
Contact › Eng. Saif Mohamed Alshara, Ministry of
Environment and Water, UAE › Fatima Obaid Saeed, Ministry of Environment
and Water, UAE › Mohammad Al-Oun (PhD), Organic Farming,
Plant Health and Development Department, Dubai, UAE
United Kingdom Sources › Land use details/crops/operators: Eurostat
database, Eurostat, Luxembourg
› Market data: Soil Association (2020): Organic Market Report 2020. Soil Association, Bristol. The export data is from 2016.
Contacts › Finn Cottle, Soil Association, Bristol, UK
United States of America Source › Land area and producers: United States
Department of Agriculture, Washington, USA. › Market data: Organic Trade Association (OTA),
Washington D.C., USA › Export data: Organic Trade Association (OTA),
(from 2016) Contact › Barbara Haumann, OTA, Brattleboro VT 05301,
www.ota.com
United States Virgin Islands Certifier data.
Uruguay Certifier data
Uzbekistan Certifier data.
Vanuatu Source › Pacific Organic and Ethical Trade Community
(POETCom), Suva Fiji, www.spc.int Contact › Karen Mapusua, Secretariat of the Pacific
Community (SPC), Suva Fiji, www.spc.int
Venezuela United States Department of Agriculture (USDA) Organic Integrity Database. USDA, Washington
Viet Nam Source › Vietnam Organic Agriculture Association,
Hanoi, Vietnam. Please note that some PGS figures were included.
Note › The data for 2018 were revised. In 2018, there
were almost 51’400 hectares of agricultural land; 100’000 hectares of aquaculture and 14’450 hectares of wild collection.
Contact › Huong Dang, Vietnam Organic Agriculture
Association, Hanoi, Vietnam
Zambia Source › Ecocert South Africa, Stellenbosch, South
Africa
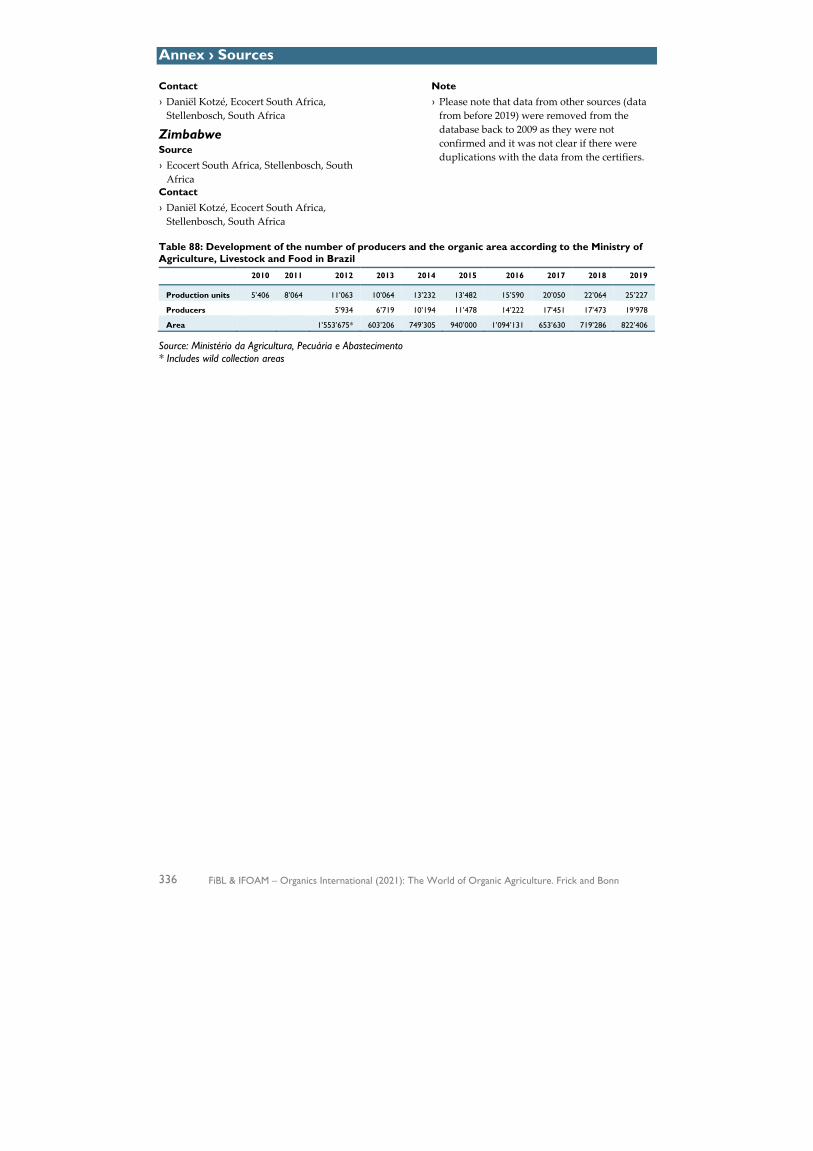
Annex › Sources
336 FiBL & IFOAM – Organics International (2021): The World of Organic Agriculture. Frick and Bonn
Contact › Daniël Kotzé, Ecocert South Africa,
Stellenbosch, South Africa
Zimbabwe Source › Ecocert South Africa, Stellenbosch, South
Africa Contact › Daniël Kotzé, Ecocert South Africa,
Stellenbosch, South Africa
Note › Please note that data from other sources (data
from before 2019) were removed from the database back to 2009 as they were not confirmed and it was not clear if there were duplications with the data from the certifiers.
Table 88: Development of the number of producers and the organic area according to the Ministry of Agriculture, Livestock and Food in Brazil
2010 2011 2012 2013 2014 2015 2016 2017 2018 2019
Production units 5’406 8’064 11’063 10’064 13’232 13’482 15’590 20’050 22’064 25’227
Producers 5’934 6’719 10’194 11’478 14’222 17’451 17’473 19’978
Area 1’553’675* 603’206 749’305 940’000 1’094’131 653’630 719’286 822’406
Source: Ministério da Agricultura, Pecuária e Abastecimento * Includes wild collection areas
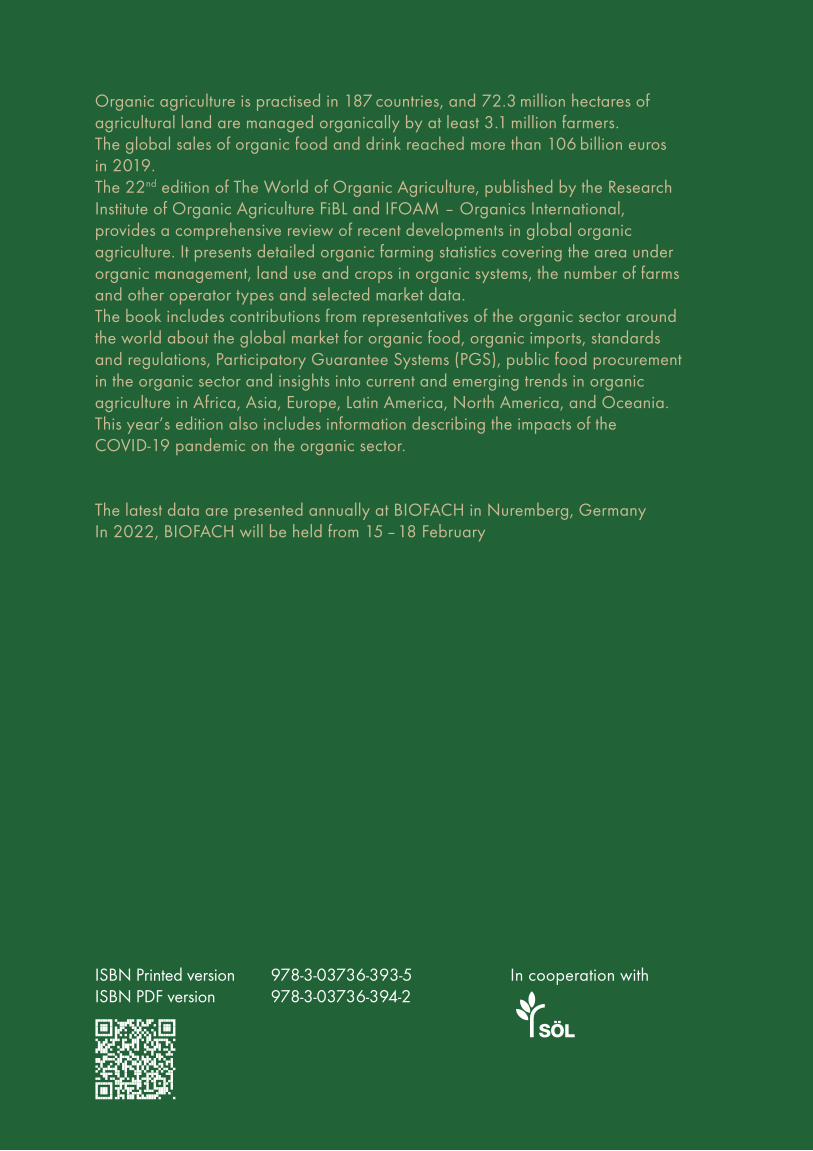
In cooperation withISBN Printed version 978-3-03736-393-5ISBN PDF version 978-3-03736-394-2
Supported by
!"# $%&'( %)%&*+,-. +*&-./'!/&#
AFRICA 2 MILLION HA
STATISTICS & EMERGING TRENDS 2021
NORTH AMERICA 3.6 MILLION HA
OCEANIA 35.9 MILLION HA
LATIN AMERICA 8.3 MILLION HA
ASIA 5.9 MILLION HA
EUROPE 16.5 MILLION HA
FiBL & IFOAM – ORGANICS INTERNATIONAL
FiB
L &
IFO
AM
– O
RG
AN
ICS
INTE
RN
ATI
ON
AL
THE
WO
RLD
OF
ORG
AN
IC A
GR
ICU
LTU
RE
2021
ST
ATI
STIC
S
Organic agriculture is practised in 187 countries, and 72.3 million hectares of agricultural land are managed organically by at least 3.1 million farmers. The global sales of organic food and drink reached more than 106 billion euros in 2019. The 22nd edition of The World of Organic Agriculture, published by the Research Institute of Organic Agriculture FiBL and IFOAM – Organics International, provides a comprehensive review of recent developments in global organic agriculture. It presents detailed organic farming statistics covering the area under organic management, land use and crops in organic systems, the number of farms and other operator types and selected market data. The book includes contributions from representatives of the organic sector around the world about the global market for organic food, organic imports, standards and regulations, Participatory Guarantee Systems (PGS), public food procurement in the organic sector and insights into current and emerging trends in organic agriculture in Africa, Asia, Europe, Latin America, North America, and Oceania. This year’s edition also includes information describing the impacts of the COVID-19 pandemic on the organic sector.
The latest data are presented annually at BIOFACH in Nuremberg, Germany In 2022, BIOFACH will be held from 15 – 18 February
Related Documents